Embed Size (px)
Citation preview
ARTICLE IN PRESS
1353-8292/$ - se
doi:10.1016/j.he
�Correspond
+1 212 481 879
E-mail addr
Health & Place ] (]]]]) ]]]–]]]
www.elsevier.com/locate/healthplace
Urban asthma and the neighbourhood environment inNew York City
Jason Corburna,�, Jeffrey Osleebb,c, Michael Porterb,c
aCenter for Occupational & Environmental Health, Hunter College of the City University of New York, 425 E. 25th St. rm 724 West,
New York, NY 10010, USAbDepartment of Geography, Hunter College of CUNY, The Graduate Center of the City University of New York, NY, USA
cEarth and Environmental Sciences Department, The Graduate Center of the City University of New York, NY, USA
Accepted 5 November 2004
Abstract
Asthma is now the leading cause of emergency room visits, hospitalizations, and missed school days in New York
City’s poorest neighbourhoods. While most research focuses on the influence of the indoor environment on asthma, this
study examines the neighbourhood effects on childhood asthma, such as housing and ambient environmental hazards.
Using Geographic Information Science (GIScience) we identify neighbourhoods with elevated concentrations of
childhood asthma hospitalizations between 1997 and 2000 in US census tracts, analyze the sociodemographic, housing
characteristics, and air pollution burdens from stationary, land use and mobile sources in these areas. The paper reveals
the importance of distinguishing the specific and often different combinations of poor housing conditions, outdoor air
pollution and noxious land uses that contribute to the high incidence of asthma in impoverished urban
neighbourhoods.
r 2004 Elsevier Ltd. All rights reserved.
Keywords: Asthma; Neighbourhood environment; Housing; Land use; Geographic information science
Introduction
Urban asthma is frequently described as one of
America’s fastest growing epidemics. The epidemic is
particularly acute among poor, African-American and
Latino children living in urban neighbourhoods. While
the national prevalence of childhood asthma in 1999 was
approximately 7% for all children under 15-years old,
African-American children living below the poverty line
were 15–20% more likely to have asthma (CDC, 2002).
In large urban areas, the prevalence of asthma is even
e front matter r 2004 Elsevier Ltd. All rights reserve
althplace.2004.11.002
ing author. Tel.: +1 212 481 5262; fax:
5.
ess: [email protected] (J. Corburn).
more severe. For instance, in New York City 17% of
children have experienced asthma-like symptoms at
some point in their lives (New York City Department
of Health (NYC DOH), 1999). Children living in poor
New York City neighbourhoods bear the heaviest
burden of the disease and are three times more likely
to be hospitalized for asthma as children who live in
wealthy neighbourhoods (NYC DOH, 2003; Claudio
et al., 1999). Asthma is the leading cause for emergency
room evaluations, pediatric hospitalizations, and school
absenteeism in New York City (NYC DOH, 2003).
Numerous factors are believed to be behind the
distribution of urban asthma. Residential exposures,
including environmental tobacco smoke and in-home
allergens common in poor quality housing, such as mold
d.

ARTICLE IN PRESSJ. Corburn et al. / Health & Place ] (]]]]) ]]]–]]]2
and cockroach allergens, are consistently associated with
the development and exacerbation of asthma (Sears,
1997; Weiss et al., 1993). Exposure to outdoor air
pollutants, including ozone (O3), particulate matter
(PM) and hazardous air pollutants (HAPs), are also
known risk factors for developing respiratory diseases,
including asthma (Strachan, 2000; Gent et al., 2003;
Delfino et al., 2003). While traditional asthma epide-
miology has focused on individual and family level risk
factors, many of the suspected contributors to asthma
(both its onset and triggering once one has the disease)
have contextual or neighbourhood effects. Neighbour-
hood physical characteristics frequently associated with
asthma include poor housing quality and dispropor-
tionate environmental pollution burdens regularly found
in low-income, minority urban neighbourhoods (Mott,
1995; Krieger and Higgins, 2002).
Increasingly, public health researchers have shown
that neighbourhood or area characteristics may be
related to health independently of individual-level
attributes (Diez Roux, 2001; MacIntyre et al., 2002).
The emerging field of social epidemiology emphasizes
that both physical and social characteristics of neigh-
bourhoods, such as persistent poverty, residential
segregation, psychosocial stress, unemployment, inade-
quate transportation, lack of affordable food stores,
unsafe recreation spaces, high crime rates, biased
policing, concentrated environmental hazards, and
social networks, are important for understanding
population distributions of disease and well being
(Kawachi and Berkman, 2003). This view of public
health suggests that disease is not determined entirely by
an individual’s biologic composition, or ‘‘who you are,’’
or social context, or ‘‘where you are,’’ but rather both/
and; so, who you are depends in part on where you are.
However, with a few exceptions, the relationships
between the physical characteristics of urban neighbour-
hoods and asthma have rarely been studied (Ledogar et
al., 2000; Brugge et al., 2003; Wright and Fisher, 2003).
Additionally, the few studies focusing on neighbour-
hood characteristics and asthma tend to examine one
neighbourhood without performing cross-neighbour-
hood comparisons.
This paper seeks to assess the neighbourhood effects
on childhood asthma hospitalization rates in New York
City by analyzing the environmental characteristics of
neighbourhoods that may be contributing to the onset
and triggering of the disease and comparing across
different neighbourhoods throughout the City. We aim
to investigate the role of the physical neighborhood
environment on childhood asthma hospitalization rates
in New York City with a research premise that
neighborhoods are important units for studying the
contextual effects on health because their physical, social
and economic characteristics all help structure the
health status of populations living in them. Thus, the
theoretical thrust behind our study is that the relation-
ship between health and place is undeniable, but
particular aspects of this relationship, including mechan-
isms and weight of particular neighborhood character-
istics, have been inadequately explored.
While asthma hospitalization data are limited because
they tend to reflect who seeks emergency treatment and
do not necessarily represent asthma prevalence, these are
the only asthma data currently available at the
neighbourhood scale for all of New York City. Using
childhood asthma hospitalization rates for the years
1997–2000 aggregated by US Census tracts, we analyze
the relationship of asthma hospitalization rates and
socio-demographic factors, neighbourhood housing
quality, and environmental exposures such as polluting
facilities, noxious land uses, and mobile-source air
pollution. The purposes of the study are to identify,
using Geographic Information Science (GIScience)
techniques, New York City neighbourhoods with con-
sistently high asthma hospitalization rates (some of the
highest rates ever recorded in the United States) and
analyze some of the neighbourhood-specific hazards,
including housing and environmental exposures, fre-
quently associated with urban asthma. A goal of this
research is to better direct asthma management and
prevention policies aimed at the neighbourhood and
metropolitan scale.
Methods
Using GIScience methods, we analyse and map the
spatial distribution of social and physical characteristics
that appear to affect population health both within and
across different neighborhoods in the same city. In order
to combine mapping with spatial statistical tools, we
selected GIScience methods. GIScience includes numer-
ous analytic tools missing in other commonly used
neighborhood-effect research methods, such as multi-
level analyses, including techniques for spatially defining
‘‘neighborhoods,’’ analyzing the spatial distributions of
hazards within selected areas (as opposed to just across
areas and levels) and mechanisms for the ‘‘smoothing’’
of disparate point data to estimate the spatial distribu-
tion of hazardous exposures across small-areas (Mark,
2000).
This study uses cluster analysis and multiple data sets
to define neighbourhoods with elevated asthma hospi-
talization rates in New York City. We then analyze the
socioeconomic and physical characteristics of neigh-
bourhoods with elevated asthma hospitalization rates,
focusing on housing and environmental conditions. Our
research methods recognize some key challenges con-
fronting analyses of neighbourhood effects on health
(MacIntyre et al., 2002). One challenge is defining
ARTICLE IN PRESSJ. Corburn et al. / Health & Place ] (]]]]) ]]]–]]] 3
‘‘neighbourhood.’’ We define neighbourhood using a
spatial scan statistic that identifies adjacent US census
tracts with elevated asthma hospitalization rates. We call
these disease cluster areas ‘‘neighbourhood hotspots’’. A
second methodological challenge is recognizing that
neighbourhoods are only one level at which health is
influenced, albeit an understudied level. Our research
acknowledges the importance of an ecologic approach
to health, where susceptibility and resistance to disease
operates simultaneously at multiple levels, from indivi-
dual, to family, to neighbourhood, to state, to nation.
Finally, we recognize that our methods are limited
because they fail to capture the dynamic and continual
interaction between compositional (‘‘who you are’’) and
contextual (‘‘where you are’’) characteristics for under-
standing health. However, while our study avoids the
ecologic fallacy, we focus on neighbourhood character-
istics because most researchers tend to fall victim to the
‘‘atomistic fallacy’’—capturing individual-level data but
ignoring the geographic and contextual characteristics of
neighbourhoods (Diez Roux, 2001).
Asthma data
Asthma hospitalization data for the years 1997
through 2000 were obtained through INFOSHARE
(http://www.infoshare.org) for the 2106 census tracts in
New York City. This program consolidates hospitaliza-
tion data obtained from the New York State Depart-
ment of Health, Statistics Planning and Area-wide
Research Council (SPARCS). The International Classi-
fication of Disease, Ninth Revision, Clinical Modfica-
tion (ICD-9-CM) diagnosis code 493 was used to
identify asthma hospitalization discharge diagnosis.
Asthma hospitalization rates per 1000 persons were
calculated for ages 0–14 years for all census tracts for
each year from 1997 to 2000. An average hospitalization
rate per 1000 persons 0–14 years was generated using the
calculated annual rates.
Demographic data for all census tracts in New York
City were obtained from 2000 US Census File SF3a. In
order to capture an area’s socioeconomic status, we
calculated the median household income, the percentage
of the population in poverty, and the mean household
rent. Race and ethnicity data for percentage of the
population white, African–American, and Latino (non-
white Hispanic) were also calculated.
Variable selection
Our study variables were selected to test whether the
built environments of neighborhoods, including housing
quality, location of hazardous air polluting facilities and
noxious land uses, correlated with childhood asthma
(Jackson, 2002). Our variables were selected to go
beyond the conclusions of most asthma studies of urban
neighborhoods: the lower the income and higher the
percentage in poverty, the higher the likelihood of
asthma. The variables reflect our hypothesis that
material and social resources and assets, including
income and wealth, act as fundamental causes of disease
disparities and that greater specification of these
resources, or lack thereof is necessary (Link and Phelan,
1996). We seek to respond to Macintyre et al. (2002)
who note that the majority of studies investigating the
neighborhood effects on health have concluded that
‘‘rather than there being one single, universal ‘area effect
on health’ there appear to be some area effects on some
health outcomes, in some population groups, and in
some types of areas’’ (Macintyre et al., 2002: 128). Thus,
our selection of variables is aimed at investigating the
combination of small-area effects on asthma and to
specify whether aspects of the built environment operate
differently across neighborhoods in the same city with
similar asthma hospitalization rates.
Housing data
Housing characteristic data were obtained for the
percentage of units subsidized and public, the age of the
housing stock, and the condition of units and buildings.
We gathered data on public housing to capture the
number of residents living on public assistance. The age
and condition of residential buildings data were
gathered with the assumption that older and substan-
dard housing would be more likely to contain known
triggers of asthma, such as mold and mildew, cockroach
and rodent dander, and dust mites. The age and housing
quality data were obtained from the New York City
Housing Vacancy Survey for 1996 and the data on
public housing units were obtained from the ‘‘Type of
Housing–Public Housing, 1998’’ from the US Depart-
ment of Housing and Urban Development (HUD). Both
of these data sets are published with the publicly
available 2000 US Census Data (http://www.census.-
gov/hhes/www/housing.html).
Environmental load profile
Environmental hazards data were obtained from
multiple sources and compiled to create a composite
area measure called the environmental load profile
(ELP). The ELP was generated to estimate harmful
respiratory exposures at the neighbourhood level. Since
actual air monitoring is sporadic or non-existent at the
neighbourhood scale, we used three proxies, stationary
source polluting facilities, noxious land uses, and truck
routes.
In order to estimate the respiratory burden from
stationary source air pollution, we gathered data for all
ARTICLE IN PRESSJ. Corburn et al. / Health & Place ] (]]]]) ]]]–]]]4
facilities emitting some pollution into the air from
the US Environmental Protection Agency (EPA),
Aerometric Information Retrieval System (AIRS) Faci-
lity Subsystem (http://www.epa.gov/enviro/html/airs/
airs_query_java.html). These data include small station-
ary air polluting facilities such as boilers in apartment
buildings and drycleaners. We also gathered data on air
polluting facilities from the US Environmental Protec-
tion Agency (EPA), Toxic Release Inventory (TRI)
system (http://www.epa.gov/tri). These are large facil-
ities that emit larger amounts of toxic pollutants into the
air than those in the AIRS database. Finally, we
gathered data from the New York State, Department
of Environmental Conservation, on the location of all
the Municipal Waste Transfer Stations (WTS) in New
York City. These are facilities that transfer residential,
commercial and construction waste that is collected
throughout the city to large long-haul trucks that ship
the waste for landfill disposal outside the city. The air
pollutants emitted by WTS are not monitored, but these
facilities tend to have trucks queuing along neighboring
streets waiting to dump their loads, trucks constantly
entering and exiting, and front-loading construction
equipment inside—all of which can generate a significant
amount of air pollution. These data were aggregated and
mapped by census tract and a facility density per square
mile was calculated for each tract.
A second variable of the ELP included environmental
burdens from potentially polluting land uses. Since data
are not collected on the potential environmental health
impact from living near land zoned for manufacturing
or industry, we developed a dataset that contained all
the potentially polluting land uses in each census tract.
These potentially noxious land uses included areas
zoned for heavy or light manufacturing (‘‘M-zones’’)
and/or contained one of the following uses; gas stations,
repair garages, power plants, sub-stations, sewage
treatment plants, bus depots, rail yards, and vacant
property. These data were obtained from the New York
City, Department of City Planning, Bytes of the Big
Apple (http://www.nyc.gov). A density figure for each
census tract of the number of potentially polluting land
uses per square mile was calculated and defined as the
composite variable ‘‘land use burden’’.
The third component of the ELP aimed to capture
mobile source air pollution from diesel exhaust. Diesel
particulate matter is a known hazardous air pollutant
and triggers asthma attacks (Kinney et al., 2000). Since
actual ambient air monitoring data at the neighbour-
hood level does not exist for diesel or particulate matter,
we again used a proxy variable. In order to estimate
mobile source air pollution, we gathered data on all
truck routes within the city designated by the New York
City, Department of Transportation (http://www.
ci.nyc.ny.us/html/dot/html/trans_maps/truckroutes.html).
Truck routes were selected because the majority of diesel
particulate air pollution in New York City comes from
trucks, not automobiles or buses. Similar to the other
ELP variables, we calculated the density of truck route
miles per square mile for each census tract. We called
this proxy variable ‘‘truck route density.’’
Data analysis
Defining neighbourhood asthma hotspots
All data were entered into a Geographic Information
System using Arcview software from Environmental
Systems Research Inc., (http://www.esri.com). The first
stage involved determining the location of asthma
‘‘neighbourhood hotspots,’’ or neighbourhoods with
consistently elevated asthma hospitalization rates for
children under 14-years old. We defined a hotspot as
contiguous census tracts where the observed asthma
hospitalization rate exceeded the expected rate with a
90% confidence interval. Hospitalization rates were
expressed as the number of hospital admissions with
ICD-9 codes for asthma per 1000 residents under 14-
years old.
We used SatScan 3.5 (Kulldorf, 2003) to calculate
several different hotspots using varied inputs. The
Kulldorf Spatial Scan Statistic is a means to identify
contiguous areas where the total number of cases within
that area is significantly greater than would be expected
given the population. The Kulldorf Spatial Scan
Statistic has been used in fields as diverse as policing
and public health on scales from the local to the national
(Jefferies, 1998; Jemal et al., 2002). We used several
iterations with different parameters to identify areas
with consistently elevated asthma hospitalization rates.
Different iterations included varying parameters such as
limiting the population to those under 14-years old,
including covariates such as race and income, changing
the maximum hotspot size, and using data from 1997 to
2000 for each year individually as well as a collective
average.
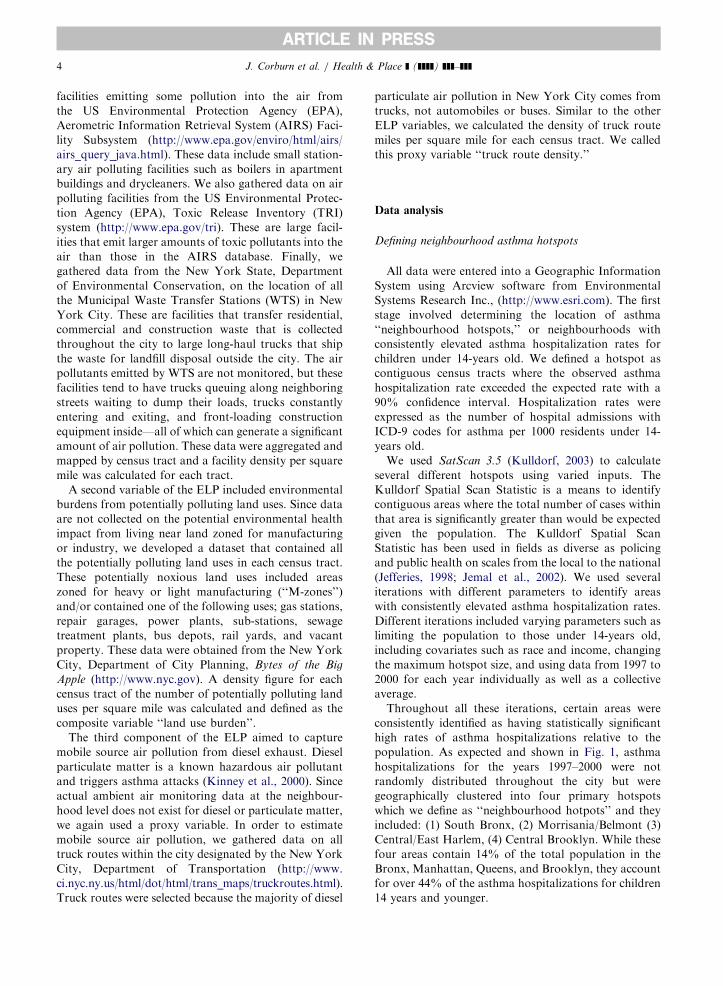
Throughout all these iterations, certain areas were
consistently identified as having statistically significant
high rates of asthma hospitalizations relative to the
population. As expected and shown in Fig. 1, asthma
hospitalizations for the years 1997–2000 were not
randomly distributed throughout the city but were
geographically clustered into four primary hotspots
which we define as ‘‘neighbourhood hotpots’’ and they
included: (1) South Bronx, (2) Morrisania/Belmont (3)
Central/East Harlem, (4) Central Brooklyn. While these
four areas contain 14% of the total population in the
Bronx, Manhattan, Queens, and Brooklyn, they account
for over 44% of the asthma hospitalizations for children
14 years and younger.
ARTICLE IN PRESS
Fig. 1. Neighbourhood asthma hotspots, New York City, 1997–2000.
J. Corburn et al. / Health & Place ] (]]]]) ]]]–]]] 5
Using the asthma hospitalization hotspots as our
‘‘neighbourhoods’’ of study, we analyzed the demo-
graphic, housing and environmental characteristics
within each hotspot, across all hotspots, outside all
hotspots and across the entire study area (New York,
Kings, Queens and Bronx Counties).
Neighbourhood characteristics
Asthma hospitalization rates for all children 0–14
years old between 1997 and 2000 in our ‘‘hotspot’’
neighbourhoods were 12.4 per 1000 persons, nearly
three times the national average of 4.2 per 1000 persons
and twice the NYC average of 6.4 per 1000 persons
(NYC DOH, 2003) (Table 1). These rates are consistent
with earlier studies by Carr et al. (1992) that found the
annual hospitalization rate in New York City between
1982 and 1986 was 3.9 per 1000 and Claudio et al. (1999)
who calculated a rate of 4.6 per 1000. Our findings
indicate that the neighbourhoods of Central and East
Harlem have had the highest asthma hospitalization
rates in the city from 1997 through 2000. These findings
are consistent with earlier studies claiming that Harlem
has some of the highest asthma hospitalization rates in
the United States (De Palo et al., 1994) and recent
studies showing that this trend continues today (Findley
et al., 2003; Citizens’ Committee for Children of New
York, 2000).
ARTICLE IN PRESS
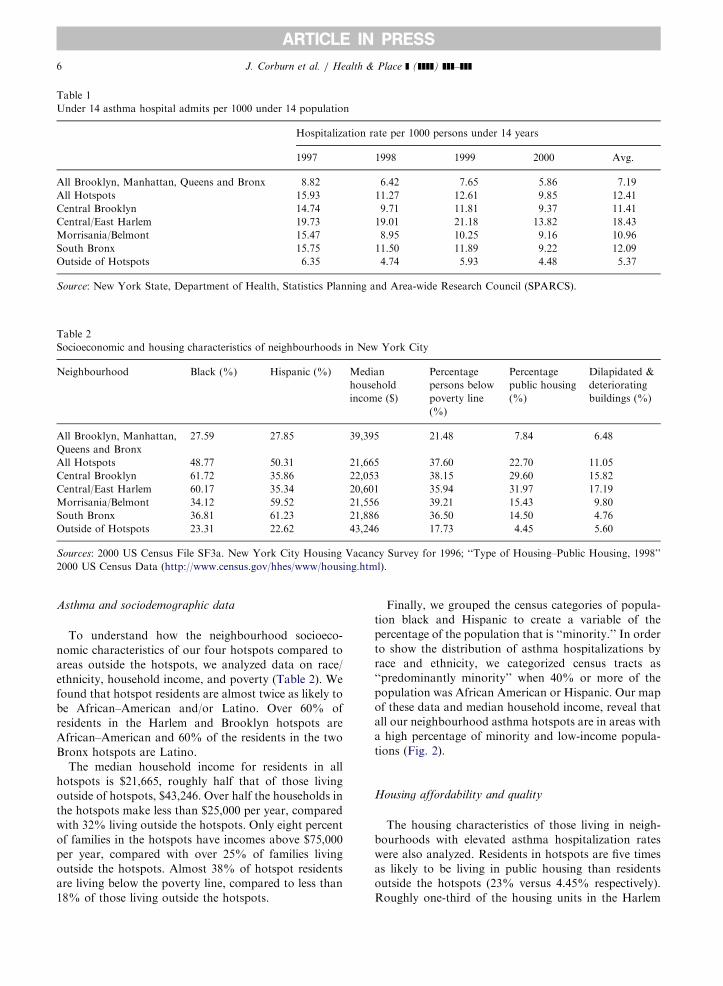
Table 2
Socioeconomic and housing characteristics of neighbourhoods in New York City
Neighbourhood Black (%) Hispanic (%) Median
household
income ($)
Percentage
persons below
poverty line
(%)
Percentage
public housing
(%)
Dilapidated &
deteriorating
buildings (%)
All Brooklyn, Manhattan,
Queens and Bronx
27.59 27.85 39,395 21.48 7.84 6.48
All Hotspots 48.77 50.31 21,665 37.60 22.70 11.05
Central Brooklyn 61.72 35.86 22,053 38.15 29.60 15.82
Central/East Harlem 60.17 35.34 20,601 35.94 31.97 17.19
Morrisania/Belmont 34.12 59.52 21,556 39.21 15.43 9.80
South Bronx 36.81 61.23 21,886 36.50 14.50 4.76
Outside of Hotspots 23.31 22.62 43,246 17.73 4.45 5.60
Sources: 2000 US Census File SF3a. New York City Housing Vacancy Survey for 1996; ‘‘Type of Housing–Public Housing, 1998’’
2000 US Census Data (http://www.census.gov/hhes/www/housing.html).
Table 1
Under 14 asthma hospital admits per 1000 under 14 population
Hospitalization rate per 1000 persons under 14 years
1997 1998 1999 2000 Avg.
All Brooklyn, Manhattan, Queens and Bronx 8.82 6.42 7.65 5.86 7.19
All Hotspots 15.93 11.27 12.61 9.85 12.41
Central Brooklyn 14.74 9.71 11.81 9.37 11.41
Central/East Harlem 19.73 19.01 21.18 13.82 18.43
Morrisania/Belmont 15.47 8.95 10.25 9.16 10.96
South Bronx 15.75 11.50 11.89 9.22 12.09
Outside of Hotspots 6.35 4.74 5.93 4.48 5.37
Source: New York State, Department of Health, Statistics Planning and Area-wide Research Council (SPARCS).
J. Corburn et al. / Health & Place ] (]]]]) ]]]–]]]6
Asthma and sociodemographic data
To understand how the neighbourhood socioeco-
nomic characteristics of our four hotspots compared to
areas outside the hotspots, we analyzed data on race/
ethnicity, household income, and poverty (Table 2). We
found that hotspot residents are almost twice as likely to
be African–American and/or Latino. Over 60% of
residents in the Harlem and Brooklyn hotspots are
African–American and 60% of the residents in the two
Bronx hotspots are Latino.
The median household income for residents in all
hotspots is $21,665, roughly half that of those living
outside of hotspots, $43,246. Over half the households in
the hotspots make less than $25,000 per year, compared
with 32% living outside the hotspots. Only eight percent
of families in the hotspots have incomes above $75,000
per year, compared with over 25% of families living
outside the hotspots. Almost 38% of hotspot residents
are living below the poverty line, compared to less than
18% of those living outside the hotspots.
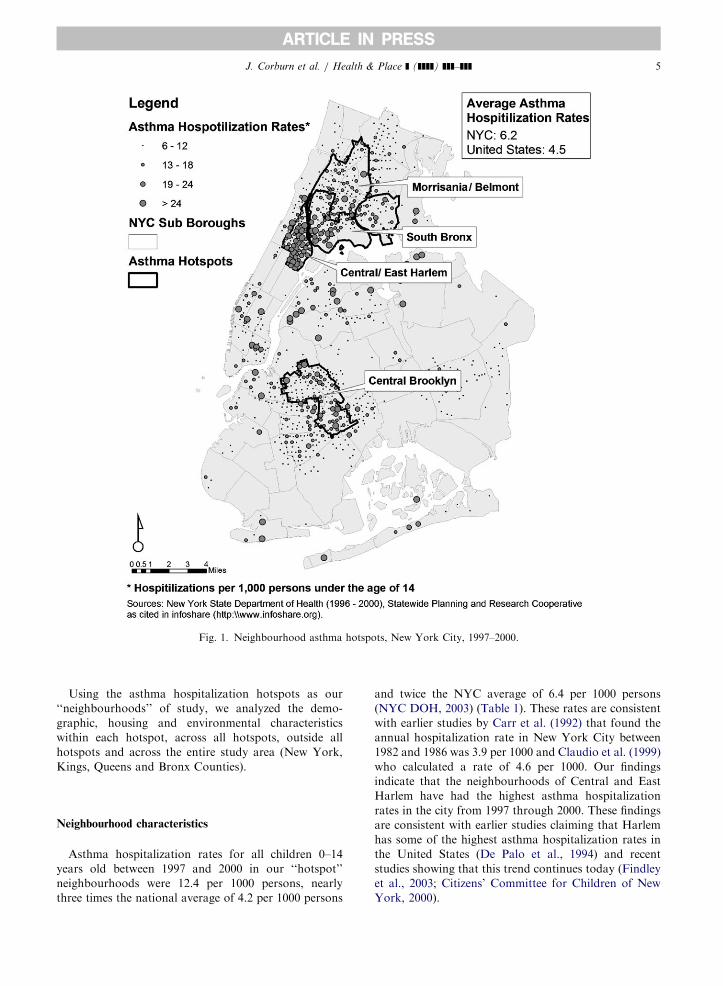
Finally, we grouped the census categories of popula-
tion black and Hispanic to create a variable of the
percentage of the population that is ‘‘minority.’’ In order
to show the distribution of asthma hospitalizations by
race and ethnicity, we categorized census tracts as
‘‘predominantly minority’’ when 40% or more of the
population was African American or Hispanic. Our map
of these data and median household income, reveal that
all our neighbourhood asthma hotspots are in areas with
a high percentage of minority and low-income popula-
tions (Fig. 2).
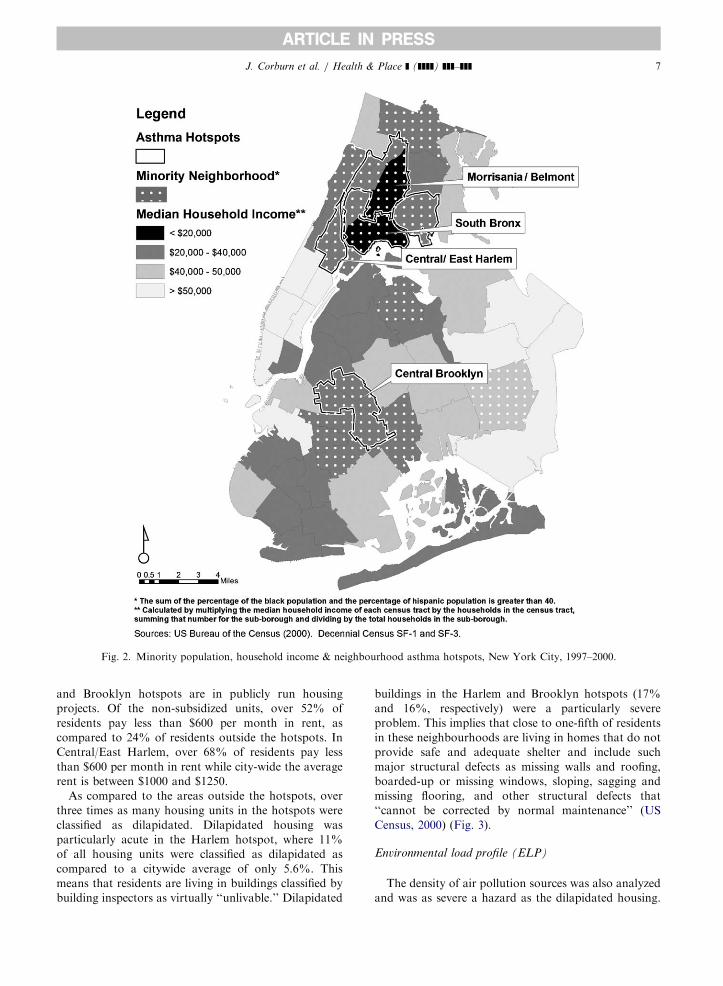
Housing affordability and quality
The housing characteristics of those living in neigh-
bourhoods with elevated asthma hospitalization rates
were also analyzed. Residents in hotspots are five times
as likely to be living in public housing than residents
outside the hotspots (23% versus 4.45% respectively).
Roughly one-third of the housing units in the Harlem
ARTICLE IN PRESS
Fig. 2. Minority population, household income & neighbourhood asthma hotspots, New York City, 1997–2000.
J. Corburn et al. / Health & Place ] (]]]]) ]]]–]]] 7
and Brooklyn hotspots are in publicly run housing
projects. Of the non-subsidized units, over 52% of
residents pay less than $600 per month in rent, as
compared to 24% of residents outside the hotspots. In
Central/East Harlem, over 68% of residents pay less
than $600 per month in rent while city-wide the average
rent is between $1000 and $1250.
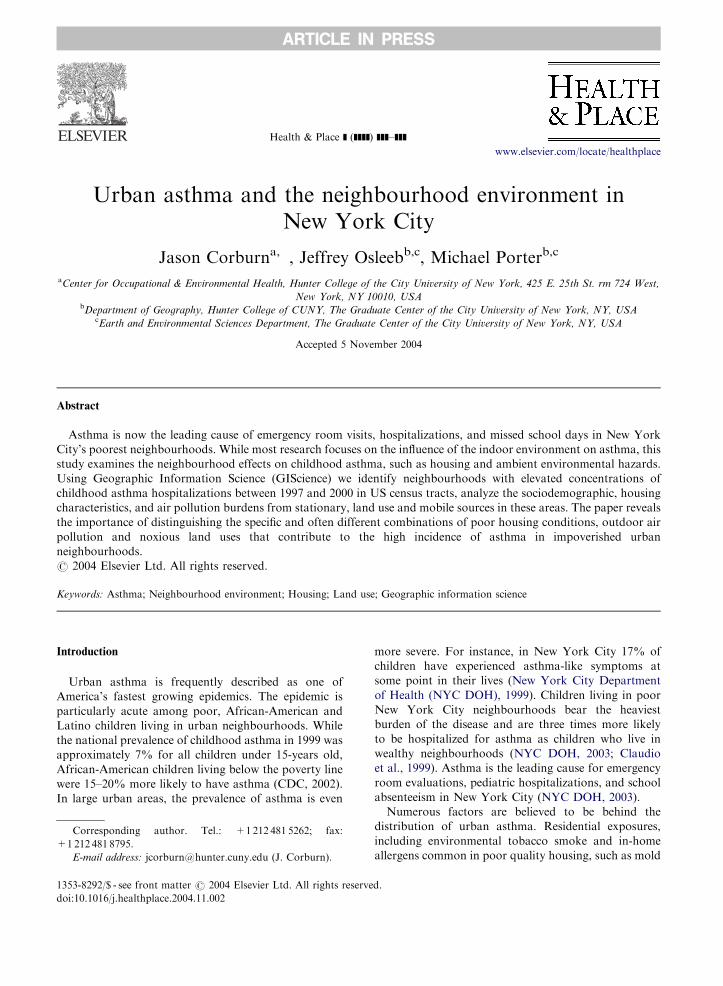
As compared to the areas outside the hotspots, over
three times as many housing units in the hotspots were
classified as dilapidated. Dilapidated housing was
particularly acute in the Harlem hotspot, where 11%
of all housing units were classified as dilapidated as
compared to a citywide average of only 5.6%. This
means that residents are living in buildings classified by
building inspectors as virtually ‘‘unlivable.’’ Dilapidated
buildings in the Harlem and Brooklyn hotspots (17%
and 16%, respectively) were a particularly severe
problem. This implies that close to one-fifth of residents
in these neighbourhoods are living in homes that do not
provide safe and adequate shelter and include such
major structural defects as missing walls and roofing,
boarded-up or missing windows, sloping, sagging and
missing flooring, and other structural defects that
‘‘cannot be corrected by normal maintenance’’ (US
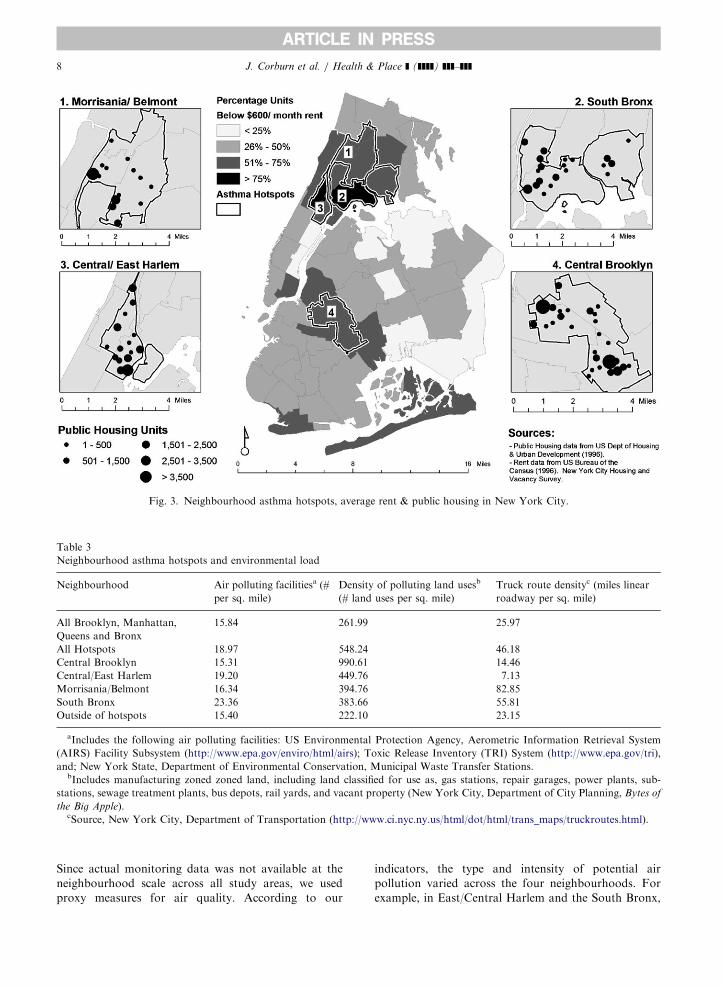
Census, 2000) (Fig. 3).
Environmental load profile (ELP)
The density of air pollution sources was also analyzed
and was as severe a hazard as the dilapidated housing.
ARTICLE IN PRESS
Fig. 3. Neighbourhood asthma hotspots, average rent & public housing in New York City.
Table 3
Neighbourhood asthma hotspots and environmental load
Neighbourhood Air polluting facilitiesa (#
per sq. mile)
Density of polluting land usesb
(# land uses per sq. mile)
Truck route densityc (miles linear
roadway per sq. mile)
All Brooklyn, Manhattan,
Queens and Bronx
15.84 261.99 25.97
All Hotspots 18.97 548.24 46.18
Central Brooklyn 15.31 990.61 14.46
Central/East Harlem 19.20 449.76 7.13
Morrisania/Belmont 16.34 394.76 82.85
South Bronx 23.36 383.66 55.81
Outside of hotspots 15.40 222.10 23.15
aIncludes the following air polluting facilities: US Environmental Protection Agency, Aerometric Information Retrieval System
(AIRS) Facility Subsystem (http://www.epa.gov/enviro/html/airs); Toxic Release Inventory (TRI) System (http://www.epa.gov/tri),
and; New York State, Department of Environmental Conservation, Municipal Waste Transfer Stations.bIncludes manufacturing zoned zoned land, including land classified for use as, gas stations, repair garages, power plants, sub-
stations, sewage treatment plants, bus depots, rail yards, and vacant property (New York City, Department of City Planning, Bytes of
the Big Apple).cSource, New York City, Department of Transportation (http://www.ci.nyc.ny.us/html/dot/html/trans_maps/truckroutes.html).
J. Corburn et al. / Health & Place ] (]]]]) ]]]–]]]8
Since actual monitoring data was not available at the
neighbourhood scale across all study areas, we used
proxy measures for air quality. According to our
indicators, the type and intensity of potential air
pollution varied across the four neighbourhoods. For
example, in East/Central Harlem and the South Bronx,
ARTICLE IN PRESSJ. Corburn et al. / Health & Place ] (]]]]) ]]]–]]] 9
stationary air pollution sources were particularly con-
centrated while in Central Brooklyn there are four-times
as many polluting land uses than in the other
neighbourhoods (Table 3). In the Morrisania/Belmont
section of the Bronx, mobile source air pollution from
trucks, reflected in the density of roads designated as
truck routes, accounts for the majority of the environ-
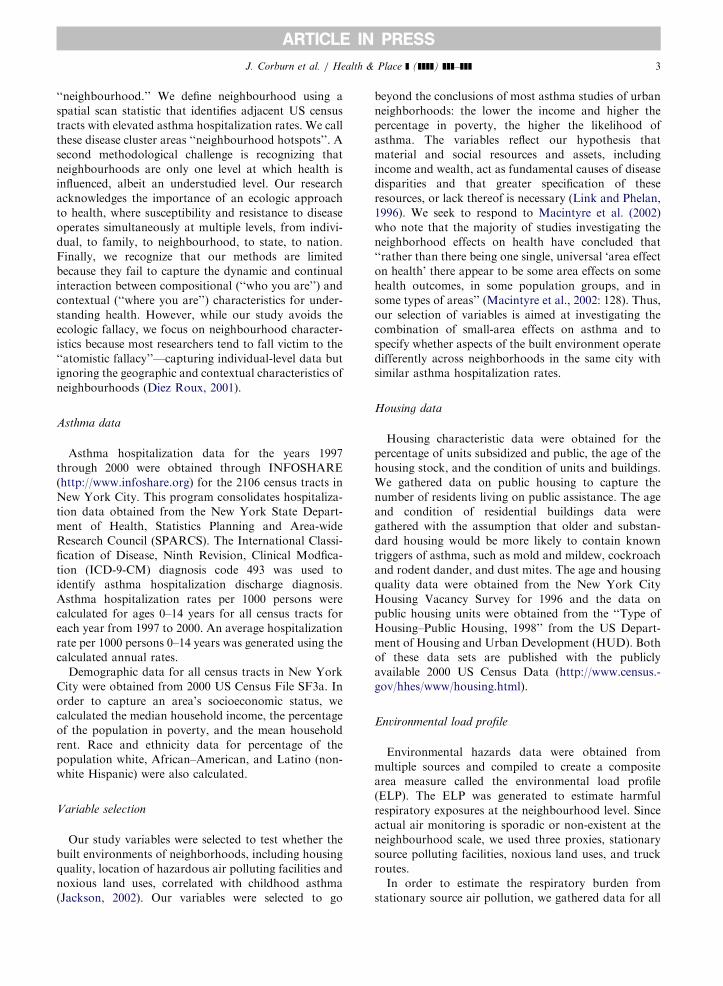
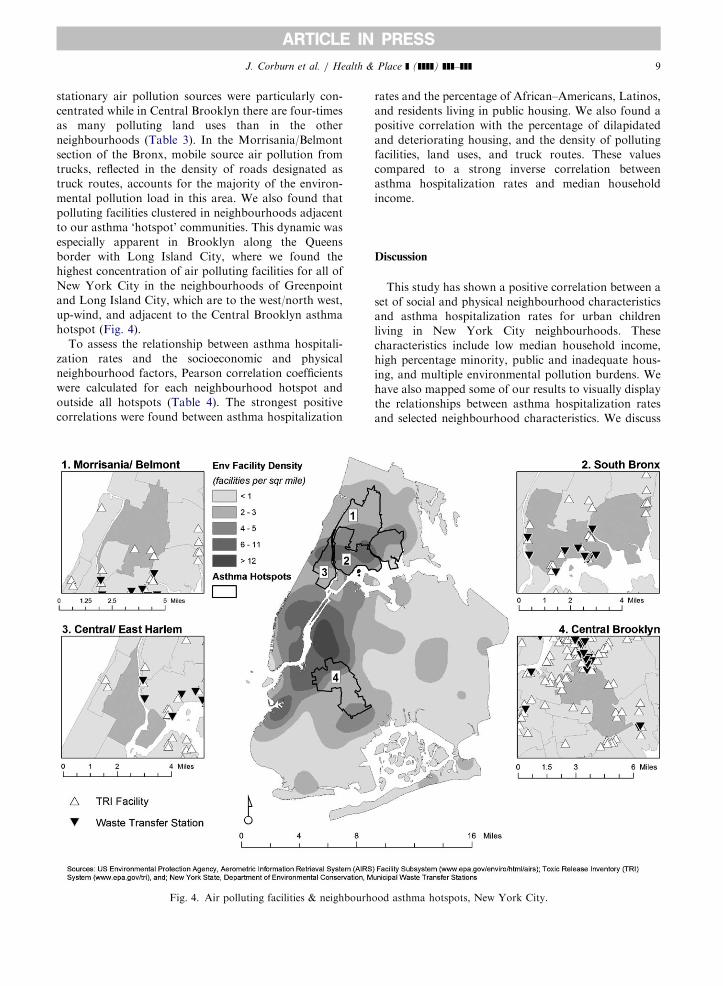
mental pollution load in this area. We also found that
polluting facilities clustered in neighbourhoods adjacent
to our asthma ‘hotspot’ communities. This dynamic was
especially apparent in Brooklyn along the Queens
border with Long Island City, where we found the
highest concentration of air polluting facilities for all of
New York City in the neighbourhoods of Greenpoint
and Long Island City, which are to the west/north west,
up-wind, and adjacent to the Central Brooklyn asthma
hotspot (Fig. 4).
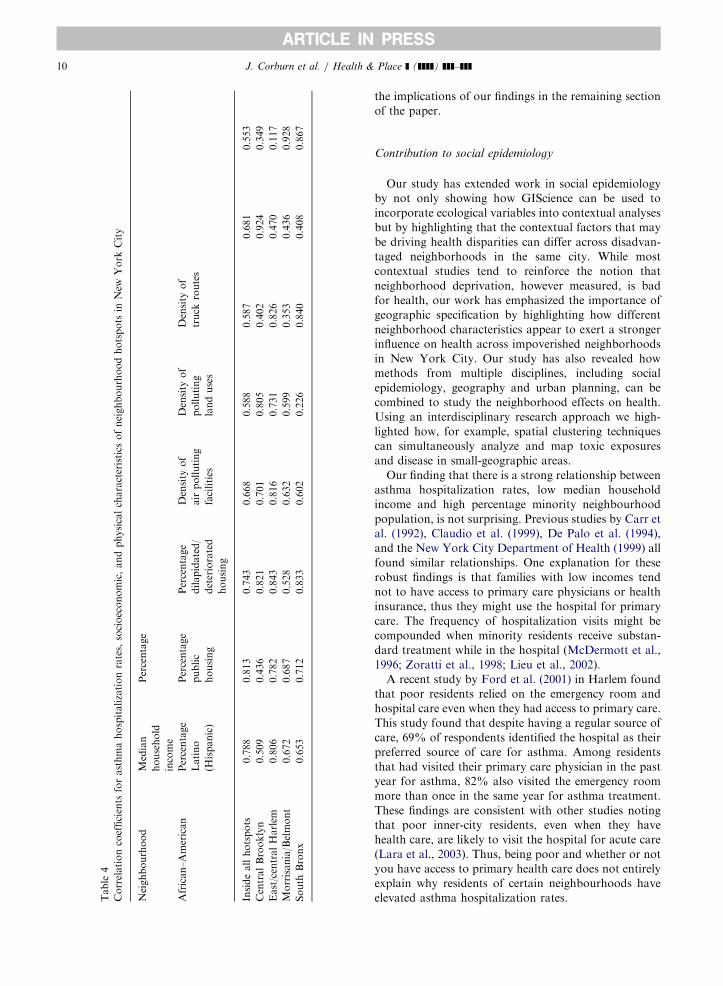
To assess the relationship between asthma hospitali-
zation rates and the socioeconomic and physical
neighbourhood factors, Pearson correlation coefficients
were calculated for each neighbourhood hotspot and
outside all hotspots (Table 4). The strongest positive
correlations were found between asthma hospitalization
Fig. 4. Air polluting facilities & neighbourh
rates and the percentage of African–Americans, Latinos,
and residents living in public housing. We also found a
positive correlation with the percentage of dilapidated
and deteriorating housing, and the density of polluting
facilities, land uses, and truck routes. These values
compared to a strong inverse correlation between
asthma hospitalization rates and median household
income.
Discussion
This study has shown a positive correlation between a
set of social and physical neighbourhood characteristics
and asthma hospitalization rates for urban children
living in New York City neighbourhoods. These
characteristics include low median household income,
high percentage minority, public and inadequate hous-
ing, and multiple environmental pollution burdens. We
have also mapped some of our results to visually display
the relationships between asthma hospitalization rates
and selected neighbourhood characteristics. We discuss
ood asthma hotspots, New York City.
ARTICLE IN PRESS
Tab
le4
Co
rrel
ati
on
coef
fici
ents
for
ast
hm
ah
osp
italiza
tio
nra
tes,
soci
oec
on
om
ic,
an
dp
hysi
cal
chara
cter
isti
cso
fn
eigh
bo
urh
oo
dh
ots
po
tsin
New
Yo
rkC
ity
Nei
gh
bo
urh
oo
dM
edia
n
ho
use
ho
ld
inco
me
Per
cen
tage
Afr
ican
–A
mer
ican
Per
cen
tage
Lati
no
(His
pan
ic)
Per
cen
tage
pu
blic
ho
usi
ng
Per
cen
tage
dilap
idate
d/
det
erio
rate
d
ho
usi
ng
Den
sity
of
air
po
llu
tin
g
faci
liti
es
Den
sity
of
po
llu
tin
g
lan
du
ses
Den
sity
of
tru
ckro
ute
s
Insi
de
all
ho
tsp
ots
�0.7
88
0.8
13
0.7
43
0.6
68
0.5
88
0.5
87
0.6
81
0.5
53
Cen
tral
Bro
ok
lyn
�0.5
09
0.4
36
0.8
21
0.7
01
0.8
05
0.4
02
0.9
24
0.3
49
East
/cen
tral
Harl
em�
0.8
06
0.7
82
0.8
43
0.8
16
0.7
31
0.8
26
0.4
70
0.1
17
Mo
rris
an
ia/B
elm
on
t�
0.6
72
0.6
87
0.5
28
0.6
32
0.5
99
0.3
53
0.4
36
0.9
28
So
uth
Bro
nx
�0.6
53
0.7
12
0.8
33
0.6
02
0.2
26
0.8
40
0.4
08
0.8
67
J. Corburn et al. / Health & Place ] (]]]]) ]]]–]]]10
the implications of our findings in the remaining section
of the paper.
Contribution to social epidemiology
Our study has extended work in social epidemiology
by not only showing how GIScience can be used to
incorporate ecological variables into contextual analyses
but by highlighting that the contextual factors that may
be driving health disparities can differ across disadvan-
taged neighborhoods in the same city. While most
contextual studies tend to reinforce the notion that
neighborhood deprivation, however measured, is bad
for health, our work has emphasized the importance of
geographic specification by highlighting how different
neighborhood characteristics appear to exert a stronger
influence on health across impoverished neighborhoods
in New York City. Our study has also revealed how
methods from multiple disciplines, including social
epidemiology, geography and urban planning, can be
combined to study the neighborhood effects on health.
Using an interdisciplinary research approach we high-
lighted how, for example, spatial clustering techniques
can simultaneously analyze and map toxic exposures
and disease in small-geographic areas.
Our finding that there is a strong relationship between
asthma hospitalization rates, low median household
income and high percentage minority neighbourhood
population, is not surprising. Previous studies by Carr et
al. (1992), Claudio et al. (1999), De Palo et al. (1994),
and the New York City Department of Health (1999) all
found similar relationships. One explanation for these
robust findings is that families with low incomes tend
not to have access to primary care physicians or health
insurance, thus they might use the hospital for primary
care. The frequency of hospitalization visits might be
compounded when minority residents receive substan-
dard treatment while in the hospital (McDermott et al.,
1996; Zoratti et al., 1998; Lieu et al., 2002).
A recent study by Ford et al. (2001) in Harlem found
that poor residents relied on the emergency room and
hospital care even when they had access to primary care.
This study found that despite having a regular source of
care, 69% of respondents identified the hospital as their
preferred source of care for asthma. Among residents
that had visited their primary care physician in the past
year for asthma, 82% also visited the emergency room
more than once in the same year for asthma treatment.
These findings are consistent with other studies noting
that poor inner-city residents, even when they have
health care, are likely to visit the hospital for acute care
(Lara et al., 2003). Thus, being poor and whether or not
you have access to primary health care does not entirely
explain why residents of certain neighbourhoods have
elevated asthma hospitalization rates.

ARTICLE IN PRESSJ. Corburn et al. / Health & Place ] (]]]]) ]]]–]]] 11
Housing conditions
Having a low-income, being a minority and living in
substandard housing appear to be strong neighbour-
hood predictors of asthma hospitalizations. Deteriorat-
ing and dilapidated housing is likely to increase
resident’s exposure to indoor air pollutants known to
trigger asthma, such as rodent and cockroach allergens,
mold, mildew, and dust mites (Rauh et al., 2002).
Substandard housing conditions may contribute to
increased exposure to nitrogen dioxide, from inade-
quately vented or poorly functioning combustion
appliances, and volatile organic compounds, emitted
from particle board and floor coverings, both of which
are associated with asthma. Housing classified as
deteriorating or dilapidated reflect the extreme condi-
tions of unhealthy shelter—boarded-up windows,
burned-out apartments, and over-crowding—and the
chronic hazards, such as cracks in walls and ceilings,
leaky pipes, unrepaired water damage, and inadequate
heating, associated with neglect and disrepair. These
chronic conditions contribute to known asthma triggers,
such as mold spore growth. Dangerous and unhealthy
housing conditions, even in a wealthy city such as New
York, remain a serious and all too common feature of
low-income urban neighbourhoods (Krieger and Hig-
gins, 2002).
Unsafe, deteriorating housing can also act as a social
determinant of health. Dilapidated conditions often
contribute to overall housing instability, the fear of
homelessness, and chronic stress that acts as both an
asthma trigger and a leading indicator of overall health
(Krieger and Higgins, 2002; Fullilove, 1998). Run-down
housing in a neighbourhood can become a place for
criminal activity and violence. To avoid these unsafe
outdoor conditions parents may be forced to keep their
children indoors in substandard housing, increasing the
likelihood of exposure to asthma allergens. The fear of
violence, both outside and inside unlit hallways and
elevators of large public housing developments, can
contribute to psychosocial stress. Neighbourhoods with
dilapidated housing often attract illegal dumping of
municipal, construction and hazardous wastes, which
can harbor pests that infest homes, further exacerbating
asthma risks.
Environmental exposures
Our findings documenting the neighbourhood ‘‘en-
vironmental load’’ are also consistent with prior studies
documenting that poor and minority communities have
higher concentrations of polluting facilities and harmful
air pollutants, such as diesel particulate matter that
lodges in the lungs and contributes to respiratory disease
(Kinney et al., 2000; Olden, 1996). A study by the
American Lung Association found that over half of
pediatric asthma cases occur in areas in non-attainment
of EPA’s air quality standards and that urban popula-
tions are disproportionately impacted (American Lung
Association (ALA), 2001).
As noted above, our study of the neighbourhood
burden from air pollution was limited because actual
monitoring data at this scale do not exist. However, our
proxy variables, density of stationary source air pollut-
ing facilities, polluting land uses, and truck routes for
estimating mobile-source air pollution, confirm that the
environmental pollution burden in the study neighbour-
hoods is particularly severe as compared to the rest of
the city. Our findings have important implications for
future neighbourhood-level studies and for environmen-
tal regulation more generally.
By estimating at the potential air pollution contribu-
tions from multiple sources, our study has highlighted
the importance of studying the multiple environmental
hazards in neighbourhoods and the cumulative burden
chronic exposures to these hazards can place on
susceptible populations, such as children. Urban neigh-
bourhoods, particularly those with low-income popula-
tions and a majority of people of colour, tend to have
many small polluting facilities that do not emit enough
pollutants to be monitored by a regulatory agency but
taken together represent a significant hazardous expo-
sure for residents. Thus, estimating the pollution burden
from noxious land uses, in addition to air quality
monitoring, is necessary for understanding neighbour-
hood environmental hazards.
Land use patterns in most US cities are driven by
zoning rules. Maantay (2001) has shown in a study of
zoning in New York City from 1961 through 1998, that
the zoning of land uses has changed significantly over
this period and, perhaps more importantly to this study,
that industrial zones have large residential populations
in them that tend to be poor and minority. In this same
study, Maantay reaches the conclusion that noxious
land uses concentrate in minority and poor neighbour-
hoods not by chance, but by discriminatory public
policies. There is a wealth of data in urban planning that
supports the notion that zoning has historically been
used as an exclusionary and discriminatory land use tool
(Babcock, 1966). Our analysis of potentially noxious
land uses reveals that these uses tend to cluster in areas
with elevated asthma hospitalization rates, but more
work needs to be done to estimate the environmental
pollution burden from land use patterns.
By underscoring the importance of studying multiple
environmental hazards at the local-level, this study
challenges the current environmental policy system that
regulates pollution with a ‘‘geographically neutral’’
approach. Currently, environmental regulations in the
US place controls on specific hazardous agents or

ARTICLE IN PRESSJ. Corburn et al. / Health & Place ] (]]]]) ]]]–]]]12
pollutants (e.g., lead, asbestos, radon), industries, or,
less frequently, the route of exposure (e.g., drinking
water, ambient air). In the case of each of these
scenarios, the cumulative exposure burden from multi-
ple hazardous agents nor the health effects of local
zoning and land use regulations are considered. Our
findings highlight the importance of considering multi-
ple pollutants and sources, and the need to devise
regulatory strategies that can address neighbourhood-
level environmental pollution burdens.
Study limits
As noted in the introduction, our study is limited by
the fact that we use asthma hospitalization data as a
surrogate for asthma prevalence. Since we were con-
cerned with neighbourhood characteristics, the hospita-
lization data we obtained did not include individual
patient information. Associations we observe from
neighbourhood characteristics may not necessarily hold
true for specific individuals. Our hospitalization data
also did not allow us to screen-out multiple admissions
of the same patient, so results are the number of
admissions, not asthmatic patients in a neighbourhood.
However, hospitalization data at the census tract level
are the only data available city-wide and the only data
that allow for cross-neighbourhood analyses. Finally,
our study could have been strengthened if actual air
pollution monitoring data were available at the neigh-
bourhood scale. In the absence of these data, we were
forced to develop proxy variables for outdoor air
pollution burdens.
These limits also reflect a reality faced by many
researchers and public health agencies in urban areas
across the US. The methodology outlined here provides
one example for how public health researchers con-
strained by funding and/or lack of data can perform
analyses of neighbourhood effects on health. This type
of study, while admittedly incomplete, will continue to
be important because it can speak directly to decision-
making that occurs along pre-existing political bound-
aries.
Conclusions
This study has shown that neighbourhood context
does matter for understanding the distribution of
childhood asthma hospitalization rates in New York
City. Our study has shown that an ecological approach
is necessary for both studying and developing interven-
tion strategies to address urban asthma. Understanding
the neighbourhood effects on urban asthma will
continue to require the use of emerging GIScience tools,
some of which have been employed here. However, more
detailed investigation are required to fully parse-out the
contextual and compositional characteristics that con-
tribute to urban asthma. This study has sketched a study
approach and revealed some new findings, but further
work is needed to address the growing epidemic of
urban asthma.
References
American Lung Association (ALA), 2001. Urban air pollution
and health inequities: a workshop report. [Congresses]
Environmental Health Perspectives 109 (Suppl 3), 357–374.
Babcock, R., 1966. The Zoning Game: Municipal Practices and
Policies. University of Wisconsin Press, Madison.
Brugge, D., Vallarino, J., Ascolillo, L., Osgood, N.D.,
Steinbach, S., Spengler, J., 2003. Comparison of multiple
environmental factors for asthmatic children in public
housing. Indoor Air 3 (1), 18–27.
Carr, W., Zeitel, L., Weiss, K.B., 1992. Variations in asthma
hospitalization and death in New York City. American
Journal of Public Health 82, 59–65.
Citizens’ Committee for Children of New York, 2000. Keeping
Track of New York City’s Children. Citizen’s Committee
for Children, New York.
Claudio, L., Tulton, L., Doucette, J., Landrigan, P.J., 1999.
Socioeconomic factors and asthma hospitalization rates in
New York City. Journal of Asthma 36, 343–350.
De Palo, V.A., Mayo, P.H., Friedman, P., Rosen, M.J., 1994.
Demographic influences on asthma hospital admission rates
in New York City. Chest 106 (2), 447–451.
Delfino, R.J., Gong Jr., H., Linn, W.S., Pellizzari, E.D., Hu, Y.,
2003. Asthma symptoms in Hispanic children and daily
ambient exposures to toxic and criteria air pollutants.
Environmental Health Perspectives 111 (4), 647–656.
Diez Roux, A.V., 2001. Investigating Neighbourhood and Area
effects on health. American Journal of Public Health 91,
1783–1789.
Findley, S., Lawler, K., Bindra, M., Maggio, L., Penachio,
M.M., Maylahn, C., 2003. Elevated asthma and indoor
environmental exposures among Puerto Rican children of
East Harlem. Journal Asthma 40 (5), 557–569.
Ford, J.G., Meyer, I.H., Sternfels, P., Findley, S.E., McLean,
D.E., Fagan, J.K., Richardson, L., 2001. Patterns and
predictors of asthma-related emergency department use in
Harlem. Chest 120 (4), 1129–1135.
Fullilove, M.T., 1998. Promoting social cohesion to improve
health. Journal of American Medical Womans Association
53, 72–76.
Gent, J.F., Triche, E.W., Holford, T.R., Belanger, K., Bracken,
M.B., Beckett, W.S., Leaderer, B.P., 2003. Association of
low-level ozone and fine particles with respiratory symp-
toms in children with asthma. Journal of the American
Medical Association 290 (14), 1859–1867.
Jackson, R., 2002. The impact of the built environment on
health: an emerging field. American Journal of Public
Health 93 (9), 1382–1384.
Jefferies, E.S., 1998. A Multi-method Exploration of Crime Hot
Spots: SaTScan Results. National Institute of Justice, Crime
Mapping Research Center.
ARTICLE IN PRESSJ. Corburn et al. / Health & Place ] (]]]]) ]]]–]]] 13
Jemal, A., Kulldorf, M., Devesa, S., Hayes, R., Fraumeni, J.,
2002. A geographic analyses of prostate cancer mortality in
the United States, 1970–89. International Journal of Cancer
101, 168–174.
Kawachi, I., Berkman, L.F., 2003. Neighbourhoods and
Health. Oxford University Press, Oxford.
Kinney, P.L., Aggarwal, M., Northridge, M.E., Janssen, N.A.,
Shepard, P., 2000. Airborne concentrations of PM(2.5) and
diesel exhaust particles on Harlem sidewalks: a community-
based pilot study. Environmental Health Perspectives 108
(3), 213–218.
Krieger, J., Higgins, D.L., 2002. Housing and health: time
again for public health action. American Journal of Public
Health 92, 758–768.
Kulldorf, M., 2003. SatScan 3.5, Software for the Spatial and
Space-Time Scan Statistics. National Cancer Institute,
Bethesda.
Lara, M., Duan, N., Sherbourne, C., Halfon, N., Leibowitz, A.,
Brook, R.H., 2003. Children’s use of emergency depart-
ments for asthma: persistent barriers or acute need? Journal
of Asthma 40 (3), 289–299.
Ledogar, R.J., Penchaszadeh, A., Garden, C.I., 2000. Asthma
and Latino cultures: different prevalence reported among
groups sharing the same environment. American Journal of
Public Health 90, 929–935.
Lieu, T.A.P., Lozano, J.A., Finkelstein, F.W., Chi, N.G.,
Jensvold, A.M., Capra, C.P., Quesenberry, J.V., Farber,
H.J., 2002. Racial/Ethnic variation in asthma status and
management practices among children in managed medi-
caid. Pediatrics 109 (5), 857–865.
Link, B.G., Phelan, J.C., 1996. Understanding sociodemo-
graphic differences in health—the role of fundamental social
causes. American Journal of Public Health 86, 471–473.
Maantay, J., 2001. Zoning, equity and public health. American
Journal of Public Health 91, 1033–1041.
Macintyre, S., Ellaway, A., Cummins, S., 2002. Place effects on
health: how can we conceptualise, operationalise and
measure them? Social Science and Medicine 55 (1), 125–139.
Mark, D., 2000. Geographic information science: critical issues
in an emerging cross-disciplinary research domain. URISA
Journal 12 (1), 45–54.
McDermott, M., Silva, J., Rydman, R., Giachello, A.L.,
Yarzagaray, E., Robinson, D., Peragallo, N., Barquero,
H., Arrom, J.O., 1996. Practice variations in treating urban
minority asthmatics in Chicago. Journal of Medical Systems
20 (5), 255–266.
Mott, L., 1995. The disproportionate impact of environmental
health threats on children of color. Environmental Health
Perspectives 103 (Suppl 6), 33–35.
New York City Department of Health (NYC DOH), 1999.
Asthma Facts. Community Health Works. Department of
Health and Mental Hygiene, NewYork.
New York City Department of Health and Mental Hygiene
(DOH), 2003. Asthma can be controlled. NYC Vital Signs
2, 1–4.
Olden, K., 1996. Effects of air pollution on African-American
and other minority populations. Otolaryngology—Head &
Neck Surgery 114 (2), 255.
Rauh, V.A., Chew, G.L., Garfinkel, R.S., 2002. Deteriorated
housing contributes to high cockroach allergen levels in
inner-city households. Environmental Health Perspectives
110 (suppl. 2), 323–327.
Sears, M.R., 1997. Epidemiology of childhood asthma. Lancet
350, 1015–1020.
Strachan, D.P., 2000. The role of environmental factors in
asthma. British Medical Bulletin 56 (4), 865–882.
US Census, 2000. New York City Region. Housing & Vacancy
Survey (Local Census): Bureau of the Census, US Depart-
ment of Commerce.
Weiss, K.B., Gergen, P.J., Wagener, D.K., 1993. Breathing
better or wheezing worse? The changing epidemiology of
asthma morbidity and mortality. Annual Review of Public
Health 14, 491–513.
Wright, R.J., Fisher, E.B., 2003. Putting asthma into context:
community influences on risk, behavior, and intervention.
In: Kawachi, I., Berkman, L.F. (Eds.), Neighborhods and
Health. Oxford University Press, New York, pp. 233–262.
Zoratti, E.M., Havstad, S., Rodriguez, J., Robens-Paradise, Y.,
Lafata, J.E., McCarthy, B., 1998. Health service use by
African Americans and Caucasians with asthma in a
managed care setting. American Journal of Respiratory &
Critical Care Medicine 158 (2), 371–377.