Embed Size (px)
Citation preview

New Product Development Project Construction, Implementation and
Continual Improvement: A Case Illustration from Semiconductor
Manufacturing
By:
Philip Daniel Walker
A Senior Project Submitted
in partial fulfillment
of the requirements for the degree of
Bachelor of Science in Industrial Engineering
California Polytechnic State University,
San Luis Obispo
Graded By: _______________________________ Date of Submission: _______________
Checked By:_____________________________ Approved By:_____________________

Table of Contents Abstract ......................................................................................................................................................... 5
Introduction .................................................................................................................................................. 6
Background ................................................................................................................................................... 7
Problem Background ................................................................................................................................. 7
Industry Background ................................................................................................................................. 8
Project Background ................................................................................................................................... 9
Literature Review ......................................................................................................................................... 9
Project Management ................................................................................................................................. 9
Metrics Lead to Identifying Important Factors .................................................................................... 10
Metrics Investigated: Self Managing Work Teams ............................................................................... 11
Manufacturability: The Concerns of a PM ........................................................................................... 12
Project Type Leads to Identifying Important Factors.......................................................................... 13
Theory Vs Practice .............................................................................................................................. 14
Quality Management................................................................................................................................ 15
Identifying and Assessing Risk .............................................................................................................. 15
Continual FMECA ................................................................................................................................ 16
Customer Involvement ........................................................................................................................ 17
Feedback is Essential ............................................................................................................................ 18
Knowledge Management ......................................................................................................................... 18
Knowledge Base and Knowledge Sharing: Following Toyota’s Example ............................................. 18
PQP in Practice: Skunkworks .................................................................................................................. 20
Assessing Economic Viability ................................................................................................................... 21
Design of Solution ....................................................................................................................................... 22
Define ...................................................................................................................................................... 22
Measure and Analyze ............................................................................................................................... 23
Improve ................................................................................................................................................... 24
Control .................................................................................................................................................... 26
Methodology ............................................................................................................................................... 27
Results ......................................................................................................................................................... 27
Conclusion .................................................................................................................................................. 28
Appendix A: Cost Analysis ......................................................................................................................... 29
Appendix B: Table of Project Management Software ................................................................................. 30
Appendix C: Interview Data ....................................................................................................................... 33

Appendix D: FMEA ..................................................................................................................................... 41
Appendix E: Acronyms Used ...................................................................................................................... 42
Appendix F: Best Practices .......................................................................................................................... 43
References................................................................................................................................................... 44

Figure 1: Wafer Routing Process ................................................................................................................... 8
Figure 2: Projects Success Metrics and Factors (Young 2008) ................................................................... 11
Figure 3: Strategy/Tactics Effectiveness Matrix (Slevin 1998) ..................................................................... 14
Figure 4: Project Time Shortened By Customer Involvement (Bommer 2002) ........................................ 17
Figure 5: The Relationship between Quality and Throughput (Bauer 2007) ............................................. 22
Figure 6: Employee Analysis of Project Success .......................................................................................... 24
Figure 7: Elements of PQP........................................................................................................................... 25
Figure 8: Full Analysis of Project Management Software ........................................................................... 30
Table 1: Identify the Customer ................................................................................................................... 25
Abstract
Successful projects are the backbone of companies that lead their respective fields. Failed project for
one reason or another are more often than not the reason some companies fall further and further
behind their counterparts. Projects are becoming more technologically advanced. Projects are more
expensive and are receiving less funding than they used to due to a highly competitive economic
climate. The projects in the second decade of 2000 have to meet the triple bottom line of cheaper,
faster, and better than ever before. Due to these reasons project have continued to fail at an alarming
rate (nearly 70% in 2009 according to the Standish Group) despite the increased awareness and the
push to involve some Project Management tools.
The seemingly elusive goal of systematically addressing and excelling at the triple bottom is attainable
when a project manager correctly utilizes every tool available including extending their knowledge
beyond typical project management tools into the realm of knowledge management and quality
management. It is with this newly dubbed Project Quality Plan (PQP) that project managers will utilize
the best practices from project management (PM) by ensuring clear leadership and by using scheduling
tools, from knowledge management (KM) by implementing a knowledge base and knowledge practices
popularized by Toyota, and finally from quality management (QM) by identifying the customer and
meeting their needs to requirements documentation. It is with the PQP that project managers can
ensure successful projects are no longer rare occurrences but common place within their company.
The PQP was first constructed in response to a Hard-drive manufacturing company’s (named Company
A) struggle to install, qualify and release to manufacturing on time. At the time of writing this report,
Company A is currently implementing their own PQP. A possible later investigation could analyze the
effectiveness of this PQP implementation and will provide recommendations for next steps.
Project success is possible, but one successful project is not enough. To ensure consistent and continual
project success there needs to be a change in the culture of Company A to one that fully embraces and
embodies the principles of PQP.

Introduction It is not uncommon for organizations to find that their projects are not only late, but over budget. The
installation process for new wafer process equipment is complex, time consuming and fraught with
pitfalls. The implications of New Product Development (NPD) projects failing to meet the requirements
are drastic, and yet there lacks a definitive solution. After participating in a NPD project that was
characterized by its lateness, the writer decided that there had to be a solution or at the very least an
explanation for its failure. After research the writer found there to be a lot of differing explanations and
even more proposed solutions.
Difficulties of projects lie within the fact that outside of the immediate project there are schedule delays,
system setup changes and on top of that qualification and release to manufacturing are divided between
different organizations and individuals. Lacking a central project management approach that is focused on
quality and exceeding customer expectations, the equipment is often released later than needed,
incompletely characterized and lack the necessary process controls. This impacts manufacturing capacity
and product throughput and in some cases can result in lower processing yields due to equipment
problems not identified and addressed during test and setup. Ultimately these problems increase
product cost and detract from a company’s ability to compete in the marketplace.
The purpose of the study is to examine what causes New Product Development projects to be late by
investigating through literature and interviewing participants of a recent project of a semiconductor
company. It is impractical to create a PQP to encompass every type of project, therefore this report will
only focus on NPD projects. This report will provide the following:
• Discuss and Assess past project
• Develop Project Quality Plan (PQP) o Project Management Plan
� Benchmarking, Team working practices o Knowledge Management and Knowledge Sharing Plan
� Live data update o Quality Management Plan
� Effectively Utilizing FMECA � Customer Identification and Involvement
• Develop recommendations for future New Product Development projects
Contained within this report is a survey of literature, where the different elements of a PQP are
investigated for best practices and recommendations. Following that is a brief overview of the project.
For the purpose of this project and due to nondisclosure of proprietary information the company will be
referred to as Company A. Company A is one of the leaders in storage in the semiconductor industry,
and because of that, there will be a brief introduction to what storage devices are, their uses, and a brief
overview of the fabrication of those devices. After the release to manufacturing, the writer interviewed
the many different players in order to figure out the roles they played. The results from this interview
will be compared to the suggested best practices in order to assess the relative success of the project
and to suggest possible areas for improvement. After discussion of the project and response from the
survey of participants involved, the project and company type characterized in order to provide reasons
for metrics selected and a recommendation and examples of best practices will follow. Templates will be
created for the future NPD projects in order to prevent future mistakes. Upon the conclusion of best
practices an economic viability assessment will be provided to conclude this report.

Background
Problem Background
Projects are complex and difficult, and project managers have the difficult job of managing a wide variety
of human, financial, and technical factors all while working without sufficient authority, money or
manpower (Slevin 1987). The reality of industry demands forces project managers to compress their
timelines, and processes to be released before being fully finished, resulting in a product that needs the
Engineering team support beyond project release. This produces a process or product that is less likely
for the now disturbed production system to resort back to high productivity and low yield loss as
quickly as possible (Kim 2009), and instead cause increased costs to the company, potentially remove
them from a market window or even in some extreme cases force a company into bankruptcy. This is
because manufacturability (the quality of development ensuring the product can be produced efficiently
and reliably (Kim 2008)) is threatened due to the incomplete project being handed off. It is found that a
third of projects are terminated before their nominal completion time while more that 50% of projects
cost approximately double their estimate. Project managers’ approaches and behaviors differed, tending
to deny, avoid, ignore and delay dealing with risk. Mitigation actions can reduce the impacts of the
possible risks that could affect the project. If proper risk measures and strengths are implemented for
projects, the efficiency of the method will be greatly improved (ZafraCabeza 2007).
The remedy to this common problem throughout industries is a reassessment of how Project
Management, commonly thought to only encapsulate the time from receiving the project to hand off, is
addressed. Project management, to be truly effective, needs to be holistic. It needs to address the needs
beyond the direct functional team working on it (for example: Research and Development), and instead
address and involve the impacting Manufacturing, Research and Development, Marketing, and
Engineering teams. On top of that, projects must be managed to the extent that the long term issues are
addressed and accounted for throughout the organization. All of those different entities who normally
function with resistance towards each other now become customers for each other, creating an
environment that fosters companywide development and growth. And when the customers become
project partners rather than distant entities, the depth of knowledge increases and the projects schedule
decreases and often reduces project cost (Bommer 2002). Furthermore the partnerships created lead to
an increase in jobs and mutually benefit client and company. The depth of knowledge is fostered by an
increase in effective communication, which also leads to beneficial data management because of the
strong knowledge base.
The world is “flattening” due to the immediacy of information flow. It is now possible to interact with
people across multiple time zones in real time. Companies are no longer competing locally, or even
domestically, but instead globally. To succeed, companies need to produce innovative quality products
(done through new product development (NPD)) quicker than the competition (Cooper 1995). There is
a demand for a new age of project managers who become responsible for the development and
implementation of a Product Quality Plan (PQP), which ties together a project plan, and a data
management plan. A PQP creates and unifies cross-functional teams, which benefits the company at
every level. It ensures that quality is not just a problem for manufacturing by initially opening
communication to the customers and then implementing good practices and by planning and accounting
for the possible issues that could arise. It also implements a centralized data management structure and
easily accessible knowledge base for future generations to learn and pull from. By implementing a
standard of expecting a PQP from project managers and input into the PQP from all members,

companies will be able to focus on product development and not waste time on troubleshooting the
reoccurring problem of failed projects.
Industry Background
Company A manufactures and sells hard disk drives. A hard disk drive (HDD) is the main permanent
storage for computers, therefore it is used for long term storage. A typical HDD has a multitude of
moving parts including but not limited to: the actuator arm, a read/write head, media disk, 2 electronic
motors which are scaled either up or down depending on the size of the end product. Hard disk drives
are used in desktop or laptop personal computers, as well as cars and airplanes, and are even used with
super computers. HDD are used by companies ranging from publically traded companies like Google to
the United States government.
Within the HDD manufacturing division of Company A, there are two main groups: Head and Media
Disk. This case study comes from a tool installation within the Head group. Heads are manufactured in
large batched called wafers, which are cut up into individual heads once the wafer reaches the final
product stage. A wafer will typically take about 40 days to get from start to finish. Wafer manufacturing
is done within a semiconductor-like line. The line is housed in a cleanroom and contains hundreds of
multimillion dollar tools. A wafer must go through nearly 700 processes to get to the finished product
stage. Photolithograhy, Vacuum deposition and etching, plating, planarization, many test and inspection
tools are required. Depicted below is a figure of the wafer routing process.
Figure 1: Wafer Routing Process

Project Background
In the summer of 2010 Company A needed a new Chemical Mechanical Planarization (CMP) tool to
replace its current outdated model. Company A decided to purchase their CMP tool from a new
vendor, and because of that the Development Engineers and the Process Engineers were tasked to
release a first of its kind to manufacturing with a very flexible timeline. Even with this flexible timeline
the release to manufacturing date was dramatically later what was originally planned. On top of that the
Engineers neglected to involved the Manufacturing team early on (see Appendix C-Manufacturing
Manager), which has resulted with a tense relationship between Manufacturing and Engineering as well as
resulted in a large delay in project completion.
The project suffered from multiple partial project managers, because the tool started as was purchased
and chosen by the Development Engineering team and then handed off to the Process Engineers to
deliver to Manufacturing. Both Development and Process Managers commented that they lacked the
proper upper management backing, which led to this project having a lower priority of time as well as
money invested. Within Company A there was no clear or defined space for documents to be managed.
There was also no clear idea of who this project actually served, or who their customer was. This led to
poor resource management especially of the Development and Process Engineer time. It led to the
process failing manufacturing’s internal quality standards. Finally, none of this process was documented
and stored in a public space to ensure the same mistakes aren’t made.
The problems present within this project are present throughout the majority of projects in industry
today. It was decided that research should be done in order to derive and compile the best practices
within Project Management, Knowledge Management, and Quality Management and therefore create a
comprehensive Project Quality Plan.
Literature Review After researching project management, quality management, and knowledge management, the writer
gained significant insight into the nuances and demands of projects. The following details the specific
nuances of: project management (PM), specifically dealing with defining appropriate success metrics and
focal points with case examples of implementation, quality management (QM), specifically dealing with
risk management, the use of FMECA, and the necessity of customer involvement, and knowledge
management (KM), specifically dealing with knowledge sharing and distribution and the current need for
real time updating. Project management that follows the principles of a PQP is, in essence, comprised of
a high functioning project team, and a efficient and effective project manager who fulfills the needs of the
project at hand, while producing a project that is self-sufficient in meeting the needs of the future.
Project Management The successful deployment of new products is essential for firms to gain and maintain competitive
advantages today (Kim 2008). But with more than $250 billion is spent in the United States each year on
industrial projects and with only 26 percent of these projects completed on time and within budget
(Bounds, 1998) it is easy to see that projects often do not reach the desired goal. The question is often
posed: What causes projects to fail so often? The answer is a lot whole lot of things. It is important to
figure out the important factors that a manager should focus his or her energy on. A survey of literature
and investigation of past project managers directed the writer to see that the project success depends
on the project team, the project manager, and how those two work together. The management of the

project at a structural level depends mainly on the project manager. The project manager is in charge of
selecting projects, selecting team members, prioritizing tasks, and most importantly facilitating and
encouraging communication between the team. There are a multitude of software packages that can aid
in the planning, documentation, and prioritization of projects but projects still fail. Project success
cannot comprise of plugging different costs into a formula, project success depends on the management
of the team.
The question arises: What must a good leader be focused on? A survey of literature provided the writer
with multiple metrics for a PM to focus on. In order to meet the measures of project success (Project
cost, schedule, impact to plant) a PM must identify the key determinates of team success and exploit
them (Young 2008).
Metrics Lead to Identifying Important Factors
There are three widely accepted objective measures of project success: project cost, project schedule,
and plant operability (Young 2008). Young defines success in terms of project cost if the project is
completed within the proposed budget, the project schedule is completed within its initial scheduled
time frame and project is characterized by high utilization with minimal maintenance shutdowns (plant
operability). Often the metrics are portrayed in aggregate fashion but in order to be able to optimize
one or two metrics they have been disaggregated. If the desire to optimize the project cost was
suggested the best predictors (and therefore the focal points) are project team efficacy, cross-functional
project teams, autonomous project team structure, and virtual office usage. If the desire is to optimize
the project schedule the best predictors are the continuity of project leadership, cross-functional
project teams, and project manager incentives. As stated, project leadership is important. Jha states: “the
project coordinator has to be adept in team building skills, contract implementation skills, and project
organization skills.” Finally if the desire is to optimize plant operability the best predictors are clear
project goals, and an office design that facilitates effective communication (Young 2008). In general
Young proposed that the result of their cross-sectional research implies cross-functional teams have a
positive correlation to project successes. Below is the full list of factors and matrices displayed
graphically in Figure 1.

Figure 2: Projects Success Metrics and Factors (Young 2008)
The factors which displayed no interaction were the project team’s co-location, and the project team’s
continuity, implying that within reason team members can come and go as needed for the project
development and implementation (Young 2008). Young admits that for the purpose of simplicity they
had to ignore the soft indicators of project success such as satisfaction of the client, and employee
development and satisfaction cultural norms (Young 2008). The Skunkworks approach (Bommer 2002)
affirms the importance of the “soft” factors by adding that in fact customer involvement and employee
development are not only helpful but critical to project success.
The power of a good cross-functional team is continually reiterated throughout literature (Cooper
1995). In the study done by Cooper where 103 major new products were investigated. It is found that
the three factors (on top of cross-functional teams) which played important roles in getting a project
delivered on time are undertaking solid up-front homework, a strong market orientation, and getting
sharp early product definition (Cooper 1995). On the topic of market orientation involving the
customer throughout the development phase with rapid prototyping was found to be instrumental to
fast product delivery (Cooper 1995). A topic that is only briefly mentioned is that of proper project
launch. It is believed that project launch is a reaction to the factors mentioned above.
The metrics once aggregated to encompass all three measures of project success that a PM is concerned
with fit two main groups: project manager related and influenced, and project team related and
influenced. Within the project team related metrics are: team efficacy, and cross-functional team
integration. Within the project leader related metrics are: PM continuity and incentives, clear goals,
office design for communication, and autonomous team structure. Investigated below are the factors
that make up a strong project team, and the concerns a project manager must be aware of.
Metrics Investigated: Self Managing Work Teams
As discussed above, it is imperative that a project team has efficacy (or potency) and is cross-functional.
As companies are looking for more and more places to minimize their spending they are turning to Self-
managing work teams. The claim to fame of self-managing work teams (SMWT) is that not only do they

enhance work-life quality, but they improve customer service, and productivity (Millikin 2010). As
implied in their names, SMWT start at an individual level.
The characteristics of SMWT players are someone who performs their own duties well, and rarely
solicits others to help finish their tasks. They are commonly called “self-starters” and do not rely on
their boss to provide direction or tasks to do. The obvious potential issue it that when placed in a team,
SMWT struggle to reach of point of cohesion and constant are working in opposite directions.
A team leader desiring to fulfill the metrics found to be crucial to project success would not only choose
players that are self-managing, but would choose players coming from all of the different parts of a
project. The main job of the project manager in this instance is to give these players a reason to work
together, which is commonly done through creating team cohesion. Team cohesion encourages self-
managers to work harder for collective pursuits according to trust scholars. Because trust reflects (and
underpins) cohesiveness, individuals who trust their teammates may more fully apply their resources and
energies toward the group’s task as they believe that teammates will not takes advantage of them or let
them down (Millikin 2010). Millikin later states that the effective ways to induce team building is through
the: “diversity training, collaborative problem-solving exercises, and conflict management training that
integrates social activities.”
Once the trust is built the next task for a PM to finally have a team that effectively works together is
coordination and communication. Coordination in the age of the internet is facilitated through many
different software packages, ranging from openware to MicroSoft’s project management package.
Because MTS (Multi-team systems) leaders are more likely share authority with teams and circulate
stronger empowerment climates within MTS self-managing teams tend to adopt collective beliefs that
their MTS can muster whatever it takes to succeed (Millikin 2010). With great empowerment and with
shared authority, SMWT players are more likely to come up with their own goals and tasks, leaving the
PM to serve as a sounding board and protection from upper management.
It is possible that a PM is not always able to find or fund a team fully comprised of self-managers. In that
case Millikin suggests that the best way to enhance individual self-management with an already
established team, leaders might engage in more one-on-one coaching or mentoring with team
participants and ensure that excessive peer control does not constrain members.
As the paradigm of team make-up has shifted for the better due to budgetary and efficiency concerns,
managers are encouraged to use this opportunity to foster the growth of players that are not quite self-
managing. A potent cross-functional team is essential to project success, and a project manager is in
charge of selecting, grooming, empowering that team.
Manufacturability: The Concerns of a PM
A project manager obviously has many concerns, but the most important one is that of
manufacturability. For a successful NPD, a firm must be able to develop an innovative product that
appeals to the customer and manufacture it in large quantity in order to reap profit from the mass
market: its ability to manage the ramp-up production effectively is essential to the eventual success of
new product development (Kim 2008). This ability to ramp-up production effectively is called
manufacturability. An efficient production ramp-up consists of quickly restoring the production system
to high productivity and low yield loss once the product has been introduced. When is manufacturability
threatened? Manufacturability is threatened when there are unresolved problems related with the
product and/or market attributes during the NPD process, since they make the transition from

development environment to ramp-up production stage difficult or delayed, causing quality problems
along the way (Kim 2008).
Due to the fact that NPD is a fast-paced, creative process where participants are often switching
between high-level conceptual issues and a low-level focus on details, it is an unfortunate reality that in
design teams, necessary activities routinely “fall through the cracks”, documentation lags development,
and decisions are made then remade due to an inability to get all the players together, the introduction
of new players and an inability to recall all the details (Cooper 2003). Issues are raised and forgotten
because attention was diverted elsewhere. Decisions are made based on sketchy information that is not
revisited. Opportunities are lost because no one is assigned to follow up on them. Quality control starts
with the beginning of the project with the customers and the design team. The section below on quality
management goes further in depth the purpose of customer involvement.
The benefits of the efficient ramp-up are desired by every project manager, but Kim suggests that these
benefits will not be reaped unless the manager implements a cross-functional team. A cross-functional
team does not mean that a random selection of people from a smattering of functional groups is desired.
As mentioned above the team is best when comprised of SMWT players. Kim further adds that it is
essential that the teams are balanced (and therefore the choices regarding the project are balanced) and
that according to the research, a physical co-location is still relevant. As social media is still being
introduced, especially to an older generation that has yet to interact with this new technology. The
writer believes that because the workforce is mainly comprised of workers who grew up without social
media is currently the reason why a physical location is still desired. This is because the most
information can be transferred face-to-face. The writer believes that it will not be long until this norm
changes to a point where the social media scene is the more desired form of interaction.
Manufacturability is a huge concern of a project manager. It is essential that a PM knows to involve every
functional group and their concerns within the team in order to efficiently ramp-up production. A
project manager is rendered completely ineffectual if they are managing the wrong type of project
though. Discussed briefly below are the recommendations of a few scholars for figuring out the PM
metrics depending on project scope.
Project Type Leads to Identifying Important Factors
Projects are inherently different from each other. Project can range from a preventative maintenance
project, to research and development, or possibly in the area that this paper is focused on, New
Product Development. Of course there are many other types of projects. It is suggested that it is not
the type of project that makes a difference but in fact the scope (Dvir 2008). Dvir continues to specify
through his research say that: “Risk management and budget control are less critical for low scope
projects but extremely important for high scope projects. Flexibility in management is important for
relatively small projects but is not important at all for large projects. Scope is one of the major variables
in project classification (Dvir 2008).” This flexibility of management that is talk about pertains mostly to
the fact that a manager often needs to manage multiple projects at the same time, some large and many
small and if a manager is unable to reconcile that resources will not be moved around as they are
needed. Further reading agreed with the metrics set earlier by confirming that milestones are important
for project success. This is because when realistic and appropriate milestones are set, the team can
work with less interruption from the manager and the manager can focus on building and growing the
team rather than making sure task are completed.

Theory Vs Practice
It is important to note that management theory and actual practice often do not perfectly align. In that
regard, it is important to note how managers must mix their strategies and tactics all the while carefully
juggling office politics.
As defined by Slevin, strategy consists of top level management like the planning and conveying the
mission and tactics consist of managing the technical tasks, managing personal, and ensuring
communication channel remain open and are flowing. Obviously a PM cannot rely completely on a good
strategy or on good tactics. Displayed below on Figure 2, Slevin details the consequences of a PM not
being highly effective tacticians and strategists.
Figure 3: Strategy/Tactics Effectiveness Matrix (Slevin 1998)
It can be seen that it is important to have high effectiveness of strategy and of tactics. It is not as easy as
just understanding what strategy and tactics mean though. Managers must understand when it is more
important to focus on strategy (in the beginning of the project) and when it is important to focus more
heavily on tactics (towards the end of the project).
The question arises: If we already know that communication is essential for tactical implementation, what are
the best practices for strategy? PMs first start by knowing that they must present the goals of not only the
project but the company as a whole in order to motivate the team to reaching the optimal mix of cost,
schedule and plant operability. Project Managers today though are limited by what is considered to be
the correct practices (Gutierrez 2008). When interviewed PMs would respond with apparent
contradictions:
“[PM were] talking about the importance of planning and forecasting, while concurrently
expressing the impossibility of predicting everything. They advocated the use of objective
financial figures in evaluating ideas, the some minutes later, they argued for the necessity of
subjective judgment. One respondent stated that the existence of written routines was
imperative, then immediately explained how ideas are developed informally over coffee breaks.”
(Gutierrez 2008).
If a project is force to follow project norms they are doomed to struggle with the project until they
eventually hand it off. Another group of PMs interviewed detail something similar saying:
“Team members often feel that they barely have enough time to do what they have to do, and
never have enough time to do all that they want or should do. The sheer volume of work leaves
little discretionary time to engage in the scanning type behaviors that enable discovery and feed
into the innovation process (Cooper 2003).”
As can seen from the excerpt above there are best practices, but those best practices seem to be
broken more often than they are followed. Respondents talked about the importance of planning and
forecasting, while concurrently expressing the impossibility of predicting anything. Literature on selecting
and prioritizing ideas has models and assumptions are based on the static paradigm, rational means,
formal processes, and hierarchical decision making (Gutierrez 2008). In an age where it is part of viability
consists of tangible quantification, the static paradigm, rational means, and formal process are the
obvious choice for proving viability. Gutierrez notes that while the reality seems contradictory to the
theory that: “due to the complexity of the innovation process, there is no single approach for making
decisions or understanding innovation that is suitable for all situations (Gutierrez 2008).”
It should be noted though that despite the fact that other approaches would be more appropriate for
most circumstances, organizations display different levels of acceptance of them. This puts decision
makers in the conflictive situation of applying approaches that are sometimes appropriate but not
accepted, and other times accepted but inappropriate.
As noted above the reality is that projects are not made to follow the paradigm that is currently
accepted for proving viability. A manager must be flexible and often if not always work within the
constraints of office politics while at the same time motivating their team beyond them. The project
manager’s only hope lies within their team. They need their team to make sure they can produce a
quality product within time and cost which does not negatively impact the production plant. Often the
best way the make sure a NPD project impacts a production plant in a positive manner is to ensure the
quality of the deliverables.
Quality Management
The quality of what is delivered depends heavily on planning for and addressing possible problems before
they happen. A quality project is one that will sustain itself no matter the possible scenarios. An industry
standard for indentifying and assessing risk is through the use of Failure Mode Effects and Criticality
Analysis (FMECA) and through involving the customer early and often.
Identifying and Assessing Risk
Every project has risk and risk assessment is important to the NPD process because it helps to “flush
out the risk management actions – doing something like this ensures that actions are taken
(Szwejczewski 2008).” Risk always consists from not meeting one of the three measures of project
success. There is a risk that the project will go over budget, there is a risk that a product will take
longer than it was scheduled, and there is the risk that the implementation of the project will result in
the production loss and/or defective products. Obviously there is an infinite amount of risks. So the next
question that is asked is: Because time is finite, where do you look first?
Typically any risk that might cause the total failure of the project would be tackled first and then it is
common to then figure out which of the measures are the most important to the company and then
figure out the risks associated with a failure in one of those measures. Obviously there is uncertainty in
every process and NPD is no immune to this. Often process uncertainties such as flow rate and
temperature variations, feed quality fluctuations and equipment deteriorations, may lead to significant
disturbances to the processes, thereby degrading the operation performance (Zhao 2008).
The PMs and their team must be continuously appraising and managing all types of risk during the NPD
process itself, because what distinguishes NPD project from others is that they are characterized by a
high level of risk (Szwejczewski 2008). Szwejczewski found that companies on a whole utilize simpler
and less sophisticated techniques. These techniques rely heavily on the intuition of the leader and the
team members, it is important that the team is focused on every different aspect of the project which
further cements the need of cross-functional teams. There are many techniques for hazard identification
which totally depend on human observation (Mili 2008). Risk analysis is presented as a tool to support
decision-making. The robustness of the risk assement depends firstly on human expertise.
It is important that reliability assessment (often paired with risk assessment) is highlights the potential
problem areas so that they can be dealt at the design stage of the system life cycle (Zafiropoulous 2004).
Once possible risks are identified the next question is: how are risks assessed once they are addressed?
Found that on a whole, companies were not using advanced normative techniques discussed and were
instead utilizing simpler and less sophisticated approaches. One common approach is through FMECA.
FMECA are asked by customers but hardly employed operationally (Mili 2008). Throughout the
assessment process those involved must maintain the mindset that they are aiming to design an optimal
maintenance strategy must minimize maintenance costs and maximize equipment reliability (Mili).
Continual FMECA
An important document that a project manager should be working into team discussions of risk
assessment and control is the FMECA document. Often suppliers perform FMECA to satisfy customer
demand, but that is when the document dies, because it is not seen as mandatory to complete daily
work (Mili 2008). Often the process is just performed to satisfy customers’ mistrust, which leads to
documents only oriented towards the customer and is unusable for daily risk management and technical
decision in a “real life” manufacturing (Mili 2008). On top of the FMECA is produced separately from
integration or the design tools, which is normally to protect proprietary information. Finally FMECA
documentation is known for its unwieldiness, which is a further disincentive for continual use. This adds
to the amount of risk that is not addressed from the first day the NPD starts.
When used correctly it is found that although a FMECA was performed to satisfy a contractual
requirement, it was the insights derived from it, coupled with the interactions with the rest of the design
team, which provided the increased functionality and reliability of the end product (Frank 2005). Frank
continues saying that an essential part of the team gain insights from the FMECA lay heavily on the
shoulders of the reliability engineer on the team. He says that the reliability engineer brought to bear on
the project insights gained from thinking about how the system, including interactions with people, and
its components, might fail (Frank 2005). Obviously an important part of team is someone who
understands the whole system. The writer would like to point out that precursory knowledge of the

system is not sufficient, the insights of those deeply involved in different processes are essential to
finding the possible risks and figuring out the correct way to address them.
The power of a FMECA lies in the recognition that sometimes a frequent but small (and sometimes
easily solved) risks provides more benefit when addressed than that of an infrequent risk, which would
be more costly to fix. Mili proposes that the automation of the FMECA process greatly reduces the
cumbersomeness of the method, and productivity gains are easily made. On top of that if data retrieval
and update (discussed more in-depth later) is as automatic as possible then there is a much less risk of
data obsolescence (Mili 2008).
The project manager must keep in mind that their team is essential to correctly assessing risk. They
need to make sure they are designing for graceful degradation to combat incipient or partial failures, or
system aging. The concept is sometimes called fault tolerance or forgiveness, and includes notions that
essentially provide a margin of safety to the expected/intended operation (Frank 2005). The team is the
PM’s best tool to addressing the risks, often what is forgotten is that the customer is also an essential
part of the team. The customer is what the product is designed for, and while the customer could lie
within the company (for example the manufacturing team is often the customer of the Engineering team)
or outside (i.e. the end user) the customer is the one who ultimately decides of the product fails or not.
Customer Involvement
Quality management starts and ends with the customer. As shown in Figure 3 below, when the
customer is involved the whole process when the customer is placed in a position of control and made
part of the team, costs were contained through better decision making, which drastically reduced the
amount rework to do and controlled project scope.
Figure 4: Project Time Shortened By Customer Involvement (Bommer 2002)

Skunkworks teams (a concept developed by Lockheed Martin) are characterized by their ability to make
ad hoc decisions and by often bypassing time-consuming bureaucracy. This dedicated project team even
when presented with 3 NPD (new product development) projects and an R&D (Research and
Development) project delivered a quality product because of extensive up-front planning, leveraging
project overlaps, empowering the team, and critically analyzing customer needs (Bommer 2002).
In terms of directly applying a quality improvement program, the project manager must follow similar
methods and practices to that of the current project manager. If a quality improvement project manager
is to ensure the quality program succeeds, they are to make sure that: they address the fundamental
trade-off between current and future performance levels, they make sure that the source of
commitment to ongoing improvement effort shifts from managerial actions to employee initiative, and
that when change occurs they adapt their improvement tools and manage expectations for continued
gains (Keating 1999).
Feedback is Essential
The last step in risk analysis and quality management is implementation. The problem is that even though
continuous improvement is widely accepted quality programs often struggle to gain initial acceptance
and sustain that improvement. Scholars suggest that main reason is: that the failure to account for
feedback from these tightly coupled activities leads to unanticipated and often harmful side effects that
can cause the premature collapse and abandonment of otherwise successful improvement programs
(Keating 1999). Keating further suggest that the “employees doing a job are the best-informed experts
and should be responsible for identifying improvement opportunities and implementing changes.” It is
the feedback and the insight gained from working with the operators upfront that can aid in the
assessment of risk and the implementation of risk mitigation programs.
Knowledge Management
Data managed well is data that induces the sharing of knowledge and incorporates constant feedback.
Knowledge sharing relies on making the (even if they are not an official team) work together and
remove the idea of proprietary information as Toyota has done within their organization and with their
suppliers.
Knowledge Base and Knowledge Sharing: Following Toyota’s Example
It is important to first start with a base definition of knowledge. As defined by Toyota: compared to
information (a good example being sales figures), know-how is more likely to result in advantages that
are sustainable. Know-how is sticky, tacit, and difficult to codify and this is difficult to transfer. Thus, it
requires “thick” or dense ties with other members of the network (Dyer 2000). This sharing of know-
how is what leads to organizational learning, which in turns leads to true change and organizational
improvement. Dyer asserts that organizational learning is perhaps the key factor in achieving sustainable
competitive advantage and organizations learn by collaborating with other organizations as well as
observing and importing the practices of other organizations. A firm’s customers and suppliers were is
primary sources of innovative ideas.
The common roadblocks to implementing knowledge sharing programs are that the parties involved are
concerned with: (1) preventing “free riders”, and (2) preventing undesirable knowledge spillovers and
the requirements of effective sharing of know-how requires: (1) absorptive capacity on the part of the

receiving firm, (2) the appropriate process to make the transfer happen, and (3) incentives for
knowledge sharing (transferring firm) and knowledge acquisition (receiving firm) (Dyer 2000).
Toyota addresses these within and outside their organization in a few different ways. Toyota first solves
the issue of “free riders” and the worry of knowledge spillover by “eliminating the notion that there is
“proprietary knowledge” within certain knowledge domains (Dyer 2000).” Because of Toyota’s market
strength, they can essentially make their own rules; Toyota is able to dictate cooperation between their
suppliers.
In response to the sharing of knowledge requirement, Toyota addresses the situation as a long term
investment. They are known for the quality of their product and because of that they are sought after.
For their suppliers, Toyota does not charge fees for its assistance but does demand that participating
suppliers be willing to let Toyota bring other companies to see their operations when the project is
completed. On top of that, Toyota does not ask for immediate price decreases or a portion of the
savings from the improvements (Dyer 2000). Toyota is generous in offering assistance, but they also
expect results. It is the desire of Toyota to improve the quality of their product, which is why they are
willing to invest into their suppliers to ensure that their suppliers can meet their quality requirements.
Toyota is known to have at least two different suppliers for the product they want, and detailed below
in Figure 4 the natural progression of knowledge sharing that Toyota desires. They do not need to be
only place where knowledge can be gained. They know that if their suppliers talk with each other than
they will learn from each other, and in turn produce a higher quality product.
Figure 4: Mature Knowledge Sharing (Dyer 2000)
In summary Toyota is effective at creating and effective knowledge sharing network because it: (1)
creates organizational units with the explicit responsibility to accumulate, store, and diffuse relevant
knowledge within the network, (2) creates “rules” or norms for participation in the network which
essentially eliminates the free rider problem, (3) creates a ranges of processes and nested networks
within the full network to facilitate the effective transfer of both explicit and tacit knowledge, and (4)
creates incentives for knowledge acquisition and application (Dyer 2000). Toyota is known
internationally because it is able to gain and disseminate know-how efficiently and effectively throughout
the suppliers in their industry. They have make quality control everyone’s problem and they ensure that
quality in gained through appropriate sharing of knowledge.
Live Data Update

As suggested above in the discussion about FMECA, a continually updating situation is the best for the
organization, as Mili states that: “A regular FMECA database update, by maintenance events allows for
enhanced knowledge about in line risks in the workshop.” Displayed graphically in Figure 5 is the
process for data updating and feedback. It should be noted that it is a never-ending loop. The continuous
feedbacks from various sections together with an agreement on detailed methods of construction with
all parties involved and preparation of a project quality plan would automatically put all parties on a
more responsive position that enhances coordination (Jha 2006).
Figure 5: Update Loop for Risk Analysis (Mili 2008)
Tools have the potential to reduce uncertainty and NPD risk. Typically the problems with information
systems are that they: exhibit cross-platform incompatibility, non-standard output formats, steep
learning curves, and high initial investment and maintenance costs. All of these are hurdles to
implementing a more open and accessible data management system (Cooper 2003).
Cooper warns PMs desiring to quickly see the results of database implementation saying: “Leaders need
to appreciate that the knowledge acquisition and development process must gradually and iteratively
lead to risk reduction, despite the inherent unpredictability, if the NPD process is to succeed. It is not
simply networking people, as in collaborative tools. Moreover, NPD participants are overwhelmed so
that proactive search and retrieval is unlikely (Cooper 2003).”
While Data management, especially through the use of a database has the potential to positively impact
every aspect of project implementation, including quality management, it is essential that project
managers enter into knowledge sharing endeavors knowing that even if knowledge gained is immediate,
it the knowledge utilized that ultimately makes knowledge useful.
PQP in Practice: Skunkworks The most visible representation of a PQP utilized comes from Lockheed Martin with their Skunkworks
team. Skunkworks teams (a concept developed by Lockheed Martin) are characterized by their ability to

make ad hoc decisions and by often bypassing time-consuming bureaucracy (Bommer 2002). A prime
example, which was examined through literature tells of a time when the Skunkworks team even when
presented with 3 NPD (new product development) projects and an R&D (Research and Development)
project delivered a quality product because of extensive up-front planning, leveraging project overlaps,
empowering the team, and critically analyzing customer needs (Bommer 2002). When Boomer broke
down the essential parts that made the Skunkworks team successful he said: “The skunkworks project
management team was able to deliver the projects on time and within budget by: (1) adhering to a clear
focus on their mission; (2) including extensive up-front planning efforts; (3) critically analyzing customer
needs; (4) leveraging project overlaps; (5) involving supplier early; (6) empowering the team; and (7)
breaking rules (Bommer 2002).”
It is easy to compare the metrics of a successfully managed project detailed earlier and see that those
are the very same reasons why the Skunkworks team was successful. To some degree, a successful PM
has to have the ability to orchestrate, foster, nurture, and develop the relationships of several diverse
groups, while at the same time being able to plan for the project gates and address future risks.
Assessing Economic Viability Proving economic viability of a project is essential to project implementation. The question of how to
detail project saving for a product that didn’t exist beforehand arises. Bauer suggests that the correct
way to present economic viability is through the use of improvement of profit factors, and the reduction
of cost factors. The profit factors suggested are (Bauer 2007):
• Throughput increase
• Process stability improvement
• Energy consumption reduction
• Increased yield of more valuable products
o Reduction of Variability (Zhao 2008)
• Downtime reduction, and less waste (better use of raw materials)
The cost factors include the cost of (Bauer 2007):
• Software upgrade (data management)
• Manpower cost, control hardware
• Production loss due to installation downtime
• Implementation Cost
Often the link between quality improvement (often hard to define) and throughput (often used as a
performance metric) is displayed on the graph below. It is this link that begins to display the effect that a
PQP has on economic viability. When a project is managed correctly and the metrics are defined and
known, there is often a reduction in the production downtime. Figure 6 below is the common argument
for a holistic PQP. The argument is that it must address the quality of the needs of the future because
that in turn will produce greater throughput due to less maintenance.

Figure 5: The Relationship between Quality and Throughput (Bauer 2007)
As discussed above project managers are in the constant battle of proving economic viability according
to metrics that are not directly applicable to the project at hand, but the best that can be done is
present a plan that will reduce the cost, while at the same time increase the quality of the current
product.
After compiling the best practices from each of the different schools of through, the researcher
constructed a few simple steps and tools which Company A could use to develop their own PQP. Those
steps and discussion of tools are detailed within the next section.
Design of Solution The engineering method that was followed in order to come to an acceptable solution is called DMAIC.
DMAIC is an acronym that stands for Define, Measure, Analyze, Improve, and Control. The following
sections reflect the use of that method.
Define
In order to design the most versatile PQP the user must understand the goal of a PQP, to eliminate
waste and severely reduce failure.
The question arises: “What is considered a failure?” After investigating the Standish Group’s many
definitions it was decided that at the most base level a failure is when the project does not meet the
intended goals and requirements of the project. More specifically, it was decided that if the project was
either: abandoned, delivered and never used, late, over budget, or completed with less than the required
functions than the project as a whole can be considered a failure. It is important to understand the
definition of a failure because it allows future project managers plan ways of addressing the five failures
described above.
Furthermore, after first understanding what a failure will look like the next step is to understand what
the impacts of project failure are. The three main impacts to the company are: the loss of strategic
opportunity, the increased financial costs, and the extended use of limited resources. In this case,
Company A experienced all three of these main impacts. Company A ended up hiring on temporary
work in order to crash the rest of the project timeline and ensure they finished the project within a
year. Interviewing the employees involved in tool installations led the understanding that the acceptable
tool release to manufacturing was just over 3 months. By hiring on temporary work force Company A
relinquished the strategic benefit of installing that tool, as well as missing the opportunity to use the
temporary workforce to become involved in cost savings or other value added processes.
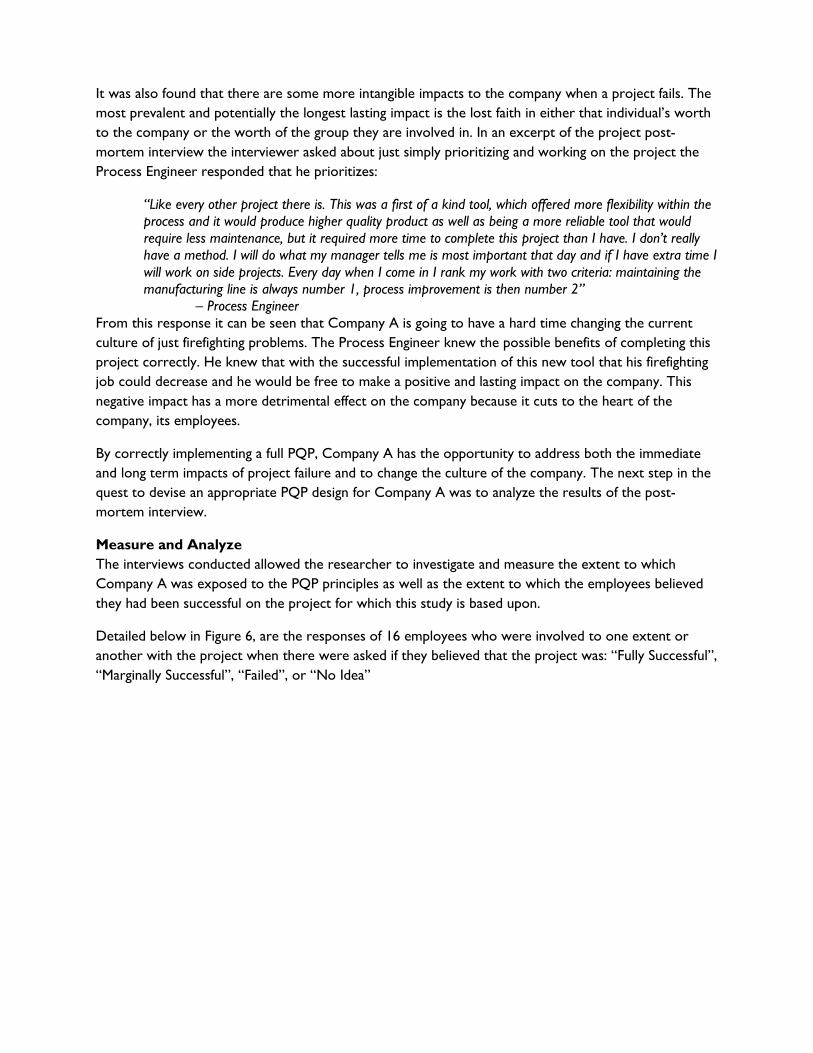
It was also found that there are some more intangible impacts to the company when a project fails. The
most prevalent and potentially the longest lasting impact is the lost faith in either that individual’s worth
to the company or the worth of the group they are involved in. In an excerpt of the project post-
mortem interview the interviewer asked about just simply prioritizing and working on the project the
Process Engineer responded that he prioritizes:
“Like every other project there is. This was a first of a kind tool, which offered more flexibility within the process and it would produce higher quality product as well as being a more reliable tool that would require less maintenance, but it required more time to complete this project than I have. I don’t really have a method. I will do what my manager tells me is most important that day and if I have extra time I will work on side projects. Every day when I come in I rank my work with two criteria: maintaining the manufacturing line is always number 1, process improvement is then number 2”
– Process Engineer From this response it can be seen that Company A is going to have a hard time changing the current
culture of just firefighting problems. The Process Engineer knew the possible benefits of completing this
project correctly. He knew that with the successful implementation of this new tool that his firefighting
job could decrease and he would be free to make a positive and lasting impact on the company. This
negative impact has a more detrimental effect on the company because it cuts to the heart of the
company, its employees.
By correctly implementing a full PQP, Company A has the opportunity to address both the immediate
and long term impacts of project failure and to change the culture of the company. The next step in the
quest to devise an appropriate PQP design for Company A was to analyze the results of the post-
mortem interview.
Measure and Analyze
The interviews conducted allowed the researcher to investigate and measure the extent to which
Company A was exposed to the PQP principles as well as the extent to which the employees believed
they had been successful on the project for which this study is based upon.
Detailed below in Figure 6, are the responses of 16 employees who were involved to one extent or
another with the project when there were asked if they believed that the project was: “Fully Successful”,
“Marginally Successful”, “Failed”, or “No Idea”

Figure 6: Employee Analysis of Project Success
From Figure 6 alone, one can derive many conclusions. First of all it is important to note that not one
person of this wide ranging sample believed this project was fully successful. When one compares the
survey choices to that of the definition of project failure applies to all but the “Fully Successful” choice.
Furthermore it is important to note that the responses are not consistent. Upon analysis of the follow
up questions it can be seen that this discrepancy is due to the lack of communication between the
different groups as well as the lack of communication within the individual groups. This can also been
seen with the group that responded that they had no idea of the relative success of the project. The
interview with the Facilities/Supplier Manager was particularly revealing because is distinctly details the
divisions that exist between different groups at Company A. The Facilities/Supplier Manager was only
concerned that the tool went in, but had no idea how the release to manufacturing ended up going.
Furthermore this manager was able to detail the project management tools she used but her
information was not fully shared across the company. The Process Engineer remembered that they as a
team were just told when the tool was ready to be tested.
The interview that detailed the largest disconnect between organizational groups was the interview with
the manufacturing manager. The word distrust was used to describe the relationship now between
manufacturing and engineering. On top of that he expressed frustration that his group wasn’t even
involved upfront with the purchasing decision. The relationship between Engineering and Manufacturing
needs to be strong by necessity. Both groups need cooperation with each other in order to make
positive changes as well as make lasting changes. Both play a crucial role in improving every company
process, because the engineer’s expertise and knowledge is useless and ineffectual if s/he is applying their
insight and time to a problem that is irrelevant to the work at hand.
The full list of questions and the responses are located in Appendix C.
Improve
The accumulation of the observations while working on qualifying the tool, the post-mortem interview
and the research into PM, QM and KM has lead to a PQP that will adequately address the current and
future project needs of Company A, the list of the best practice for PM, QM and KM are located in
0
2
4
6
8
10
12
14
Fully Successful Marginally
sucessful
Failed No Idea
Re
spo
nse
Project Opinion
Project Success Review

Appendix F. The main facets of a PQP can be described as a plan that addresses needs in three time
periods. First it serves as framework for the
project prepping, and then it gives direction
to complete the project in time and within
budget, and finally it leaves a legacy for
future projects to call upon in order to
reduce redundant errors. A visual of how
project management, knowledge
management and quality management work
together to become a PQP is displayed in
Figure 7.
For Company A it is recommended that they
implement a three pronged PQP, in which
customer needs are addressed, knowledge
bases are implemented and continually
updated, and the project is managed by a
visible and organized leader. The first step is
to correctly identify the customer. The chart
below is a useful tool for figuring out no
matter the project that is being worked on.
This is especially important for the Engineering teams to realize that more often than not their
immediate customer is manufacturing. This should shape the engineer’s new tool purchasing decisions as
well as guide the other projects that they undertake. This intimate knowledge shapes the use tools like
FMEA to reflect and address the needs of the customer. Understanding the customer is the first step to
a strong PQP. Understanding the customer allows the project manager to accurately construct first a
vision statement and then goals, a requirements document, and a project timeline or Gantt chart.
Table 1: Identify the Customer
Equipment
Engineers
Process
Engineers Manufacturing
Equipment
Vendor Facilities
Control
Engineers Operations
Equipment
Engineers --- Supplier Supplier Customer Customer N/A Supplier
Process
Engineers Customer --- Supplier Customer Customer Customer Supplier
Manufacturing Customer Customer --- N/A N/A Customer Customer
Equipment
Vendor Supplier Supplier N/A --- Supplier N/A N/A
Facilities Supplier Supplier N/A Customer --- N/A N/A
Control
Engineers N/A Supplier Supplier N/A N/A --- Supplier
Operations Customer Customer Supplier N/A N/A Customer ---
Knowledge Management
Quality Management
Project Management
Figure 7: Elements of PQP

Once the needs of the customer is understood fully the next step is for the project manager is to design
a Gantt chart. A Gantt chart is an effective way to depict how tasks are related to each other. This is
useful because it allows the manager to allocate resources efficiently and get a complete picture of which
tasks are essential and which ones can be pushed back if they need to. Because it is useful to have the
continually updated Gantt chart updated and tasks for each employee visible it is recommended that
project managers use project management software that is viewable and editable online.
After extensive research and testing it was decided that Plandora (http://www.plandora.org/) is the
program which would address the needs of Company A. Because cost of implementation has been often
used as reason for not using project management software, research was direct toward free software.
Plandora stands out against free software as well as the software that cost money because it is intuitive,
it has a lot of features, it is web based as well as open source. On top of all of that, the information
about the projects (task, risks, issues, lesson learned, etc) are automatically indexed and can be searched
through a 'google-like' GUI, consolidating a knowledge base of all projects in a collaborative way and
with common sharing. This knowledge base serves as a quick and easy way for the project manager to
wrap up a project.
The project wrap up is as equally important to maintaining successful projects as understanding the
customer and planning scheduling. A final wrap up for a project gives the employees involved closure
and allows them to be proud of the hard work they put into it. It also gives the team a chance to
document the lessons learned and reduce the likelihood of repeating that error. It is also recommended
that this knowledge base is located where everybody within the company can access it. Commonly in an
academic setting Dropbox (http://www.dropbox.com/) is used as the central meeting place, but due to
security concerns it is recommended to use either Lotus Notes Database or an in-house web
application where security can be maintained.
The PQP addresses the needs of any project by being involved at every part of the project life cycle.
This full involvement will lead to consistent project success due to the fact that it induces an open and
learning culture within the company. The PQP has been very easy to sell to Company A initially. It has
been presented, accurately, as a change that will cost Company A nothing. It is important to note, as
was explained to Company A that every change needs to be sustained to ensure positive results.
Control
The control aspect of the DMAIC process is arguably the most important of the whole design process.
This element really is the defining characteristic that determines whether the recommendations will be a
flash in the pan or if they will be a long lasting and impactful change.
The method that had been popularized by Toyota for making lasting change starts with the employees.
Toyota knows and has proven that to make a lasting change, the change must come from those forced
to make the change.
In this case, the largest and most impactful is to ensure the necessary business units are involved from
the beginning instead of when it seems they are needed. This is especially important in light of the
customer chart (Table 1) because once the customer is involved from design the design flaws can be
caught upfront instead of having to wait for corrections to happen to the final product. While seemingly
the easiest change for a company is within the control element it cannot be stressed enough that until
the change is lasting employees will continue to slip into their old ways and projects will continually to
only be “Marginally Successful.” Project will continue to be more than budgeted for, later, and not
completely fulfilling customer requirements unless sustainable changes are made.
Methodology The real power of the PQP lies within the fact that it is focused on long term change. The change of
company culture to preparedness and transparency are the reason for the PQP tools. These tools and
software programs make the change easier but to actually assess how successful the PQP
implementation at Company A was one will need to investigate the projects that the Process Engineers
take on for the next five years. The testing and assessment of the PQP proposal will have to be done
through periodical interview of the team members involved. Continual documentation will be done to
assess how Company A is allowing the new methods of the PQP to germinate and grow into methods
that are truly specialized to their needs.
At the start of April 2011, Company A began the process of the installing, qualifying and release to
manufacturing process of two new CMP tools. As of May 27, 2011 the tool is a week away from being
handed off to the Process Engineers. This is the first stage of analyzing their PQP.
Results As mentioned in the Methodology section, it is virtually impossible to analyze how effective PQP has
been over a short time span. What can be assessed though is how the users feel about implementing
and how excited they are to interact with these new ideas. A recent check up with the Process Engineer
involved shows that the PQP culture is starting to be taken seriously.
“We are much more prepared this time, and using Gantt charts has made this project easier to
convince people that certain work takes precedence.” – Process Engineer
One can see that the first benefit of a PQP has been derived by the Process Engineer, he understands
(and can explain to others) the way a project must fit together to be completed successfully. The
Process Engineering Manager, the previous Project Manager, was also able to speak to another tool.
“The FMEA is great for addressing problems we have habitually had.”- Process Engineering
Manager
Both of these responses are very encouraging. They both speak to the team members of the project
utilizing tools that they have been given and finding uses for them. These positive interactions will lead
to further interaction with the tools until expert status is reached and they can in turn teach their fellow
team members and widen the strength and influence of the PQP.
The results as a whole have been better than expected. In a large company often there is often a larger
resistance to change. It is believed that the previous project’s limited success played a larger part into
the team’s willingness to try something new. Furthermore due to the offer of something for free (the
tools that were given initially) the team was also willing to give PQP in the very least a small chance. If
given the chance to revise the initial implementation of a PQP, a more effective way to convey and
encourage implementation would have been through a daylong seminar and workshop, instead of an
hour PowerPoint presentation. Due to the current time constraints this would have been nearly

impossible. Furthermore, a full hour together to present the tools and goals and in turn for the
participants to ask questions obviously made an impact. As can be seen from the comments from the
engineer and the manager the tools are proving to be useful, and therefore have a great likelihood to
continue to be used.
At the end of the day, a PQP demands a change in culture in the CMP department. This will always be
the greatest limitation of a PQP and any sustainable change for that matter. The hardest thing about
qualifying the results of PQP implementation will be ensuring that the teams continue to use the tools
and ideas they learned about and then have the patience to observe for the next few years.
Based on results and knowledge and experience at Company A, it is believed that they will struggle to
implement and in turn fail to utilize a PQP without a strong and charismatic leader. Without that leader
and a strong backing from upper management, project success will continue to be intermittent.
Furthermore, the tools will only become truly useful when the entire team buys into the idea that
culture needs to change. The PQP has the ability to radically change any company, especially Company
A, but the seeds to transparency and willingness to try must be present with the team members.
Conclusion Every object listed in the introduction has been completed. The past CMP project at Company A was
assessed through the lens of project success using the simple criteria of: was the project completed on
time, within budget and did the project satisfy the customer’s requirements. The past project failed all of
these requirements. This failure led to the construction of a Project Quality Plan, and the initial steps of
full implementation being put into motion at Company A. Companies in every industry are in desperate
need on a strong PQP. Every sector of every industry is continuing to have large, more expensive
projects that are expected to be completed sooner and sooner. It is essential that companies
understand that project management no longer only pertains to managing the project during
implementation but that project management must be combined with knowledge management, as well as
quality management. It is with this combination that companies will become more transparent and
knowledge will be easily gained throughout the company. This connectedness will allow projects to finish
quicker and a fraction of the cost. Further studies would include conducting as a long term study of
Company A as well as other semiconductor companies. This will provide even more insight to the
possible effects of a PQP.
To ensure consistent and continual project success there needs to be a change in the culture of
Company A to one that fully embraces and embodies the principles of PQP. By applying PM, KM, QM
tools and methods project success can become a reality. For Company A, areas of focus for new tool
deployments should be: Assigning a PM and setting the expectation of utilizing the tools discussed
previously as well as the expectation of involving the entire team through and open and easily viewable
project schedule and deadlines. Finally this charismatic Project Manager needs to focus on created a
culture that can fully utilize the many tools that have been gained. Project success is possible, but one
successful project is not enough.

Appendix A: Cost Analysis
Appendix A: Cost Analysis

Appendix B: Table of Project Management Software
Figure 8: Full Analysis of Project Management Software
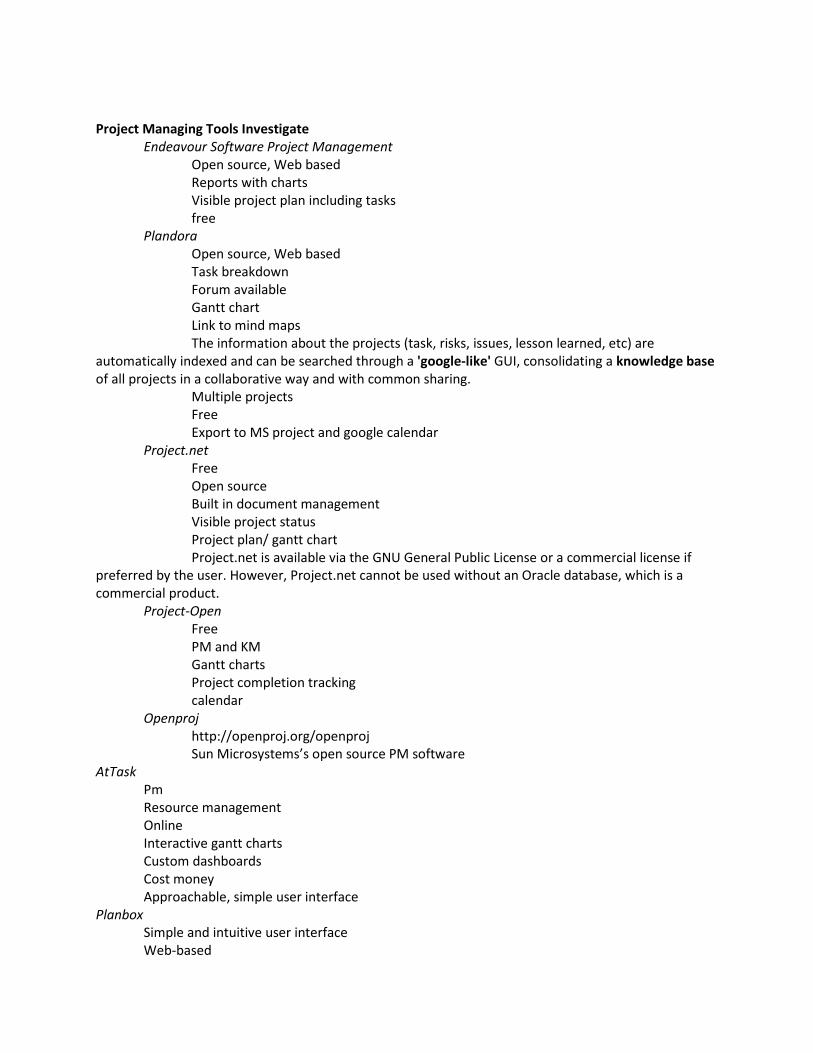
Project Managing Tools Investigate
Endeavour Software Project Management
Open source, Web based
Reports with charts
Visible project plan including tasks
free
Plandora
Open source, Web based
Task breakdown
Forum available
Gantt chart
Link to mind maps
The information about the projects (task, risks, issues, lesson learned, etc) are
automatically indexed and can be searched through a 'google-like' GUI, consolidating a knowledge base
of all projects in a collaborative way and with common sharing.
Multiple projects
Free
Export to MS project and google calendar
Project.net
Free
Open source
Built in document management
Visible project status
Project plan/ gantt chart
Project.net is available via the GNU General Public License or a commercial license if
preferred by the user. However, Project.net cannot be used without an Oracle database, which is a
commercial product.
Project-Open
Free
PM and KM
Gantt charts
Project completion tracking
calendar
Openproj
http://openproj.org/openproj
Sun Microsystems’s open source PM software
AtTask
Pm
Resource management
Online
Interactive gantt charts
Custom dashboards
Cost money
Approachable, simple user interface
Planbox
Simple and intuitive user interface
Web-based

Free for 2 users- up to $200/month (50 users) but is $40/month for 10 users
Based on SCRUM and Agile
Project Planning Tools
Mind Manager Mind Jet
http://www.mindjet.com/
-Cost $349 per machine
Has Gantt chart capability
Intuitive interface
Integrates with MS Office and Adobe products
Map out resource assignments and dependencies
Time line (through MS PowerPoint or MS Visio)
Comes with MS Office Suite
Visually presents schedule
-doesn’t necessary show relationships between other tasks
-doesn’t show resources required
Project Documentation and Collaboration
Dropbox
https://www.dropbox.com/
Basic: Free- 2GB
Pro50: $10.00/month, 50GB
Pro100: $20.00/month, 100GB
Updates automatically, apps for phones etc
All transmission of file data occurs over an encrypted channel (SSL)
All files stored on Dropbox are encrypted (AES-256)
MS Sharepoint
http://sharepoint.microsoft.com/en-us/Pages/default.aspx
Costs money
Lotus Notes Database
Currently possible to have

Appendix C: Interview Data
This interview was conducted to serve as a post-mortem project analysis. It was conduct in order to
figure out the perception of the project throughout the entire lifecycle. Due to availability constraints
the entire team was not interviewed. The questions have been personalized to each team member’s
involvement in the project, and their answers have been paraphrased and highlighted in red. Due to
privacy concerns the team member’s names have been replaced with their job title at the time of the
project completion.
Feb 6th, 2011
Interview Questions and Answers
“This is for my senior project. I’m doing an analysis of projects for installing new complex tools and I
would appreciate if you could answer a few questions I have about the Company A’s most recent CMP
tool project. I have tried to tailor some questions to what I believe are specific parts of the project. I will
be brief and to the point. Thank you for volunteering your time.”
Process Engineer 1 1. Who assigned the project to you?
Process Engineering Manager
a. How was the project presented to you?
Just told it had to be ready,
2. How did you prioritize this project?
“Like every other project there is. This was a first of a kind tool, which offered more flexibility,
but it required more time to complete this project that I have. I don’t really have a method. Every
day when I come in I rank my work with two criteria: maintaining the manufacturing line is always
number 1, process improvement is then number 2”
3. What were your initial responsibilities?
Metrology Tool Installation, APC integration
a. What did your responsibilities end up being?
Metrology Tool installation and integration, APC integration, bridge for Development
and the Process Engineers
4. What was the strategic benefit of installing these tools?
Technology, better uniformity control, “produce better”, new chemistry (new slurrys)
5. What are the specific skills that you brought (or could have brought) to the project team?
Knowledge of metrology, talking with APC
6. What part of the tool qualification were your involved in?
No process,
a. What metrics did you use to qualify the tool?
Speed, reproducibility,
7. Are there acceptance documents that you have to adhere to?
Industry standard
a. Who was the original author? Where they appropriate? What was missing?
Metrology Manufacturer, slight modifications, all
8. What were the tools used to manage this project?
a. Gantt Chart, Work Breakdown structure, risk analysis, War room, Identification of the
Key Stakeholders, Quality Criteria, Project manager, Project phase definitions, project
scorecard, critical path analysis
Had Log sheet, standardized to previous CMP tool manufacturer

9. Did anyone understand the economic impact associated with project delays?
No dollar amount associated with project delay. I was just told that it would be bad.
10. How do you think this project went?
Path finding mission, now have template (now strategy, config files, process)
a. What in your opinion would have made it more successful?
Better project management, id risk,
Overall
Original misgivings?
No idea what we were doing,
Risks now?
Hope to copy everything across.
Teams?
2:00 meeting daily, every couple weeks- tool status review,
Process Engineering Manager
1. Was there a single project manager responsible for all aspects of the project?
Previous was Development Engineering Mananger, because when I came the tool was already
installed,
It started with him, but he was not responsible for installation. I took over once the tool was
accepted. At that point I was responsible to put it into production
a. Who was that person? Development Engineering Mananger (start with), It became the
Process Engineering Manager’s tool over after tool accepted
b. Was this project best characterized by a bunch of little projects and therefore many
project managers?
2. What was the strategic benefit of these tools?
Build more and more advanced devices, previous CMP tool technology was old, and often
break down. The new tool enable us to increase uniformity, target control, end point control
was never used for the Old CMP tool. Higher throughput
a. Was the project aligned with the company’s strategic goals?
In terms of general strategic goals, yes. The life time is about a year. Better product is more
important. You either advance or you are left behind. This industry is more brutal than
semiconductor.
i. Was everyone on board with the purchase decision? How were differences
resolved?
Yes, they were all on board, but.. not all Engineers have equal exposure to the
new tool.
b. How did you create buy-in within your team? No conflict
People understand that the tool has a limited capacity. The goal for the whole team is to
improve the whole CMP area
3. How did you prioritize this project?
Manufacturing most important,
One of the important projects to work on
First priority is always to support mfg,
Meet technology requirement, the new product release has high priority
In terms of priority, it changed within the team
4. How much did the development team collaborate with manufacturing/ engineering team in
regards to specifying the tool requirements?

5. Are there acceptance documents that you have to adhere to?
a. Who was the original author? Where they appropriate? What was missing?
6. What were the tools used to manage this project?
a. Gantt Chart (Process Engineer 1 made one), Work Breakdown structure (yes, for
example we need the equipment people to put it in the equipment server. We had a
pretty good idea these things had to be done, because of Control Engineer on the APC
team. We did not do a good job predicting how long. A lot of times a different priority
will change and take you away), risk analysis (single path tool, came up with a non ideal
back up plan if New CMP tool is down. Did not do one for if not done on time), War
room, Identification of the Key Stakeholders, Quality Criteria, Project manager, Project
phase definitions, project scorecard (no, you know what, this environment is so busy,
before we are even done we are on new projects, it is very hard to stop and think of a
summary, it is very difficult), critical path analysis (for us the major critical path, it must
be in the system, the wafer processing must be in the system, to do wafer testing it does
not need to be in the system)
Spreadsheet, I do not have MS project. Yes I think Process Engineer 1 made a nice Gantt
chart. But it was modified many times because our initial understanding of the work was not
sufficient.
7. Was an economic analysis done in order to understand the cost per day/week/month late of
completion of the project? No, in this case, we did not do that. Because I know that in a big
project in a big organization, but here as a process engineering I do not have access to. I tried to
do a similar thing for another item, and no one could tell. It is very hard when you are cut to the
bone.
a. Did anyone understand the economic impact associated with project delays?
i. Could that have used to motivate your team?
8. How do you think this project went? Passing score, I would say. We learned a lot. There were a
lot of factors. Members of the project team should also do the same. A lot of the time do not
have commitment for members from other teams. A lot of time do not have control of our
resources
a. What in your opinion would have made it more successful?
Commitment from all the team members. They have to listen to you. Cross functional
team.
Development Engineer
1. How did you prioritize this project?
2. What were your initial responsibilities?
a. What did your responsibilities end up being?
i. What specific requirements did you need to meet?
1. How did those requirements change over the course of the project?
3. Who was in charge of the installation and qualification of the Tool Vendor tools?
4. What part of the tool qualification were your involved in?
a. What metrics did you use to qualify the tool?
5. What metrics were used to select the Tool Vendor?
6. How much did the development team collaborate with manufacturing/ engineering team in
regards to specifying the tool requirements?
7. Are there acceptance documents that you have to adhere to?
a. Who was the original author? Where they appropriate? What was missing?
8. What were the tools used to manage this project?

a. Gantt Chart, Work Breakdown structure, risk analysis, War room, Identification of the
Key Stakeholders, Quality Criteria, Project manager, Project phase definitions, project
scorecard, critical path analysis
9. Did you understand the economic impact associated with project delays?
10. How do you think this project went?
a. What in your opinion would have made it more successful?
Control Engineer II(A)/ Control Engineer I (S) 1. What was the strategic benefit of installing these tools? Better control (great uniformity),
required for damescene process,
S: I think they have better control compared to Old CMP tool tools
A: they were required for the damescene process, they couldn’t do that on the old tools. There was
also a uniformity improvement, built in endpoint detection
2. How did you prioritize this project? Told behind and this was key tool, ranked high, prioritize by
what is important, dvp came first to APC,
A: I guess for us, because we were being told that we were behind on Dam, we ranked it high on a
technology. We try to rank based on cycle time reduction, tech, or yield, and if it is one or more of
those t
Interviewer: Was it Process Engineering Manager or Control Engineering Manager who came to
you?
A: actually I think it was the development engineer in the beginning. We worked with them early on.
Once the tool was installed, the contact point switch.
3. What were your initial responsibilities?
Get APC on tool
A: it was just an APC responsibility. I will work early on getting people to understand gem
capability, set up a schedule, make sure people have the funding, maybe work with the facilities
S: strategy
a. What did your responsibilities end up being? Education and pull information from
everyone.
A: they tend to just know that it is required. A lot of time they don’t understand what a
strategy is.
Interviewer: so would you say that because a lot of engineers do not fully understand
APC and its capabilities part of your responsibilities end up being education of the
engineers
S: yes because eventually they have to own the process
A: and it depends on the team that you are working with, and in this case the engineers
were pretty new and there was a fairly big mix of people. So Control Engineer probably
had a different role, because he has to teach as well as pull together different ideas. So I
think that is an example where a project manager would have been useful.
i. What specific requirements did you need to meet?
1. How did those requirements change over the course of the project?
4. What are the specific skills that you brought (or could have brought) to the project team?
S: Knowledge of APC (DOE, gem, WORKS, ARTIST, statistical analysis, software testing, level of
project management)
A: Did you do any data analysis for them?
S: yes I did
A: Software testing skills, ummm some level of project management for our part of it. Nothing
really for the tool side except for the installation of the host computer

5. Who was in charge of this project? Vague, (initially Development Engineering Manager, and
worked with the purchase of the tool project. He tried to bring in people from different
organizations when assessing the tool. no hand off seen, it was just groups doing what they
knew needed to be done),
A: There was not a single gantt chart that I ever saw that had all of the APC stuff, the production,
release to manufacturing, etc.
for apc: Control Engineer II until final set up for strategy then it was Control Engineer.
6. What were the tools used to manage this project?
a. Gantt Chart (we have own that we generated and worked with our supplier, because
software is done with external supplier) Project Plan (A: I originally sent a project plan to
Development Engineering Manager. I don’t think that we every got a release date from
the process engineers A: wasn’t some of that being driven by hardware too?), Work
Breakdown structure, risk analysis (not for APC either, realized after GEM testing), War
Room (A: this office. We are small enough), Identification of the Key Stakeholders,
Quality Criteria, Project manager, Project phase definitions (yea, And initially we will do
a basic critical path analysis, but this these? projects are pretty predictable. I don’t know
if I want to call this a risk analysis. We realize that we weren’t getting the polish time,
and we went back to the vendor. It was factored in and we went with it), project
scorecard, critical path analysis
7. Did you understand the economic impact associated with project delays? No,
A&S: no.
A: we just heard that for damescene that it was pretty important. It was brought to our attention
that there would be a negative economic impact if we didn’t change our processing records. There
was a lot of urgent discussions to figure out it how to address it.
8. How do you think this project went? Fairly well, could have been release sooner (for APC: went
smoothly, waiting more on recipe work, good at forcing issues to the surface, positive critic)
S: I think that it went well. In the end the process team came out with at least a knowledge of
WORKS and strategy development
a. What in your opinion would have made it more successful? More active management, a
lot of confusion, communication, no central place for info.. this is interviewer
prompting?
A: there could have been a real reduction to the cycle time if there was a project manager.
The vendor has their gantt charts, I never saw a master gantt chart
Interviewer: How do you think the APC project went?
A: we were probably waiting more on recipe works, what apc does in projects is,
Interviewer: because APC was involved in almost all aspects, it served to locate all of the holes.
A: it added a level of exposure that you would not have seen otherwise. Yea I think it’s typical, we tend
to be discovers of things.
A: we cannot get involved much earlier.
These were used tools, it probably limited what the supplier wanted to do. It was kinda overshadowing
things a bit.
Interviewer: is there anyhitnganything that would have made this project …..better?
A: there was not central place to get information on the project.
on knowledge base:
A: if there was a place where
showcase Active discussion on points
the more information you can float to the surface to more useful.
***no knowledge base, new ideas about collaboration…

Interviewer:If you can’t have a centralized project mananger would it be better to just have centralized
project work space.
A: yes, but it couldn’t be Google docs. It is necessary through because even in strategy dvp, Control
Engineer had to seek out people and pull them in.
Manufacturing Manager 1. Did anyone explain the strategic benefit of these tools for manufacturing?
Not to me at the time. Again my role has changed. Now my job would have been much more in tune
than before.
New CMP tool was pretty much already within mfg. the second tool was already here
2. Did anyone present a project plan to you?
no
a. What was going to be delivered and when?
3. Was there one person you could go to determine project status? Yes, that would be Process
Engineering Manager
a. Did you get regular updates on project status? No regular updates
4. Were manufacturing’s needs considered as part of the project deliverables? Layers, I am fighting
for it now. Ie: the New CMP tool cannot process in slot 1. It violates all our current procedures. It
is a bit of a process and it is too . exposing us to either additional scrap or additional cycle time.
Iinterviewer: what else was missed?
K: the other thing would be, what layers. The second tool inherited pretty much the same thing. We
are not single path, but our existing paths are not great. There was not a consultation with these
new tools. Originally a lot of things were not implemented with CMP METROLOGY TOOL
5. Did anyone explain manufacturing’s responsibilities for this project? No
6. How was the project managed? poorly
7. Is there an acceptance document that manufacturing provides to engineering explaining what is
needed to release a tool? (operator training, process documentation, PCN, checklists, etc.) They
have the MRR and to this day, I have not been involved in that. In my view, mfg has not been
involved early enough.
8. What is the economic impact associated with project delays? It can be huge. Yield improvement,
cycle time, since our cycle time is so long. I think its useful to consider when they are purchasing
the tool and when they are going though the installation and qual plans.
It primarily came on for new layers. We don’t see quality improvement directly.
I currently have all the vacuum side. Any of the bottlenecks, and qual issues, working with
engineering. I’m kinda the go between for mfg and engineering
9. How do you think this project went? Not well, it’s into production without slot 1 issue, again I’m
coming into it late, but I am seeing the after effects. No decisions had been made, no
presentations, it was not until the operator said something. A lot of times the operator will just
accept what engineering has to say. The fact that it got that far without being addressed
a. What in your opinion would have made it more successful? Gap in MRR (manf readiness
review), again it does not come on early enough
I don’t think from the mfg side, I don’t think there is anyone engaged hands on enough,
things like, when they are going through the MRR, they are demonstrating the quals,
and their yields. It needs to be more than a rubber stamp.
I think that the MRR process needs to reviewed. The time frame is probably not
stringent enough. People need to be more vocal in the beginning. If doc is present early
on than it can be reviewed early on.
If it goes too long, it comes to a point where you can’t stop the train.
Interviewer: With the new tools they are now installing what is changing?

K: I probably need to be more active in that process. I am not as involved as I want to
be.
10. What tools do you use to manage projects?
a. Gantt Chart, Work Breakdown structure, risk analysis (yes. Evaluates the results on
path), War Room, Identification of the Key Stakeholders, Quality Criteria, Project
manager, Project phase definitions, project scorecard, critical path analysis
Primarily here it is just done in excel. Tend to do a work breakdown of what is required for
each project.
Interviewer: do your tools ever get integrated with engineering?
K: some of it?
Interviewer: any for New CMP tool?
K: not yet. All I have seen for New CMP tool are just delivery date
Interviewer: how early would you need it to be useful?
K: ideally they have already justified the tools, so when tools are being purchased,
Interviewer: so you would prefer to be involved as soon as possible
K: the sooner the better, I don’t need tools aren’t useful to me. There might be times, where
I am like new tools are nice, but I don’t need that right now.
We are the customer. But yes if it was on the engineering side I would want to make sure
that I was in turn with my customer.
11. Who should have the responsibility of being the point person?
I think it should be the process engineer. I probably should be Process Engineering Manager. The
tools would be multiuse. Other times its black and white, CMP is not. He should be the one
coordinating with MFg, the customer.
K: the process engineers are putting out fires all the time
Everyone’s got a full plate. Its easy for something not to be have Clear communication and
Documented plans. Too many things fall though in the end.
Interviewer: but you are looking to standardize everything…
K: the expectation is that a completed professional project…
You don’t have that unless you got buy in from your customers
You don’t have that unless your procedures are clean
You just got to do your diligence and do what is expected
Facilities Manager and Supplier Manager
• What were your responsibilities for this project? I am the hitachi rep that oversees the
construction management project
• Did anyone explain the strategic benefit of installing these tools? Product , alleviate a few of the
CMP and a few of the DNS
• Was there a single project manager that you worked with that understood all aspects of the
project? (APC, release to MFG, process dvp, tool qual, DVP) There is a project manager but only
from the construction side.
• What special requirements did you have to meet related to the facilities or approvals from
external agencies (fire department, OSHA)?
• Who coordinates internal and external approvals? (customs, permits, internal equipment safety
approval) driven thru RESO
• How was the project prioritized? Delivery date
• What were the tools used to manage this project?

• Gantt Chart, Work Breakdown structure, risk analysis, War room, Identification of the
Key Stakeholders, Quality Criteria, Project manager, Project phase definitions, project
scorecard, critical path analysis
Gantt charts were used
• How do you think this project went? It went okay. Because it was the first tool we expect a few
kinks that we fix later on.
• What in your opinion would have made it more successful? Punch list,

Appendix D: FMEA
An example of an FMEA is displayed below. This tool is used to identify risks and address
before they arise.
Cher Ming Tan, Customer-focused build
An example of an FMEA is displayed below. This tool is used to identify risks and address
focused build-in reliability: a case study
An example of an FMEA is displayed below. This tool is used to identify risks and address problems

Dieter Vandeun, Wikipedia
Appendix E: Acronyms Used
PQP: Project Quality Plan
PM: Project Management/ Project Manager
QM; Quality Management
KM: Knowledge Management
NPD: New Project Development
FMECA: Failure Mode Effects and Criticality Analysis
R&D: Research and Development
APC: Advanced Process Control
SMWT: Self Managing Work Teams
MTS: Multi-team Systems
TPM: Toyota Production Method
HDD: Hard Disk Drive

Appendix F: Best Practices PM best practices
Single PM for coordination to avoid groups working without a view of the big picture
� Coordinator with big picture view
� Multidisciplinary experience
� Team leader
� Clearly defined deliverables
� Coordinator Identifies keys to success � Clear Goals � Designated Communication Channel � Team Empowerment � Active involvement in all phases � Understand Customer � Knows sponsor and how to get things done
KM best practices Common and needed by all resources Processing data, converting it into knowledge
• information that is used by more than one group
• Recipe Names, log in names and passwords for computers Giving access to the people who need it Lose less in translation Schedule in a central place – having people able to update their part -slurry information eqp and
� Use of Collaborative Media � Internal forums
� Increases corporate knowledge and memory � Converts data and experience into usable knowledge � Captures intellectual property
� Common meeting place for sharing information � Process Operation Information (Operation) � Equipment Configuration (Slurry) � Security/Access Information (Users) � Schedules and Reports � Troubleshooting guides
QM best practices
� Quality management starts and ends with the customer
� Reduction of variability
� Within product/process/project
� Identify risks upfront
� Robustness depends of expertise
� Continual risk analysis and assessment

References Bauer, Margret, and Ian Craig. "Economic Assessment of Advanced Process Control %u2013 A Survey
and Framework." Journal of Process Control 18.1 (2008): 2-18. Print.
Bommer, Michael, Renee DeLaPorte, and James Higgins. "Skunkworks Approach to Project
Management." Journal of Management in Engineering 18.1 (2002): 21-28. Print.
Bounds, G. "The Last Word on Project Management." IIE Solutions 30 (1998): 41-43. Print.
Cooper, Lynne P. "A Research Agenda to Reduce Risk in New Product Development through
Knowledge Management: a Practitioner Perspective." Journal of Engineering and Technology
Management 20.1-2 (2003): 117-40. Print.
Cooper, Robert G. "Developing New Products on Time, in Time." Research Technology Management 38.5
(1995): 49-58. Print.
Dvir, D., S. Lipovetsky, A. Shenhar, and A. Tishler. "In Search of Project Classification: a Non-universal
Approach to Project Success Factors." Research Policy 27 (1998): 915-35. Print.
Dyer, Jeffrey H., and Kentaro Nobeoka. "Creating and Managing a High-performance Knowledge-sharing
Network: the Toyota Case." Strategic Management Journal 21.3 (2000): 345-67. Print.
Frank, Michael. "View Through the Door of the SOFIA Project." IEEE Transactions on Reliability 54.1
(2005): 181-88. Print.
Gutierrez, E., G. O. Sandstrom, J. Janhanger, and S. Ritzen. "Innovation and Decision Making:
Understanding Selection and Prioritization of Develpment Projects." IEEE ICMIT (2008): 333-38.
Print.
Jha, K. N., and K. C. Iyer. "Critical Determinants of Project Coordination." International Journal of Project
Management 24.4 (2006): 314-22. Print.
Keating, Elizabeth, Rogelio Oliva, Nelson Repenning, Scott Rockart, and John Sterman. "Overcoming the
Improvement Paradox." European Management Journal 17.2 (1999): 120-34. Print.
Kim, Bowon, and Jongjoo Kim. "Structural Factors of NPD (new Prodect Development) Team of
Manufacturability." International Journal of Project Management 27 (2009): 690-702. Print.
Liker, Jeffrey K. The Toyota Way: 14 Management Principles from the World's Greatest Manufacturer. New
York: McGraw-Hill, 2004. Print.
Mili, Aymen, Samuel Bassetto, Ali Siadat, and Michel Tollenaere. "Dynamic Risk Management Unveil
Productivity Improvements." Journal of Loss Prevention in the Process Industries 22.1 (2009): 25-34.
Print.
Millikin, John P., Peter W. Hom, and Charles C. Manz. "Self-management Competencies in Self-manging
Teams: Their Impact on Multi-team System Productivity." The Leadership Quarterly 21 (2010):
687-702. Print.

Slevin, Dennis P., and Jeffrey K. Pinto. "Balancing Strategy and Tactics in Project Implementation." Sloan
Management Review 29.1 (1987): 33-41. Print.
Szwejczewski, Marek, Rick Mitchell, and Fred Lemke. "Risk Measurement and Management during New
Product Development: an Exploratory Study." International Journal of Risk Assessment and
Management 9.3 (2008): 277-87. Print.
Young, Christina, and Danny Samson. "Project Success and Project Team Management: Evidence from
Capital Projects in the Process Industries." Journal of Operations Management 26 (2008): 749-66.
Print.
Zafiropoulos, E.P., and E.N. Dialynas. "Reliability Prediction and Failure Mode Effects and Criticality
Analysis (FMECA) of Electronic Devices Using Fuzzy Logic." International Journal of Quality &
Reliability Management 22.2 (2005): 183-200. Print.
Zafracabeza, Ascension, Miguel Ridao, and Eduardo Camacho. "Using a Risk-based Approach to Project
Scheduling: A Case Illustration from Semiconductor Manufacturing." European Journal of
Operational Research 190.3 (2008): 708-23. Print.
Zhao, Chao, Yu Zhao, Hongye Su, and Biao Huang. "Economic Performance Assessment of Advanced
Process Control with LQG Benchmarking." Journal of Process Control 19 (2009): 557-69. Print.