Embed Size (px)
Citation preview

Dep
th (
Km
)
Tupi Jupiter0
5
100 Km
SaltVolcanics
Salt
Dep
th (
Km
)
10
15
OceanicCrust
ContinentalCrust
SaltVolcanics
Sag
C
ION’s BasinSPAN™ regional 2D programs feature surveys designed for the purpose of imaging the full crustal architecture. Their BrasilSPAN program is showing never before imaged sub-salt horizons and new stratigraphic and structural details of this frontier petroleum system.
new pre-salt insight
seismic section (a) is an enlarged image from one of the regional lines situated across the 2007 Tupi discovery well. The yellow line rep-resents the base of salt which is located 5 km below sea level (nearly 3 km below the ocean bottom). The well was designed to test the pre-salt Sag basin microbial res-ervoirs. An intermediate reservoir, named Coquina interval is also present in this well. The Sag interval is marked below the base of the salt in the seismic section. The interval marked “Syn-Rift” is shown as dipping beds under the Sag. Note that the faults shown in the seismic section termi-nate at the base of the Sag. The Lagoa Feia Formation source rocks are present in the Sag interval as well. The thick salt cover has effectively sealed off the generated hydro-carbons from migrating into the overlying section in this area forming large accumu-
lations under the salt. In other parts of the basin, hydrocarbons can migrate across the salt layer, in which case a dry well, might result in the pre-salt. At the same time, these hydrocarbons can be trapped above the salt layer, and have formed large ac-cumulations in other parts of Santos and Campos Basins.
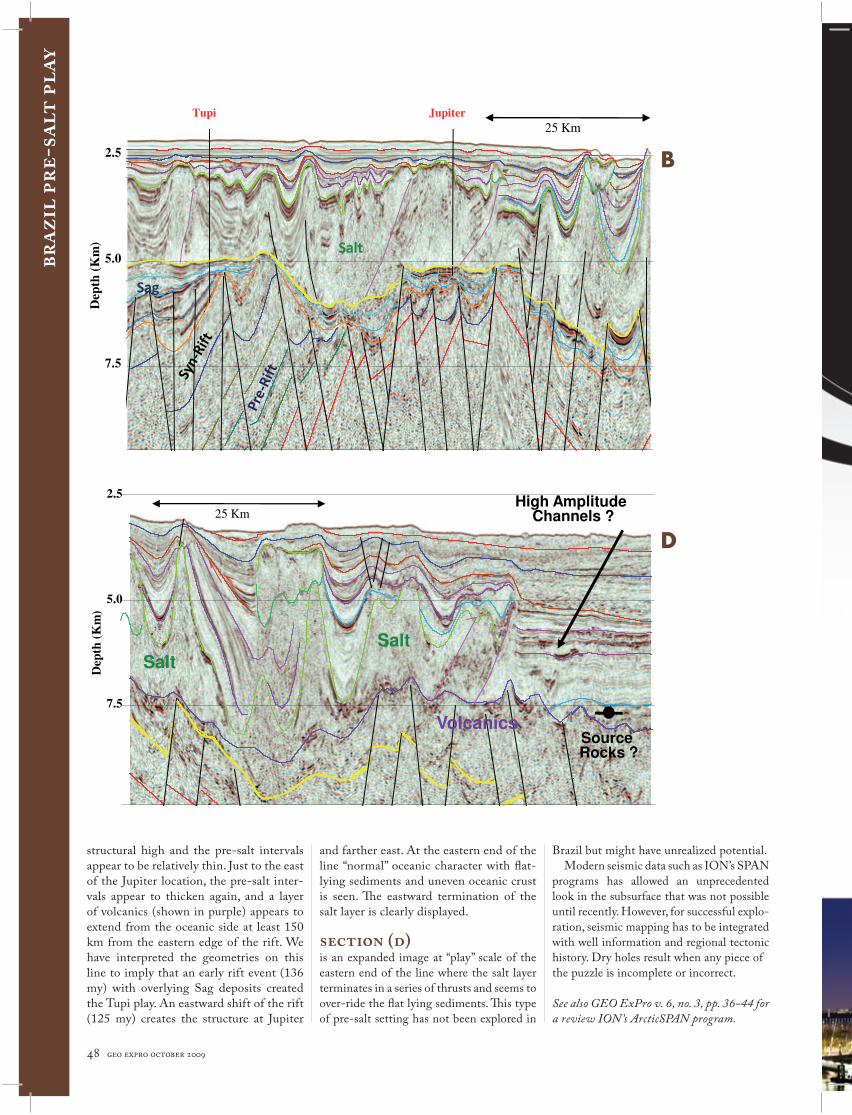
seismic section (b) is an extended view from the same seismic line as section (A). This section is approxi-mately 75 km across and shows the sub-surface sequences from a depth of 2.5 km to almost 10.0 km. It not only shows the location of the Tupi discovery, but also another discovery to the east, Jupiter. The highlighted yellow line represents the base of the salt with the top of the salt marked in green and appears as a series of diapirs across the section. Thickness of the layer
The seismic sections shown on these pages all belong to the same line. The location of the line is shown on page 44.
46 geo expro october 2009
braz
il p
re-s
alt
play
steven g. henry, rift institute for teaching and training, las cruces, nm,naresh kumar, growth oil and gas, richardson, tx, and sujata venkatraman, project manager, ion-gx technology, houston, tx

Dep
th (
Km
)
Tupi Jupiter0
5
100 Km
SaltVolcanics
Salt
Dep
th (
Km
)
10
15
OceanicCrust
ContinentalCrust
SaltVolcanics
Sag
A
ranges from 2.5 to 3.0 km. The Tupi well drilled through almost 2 km of salt before entering the target reservoir intervals. The Jupiter well, almost 30 km to the east, also drilled through approximately the same thickness of salt. The Jupiter location appears to be on a relative high and some of the faults disrupt the Sag layer, whereas, at the Tupi location, faults terminate at the base of Sag. A different tectonic history of each discovery can be implied, but the basic
setting of hydrocarbon migration from the Lago Feia source rock, and accumulation in reservoirs below salt, remain the same. Well and test information, unavailable at this time, is needed to reconstruct the detailed geologic history of each discovery.
seismic section (c) is the regional view of the same east-west line in the central Santos Basin and is more than 600 km in length. Only the
major features can be seen at the scale of this display, however the resolution of the Pre-Stacked Depth Migrated (PSDM) data, even at the regional scale, is very high. Although the line has been processed to 25 km in depth, only the uppermost 15 km are displayed. As shown on this line, thick Sag and Rift sections appear at the Tupi location and to the west. The base of the salt is relatively smooth in this segment of the line. Jupiter is on a
Dep
th (
Km
)
Tupi
5.0Salt
Dep
th (
Km
)
5 Km
Sag
6.0
7.0
geo expro october 2009 47
Dep
th (
Km
)
Tupi Jupiter
5.0
2.5
25 Km
Salt
Dep
th (
Km
)
7.5
Sag
B
25 Km
Dep
th (
Km
)
5.0
2.5
Salt
High Amplitude Channels ?
Dep
th (
Km
)
7.5
Salt
Volcanics
Salt
Source Rocks ?
D
48 geo expro october 2009
structural high and the pre-salt intervals appear to be relatively thin. Just to the east of the Jupiter location, the pre-salt inter-vals appear to thicken again, and a layer of volcanics (shown in purple) appears to extend from the oceanic side at least 150 km from the eastern edge of the rift. We have interpreted the geometries on this line to imply that an early rift event (136 my) with overlying Sag deposits created the Tupi play. An eastward shift of the rift (125 my) creates the structure at Jupiter
and farther east. At the eastern end of the line “normal” oceanic character with flat-lying sediments and uneven oceanic crust is seen. The eastward termination of the salt layer is clearly displayed.
section (d) is an expanded image at “play” scale of the eastern end of the line where the salt layer terminates in a series of thrusts and seems to over-ride the flat lying sediments. This type of pre-salt setting has not been explored in
Brazil but might have unrealized potential. Modern seismic data such as ION’s SPAN programs has allowed an unprecedented look in the subsurface that was not possible until recently. However, for successful explo-ration, seismic mapping has to be integrated with well information and regional tectonic history. Dry holes result when any piece ofthe puzzle is incomplete or incorrect.
See also GEO ExPro v. 6, no. 3, pp. 36-44 fora review ION’s ArcticSPAN program.
braz
il p
re-s
alt
play
F A R M O U T S • N E W V E N T U R E S • N E W R E G I O N S • A S S E T S W A P S
Here’s why exhibitors come to APPEX:
“I wanted to take a moment to express our gratitude for the opportunity to attend the 2009 APPEX meeting in London, England… The slower, more intimate pace of APPEX provided our personnel the ability to hold small meetings with interested parties instead of the ‘fast food meet and greet’ capped with a business card swap… The key difference in this observation can be narrowed down to one factor; the clientele. Attendees of APPEX are present of their own accord, looking for opportunity. This has made all the difference.”
— Scott Hess, GM Greensburg Oil LLC
The global forum to buy, sell and promoteinternational upstream E&P deals withkey international players.
To exhibit contact:Steph BentonConvention Sales ManagerDirect: +1 918 560 2696Email: [email protected]
To sponsor contact:Jackie Banner or Debbie [email protected]
Space is limited. Make plans today to be a part of APPEX 2010.