Embed Size (px)
Citation preview
Gulf Of Mexico Salt Tectonics – GOMSalt.com
The Seismic Response of Salt
In the Gulf of Mexico, salt is covered by and surrounded by sediments, largely clastic and largely shale. Salt is for the most part much denser and has a much higher seismic velocity than the clastic sediments. This is especially true in the shallower section close to the seafloor where the sediments are more of a slurry of particles in a fluid matrix than what we would think of as rock. Because the salt has such anomalous seismic properties, it causes severe refraction effects. Because of the very high reflection coefficients that result from the disparity in the impedance of the shales and salt, it is difficult for seismic energy to penetrate salt bodies. Interpreters in the Gulf of Mexico have to deal with these effects every day in an effort to image geology under and adjacent to salt bodies. Until the last 10 years, efforts to compensate for the distortion of the subsurface image due to the presence of salt were crude and generally unsuccessful. Interpreters could estimate the amount of structural “pullup” caused by the much higher velocity of salt bodies, either visually, or through simple mathematical corrections based on the salt thickness and average sediment velocity. Needless to say these crude corrections were less than satisfactory. They could remove some or all of the vertical distortion, but the result was by no means a true representation of the structure. Interpreters at the time were well aware of the solution to the imaging problems (depth migration of the prestack seismic time data with an accurate salt-sediment velocity model), but that seemed at the time to be an impossible task. With the advent of very powerful seismic processing computer hardware and software starting in the late 1990’s, efforts began in earnest to convert the seismic time data into a depth image which would correctly place seismic events (both vertically and areally) in the subsurface. In the roughly 10 years since these efforts began, tremendous progress has been made in imaging around and under salt. However, it has also been clear for some time that processing of the data will not, in many cases, give a usable (accurately interpretable) image in areas with salt, because of inadequate sampling of the subsurface by the acquisition geometry. Thus, the latest effort in improving imaging has concentrated on recovering as many raypaths from as many azimuths and offsets as possible in order to illuminate as much of the subsurface as possible. The nature of the geologic problem has frustrated all of these efforts in some cases, but there is now a substantial portion of the salt distorted subsurface of the Gulf of Mexico which is adequately imaged. In 2009, migration algorithms which have no dip limitations (Reverse Time Migration) and which take into account Tilted Tranverse Anisotropy (TTM) are being applied to Wide Azimuth acquisition datasets, with often spectacular results.
The remaining areas of poor image are the result of salt-sediment geometries which make it impossible to get seismic reflections back to the recording array using any kind of a normal acquisition setup. These areas will require tailored, exotic, acquisition geometries which will be designed based on extensive forward modeling studies. In this section we will examine the seismic response of salt for simple models which hopefully will give the reader some insight into the difficulties posed by imaging in salt-sediment systems.
Reflection Coefficients for Salt-Sediment Systems
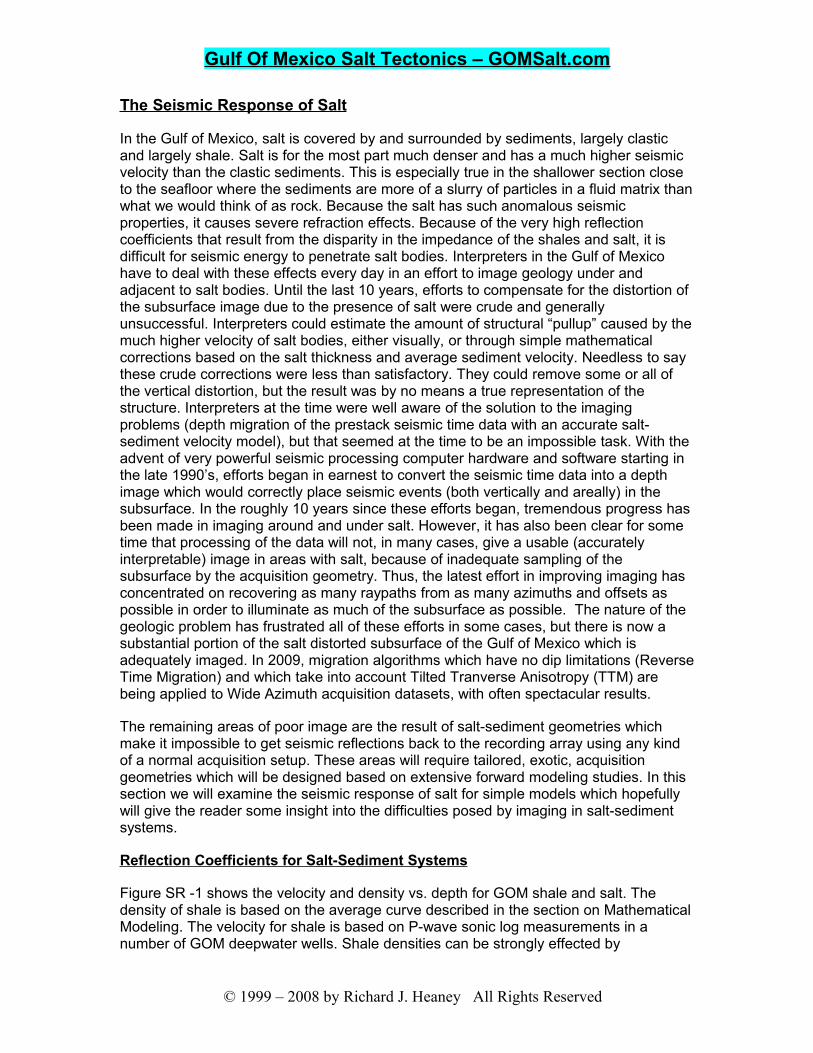
Figure SR -1 shows the velocity and density vs. depth for GOM shale and salt. The density of shale is based on the average curve described in the section on Mathematical Modeling. The velocity for shale is based on P-wave sonic log measurements in a number of GOM deepwater wells. Shale densities can be strongly effected by
© 1999 – 2008 by Richard J. Heaney All Rights Reserved
Gulf Of Mexico Salt Tectonics – GOMSalt.com
overpressuring (pressure above the normal hydrostatic trend) and an effort has been made to estimate this effect, using various published studies of pressure estimation. The hatchered area on the shale density graph shows the curve for the normal compaction case (higher density) and for the case of significant overpressure. The expected range of shale densities should lie in the area between these two extremes. Compared to the
Figure SR -1 . Graphs of shale and salt velocity vs. depth for the Gulf of Mexico
seismic velocity of salt, the shale velocities are much slower, even at depths of 25000 feet below mudline. Shale density ranges from close to the density of salt to a few tenths of a gram per cc greater than salt. The contrasts between shale and salt velocity and density contribute equally to the resultant reflection coefficient, However, the contrast is much stronger for velocity than for density so the velocity difference dominates the reflection strength. Recall that reflection coefficient at zero offset at an impedance boundary is given by:
Reflection Coefficient = V2D2 – V1D1/ V2D2 + V1D1 (1)
where V1 and D1 are the velocity and density above the boundary and V2 and D2 are the velocity and density below the boundary. The product of velocity and density is the impedance, so, at a boundary going from shale into salt, (1) can be expressed as:
Reflection Coefficient = Imp. Salt – Imp. Shale/ Imp. Salt + Imp. Shale (2)
© 1999 – 2008 by Richard J. Heaney All Rights Reserved
Gulf Of Mexico Salt Tectonics – GOMSalt.com
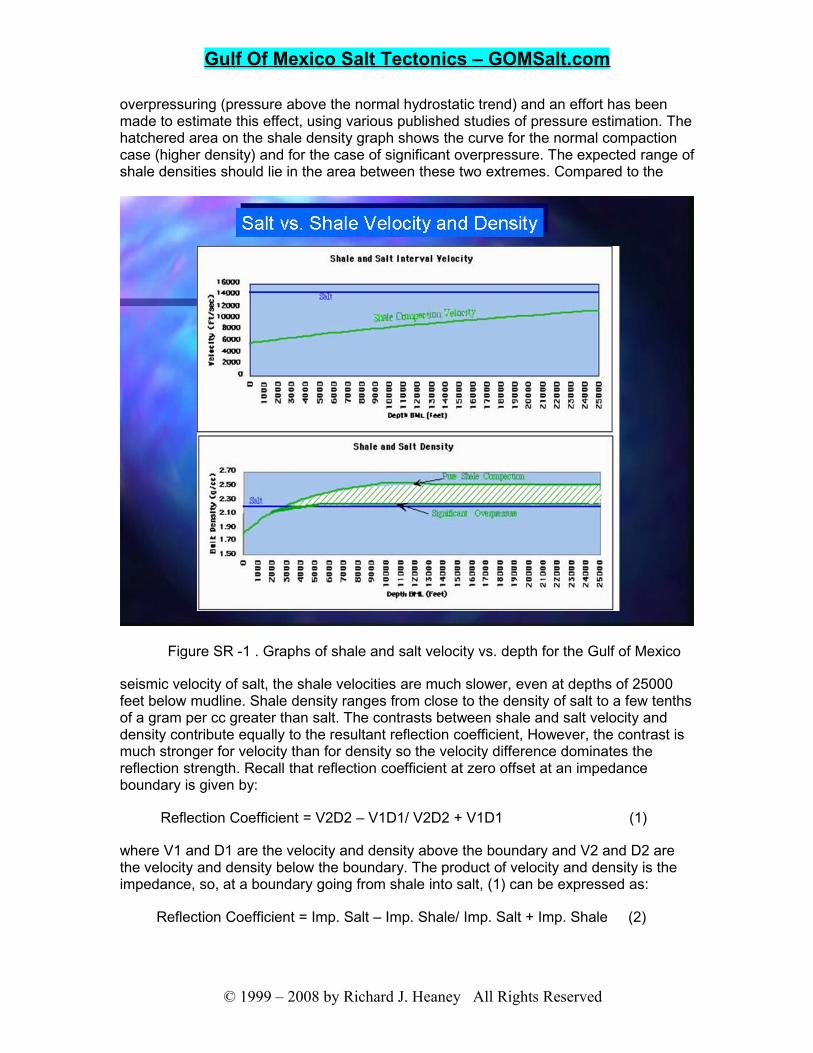
The relative impedance values versus depth for shale and salt for the velocity and density values in Figure SR -1, are shown in Figure SR - 2. It is readily apparent from the figure that reflections from the shale-above-salt interface are very strong and positive, while reflections going from salt into shale are very strong and negative. Using (2) to calculate the reflection coefficients vs. depth gives the graph in Figure SR - 3. As
Figure SR -2. Salt impedance compared to average shale impedance vs. depth
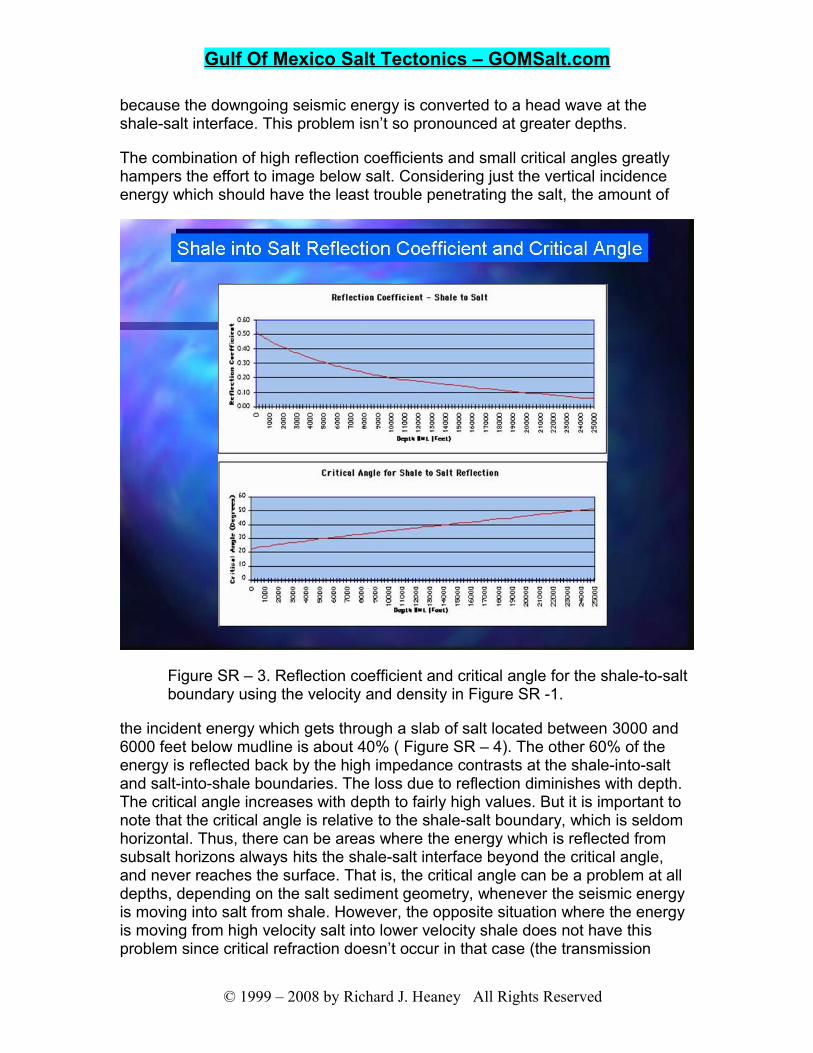
expected, the coefficients are very large, up to .5, near the seafloor and decrease substantially at depth. These coefficients are only valid for vertical incidence. We will examine the offset behavior of salt-shale reflections below.
Because salt always has a higher velocity than shale, the top-of-salt transmission angle reaches a critical value beyond which the energy impinging on the boundary travels horizontally and does not penetrate the salt. This angle is calculated from Snell’s Law in the case where the reflection angle is 90 degrees, and is given by:
Θcr = sin ˉ¹(V2/V1) (3)
The value of the critical angle going into salt from shale is also shown in Figure SR - 3. The values at shallower depths, ie. for salt bodies which are relatively close to the waterbottom, are in the range of 20 to 30 degrees. Thus, for most of the offsets in the recording array, there cannot be much subsalt reflected energy
© 1999 – 2008 by Richard J. Heaney All Rights Reserved
Gulf Of Mexico Salt Tectonics – GOMSalt.com
because the downgoing seismic energy is converted to a head wave at the shale-salt interface. This problem isn’t so pronounced at greater depths.
The combination of high reflection coefficients and small critical angles greatly hampers the effort to image below salt. Considering just the vertical incidence energy which should have the least trouble penetrating the salt, the amount of
Figure SR – 3. Reflection coefficient and critical angle for the shale-to-salt boundary using the velocity and density in Figure SR -1.
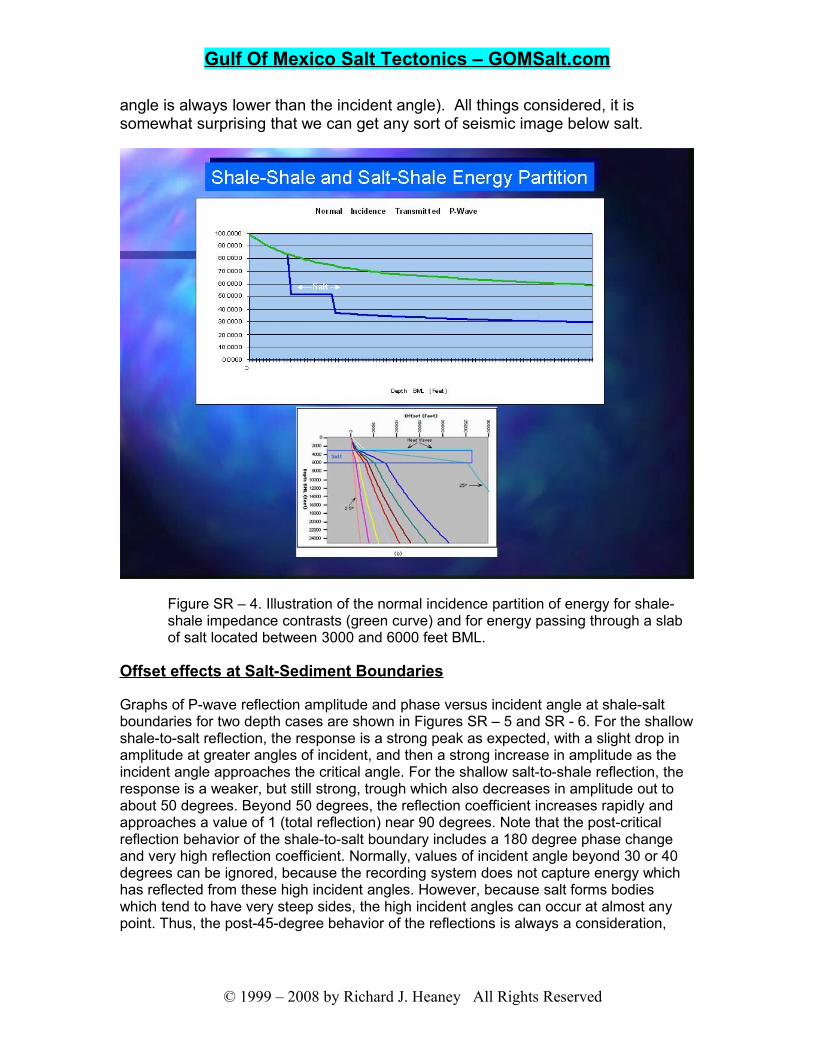
the incident energy which gets through a slab of salt located between 3000 and 6000 feet below mudline is about 40% ( Figure SR – 4). The other 60% of the energy is reflected back by the high impedance contrasts at the shale-into-salt and salt-into-shale boundaries. The loss due to reflection diminishes with depth. The critical angle increases with depth to fairly high values. But it is important to note that the critical angle is relative to the shale-salt boundary, which is seldom horizontal. Thus, there can be areas where the energy which is reflected from subsalt horizons always hits the shale-salt interface beyond the critical angle, and never reaches the surface. That is, the critical angle can be a problem at all depths, depending on the salt sediment geometry, whenever the seismic energy is moving into salt from shale. However, the opposite situation where the energy is moving from high velocity salt into lower velocity shale does not have this problem since critical refraction doesn’t occur in that case (the transmission
© 1999 – 2008 by Richard J. Heaney All Rights Reserved
Gulf Of Mexico Salt Tectonics – GOMSalt.com
angle is always lower than the incident angle). All things considered, it is somewhat surprising that we can get any sort of seismic image below salt.
Figure SR – 4. Illustration of the normal incidence partition of energy for shale-shale impedance contrasts (green curve) and for energy passing through a slab of salt located between 3000 and 6000 feet BML.
Offset effects at Salt-Sediment Boundaries
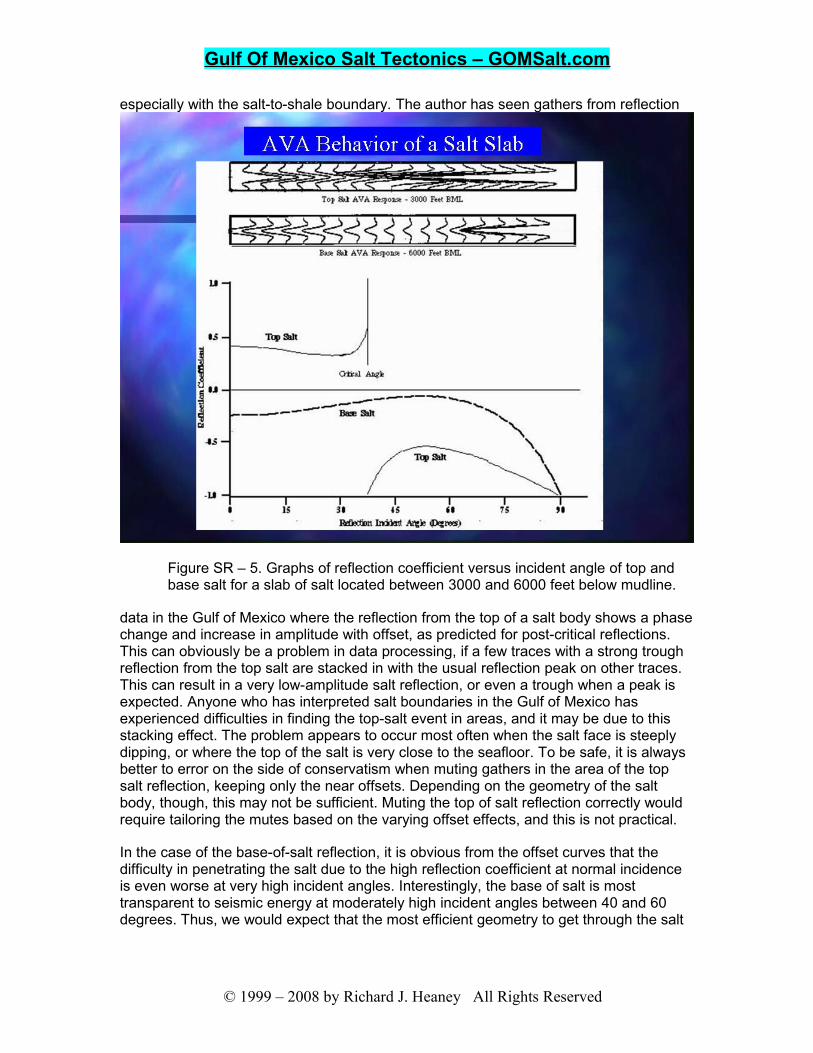
Graphs of P-wave reflection amplitude and phase versus incident angle at shale-salt boundaries for two depth cases are shown in Figures SR – 5 and SR - 6. For the shallow shale-to-salt reflection, the response is a strong peak as expected, with a slight drop in amplitude at greater angles of incident, and then a strong increase in amplitude as the incident angle approaches the critical angle. For the shallow salt-to-shale reflection, the response is a weaker, but still strong, trough which also decreases in amplitude out to about 50 degrees. Beyond 50 degrees, the reflection coefficient increases rapidly and approaches a value of 1 (total reflection) near 90 degrees. Note that the post-critical reflection behavior of the shale-to-salt boundary includes a 180 degree phase change and very high reflection coefficient. Normally, values of incident angle beyond 30 or 40 degrees can be ignored, because the recording system does not capture energy which has reflected from these high incident angles. However, because salt forms bodies which tend to have very steep sides, the high incident angles can occur at almost any point. Thus, the post-45-degree behavior of the reflections is always a consideration,
© 1999 – 2008 by Richard J. Heaney All Rights Reserved
Gulf Of Mexico Salt Tectonics – GOMSalt.com
especially with the salt-to-shale boundary. The author has seen gathers from reflection
Figure SR – 5. Graphs of reflection coefficient versus incident angle of top and base salt for a slab of salt located between 3000 and 6000 feet below mudline.
data in the Gulf of Mexico where the reflection from the top of a salt body shows a phase change and increase in amplitude with offset, as predicted for post-critical reflections. This can obviously be a problem in data processing, if a few traces with a strong trough reflection from the top salt are stacked in with the usual reflection peak on other traces. This can result in a very low-amplitude salt reflection, or even a trough when a peak is expected. Anyone who has interpreted salt boundaries in the Gulf of Mexico has experienced difficulties in finding the top-salt event in areas, and it may be due to this stacking effect. The problem appears to occur most often when the salt face is steeply dipping, or where the top of the salt is very close to the seafloor. To be safe, it is always better to error on the side of conservatism when muting gathers in the area of the top salt reflection, keeping only the near offsets. Depending on the geometry of the salt body, though, this may not be sufficient. Muting the top of salt reflection correctly would require tailoring the mutes based on the varying offset effects, and this is not practical.
In the case of the base-of-salt reflection, it is obvious from the offset curves that the difficulty in penetrating the salt due to the high reflection coefficient at normal incidence is even worse at very high incident angles. Interestingly, the base of salt is most transparent to seismic energy at moderately high incident angles between 40 and 60 degrees. Thus, we would expect that the most efficient geometry to get through the salt
© 1999 – 2008 by Richard J. Heaney All Rights Reserved
Gulf Of Mexico Salt Tectonics – GOMSalt.com
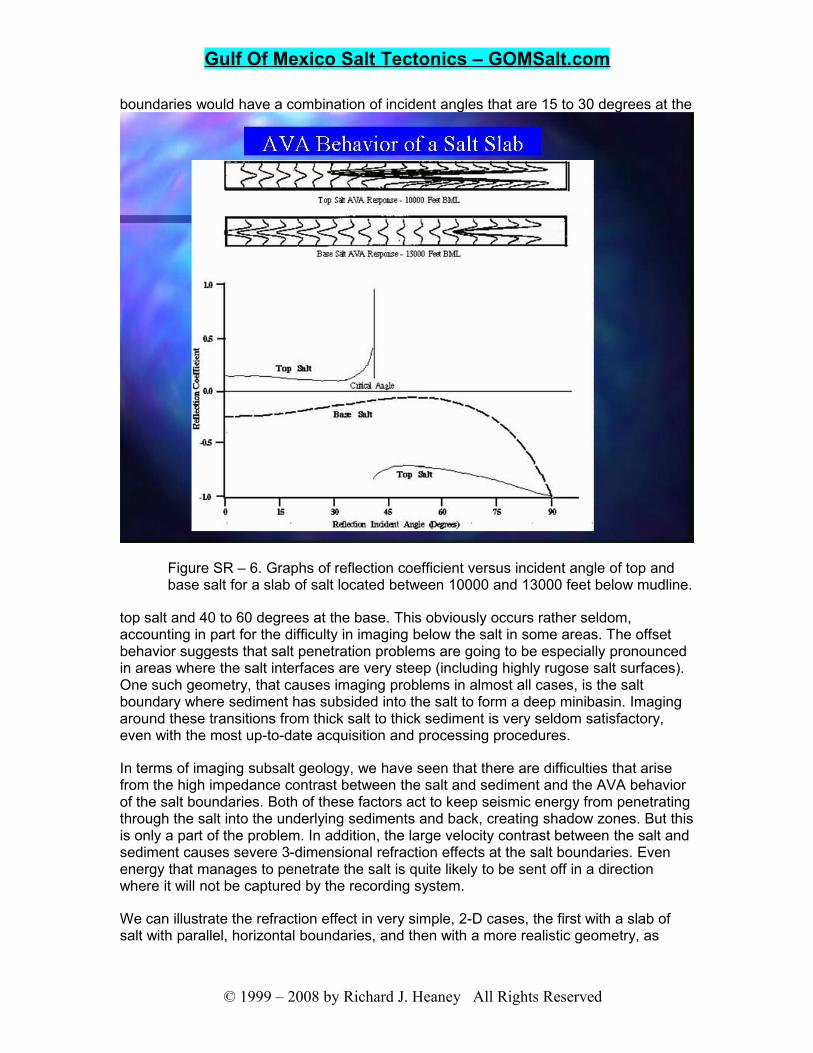
boundaries would have a combination of incident angles that are 15 to 30 degrees at the
Figure SR – 6. Graphs of reflection coefficient versus incident angle of top and base salt for a slab of salt located between 10000 and 13000 feet below mudline.
top salt and 40 to 60 degrees at the base. This obviously occurs rather seldom, accounting in part for the difficulty in imaging below the salt in some areas. The offset behavior suggests that salt penetration problems are going to be especially pronounced in areas where the salt interfaces are very steep (including highly rugose salt surfaces). One such geometry, that causes imaging problems in almost all cases, is the salt boundary where sediment has subsided into the salt to form a deep minibasin. Imaging around these transitions from thick salt to thick sediment is very seldom satisfactory, even with the most up-to-date acquisition and processing procedures.
In terms of imaging subsalt geology, we have seen that there are difficulties that arise from the high impedance contrast between the salt and sediment and the AVA behavior of the salt boundaries. Both of these factors act to keep seismic energy from penetrating through the salt into the underlying sediments and back, creating shadow zones. But this is only a part of the problem. In addition, the large velocity contrast between the salt and sediment causes severe 3-dimensional refraction effects at the salt boundaries. Even energy that manages to penetrate the salt is quite likely to be sent off in a direction where it will not be captured by the recording system.
We can illustrate the refraction effect in very simple, 2-D cases, the first with a slab of salt with parallel, horizontal boundaries, and then with a more realistic geometry, as
© 1999 – 2008 by Richard J. Heaney All Rights Reserved
Gulf Of Mexico Salt Tectonics – GOMSalt.com
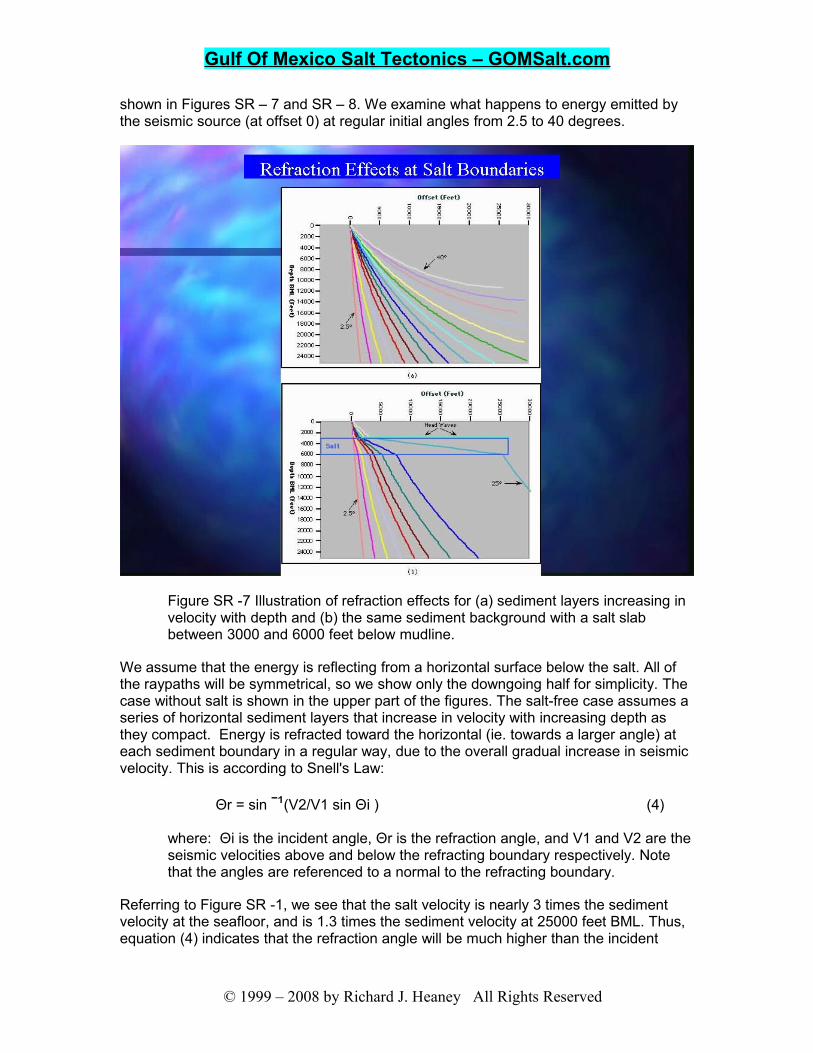
shown in Figures SR – 7 and SR – 8. We examine what happens to energy emitted by the seismic source (at offset 0) at regular initial angles from 2.5 to 40 degrees.
Figure SR -7 Illustration of refraction effects for (a) sediment layers increasing in velocity with depth and (b) the same sediment background with a salt slab between 3000 and 6000 feet below mudline.
We assume that the energy is reflecting from a horizontal surface below the salt. All of the raypaths will be symmetrical, so we show only the downgoing half for simplicity. The case without salt is shown in the upper part of the figures. The salt-free case assumes a series of horizontal sediment layers that increase in velocity with increasing depth as they compact. Energy is refracted toward the horizontal (ie. towards a larger angle) at each sediment boundary in a regular way, due to the overall gradual increase in seismic velocity. This is according to Snell's Law:
Θr = sin ˉ¹(V2/V1 sin Θi ) (4)
where: Θi is the incident angle, Θr is the refraction angle, and V1 and V2 are the seismic velocities above and below the refracting boundary respectively. Note that the angles are referenced to a normal to the refracting boundary.
Referring to Figure SR -1, we see that the salt velocity is nearly 3 times the sediment velocity at the seafloor, and is 1.3 times the sediment velocity at 25000 feet BML. Thus, equation (4) indicates that the refraction angle will be much higher than the incident
© 1999 – 2008 by Richard J. Heaney All Rights Reserved
Gulf Of Mexico Salt Tectonics – GOMSalt.com
angle at shale-salt boundaries. At shale-shale boundaries, where V1 and V2 are nearly identical, the refraction angle is only slightly changed from the incident angle.
In the sediment only case, the ray with an initial angle of 40 degrees is refracted at 90 degrees at around 11000 feet below mudline, and does not penetrate any further into the sediment. This would be the expected result within a deep minibasin. Reflections obtained from this salt-free case are very regular, with larger initial angles corresponding to larger reflection offsets in a systematic way. The reflection point is midway between the source and receiver. If a slab of salt with a flat, horizontal top and bottom is introduced into the sedimentary section, the refraction of seismic energy toward horizontal is greatly increased, and the energy beyond about 27 degrees initial angle is critically refracted and never penetrates into the salt or into the subsalt sediment. This salt geometry would also result in a well-ordered reflection gather, with larger initial angles resulting in larger reflection offsets. However, the offset range would be limited by the critical refraction angle, and the offsets corresponding to initial angles would increase rapidly for each angle increment in a nonlinear way.
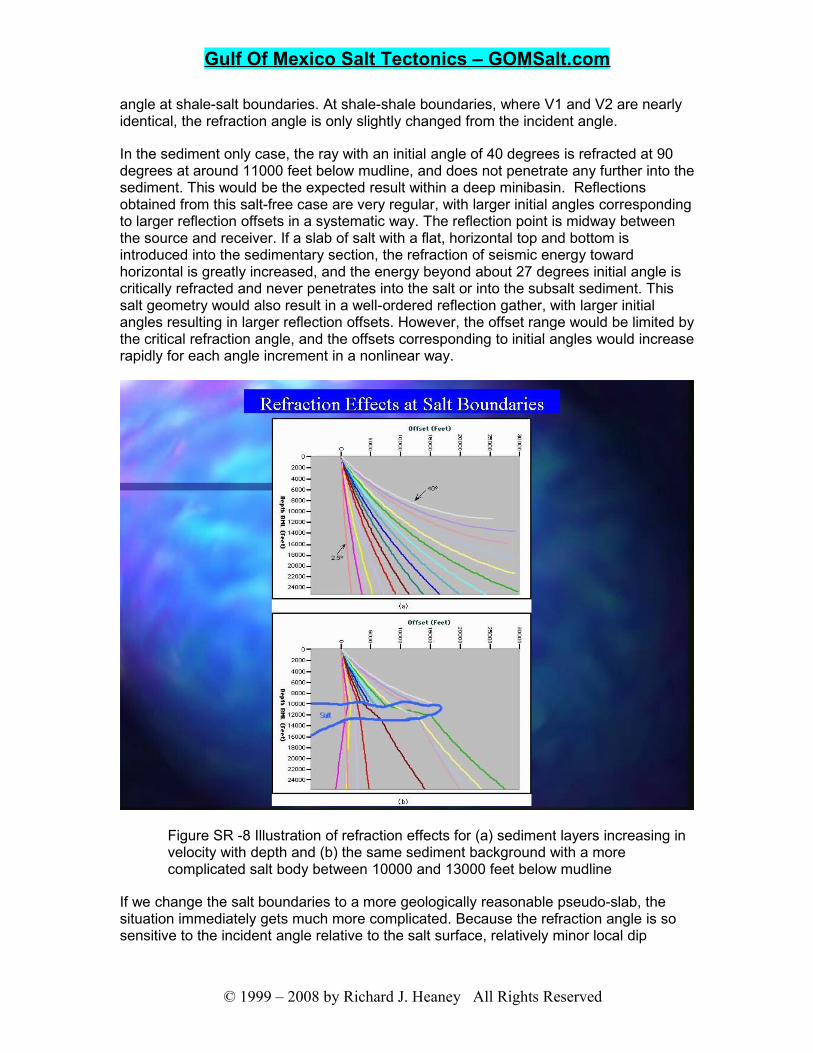
Figure SR -8 Illustration of refraction effects for (a) sediment layers increasing in velocity with depth and (b) the same sediment background with a more complicated salt body between 10000 and 13000 feet below mudline
If we change the salt boundaries to a more geologically reasonable pseudo-slab, the situation immediately gets much more complicated. Because the refraction angle is so sensitive to the incident angle relative to the salt surface, relatively minor local dip
© 1999 – 2008 by Richard J. Heaney All Rights Reserved
Gulf Of Mexico Salt Tectonics – GOMSalt.com
changes in the salt boundary (ie. within a Fresnel zone) are enough to send rays on very irregular paths. The result is a non-trivial relation between incident angle of the rays and where a reflection appears in the recording array. The spacing of offsets for regular initial angle increments will be very irregular. In some cases, rays with higher initial angles end up at shorter offsets than rays with lower initial angles; rays can be refracted toward shorter offsets if the dip of the top salt boundary is towards the source. (There would also be severe distortion of the reflections in the case shown since some of the raypaths return to the recording array through the salt, whereas others return through sediment. Examination of the reflection gathers would not result in a straightforward identification of reflection events due to the “pullup” from this effect.) This is a relatively simple and uncomplicated geometry, compared to common Gulf of Mexico salt boundaries, and yet it produces serious distortion of the reflection energy. This is analogous to what happens when a flat mirror is replaced by a warped “funhouse” mirror. The reflected image is distorted, and no longer reflects the true structure. The distortion is due to the velocity disparity between the salt and sediment, and thus is most pronounced at shallower depths and becomes much less of a problem at greater depths. Unfortunately, all of the thick salt bodies in the Gulf of Mexico are, at least in part, close to the seafloor. So imaging subsalt sediments is nearly always hampered by severe refraction effects.
We have only considered 2-D models, but clearly this is a 3-D problem. In the case of crossline dip components (ie. perpendicular to the shot progression of the recording system), the vertical input seismic energy will be strongly refracted away from the desired vertical path. If the recording array samples a wide swath of azimuths and offsets, some of the laterally refracted energy will be captured. But for most “standard” recording systems, the refracted energy returns to the surface outside of the recording array and is lost. Depending on the specific geometry of the salt boundaries and the subsalt horizons, some energy which is strongly refracted will be captured, due to a fortunate combination of refraction and reflection angles. However, it is clear that the more likely case is for the energy to be scattered and lost, unless the dip is near zero in the crossline direction. Thus, one of the negatives of the strong refraction at salt-sediment boundaries is the loss of input seismic energy which is never captured after reflecting in the subsurface. Because the energy from some subsalt reflectors is not recorded, some areas of the seismic data will lack any reflection energy to represent the subsalt structure. The result is referred to as incomplete subsalt illumination.
A second negative effect of the strong 3-D refraction is that simple data processing assumptions that assume a slowly varying velocity field in the subsurface, and more or less vertical travel of the seismic energy, are no longer even slightly valid. For instance, in the case of a slowly and slightly varying lateral velocity, a flat sedimentary surface will appear on a time seismic section as a relatively flat reflection. The same surface placed below a salt body will be strongly pulled up in time by the higher velocity of the salt (ie: the time to pass through the salt will be much smaller than the time to pass through the adjacent, slower-velocity sediment). In the subsalt case, the time data will no longer correctly suggest the subsurface structure. More importantly, some of the assumptions that are used to correct the data during processing in order to produce a useful image will no longer be valid. As we showed with the 2-D example of refraction effects, in general the assumption that the reflection point is midway between the source and receiver points is no longer true in the presence of salt bodies. And, since the salt boundaries almost always have complex 3-D geometries, the assumption that the reflection energy follows a simple vertical path from source to receiver is also in error. In cases like salt-sediment systems, where the seismic velocity changes radically in all
© 1999 – 2008 by Richard J. Heaney All Rights Reserved
Gulf Of Mexico Salt Tectonics – GOMSalt.com
directions, the only solution is to identify the refracting boundaries (ie. the location in 3-D of the anomalous velocities) and to back out the refraction effects so that the assumptions used in producing the subsurface image are again valid. The result of “undoing” the salt effects is to produce reflection gathers that correctly identify seismic energy from subsurface reflectors and place it in the correct 3-D spatial position. This can be done by literally tracing the energy down to the reflection point and back again, thus identifying the reflection points. Reflections from common subsurface points can then be sorted into “common image point” gathers and processed in the usual way. However, raytracing and sorting the data sample by sample is extremely time consuming, so algorithms that use this procedure usually require simplifying assumptions. These can reduce the output signal-to-noise and cause serious distortion in areas where the salt varies rapidly in thickness.
Alternatively, depth migration using wave-equation methods produces a generally more accurate and higher-signal result, and, with present computer systems, often with less computation time. Recent innovations in depth migration algorithms have removed the dip limitations which plagued earlier wave-equation solutions, and easily account for anisotropy, given an estimate of the anisotropic factors. Assuming an accurate 3-D velocity model, which represents the actual location and velocity of the salt and sediment, these newer algorithms produce a very satisfactory representation of the subsalt structure. This assumes, however, that some reflection energy has been captured by the acquisition system. Even the best, state-of-the-art migration can only work with the signal that is available.
Summary
Given all of the problems in imaging below salt bodies in the Gulf of Mexico, it seems somewhat amazing that it is possible at all. These problems include strong refraction and head-wave formation at salt boundaries, and high impedance contrasts at salt boundaries which restrict energy penetration into and through the salt. Yet, there are now areas of the Gulf of Mexico where the image of sediments below salt is comparable to the image in salt-free or suprasalt areas. In most cases, this is true when the salt is in roughly slab-like form, so that the top and bottom salt boundaries are relatively horizontal and regular. Severe imaging problems generally occur at the transitions where thick salt is replaced laterally by thick sediment. The steep, complex salt faces in these locations make capture of reflection energy exceedingly difficult, even with wide azimuth acquisition. Other poorly imaged areas result from improper identification of the salt boundaries. Despite the strong reflection coefficients expected at salt-sediment boundaries, it is common to find little or no reflection energy at these boundaries, usually due to complex refraction and lack of reflection energy capture. Since migration algorithms are only as good as the velocity model that is input to them, a bad velocity model is not going to result in an accurate image, or constructive stacking of correctly placed reflection energy. The fact that even state-of-the-art acquisition systems fail to record reflections from all of the subsurface represents the biggest imaging challenge in the Gulf of Mexico today. The only solution when “normal” acquisition geometries fail to capture reflections from the subsalt sediments is to design a custom recording geometry, (based on forward modeling of correct velocity models), which “follows the energy” and places the source and receivers in the proper locations to illuminate the subsurface. To the author’s knowledge, this has not been attempted in the Gulf of Mexico, or anywhere else for that matter, but it is probably the only solution. There are producing subsalt fields in the Gulf of Mexico where the details of structure and stratigraphy are only
© 1999 – 2008 by Richard J. Heaney All Rights Reserved
Gulf Of Mexico Salt Tectonics – GOMSalt.com
partially imaged because of subsurface illumination challenges. This results in very expensive development wells being drilled “blind”, which is clearly not a desirable situation. Failure to obtain subsalt data sufficient to identify faults and stratigraphic complexities can jeopardize field development when reservoirs are highly compartmentalized. Because re-completions or even lost wellbores can result from a lack of seismic image, resulting in tens of millions of dollars of additional costs, at some point a company contemplating a multi-billion dollar development will test out the concept of a custom, “designed to illuminate”, acquisition setup. Once that process is proven and in common usage, there should be no subsalt areas left in the Gulf of Mexico where an interpretable, relatively high-quality depth image is not achievable.
© 1999 – 2008 by Richard J. Heaney All Rights Reserved