Embed Size (px)
Citation preview

New Mexico
State Personnel Office FY16 3rd Quarter Workforce Report Mission: To deliver human capital management programs that advance all State agency missions, while protecting the
rights of our State employees.

P a g e | 2
ContentsDirector’sReport................................................................................................................................................................................................3
ClassifiedServiceataGlance(March31,2016)....................................................................................................................................5
TotalCompensation..........................................................................................................................................................................................5
MultipleComponentsofPay(MCOP).........................................................................................................................................................6
AnnualKeyPerformanceMeasures............................................................................................................................................................8
Overtime.................................................................................................................................................................................................................9
SickLeave............................................................................................................................................................................................................11
AnnualLeave......................................................................................................................................................................................................11
ContinuousAdvertisements.........................................................................................................................................................................13
Applications........................................................................................................................................................................................................14
AverageDaystoFillaPositionbyAnswerDatebyAgency............................................................................................................16
ClassifiedServiceHiresandSeparations................................................................................................................................20
NewEmployeeHiresbyFiscalYear(FY11‐FY15)..............................................................................................................................20
FY16NewEmployeeHiresandSeparationsbyQuarter.................................................................................................................20
NewHireCompa‐Ratio...................................................................................................................................................................................21
QuarterlyNewEmployeeHireCompa‐RatiobyPayBand..............................................................................................................22
QuarterlyNewEmployeeHireDemographics.....................................................................................................................................23
QuarterlyClassifiedEmployeeSeparationsbyReason....................................................................................................................23
QuarterlyClassifiedEmployeeSeparationsbyAgency....................................................................................................................24
StatewideClassifiedTurnoverRate..........................................................................................................................................25
StatewideClassifiedEmployeeTurnoverRatebyAgency..............................................................................................................25
VacancyRates....................................................................................................................................................................................................28
QuarterlyVacancyRatesfor20KeyAgencies......................................................................................................................................28
Training................................................................................................................................................................................................................29
Instructor–LedCoreCurriculumClasses..............................................................................................................................................29
eLearningMandatoryClasses.....................................................................................................................................................................30
Adjudication........................................................................................................................................................................................................31
LaborRelations(LRD)....................................................................................................................................................................................32
QuarterlyUnionRepresentedvs.NonUnion........................................................................................................................................33
QuarterlyPerformanceMeasures.............................................................................................................................................................35

P a g e | 3
Director’sReport
The State Personnel Office’s (SPO) mission is to provide the State of New Mexico (the State) with human resource (HR) leadership and direction, in order to maximize service to the citizens of the State. A quarterly report is issued by SPO, as required by the Accountability in Government Act, to address the HR metrics established within the General Appropriations Act. The report is updated quarterly to provide timely metrics that are used to enhance the State’s ability to address HR issues impacting management throughout State government. Additionally, SPO is required to conduct and lead workforce planning and policy development throughout the State on HR issues. To accomplish this mission, SPO, in partnership with the State Personnel Board and State agencies, endeavors to:
• Provide timely and quality information and guidance to the State Personnel Board, the Governor, and State agencies regarding the delivery of HR programs;
• Recommend improvements to HR function, emphasizing economy, efficiency, compliance, and effectiveness;
and, • Conduct value‐added reviews and projects.
SPO continues to focus on recruitment, including working with state agencies to decrease the amount of time taken to fill positions, while working to improve overall hiring efficiency. It should be noted that the average days to fill a position has decreased by another four days when compared to the last quarter. The average days to refer applicants have continued to decline since FY13. The number of days that HR staff is taking to refer applicants to hiring managers this quarter is 7.7 days, which is consistent with last quarter. SPO continues to partner with agencies on enhancing recruitment for the State. For example, SPO has created the “Rapid Hire Program” to assist agencies when standard recruitment efforts have proven unsuccessful in meeting the hiring needs for critical positions. The Rapid Hire Program provides agencies the ability to perform on‐site recruitment and selection at specified hiring events that are well‐suited for the unique recruiting needs of the agency. In addition, SPO has created a YouTube channel that contains video tutorials on the recruitment process to assist applicants as they apply for State positions. In order to ensure that applicants have ample opportunity to revise their applications before the job advertisement has closed, SPO updated the re‐apply time to allow applicants to re‐apply without any time limitations up until the advertisement closes. This quarter, 608 new hires were made, while 664 employees separated from State service. Included in the number of separations, 213 employees retired from state service in the second quarter of FY16. This trend is evidence of the State’s continuing work to retain qualified employees. Of the entire State service, 3.3% of employees separated voluntarily, while only 0.4% separated involuntarily. The Statewide Vacancy Rate for the 2nd Quarter dropped to 14.4%. SPO’s Career Services Division and State agencies continue to work diligently to reduce vacancy rates by managing the time it takes to advertise and fill a position. Sincerely, Justin R. Najaka State Personnel Director

P a g e | 4
Workforce Overview
The State’s workforce demographics show change due to retirements, normal attrition, and budgetary limitations. SPO
has initiated the following critical actions to stabilize and increase a qualified workforce:
• An enhanced on‐line application process (NEOGOV);
• Revision of classifications to closely align job duties with the requisite minimum qualifications required; and,
• Continuation of a compensation review to make State classifications competitive with both the public and
private sector.
Executive branch employee levels have remained stable since FY12 as a result of careful assessment of the need to fill
vacant positions, improvements in business processes, revision of restrictive non‐competitive compensation plans, and
employee retirements and resignations. Legislative employee headcounts traditionally increase in the 3rd Quarter as a
result of hiring for the Legislative session.
25.1 24.1 22.6 22.2 22.7 22.0 22.1
0.0
5.0
10.0
15.0
20.0
25.0
30.0
FY10 FY11 FY12 FY13 FY14 FY15 FY16 (YTD)
Thousands
Employee HeadcountFY10‐FY16
FY12 FY13 FY14 FY15 FY16
Executive ‐6.6% ‐2.3% 2.7% ‐0.67% 0.53%
Legislative 0.6% 1.2% ‐4.6% ‐4.62% ‐1.21%
Courts ‐2.6% 0.4% ‐0.3% ‐0.51% 0.42%
‐8.0%
‐3.0%
2.0%
7.0%
12.0%
17.0%
Percent change
Fiscal Year Percent of Increase/Decrease(Employee Headcount)

P a g e | 5
TOTALCOMPENSATIONASOF
MARCH31,2016
AVERAGEBASESALARY$44,741
AVERAGEBENEFIT$33,182
AVERAGETOTALCOMPENSATION$77,923
AVERAGECLASSIFIEDEMPLOYEECOMPA‐RATIO102.1%
ClassifiedServiceataGlance(March31,2016)
TotalCompensationTotal compensation is a commonly utilized standard by both private and public sectors in assessing the employee
average base salary and benefits provided by the employer. Benefit expenditures provided by the State include costs
associated with retirement, health and other insurances, FICA, and paid leave (annual, sick, etc.). The graph on the next
page shows the significant growth in the average benefit expenditures by the State since FY12. In the 3rd Quarter of
FY16, benefit costs as a percentage of total compensation rose, as health care insurance rates increased. Between FY14
and FY15, benefits remained level, while the average salary increased by almost 6%.
Employee Count: 17,666
Regular: 15,593
Term: 1,930
Temporary: 143
Managers: 2,173
Supervisors:1,545
16,052 15,953 15,566 15,602 15,593
1,999 2,014 1,950 1,952 1,930
222 388 189 164 143 0
5,000
10,000
15,000
20,000
FY15 Q3 FY15 Q4 FY16 Q1 FY16 Q2 FY16 Q3
Classified Employees Workforce
Regular Employees Term Employees Temporary Employees
Workforce Data
UnionRepresentedEmployees 55.4%
Minority 63.9%
Female 54.7%
Male 45.3%

P a g e | 6
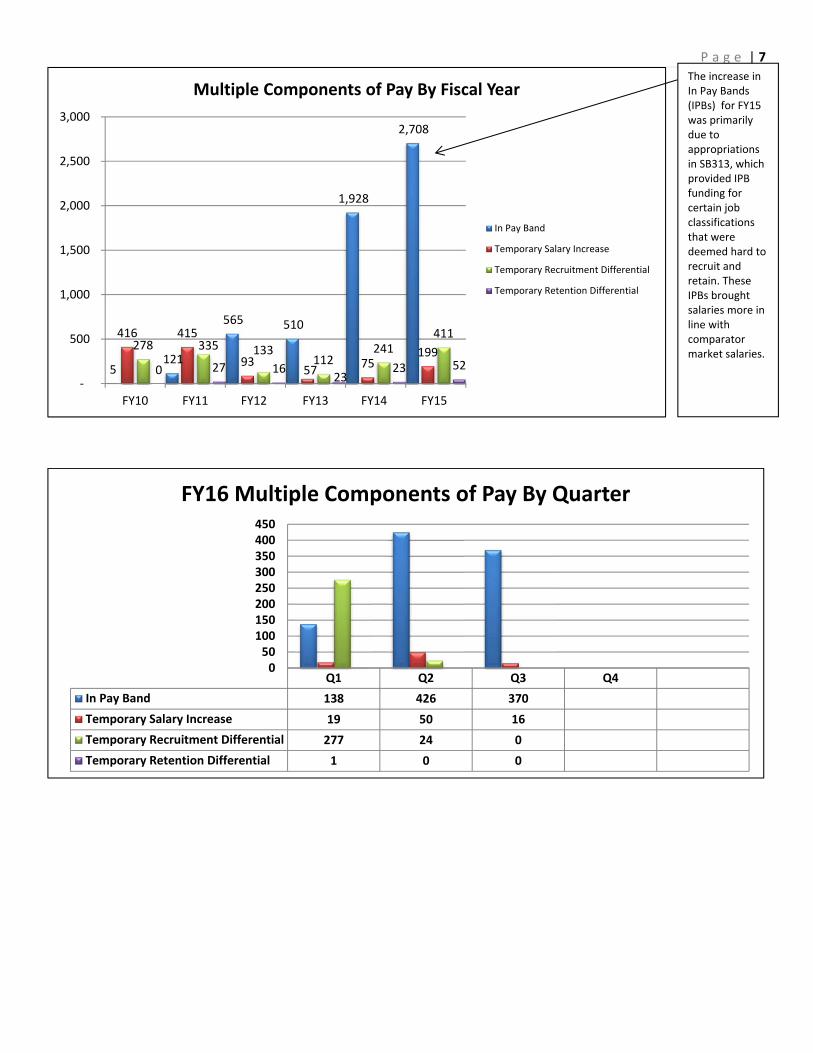
MultipleComponentsofPay(MCOP)
Various pay mechanisms permitted through the State Personnel Board (SPB) Rules were developed to facilitate
recruitment and retention efforts. The following provisions within the SPB Rules are currently authorized:
Temporary Recruitment Differentials (TREC) are permitted for positions determined to be critical to meet the business needs of an agency that is experiencing difficulties in recruitment.
Temporary Retention Differentials (TRET) are permitted to retain an employee critical to meeting the business needs of an agency that would otherwise be disrupted if an employee left the position.
Temporary Salary Increases (TSI) are permitted when an employee temporarily accepts, and consistently performs, additional duties characteristic of a job requiring greater responsibility and accountability, making it a higher valued job. A TSI is a short‐term salary measure that may be used until the conditions of the additional duties and responsibilities cease to exist, and may not be extended beyond a one‐year period.
In‐Pay Band Salary Adjustments (IPBs) are permitted to increase an employee’s base compensation up to 10% within a Fiscal Year, provided that the employee’s performance has demonstrated placement at a higher compa‐ratio. This is a permanent pay mechanism that allows for salary growth within the Pay Band. The Department of Finance and Administration (DFA) must review IPB requests to ensure agency budget availability.
SPO reviews and approves various actions to ensure compliance with SPB Rules. The State’s pay structure has not been
comprehensively addressed since 2001, compromising retention of employees in many critical positions, and creating a
negative impact on the State’s ability to attract and retain qualified applicants.
The graph on the next page shows the utilization of Multiple Components of Pay.
$41,912 $41,850 $41,912 $44,554 $44,741
$27,328 $28,107 $30,244$30,054 $33,182
$0
$10,000
$20,000
$30,000
$40,000
$50,000
$60,000
$70,000
$80,000
$90,000
FY12 FY13 FY14 FY15 FY16 YTD
Total Classified Compensation
Average Benefit
Average Base Salary
P a g e | 7
5 121
565 510
1,928
2,708
416 415
9357
75199
278 335 133112
241411
0 27 1623
23 52
‐
500
1,000
1,500
2,000
2,500
3,000
FY10 FY11 FY12 FY13 FY14 FY15
Multiple Components of Pay By Fiscal Year
In Pay Band
Temporary Salary Increase
Temporary Recruitment Differential
Temporary Retention Differential
Q1 Q2 Q3 Q4
In Pay Band 138 426 370
Temporary Salary Increase 19 50 16
Temporary Recruitment Differential 277 24 0
Temporary Retention Differential 1 0 0
050100150200250300350400450
FY16 Multiple Components of Pay By Quarter
The increase in In Pay Bands (IPBs) for FY15 was primarily due to appropriations in SB313, which provided IPB funding for certain job classifications that were deemed hard to recruit and retain. These IPBs brought salaries more in line with comparator market salaries.

P a g e | 8
The increase in average compa‐ratio is attributed to classification and range adjustments.
AnnualKeyPerformanceMeasures
Performance evaluation remains critical in assessing the quality of the workforce, recognizing employee efforts, and
providing guidance in employee development. Performance evaluations are a requirement outlined within the SPB
Rules. Without a linkage to compensation, many employees and supervisors do not conduct employee evaluations;
however, research demonstrates that an evaluation, even absent linkage to pay, creates the opportunity not only to
recognize and document performance, but also to create a non‐threatening approach to improving the quality of the
workforce. In FY15, 56% of eligible classified employees were evaluated. Due to this measure’s target not being met at
the close of FY15, SPO has already begun working with agencies to provide guidance to ensure compliance in this area.
In a collaborative effort, agencies are working to ensure FY15 evaluations are closed out and entered accordingly.
Agencies are also being provided with reports to aid in identifying employees that need an employee evaluation, based
on the employee’s anniversary date for FY16.
The number of employees completing their probationary period has increased steadily since the 3rd Quarter of FY15, and
is up almost 4% over the same period last year. Between FY14 and FY15, employees’ completing their probationary
period has remained flat. This is partly due to the 2011 re‐establishment of the minimum qualifications for
classifications, and classification and compensation reviews.
101.0% 99.0% 100.0% 101.7% 102.1%
0.0%
20.0%
40.0%
60.0%
80.0%
100.0%
120.0%
FY12 FY13 FY14 FY15 FY16
Average Employee Compa Ratio
Update:AsofApril15,2016,thepercentageofFY15evaluationscompletedhasbeenrevisedto89%.Amajorityofemployees’evaluationswerecompletedby6/30/15,butwerenotentered
intoPeopleSoft(Share)byagencystaff.

P a g e | 9
Overtime
When compared to the same time frame in FY15, the actual cost of overtime worked decreased for the 3rd Quarter of
FY16. The graphs on the next page will show a small increase in the number of hours an employee is working, but an
overall decrease in the percentage of employees working overtime. This translates to fewer employees working
additional hours of overtime.
*Note: The above graphs account for both overtime accrual and payout at straight time/time and a half.
65.9%
69.9%68.2% 68.5%
69.7%70.1% 71.2%
55%
60%
65%
70%
75%
Q1 Q2 Q3 Q4
Employees Who Successfully Completed Their Probationary Period By Quarter
FY15 FY16
58.0% 58.0%
68.0% 68.0%
52%
54%
56%
58%
60%
62%
64%
66%
68%
70%
FY12 FY13 FY14 FY15
Employees Who Successfully Completed Their Probationary Period
$11.6
$9.5 $9.7$10.4$10.9
$8.1
$6.6
$0.0
$2.0
$4.0
$6.0
$8.0
$10.0
$12.0
$14.0
Q1 Q2 Q3 Q4
Millions
Overtime Cost
FY15 FY16
475.6
390.1 396.6423.7
446.0 461.5
362.9
0
100
200
300
400
500
Q1 Q2 Q3 Q4
Thousands
Overtime Usage
FY15 FY16

P a g e | 10
3rdQuarterTop20AgenciesOvertimeCostandUsageAgency Number of Hours CostNewMexicoCorrectionsDepartment 162,702 $2,728,299
DepartmentofHealth 82,363 $1,309,599
DepartmentofTransportation 40,344 $769,681
Children,Youth&FamiliesDepartment 35,878 $703,800
MinersColfaxMedicalCenter 5,8883 $199,368
DepartmentofPublicSafety 6,730 $150,779
Taxation&RevenueDepartment 3,893 $85,680
DepartmentofGame&Fish 3,037 $73,553
Energy,Minerals&NaturalResourcesDepartment 2,741 $67,069
DepartmentofVocationalRehabilitation 2,107 $48,404
DepartmentofInformationTechnology 1,543 $36,830
DepartmentofWorkforceSolutions 1,288 $33,059
PublicEducationDepartment 963 $32,410
HomelandSecurity&EmergencyManagement 1,180 $30,576
MilitaryAffairs 1,163 $22,798
GeneralServicesDepartment 1,111 $21,713
DepartmentofEnvironment 604 $19,172
HumanServicesDepartment 920 $19,120
DepartmentofCulturalAffairs 1,047 $18,336
EducationalRetirementBoard 815 $17,601
OTHER 356,328 $6,387,856
TOTAL 6,650 $168,329
Grand Total 362,978 $6,556,185
15.915.0
15.7 15.516.3
17.3
14.6
0
2
4
6
8
10
12
14
16
18
20
Q1 Q2 Q3 Q4
Monthly Average Number of Overtime Hours Worked Per Employee
FY15 FY16
18.2%
15.9%
15.3%
16.6%
17.2%
16.7%
15.6%
13%
14%
15%
16%
17%
18%
Q1 Q2 Q3 Q4
Average Percentage of Employee Receiving Overtime Per Month
FY15 FY16
P a g e | 11
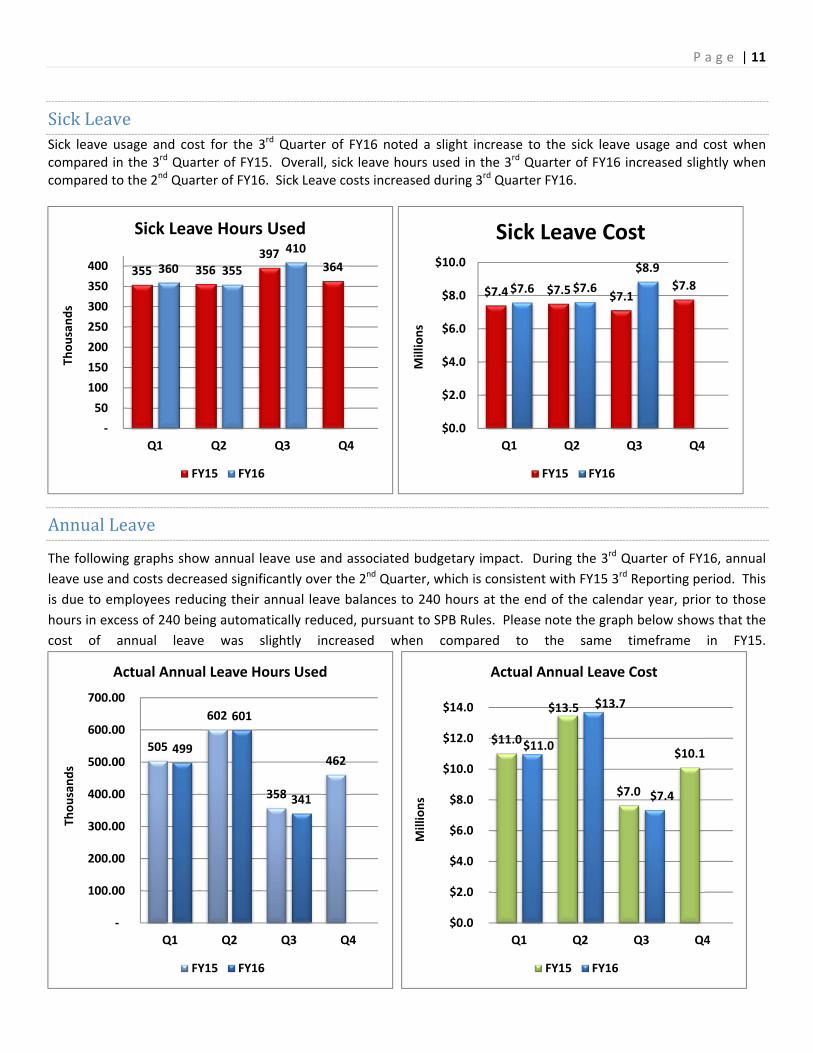
SickLeaveSick leave usage and cost for the 3rd Quarter of FY16 noted a slight increase to the sick leave usage and cost when compared in the 3rd Quarter of FY15. Overall, sick leave hours used in the 3rd Quarter of FY16 increased slightly when compared to the 2nd Quarter of FY16. Sick Leave costs increased during 3rd Quarter FY16.
AnnualLeave
The following graphs show annual leave use and associated budgetary impact. During the 3rd Quarter of FY16, annual
leave use and costs decreased significantly over the 2nd Quarter, which is consistent with FY15 3rd Reporting period. This
is due to employees reducing their annual leave balances to 240 hours at the end of the calendar year, prior to those
hours in excess of 240 being automatically reduced, pursuant to SPB Rules. Please note the graph below shows that the
cost of annual leave was slightly increased when compared to the same timeframe in FY15.
355 356397
364360 355
410
‐
50
100
150
200
250
300
350
400
Q1 Q2 Q3 Q4
Thousands
Sick Leave Hours Used
FY15 FY16
$7.4 $7.5 $7.1$7.8$7.6 $7.6
$8.9
$0.0
$2.0
$4.0
$6.0
$8.0
$10.0
Q1 Q2 Q3 Q4
Millions
Sick Leave Cost
FY15 FY16
505
602
358
462499
601
341
‐
100.00
200.00
300.00
400.00
500.00
600.00
700.00
Q1 Q2 Q3 Q4
Thousands
Actual Annual Leave Hours Used
FY15 FY16
$11.0
$13.5
$7.0
$10.1$11.0
$13.7
$7.4
$0.0
$2.0
$4.0
$6.0
$8.0
$10.0
$12.0
$14.0
Q1 Q2 Q3 Q4
Millions
Actual Annual Leave Cost
FY15 FY16

P a g e | 12
ClassifiedServiceRecruitmentTrends The Career Services Division’s primary responsibility is to ensure compliance with the State Personnel Act and the SPB
Rules that require the “certification of the highest standing candidates to prospective employers.” See NMSA 1978, § 10‐
9‐13(F). Since November 2011, when the NEOGOV application system for managing recruitment for all classified
positions was initiated, there has been an increase in both job advertisements and applications received. The graphic
below illustrates the standard process.
StepsFollowedOnceanApplicantAppliesforaPosition

P a g e | 13
SPO continues to work with agencies on improving the quality of their advertisements, in order to strengthen their
applicant pool. This requires agency HR professionals to work closely with hiring managers to obtain critical information
regarding the position being advertised. The result is a customized advertisement that provides applicants with clear
qualification requirements and preferences. The first example below is a supplemental question that is broader
compared to the second example, which is customized to address specific experience obtained.
ExampleofTargetedApplicationsDevelopedwithAgencies
EXAMPLE1
How many years of experience do you haverelatedtothepurposeofthisposition?
o None
o 3monthsofexperience
o 6monthsofexperience
o 1yearofexperience
o 2yearsofexperience
o 3yearsofexperience
o 4yearsofexperience
o 5yearsofexperience
o 6yearsofexperience
o 7yearsofexperience
o 8yearsofexperience
o 9yearsofexperience
o 10yearsofexperience
EXAMPLE2
Howmany years of experience do you have inbudgetdevelopmentforagovernmentalagency?
o 0‐1yearofexperience
o 2‐5yearsofexperience
o 6‐9yearsofexperience
o 10ormoreyearsofexperience
Agencies have begun to use this targeted form of advertising, in order to provide the potential applicant with the most
accurate description of the responsibilities of the position, including the specific education and experience preferred by
the hiring agency. Applicants who have a thorough understanding of the position can make an informed decision
regarding whether they should apply for a position. In return, hiring managers will have an applicant list that is more
reflective of the specific needs of the position.
ContinuousAdvertisements A continuous advertisement is used when an agency has a hard to fill position and will benefit from an advertisement
that remains open until the position is filled. Continuous advertisements are beneficial because they allow an agency to
receive a steady flow of applicants. Some positions are difficult to fill because of their geographic location, challenging
job duties, a need for specific expertise, or the need for a large number of workers without the population to fill them.
Approximately 47% of continuous advertisements were for positions in a health related field, or for Child Protective
Services Case Workers.
Driven,focusedquestionsbasedonspecificposition
needs.
General,notspecifictothejobbeingadvertised.

P a g e | 14
Applications
The total views of posted applications have increased since 2012, as seen below. Since 2012, posted advertisements on
NEOGOV have been viewed over 13 million times. There have been 469,676 views this quarter.
TotalViewsonPostedAdvertisementsbyFiscalYearFY12 FY13 FY14 FY15 FY16 YTD
2,286,916 3,645,209 4,079,561 3,326,579 1,650,974
33%
25%
22%
3%7%
7%3%
FY16 3rd Quarter Continuous Job Postings
All other
Social Work/Child Assistance
Healthcare
Business & Financial
Corrections/Public Safety
Engineering
IT
FY11 FY12 FY13 FY14 FY15 FY16YTD
Applications 125,670 200,758 206,740 246,616 206,702 145,205
Postings 3,439 4,725 5,652 6,437 6,208 3,913
0
1,000
2,000
3,000
4,000
5,000
6,000
7,000
0
50,000
100,000
150,000
200,000
250,000
300,000
Job Postings & Applications Received‐FY11 to FY16

P a g e | 15
The number of applications received represents any applicant who applied for a position during the quarter. The
quarterly postings represent any advertisement with a start date that initiated during the quarter. Currently, as
illustrated below, six agencies represent 65% of all jobs advertised this quarter.
54,677
45,598
52,065
54,36253,174
48,415
43,616
40,000
42,000
44,000
46,000
48,000
50,000
52,000
54,000
56,000
Q1 Q2 Q3 Q4
Applications Received
FY15 FY16
Department of Health19%
Department of Transportation
14%
Human Services Department
9%
New Mexico Corrections Department
9%
Children, Youth & Families Department
8%
Energy, Minerals & Natural Resources
Department6%
All other 35%
FY16 3rd Quarter Postings by Agency

P a g e | 16
3rdQuarterTop20HighestPostingAgencies
Agency Advertisements Views Applications Received
DepartmentofHealth 211 66,547 4,893
DepartmentofTransportation 147 43,160 2,832
HumanServicesDepartment 99 50,038 4,920
NewMexicoCorrectionsDepartment 94 36,960 2,709
Children,Youth&FamiliesDepartment 88 62,358 4,804
Energy,Minerals&NaturalResourcesDepartment 67 20,608 1,309
Taxation&RevenueDepartment 49 19,589 2,079
MinersColfaxMedicalCenter 27 2,887 192
DepartmentofEnvironment 25 13,195 590
DepartmentofPublicSafety 21 12,302 904
StateLandOffice 21 12,579 879
DepartmentofWorkforceSolutions 19 13,641 1,062
DepartmentofGame&Fish 18 12,454 606
OfficeoftheStateEngineer 18 6,309 349
PublicEducationDepartment 18 12,827 533
PublicRegulationCommission 16 7,442 631
Aging&Long‐TermServicesDepartment 15 8,456 457
DepartmentofVocationalRehabilitation 13 5,998 417
GeneralServicesDepartment 11 4,500 345
HomelandSecurity&EmergencyManagement 10 6,031 332
Total 987 417,881 30,843
AverageDaystoFillaPositionbyAnswerDatebyAgencyA number of factors impact the average number of days to fill a position. SPO continues to actively work with State agencies to decrease the amount of time being taken to review and refer applications. Accordingly, the time has decreased significantly since NEOGOV implementation. The time to interview and process a hire at the agency level is currently 46.3 days. Please note that the period of time taken to interview and process a hire at the agency level, “Average Refer to Answer,” is the most significant portion of the hiring process.
Data reported is as of 03/2016.
Data excludes Continuous Postings (Advertised 30 days or more).
Data for days advertised, referred, and referral to hire are tied to the quarter in which the hire occurred.
15.3 7.7
46.3
69.3
0
20
40
60
80
Average days to Advertise Average days to Refer Average Refer to Answer Average Total Days
Average Days to Fill a PositionReporting from Advertisement Start Date to Acceptance of Offer Letter

P a g e | 17
Data does not include hires that have not been entered in NEOGOV.
In order to decrease the time taken to interview and process a hire, SPO has made the following recommendations to hiring agencies:
Upon receipt of the list of referred applicants, the hiring manager should review the list within three business days, to ensure they have an adequate pool to interview from, and to ensure that they do not need additional applicants; and,
The agency should conduct interviews within two weeks of receiving the referred list of applicants.
SPO provides the agency HR Manager with ongoing reports to inform them of any outstanding advertisements that have not been filled or closed out within NEOGOV. Factors exist that may impact the time to fill, such as required background checks; however, by working on the recommendations outlined above, there have been positive changes with the time agencies are taking to fill positions.
How to interpret the graphs below:
Average Days a Job is Advertised: The average amount of time a job (excluding continuous postings) is advertised on NEOGOV.
Average Days to Refer Top Ranked Applicants to Hiring Manager: The average amount of time taken by HR professionals to review the top ranked applicants and forward them to the Hiring Manager for review.
Average Days from Applicant Referral to Job Offer Acceptance Date: The average amount of time taken for an agency to interview, process hire paperwork, and receive an acceptance of offer from the top candidate.
Average Sum of Days to Fill a Position Across all Agencies: The sum of time between the first day a job is advertised to the selected candidate accepting the position.
*Please note data depicted in the following graphs may include multiple hires from single advertisements.
8.1 8.28.8
7.47.58.0
7.7
0
1
2
3
4
5
6
7
8
9
Q1 Q2 Q3 Q4
Average Days to Process and Refer Applications
2015
2016

P a g e | 18 Average Days to Fill a Position by Answer Date (Graph 1 of 2)

P a g e | 19 Average Days to Fill a Position by Answer Date (Graph 2 of 2)

P a g e | 20
ClassifiedService HiresandSeparationsIn FY15, 2,778 positions in the State’s Classified Service were filled. This is directly attributed to continued efforts to fill and properly classify vacant, budgeted positions. The high number of hires has created a positive impact on the delivery of services and improved employee morale throughout State government.
The State’s hiring activity has increased since FY11, by 130%; however, this effort has only offset the increased separations of State employees.
NewEmployeeHiresbyFiscalYear(FY11‐FY15)
FY16NewEmployeeHiresandSeparationsbyQuarter
2,153 2,332
2,962 2,858
2,625
1,205
2,193
3,090 3,227
2,778
‐
500
1,000
1,500
2,000
2,500
3,000
3,500
FY11 FY12 FY13 FY14 FY15
Classified Hires and Separations by Fiscal Year
Separations
Hires
746
631
751650
817
608
737
0
200
400
600
800
1,000
Q1 Q2 Q3 Q4
New Hires By Quarter Fiscal Year Comparison
FY15 FY16NOTE: Hires represent only new hires and do not include
transfers or promotions of state employees
762
613567
683702664
761
0
100
200
300
400
500
600
700
800
900
Q1 Q2 Q3 Q4
Separations By Quarter
FY15 FY16

P a g e | 21
The graph above shows the separation rate of classified employees as a percentage of the total Classified Service population. Of the 761 separations this quarter, 3.7% were voluntary, and 0.6% were involuntary.
Separation numbers represent classified employees who have separated or retired from State government or switched to a different salary plan.
NewHireCompa‐RatioThe Compa‐Ratio of newly hired employees, in many situations, is above the minimum of the pay band. Without adjusting entry level pay rates within the existing salary plan, it is difficult for the State to compete in the labor market; therefore, State agencies hire at rates in excess of the minimum of the pay band to attract qualified applicants. Agencies are applying the concepts and principles of “appropriate placement” to properly set employee pay relative to other employees in the same classification within the work unit. As a result, tenured employees are not progressing through the pay range. Accordingly, non‐adjustment of the salary plan is a factor in employee turnover, and makes attracting well‐qualified applicants difficult. SPO, with the Legislature, has budgeted current appropriations for vacant positions at mid‐point levels, rather than entry level, as has been previous practice.
Q1 Q2 Q3 Q4
Voluntary 506 374 451
Retirement 112 213 197
Involuntary 84 77 112
RIF 0 0 1
0
100
200
300
400
500
600
Classified Separation Reason
3.5% 3.3% 3.7%
0.5% 0.4% 0.6%
0.0%
2.0%
4.0%
6.0%
8.0%
10.0%
Q1 Q2 Q3 Q4
Percent of the Total Classified Employee Population Leaving State Service Voluntarily and Involuntarily
Voluntary Involuntary

P a g e | 22
QuarterlyNewEmployeeHireCompa‐RatiobyPayBand
Pay Band Average Compa-Ratio # of Employees
25 85.9% 21
30 96.0% 57
35 93.6% 33
40 99.0% 54
45 97.2% 55
50 91.0% 93
55 95.0% 78
60 89.5% 130
65 101.5% 73
70 101.8% 48
75 109.5% 35
80 110.3% 33
85 113.6% 18
90 106.4% 2
95 111.5% 3
96 105.1% 2
97 127.0% 1
98 99.9% 1
AverageTotal 97% 737
97% 97% 97%94%
99% 97%98%
0%
20%
40%
60%
80%
100%
120%
Q1 Q2 Q3 Q4
New Hire Compa‐Ratio
FY16 FY15
93.5%
94.4%
96.1% 96.2%
97%
91.0%
92.0%
93.0%
94.0%
95.0%
96.0%
97.0%
98.0%
FY12 FY13 FY14 FY15 FY16 YTD
Average New Hire Compa‐Ratio By Fiscal Year

P a g e | 23
QuarterlyNewEmployeeHireDemographics
Ethnicity Female Male Grand Total % Per Ethnic Group
AfricanAmerican 10 11 21 3%
AmericanIndian 22 11 33 4%
Asian 7 6 13 2%
Caucasian 140 102 242 33%
Hispanic 218 145 363 49%
NotSpecified 37 28 65 9%
GrandTotal 434 303 737 100.0%
%PerGenderGroup 59% 41%
QuarterlyClassifiedEmployeeSeparationsbyReason
Reason Q1
# of Employees Q2
# of Employees Q3
# of Employees Q4
# of Employees
Accepted New Job (Competitor) 20 21 13
Accepted New Job (Non‐Comp) 10 12 11
Attendance 19 18 28
Death 6 9 9
Disability Retirement 6 12 2
Discharge 0 5 4
Dissatisfied w/Work Conditions 3 2 1
Dissatisfied w/Pay 0 1 1
Dissatisfied with Supervision 1 0 0
Early Retirement 5 3 1
End of Appointment 5 1 5
End Temporary Employment 0 0 1
Failed Condition of Employment 6 6 6
Falsified Qualifications 1 1 0
Family Reasons 6 1 1
Health Reasons 4 7 7
Illness in Family 2 1 2
Insubordination 1 2 0
Misconduct 35 30 44
Mutual Consent 1 0 0
No Show Employee 1 0 0
Non Job Connected Medical 2 2 2
Normal Retirement 99 191 188
Other Medical 3 2 4
Personal Reasons 48 36 44
Pregnancy 0 0 2
Quit without Notice 17 26 29
Reduction in Force (RIF) 0 0 1
Relocation 12 5 7
Resignation 353 248 308
Resignation‐Other Position 7 8 9

P a g e | 24
Return to School 9 0 3
Unforeseen Circumstances 2 1 1
Unsatisfactory Performance 13 5 17
Vested Retirement 2 7 6
Violation of Rules 3 1 4
Grand Total 702 664 761
QuarterlyClassifiedEmployeeSeparationsbyAgency
Agency NumberofEmployees
AdministrativeHearingsOffice 1
Aging&Long‐TermServicesDepartment 9
Children,Youth&FamiliesDepartment 80
CommissionfortheDeaf/HardofHearing 1
DepartmentofCulturalAffairs 22
DepartmentofEnvironment 24
DepartmentofFinance&Administration 4
DepartmentofGame&Fish 4
DepartmentofHealth 179
DepartmentofIndianAffairs 1
DepartmentofPublicSafety 16
DepartmentofTransportation 78
DepartmentofVeteranServices 1
DepartmentofInformationTechnology 7
DepartmentofVocationalRehabilitation 9
DepartmentofWorkforceSolutions 20
EconomicDevelopmentDepartment 3
EducationalRetirementBoard 1
Energy,Minerals&NaturalResourcesDepartment 18
GamingControlBoard 1
GeneralServicesDepartment 14
Governor'sComm.onDisability 1
HigherEducationDepartment 2
HomelandSecurity&EmergencyManagement 4
HumanServicesDepartment 76
LivestockBoard 3
MedicalExaminersBoard 1
MilitaryAffairs 9
MinersColfaxMedicalCenter 22
NewMexicoCorrectionsDepartment 63
OfficeoftheStateEngineer 9
PublicEducationDepartment 10

P a g e | 25
Agency NumberofEmployees
PublicEmployeeRetirementAssociation 1
PublicRegulationCommission 4
PublicSchoolInsuranceAuthority 1
Regulation&LicensingDepartment 5
SecretaryofState 4
StateAuditor 2
StateLandOffice 6
StateRacingCommission 1
SuperintendentofInsurance 2
Taxation&RevenueDepartment 37
TourismDepartment 1
WorkersCompensationAdministration 4
GrandTotal 761
StatewideClassifiedTurnoverRateTurnover is attributable to many factors beyond management control such as retirement, transfers, and promotional
opportunity. The turnover rate for FY16 year‐to‐date is 10.7%. The table below reflects classified employee quarterly
turnover rates for promotions, transfers, retirements, and separations for voluntary/involuntary departures.
StatewideClassifiedEmployeeTurnoverRatebyAgency
3rdQuarterStatewideTurnover ReasonsforLeaving Employment
BU Agency #Emp
TotalTurnover%
VoluntaryTurnover%
TotalSeparationActions
Voluntary VoluntaryRetirement
Involuntary
30800 State Auditor 25 20.0% 4.0% 5 1 1 3
33300 Taxation & Revenue Department 894 8.7% 6.8% 78 61 17 0
33700 State Investment Council 18 0.0% 0.0% 0 0 0 0
34000 Administrative Hearings Office 12 16.7% 16.7% 2 2 0 0
34100 Department of Finance & Administration
132 6.1% 2.3% 8 3 5 0
34200 Public School Insurance Authority 7 42.9% 42.9% 3 3 0 0
34300 Retiree Health Care Authority 22 4.5% 4.5% 1 1 0 0
35000 General Services Department 240 8.8% 6.3% 21 15 3 3
35200 Educational Retirement Board 52 11.5% 11.5% 6 6 0 0
36100 Department of Information Technology
156 9.6% 5.8% 15 9 6 0

P a g e | 26
3rdQuarterStatewideTurnover ReasonsforLeaving Employment
BU Agency #Emp
TotalTurnover%
VoluntaryTurnover%
TotalSeparationActions
Voluntary VoluntaryRetirement
Involuntary
36600 Public Employee Retirement Association
72 5.6% 5.6% 4 4 0 0
36900 Commission of Public Records 34 0.0% 0.0% 0 0 0 0
37000 Secretary of State 39 12.8% 5.1% 5 2 1 2
37800 State Personnel Board 43 11.6% 11.6% 5 5 0 0
39400 State Treasurer’s Office 22 0.0% 0.0% 0 0 0 0
40400 Board of Examiners for Architects 3 0.0% 0.0% 0 0 0 0
41700 Border Authority 2 0.0% 0.0% 0 0 0 0
41800 Tourism Department 46 4.3% 4.3% 2 2 0 0
41900 Economic Development Department 36 13.9% 13.9% 5 5 0 0
42000 Regulation & Licensing Department 250 5.6% 4.8% 14 12 1 1
43000 Public Regulation Commission 110 10.9% 10.0% 12 11 0 1
44000 Superintendent of Insurance 88 6.8% 4.5% 6 4 2 0
44600 Medical Board 12 8.3% 0.0% 1 0 0 1
44900 Board of Nursing 18 0.0% 0.0% 0 0 0 0
46000 EXPO New Mexico 16 0.0% 0.0% 0 0 0 0
46400 Board of Licensure for Professional Engineers & Professional Surveyors
4 25.0% 25.0% 1 1 0 0
46500 Gaming Control Board 48 4.2% 4.2% 2 2 0 0
46900 State Racing Commission 10 20.0% 20.0% 2 2 0 0
47900 Board of Veterinary Medicine 2 0.0% 0.0% 0 0 0 0
49500 Spaceport Authority 12 0.0% 0.0% 0 0 0 0
50500 Department of Cultural Affairs 423 6.4% 3.8% 27 16 8 3
50800 Livestock Board 55 5.5% 3.6% 3 2 0 1
51600 Department of Game & Fish 276 3.3% 2.9% 9 8 1 0
52100 Energy, Minerals & Natural Resources Department
370 8.1% 2.7% 30 10 10 0
52200 Youth Conservation Corps 2 0.0% 0.0% 0 0 0 0

P a g e | 27
3rdQuarterStatewideTurnover ReasonsforLeaving Employment
BU Agency #Emp
TotalTurnover%
VoluntaryTurnover%
TotalSeparationActions
Voluntary VoluntaryRetirement
Involuntary
53900 State Land Office 126 12.7% 10.3% 16 13 2 1
55000 Office of the State Engineer 292 10.6% 9.9% 31 29 2 0
60300 Office of African American Affairs 5 0.0% 0.0% 0 0 0 0
60400 Commission for Deaf & Hard of Hearing
14 14.3% 7.1% 2 1 1 0
60600 Commission for the Blind 60 0.0% 0.0% 0 0 0 0
60900 Indian Affairs Department 9 33.3% 33.3% 3 3 0 0
62400 Aging & Long‐Term Services Department
214 8.4% 5.6% 18 12 5 1
63000 Human Services Department 1,705 9.3% 8.4% 159 144 15 10
63100 Department of Workforce Solutions 424 7.8% 5.9% 33 25 4 4
63200 Workers’ Compensation Administration
106 7.5% 5.7% 8 6 1 1
64400 Division of Vocational Rehabilitation 246 8.9% 8.1% 22 20 2 0
64500 Governor's Commission on Disability 14 7.1% 0.0% 1 0 0 1
64700 Developmental Disabilities Planning Council
15 0.0% 0.0% 0 0 0 0
66200 Miners Colfax Medical Center 192 18.2% 14.6% 35 28 1 6
66500 Department of Health 3,197 10.3% 0.9% 329 30 271 28
66700 Department of Environment 540 8.0% 5.6% 43 30 11 2
66800 Office of Natural Resources Trustee 3 0.0% 0.0% 0 0 0 0
67000 Department of Veteran Services 43 7.0% 4.7% 3 2 1 0
69000 Children, Youth & Families Department
1,912 9.2% 7.6% 175 146 1 28
70500 Department of Military Affairs 125 11.2% 7.2% 14 9 2 3
76000 Adult Parole Board 5 0.0% 0.0% 0 0 0 0
77000 Corrections Department 1,815 26.8% 25.1% 486 456 19 11
78000 Crime Victims Reparation Commission
19 0.0% 0.0% 0 0 0 0
79000 Department of Public Safety 395 6.6% 5.6% 26 22 4 0
79500 Homeland Security & Emergency Management
42 16.7% 14.3% 7 6 1 0

P a g e | 28
3rdQuarterStatewideTurnover ReasonsforLeaving Employment
BU Agency #Emp
TotalTurnover%
VoluntaryTurnover%
TotalSeparationActions
Voluntary VoluntaryRetirement
Involuntary
80500 Department of Transportation 2,194 8.2% 1.2% 179 26 138 15
92400 Public Education Department 223 9.0% 8.5% 20 19 1 0
94900 Education Trust Board 2 0.0% 0.0% 0 0 0 0
95000 Higher Education Department 35 14.3% 11.4% 5 4 1 0
Totals 17,523 10.7% 7.0% 1,882 1,218 538 126
PercentTurnoverbyReason 64.7% 28.6% 6.7%
*Thischartincludespromotionsandtransferswithintheclassifiedserviceinadditiontoseparations.
VacancyRatesSPO acknowledges the importance of tracking vacancy data; however, it is difficult to ascertain what positions are
budgeted, versus authorized from the data available. Determining the vacancy rate in each agency is determined from
the DFA FY16 Operating Budget numbers for each agency, since the FY16 General Appropriations Act does not contain
information on authorized versus funded FTE (equivalent employees working full‐time). The Career Services Division and
agencies are working diligently to reduce vacancy rates by accelerating the time it takes to advertise a position to the
time it takes to fill the position.
QuarterlyVacancyRatesfor20KeyAgencies
BusinessUnit
AGENCYNAME Q1 Q2 Q3 Q4
33300 Taxation & Revenue Department 18.4% 18.4% 18.0%
35000 General Services Department 19.2% 16.1% 18.6%
36100 Department of Information Technology 20.5% 23.7% 25.6%
42000 Regulation & Licensing Department 20.0% 19.6% 17.6%
50500 Department of Cultural Affairs 5.7% 8.3% 11.1%
51600 Department of Game & Fish 13.4% 10.7% 9.5%
52100 Energy, Minerals & Natural Resources Department 23.2% 21.5% 23.3%
55000 Office of the State Engineer 16.3% 14.3% 15.4%
62400 Aging & Long‐Term Services Department 12.9% 9.1% 7.4%
63000 Human Services Department 15.7% 15.7% 15.1%
63100 Department of Workforce Solutions 18.3% 20.4% 21.0%
64400 Division of Vocational Rehabilitation 19.9% 16.5% 17.2%
66200 Miners Colfax Medical Center 2.9% 3.1% 4.7%
66500 Department of Health 14.2% 14.8% 14.3%
66700 Department of Environment 14.6% 16.4% 17.0%
69000 Children, Youth & Families Department 16.2% 14.5% 14.7%
77000 New Mexico Corrections Department 23.9% 24.8% 25.3%
79000 Department of Public Safety 17.5% 18.6% 17.8%
80500 Department of Transportation 10.9% 10.7% 11.9%
P a g e | 29
BusinessUnit
AGENCYNAME Q1 Q2 Q3 Q4
92400 Public Education Department 17.7% 14.6% 16.7%
GrandTotal 14.7% 14.4% 15.5%
TrainingThe SPO Training Bureau continues to provide guidance and oversight, in order to ensure State‐wide compliance with
SPB Rules. Specifically, the SPO Training Bureau has revised our Managing Employee Performance (MEP) course, and
has released updated Employee and Supervisor/Manager Evaluation forms, to aid in our compliance efforts.
The SPO Training Bureau is in the process of creating an on‐boarding course for newly hired classified employees that
will include a specialized on‐boarding section for Supervisors and Managers. One of the goals of this project is to design
a course that allows for the interaction among newly hired employees from different State agencies and classifications
to network and learn more on how they are part of a larger State Government. Equally important, is working with new
supervisors and managers on the importance of their role. The objective of the Onboarding program is to provide tools
and knowledge that will help create an effective employee‐manager relationship from the beginning of the employees’
careers.
The SPO Training Bureau is also in the process of creating a course of study for employees who work in the HR field. The
course material will concentrate on the foundation of HR principles, as they relate to working in State Government.
Instructor–LedCoreCurriculumClasses
The SPO Training Bureau delivers professional development in both mandatory and statutory instructor‐led and
eLearning course blocks:
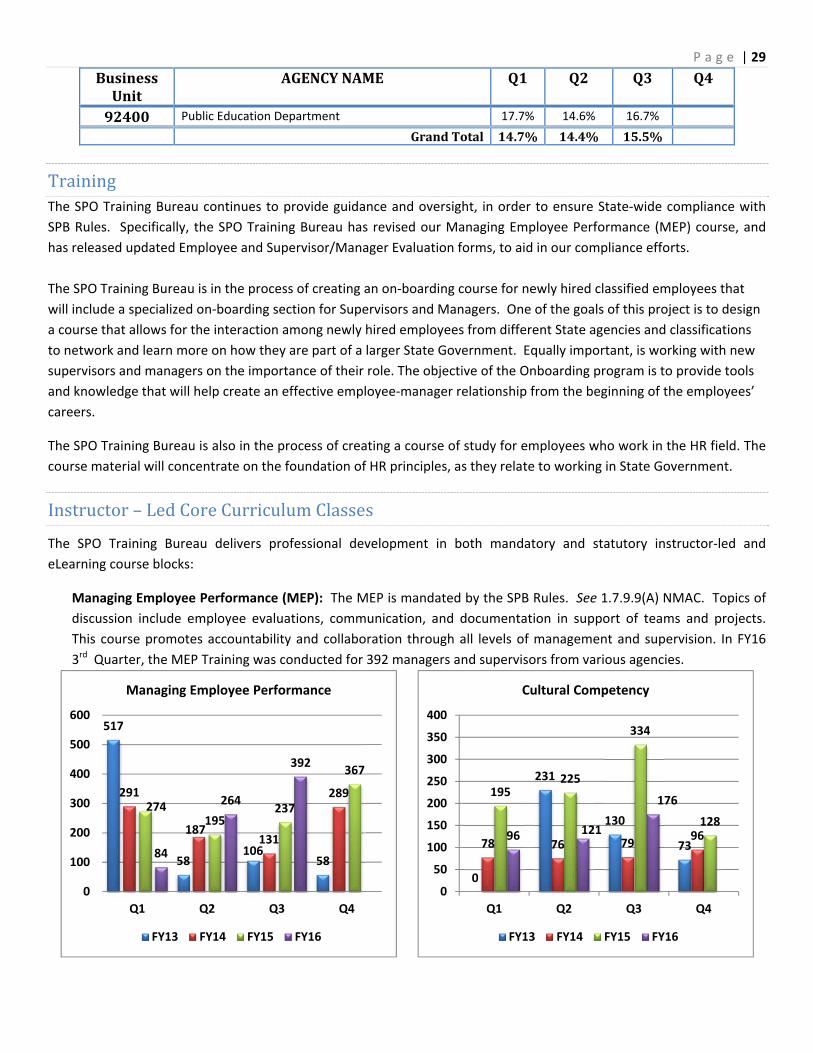
Managing Employee Performance (MEP): The MEP is mandated by the SPB Rules. See 1.7.9.9(A) NMAC. Topics of
discussion include employee evaluations, communication, and documentation in support of teams and projects.
This course promotes accountability and collaboration through all levels of management and supervision. In FY16
3rd Quarter, the MEP Training was conducted for 392 managers and supervisors from various agencies.
517
58106
58
291
187131
289274
195237
367
84
264
392
0
100
200
300
400
500
600
Q1 Q2 Q3 Q4
Managing Employee Performance
FY13 FY14 FY15 FY16
0
231
130
7378 76 7996
195225
334
12896 121
176
0
50
100
150
200
250
300
350
400
Q1 Q2 Q3 Q4
Cultural Competency
FY13 FY14 FY15 FY16
P a g e | 30
Cultural Competency: Pursuant to the State‐Tribal Collaboration Act (STCA), in collaboration with the Indian Affairs
Department (IAD), SPO developed a cultural competency statutory training program to be offered to all State
employees who have ongoing communication with Native American nations, tribes, or pueblos. SPO ensures that
the Cultural Competency training developed in collaboration with IAD remains aligned with the needs of tribal and
State governments. State agency employees are notified of the provisions of the STCA through the SPO Training
bureau and the IAD websites. SPO maintains certification of the number of State employees from each State agency
that have completed the Cultural Competency training. The current Cultural Competency training curriculum
includes:
o An introduction to the unique legal and political status of New Mexico Indian Nations, Pueblos, and
Tribes, with a review of Federal Indian policies and laws;
o An examination of tribal governments and authorities;
o Collaboration and consultation principles and guidance;
o Communication skills; and,
o Cultural competencies and best practices.
In the 3rd Quarter of FY16, 176 employees participated in the Cultural Competency training.
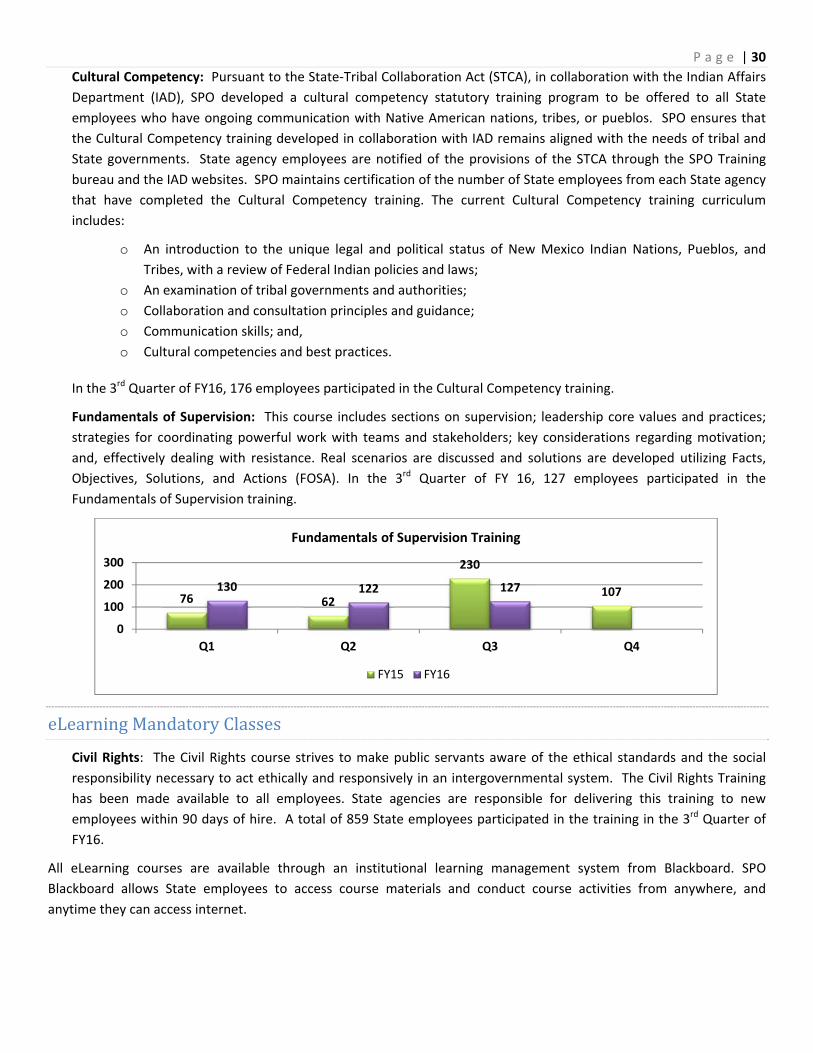
Fundamentals of Supervision: This course includes sections on supervision; leadership core values and practices;
strategies for coordinating powerful work with teams and stakeholders; key considerations regarding motivation;
and, effectively dealing with resistance. Real scenarios are discussed and solutions are developed utilizing Facts,
Objectives, Solutions, and Actions (FOSA). In the 3rd Quarter of FY 16, 127 employees participated in the
Fundamentals of Supervision training.
eLearningMandatoryClasses
Civil Rights: The Civil Rights course strives to make public servants aware of the ethical standards and the social
responsibility necessary to act ethically and responsively in an intergovernmental system. The Civil Rights Training
has been made available to all employees. State agencies are responsible for delivering this training to new
employees within 90 days of hire. A total of 859 State employees participated in the training in the 3rd Quarter of
FY16.
All eLearning courses are available through an institutional learning management system from Blackboard. SPO
Blackboard allows State employees to access course materials and conduct course activities from anywhere, and
anytime they can access internet.
76 62
230
107130 122 127
0
100
200
300
Q1 Q2 Q3 Q4
Fundamentals of Supervision Training
FY15 FY16

P a g e | 31
AdditionalTraining
SHARE Human Capital Management (HCM) Training: The SPO Training Bureau partners with the Department of
Information Technology to manage training offered to State employees who are either new or current users of the
SHARE system. A Subject Matter Expert (SME) conducts the SHARE HCM training. A total of 29 State employees
participated in the training in the 3rd Quarter of FY16.
Adjudication
In compliance with the State Personnel Act, SPO’s Adjudication Division is responsible for conducting administrative
hearings on appeals filed by classified State employees, who have completed their probationary period, and against
whom formal disciplinary action (suspension, demotion, or dismissal) has been taken. Following pre‐hearing discovery
and exchange of information, one of the Division’s two Administrative Law Judges (ALJs) conducts an evidentiary
hearing, at which the State agency imposing the discipline and the appealing employee present evidence and arguments
related to whether there was just cause for the disciplinary action. Following the hearing, the ALJ prepares a written
Recommended Decision for submission to the SPB. A Final Decision is then made by the SPB.
Although District Attorney’s and the Department of Public Safety have their own personnel boards, employees of those
agencies (excluding State Police Officers) may select the SPB to decide appeals of their disciplinary action. Additionally,
if a classified State employee is “separated” from his or her job as a result of injury or illness (on or off the job), the
employee has the right to file an appeal with the SPB and have a hearing on the issue of whether the employee was
409171 327
1422
419 440
859
0
500
1000
1500
Q1 Q2 Q3 Q4
ELearning: Civil Rights Training
FY15 FY16
33
15
322526
0
107 108
45
5 6
2633 29 29
0
20
40
60
80
100
120
Q1 Q2 Q3 Q4
SHARE HCM Training
FY13 FY14 FY15 FY16

P a g e | 32
properly separated from employment. The SPB is also charged with making findings on complaints filed against
Workers’ Compensation Judges and forwarding its findings to the Director of the Workers’ Compensation
Administration. The Adjudication Division conducts evidentiary hearings for the
SPB for these purposes as well.
State classified employees covered by a collective bargaining agreement (CBA)
have the option of choosing an outside arbitrator to decide their disciplinary
appeals. Employee requests for arbitration are provided to SPO’s Labor Relations
Division, which provides notice to the employer and union of the request.
The majority of the Adjudication Division’s hearings are conducted at SPO in Santa Fe. The Adjudication Division will
consider requests for alternative hearing arrangements on a case‐by‐case basis.
Status 1stQtr. 2nd Qtr. 3rd Qtr. 4th Qtr. FY16Total
Appeals Pending 37 36 36 *36
New Appeals Filed 11 17 12 40
Appeal Disposition 38 18 11 67 *indicates rolling number
LaborRelations(LRD)The Labor Relations Division’s (LRD) philosophy is that real success and teamwork is impossible without building
collaborative relationships. In an effort to build a relationship and an environment that creates a teamwork culture with
other state agencies, the LRD has implemented a process in which LRD staff visit all newly hired HR Managers or
Directors, and their staff. One important objective of the visit is to inform the newly hired HR Managers/Director of the
specific ways the LRD can help them. In short, we strongly believe a great relationship is mutually beneficial.
This 3rd Quarter, the LRD began gathering data through its newly created Union Grievance Face to Face (F2F) Action
Research Pilot Project.
The pilot project consists of three (3) steps: 1) Action observation, 2) Best Practices model and 3) onsite
“Group Dynamic” observations. LRD observed nine (9) F2F grievance meetings, gathered the grievances and
agency responses and tracked and reviewed the results of the F2F meetings. LRD will continue to observe F2F
meetings until observations have been conducted to identify performance measurements and analysis data to
further develop and establish a best practice model.
LRD believes that training for supervisors, managers, attorneys and HR Professionals is essential for organizational
development and success. Our training is aimed at helping supervisors, managers, attorneys and HR Professionals
acquire the basic skills to efficiently and effectively perform their job as it relates to union matters including conducting
LRD continues to support supervisors, managers, attorneys and HR Professionals by conducting labor related training.
LRD conducted two (2) LIUE classes during this quarter and a total of 40 managers, supervisors, attorneys and HR
professionals attended the classes. LRD also trained two (2) LIUE Refresher classes. A total of 24 managers, supervisors,
attorneys and HR Professionals attended LIUE Refresher training. LRD also conducted one (1) Workplace Investigations
Trainings (WPI). During this training session supervisors, managers, attorneys and HR Professionals were provided with
the tools to conduct workplace investigations utilizing methods applied by experienced workplace investigators. The
information provided in this course promotes conducting quality, prompt and fair investigations. A total of 14 managers,
supervisors, attorneys and HR Professionals attended WPI training during the 3rd Quarter FY16.
Adjudication reached final
disposition on 11 appeals in the
3rd Quarter of FY16.

P a g e | 33
LaborRelationsDivisionAtAGlancePerformanceMeasuresforFY163rdQtr.
AFSCME CWA
Total number of union grievances filed by each union 29 9
Total number of disciplinary actions appealed to an arbitrator, by each union
7 1
Total number of grievance arbitrations, by each union: 0 2
Average cost paid by the state for arbitrations and disciplinary appeals this quarter
$0.00 (No hearings took place this 3rd Quarter FY16)
Total number of Prohibited Practice Complaints filed by each union 1 0
QuarterlyUnionRepresentedvs.NonUnion
During the 3rd Quarter of the FY16, a total of 38 union grievances were filed. Of the 38 grievance filed, twenty‐ nine (29)
grievances were filed by AFSCME and nine (9) were filed by CWA. Out of the 38 union grievances filed, four (4) were
settled, six (6) were timed out (a.k.a. Dead on Time), two (2) were withdrawn, and 25 of the remaining grievances are
pending.
There were eight (8) disciplinary appeals before an arbitrator invoked by a bargaining unit employee, and/or their union
representative, during the 3rd Quarter. Seven (7) were invoked by AFSCME, and one (1) were invoked by CWA. In
comparison, four (4) bargaining unit employees chose to appeal their discipline to the SPB. Of the four (4) appeals to
State Personnel Board (SPB) three (3) appellants belong to AFSCME and one (1) appellant belongs to CWA.

P a g e | 34
6
14
6
87
98
2
78
4
9
11 11
8
0
2
4
6
8
10
12
14
16
Q1 Q2 Q3 Q4
Number of disciplinary actions (union covered) positions appealing to arbitration
FY13 FY14 FY15 FY16
$0.0
$3.0
$7.4
$.0
$4.4 $4.7
$3.1
$16.7
$0.0
$8.0
$0.0$0.0
$2.0
$4.0
$6.0
$8.0
$10.0
$12.0
$14.0
$16.0
$18.0
Q1 Q2 Q3 Q4
Average Cost Paid by the State for Arbitration
FY13
FY14
FY15
$27.0
$39.7
$3.81
$0.0
$5.0
$10.0
$15.0
$20.0
$25.0
$30.0
$35.0
$40.0
$45.0
FY14 FY15 FY16 Average YTD
Annual Cost Paid by State for Arbitration
141
55
119
154
180
102
58
106101
83
64
0
20
40
60
80
100
120
140
160
180
200
Q1 Q2 Q3 Q4
Number of Employees Attending LIUE Training
FY14 FY15 FY16

P a g e | 35
QuarterlyPerformanceMeasures
FY16ApprovedQuarterlyPerformanceMeasures FY16Targets
Q1 Q2 Q3 Q4 FY16Total
Averagenumberofdaysto fillapositionfrom thedateo f posting 55 64.2 66.7 69.3
Average number of days to fill a position fromadvertisement closure to issue of employment offerletter
40 49 44.0 46.3
Average number of days to advertise a positionfollowingtheagencyrequest 10 5 6 15.3
Percentofemployeeswho successfullycomplete theirprobationaryperiod 75% 69.7% 70.1% 70.1%
Percent of “voluntary” classified employee turnover(leavingStateservice) 15% 3.5% 3.3% 3.7%
Percentof“involuntary” classifiedemployeeturnover(leavingStateservice) 5% 0.5% 0.4% 0.6%
AverageStateemployeesickleaveusagepercapita 24 Hrs. 23.6 Hrs.
23.6 Hrs.
26.2 Hrs.
Stateemployeeaverageovertimeusagepermonth 12 Hrs. 16.3 Hrs.
17.3 Hrs.
15.6 Hrs.
PercentofStateemployeesreceivingovertime 25% 17.2% 16.7% 15.6%
AverageStateclassifiedemployeecompa‐ratio 95% 101.8% 101.9% 102.1%
AverageStateclassifiednewhirecompa‐ratio 91% 97% 97% 97%
Number of disciplinary actions (union coveredpositions)appealingtoarbitrationratherthanto StatePersonnelBoard
40 11 8 8
Average cost paid by State for arbitration ofdisciplinary actions (union covered positions)appealingtoarbitrationratherthantoStatePersonnelBoard
$7,500 $5,918 $5,914 $3,813
State‐wideclassifiedservicevacancyrate 13% 14.7% 14.4% 15.5%
Percent of new hiremanagers and supervisors whosuccessfully complete the management andsupervision trainingsponsoredbythe Statepersonnelofficewithinthreemonthsofdateofhire.
95% 35% 35% 34%
FY16ApprovedAnnualPerformanceMeasure*ThesemeasureswillbereportedonaFYendbasis
FY16Targets
FY16Total
Percentofdepartment/agencieswithover90percentcompletedevaluations95%
Percent of eligible State classified employees with a completed performanceappraisalonrecordatthecloseofthefiscalyear 95%
Numberofrulecomplianceauditreviewsperformedduringthefiscalyear 10 Percentof rule compliance reviewauditexceptions correctedwithin sixmonthsofdiscovery 100%