Embed Size (px)
Citation preview
New Jersey Nurse Workforce
Supply and Demand
A Report to Governor Chris Christie and
the New Jersey State Legislature
December 2015
R NJCCN REPORT TO THE GOVERNOR
Governor’s Bi-annual Report
December 2015
New Jersey Nurse Workforce Supply
& Demand
Edna Cadmus PhD, RN, NEA-BC, FAAN Executive Director
New Jersey Collaborating Center for Nursing 180 University Avenue
Room 238 Newark, NJ 07102
Phone: 973-353-2715 Web: www.njccn.org
Email: [email protected]
1
NJCCN REPORT TO THE GOVERNOR
ABOUT US The New Jersey Collaborating Center for Nursing was established by legislation on December 12, 2002, P.L.2002, c.116 (C.18A:65-90). The Center works on behalf of nurses to provide evidence-based recommendations regarding the nursing workforce and its impact on patient care. The Center is located in Rutgers University, School of Nursing, Newark. We are guided by a 17-member board representing New Jersey nursing and healthcare stakeholders.
VISION To be the dominant voice on nursing workforce solutions for New Jersey citizens.
MISSION • Ensure that competent future oriented, diverse nursing providers are available in sufficient numbers and preparation to meet the demand of the evolving healthcare system in New Jersey • Transform the healthcare system through research and innovative model programs. • Create a central repository for education practice, and research related to nursing workforce. • Engage academic/practice partners, inter-professional colleagues, government and legislative agencies, consumers, business and industry in workforce solutions. • Promote a positive image for nursing.
PURPOSE Purpose of this report is to provide a snapshot of nursing supply and demand in NJ as defined by state reports and national projections. This report is a requirement of the legislation and is to be submitted to the governor every 2 years.
INTRODUCTION Nurses make up the largest health profession in the United States.1 Similarly, nurses are the largest healthcare workforce in NJ. Therefore, it is important to understand the current supply and future demand for nurses in meeting the healthcare needs of the citizens of NJ. There are many factors that impact on supply and demand data. These include: 1)an aging workforce and population in the state, 2) more complex and chronic care management needs, 3)changes in the economy, 4)changes in the healthcare delivery system and 5) a focus on preventative care and care coordination. This data can help guide policy and planning but are not meant to be definitive markers for decision making.
This report is divided into supply and demand data. Recommendations for action are identified at the end of this report.
1 U.S. Department of Labor, Bureau of Labor Statistics. (2012). Occupational Outlook Handbook, 2012-13 Edition. Washington, D.C.: GPO, U.S. Bureau of Labor Statistics. Retrieved from http://www.bls.gov/ooh/healthcare/registered-nurses.htm; http://www.bls.gov/ooh/healthcare/licensed-practical-and-licensed-vocational-nurses.htm
2
R NJCCN REPORT TO THE GOVERNOR
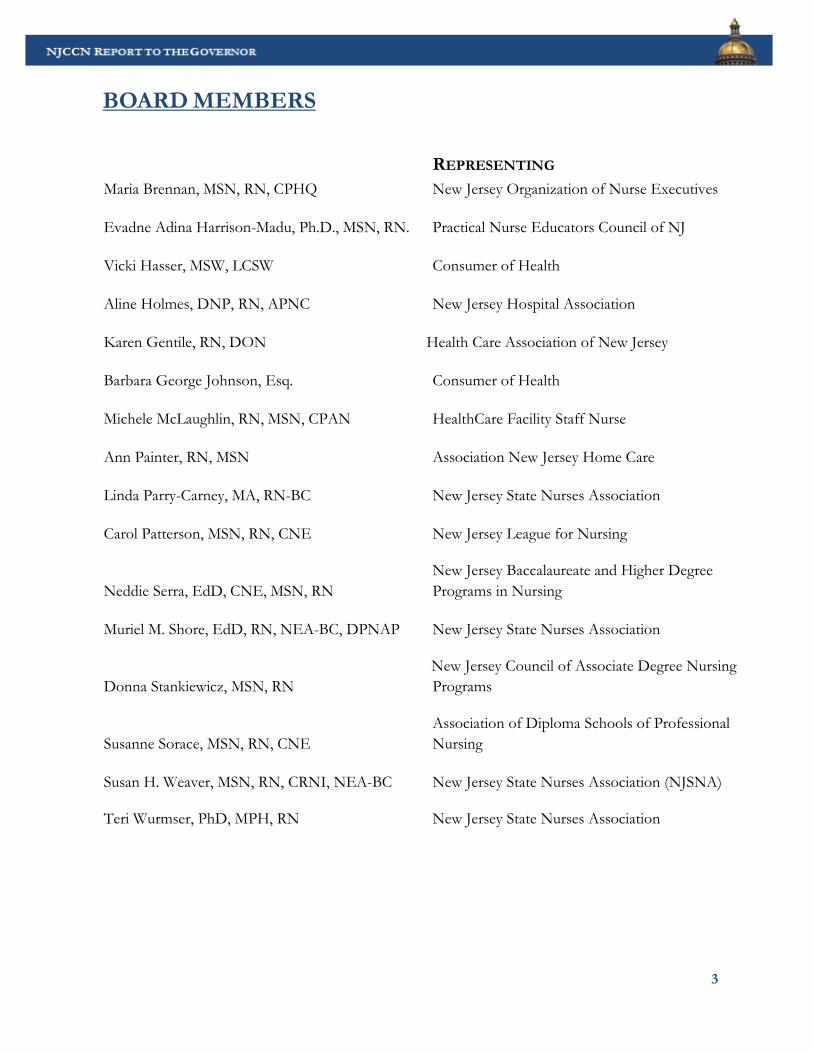
8BOARD MEMBERS
REPRESENTING Maria Brennan, MSN, RN, CPHQ New Jersey Organization of Nurse Executives
Evadne Adina Harrison-Madu, Ph.D., MSN, RN. Practical Nurse Educators Council of NJ
Vicki Hasser, MSW, LCSW Consumer of Health
Aline Holmes, DNP, RN, APNC New Jersey Hospital Association
Karen Gentile, RN, DON Health Care Association of New Jersey
Barbara George Johnson, Esq. Consumer of Health
Michele McLaughlin, RN, MSN, CPAN HealthCare Facility Staff Nurse
Ann Painter, RN, MSN Association New Jersey Home Care
Linda Parry-Carney, MA, RN-BC New Jersey State Nurses Association
Carol Patterson, MSN, RN, CNE New Jersey League for Nursing
Neddie Serra, EdD, CNE, MSN, RN New Jersey Baccalaureate and Higher Degree Programs in Nursing
Muriel M. Shore, EdD, RN, NEA-BC, DPNAP New Jersey State Nurses Association
Donna Stankiewicz, MSN, RN New Jersey Council of Associate Degree Nursing Programs
Susanne Sorace, MSN, RN, CNE Association of Diploma Schools of Professional Nursing
Susan H. Weaver, MSN, RN, CRNI, NEA-BC New Jersey State Nurses Association (NJSNA)
Teri Wurmser, PhD, MPH, RN New Jersey State Nurses Association
3
NJCCN REPORT TO THE GOVERNOR
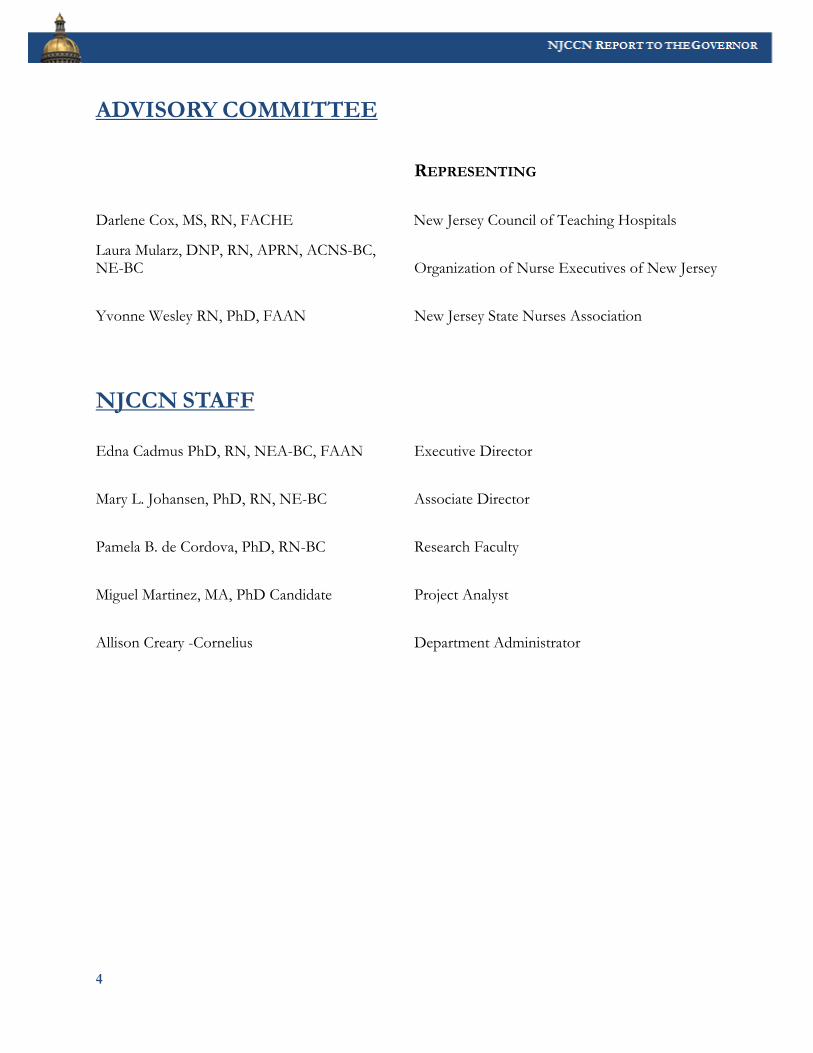
ADVISORY COMMITTEE
NJCCN STAFF
REPRESENTING
Darlene Cox, MS, RN, FACHE New Jersey Council of Teaching Hospitals
Laura Mularz, DNP, RN, APRN, ACNS-BC, NE-BC Organization of Nurse Executives of New Jersey
Yvonne Wesley RN, PhD, FAAN New Jersey State Nurses Association
Edna Cadmus PhD, RN, NEA-BC, FAAN Executive Director
Mary L. Johansen, PhD, RN, NE-BC Associate Director
Pamela B. de Cordova, PhD, RN-BC Research Faculty
Miguel Martinez, MA, PhD Candidate Project Analyst
Allison Creary -Cornelius Department Administrator
4
R NJCCN REPORT TO THE GOVERNOR
TABLE OF CONTENTS
ABOUT US .......................................................................................................................................................................... 2
SECTION 1: CURRENT NEW JERSEY NURSE SUPPLY DATA .................................................................................... 7
A. PRE-LICENSURE EDUCATIONAL PROFILE ....................................................................................................... 7
DEFINITIONS OF PRE-LICENSURE PROGRAMS .................................................................................................... 7
PRE-LICENSURE STUDENT ADMISSION AND GRADUATES .................................................................................... 8
B. POST-LICENSURE EDUCATIONAL PROFILE ................................................................................................... 10
DEFINITIONS OF POST-LICENSURE PROGRAMS ............................................................................................... 10
POST-LICENSURE STUDENTS ENROLLMENT ADMISSION BY PROGRAM TYPE 2013-2014 ........................... 11
C. FACULTY ............................................................................................................................................................... 13
SECTION 2: CURRENT NEW JERSEY NURSE WORKFORCE .................................................................................... 14
A. REGISTERED NURSE (RN) PROFILE ............................................................................................................... 14
B. RN UNEMPLOYMENT DATA ............................................................................................................................ 16
C. LICENSED PRACTICAL NURSE (LPN) PROFILE............................................................................................. 17
D. LPN UNEMPLOYMENT DATA ........................................................................................................................... 19
E. ADVANCED PRACTICE NURSE (APN) PROFILE ........................................................................................... 20
F. APN UNEMPLOYMENT DATA .......................................................................................................................... 22
SECTION 3: NEW JERSEY NURSE DEMAND ............................................................................................................. 23
SECTION 4: RECOMMENDATIONS ............................................................................................................................. 24
A. RECOMMENDATIONS/SOLUTIONS ................................................................................................................. 24
B. SUMMARY ............................................................................................................................................................. 24
LIST OF TABLES .............................................................................................................................................................. 6
LIST OF FIGURES ........................................................................................................................................................... 6
5
NJCCN REPORT TO THE GOVERNOR
LIST OF TABLES LIST OF FIGURES Table 1:Number of Qualified Pre-Licensure Student Applicants by Program Type 2013-2014 ........... 8
Table 2: Pre-Licensure Student Graduates by Program Type 2013-2014 ................................................. 9
Table 3: Post-Licensure Applicants and Admission by Program Type 2013-2014 ................................ 11
Table 4: Post-Licensure Graduates by Program Type 2013-2014 ............................................................ 12
Table 5: Number of FT & PT Nursing Faculty Positions Filled Vacant by Program Type ................. 13
Table 6: Registered Nurse Profile .................................................................................................................. 14
Table 7: RN Employment Profile ................................................................................................................. 14
Table 8: RN Primary & Secondary Setting ................................................................................................... 15
Table 9: RN Intentions Among Unemployed ............................................................................................. 16
Table 10: RN Reasons for Unemployed ....................................................................................................... 16
Table 11 RN Reason for Unemployed ......................................................................................................... 16
Table 12 License Practical Nurse Profile...................................................................................................... 17
Table 13 LPN Employment Profile .............................................................................................................. 17
Table 14: Intentions Among LPNs Unemployed ....................................................................................... 19
Table 15: Reason for LPNs Unemployed .................................................................................................... 19
Table 16: Advanced Practice Nurse .............................................................................................................. 20
Table 17: APN Employment Profile ............................................................................................................ 20
Table 18: APN Primary & Secondary Setting .............................................................................................. 21
Table 19: APN Intentions Among Unemployed ........................................................................................ 22
Table 20: APN Reasons for Unemployed .................................................................................................... 22
Table 21: Baseline & Projected Supply & Demand 2012-2015 ................................................................ 23
LISTOF FIGURES
Figure 1: Pre-licensure Total Enrollment Trends Analysis 2011-2014 ...................................................... 8
Figure 2: Pre-licensure Total Graduates Trend 2011-2014 ......................................................................... 9
Figure 3: Post-licensure Applicants & Admission Trend 2011-2014 ....................................................... 11
Figure 4: Post-licensure Number of Graduates Trend 2011-2014 ........................................................... 12
Figure 5: Full & Part time Faculty Vacancy Rate Trend 2011-2014 ......................................................... 13
8
6
R NJCCN REPORT TO THE GOVERNOR
SECTION 1: CURRENT NEW JERSEY NURSE SUPPLY DATA
A. PRE-LICENSURE EDUCATIONAL PROFILE One of NJCCN’s initiatives is to conduct an annual survey of all the nursing schools approved by the New Jersey State Board of Nursing to measure and monitor student enrollments, graduations and demographics, as well as data on New Jersey nursing school faculty. Inherent in the mission of NJCCN is a focus on increasing the percentage of underrepresented minorities in the nursing workforce. DEFINITIONS OF PRE-LICENSURE PROGRAMS Pre-licensure are those that prepare students for the initial National Council Licensure.
Diploma Program: A program of instruction that requires two to three years of full-time equivalent coursework, usually within a hospital-based structural unit.
ADN Program, Generic: A program of instruction that requires at least two years of full- time
equivalent college academic work generally within a junior or community college. ADN Program, Bridge: A pre-licensure RN associate degree program with a curriculum
sequence for students having some formal training in nursing or a related field. Bridge programs typically accelerate the degree completion for students who are licensed as an LPN or paramedic.
Pre-licensure BSN Program, Generic: A program of instruction to prepare registered nurses
that admits students with no previous nursing education, the completion of which results in a baccalaureate degree.
Pre-licensure BSN Program, Second Degree: A program of instruction to prepare
registered nurses that admits students with baccalaureate degrees in other disciplines and no previous nursing education and, at completion, awards a baccalaureate degree in nursing and eligibility to apply for licensure as an RN.
Pre-licensure MSN Program (Entry MSN): A program of instruction that admits students with
baccalaureate degrees in other disciplines and no previous nursing education. The program prepares graduates for entry into the profession, eligibility to apply for licensure as an RN, and upon completion awards a master's degree.
7
NJCCN REPORT TO THE GOVERNOR
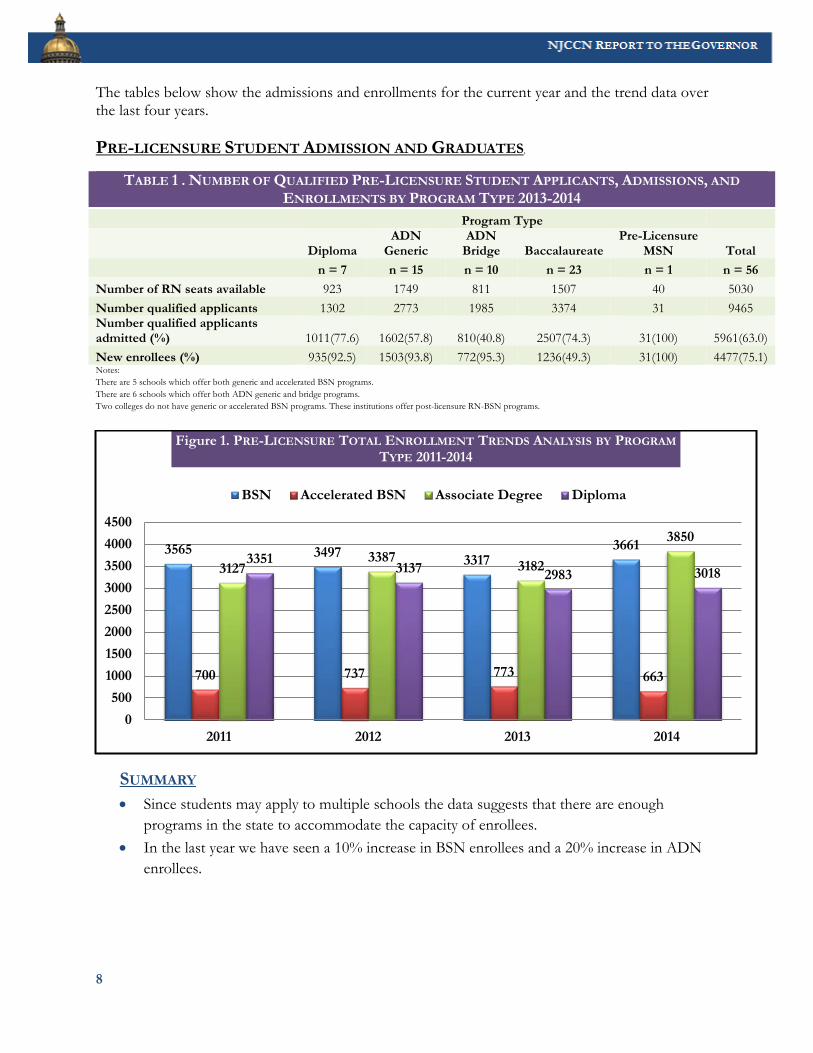
The tables below show the admissions and enrollments for the current year and the trend data over the last four years.
PRE-LICENSURE STUDENT ADMISSION AND GRADUATES,
Notes: There are 5 schools which offer both generic and accelerated BSN programs. There are 6 schools which offer both ADN generic and bridge programs. Two colleges do not have generic or accelerated BSN programs. These institutions offer post-licensure RN-BSN programs.
SUMMARY • Since students may apply to multiple schools the data suggests that there are enough
programs in the state to accommodate the capacity of enrollees. • In the last year we have seen a 10% increase in BSN enrollees and a 20% increase in ADN
enrollees.
3565 3497 3317 3661
700 737 773 663
3127 3387 3182
3850 3351
3137 2983 3018
0500
10001500200025003000350040004500
2011 2012 2013 2014
Figure 1. PRE-LICENSURE TOTAL ENROLLMENT TRENDS ANALYSIS BY PROGRAM TYPE 2011-2014
BSN Accelerated BSN Associate Degree Diploma
TABLE 1 . NUMBER OF QUALIFIED PRE-LICENSURE STUDENT APPLICANTS, ADMISSIONS, AND ENROLLMENTS BY PROGRAM TYPE 2013-2014
Program Type
Diploma
ADN Generic
ADN Bridge Baccalaureate
Pre-Licensure MSN Total
n = 7 n = 15 n = 10 n = 23 n = 1 n = 56
Number of RN seats available 923 1749 811 1507 40 5030 Number qualified applicants 1302 2773 1985 3374 31 9465 Number qualified applicants admitted (%) 1011(77.6) 1602(57.8) 810(40.8) 2507(74.3) 31(100) 5961(63.0) New enrollees (%) 935(92.5) 1503(93.8) 772(95.3) 1236(49.3) 31(100) 4477(75.1)
Table 1:Number of Qualified Pre-Licensure Student Applicants Admissions and Enrollments by
Figure 1: Pre-licensure Total Enrollment Trends Analysis 2011-2014
8
R NJCCN REPORT TO THE GOVERNOR
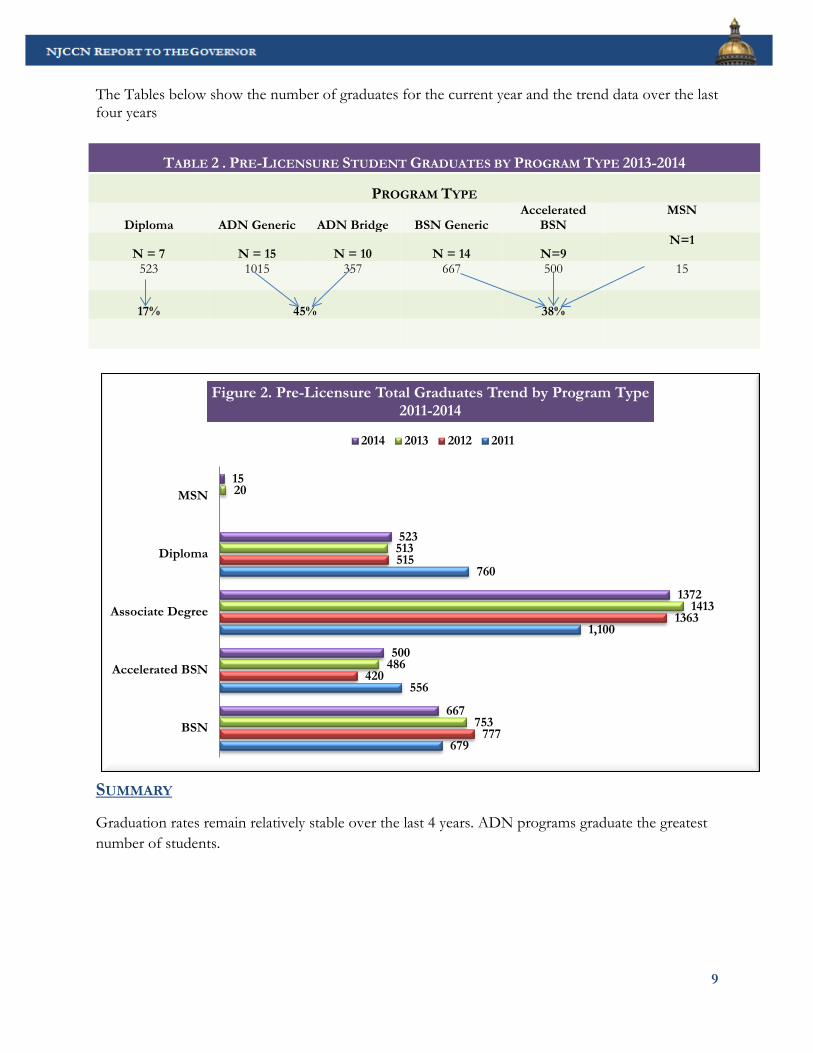
The Tables below show the number of graduates for the current year and the trend data over the last four years
SUMMARY
Graduation rates remain relatively stable over the last 4 years. ADN programs graduate the greatest number of students.
679
556
1,100
760
777
420
1363
515
753
486
1413
513
20
667
500
1372
523
15
BSN
Accelerated BSN
Associate Degree
Diploma
MSN
Figure 2. Pre-Licensure Total Graduates Trend by Program Type 2011-2014
2014 2013 2012 2011
TABLE 2 . PRE-LICENSURE STUDENT GRADUATES BY PROGRAM TYPE 2013-2014
PROGRAM TYPE
Diploma ADN Generic ADN Bridge BSN Generic Accelerated
BSN MSN
N = 7 N = 15 N = 10 N = 14 N=9 N=1
523 1015 357 667 500 15
17% 45% 38%
Table 2: Pre-Licensure Student Graduates by Program Type 2013-2014
Figure 2: Pre-licensure Total Graduates Trend 2011-2014
9
NJCCN REPORT TO THE GOVERNOR
B. POST-LICENSURE EDUCATIONAL PROFILE DEFINITIONS OF POST-LICENSURE PROGRAMS Post-licensure is a program for students who are already licensed as Registered Nurse
Post-licensure BSN Program (RN-BSN Program): A program for students who are already licensed as RNs but whose highest nursing degree is a diploma or associate’s degree. Do not include unlicensed students in these counts.
MSN Program – Clinical Track: A post-licensure master’s program with emphasis on
advanced clinical practice, including Nurse Practitioner, Nurse Anesthetist, Nurse Midwifery, and Clinical Nurse Specialist tracks. If your state collects separate data on different clinical tracks, please combine them.
MSN Program – Non-clinical Track: A post-licensure master’s program with non-clinical
emphasis, such as Nurse Educator and Management/Leadership tracks. If your state collects separate data on different non-clinical tracks, please combine them.
DNP Program: A program of instruction that prepares graduates for the highest level of nursing
practice beyond the initial preparation in the discipline. The doctor of nursing practice degree is the terminal practice degree.*
PhD Program: A post-licensure doctoral program that culminates in the Doctorate of
Philosophy in Nursing.
The goal of the Institute of Medicine (IOM) report the Future of Nursing Leading Change Advancing Health2011 recommendation is to increase BSN prepared nurses to 80% by 2020. Post-licensure data provides a snapshot of the academic progression of nurses in the state. This important in helping to build a pipeline of nurses who can build faculty capacity, drive in leadership roles in transitioning practice and healthcare research.
10
R NJCCN REPORT TO THE GOVERNOR
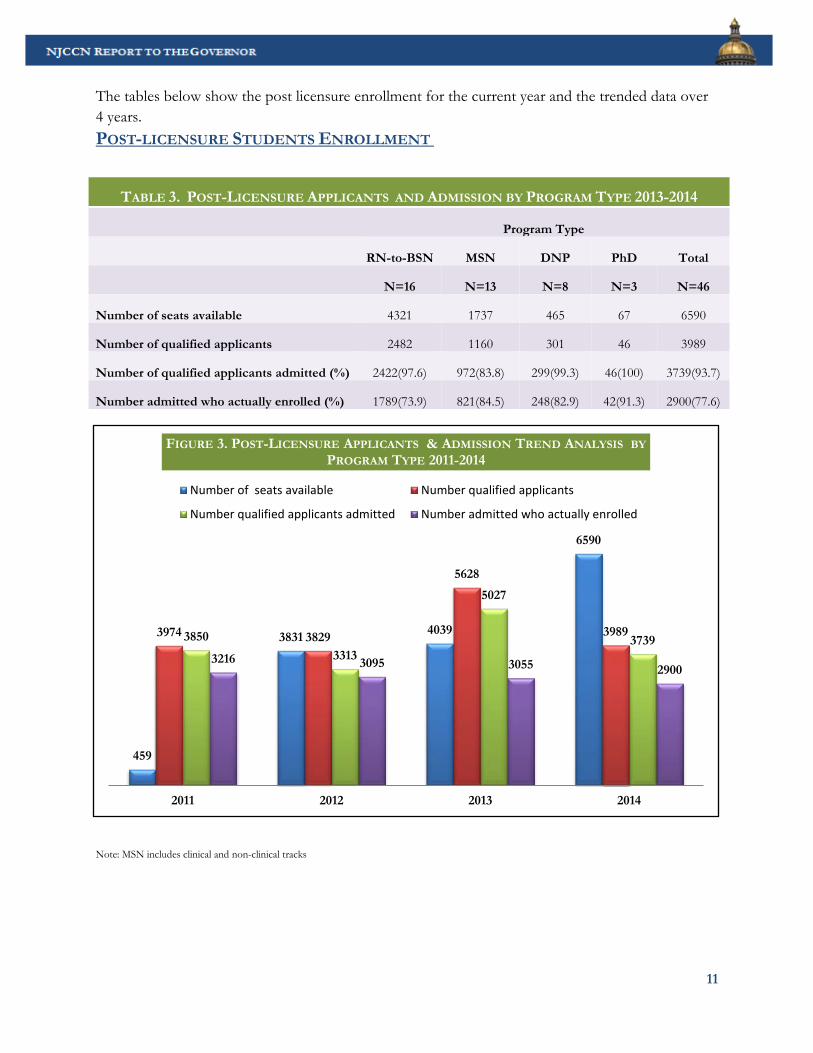
The tables below show the post licensure enrollment for the current year and the trended data over 4 years. POST-LICENSURE STUDENTS ENROLLMENT Admission by Program Type 2013-2014
Note: MSN includes clinical and non-clinical tracks
TABLE 3. POST-LICENSURE APPLICANTS AND ADMISSION BY PROGRAM TYPE 2013-2014
Program Type
RN-to-BSN MSN DNP PhD Total
N=16 N=13 N=8 N=3 N=46
Number of seats available 4321 1737 465 67 6590
Number of qualified applicants 2482 1160 301 46 3989
Number of qualified applicants admitted (%) 2422(97.6) 972(83.8) 299(99.3) 46(100) 3739(93.7)
Number admitted who actually enrolled (%) 1789(73.9) 821(84.5) 248(82.9) 42(91.3) 2900(77.6)
459
3831 4039
6590
3974 3829
5628
3989 3850 3313
5027
3739 3216 3095 3055 2900
2011 2012 2013 2014
FIGURE 3. POST-LICENSURE APPLICANTS & ADMISSION TREND ANALYSIS BY PROGRAM TYPE 2011-2014
Number of seats available Number qualified applicants
Number qualified applicants admitted Number admitted who actually enrolled
Figure 3: Post-licensure Applicants & Admission Trend 2011-2014
11
NJCCN REPORT TO THE GOVERNOR
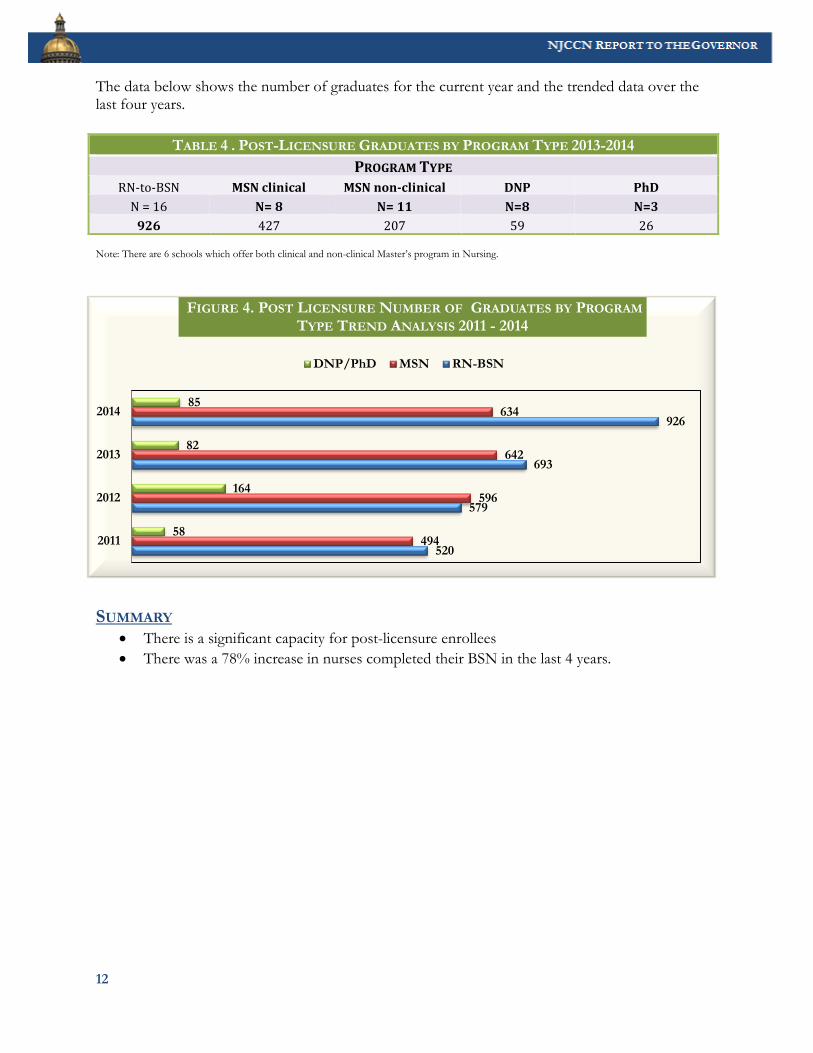
The data below shows the number of graduates for the current year and the trended data over the last four years.
Note: There are 6 schools which offer both clinical and non-clinical Master’s program in Nursing.
SUMMARY • There is a significant capacity for post-licensure enrollees • There was a 78% increase in nurses completed their BSN in the last 4 years.
TABLE 4 . POST-LICENSURE GRADUATES BY PROGRAM TYPE 2013-2014 PROGRAM TYPE
RN-to-BSN MSN clinical MSN non-clinical DNP PhD N = 16 N= 8 N= 11 N=8 N=3
926 427 207 59 26
520
579
693
926
494
596
642
634
58
164
82
85
2011
2012
2013
2014
FIGURE 4. POST LICENSURE NUMBER OF GRADUATES BY PROGRAM TYPE TREND ANALYSIS 2011 - 2014
DNP/PhD MSN RN-BSN
Table 4: Post-Licensure Graduates by Program Type 2013-2014
Figure 4: Post-licensure Number of Graduates Trend 2011-2014
12
R NJCCN REPORT TO THE GOVERNOR
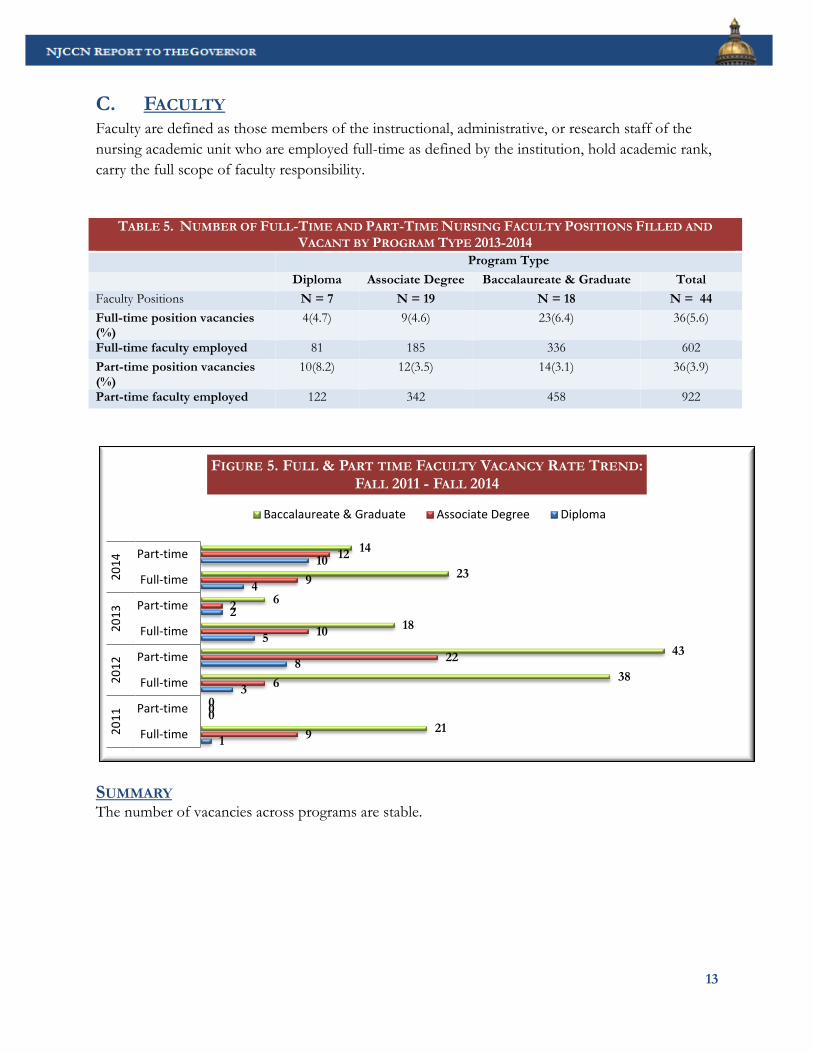
C. FACULTY Faculty are defined as those members of the instructional, administrative, or research staff of the nursing academic unit who are employed full-time as defined by the institution, hold academic rank, carry the full scope of faculty responsibility.
SUMMARY The number of vacancies across programs are stable. Figure
1
0
3
8
5
2
4
10
9
0
6
22
10
2
9
12
21
0
38
43
18
6
23
14
Full-time
Part-time
Full-time
Part-time
Full-time
Part-time
Full-time
Part-time
2011
2012
2013
2014
FIGURE 5. FULL & PART TIME FACULTY VACANCY RATE TREND: FALL 2011 - FALL 2014
Baccalaureate & Graduate Associate Degree Diploma
TABLE 5. NUMBER OF FULL-TIME AND PART-TIME NURSING FACULTY POSITIONS FILLED AND VACANT BY PROGRAM TYPE 2013-2014
Program Type Diploma Associate Degree Baccalaureate & Graduate Total Faculty Positions N = 7 N = 19 N = 18 N = 44 Full-time position vacancies (%)
4(4.7) 9(4.6) 23(6.4) 36(5.6)
Full-time faculty employed 81 185 336 602 Part-time position vacancies (%)
10(8.2) 12(3.5) 14(3.1) 36(3.9)
Part-time faculty employed 122 342 458 922
Table 5: Number of Full Time and Part Time Nursing Faculty Positions Filled and Vacant
Figure 5: Full & Part time Faculty Vacancy Rate Trend 2011-2014
13
NJCCN REPORT TO THE GOVERNOR
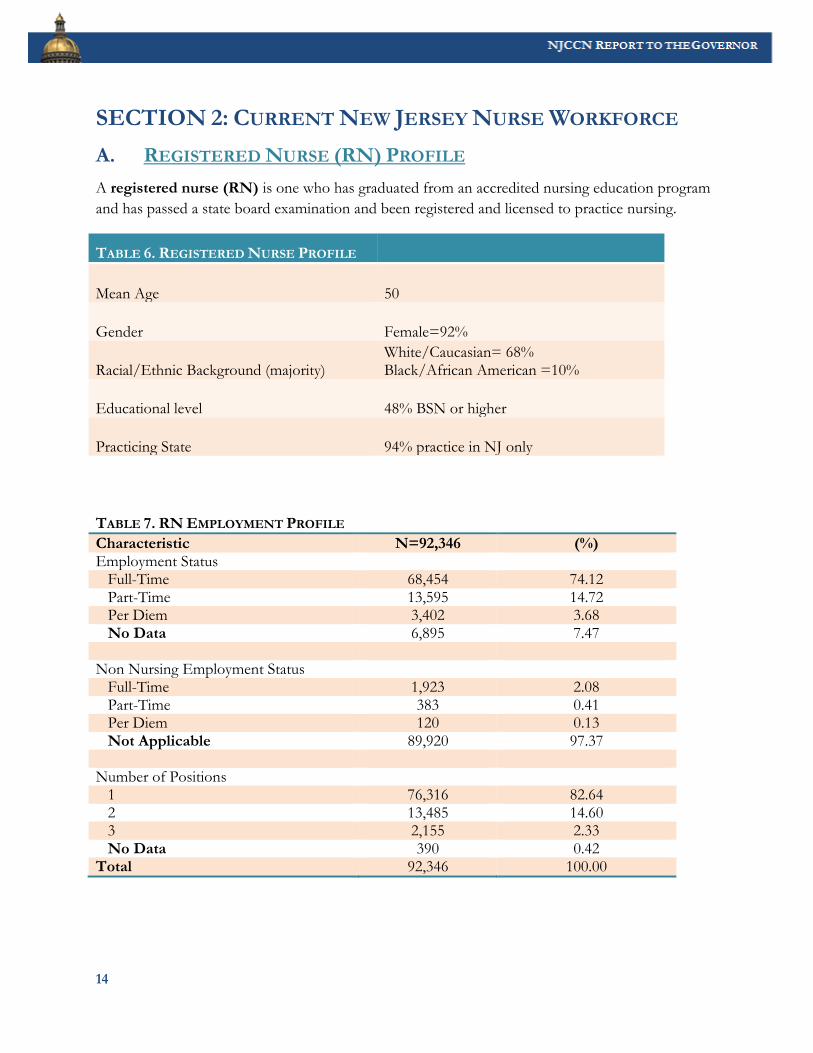
SECTION 2: CURRENT NEW JERSEY NURSE WORKFORCE A. REGISTERED NURSE (RN) PROFILE A registered nurse (RN) is one who has graduated from an accredited nursing education program and has passed a state board examination and been registered and licensed to practice nursing.
TABLE 6. REGISTERED NURSE PROFILE
Mean Age 50
Gender Female=92%
Racial/Ethnic Background (majority) White/Caucasian= 68% Black/African American =10%
Educational level 48% BSN or higher
Practicing State 94% practice in NJ only
TABLE 7. RN EMPLOYMENT PROFILE Characteristic N=92,346 (%) Employment Status Full-Time 68,454 74.12 Part-Time 13,595 14.72 Per Diem 3,402 3.68 No Data 6,895 7.47 Non Nursing Employment Status Full-Time 1,923 2.08 Part-Time 383 0.41 Per Diem 120 0.13 Not Applicable 89,920 97.37 Number of Positions 1 76,316 82.64 2 13,485 14.60 3 2,155 2.33 No Data 390 0.42 Total 92,346 100.00
Table 6: Registered Nurse Profile
Table 7: RN Employment Profile
14
R NJCCN REPORT TO THE GOVERNOR
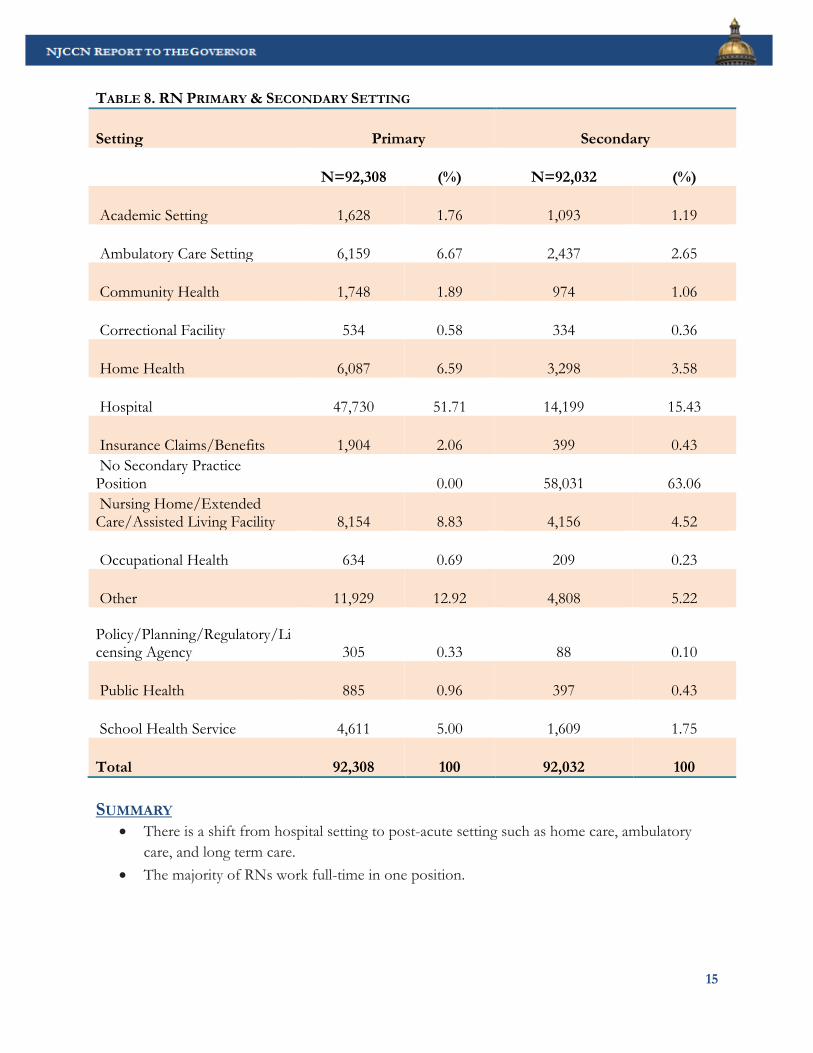
SUMMARY
• There is a shift from hospital setting to post-acute setting such as home care, ambulatory care, and long term care.
• The majority of RNs work full-time in one position.
TABLE 8. RN PRIMARY & SECONDARY SETTING
Setting Primary Secondary
N=92,308 (%) N=92,032 (%)
Academic Setting 1,628 1.76 1,093 1.19
Ambulatory Care Setting 6,159 6.67 2,437 2.65
Community Health 1,748 1.89 974 1.06
Correctional Facility 534 0.58 334 0.36
Home Health 6,087 6.59 3,298 3.58
Hospital 47,730 51.71 14,199 15.43
Insurance Claims/Benefits 1,904 2.06 399 0.43 No Secondary Practice Position 0.00 58,031 63.06 Nursing Home/Extended Care/Assisted Living Facility 8,154 8.83 4,156 4.52
Occupational Health 634 0.69 209 0.23
Other 11,929 12.92 4,808 5.22 Policy/Planning/Regulatory/Licensing Agency 305 0.33 88 0.10
Public Health 885 0.96 397 0.43
School Health Service 4,611 5.00 1,609 1.75
Total 92,308 100 92,032 100
Table 8: RN Primary & Secondary Setting
15
NJCCN REPORT TO THE GOVERNOR
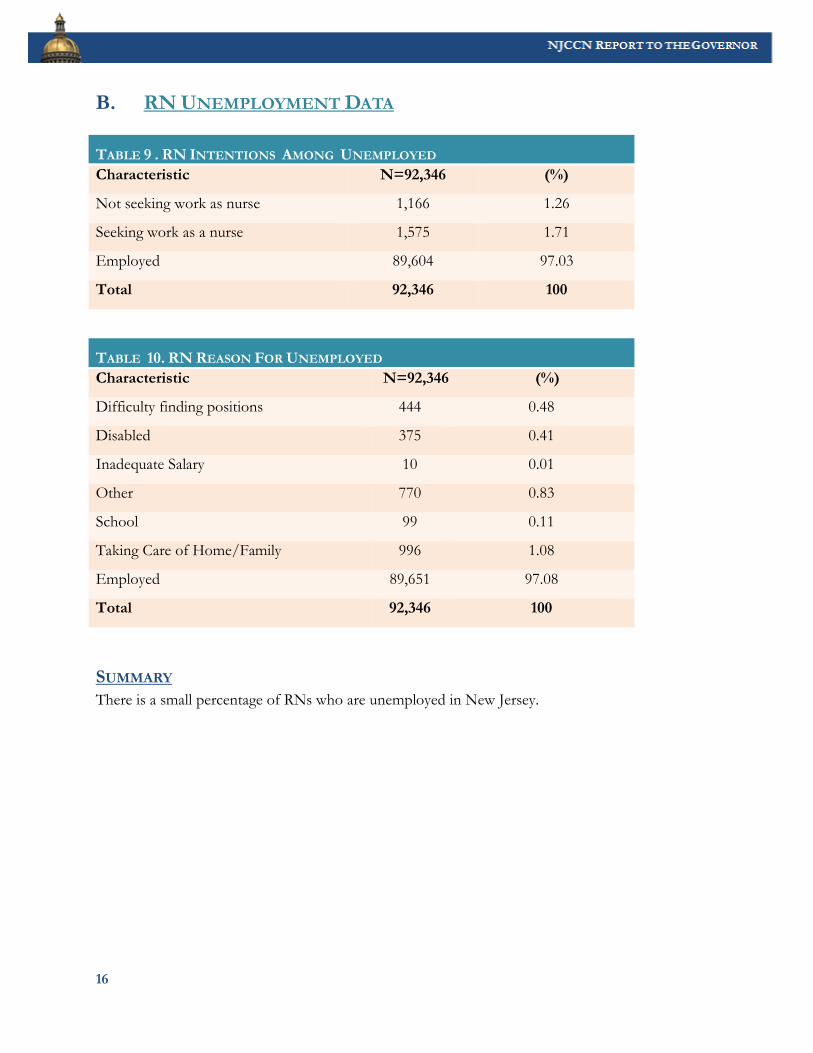
B. RN UNEMPLOYMENT DATA
Table 11 RN Reason for Unemployed
SUMMARY There is a small percentage of RNs who are unemployed in New Jersey.
TABLE 9 . RN INTENTIONS AMONG UNEMPLOYED Characteristic N=92,346 (%)
Not seeking work as nurse 1,166 1.26
Seeking work as a nurse 1,575 1.71
Employed 89,604 97.03
Total 92,346 100
TABLE 10. RN REASON FOR UNEMPLOYED Characteristic N=92,346 (%)
Difficulty finding positions 444 0.48
Disabled 375 0.41
Inadequate Salary 10 0.01
Other 770 0.83
School 99 0.11
Taking Care of Home/Family 996 1.08
Employed 89,651 97.08
Total 92,346 100
Table 9: RN Intentions Among
Table 10: RN Reasons for Unemployed
16
R NJCCN REPORT TO THE GOVERNOR
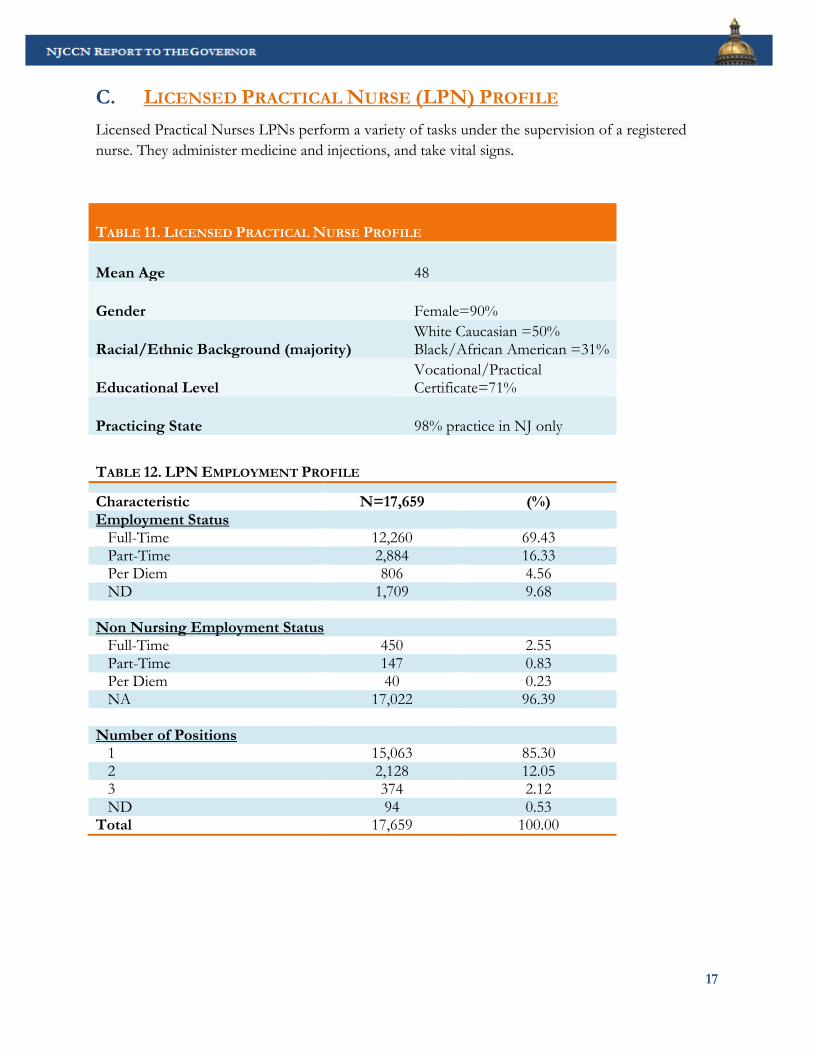
C. LICENSED PRACTICAL NURSE (LPN) PROFILE Licensed Practical Nurses LPNs perform a variety of tasks under the supervision of a registered nurse. They administer medicine and injections, and take vital signs. Table 12 License Practical Nurse Profile
TABLE 11. LICENSED PRACTICAL NURSE PROFILE
Mean Age 48
Gender Female=90%
Racial/Ethnic Background (majority) White Caucasian =50% Black/African American =31%
Educational Level Vocational/Practical Certificate=71%
Practicing State 98% practice in NJ only
Table 13 LPN Employment Profile
TABLE 12. LPN EMPLOYMENT PROFILE Characteristic N=17,659 (%) Employment Status Full-Time 12,260 69.43 Part-Time 2,884 16.33 Per Diem 806 4.56 ND 1,709 9.68 Non Nursing Employment Status Full-Time 450 2.55 Part-Time 147 0.83 Per Diem 40 0.23 NA 17,022 96.39 Number of Positions 1 15,063 85.30 2 2,128 12.05 3 374 2.12 ND 94 0.53 Total 17,659 100.00
17
NJCCN REPORT TO THE GOVERNOR
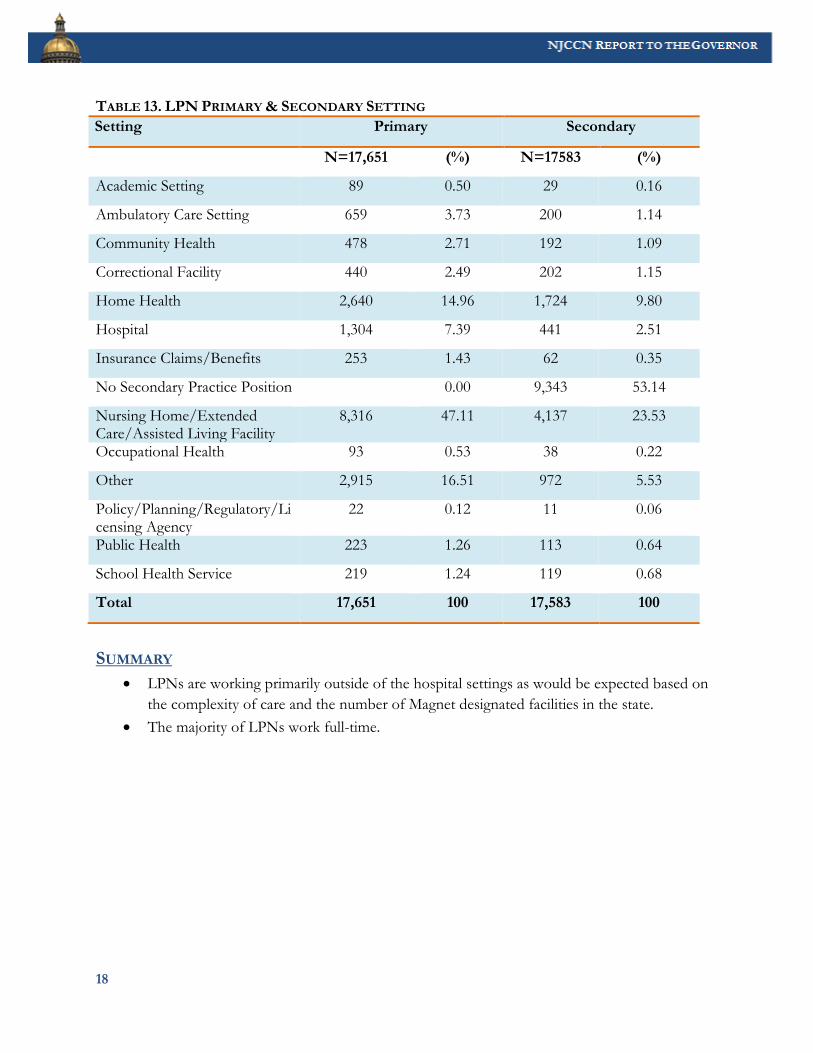
SUMMARY
• LPNs are working primarily outside of the hospital settings as would be expected based on the complexity of care and the number of Magnet designated facilities in the state.
• The majority of LPNs work full-time.
TABLE 13. LPN PRIMARY & SECONDARY SETTING Setting Primary Secondary
N=17,651 (%) N=17583 (%)
Academic Setting 89 0.50 29 0.16
Ambulatory Care Setting 659 3.73 200 1.14
Community Health 478 2.71 192 1.09
Correctional Facility 440 2.49 202 1.15
Home Health 2,640 14.96 1,724 9.80
Hospital 1,304 7.39 441 2.51
Insurance Claims/Benefits 253 1.43 62 0.35
No Secondary Practice Position 0.00 9,343 53.14
Nursing Home/Extended Care/Assisted Living Facility
8,316 47.11 4,137 23.53
Occupational Health 93 0.53 38 0.22
Other 2,915 16.51 972 5.53
Policy/Planning/Regulatory/Licensing Agency
22 0.12 11 0.06
Public Health 223 1.26 113 0.64
School Health Service 219 1.24 119 0.68
Total 17,651 100 17,583 100
18
R NJCCN REPORT TO THE GOVERNOR
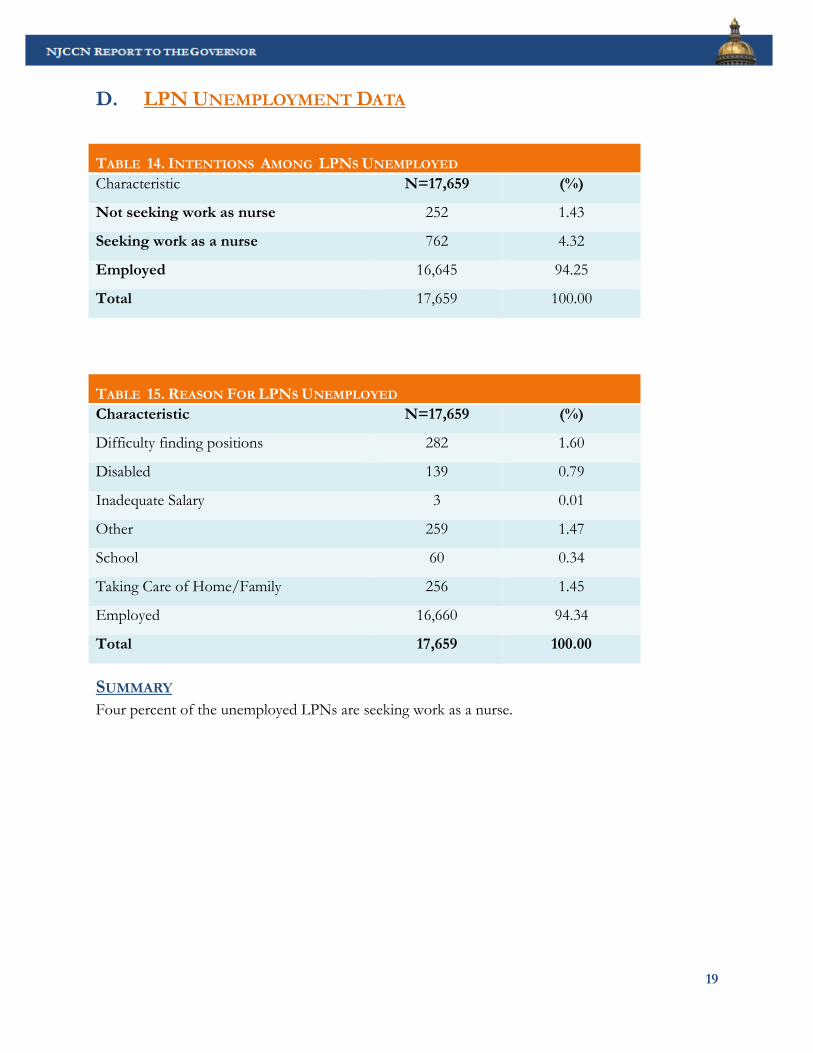
D. LPN UNEMPLOYMENT DATA
SUMMARY Four percent of the unemployed LPNs are seeking work as a nurse.
TABLE 14. INTENTIONS AMONG LPNS UNEMPLOYED Characteristic N=17,659 (%)
Not seeking work as nurse 252 1.43
Seeking work as a nurse 762 4.32
Employed 16,645 94.25
Total 17,659 100.00
TABLE 15. REASON FOR LPNS UNEMPLOYED Characteristic N=17,659 (%)
Difficulty finding positions 282 1.60
Disabled 139 0.79
Inadequate Salary 3 0.01
Other 259 1.47
School 60 0.34
Taking Care of Home/Family 256 1.45
Employed 16,660 94.34
Total 17,659 100.00
Table 14: Intentions Among LPNs Unemployed
Table 15: Reason for LPNs Unemployed
19
NJCCN REPORT TO THE GOVERNOR
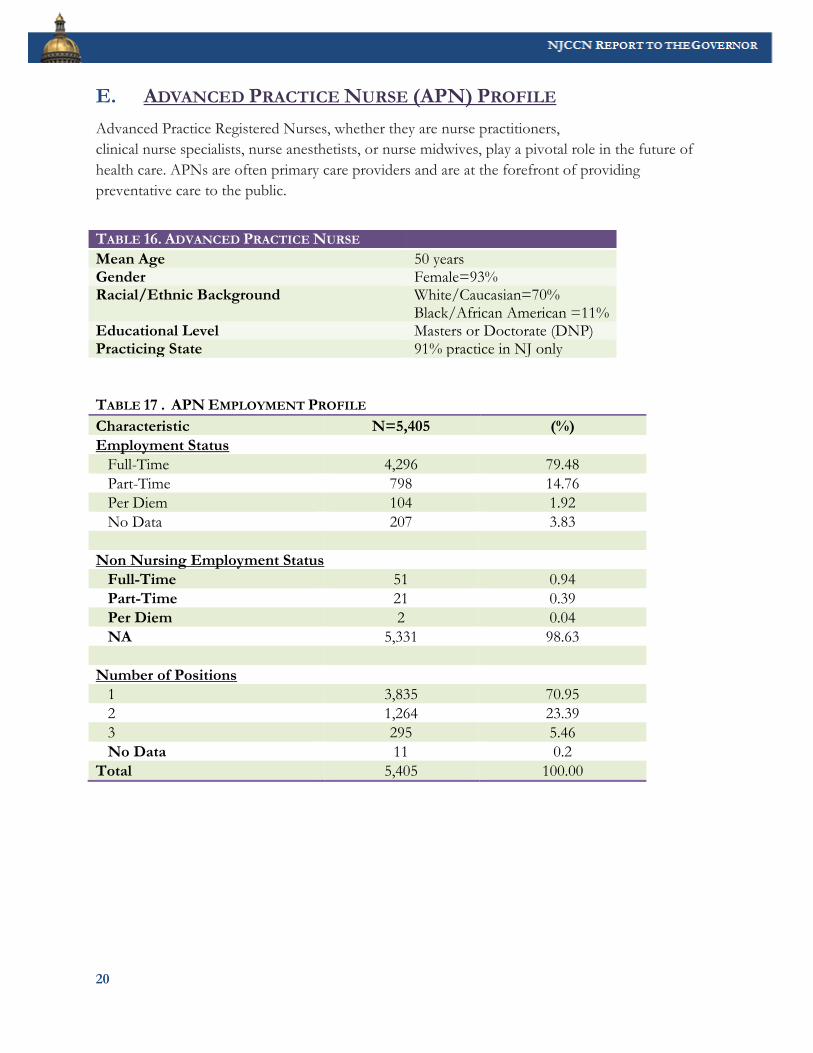
E. ADVANCED PRACTICE NURSE (APN) PROFILE Advanced Practice Registered Nurses, whether they are nurse practitioners, clinical nurse specialists, nurse anesthetists, or nurse midwives, play a pivotal role in the future of health care. APNs are often primary care providers and are at the forefront of providing preventative care to the public.
TABLE 16. ADVANCED PRACTICE NURSE Mean Age 50 years Gender Female=93% Racial/Ethnic Background White/Caucasian=70%
Black/African American =11% Educational Level Masters or Doctorate (DNP) Practicing State 91% practice in NJ only
TABLE 17 . APN EMPLOYMENT PROFILE Characteristic N=5,405 (%) Employment Status Full-Time 4,296 79.48 Part-Time 798 14.76 Per Diem 104 1.92 No Data 207 3.83 Non Nursing Employment Status Full-Time 51 0.94 Part-Time 21 0.39 Per Diem 2 0.04 NA 5,331 98.63 Number of Positions 1 3,835 70.95 2 1,264 23.39 3 295 5.46 No Data 11 0.2 Total 5,405 100.00
Table 16: Advanced Practice Nurse
Table 17: APN Employment Profile
20
R NJCCN REPORT TO THE GOVERNOR
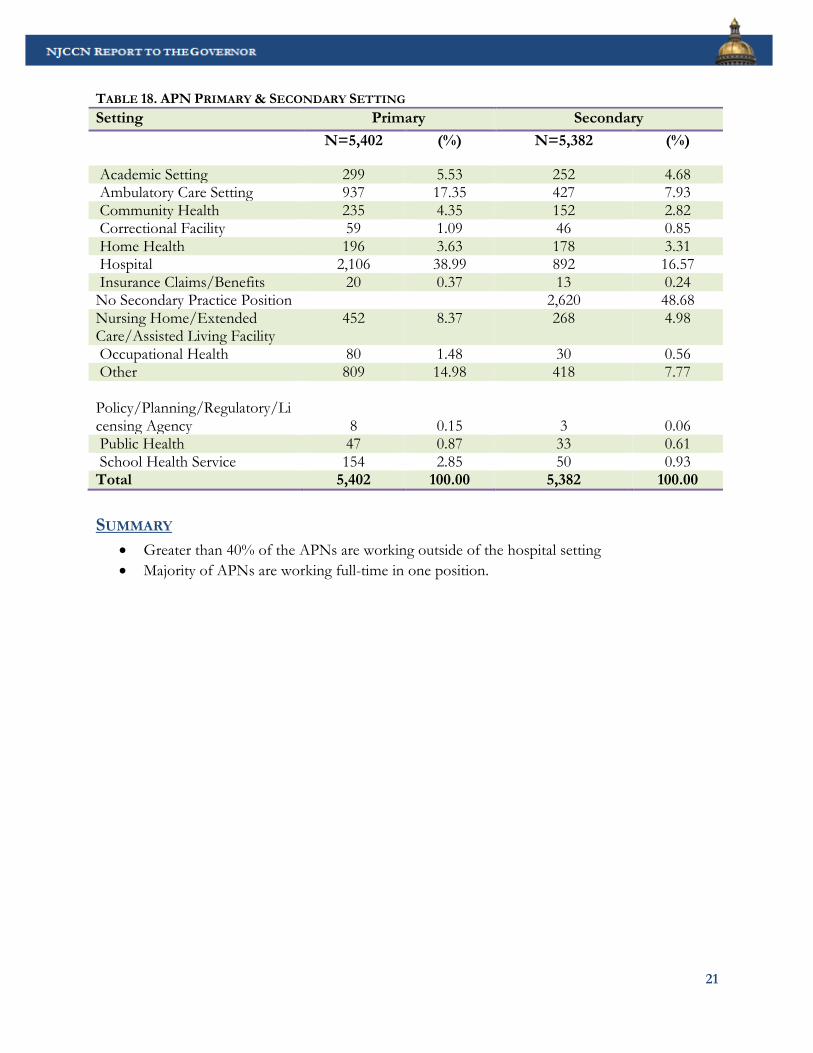
SUMMARY
• Greater than 40% of the APNs are working outside of the hospital setting • Majority of APNs are working full-time in one position.
TABLE 18. APN PRIMARY & SECONDARY SETTING Setting Primary Secondary
N=5,402 (%) N=5,382 (%)
Academic Setting 299 5.53 252 4.68 Ambulatory Care Setting 937 17.35 427 7.93 Community Health 235 4.35 152 2.82 Correctional Facility 59 1.09 46 0.85 Home Health 196 3.63 178 3.31 Hospital 2,106 38.99 892 16.57 Insurance Claims/Benefits 20 0.37 13 0.24 No Secondary Practice Position 2,620 48.68 Nursing Home/Extended Care/Assisted Living Facility
452 8.37 268 4.98
Occupational Health 80 1.48 30 0.56 Other 809 14.98 418 7.77 Policy/Planning/Regulatory/Licensing Agency 8 0.15 3 0.06 Public Health 47 0.87 33 0.61 School Health Service 154 2.85 50 0.93 Total 5,402 100.00 5,382 100.00
Table 18: APN Primary & Secondary Setting
21
NJCCN REPORT TO THE GOVERNOR
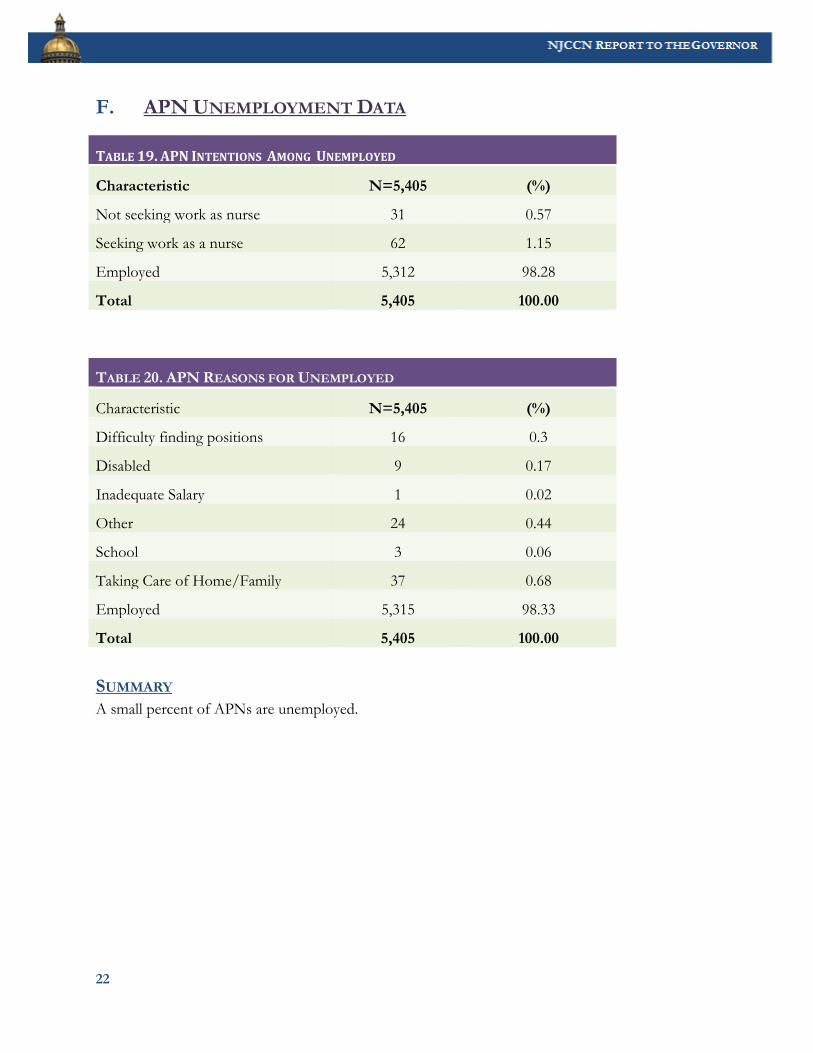
F. APN UNEMPLOYMENT DATA
T
SUMMARY A small percent of APNs are unemployed.
TABLE 19. APN INTENTIONS AMONG UNEMPLOYED
Characteristic N=5,405 (%)
Not seeking work as nurse 31 0.57
Seeking work as a nurse 62 1.15
Employed 5,312 98.28
Total 5,405 100.00
TABLE 20. APN REASONS FOR UNEMPLOYED
Characteristic N=5,405 (%)
Difficulty finding positions 16 0.3
Disabled 9 0.17
Inadequate Salary 1 0.02
Other 24 0.44
School 3 0.06
Taking Care of Home/Family 37 0.68
Employed 5,315 98.33
Total 5,405 100.00
Table 19: APN Intentions Among Unemployed
Table 20: APN Reasons for Unemployed
22
R NJCCN REPORT TO THE GOVERNOR
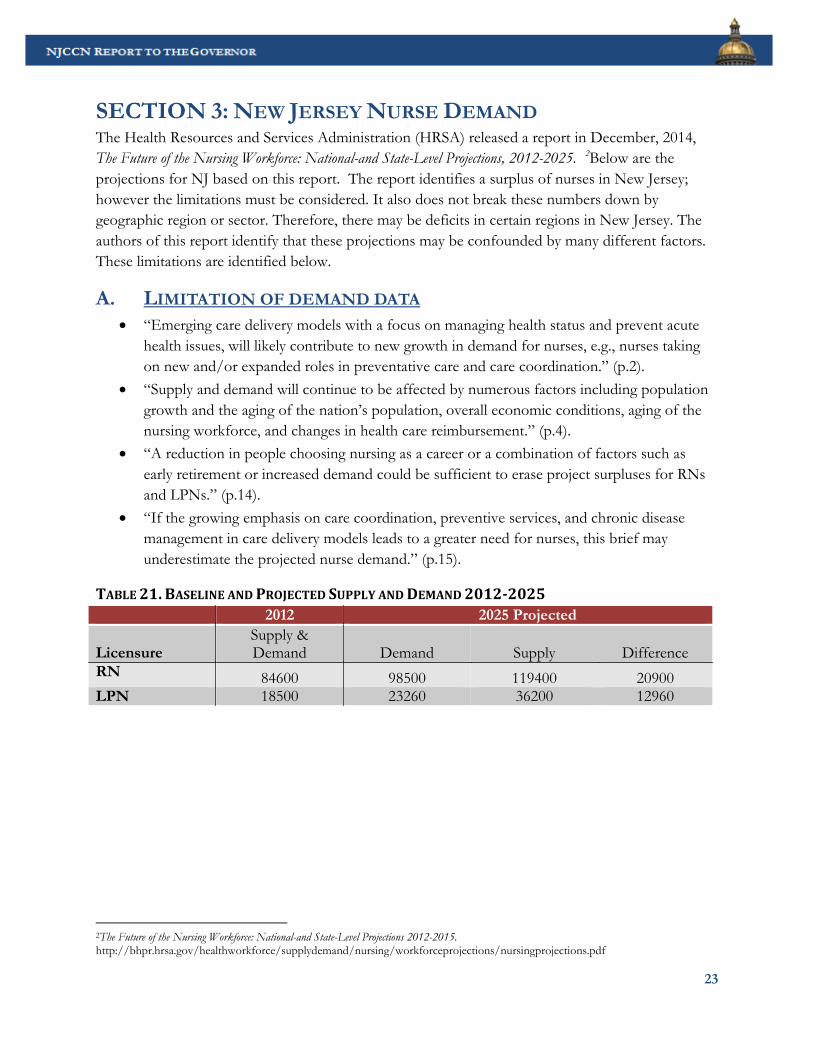
SECTION 3: NEW JERSEY NURSE DEMAND The Health Resources and Services Administration (HRSA) released a report in December, 2014, The Future of the Nursing Workforce: National-and State-Level Projections, 2012-2025. 2Below are the projections for NJ based on this report. The report identifies a surplus of nurses in New Jersey; however the limitations must be considered. It also does not break these numbers down by geographic region or sector. Therefore, there may be deficits in certain regions in New Jersey. The authors of this report identify that these projections may be confounded by many different factors. These limitations are identified below.
A. LIMITATION OF DEMAND DATA • “Emerging care delivery models with a focus on managing health status and prevent acute
health issues, will likely contribute to new growth in demand for nurses, e.g., nurses taking on new and/or expanded roles in preventative care and care coordination.” (p.2).
• “Supply and demand will continue to be affected by numerous factors including population growth and the aging of the nation’s population, overall economic conditions, aging of the nursing workforce, and changes in health care reimbursement.” (p.4).
• “A reduction in people choosing nursing as a career or a combination of factors such as early retirement or increased demand could be sufficient to erase project surpluses for RNs and LPNs.” (p.14).
• “If the growing emphasis on care coordination, preventive services, and chronic disease management in care delivery models leads to a greater need for nurses, this brief may underestimate the projected nurse demand.” (p.15).
TABLE 21. BASELINE AND PROJECTED SUPPLY AND DEMAND 2012-2025 Demand 2012-2015 2012 2025 Projected
Licensure Supply & Demand Demand Supply Difference
RN 84600 98500 119400 20900 LPN 18500 23260 36200 12960
2The Future of the Nursing Workforce: National-and State-Level Projections 2012-2015. http://bhpr.hrsa.gov/healthworkforce/supplydemand/nursing/workforceprojections/nursingprojections.pdf
Table 21: Baseline & Projected Supply & Demand 2012-2015
23
NJCCN REPORT TO THE GOVERNOR
SECTION 4: RECOMMENDATIONS
A. RECOMMENDATIONS/SOLUTIONS 1. Higher educational levels are needed to meet the complexity of healthcare. This is evidenced
in the Institute for Medicine Report: The Future of Nursing Leading Change Advancing Health3. The goal is to reach 80% BSN prepared RNs by 2020. Therefore, this needs to continue to be as an important goal for NJ. The NJCCN will continue to work with the New Jersey Action Coalition to meet this goal as well as other constituents.
2. Supply and Demand data needs to be collected to understand the workforce needs across settings and disciplines.
o The National Governor’s Association (NGA) technical support for NJ could be an avenue pursued if the governor endorsed this program for NJ. This would not require financial resources from the state.
o Additionally all disciplines that are licensed and certified through the Division of Consumer Affairs and the New Jersey Department of Health (NJDOH) should be required to collect a minimum data set for all healthcare providers. The NJCCN would be willing to lead this endeavor in collaboration with other agencies if regulatory mandates were put in place.
3. Educational programs are needed to meet the demands of the populations served. Programs such as transition programs for new nurses and the retooling of current nurses into non-hospital settings are needed. This would ensure an adequate supply of nurses with the needed skills and knowledge for the future. Funding is needed to support these transition programs.
4. Eliminate barriers to practice for APNs to ensure access to care for all New Jersey citizens in primary care.
B. SUMMARY This report provides a snapshot of NJ nurses, LPNs, RNs, and APNs. A full report on educational capacity and nursing workforce can be found on our website (http://njccn.org). The NJCCN board and advisory council represent nurses across all levels and settings. We, therefore, can serve as a resource on nursing workforce for NJ. The recommendations above require nursing leadership, legislation/regulation as well as funding to support changes in healthcare. While the NJCCN is focused on nursing workforce it is understood that nursing or any other discipline cannot work in a vacuum. Therefore, several of the recommendations go beyond nursing. We hope this report provides valuable information for the governor and others.
3 The Future of Nursing Leading Change Advancing Health. https://iom.nationalacademies.org/~/media/Files/Report%20Files/2010/The-Future-of-Nursing/Future%20of%20Nursing%202010%20Recommendations.pdf
24

New Jersey Collaborating Center for Nursing Rutgers School of Nursing
180 University Avenue Newark, NJ 07102
Phone: 973-353-2715 Web: www.njccn.org