Embed Size (px)
Citation preview
Philip R. Lee Institute for Health Policy Studies & Healthforce Center at UCSF
This project is/was supported by the California Board of Registered Nursing (BRN). This information or content and conclusions are those of the authors and should not be construed as the official position or policy of, nor should any endorsements be inferred by BRN or the State of California.
Copyright © 2017 The Regents of the University of California
Contact: Joanne Spetz, 415-502-4443, [email protected]
Forecasts of the Registered Nurse
Workforce in California
Prepared for the California Board of Registered Nursing
by
Joanne Spetz, PhD
June 4, 2017
Forecasts of the RN Workforce in California
2
Forecasts of the Registered Nurse Workforce in California
Table of Contents
Table of Contents ........................................................................................... 2
List of Tables ................................................................................................. 4
List of Figures ................................................................................................ 5
Executive Summary ....................................................................................... 6
The Supply of RNs .......................................................................................... 9
Method of Calculating RN Supply ................................................................. 11
Estimates of Supply Model Factors............................................................... 12
Stock of RNs in 2017 .............................................................................. 12
Graduates from California nursing programs .............................................. 13
Graduates from nursing programs in other states who obtain their first license
in California ........................................................................................... 14
Immigration of internationally-educated nurses .......................................... 15
Age distributions of new graduates ........................................................... 15
Interstate migration of RNs to California .................................................... 16
Movements from inactive to active license status ........................................ 17
Movements from lapsed to active license status ......................................... 18
Migration out of California (to another state or country) .............................. 18
Movements from active to inactive or lapsed license status .......................... 18
Supply Forecasts of California’s RN workforce ............................................... 19
The Demand for RNs .................................................................................... 25
Forecasts based on RNs per capita .............................................................. 25
Forecasts based on hospital staffing of RNs per patient day ............................ 26
Employment Development Department forecasts .......................................... 28
Bureau of Health Workforce forecasts .......................................................... 28
Comparing the demand forecasts ................................................................ 28
Comparing Supply and Demand for RNs .......................................................... 29
Comparison of the 2017 Forecasts with Previous Forecasts................................ 31
Policy Implications ....................................................................................... 32
Forecasts of the RN Workforce in California
3
Acronyms .................................................................................................... 34
References .................................................................................................. 35
Forecasts of the RN Workforce in California
4
List of Tables
Table 1. Counts of actively-licensed RNs living in California, by age group, April 6,
2017, and April 9, 2015 ................................................................................ 12
Table 2. New student enrollments and number of graduates from RN education
programs, 2006-2007 through 2015-2016 ...................................................... 13
Table 3. Predicted number of graduates based on new student enrollments ......... 14
Table 4. Estimated age distribution of new graduates from California RN programs
................................................................................................................. 16
Table 5. Requests for license endorsement into California, 2016 ........................ 17
Table 6. Number and age distribution of RNs changing status from inactive to active
license status, 2016 ..................................................................................... 17
Table 7. Number and rate of RNs reactivating lapsed licenses, 2016 ................... 18
Table 8. Estimated annual rates of RNs migrating out of California. .................... 19
Table 9. Estimated annual rates of RNs changing from active to inactive or lapsed
license status, by age category. ..................................................................... 20
Table 10. Employment rates for RNs residing in California, 2016, and average rates
used in forecasts .......................................................................................... 22
Table 11. Average hours worked per week by RNs residing in California, 2016, and
average hours used in forecasts ..................................................................... 23
Table 12. Working RNs per 100,000, 2015 ...................................................... 26
Forecasts of the RN Workforce in California
5
List of Figures
Executive Summary Exhibit: Projected full-time equivalent supply of and demand
for RNs, 2017-2035 ........................................................................................ 7
Figure 1. A model of the supply of RNs ........................................................... 10
Figure 2. Forecasted number of RNs with active licenses residing in California,
2017-2035 .................................................................................................. 21
Figure 3. Forecasted full-time equivalent supply of RNs, 2017-2035 ................... 24
Figure 4. Forecasted number of employed RNs per 100,000 population, 2017-2035
................................................................................................................. 24
Figure 5. Forecasted full-time equivalent demand for RNs, 2017-2035. ............... 29
Figure 6. Forecasted full-time equivalent supply of and demand for RNs, 2017-
2035. ......................................................................................................... 30
Forecasts of the RN Workforce in California
6
Forecasts of the Registered Nurse Workforce in California
Executive Summary
This report presents supply and demand forecasts for the Registered Nurse (RN)
workforce in California from 2017 through 2035. These new forecasts are based on
data from the 2016 California Board of Registered Nursing (BRN) Survey of
Registered Nurses, the 2015-2016 BRN Annual Schools Report, data extracted from
the BRN license records, and other state and national data sources. The 2017
forecasts indicate that supply of and demand for RNs are fairly well-balanced over
the next 10 years if current enrollment and state-to-state migration patterns are
stable.
The forecasts of RN supply take into account the aging of the RN workforce, new
graduates (including those from out-of-state and international nursing programs),
interstate flows of RNs, and changes in license status. These new forecasts of
supply incorporate new data for these factors.
The demand forecasts are based on national numbers of RNs per 100,000
population. An alternate forecast of demand was developed that estimates future
hospital utilization in California and current data on RN employment in hospitals.
The forecasts are compared with other published forecasts including those from the
U.S. Bureau of Health Workforce and California Employment Development
Department. Together, the demand estimates provide a range of possible scenarios
for the future.
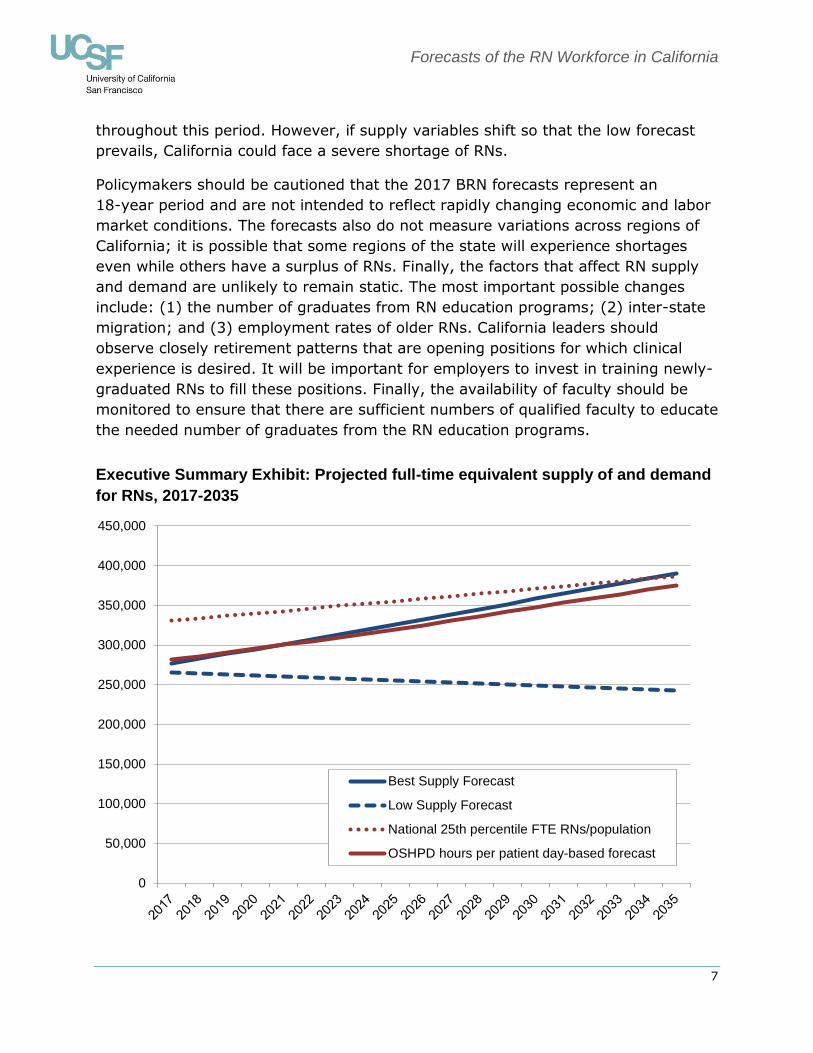
The Executive Summary Exhibit indicates that whether California experiences a
shortage of RNs in the future depends on the measure of demand selected for
comparison with supply as well as whether supply variables change. The forecasting
model produces a range of supply forecasts; the “Best Supply Forecast” is based on
the midpoint of most of the parameters in the model; the Exhibit presents both the
“Best” and “Low” forecasts. In the figure, the supply forecasts are compared with
two different estimates of demand: (1) the 2015 national 25th percentile of full-
time equivalent RNs per population; and (2) a forecast of demand based on current
hospital utilization by age group. In 2017, the statewide RN labor supply is slightly
lower than the utilization-based forecast and 17 percent lower than the national
25th percentile of full-time equivalent (FTE) RNs per capita. Overall, California’s RN
supply is forecasted to reach the national 25th percentile by 2034 if the number of
RN graduates remains stable and state-to-state migration patterns do not change
substantially; it will remain close to the utilization-based demand forecast
Forecasts of the RN Workforce in California
7
throughout this period. However, if supply variables shift so that the low forecast
prevails, California could face a severe shortage of RNs.
Policymakers should be cautioned that the 2017 BRN forecasts represent an
18-year period and are not intended to reflect rapidly changing economic and labor
market conditions. The forecasts also do not measure variations across regions of
California; it is possible that some regions of the state will experience shortages
even while others have a surplus of RNs. Finally, the factors that affect RN supply
and demand are unlikely to remain static. The most important possible changes
include: (1) the number of graduates from RN education programs; (2) inter-state
migration; and (3) employment rates of older RNs. California leaders should
observe closely retirement patterns that are opening positions for which clinical
experience is desired. It will be important for employers to invest in training newly-
graduated RNs to fill these positions. Finally, the availability of faculty should be
monitored to ensure that there are sufficient numbers of qualified faculty to educate
the needed number of graduates from the RN education programs.
Executive Summary Exhibit: Projected full-time equivalent supply of and demand
for RNs, 2017-2035
0
50,000
100,000
150,000
200,000
250,000
300,000
350,000
400,000
450,000
Best Supply Forecast
Low Supply Forecast
National 25th percentile FTE RNs/population
OSHPD hours per patient day-based forecast
Forecasts of the RN Workforce in California
8
Forecasts of the Registered Nurse Workforce in California
The labor market for registered nurses (RNs) has been characterized by cycles of
shortage and surplus since World War II. The most recent period of shortage began
in the late 1990s (Buerhaus 1998), and persisted through 2007. After 2008, survey
data indicated that California’s long-standing RN shortage ended, at least
temporarily (Bates, Keane, & Spetz 2011). This change in the labor market was
attributed to several trends. First, nursing school enrollments expanded
substantially in California, more than doubling between 2001 and 2010 (Waneka,
Keane, & Spetz 2012). This expansion of RN supply would have alleviated the
shortage in many regions on its own. The economic recession that started in late
2007 further mitigated the shortage by increasing the workforce participation of
RNs who otherwise might have retired or reduced their hours of work. It has been
estimated that nearly all the hospital employment increase in the past decade can
be attributed to growth in RN supply during economic recessions (Buerhaus &
Auerbach 2011). The recession also reportedly dampened demand for newly-
graduated nurses. In late 2010, a survey of Chief Nursing Officers found that there
were fewer than 6,500 full-time equivalent vacant positions for RNs statewide
(Bates, Keane, & Spetz 2011) while the 2010 BRN Survey of Registered Nurses
indicated that nearly 7,700 RNs were seeking employment (Spetz, Keane, &
Herrera 2011).
More recent data suggest the labor market may be shifting again. The Fall 2016
Survey of Nurse Employers found that many Chief Nursing Officers are experiencing
difficulty recruiting RNs for specialized positions and that more than 90 percent of
hospitals reported demand for RNs being greater than the available supply (Chu,
Bates, & Spetz 2017). Hospital vacancy rates have been rising since 2013, reaching
5.9 percent in 2016. There also has been growth in the share of newly-graduated
RNs reporting they are employed within 12 months of licensure, rising from 59
percent in 2013 to 84 percent in 2016 (HealthImpact 2017). These data are
consistent with the expectation that the economic recovery would lead nurses who
had delayed retirement, re-entered the labor force, or increased their hours of work
due to the economic recession to retire or reduce their employment as the economy
recovers (Buerhaus & Auerbach 2011).
At the same time, the implementation of the most significant components of the
Affordable Care Act (ACA) – an expansion of Medi-Cal and the implementation of
the Covered California health insurance exchange to facilitate insurance enrollment
– reduced the share of nonelderly Californians without health insurance from 16.2
percent in 2011 (Charles 2015) to 8.1 percent in 2015 (Cohen et al. 2016).
Growing numbers of insured people will demand greater health care services,
Forecasts of the RN Workforce in California
9
although the types of services needed are likely to change. In addition, the ACA
established programs to encourage improved care management in order to deliver
health care more efficiently and effectively (Spetz 2014). These changes have
increased demand for RNs.
This report updates forecasts of RN supply and demand in California, which were
first developed for the California Board of Registered Nursing (BRN) in 2005 and
subsequently updated every two years (Spetz & Dyer 2005; Spetz 2007; Spetz
2009; Spetz 2011; Spetz 2013; Spetz 2015). New data from the 2016 BRN Survey
of Registered Nurses (Spetz, Chu, & Jura 2017), the 2015-2016 BRN Annual
Schools Report (Blash & Spetz 2017), and BRN license records were used to update
the model of RN supply. The supply forecast is compared with several benchmarks
of demand, including national numbers of RNs per 100,000 population, estimates of
future hospital utilization in California, and forecasts published by the U.S. Bureau
of Health Workforce and California Employment Development Department (BHW
2014; EDD 2016).
The Supply of RNs
As of April 6, 2017, there were 415,798 RNs with current, active licenses in
California, of whom 353,051 resided in California. For the purposes of these
forecasts, the California-resident population is defined as the supply of nurses; the
role of nurses who travel to work in California from other states is discussed later in
the report.
The RN workforce constantly changes with the entrance of newly graduated nurses,
migration of nurses from other states and countries, retirements, temporary
departures from nursing work, and fluctuations in the number of hours that nurses
choose to work. These factors can be grouped into three categories:
Inflows of nurses: Additions to the number of RNs in California
o Graduates from California nursing programs
o Graduates of nursing programs in other states who obtain their
first RN license in California
o Internationally-educated nurses who immigrate to California and
obtain their RN license
o Interstate migration of RNs to California
o Changes from inactive to active license status
o Changes from delinquent to active license status
Forecasts of the RN Workforce in California
10
Outflows of nurses: The departure of RNs from the California
population
o Migration out of California (to another state or country)
o Movements from active to inactive or lapsed license status
Labor force participation factors: Decisions to work, and how much to
work
o Share of RNs with active licenses and California residence that
work in nursing
o Average number of hours worked per week by RNs working in
nursing
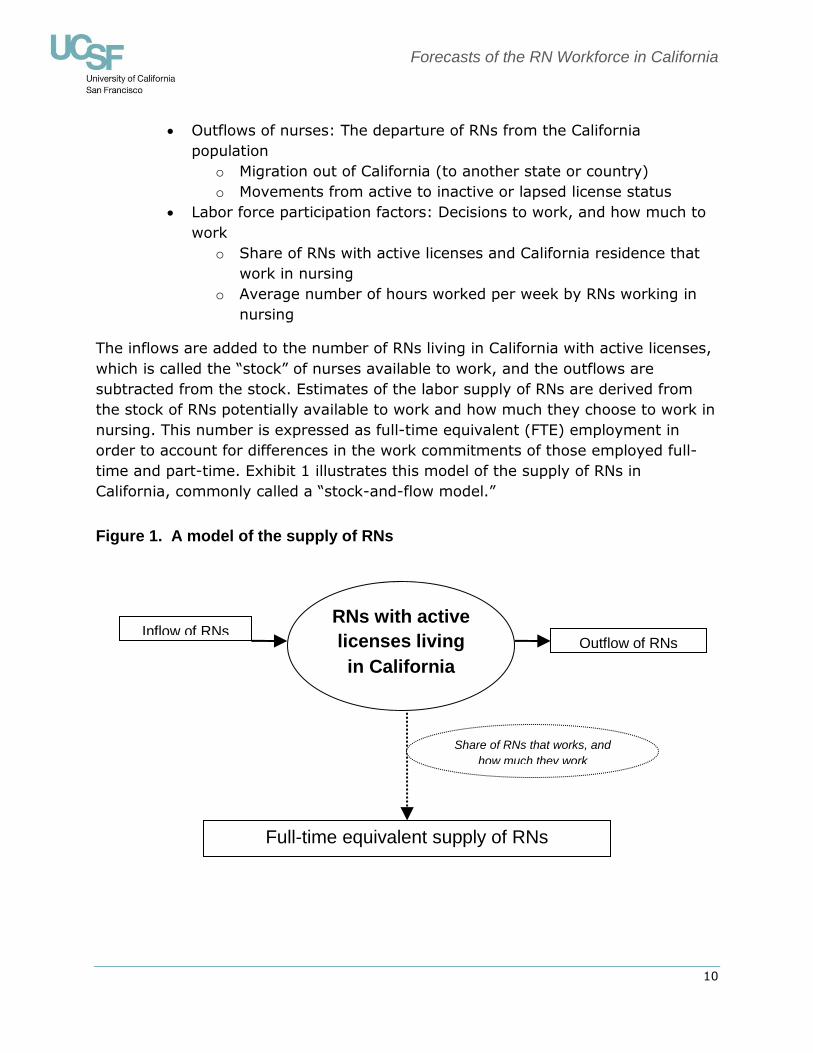
The inflows are added to the number of RNs living in California with active licenses,
which is called the “stock” of nurses available to work, and the outflows are
subtracted from the stock. Estimates of the labor supply of RNs are derived from
the stock of RNs potentially available to work and how much they choose to work in
nursing. This number is expressed as full-time equivalent (FTE) employment in
order to account for differences in the work commitments of those employed full-
time and part-time. Exhibit 1 illustrates this model of the supply of RNs in
California, commonly called a “stock-and-flow model.”
Figure 1. A model of the supply of RNs
RNs with active
licenses living
in California
Inflow of RNs Outflow of RNs
Full-time equivalent supply of RNs
Share of RNs that works, and
how much they work
Forecasts of the RN Workforce in California
11
Method of Calculating RN Supply
As inflows, outflows, and employment decisions change over time, so does the RN
workforce. At first glance, it seems clear that as long as the inflow of RNs is greater
than the outflow, the RN workforce will grow over time. However, such a
comparison between total inflow and outflow does not take into account the aging
of the RN workforce. The age distributions of the stock of RNs and each inflow and
outflow component affect supply. Thus, the model “ages” each age cohort to
capture the impact of age on the supply forecast.
In the supply model, the number of RNs with active licenses who reside in California
is divided into 13 age categories: under 25, 25-29, 30-34, 35-39, 40-44, 45-49,
50-54, 55-59, 60-64, 65-69, 70-74, 75-79, and 80 and older. One-fifth of RNs in
each age category moves into the next (older) age category in the subsequent
year, until they reach the oldest age category.1 The inflow estimates are added to
each age group of RNs and the outflow estimates are subtracted from each age
group of RNs. The result is a forecast of the new stock of RNs for the next year.
Finally, employment rates and hours worked per week in nursing are applied to the
estimated stock of RNs in each age group to obtain estimated FTE supply. This
calculation is iterated through 2035 to obtain yearly forecasts of California’s RN
supply.
For some factors in the supply model, differing estimates are available, with no
indication of which estimate is most reliable. For other factors, there is uncertainty
as to whether current data are applicable to what might happen in the future. For
example, in 2010 and 2012, a greater share of nurses over age 60 was employed
as compared with prior years. This increase was likely the result of older nurses
delaying retirement due to declines in the value of their retirement savings
(Buerhaus & Auerbach 2011). More recent data indicate that employment of nurses
in this age group has returned to lower pre-recession levels (Spetz et al. in press).
However, it also is possible that “baby boomer” nurses have different intentions
regarding retirement than did previous generations, and higher rates of
employment in older age groups will reemerge. For variables with such uncertainty,
a range of estimates is offered representing the highest and lowest values. In the
final models, the “best estimate” for each parameter is the average of the low and
high estimates, unless otherwise noted.
1 All but one age group spans 5 years, so if nurses are evenly distributed across those five years, 20% - or 1 in 5 –
would move to the next age group each year. The youngest age group spans 7 years, but there were few RNs under
20 years old in 2017; thus, the 20% assumption seems reasonable for this group as well.
Forecasts of the RN Workforce in California
12
Estimates of Supply Model Factors
Stock of RNs in 2017
Data describing the number of RNs with active licenses on April 6, 2017, were
obtained from the BRN. At that time, 353,051 RNs had active licenses and a
California address. The 62,747 RNs with addresses outside California were not
included in the stock of RNs because California’s border regions are generally rural
and thus few nurses commute regularly from out of state. Some nurses might
intermittently come to California as traveling nurses, thus supplanting the state’s
supply; this is discussed in more detail below.
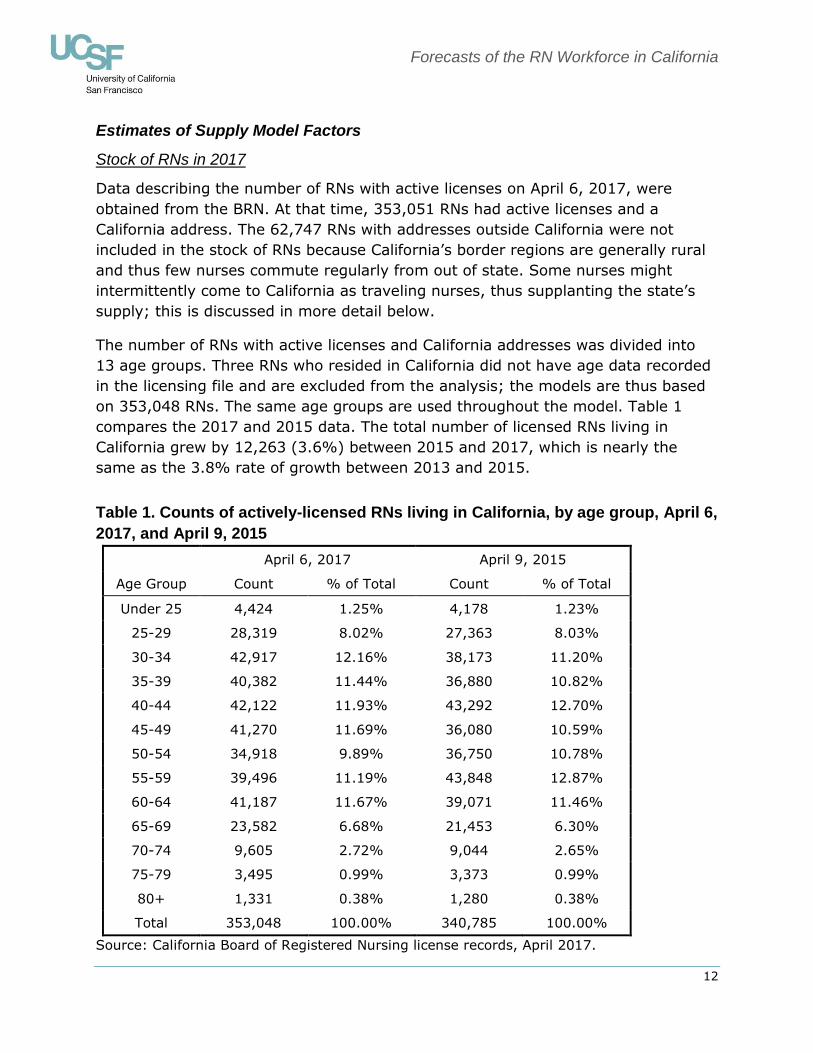
The number of RNs with active licenses and California addresses was divided into
13 age groups. Three RNs who resided in California did not have age data recorded
in the licensing file and are excluded from the analysis; the models are thus based
on 353,048 RNs. The same age groups are used throughout the model. Table 1
compares the 2017 and 2015 data. The total number of licensed RNs living in
California grew by 12,263 (3.6%) between 2015 and 2017, which is nearly the
same as the 3.8% rate of growth between 2013 and 2015.
Table 1. Counts of actively-licensed RNs living in California, by age group, April 6,
2017, and April 9, 2015
April 6, 2017 April 9, 2015
Age Group Count % of Total Count % of Total
Under 25 4,424 1.25% 4,178 1.23%
25-29 28,319 8.02% 27,363 8.03%
30-34 42,917 12.16% 38,173 11.20%
35-39 40,382 11.44% 36,880 10.82%
40-44 42,122 11.93% 43,292 12.70%
45-49 41,270 11.69% 36,080 10.59%
50-54 34,918 9.89% 36,750 10.78%
55-59 39,496 11.19% 43,848 12.87%
60-64 41,187 11.67% 39,071 11.46%
65-69 23,582 6.68% 21,453 6.30%
70-74 9,605 2.72% 9,044 2.65%
75-79 3,495 0.99% 3,373 0.99%
80+ 1,331 0.38% 1,280 0.38%
Total 353,048 100.00% 340,785 100.00%
Source: California Board of Registered Nursing license records, April 2017.
Forecasts of the RN Workforce in California
13
Graduates from California nursing programs
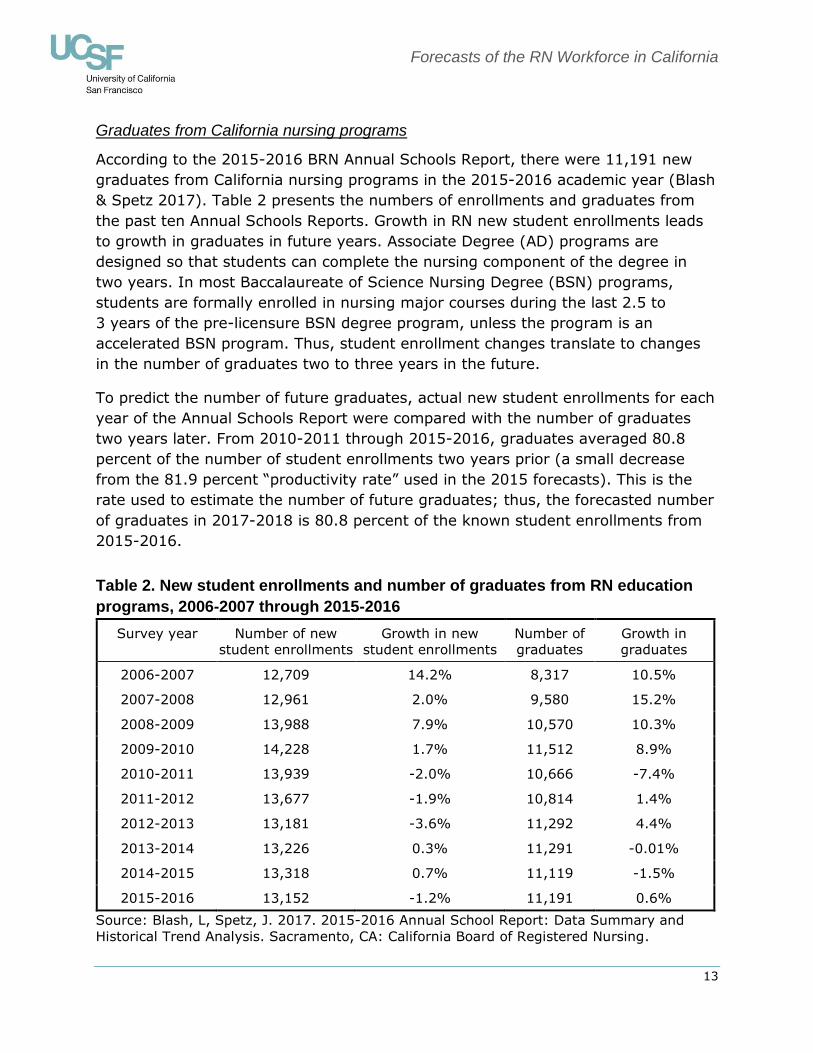
According to the 2015-2016 BRN Annual Schools Report, there were 11,191 new
graduates from California nursing programs in the 2015-2016 academic year (Blash
& Spetz 2017). Table 2 presents the numbers of enrollments and graduates from
the past ten Annual Schools Reports. Growth in RN new student enrollments leads
to growth in graduates in future years. Associate Degree (AD) programs are
designed so that students can complete the nursing component of the degree in
two years. In most Baccalaureate of Science Nursing Degree (BSN) programs,
students are formally enrolled in nursing major courses during the last 2.5 to
3 years of the pre-licensure BSN degree program, unless the program is an
accelerated BSN program. Thus, student enrollment changes translate to changes
in the number of graduates two to three years in the future.
To predict the number of future graduates, actual new student enrollments for each
year of the Annual Schools Report were compared with the number of graduates
two years later. From 2010-2011 through 2015-2016, graduates averaged 80.8
percent of the number of student enrollments two years prior (a small decrease
from the 81.9 percent “productivity rate” used in the 2015 forecasts). This is the
rate used to estimate the number of future graduates; thus, the forecasted number
of graduates in 2017-2018 is 80.8 percent of the known student enrollments from
2015-2016.
Table 2. New student enrollments and number of graduates from RN education
programs, 2006-2007 through 2015-2016
Survey year Number of new
student enrollments
Growth in new
student enrollments
Number of
graduates
Growth in
graduates
2006-2007 12,709 14.2% 8,317 10.5%
2007-2008 12,961 2.0% 9,580 15.2%
2008-2009 13,988 7.9% 10,570 10.3%
2009-2010 14,228 1.7% 11,512 8.9%
2010-2011 13,939 -2.0% 10,666 -7.4%
2011-2012 13,677 -1.9% 10,814 1.4%
2012-2013 13,181 -3.6% 11,292 4.4%
2013-2014 13,226 0.3% 11,291 -0.01%
2014-2015 13,318 0.7% 11,119 -1.5%
2015-2016 13,152 -1.2% 11,191 0.6%
Source: Blash, L, Spetz, J. 2017. 2015-2016 Annual School Report: Data Summary and
Historical Trend Analysis. Sacramento, CA: California Board of Registered Nursing.
Forecasts of the RN Workforce in California
14
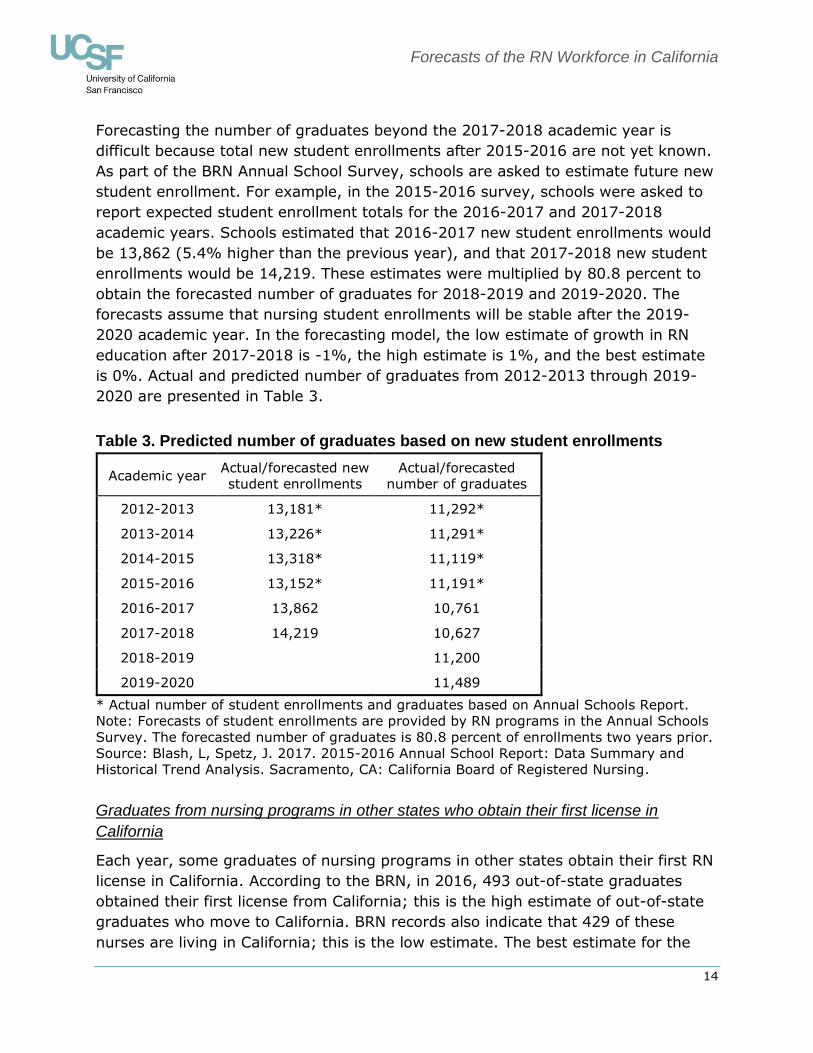
Forecasting the number of graduates beyond the 2017-2018 academic year is
difficult because total new student enrollments after 2015-2016 are not yet known.
As part of the BRN Annual School Survey, schools are asked to estimate future new
student enrollment. For example, in the 2015-2016 survey, schools were asked to
report expected student enrollment totals for the 2016-2017 and 2017-2018
academic years. Schools estimated that 2016-2017 new student enrollments would
be 13,862 (5.4% higher than the previous year), and that 2017-2018 new student
enrollments would be 14,219. These estimates were multiplied by 80.8 percent to
obtain the forecasted number of graduates for 2018-2019 and 2019-2020. The
forecasts assume that nursing student enrollments will be stable after the 2019-
2020 academic year. In the forecasting model, the low estimate of growth in RN
education after 2017-2018 is -1%, the high estimate is 1%, and the best estimate
is 0%. Actual and predicted number of graduates from 2012-2013 through 2019-
2020 are presented in Table 3.
Table 3. Predicted number of graduates based on new student enrollments
Academic year Actual/forecasted new
student enrollments
Actual/forecasted
number of graduates
2012-2013 13,181* 11,292*
2013-2014 13,226* 11,291*
2014-2015 13,318* 11,119*
2015-2016 13,152* 11,191*
2016-2017 13,862 10,761
2017-2018 14,219 10,627
2018-2019 11,200
2019-2020 11,489
* Actual number of student enrollments and graduates based on Annual Schools Report.
Note: Forecasts of student enrollments are provided by RN programs in the Annual Schools
Survey. The forecasted number of graduates is 80.8 percent of enrollments two years prior.
Source: Blash, L, Spetz, J. 2017. 2015-2016 Annual School Report: Data Summary and
Historical Trend Analysis. Sacramento, CA: California Board of Registered Nursing.
Graduates from nursing programs in other states who obtain their first license in
California
Each year, some graduates of nursing programs in other states obtain their first RN
license in California. According to the BRN, in 2016, 493 out-of-state graduates
obtained their first license from California; this is the high estimate of out-of-state
graduates who move to California. BRN records also indicate that 429 of these
nurses are living in California; this is the low estimate. The best estimate for the
Forecasts of the RN Workforce in California
15
inflow of new licensees from other states is the average of the high and low
estimates: 461 nurses. This estimate is higher than that from the 2015 forecasts,
which was 291.
Immigration of internationally-educated nurses
In 2016, the BRN reported that 703 internationally-educated nurses passed the
National Council Licensure Examination for RNs (NCLEX-RN) and received initial
licensure as an RN in California, 503 of whom also had a California residence; the
remainder lived in other states or countries. In the supply model, we use the total
number of 2016 international graduates receiving initial licensure in California as
the high estimate of the number of immigrants; we use the number that lives in
California as the low estimate. The best estimate is the average of the high and low
estimates: 603 internationally-educated RNs immigrate to California each year. This
number is similar to the 2015 estimate of 209. However, these figures are much
lower than the prior decade when the number of first licenses issued to
internationally-educated nurses ranged between 1,145 and 4,107 annually. The
lower numbers in recent years are consistent with other reports that international
recruitment of nurses slowed significantly after 2008 (Chu, Bates, & Spetz 2017).
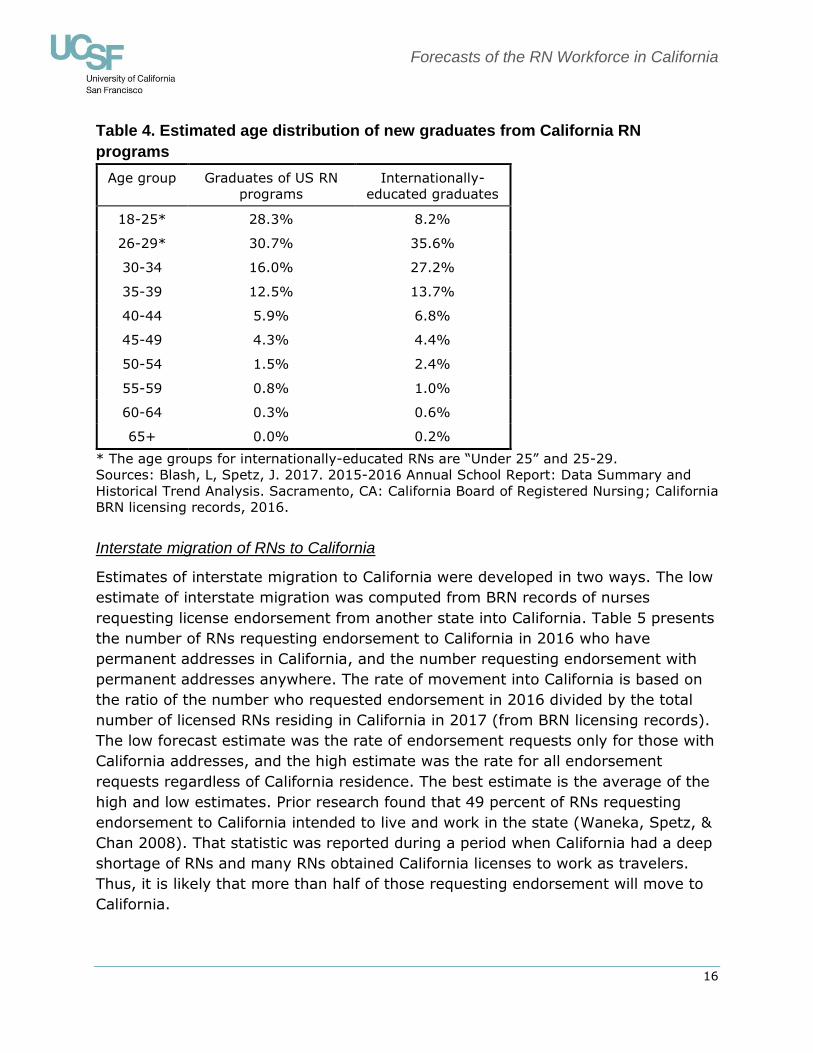
Age distributions of new graduates
Inflows of new graduates are added to the stock of RNs by age group. The BRN
Annual Schools Report uses an uneven set of age groups for new California
graduates: 18-25, 26-30, and then ten-year age groups for graduates over age 30.
To create consistent groups of graduates in the forecasting model, we allocated the
graduates into five-year groups. Table 4 shows how new graduates from California
nursing programs were distributed by age group. RN graduates from nursing
programs in other states seeking initial licensure as an RN in California are assumed
to have the same age distribution as California graduates.
BRN records of internationally-educated nurses who receive initial U.S. licensure in
California include the birth years of these nurses. The age distribution of
internationally-educated RNs who lived in California and obtained licenses in 2016 is
presented in the last column of Table 4; these data are used to forecast the age
distribution for all internationally-educated RNs receiving first licenses in California.
Forecasts of the RN Workforce in California
16
Table 4. Estimated age distribution of new graduates from California RN
programs
Age group Graduates of US RN
programs
Internationally-
educated graduates
18-25* 28.3% 8.2%
26-29* 30.7% 35.6%
30-34 16.0% 27.2%
35-39 12.5% 13.7%
40-44 5.9% 6.8%
45-49 4.3% 4.4%
50-54 1.5% 2.4%
55-59 0.8% 1.0%
60-64 0.3% 0.6%
65+ 0.0% 0.2%
* The age groups for internationally-educated RNs are “Under 25” and 25-29.
Sources: Blash, L, Spetz, J. 2017. 2015-2016 Annual School Report: Data Summary and
Historical Trend Analysis. Sacramento, CA: California Board of Registered Nursing; California
BRN licensing records, 2016.
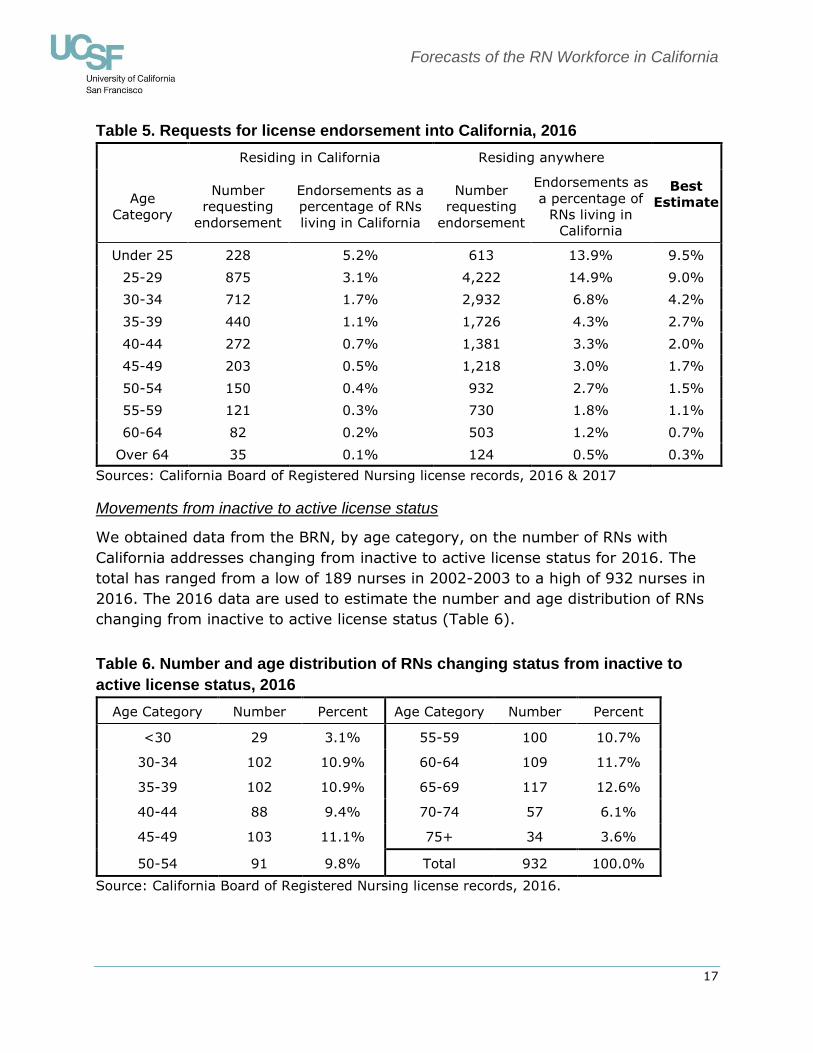
Interstate migration of RNs to California
Estimates of interstate migration to California were developed in two ways. The low
estimate of interstate migration was computed from BRN records of nurses
requesting license endorsement from another state into California. Table 5 presents
the number of RNs requesting endorsement to California in 2016 who have
permanent addresses in California, and the number requesting endorsement with
permanent addresses anywhere. The rate of movement into California is based on
the ratio of the number who requested endorsement in 2016 divided by the total
number of licensed RNs residing in California in 2017 (from BRN licensing records).
The low forecast estimate was the rate of endorsement requests only for those with
California addresses, and the high estimate was the rate for all endorsement
requests regardless of California residence. The best estimate is the average of the
high and low estimates. Prior research found that 49 percent of RNs requesting
endorsement to California intended to live and work in the state (Waneka, Spetz, &
Chan 2008). That statistic was reported during a period when California had a deep
shortage of RNs and many RNs obtained California licenses to work as travelers.
Thus, it is likely that more than half of those requesting endorsement will move to
California.
Forecasts of the RN Workforce in California
17
Table 5. Requests for license endorsement into California, 2016
Residing in California Residing anywhere
Best
Estimate Age
Category
Number
requesting
endorsement
Endorsements as a
percentage of RNs
living in California
Number
requesting
endorsement
Endorsements as
a percentage of
RNs living in
California
Under 25 228 5.2% 613 13.9% 9.5%
25-29 875 3.1% 4,222 14.9% 9.0%
30-34 712 1.7% 2,932 6.8% 4.2%
35-39 440 1.1% 1,726 4.3% 2.7%
40-44 272 0.7% 1,381 3.3% 2.0%
45-49 203 0.5% 1,218 3.0% 1.7%
50-54 150 0.4% 932 2.7% 1.5%
55-59 121 0.3% 730 1.8% 1.1%
60-64 82 0.2% 503 1.2% 0.7%
Over 64 35 0.1% 124 0.5% 0.3%
Sources: California Board of Registered Nursing license records, 2016 & 2017
Movements from inactive to active license status
We obtained data from the BRN, by age category, on the number of RNs with
California addresses changing from inactive to active license status for 2016. The
total has ranged from a low of 189 nurses in 2002-2003 to a high of 932 nurses in
2016. The 2016 data are used to estimate the number and age distribution of RNs
changing from inactive to active license status (Table 6).
Table 6. Number and age distribution of RNs changing status from inactive to
active license status, 2016
Age Category Number Percent Age Category Number Percent
<30 29 3.1% 55-59 100 10.7%
30-34 102 10.9% 60-64 109 11.7%
35-39 102 10.9% 65-69 117 12.6%
40-44 88 9.4% 70-74 57 6.1%
45-49 103 11.1% 75+ 34 3.6%
50-54 91 9.8% Total 932 100.0%
Source: California Board of Registered Nursing license records, 2016.
Forecasts of the RN Workforce in California
18
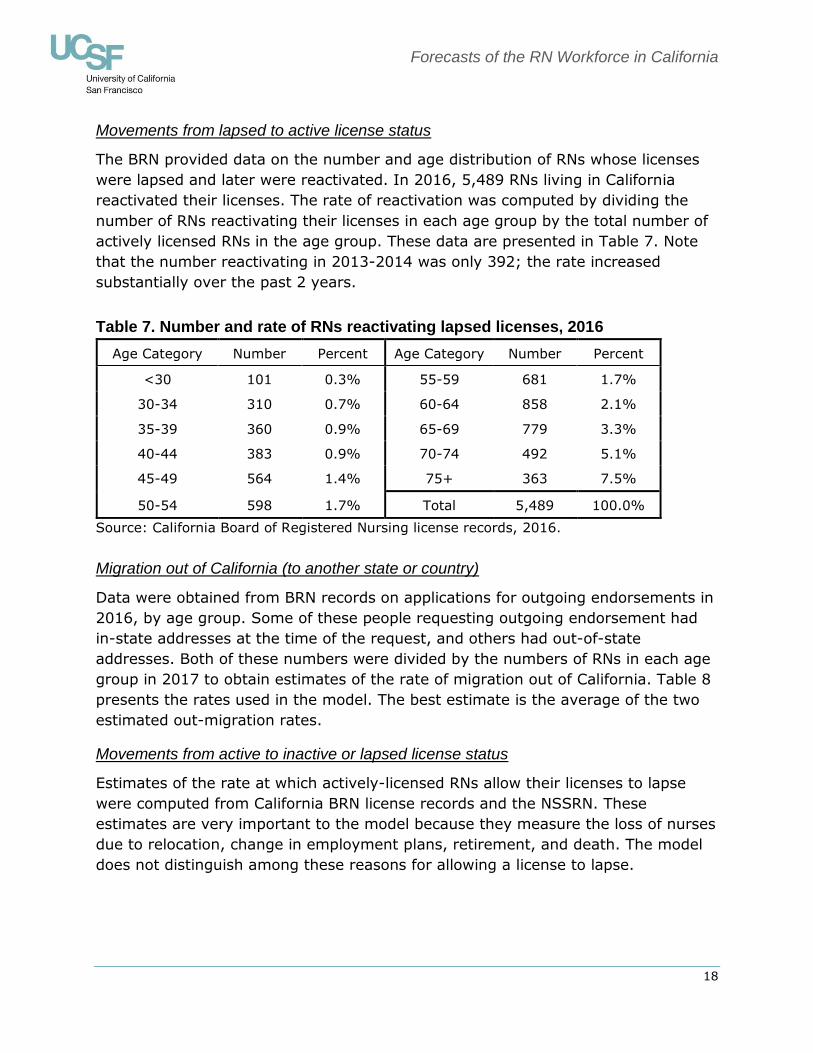
Movements from lapsed to active license status
The BRN provided data on the number and age distribution of RNs whose licenses
were lapsed and later were reactivated. In 2016, 5,489 RNs living in California
reactivated their licenses. The rate of reactivation was computed by dividing the
number of RNs reactivating their licenses in each age group by the total number of
actively licensed RNs in the age group. These data are presented in Table 7. Note
that the number reactivating in 2013-2014 was only 392; the rate increased
substantially over the past 2 years.
Table 7. Number and rate of RNs reactivating lapsed licenses, 2016
Age Category Number Percent Age Category Number Percent
<30 101 0.3% 55-59 681 1.7%
30-34 310 0.7% 60-64 858 2.1%
35-39 360 0.9% 65-69 779 3.3%
40-44 383 0.9% 70-74 492 5.1%
45-49 564 1.4% 75+ 363 7.5%
50-54 598 1.7% Total 5,489 100.0%
Source: California Board of Registered Nursing license records, 2016.
Migration out of California (to another state or country)
Data were obtained from BRN records on applications for outgoing endorsements in
2016, by age group. Some of these people requesting outgoing endorsement had
in-state addresses at the time of the request, and others had out-of-state
addresses. Both of these numbers were divided by the numbers of RNs in each age
group in 2017 to obtain estimates of the rate of migration out of California. Table 8
presents the rates used in the model. The best estimate is the average of the two
estimated out-migration rates.
Movements from active to inactive or lapsed license status
Estimates of the rate at which actively-licensed RNs allow their licenses to lapse
were computed from California BRN license records and the NSSRN. These
estimates are very important to the model because they measure the loss of nurses
due to relocation, change in employment plans, retirement, and death. The model
does not distinguish among these reasons for allowing a license to lapse.
Forecasts of the RN Workforce in California
19
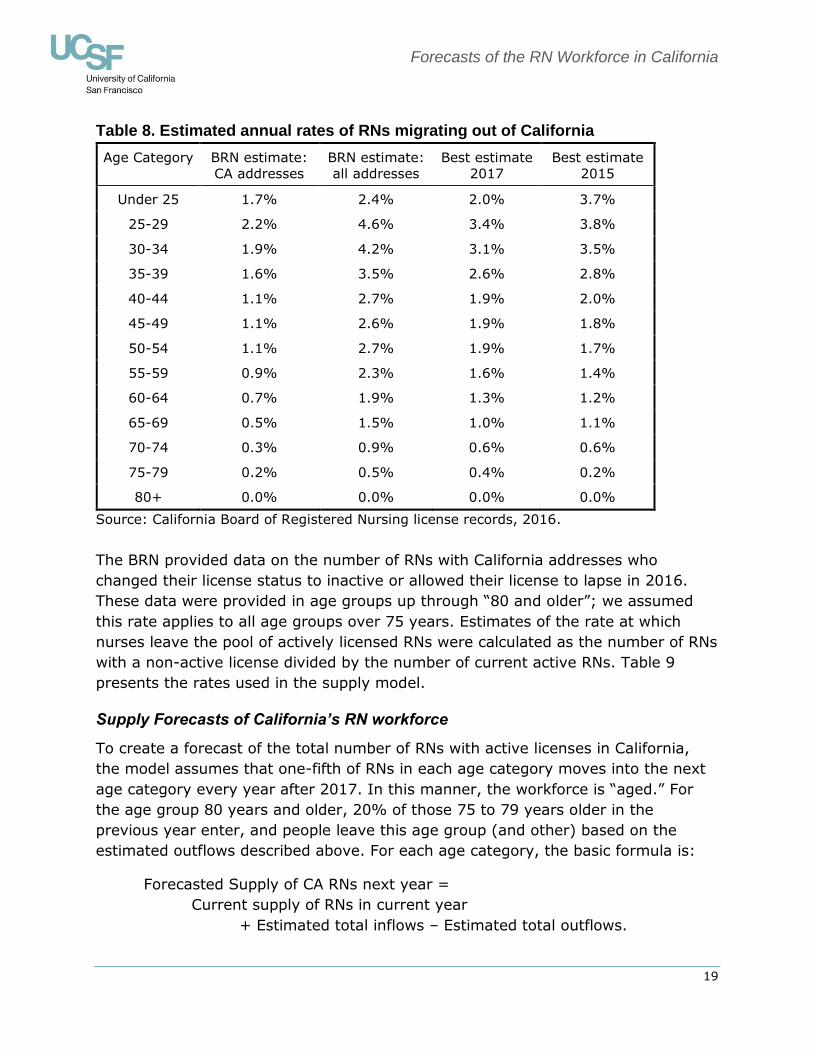
Table 8. Estimated annual rates of RNs migrating out of California
Age Category BRN estimate:
CA addresses
BRN estimate:
all addresses
Best estimate
2017
Best estimate
2015
Under 25 1.7% 2.4% 2.0% 3.7%
25-29 2.2% 4.6% 3.4% 3.8%
30-34 1.9% 4.2% 3.1% 3.5%
35-39 1.6% 3.5% 2.6% 2.8%
40-44 1.1% 2.7% 1.9% 2.0%
45-49 1.1% 2.6% 1.9% 1.8%
50-54 1.1% 2.7% 1.9% 1.7%
55-59 0.9% 2.3% 1.6% 1.4%
60-64 0.7% 1.9% 1.3% 1.2%
65-69 0.5% 1.5% 1.0% 1.1%
70-74 0.3% 0.9% 0.6% 0.6%
75-79 0.2% 0.5% 0.4% 0.2%
80+ 0.0% 0.0% 0.0% 0.0%
Source: California Board of Registered Nursing license records, 2016.
The BRN provided data on the number of RNs with California addresses who
changed their license status to inactive or allowed their license to lapse in 2016.
These data were provided in age groups up through “80 and older”; we assumed
this rate applies to all age groups over 75 years. Estimates of the rate at which
nurses leave the pool of actively licensed RNs were calculated as the number of RNs
with a non-active license divided by the number of current active RNs. Table 9
presents the rates used in the supply model.
Supply Forecasts of California’s RN workforce
To create a forecast of the total number of RNs with active licenses in California,
the model assumes that one-fifth of RNs in each age category moves into the next
age category every year after 2017. In this manner, the workforce is “aged.” For
the age group 80 years and older, 20% of those 75 to 79 years older in the
previous year enter, and people leave this age group (and other) based on the
estimated outflows described above. For each age category, the basic formula is:
Forecasted Supply of CA RNs next year =
Current supply of RNs in current year
+ Estimated total inflows – Estimated total outflows.
Forecasts of the RN Workforce in California
20
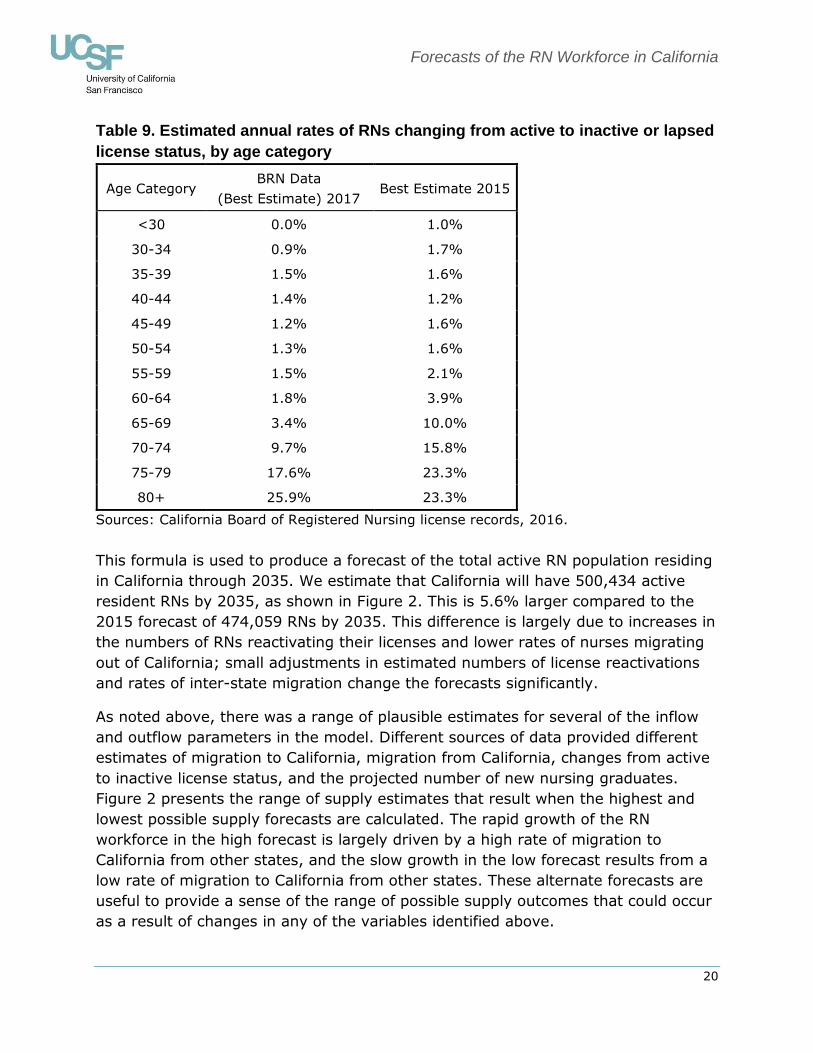
Table 9. Estimated annual rates of RNs changing from active to inactive or lapsed
license status, by age category
Age Category BRN Data
(Best Estimate) 2017 Best Estimate 2015
<30 0.0% 1.0%
30-34 0.9% 1.7%
35-39 1.5% 1.6%
40-44 1.4% 1.2%
45-49 1.2% 1.6%
50-54 1.3% 1.6%
55-59 1.5% 2.1%
60-64 1.8% 3.9%
65-69 3.4% 10.0%
70-74 9.7% 15.8%
75-79 17.6% 23.3%
80+ 25.9% 23.3%
Sources: California Board of Registered Nursing license records, 2016.
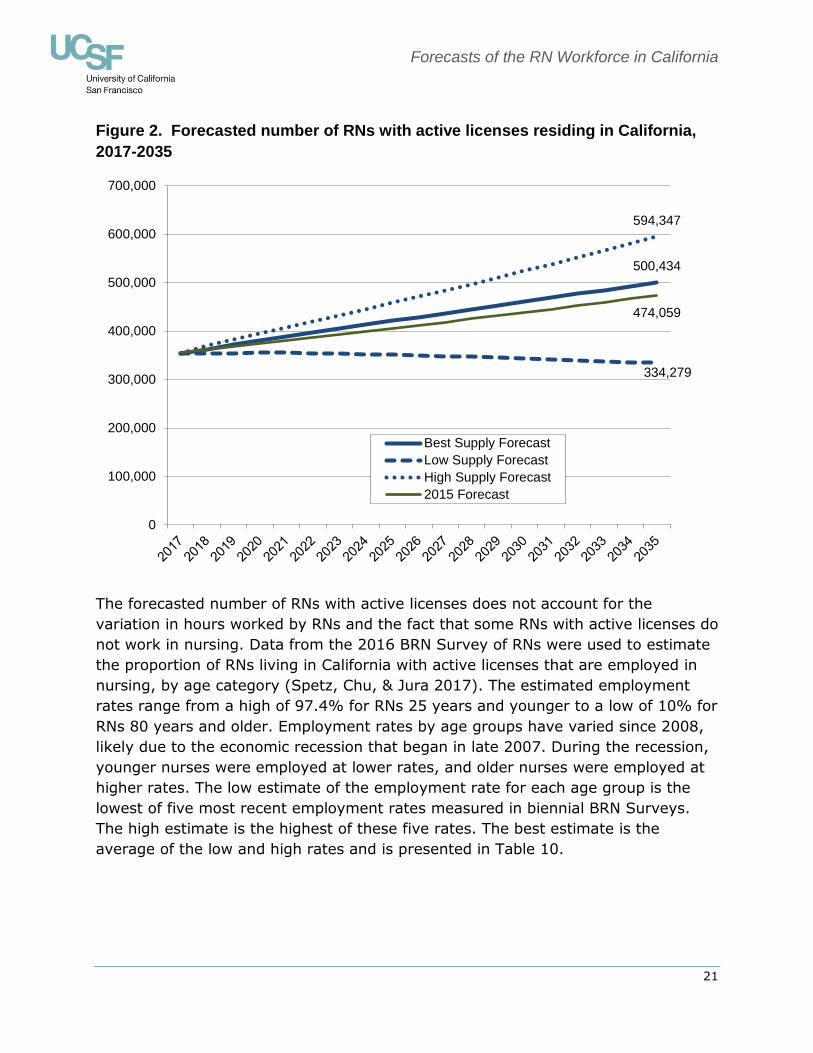
This formula is used to produce a forecast of the total active RN population residing
in California through 2035. We estimate that California will have 500,434 active
resident RNs by 2035, as shown in Figure 2. This is 5.6% larger compared to the
2015 forecast of 474,059 RNs by 2035. This difference is largely due to increases in
the numbers of RNs reactivating their licenses and lower rates of nurses migrating
out of California; small adjustments in estimated numbers of license reactivations
and rates of inter-state migration change the forecasts significantly.
As noted above, there was a range of plausible estimates for several of the inflow
and outflow parameters in the model. Different sources of data provided different
estimates of migration to California, migration from California, changes from active
to inactive license status, and the projected number of new nursing graduates.
Figure 2 presents the range of supply estimates that result when the highest and
lowest possible supply forecasts are calculated. The rapid growth of the RN
workforce in the high forecast is largely driven by a high rate of migration to
California from other states, and the slow growth in the low forecast results from a
low rate of migration to California from other states. These alternate forecasts are
useful to provide a sense of the range of possible supply outcomes that could occur
as a result of changes in any of the variables identified above.
Forecasts of the RN Workforce in California
21
Figure 2. Forecasted number of RNs with active licenses residing in California,
2017-2035
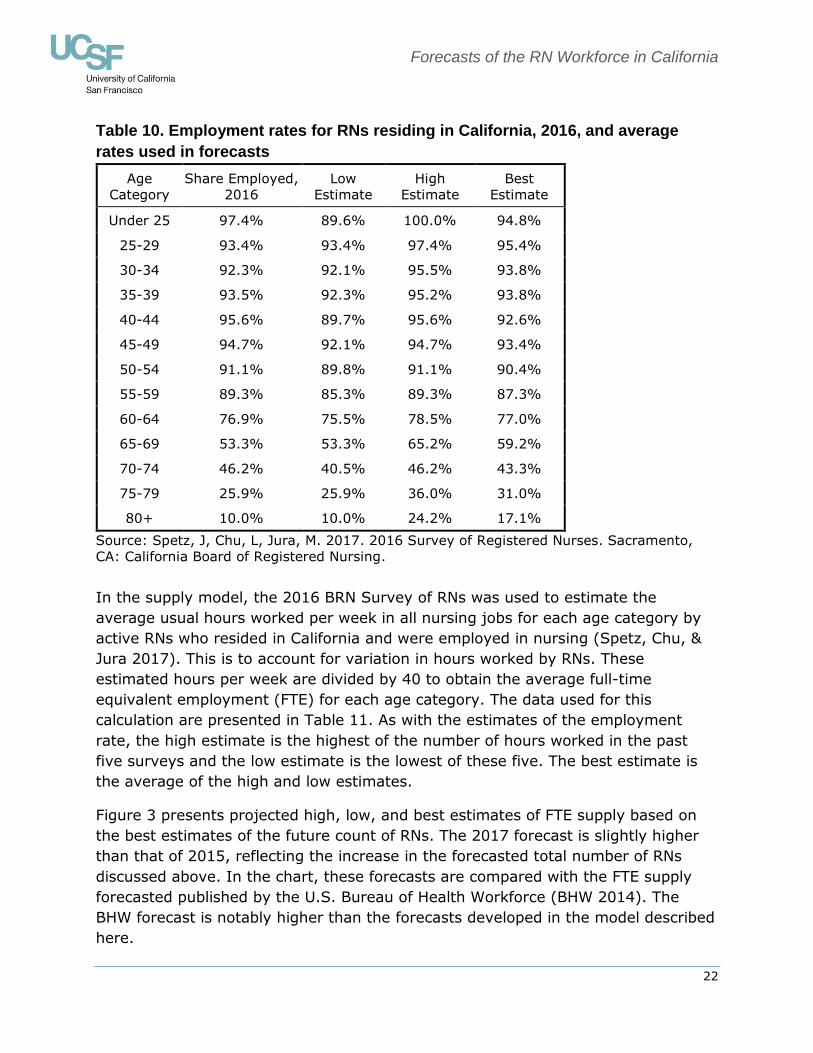
The forecasted number of RNs with active licenses does not account for the
variation in hours worked by RNs and the fact that some RNs with active licenses do
not work in nursing. Data from the 2016 BRN Survey of RNs were used to estimate
the proportion of RNs living in California with active licenses that are employed in
nursing, by age category (Spetz, Chu, & Jura 2017). The estimated employment
rates range from a high of 97.4% for RNs 25 years and younger to a low of 10% for
RNs 80 years and older. Employment rates by age groups have varied since 2008,
likely due to the economic recession that began in late 2007. During the recession,
younger nurses were employed at lower rates, and older nurses were employed at
higher rates. The low estimate of the employment rate for each age group is the
lowest of five most recent employment rates measured in biennial BRN Surveys.
The high estimate is the highest of these five rates. The best estimate is the
average of the low and high rates and is presented in Table 10.
500,434
334,279
594,347
474,059
0
100,000
200,000
300,000
400,000
500,000
600,000
700,000
Best Supply Forecast
Low Supply Forecast
High Supply Forecast
2015 Forecast
Forecasts of the RN Workforce in California
22
Table 10. Employment rates for RNs residing in California, 2016, and average
rates used in forecasts
Age
Category
Share Employed,
2016
Low
Estimate
High
Estimate
Best
Estimate
Under 25 97.4% 89.6% 100.0% 94.8%
25-29 93.4% 93.4% 97.4% 95.4%
30-34 92.3% 92.1% 95.5% 93.8%
35-39 93.5% 92.3% 95.2% 93.8%
40-44 95.6% 89.7% 95.6% 92.6%
45-49 94.7% 92.1% 94.7% 93.4%
50-54 91.1% 89.8% 91.1% 90.4%
55-59 89.3% 85.3% 89.3% 87.3%
60-64 76.9% 75.5% 78.5% 77.0%
65-69 53.3% 53.3% 65.2% 59.2%
70-74 46.2% 40.5% 46.2% 43.3%
75-79 25.9% 25.9% 36.0% 31.0%
80+ 10.0% 10.0% 24.2% 17.1%
Source: Spetz, J, Chu, L, Jura, M. 2017. 2016 Survey of Registered Nurses. Sacramento,
CA: California Board of Registered Nursing.
In the supply model, the 2016 BRN Survey of RNs was used to estimate the
average usual hours worked per week in all nursing jobs for each age category by
active RNs who resided in California and were employed in nursing (Spetz, Chu, &
Jura 2017). This is to account for variation in hours worked by RNs. These
estimated hours per week are divided by 40 to obtain the average full-time
equivalent employment (FTE) for each age category. The data used for this
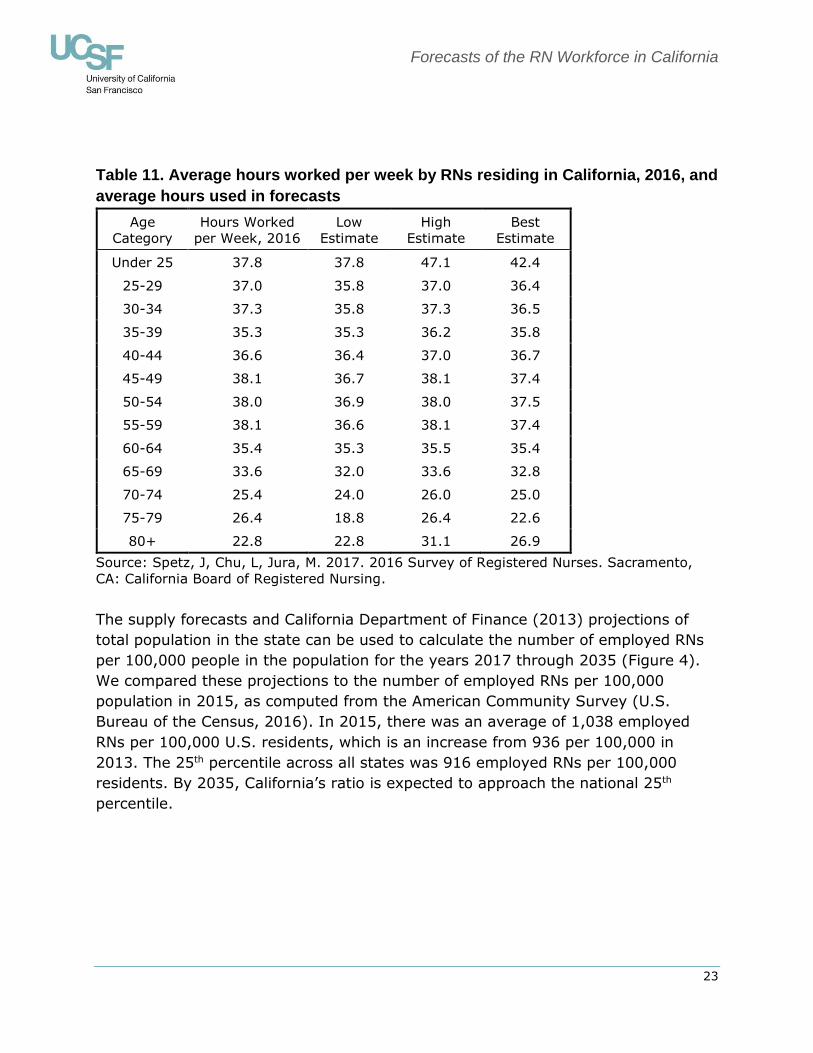
calculation are presented in Table 11. As with the estimates of the employment
rate, the high estimate is the highest of the number of hours worked in the past
five surveys and the low estimate is the lowest of these five. The best estimate is
the average of the high and low estimates.
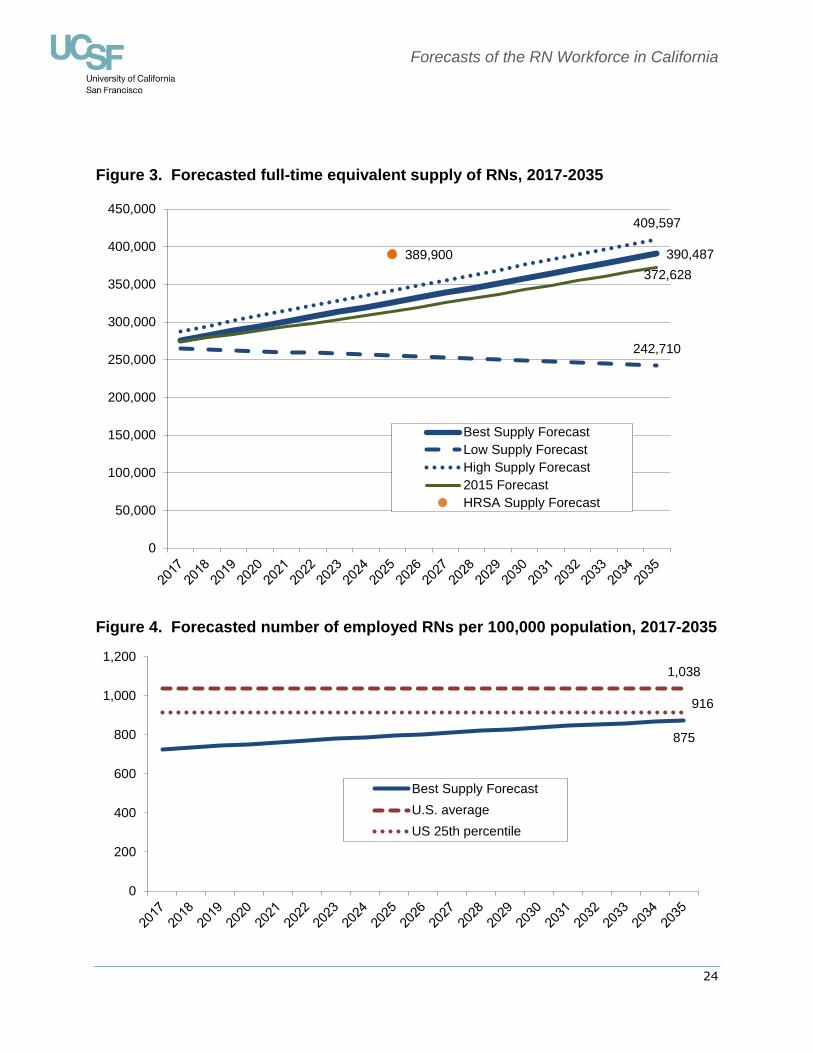
Figure 3 presents projected high, low, and best estimates of FTE supply based on
the best estimates of the future count of RNs. The 2017 forecast is slightly higher
than that of 2015, reflecting the increase in the forecasted total number of RNs
discussed above. In the chart, these forecasts are compared with the FTE supply
forecasted published by the U.S. Bureau of Health Workforce (BHW 2014). The
BHW forecast is notably higher than the forecasts developed in the model described
here.
Forecasts of the RN Workforce in California
23
Table 11. Average hours worked per week by RNs residing in California, 2016, and
average hours used in forecasts
Age
Category
Hours Worked
per Week, 2016
Low
Estimate
High
Estimate
Best
Estimate
Under 25 37.8 37.8 47.1 42.4
25-29 37.0 35.8 37.0 36.4
30-34 37.3 35.8 37.3 36.5
35-39 35.3 35.3 36.2 35.8
40-44 36.6 36.4 37.0 36.7
45-49 38.1 36.7 38.1 37.4
50-54 38.0 36.9 38.0 37.5
55-59 38.1 36.6 38.1 37.4
60-64 35.4 35.3 35.5 35.4
65-69 33.6 32.0 33.6 32.8
70-74 25.4 24.0 26.0 25.0
75-79 26.4 18.8 26.4 22.6
80+ 22.8 22.8 31.1 26.9
Source: Spetz, J, Chu, L, Jura, M. 2017. 2016 Survey of Registered Nurses. Sacramento,
CA: California Board of Registered Nursing.
The supply forecasts and California Department of Finance (2013) projections of
total population in the state can be used to calculate the number of employed RNs
per 100,000 people in the population for the years 2017 through 2035 (Figure 4).
We compared these projections to the number of employed RNs per 100,000
population in 2015, as computed from the American Community Survey (U.S.
Bureau of the Census, 2016). In 2015, there was an average of 1,038 employed
RNs per 100,000 U.S. residents, which is an increase from 936 per 100,000 in
2013. The 25th percentile across all states was 916 employed RNs per 100,000
residents. By 2035, California’s ratio is expected to approach the national 25th
percentile.
Forecasts of the RN Workforce in California
24
Figure 3. Forecasted full-time equivalent supply of RNs, 2017-2035
Figure 4. Forecasted number of employed RNs per 100,000 population, 2017-2035
390,487
242,710
409,597
372,628
389,900
0
50,000
100,000
150,000
200,000
250,000
300,000
350,000
400,000
450,000
Best Supply Forecast
Low Supply Forecast
High Supply Forecast
2015 Forecast
HRSA Supply Forecast
875
1,038
916
0
200
400
600
800
1,000
1,200
Best Supply Forecast
U.S. average
US 25th percentile
Forecasts of the RN Workforce in California
25
The Demand for RNs
The demand for RNs can be measured and forecasted in many ways, reflecting
disparate notions of what demand is or should be. Many policymakers and health
planners consider population needs as the primary factor that should dictate the
need for health care workers. For example, the World Health Organization has
established a goal of countries needing a minimum of 2.28 health care professionals
per 1,000 population in order to achieve the goal of 80 percent of deliveries being
attended by a skilled birth attendant (WHO 2006). Similarly, policymakers could
target a stable number of nurses per capita, a level developed by an expert panel,
or a goal based on comparisons with other U.S. states.
It is important to recognize, however, that population need is not the same thing as
economic demand. Nurses and other health professionals are not free, and the cost
of employing them must be weighed against other uses of resources. A nurse
employer might want to hire more nurses but may not have sufficient income from
its patient care services to afford more nurses. An employer might have resources
that could be used to hire more nurses, but might think that investment in an
electronic medical record will produce more value to patients. The demand for
nurses is essentially derived from economic forces, which may not be aligned with
population needs.
For this report, several different measures of demand (or need) are considered in
order to develop a range of plausible estimates of future demand for RNs. The
approaches used are:
Fixed benchmarks based on current RN-to-population ratios in California
Fixed benchmarks based on U.S. RN-to-population ratios
Demand forecasts based on 2015 hospital patient days, employment in
hospitals, and future population growth and aging
An employment forecast for 2024 published by the California Employment
Development Department (EDD 2016)
A demand forecast for 2025 published by the U.S. Bureau of Health Workforce (BHW 2014)
These approaches are informed by surveys of RN employers conducted from fall
2010 through 2014 and by other recent analyses of the effect of health insurance
expansion in California.
Forecasts based on RNs per capita
One frequently-used benchmark of the need for RNs is the number of employed
RNs per 100,000 population (California Institute for Nursing and Health Care,
Forecasts of the RN Workforce in California
26
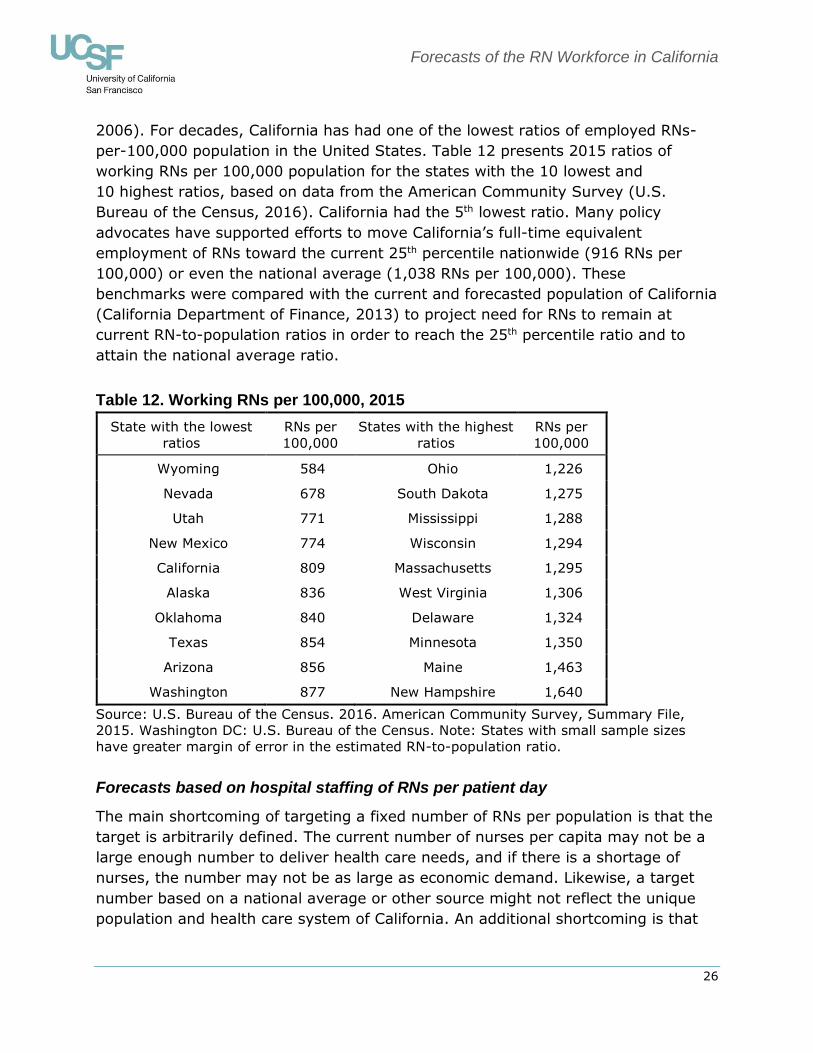
2006). For decades, California has had one of the lowest ratios of employed RNs-
per-100,000 population in the United States. Table 12 presents 2015 ratios of
working RNs per 100,000 population for the states with the 10 lowest and
10 highest ratios, based on data from the American Community Survey (U.S.
Bureau of the Census, 2016). California had the 5th lowest ratio. Many policy
advocates have supported efforts to move California’s full-time equivalent
employment of RNs toward the current 25th percentile nationwide (916 RNs per
100,000) or even the national average (1,038 RNs per 100,000). These
benchmarks were compared with the current and forecasted population of California
(California Department of Finance, 2013) to project need for RNs to remain at
current RN-to-population ratios in order to reach the 25th percentile ratio and to
attain the national average ratio.
Table 12. Working RNs per 100,000, 2015
State with the lowest
ratios
RNs per
100,000
States with the highest
ratios
RNs per
100,000
Wyoming 584 Ohio 1,226
Nevada 678 South Dakota 1,275
Utah 771 Mississippi 1,288
New Mexico 774 Wisconsin 1,294
California 809 Massachusetts 1,295
Alaska 836 West Virginia 1,306
Oklahoma 840 Delaware 1,324
Texas 854 Minnesota 1,350
Arizona 856 Maine 1,463
Washington 877 New Hampshire 1,640
Source: U.S. Bureau of the Census. 2016. American Community Survey, Summary File,
2015. Washington DC: U.S. Bureau of the Census. Note: States with small sample sizes
have greater margin of error in the estimated RN-to-population ratio.
Forecasts based on hospital staffing of RNs per patient day
The main shortcoming of targeting a fixed number of RNs per population is that the
target is arbitrarily defined. The current number of nurses per capita may not be a
large enough number to deliver health care needs, and if there is a shortage of
nurses, the number may not be as large as economic demand. Likewise, a target
number based on a national average or other source might not reflect the unique
population and health care system of California. An additional shortcoming is that
Forecasts of the RN Workforce in California
27
fixed nurse-to-population ratios do not account for increases in the demand for
health care services associated with population aging.
A second approach to forecasting demand for RNs uses current hospital utilization
and staffing patterns to estimate future demand. First, the 2015 total number of
hospital patient discharges, per ten-year age group, at short-term acute-care
hospitals was obtained (California OSHPD 2016).2 In order to estimate the total
number of patient days per age group, these data were then multiplied by the
average length of stay per age group, as reported from the 2014 Hospital National
Inpatient Statistics (AHRQ 2014).
To calculate the rate of hospital utilization per age group, the total number of
patient days per age group was divided by the estimated population of each age
group. Age-specific population estimates and forecasts were gathered from the
California Department of Finance (2013). Dividing patient days by population
provides the number of patient days per population, per age group. These rates of
patient days were then applied to the population projections to get projections of
total patient days by age category.
To produce forecasts of hospital demand for RNs, RN hours per patient day were
calculated using OSHPD’s Hospital Annual Financial Data (Office of Statewide Health
Planning and Development, 2016). In 2015, a total of 225,000,204 productive RN
hours were reported. The number of RN hours per discharge was calculated by
dividing these hours by the number of patient days in 2015, resulting in 12.51
productive RN hours per patient day. Multiplying the number of productive RN
hours per patient day by the forecasts of the total number of patient days produces
a forecast of hospital-based RN hours needed in the future. To equate these
estimates to FTE jobs, RN hours are divided by 1,768 (average annual productive
hours per FTE).
The calculations described above provide demand forecasts for only one type of
care setting (hospitals), and only for a subset of hospitals (long-term hospitals and
federal hospitals are not included in the calculations based on OSHPD data). The
OSHPD data estimate that there were 127,263 FTE hospital positions in 2015.
Calculations based on the 2016 BRN Survey of Registered Nurses find that total FTE
employment was 272,522 (Spetz et al., 2015). Together, these figures indicate that
46.7 percent of jobs were in the types of hospitals included in the OSHPD data. The
hospital-based projections of future RN demand were thus augmented to maintain
this 46.7 percent ratio in future years. The projections indicate there will be a need
for 175,096 FTE RNs in hospitals and 374,954 FTE RNs statewide in 2035. Projected
2 The age groups are under 1, 1-9, 10-19, 20-29, 30-39, 40-49, 50-59, 60-69, 70-79, and 80 and older.
Forecasts of the RN Workforce in California
28
RN FTEs in hospitals are 4.3 percent larger and projected statewide RN FTEs are 2.7
percent larger than the forecasts developed in 2015 (167,930 and 365,214
respectively), reflecting increases in hospital utilization and higher RN hours per
patient day reported by OSHPD in 2015 as compared with 2014.
Employment Development Department forecasts
The most recent projection by the EDD indicates that there will be 300,300
registered nurse jobs in California by 2024 (California Employment Development
Department, 2016). The EDD projection does not distinguish between full-time and
part-time jobs. To estimate the FTE employment implied by the EDD projection, we
use the adjustment of 0.906, which is the average number of hours worked per
week by California RNs in 2016 (36.24), divided by 40 (Spetz, Chu, and Jura 2017).
The FTE projection for 2024 is thus 272,072, which is slightly higher than the EDD’s
projection of 271,378 jobs in 2022.
Bureau of Health Workforce forecasts
The U.S. Bureau of Health Workforce developed forecasts of supply and demand for
RNs nationally and for states (BHW 2014). These forecasts are based on a multi-
step model that first projects demand for different types of health services and then
projects demand for health care workers based on estimated service demand. They
project that supply in California in 2025 will be 389,900 FTE RNs, and demand will
be 393,600 FTE RNs.
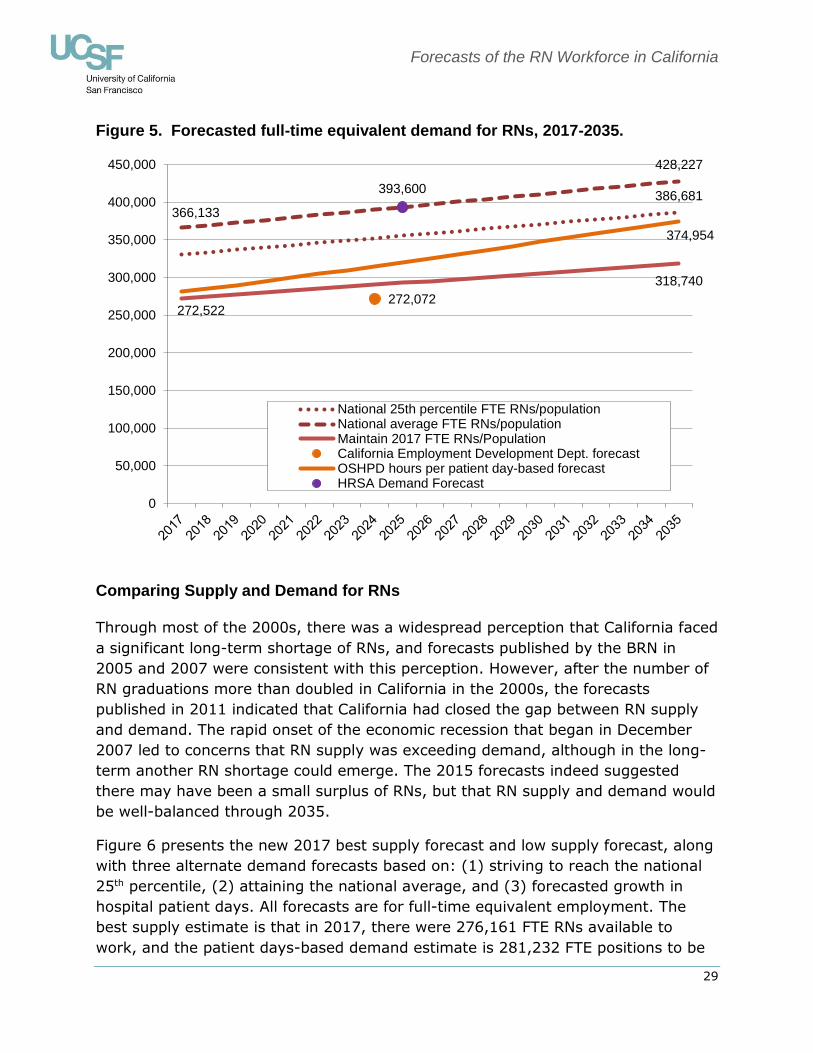
Comparing the demand forecasts
Figure 5 compares alternative demand forecasts of full-time equivalent RNs. The
forecasts estimate that the FTE demand for RNs in 2017 ranged from 272,522 to
366,133. Demand in 2035 is forecasted to be between 318,740 and 428,227. These
lower figures are not likely to accurately represent total future demand because
they do not account for additional demand caused by future population growth and
aging. The EDD forecast for 2024 is lower than that produced by maintaining the
current RN-to-population ratio. The BHW forecast for 2025 is slightly higher than
the projection based on attaining the national average RN-to-population ratio.
Forecasts of the RN Workforce in California
29
Figure 5. Forecasted full-time equivalent demand for RNs, 2017-2035.
Comparing Supply and Demand for RNs
Through most of the 2000s, there was a widespread perception that California faced
a significant long-term shortage of RNs, and forecasts published by the BRN in
2005 and 2007 were consistent with this perception. However, after the number of
RN graduations more than doubled in California in the 2000s, the forecasts
published in 2011 indicated that California had closed the gap between RN supply
and demand. The rapid onset of the economic recession that began in December
2007 led to concerns that RN supply was exceeding demand, although in the long-
term another RN shortage could emerge. The 2015 forecasts indeed suggested
there may have been a small surplus of RNs, but that RN supply and demand would
be well-balanced through 2035.
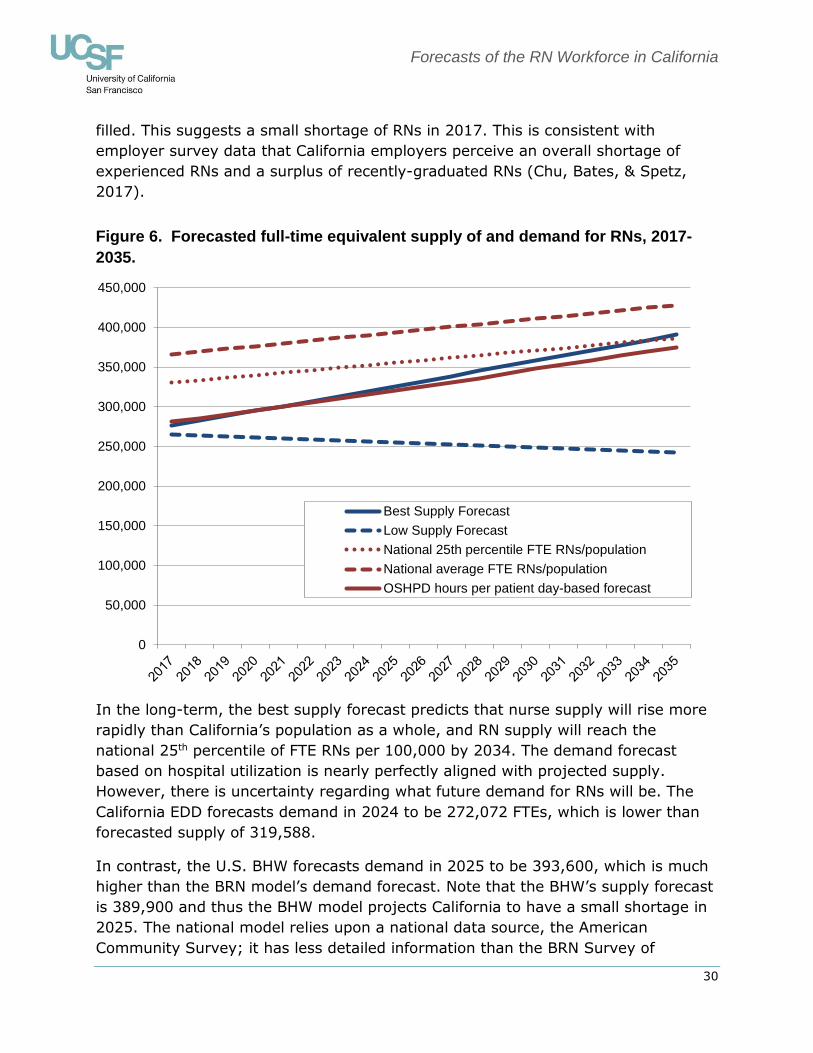
Figure 6 presents the new 2017 best supply forecast and low supply forecast, along
with three alternate demand forecasts based on: (1) striving to reach the national
25th percentile, (2) attaining the national average, and (3) forecasted growth in
hospital patient days. All forecasts are for full-time equivalent employment. The
best supply estimate is that in 2017, there were 276,161 FTE RNs available to
work, and the patient days-based demand estimate is 281,232 FTE positions to be
386,681
366,133
428,227
272,522
318,740
272,072
374,954
393,600
0
50,000
100,000
150,000
200,000
250,000
300,000
350,000
400,000
450,000
National 25th percentile FTE RNs/populationNational average FTE RNs/populationMaintain 2017 FTE RNs/PopulationCalifornia Employment Development Dept. forecastOSHPD hours per patient day-based forecastHRSA Demand Forecast
Forecasts of the RN Workforce in California
30
filled. This suggests a small shortage of RNs in 2017. This is consistent with
employer survey data that California employers perceive an overall shortage of
experienced RNs and a surplus of recently-graduated RNs (Chu, Bates, & Spetz,
2017).
Figure 6. Forecasted full-time equivalent supply of and demand for RNs, 2017-
2035.
In the long-term, the best supply forecast predicts that nurse supply will rise more
rapidly than California’s population as a whole, and RN supply will reach the
national 25th percentile of FTE RNs per 100,000 by 2034. The demand forecast
based on hospital utilization is nearly perfectly aligned with projected supply.
However, there is uncertainty regarding what future demand for RNs will be. The
California EDD forecasts demand in 2024 to be 272,072 FTEs, which is lower than
forecasted supply of 319,588.
In contrast, the U.S. BHW forecasts demand in 2025 to be 393,600, which is much
higher than the BRN model’s demand forecast. Note that the BHW’s supply forecast
is 389,900 and thus the BHW model projects California to have a small shortage in
2025. The national model relies upon a national data source, the American
Community Survey; it has less detailed information than the BRN Survey of
0
50,000
100,000
150,000
200,000
250,000
300,000
350,000
400,000
450,000
Best Supply Forecast
Low Supply Forecast
National 25th percentile FTE RNs/population
National average FTE RNs/population
OSHPD hours per patient day-based forecast
Forecasts of the RN Workforce in California
31
Registered Nurses, which may account for some of the difference between the BRN
and national projections.
The low projection of supply indicates that it is possible that California will enter
another period of RN shortage that could persist for decades. Which scenario
prevails will depend on a number of factors:
Whether the number of RN graduates is sustained at the current level or
declines
Whether inter-state migration leads to fewer nurses entering California than leaving
Whether older RNs work at higher rates than in the past
Whether expanded health insurance coverage continues, supporting
higher demand for primary care services
How organizations utilize RNs to meet population health goals and leverage value-based health insurance payment
Educational and public policies at the state and federal level will play roles in determining whether California’s RN workforce stays in balance or tips toward
shortage.
Comparison of the 2017 Forecasts with Previous Forecasts
The forecasts presented here use a similar methodology to that used in prior BRN
forecasts. The magnitude of the projected shortage changed dramatically over time.
In 2005, California had a substantial shortage of RNs, ranging between 6,872 and
21,161 RN FTEs. This shortage grew by 2007, reaching at least 10,294 RN FTEs.
However, due to growth in the number of new RN student enrollments, the 2007
forecasts predicted that the shortage would be reduced over time and that
California would surpass the national average of RN FTEs per 100,000 population
(825) by 2022. The 2009 forecasts were similar to those of 2007.
The 2011 forecasts indicated that supply would rise more rapidly than had been
previously estimated, in part due to continued growth in new student enrollments in
RN education programs and in part due to greater employment of nurses during the
economic recession. The forecasts suggested that it was possible that a surplus of
RNs would emerge in the late 2020s. However, the 2015 forecasts did not project a
future surplus of RNs, largely due to the flattening of student enrollments in RN
education programs. Supply was anticipated to grow at a rate roughly equivalent to
demand growth. The 2017 forecasts are similar to those from 2015, with supply
and demand in close alignment and a surplus unlikely to emerge.
Forecasts of the RN Workforce in California
32
The year in which California might reach the national 25th percentile or national
average of RNs-per-population has moved later in each forecast. This is in part
because the number of RNs-per-population has risen nationwide from 825 in 2007
to 1,038 in 2015. Thus, one should not interpret the later year of attainment of
these benchmarks as a sign that California’s RN workforce is not growing
adequately.
Policy Implications
Periods of nursing shortage generate significant challenges because patient
outcomes are impacted by the level of nurse staffing in hospitals and other care
facilities (Kane & Shamliyan, 2007; Institute of Medicine, 2011; Penoyer, 2010). In
addition, shortages drive up the cost of health care as wages rise (Spetz and Given,
2003). Thus, it is essential that these forecasts of RN supply and demand guide
policies to prevent RN shortages.
The 2005 forecast report advised that “The only plausible solution to the RN
shortage, based on our preliminary analyses, appears to be continued efforts to
increase the numbers of graduates from California nursing programs.” This
recommendation was acted upon by state leaders. Significant increases in state
funding for nursing programs, increased funding for equipment, use of updated
instructional technologies, and other educational investments had a favorable
impact on addressing the RN shortage in California. Between the academic years
2004-2005 and 2009-2010, the number of nursing graduates increased 72 percent,
exceeding 11,500 new RN graduates in 2009-2010 (Waneka, Keane, & Spetz
2012). The total number of graduates has stabilized since then, ranging from
10,666 and 11,292 since 2010-2011. The number of graduates is projected to
remain above 10,000 per year through 2019-2020, thus leading to a stable
workforce. If future numbers of student enrollments and graduates decline, a
shortage could re-emerge.
Changes in the demand for RNs also could lead to a future shortage or surplus. If
emerging care delivery models, such as accountable care organizations and patient-
centered medical homes, lead to greater use of RNs in care management roles,
demand for RNs could rise above the projections presented in this report. A recent
report (Oberlin et al. 2015) found that if health care organizations increase
employment of RNs by 10 percent to serve in care management roles, overall
demand would increase by about 22,000 jobs in California (which may include some
part-time jobs). This would be a relatively small change in demand, which would
likely emerge slowly enough over time that nursing education programs could
respond by increasing student enrollment.
Forecasts of the RN Workforce in California
33
Policymakers should be cautioned that the 2017 BRN forecasts represent the state
as a whole and do not reflect the fact that one region of California may experience
a shortage while another may face a surplus of RNs. Both statewide and regionally,
the most important changes that could lead to shortages include: (1) the number of
graduates from RN education programs; (2) inter-state migration; and (3) employ-
ment rates of older RNs. These factors and any other potential influences on
California’s nursing shortage, such as the limited pool of faculty, limited availability
of clinical education placements, and faculty salaries that are not competitive with
clinical practice positions, should be monitored continuously.
California leaders should track the employment paths of recent nursing graduates
as they develop specialized skills to fill the roles of experienced nurses who will
retire in the near future. Moreover, they should watch new student enrollments in
nursing programs, as well as monitor local labor market conditions, which could
warrant local action. California will need to maintain the present number of nursing
graduates in order to meet long-term health care needs.
Forecasts of the RN Workforce in California
34
Acronyms
ACA – Affordable Care Act of 2010
AD – Associate Degree
BHW – Bureau of Health Workforce, Health Resources and Services Administration, U.S. Department of Health and Human Services
BRN – California Board of Registered Nursing
BSN – Bachelors (or Baccalaureate) of Science in Nursing
EDD – California Employment Development Department
FTE – Full-time Equivalent
NCLEX-RN – National Council Licensure Examination – Registered Nurses (NCLEX is
a registered trademark and/or servicemark of the National Council of State Boards of Nursing, Inc.)
NSSRN – National Sample Survey of Registered Nurses (last conducted in 2008)
OSHPD – California Office of Statewide Health Planning and Development
RN – Registered Nurse
UCSF – University of California San Francisco
WHO – World Health Organization
Forecasts of the RN Workforce in California
35
References
Bates, T, Keane, D, Spetz, J. 2011. Survey of Nurse Employers in California, Fall
2010. San Francisco, CA: University of California, San Francisco.
Blash, L, Spetz, J. 2017. 2015-2016 Annual School Report: Data Summary and Historical Trend Analysis. Sacramento, CA: California Board of Registered
Nursing.
Buerhaus, PI. 1998. Is Another RN Shortage Looming? Nursing Outlook 46 (3):
103-108.
Buerhaus, PI, Auerbach, DI. 2011. The Recession’s Effect on Hospital Registered Nurse Employment Growth. Nursing Economics 29 (4): 163-167.
California Department of Finance. 2013. State of California, Department of Finance, State and County Total Population Projections by Race/Ethnicity and Detailed
Age 2010 through 2060 (as of July 1). Sacramento, CA: California Department of Finance. Available from: http://dof.ca.gov/Forecasting/Demographics/Projections/
California Employment Development Department (EDD). 2016. California Occupational Employment Projections, 2014-2024. Sacramento, CA: Labor
Market Information Division, California Employment Development Department. Available from http://www.labormarketinfo.edd.ca.gov/data/employment-projections.html#Long
California Institute for Nursing and Health Care. 2006. California Registered Nurse Regional Workforce Report Card. Berkeley, CA: California Institute for Nursing
and Health Care.
California Office of Statewide Health Planning and Development (OSHPD). 2016.
Annual Financial Data Pivot Profiles, 2015. Sacramento, CA: California Office of Statewide Health Planning and Development. Available at http://www.oshpd.ca.gov/HID/Products/Hospitals/AnnFinanData/PivotProfles/de
fault.asp
Charles, SA. 2015. Adult Medi-Cal Enrollment Surges, Uninsured Rate Plummets in
2014. Los Angeles, CA: UCLA Center for Health Policy Research. http://healthpolicy.ucla.edu/publications/Documents/PDF/2015/Medi-Cal-factsheet-aug2015.pdf.
Chu, L, Bates, T, Spetz, J. 2017. Survey of Nursing Employers in California, Fall 2016. San Francisco, CA: Philip R. Lee Institute for Health Policy Studies,
University of California, San Francisco.
Cohen, RA, Martinez, ME, Zammitti, EP. 2016. Health Insurance Coverage: Early Release of Estimates From the National Health Interview Survey, 2015.
Hyattsville MD: National Center for Health Statistics.
HealthImpact. 2017. 2015-2016 California New Graduate Employment Survey.
Oakland, CA: HealthImpact. https://healthimpact.org/wp-content/uploads/2017/01/2015-2016-California-New-Graduate-Employment-Survey-02-03-17.pdf
Forecasts of the RN Workforce in California
36
Institute of Medicine. 2011. The future of nursing: Leading change, advancing health. Washington, DC: National Academies Press.
Kane, RL, Shamliyan, TA. 2007. The association of registered nurse staffing levels and patient outcomes: Systematic review and meta-analysis. Medical Care 45:
1195-1204.
Oberlin, S, Chapman, S, Spetz, J, Waneka, R. 2015. Impact of the 2010 Affordable Care Act on the California Health Care Labor Force. San Francisco, CA:
University of California, San Francisco.
Penoyer, DA. 2010. Nurse staffing and patient outcomes in critical care: A concise
review. Critical Care Nursing 38 (7): 1521-1528.
Spetz, J. 2007. Forecasts of the Registered Nurse Workforce in California. Sacramento, CA: California Board of Registered Nursing.
Spetz, J. 2009. Forecasts of the Registered Nurse Workforce in California. Sacramento, CA: California Board of Registered Nursing.
Spetz, J. 2011. Forecasts of the Registered Nurse Workforce in California. Sacramento, CA: California Board of Registered Nursing.
Spetz, J. 2013. Forecasts of the Registered Nurse Workforce in California.
Sacramento, CA: California Board of Registered Nursing.
Spetz, J. 2014. Economics of Health Care and Nursing: How Will Health Reform
Affect Demand for RNs? Nursing Economics 32 (1): 42-43.
Spetz, J. 2015. Forecasts of the Registered Nurse Workforce in California. Sacramento, CA: California Board of Registered Nursing.
Spetz, J, Chu, L, Jura, M. 2017. 2016 Survey of Registered Nurses. Sacramento, CA: California Board of Registered Nursing.
Spetz, J, Dyer, WT. 2005. Forecasts of the Registered Nurse Workforce in California. Sacramento, CA: California Board of Registered Nursing.
Spetz, J, Given, R. 2003. The Future of the Nurse Shortage: Will Wage Increases Close the Gap? Health Affairs 22 (6): 199-206.
Spetz, J, Keane, D, Herrera, C. 2011. 2010 Survey of Registered Nurses.
Sacramento, CA: California Board of Registered Nursing.
U.S. Agency for Healthcare Research and Quality (AHRQ). 2014. Hospital National
Inpatient Statistics. Retrieved via HCUPNet: Healthcare Cost and Utilization Project. Rockville MD: U.S. Agency for Healthcare Research and Quality. https://hcupnet.ahrq.gov/#setup
U.S. Bureau of the Census. 2016. American Community Survey, Summary File, 2015. Washington DC: U.S. Bureau of the Census.
U.S. Bureau of Health Professions. 2010. The Registered Nurse Population: Findings from the 2008 National Sample Survey of Registered Nurses. Washington, DC: U.S. Health Resources and Services Administration, Department of Health and
Human Services.
U.S. Bureau of Health Workforce (BHW). 2014. Future of the Nursing Workforce:
National- and State-Level Projections, 2012-2025. Rockville, MD: U.S. Health
Forecasts of the RN Workforce in California
37
Resources and Services Administration, Department of Health and Human Services.
Waneka, R, Keane, D, Spetz, J. 2012. 2010-2011 Annual School Report: Data Summary and Historical Trend Analysis. Sacramento, CA: California Board of
Registered Nursing,
Waneka, R, Spetz, J, Chan, M. 2008. The Movement of Registered Nurse into and out of California. Sacramento, CA: California Board of Registered Nursing.
http://www.rn.ca.gov/pdfs/forms/endreport11-08.pdf
World Health Organization. 2006. Working Together for Health: The World Health
Report 2006. Geneva: World Health Organization.