Embed Size (px)
Citation preview
Available online at www.sciencedirect.com
Nur s Ou t l o o k x x x ( 2 0 1 6 ) 1e 7www.nursingoutlook.org
How fast will the registered nurse workforce grow through2030? Projections in nine regions of the country
David I. Auerbach, PhDa,*, Peter I. Buerhaus, PhD, RN, FAANa,Douglas O. Staiger, PhDb,c
aCenter for Interdisciplinary Health Workforce Studies, College of Nursing, Montana State University, Bozeman, MTbDepartment of Economics, Dartmouth College, Hanover, NH
cNational Bureau of Economic Research, Cambridge, MA
a r t i c l e i n f o
Article history:Received 30 May 2016Revised - - -
Accepted 4 July 2016
Keywords:WorkforceSupplyRegistered Nurses
* Corresponding author: David I. Auerbach, 3E-mail address: [email protected] (D.I
0029-6554/$ - see front matter � 2016 Elsevihttp://dx.doi.org/10.1016/j.outlook.2016.07.004
a b s t r a c t
Background: After an unprecedented increase in nursing school enrollment andgraduates in the past 10 years, projected shortages of nurses have been erased ata national level. However, nursing markets are local, and an uneven distributionof health care providers of all types is a longstanding feature of health care inthe United States.Purpose: The purpose of this study was to understand how the outlook for futureregistered nurse (RN) supply varies regionally across the United States.Methods: We apply our nursing supply model to the nine U.S. Census Divisions toproduce separate supply forecasts for each region.Discussion: We find dramatic differences in expected future growth of the nursingworkforce across U.S. regions. These range from zero expected growth in thenumber of RNs per capita in New England and in the Pacific regions between2015 and 2030 to 40% growth in the East South Central region (Mississippi,Alabama, Tennessee, Kentucky) and in the West South Central region (Texas,Oklahoma, Arkansas, Louisiana).Conclusion: Assuming growth in the demand for RNs per population, some regionsof the United States are expected to face shortfalls in their nursing workforce ifrecent trends do not change.
Cite this article: Auerbach, D. I., Buerhaus, PeterI., & Staiger, D. O. (2016, -). How fast will the registered
nurse workforce grow through 2030? Projections in nine regions of the country. Nursing Outlook, -(-), 1-
7. http://dx.doi.org/10.1016/j.outlook.2016.07.004.
Introduction
After a decade-long unprecedented expansion innursing school enrollments, the outlook for the nursingworkforce has turned fromone of dire shortages to near-balance and even a small surplus according to oneforecast (Auerbach, Buerhaus, & Staiger, 2015; Spetz,2015; U.S. Department of Health and Human Services,
4 Emerson St, Newton, M. Auerbach).
er Inc. All rights reserved
Health Resources and Services Administration, Bureauof Health Professions, National Center for HealthWorkforce Analysis, 2014). However, these national-level assessments belie substantial differences at thesubnational level. Researchers recently projected thefuture supply of full-time equivalent (FTE) registerednurses (RNs) through 2030 according to four regions ofthe countrydNortheast, South, Midwest, and West(Buerhaus, Auerbach, Staiger, & Muench, 2013). The
A 02458.
.
Nur s Ou t l o o k x x x ( 2 0 1 6 ) 1e 72
study found substantial differences in outlook in eachregion, with states in the Midwest and South havingyounger RN workforces and much higher expectedsupply growth relative to the region’s population growththrough 2030 (17.4% per capita and 10.8% per capita,respectively). In contrast, the size of the RN workforcesin the West and Northeast regions was projected todecline relative to the growth of their overall population(�2.5% per capita and �6.0% per capita).
This article provides regional projections of thenumber of FTE RNs based on workforce data through2014. Unlike the previous regional forecasts publishedin 2013, the projections reported here extend thatanalysis by further dividing the country into ninecensus divisions. These more detailed forecasts pro-vide agencies and stakeholders with more actionableinformation at a local level. We find strikingly differentpatterns by region suggesting some areas of the UnitedStates may be facing large shortages over the nextdecade while others are poised to readily meet thegrowing demands of an aging population.
Methods
Data
The workforce projection model requires informationon the age of RNs, their employment status, hoursworked, and the age and size of the U.S. population.Data on the age and employment of RNs were obtainedfrom the Current Population Survey (CPS) and theAmerican Community Survey (ACS). The CPS is ahousehold-based, nationally representative survey ofover 100,000 individuals administered monthly by theBureau of the Census. The CPS has asked detailedquestions about employment (including occupationand hours worked) since 1973 and is used by theDepartment of Labor to estimate current trends inunemployment, employment, and earnings. When themonthly surveys are aggregated to a yearly basis, theCPS provides data on approximately 3,000 RNs per year.
The ACS, which began reporting data in 2001, ismodeled after the long form of the decennial census.Although it contains fewer questions than the CPS, theACS obtainsmuch larger sample sizesdapproximately12,000 RNs from 2001 to 2004 and roughly 35,000 RNsper year thereafter (after the sampling frame wasexpanded). These larger sample sizes enable work-force trends in nursing to be analyzed with greateraccuracy. Consequently, the projection model usesdata from the ACS data rather than the CPS databeginning in 2001.
The data analyzed included all individuals betweenthe ages of 23 and 69 years who reported beingemployed as an RN during the week of the survey be-tween 1979 and 2014 (N¼ 70,201 in the CPS,N¼ 366,927in the ACS). To be consistent with previous projections,RNs reporting working fewer than 30 hr in a typical
weekwere recorded as .5 FTEs. These data were used toestimate the number of FTE RNs of each single year ofage who were working in each year of our data. Tomake estimates representative of the U.S. noninstitu-tionalized population, observations were weighted bysampling weights provided by the CPS and ACS. Addi-tional data on the U.S. population by year, state, andage between 1979 and 2014were obtained from the U.S.Bureau of the Census. Forecasts of the U.S. populationthrough 2030 by age were obtained from projectionsprepared by the U.S. Bureau of the Census.
Statistical Analysis
CPS and ACS data were used to estimate the number ofFTE RNs by age and year. These estimates were sub-sequently used in a projection model that was runseparately for each of nine regions within the UnitedStates (Figure 1). The model predicts the proportion ofthe population in a given birth cohort that will beworking as RNs at each age as the product of a cohorteffect (defined by birth year) and an age effect. Cohorteffects refer to the propensity of individuals born inany given year to work as RNs and capture changesacross birth cohorts in the perceived attractiveness of anursing career relative to other occupations. Age ef-fects refer to the relative propensity of RNs to beworking at different ages and capture life-cycle pat-terns such as retirement and the tendency of femaleRNs to work less during childbearing years. Thus, theproportion of any particular cohort working as RNs at agiven age is the product of the propensity of that cohortto choose nursing as a career and the propensity of RNsto be working at that age.
Estimation
Analysis of variance was used to estimate the age andcohort effects for each U.S. region. The dependentvariable in the model was the logarithm of the numberof FTE RNs of every age between 23 and 69 years forevery year between 1979 and 2014 (46 years of agetimes 36 years equals 1,656 total observations) dividedby the regional U.S. population in that given year-agecell. The analysis of variance model estimated maineffects for cohort (birth year) and age, and two inter-action effects to capture instances where the life-cyclepattern of nursing careers changed: the shift towardolder ages of first entry into the workforce by cohortsborn after 1965 (Auerbach, Buerhaus, & Staiger, 2007)and the shift toward older ages of retirement startingroughly in the early 2000s (Auerbach, Buerhaus, &Staiger, 2014). All statistical analyses were performedusing Stata, version 14.1.
Projections
Estimates of age and cohort effects were used to projectthe numbers of FTE RNs through 2030.We assumed thatage effects in future years will be the same as those
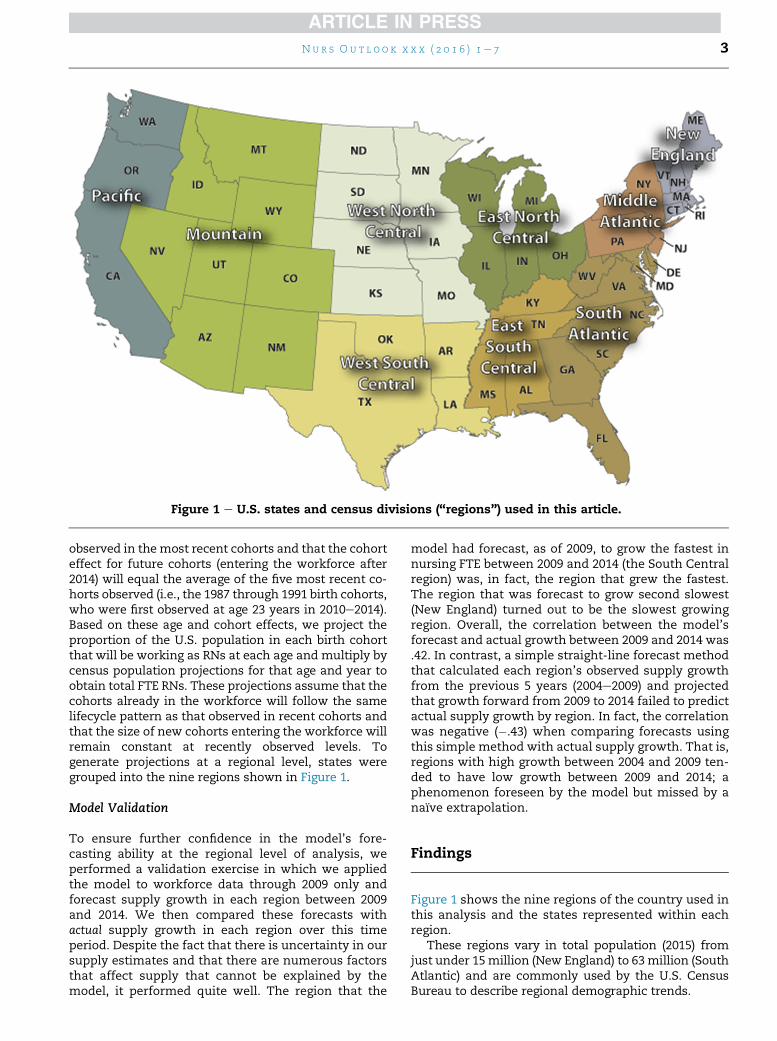
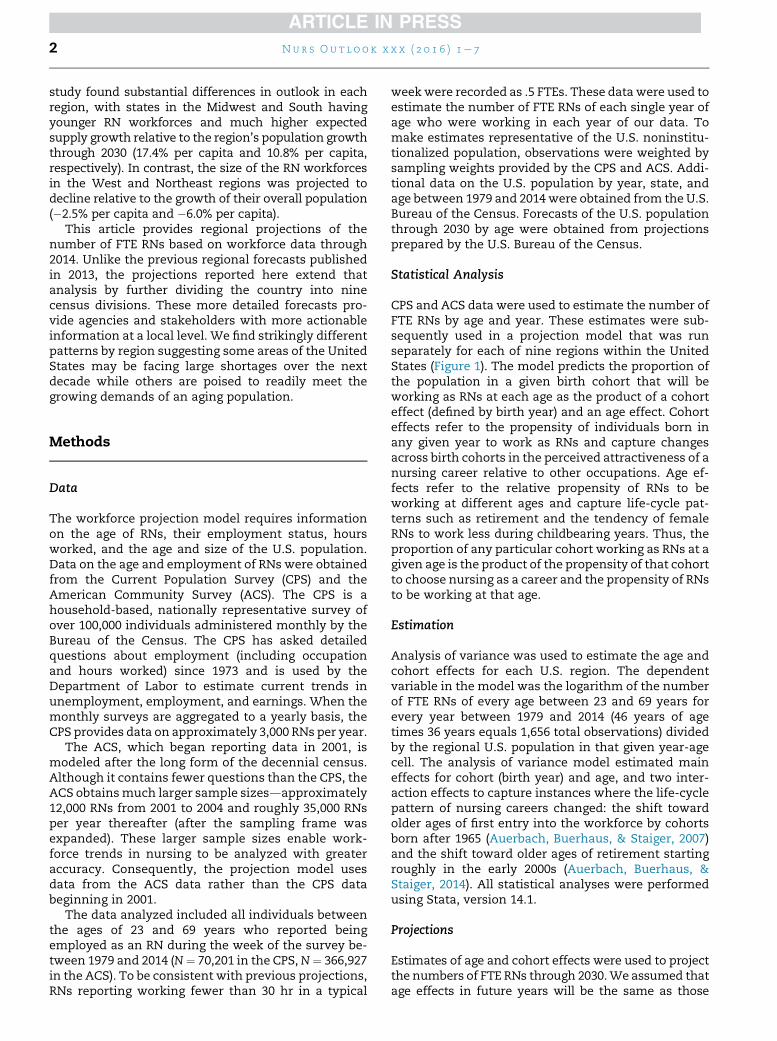
Figure 1 e U.S. states and census divisions (“regions”) used in this article.
Nur s Ou t l o o k x x x ( 2 0 1 6 ) 1e 7 3
observed in themost recent cohorts and that the cohorteffect for future cohorts (entering the workforce after2014) will equal the average of the five most recent co-horts observed (i.e., the 1987 through 1991 birth cohorts,who were first observed at age 23 years in 2010e2014).Based on these age and cohort effects, we project theproportion of the U.S. population in each birth cohortthat will be working as RNs at each age and multiply bycensus population projections for that age and year toobtain total FTE RNs. These projections assume that thecohorts already in the workforce will follow the samelifecycle pattern as that observed in recent cohorts andthat the size of new cohorts entering the workforce willremain constant at recently observed levels. Togenerate projections at a regional level, states weregrouped into the nine regions shown in Figure 1.
Model Validation
To ensure further confidence in the model’s fore-casting ability at the regional level of analysis, weperformed a validation exercise in which we appliedthe model to workforce data through 2009 only andforecast supply growth in each region between 2009and 2014. We then compared these forecasts withactual supply growth in each region over this timeperiod. Despite the fact that there is uncertainty in oursupply estimates and that there are numerous factorsthat affect supply that cannot be explained by themodel, it performed quite well. The region that the
model had forecast, as of 2009, to grow the fastest innursing FTE between 2009 and 2014 (the South Centralregion) was, in fact, the region that grew the fastest.The region that was forecast to grow second slowest(New England) turned out to be the slowest growingregion. Overall, the correlation between the model’sforecast and actual growth between 2009 and 2014 was.42. In contrast, a simple straight-line forecast methodthat calculated each region’s observed supply growthfrom the previous 5 years (2004e2009) and projectedthat growth forward from 2009 to 2014 failed to predictactual supply growth by region. In fact, the correlationwas negative (�.43) when comparing forecasts usingthis simple method with actual supply growth. That is,regions with high growth between 2004 and 2009 ten-ded to have low growth between 2009 and 2014; aphenomenon foreseen by the model but missed by anaı̈ve extrapolation.
Findings
Figure 1 shows the nine regions of the country used inthis analysis and the states represented within eachregion.
These regions vary in total population (2015) fromjust under 15million (New England) to 63million (SouthAtlantic) and are commonly used by the U.S. CensusBureau to describe regional demographic trends.
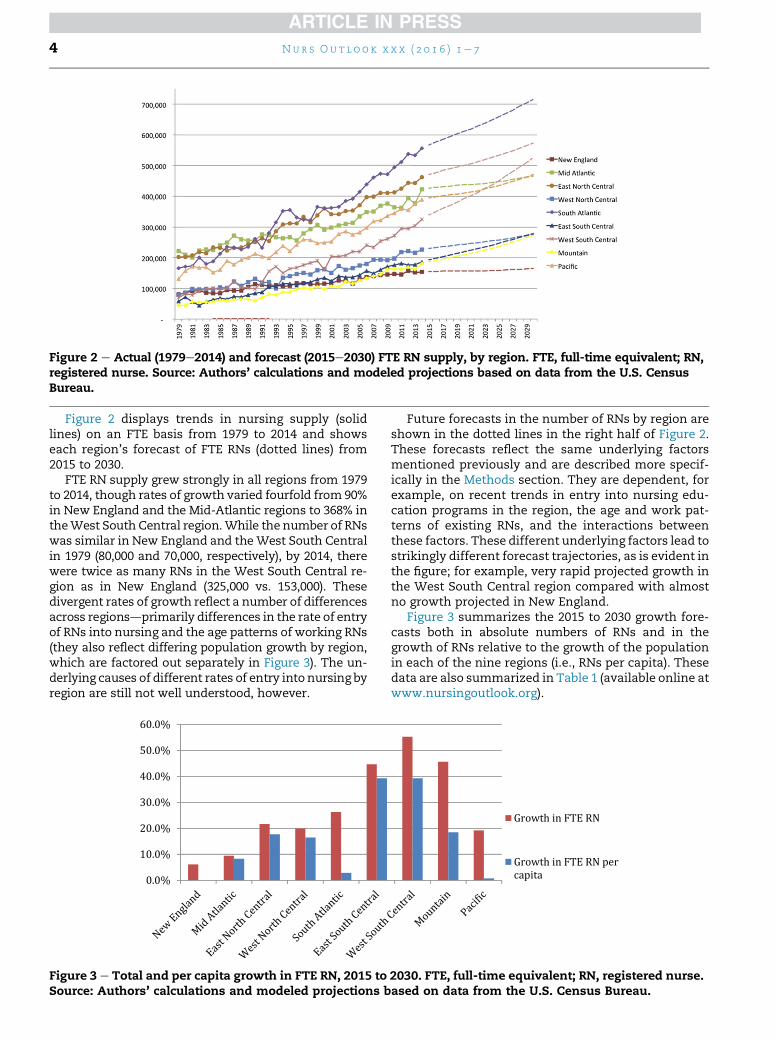
Figure 2 e Actual (1979e2014) and forecast (2015e2030) FTE RN supply, by region. FTE, full-time equivalent; RN,registered nurse. Source: Authors’ calculations and modeled projections based on data from the U.S. CensusBureau.
Nur s Ou t l o o k x x x ( 2 0 1 6 ) 1e 74
Figure 2 displays trends in nursing supply (solidlines) on an FTE basis from 1979 to 2014 and showseach region’s forecast of FTE RNs (dotted lines) from2015 to 2030.
FTE RN supply grew strongly in all regions from 1979to 2014, though rates of growth varied fourfold from 90%in New England and the Mid-Atlantic regions to 368% intheWest South Central region.While the number of RNswas similar in New England and theWest South Centralin 1979 (80,000 and 70,000, respectively), by 2014, therewere twice as many RNs in the West South Central re-gion as in New England (325,000 vs. 153,000). Thesedivergent rates of growth reflect a number of differencesacross regionsdprimarily differences in the rate of entryof RNs into nursing and the age patterns of working RNs(they also reflect differing population growth by region,which are factored out separately in Figure 3). The un-derlying causes of different rates of entry into nursing byregion are still not well understood, however.
0.0%
10.0%
20.0%
30.0%
40.0%
50.0%
60.0%
Figure 3 e Total and per capita growth in FTE RN, 2015 toSource: Authors’ calculations and modeled projections b
Future forecasts in the number of RNs by region areshown in the dotted lines in the right half of Figure 2.These forecasts reflect the same underlying factorsmentioned previously and are described more specif-ically in the Methods section. They are dependent, forexample, on recent trends in entry into nursing edu-cation programs in the region, the age and work pat-terns of existing RNs, and the interactions betweenthese factors. These different underlying factors lead tostrikingly different forecast trajectories, as is evident inthe figure; for example, very rapid projected growth inthe West South Central region compared with almostno growth projected in New England.
Figure 3 summarizes the 2015 to 2030 growth fore-casts both in absolute numbers of RNs and in thegrowth of RNs relative to the growth of the populationin each of the nine regions (i.e., RNs per capita). Thesedata are also summarized in Table 1 (available online atwww.nursingoutlook.org).
Growth in FTE RN
Growth in FTE RN percapita
2030. FTE, full-time equivalent; RN, registered nurse.ased on data from the U.S. Census Bureau.
Nur s Ou t l o o k x x x ( 2 0 1 6 ) 1e 7 5
Differences in rates of population growth by regionlead to even greater variation in the forecast growth inper-capita RNs by region: from zero growth in NewEngland and the Pacific regions and 2.9% growth in theSouth Atlantic to almost 40% growth in RNs per capitain the East and West South Central regions.
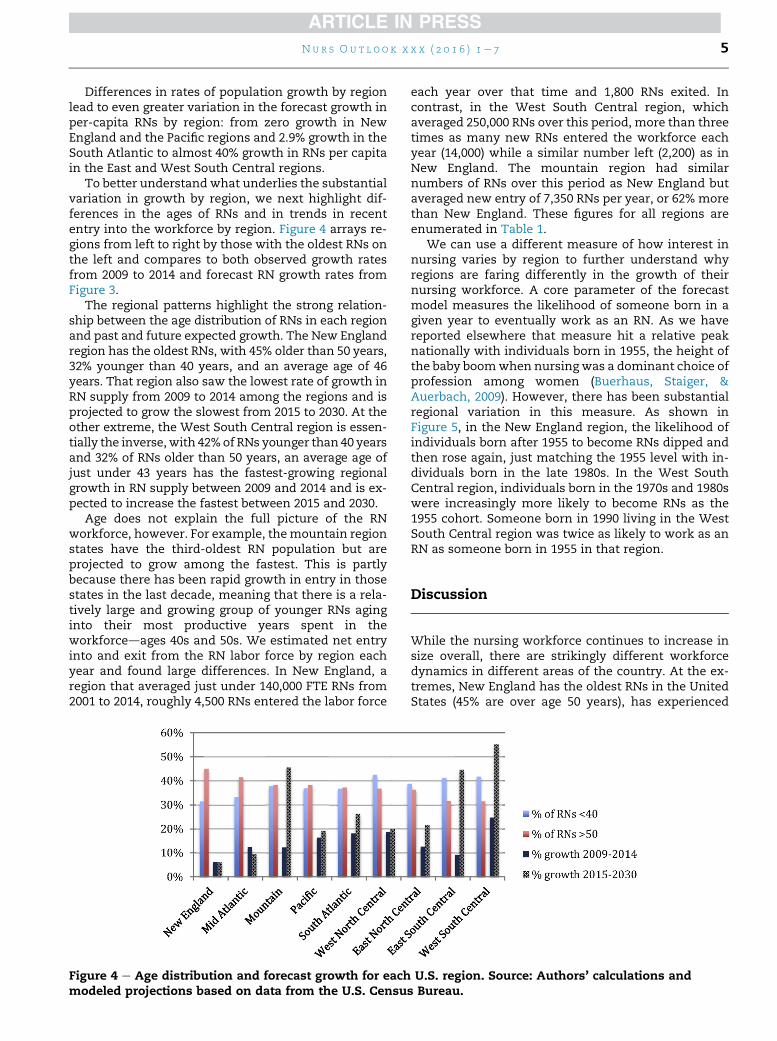
To better understand what underlies the substantialvariation in growth by region, we next highlight dif-ferences in the ages of RNs and in trends in recententry into the workforce by region. Figure 4 arrays re-gions from left to right by those with the oldest RNs onthe left and compares to both observed growth ratesfrom 2009 to 2014 and forecast RN growth rates fromFigure 3.
The regional patterns highlight the strong relation-ship between the age distribution of RNs in each regionand past and future expected growth. The New Englandregion has the oldest RNs, with 45% older than 50 years,32% younger than 40 years, and an average age of 46years. That region also saw the lowest rate of growth inRN supply from 2009 to 2014 among the regions and isprojected to grow the slowest from 2015 to 2030. At theother extreme, the West South Central region is essen-tially the inverse,with 42%of RNs younger than 40 yearsand 32% of RNs older than 50 years, an average age ofjust under 43 years has the fastest-growing regionalgrowth in RN supply between 2009 and 2014 and is ex-pected to increase the fastest between 2015 and 2030.
Age does not explain the full picture of the RNworkforce, however. For example, themountain regionstates have the third-oldest RN population but areprojected to grow among the fastest. This is partlybecause there has been rapid growth in entry in thosestates in the last decade, meaning that there is a rela-tively large and growing group of younger RNs aginginto their most productive years spent in theworkforcedages 40s and 50s. We estimated net entryinto and exit from the RN labor force by region eachyear and found large differences. In New England, aregion that averaged just under 140,000 FTE RNs from2001 to 2014, roughly 4,500 RNs entered the labor force
Figure 4 e Age distribution and forecast growth for eachmodeled projections based on data from the U.S. Censu
each year over that time and 1,800 RNs exited. Incontrast, in the West South Central region, whichaveraged 250,000 RNs over this period, more than threetimes as many new RNs entered the workforce eachyear (14,000) while a similar number left (2,200) as inNew England. The mountain region had similarnumbers of RNs over this period as New England butaveraged new entry of 7,350 RNs per year, or 62% morethan New England. These figures for all regions areenumerated in Table 1.
We can use a different measure of how interest innursing varies by region to further understand whyregions are faring differently in the growth of theirnursing workforce. A core parameter of the forecastmodel measures the likelihood of someone born in agiven year to eventually work as an RN. As we havereported elsewhere that measure hit a relative peaknationally with individuals born in 1955, the height ofthe baby boomwhen nursing was a dominant choice ofprofession among women (Buerhaus, Staiger, &Auerbach, 2009). However, there has been substantialregional variation in this measure. As shown inFigure 5, in the New England region, the likelihood ofindividuals born after 1955 to become RNs dipped andthen rose again, just matching the 1955 level with in-dividuals born in the late 1980s. In the West SouthCentral region, individuals born in the 1970s and 1980swere increasingly more likely to become RNs as the1955 cohort. Someone born in 1990 living in the WestSouth Central region was twice as likely to work as anRN as someone born in 1955 in that region.
Discussion
While the nursing workforce continues to increase insize overall, there are strikingly different workforcedynamics in different areas of the country. At the ex-tremes, New England has the oldest RNs in the UnitedStates (45% are over age 50 years), has experienced
U.S. region. Source: Authors’ calculations ands Bureau.
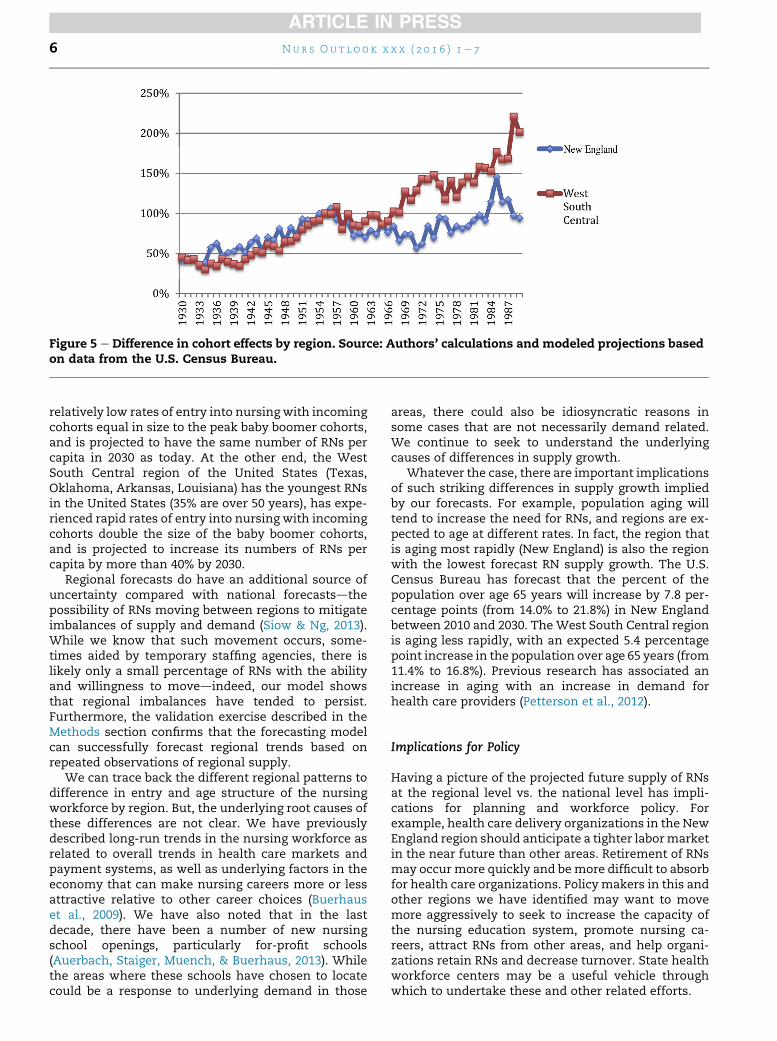
Figure 5 e Difference in cohort effects by region. Source: Authors’ calculations and modeled projections basedon data from the U.S. Census Bureau.
Nur s Ou t l o o k x x x ( 2 0 1 6 ) 1e 76
relatively low rates of entry into nursing with incomingcohorts equal in size to the peak baby boomer cohorts,and is projected to have the same number of RNs percapita in 2030 as today. At the other end, the WestSouth Central region of the United States (Texas,Oklahoma, Arkansas, Louisiana) has the youngest RNsin the United States (35% are over 50 years), has expe-rienced rapid rates of entry into nursing with incomingcohorts double the size of the baby boomer cohorts,and is projected to increase its numbers of RNs percapita by more than 40% by 2030.
Regional forecasts do have an additional source ofuncertainty compared with national forecastsdthepossibility of RNs moving between regions to mitigateimbalances of supply and demand (Siow & Ng, 2013).While we know that such movement occurs, some-times aided by temporary staffing agencies, there islikely only a small percentage of RNs with the abilityand willingness to movedindeed, our model showsthat regional imbalances have tended to persist.Furthermore, the validation exercise described in theMethods section confirms that the forecasting modelcan successfully forecast regional trends based onrepeated observations of regional supply.
We can trace back the different regional patterns todifference in entry and age structure of the nursingworkforce by region. But, the underlying root causes ofthese differences are not clear. We have previouslydescribed long-run trends in the nursing workforce asrelated to overall trends in health care markets andpayment systems, as well as underlying factors in theeconomy that can make nursing careers more or lessattractive relative to other career choices (Buerhauset al., 2009). We have also noted that in the lastdecade, there have been a number of new nursingschool openings, particularly for-profit schools(Auerbach, Staiger, Muench, & Buerhaus, 2013). Whilethe areas where these schools have chosen to locatecould be a response to underlying demand in those
areas, there could also be idiosyncratic reasons insome cases that are not necessarily demand related.We continue to seek to understand the underlyingcauses of differences in supply growth.
Whatever the case, there are important implicationsof such striking differences in supply growth impliedby our forecasts. For example, population aging willtend to increase the need for RNs, and regions are ex-pected to age at different rates. In fact, the region thatis aging most rapidly (New England) is also the regionwith the lowest forecast RN supply growth. The U.S.Census Bureau has forecast that the percent of thepopulation over age 65 years will increase by 7.8 per-centage points (from 14.0% to 21.8%) in New Englandbetween 2010 and 2030. TheWest South Central regionis aging less rapidly, with an expected 5.4 percentagepoint increase in the population over age 65 years (from11.4% to 16.8%). Previous research has associated anincrease in aging with an increase in demand forhealth care providers (Petterson et al., 2012).
Implications for Policy
Having a picture of the projected future supply of RNsat the regional level vs. the national level has impli-cations for planning and workforce policy. Forexample, health care delivery organizations in the NewEngland region should anticipate a tighter labormarketin the near future than other areas. Retirement of RNsmay occur more quickly and bemore difficult to absorbfor health care organizations. Policy makers in this andother regions we have identified may want to movemore aggressively to seek to increase the capacity ofthe nursing education system, promote nursing ca-reers, attract RNs from other areas, and help organi-zations retain RNs and decrease turnover. State healthworkforce centers may be a useful vehicle throughwhich to undertake these and other related efforts.
Nur s Ou t l o o k x x x ( 2 0 1 6 ) 1e 7 7
Finally, the uneven future growth of the RN work-force by region of the country also means that imple-mentation of health reforms may be adverselyaffected, particularly those linked to an adequatesupply of RNs. Delivery system changes that are likelyto depend on an adequate supply of nurses includethose aimed at increasing accountability for quality,costs, and population health (e.g., accountable careorganizations); increasing health education and pre-vention, expanding insurance coverage (via increasingMedicaid enrollments and federal and state ex-changes), shifting payment away from fee-for-servicetoward value-based payment, and increasing use ofhealth information technology. Being aware of thefuture projections in RN supply growth at a regionallevel can provide information needed by workforceplanners to assess the timing and likely success ofimplementing such reforms.
Acknowledgment
This work was funded by the Gordon and Betty MooreFoundation.
Supplementary Data
Supplementary data related to this article can be foundat http://dx.doi.org/10.1016/j.outlook.2016.07.004.
r e f e r e n c e s
Auerbach, D. I., Buerhaus, P. I., & Staiger, D. O. (2015). Will the RNworkforce weather the retirement of the baby boomers?Medical Care, 53, 850e856.
Auerbach,D. I.,Buerhaus,P. I.,&Staiger,D.O. (2014).Registerednursesare delaying retirement, a shift that has contributed to recentgrowth in the nurse workforce. Health Affairs, 33, 1474e1480.
Auerbach, D. I., Buerhaus, P. I., & Staiger, D. O. (2007). Better latethan never: Workforce supply implications of later entry intonursing. Health Affairs, 26, 178e185.
Auerbach, D. I., Staiger, D. O., Muench, U., & Buerhaus, P. I. (2013).The nursing workforce in an era of health care reform. NewEngland Journal of Medicine, 368, 1470e1472.
Buerhaus, P. I., Auerbach, D. I., Staiger, D. O., & Muench, U. (2013).Projections of the long-term growth of the registered nurseworkforce: A regional analysis. Nursing Economics, 31, 13e17.
Buerhaus, P., Staiger, D., & Auerbach, D. (2009). The future of thenursing workforce in the United States: Data, trends andimplications. Boston, MA: Jones & Bartlett Publishers.
Petterson, S. M., Liaw, W. R., Phillips, R. L., Jr., Rabin, D. L.,Meyers, D. S., & Bazemore, A. W. (2012). Projecting US primarycare physician workforce needs: 2010-2025. The Annals ofFamily Medicine, 10, 503e509.
Siow, E., & Ng, J. (2013). Internal migration of nurses in the UnitedStates: Migratory prompts and difference in job satisfactionbetweenmigrants and non-migrants. Nursing Economics, 31, 128.
Spetz, J. (2015). Too many, too few, or just right? Making sense ofconflicting RN supply and demand forecasts. NursingEconomics, 33, 176.
U.S. Department of Health and Human Services, Health Resources andServices Administration, National Center for Health WorkforceAnalysis. (2014). Rockville. Maryland: The Future of theNursing Workforce: National- and State-Level Projections,2012-2025.