Embed Size (px)
Citation preview

NEW DIRECTIONS
FOR STATE LONG-TERM CARE SYSTEMS
Second Edition
by
Barbara ColemanAARP Public Policy Institute

Acknowledgments
The author would like to thank the many state officials who were extremelyhelpful and wonderfully patient in providing information on their state long-term caresystems. I am also grateful to PPI’s Sharon Hermanson and Natalie Graves Tucker fortheir valuable contributions to the report. I appreciate the thoughtful review of the paperby Donna Folkemer, Wendy Fox-Grage, Carolyn French, Enid Kassner, Glenn Koocher,and Robert Mollica.
Table of Contents
Foreword . . . . . . . . . . . . . . . . . . . . . . . . . . . . . . . . . . . . . . . . . . . . . . . . . . . . . . . . . . . . . . i
Executive Summary . . . . . . . . . . . . . . . . . . . . . . . . . . . . . . . . . . . . . . . . . . . . . . . . . . . . . . ii
I. Introduction . . . . . . . . . . . . . . . . . . . . . . . . . . . . . . . . . . . . . . . . . . . . . . . . . . . . . . 1
II. Controlling Spending on Nursing Home Care . . . . . . . . . . . . . . . . . . . . . . . . . . . . 3
III. Expanding Home and Community-Based Care Services . . . . . . . . . . . . . . . . . . .. 9
IV. Developing Residential Options . . . . . . . . . . . . . . . . . . . . . . . . . . . . . . . . . . . . . 13
V. Consolidating State Long-Term Care Systems . . . . . . . . . . . . . . . . . . . . . . . . . . 16
VI. Establishing A Single Point of Entry System . . . . . . . . . . . . . . . . . . . . . . . . . . . 20
VII. Integrating Health and Long-Term Care . . . . . . . . . . . . . . . . . .. . . . . . . . . . . . . 22
VIII. Creating Consumer-Directed Care Programs . . . . . . . . . . . . . . . . . . . . . . . . . . . 25
IX. Conclusion . . . . . . . . . . . . . . . . . . . . . . . . . . . . . . . . . . . . . . . . . . . . . . . . . . . . . . 26
References . . . . . . . . . . . . . . . . . . . . . . . . . . . . . . . . . . . . . . . . . . . . . . . . . . . . . . . . . . . . 28
List of Tables
Table 1 Maine Long-Term Care Expenditures FY 1995 & 1997 ……………………... 9
Table 2 Kansas Department on Aging Services ……………………………………… 19
Table 3 Summary of Selected Programs Serving Dually Eligible Beneficiaries ……. 23
List of Figures
Figure 1 Medicaid Expenditures for LTC Services, 1997 ……………………………. 1
Figure 2 Bed Occupancy Rates in Nursing Homes …………………………………. 4
Figure 3 Total Long-Term Care Expenditures in Indiana ……………………………. 12
Figure 4 Average Monthly Rent and Fees in Assisted Living Facilities …………….. 15
i
Foreword
Publicly funded long-term care in the United States today consists of 50 differentstate and five U.S. territory systems that vary considerably in services, financing methods,and eligibility standards. In the absence of a national long-term care program, the statescontinue to be the major decisionmakers in long-term care: setting policies, regulatingcare, and controlling resources.
Until the 1990s, a state’s long-term care system consisted largely of care in anursing home. States are required to help pay for nursing home care for Medicaid-eligible adults and those who become eligible after they have depleted their assets payingfor such care. Although states are not obligated under Medicaid to offer home andcommunity-based care, changes in federal Medicaid policies in recent years have allowedthe states more flexibility, and thus have encouraged states to expand home andcommunity-based care services. A number of states have also allocated significant stategeneral revenue funds for home care services.
Medicaid is the largest public source of long-term care expenditures. About 76percent of Medicaid long-term care spending covers care in institutions — nursinghomes and intermediate care facilities for the mentally retarded. Many states have beenlooking for ways to control the rapidly rising costs of such care, and to offer alternativeforms of long-term care. Several states have been notably successful in developingbalanced and comprehensive long-term care systems that include nursing home care,residential services, and home care services.
This report revises information presented in the 1996 AARP publication, NewDirections for State Long-Term Care Systems, Volume 1: Overview. Material in theoriginal report has been updated or replaced by more recent examples of state long-termcare systems. New sections have been added on state demonstration projects to integratehealth and long-term care services and state programs for consumer-directed care.
States serve as laboratories for reform. States that have revamped their long-termcare systems to provide a range of options for consumers contribute ideas and informationto other states. The challenge for researchers is to help fill the gaps in knowledge aboutthe most effective state strategies for developing comprehensive long-term care systems.The challenge for states is to provide consumers with affordable quality long-term care inthe home, the community, or in nursing homes.
Barbara ColemanSenior AnalystPublic Policy InstituteResearch Group

ii
Executive Summary
Background
The country’s long-term care system is actually 50 different state and five U.S.territory systems. In the absence of a national long-term care program, states havedeveloped their own long-term care programs and services, using federal Medicaid andOlder Americans Act funds and state general revenues.
The largest source of public funds to pay for long-term care is the Medicaidprogram. In 1997, 35 percent of total Medicaid expenditures went to long-term careservices. During the late 1980s, Medicaid long-term care costs grew at a rate of 20 to 25percent a year. Since more than four-fifths of that spending had been going to nursinghome care, states began taking a hard look at how they could control the rate of increasein these expenditures.
Many state officials believe they can restrain the growth in publicly fundednursing home costs by expanding home and community-based care (HCBC) services.These officials reason that many persons enter nursing homes because of a scarcity ofother care options, not because they need skilled nursing care. States believe they canprovide HCBC services at a lower cost per capita than they would spend for nursinghome care. Long-term care recipients also prefer home to institutional care, according tosurveys, giving states another incentive to augment HCBC services.
Purpose
A number of states have demonstrated that a state’s long-term care system can betransformed from almost total dependence on nursing home care to a morecomprehensive system that offers a variety of care options. This report providesinformation on these long-term care models to encourage similar efforts in other states.
States learn from each other. State officials frequently exchange ideas andstrategies with each other. This report is intended to contribute to that process.Another goal is to help consumers understand the key components of state long-term caresystems and how those elements need to be linked to create a comprehensive range ofservice and financing options. This information can help consumers advocate in theirstates for the development or expansion of long-term care options so that more peoplewill be able, if they wish, to remain in their homes and communities as they age.
Methodology
The report draws on the programs and experiences of a number of states that havebeen leading the way in recent years in building comprehensive long-term care systems.The emphasis of this report is on “comprehensive” systems because limited reforms, such
iii
as controls on the expansion of nursing home beds, can create greater difficulties forpeople seeking long-term care if other service options are not available.
The author selected the states featured in this report mainly to be illustrative ofvarious approaches to organizing, financing, and delivering long-term care services.Oregon is highlighted frequently throughout the report because the state was the first toenvision and develop a long-term care system based primarily on the theory that peoplewanted and should be offered “the least restrictive setting” (the state’s term) for theircare. The result in Oregon has been the growth of a wide range of in-home andcommunity services for persons needing long-term care.
The other states discussed in this report demonstrate a specific strategy fororganizing their long-term care systems or a new direction for their long-term careprograms and services. The author also selected states from different regions of thecountry, from large and small states, and from rural and urban areas.
The author collected information for the report from state annual reports, fromtelephone interviews with state officials, and from other state summaries on specificprograms. The report also draws extensively on Medicaid expenditures data reported bythe states to the US Health Care Financing Administration, as compiled by Brian Burwellof the MEDSTAT Group in Cambridge, Massachusetts.
Principal Findings
From 1987 through 1997, Medicaid spending on home and community-based careservices rose from about $2 billion to $13.6 billion — more than a six-fold increase.Over the same period, Medicaid expenditures for institutional care (nursing facilities andintermediate care facilities for the mentally retarded) slightly more than doubled from $19billion to $40.8 billion.
Over this decade, many states adopted comprehensive long-term care plans thatcalled for developing, expanding, and coordinating home and community-based servicesas alternatives to nursing home care. The following are examples of state strategies thatmany states have combined to create long-term care systems that respond to consumerneeds and demands.
• In 1995, 45 states regulated the growth of nursing home beds either through acertificate of need process, a moratorium, or both. Many states also restrictedrate reimbursement increases and controlled access to nursing home care.
• While home and community-based care claimed only a 10 percent share of
Medicaid long-term care dollars in 1987, that percentage had increased toabout 24 percent in 1997. States used federal Medicaid and Older AmericansAct funds and state general revenues to expand home and community-basedcare services.

iv
• States have moved toward a single state agency approach to managing and
operating all home and community-based care services regardless of fundingsource. This consolidation helps to reduce the fragmentation that resultedfrom having long-term care services scattered throughout state government.
• Many states have created single entry point agencies at the local level for
screening, assessment, and care management to help consumers identify themost appropriate services for their needs and help arrange the services.
• States are encouraging the development of supportive residential housing for
older persons such as congregate housing, board and care facilities, andassisted living facilities.
• By 1998, two states (Minnesota and Texas) had initiated demonstration
projects to integrate acute and long-term care services and financing forpersons dually eligible for Medicare and Medicaid. Several other states havebeen developing plans for such projects.
• States have provided funds to persons with disabilities to manage their own
care through self-directed care programs.
Conclusion
Many states are broadening the scope of publicly funded long-term care servicesbeyond traditional and costly nursing home care in an effort to control the growth inMedicaid long-term care spending and to offer consumers greater choice of services.States are also consolidating formerly fragmented programs into more easily accessiblefinancing and delivery systems.
Evidence of these shifts comes from rising Medicaid and state expenditures forhome and community-based services and structural changes in state management of long-term care programs and services. Still, progress in building comprehensive long-termcare systems at the state level has been slowed by gaps in the research about the mostcost-effective strategies. These gaps leave many policymakers reluctant to increasespending too rapidly on HCBC services. Some policymakers are uncertain about whetherthey will be substituting HCBC services for costly nursing home care or adding additionalHCBC recipients while nursing home costs continue to rise.
Cost is a legitimate concern for advocates and consumers as well as policymakersand researchers. State models need to be tested, comparative studies need to beconducted, and outcomes need to be assessed. But a debate over costs could paralyzefurther progress in developing a rational long-term care system in this country. Manyvulnerable people will go without services if cost effectiveness is the only issue.

v
States must move ahead in developing long-term care systems that offer a range ofservices in various settings so that the millions of people who need long-term care haveaccess to the most appropriate and affordable services. Important lessons can be learnedfrom the long-term care models that have already been developed. These modelsdemonstrate a broad range of options that have been explored and implemented.
This report has sought to highlight some of these models. State officials must bewilling to experiment and innovate as have the states mentioned in this report and others.At the same time, researchers need to continue their search for quantifiable data on cost-effective methods and successful outcomes.

NEW DIRECTIONS
FOR STATE LONG-TERM CARE SYSTEMS
I. INTRODUCTION
States have been facing tough budget and fiscal decisions in recent years. One of thebiggest challenges has come from the federal-state Medicaid program, the major public source offunding for health and long-term care for persons of low income. In most states, spending onlong-term care services comprises between 30 and 50 percent of total Medicaid expenditures.
Medicaid has been one of the biggest and fastest growing programs in state budgets.Between 1988 and 1992, total Medicaid spending grew at over 22 percent a year (Holahan andLiska 1997). That spending growth has slowed; increases have averaged 9.5 percent each yearbetween 1992 and 1995 (Holahan and Liska 1997).
While total Medicaid spending increased by only 4 percent from fiscal 1996 to 1997,Medicaid long-term care spending increased 9.3 percent over that period. That was the highestannual rate of growth in Medicaid long-term care spending since fiscal 1992 (Burwell 1998).
• Medicaid spent almost $56.1 billion for long-term care services in 1997, about onethird of total Medicaid expenditures that year.
• About 76 percent of those Medicaid dollars ($42.5 billion) in 1997 went to nursing
homes and intermediate care facilities for the mentally retarded (Burwell 1998). (SeeFigure 1.)
Figure 1Medicaid Expenditures for LTC Services, 1997*
(Total Expenditures = $56.1 billion)
Nursing Homes58.0%
Home Health3.9%
HCBS Waiver14.5%
ICF-MR17.8%
Personal Care5.7%
Source: Brian Burwell, The Medstat Group, 1998.*Does not add to 100% because of rounding.

Nursing home care is costly. Many nursing home residents are severely disabled orcognitively impaired with high-cost care needs, and nursing homes have to be staffed andequipped for 24-hour care. However, home care advocates contend that other nursing homeresidents do not need skilled nursing home level of care and could be cared for at home. Theyalso claim that home care can be much less costly because family and friends often provide thebulk of the care, perhaps supplemented with paid services.
State officials also point to cost savings in home care versus nursing home care. Forexample, Indiana officials estimated that Medicaid paid on average about $36,400 a year for anursing home resident in 1996, compared to $8,122 on average for a person receiving home careservices under a Medicaid home and community-based care “aged and disabled waiver”1
program (Indiana Family and Social Services Administration 1997). Similarly, Maine officialssaid that the annual cost for a Medicaid nursing home resident was $22,570 in 1996, but onlyabout $7,650 for a person receiving Medicaid services under the elder and adults waiver program(Maine Department of Human Services 1997).
It should be noted, however, that per capita costs may be much higher for certain groupsof home care beneficiaries than in the examples noted above. For example, the annual Medicaidcost for an autistic individual receiving HCBC waiver services in Indiana was about $28,828 in1997.) Although the amounts vary considerably from state to state and from one beneficiarygroup to another, all states spend less per capita for home and community-based care than fornursing home care.
Thus, states have a major financial stake in limiting construction of new nursing homebeds, controlling the use of nursing home care, and promoting use of home and community-basedcare (HCBC). This has led a number of states to begin testing new and innovative ways toprovide inexpensive, quality long-term care services for people in their homes or in residentialsettings, such as adult foster homes or assisted living facilities.
This report describes the steps a number of states have taken to begin revamping theirpublicly funded long-term care systems. Generally, this has meant controlling the growth ofnursing home use while increasing expenditures for home and community-based services. But italso involves restructuring state long-term care financing and delivery systems to improve accessto and coordination of services.
The report reviews efforts by states to:
• control spending on nursing home care; • expand the use of home and community-based care services through the federal-state
Medicaid program and state general revenues;
1 States receive a waiver of certain Medicaid requirements to provide a range of services for persons who wouldotherwise require institutional care. “Aged and disabled” is one category of beneficiaries; others include personswith AIDS, persons with traumatic brain injuries, and technology dependent children.2

3
• encourage the development of residential settings, such as adult foster care homes and
assisted living facilities;
• consolidate and coordinate long-term care services and financing at the state level; • create a single point of entry at the local level that, at a minimum, provides
information and referral, screening, and care management; • integrate health and long-term care services for persons eligible for Medicare and
Medicaid through a managed care approach using capitated payment systems; and
• provide more opportunities for persons with disabilities to choose, purchase, ormanage their own care.
II. CONTROLLING SPENDING ON NURSING HOME CARE
Background
Each state’s Medicaid program must pay for nursing home and home health care foreligible persons, and has the option to cover other long-term care services. Federal law providesthat individuals can qualify for Medicaid assistance for the cost of nursing home care if theirincome and assets fall below specific state-set limits, and they meet state standards for medical,functional, and cognitive impairment.
The availability of Medicaid funding was a key factor in the growth of nursing home carein the 1970s and early 1980s. Other factors included the aging of the American population,shortened Medicare-covered hospital stays due to the introduction of the prospective paymentsystem in 1983, and the lack of affordable alternatives.
The number of nursing homes increased from 15,700 in 1973-74 to 19,100 in 1985. Butby 1995, the total had decreased by 12.6 percent to 16,700 facilities, as reported by the 1995National Nursing Home Survey (Strahan 1997).
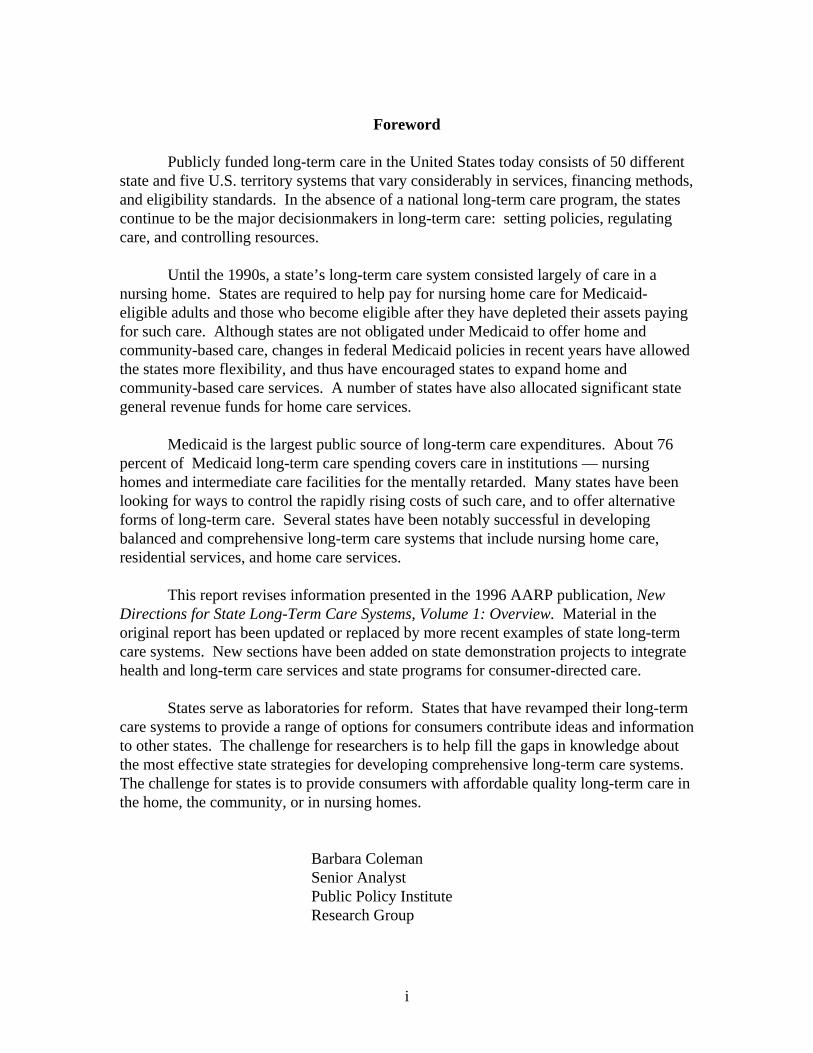
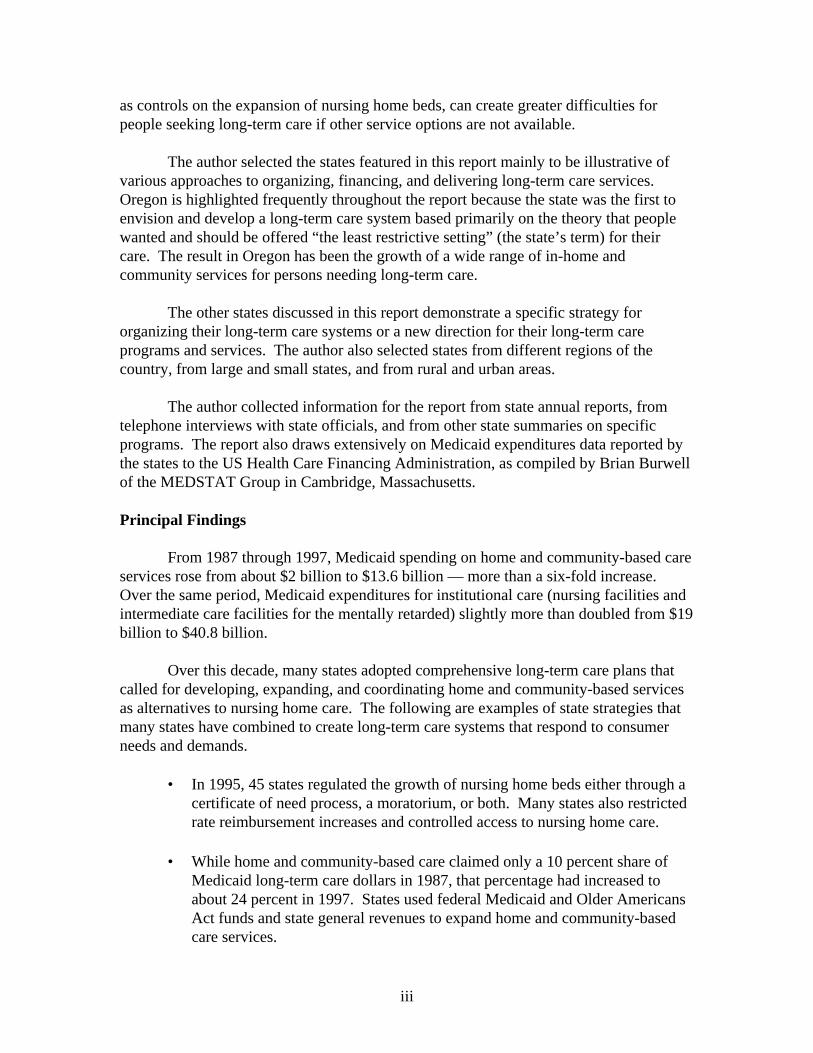
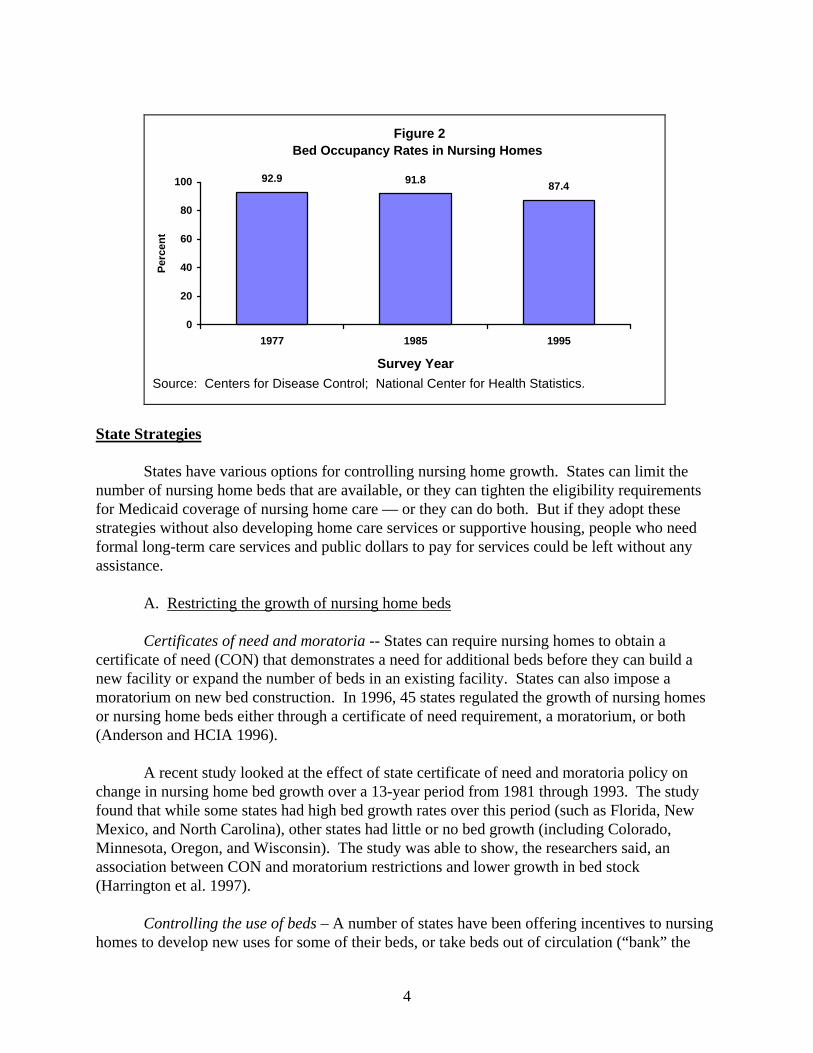
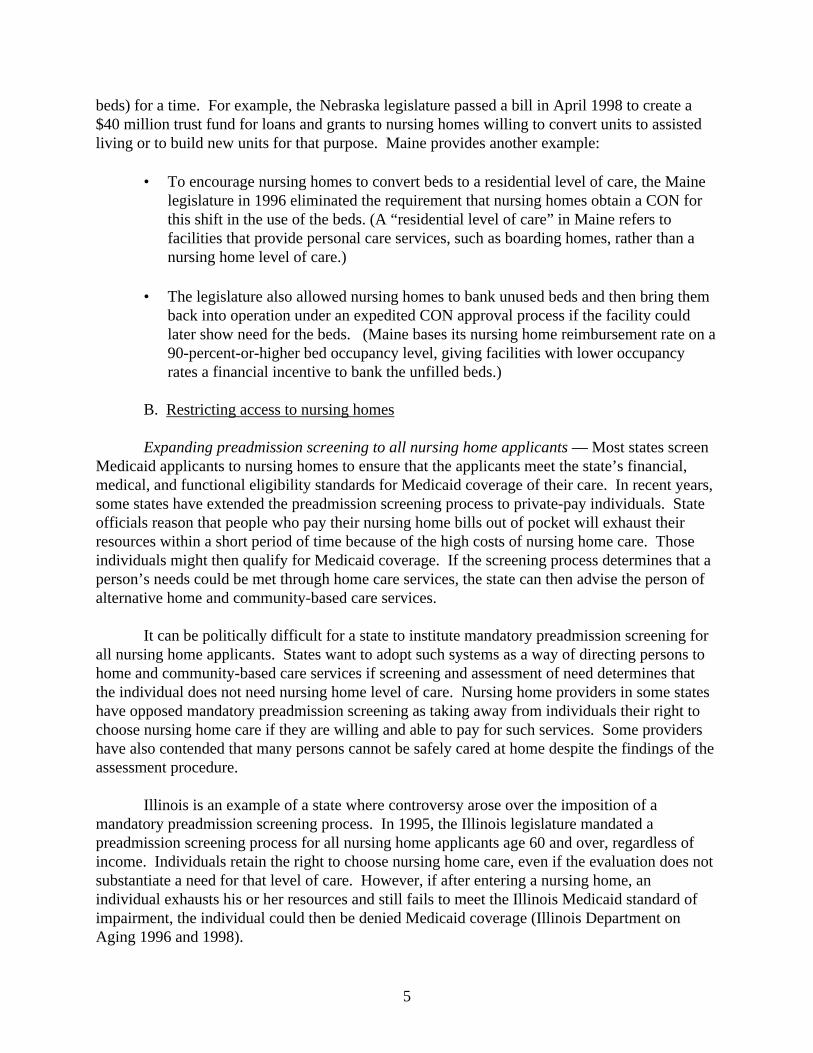
The Survey also reports a decline over the 1985-95 decade in the number of nursing homebeds per 1,000 persons age 65 and over, from 56.9 beds per 1,000 in 1985 to 52.6 beds in 1995.Bed occupancy rates also decreased over the period, from 91.8 percent in 1985 to 87.4 percent in1995 (Strahan 1997). (See Figure 2.)
State S
numbefor Mestrategformalassista
certificnew famoratoor nurs(Ander
changefound MexicMinneassocia(Harrin
homes
Figure 2Bed Occupancy Rates in Nursing Homes
92.9 91.887.4
0
20
40
60
80
100
1977 1985 1995
Survey Year
Per
cen
t
Source: Centers for Disease Control; National Center for Health Statistics.
4
trategies
States have various options for controlling nursing home growth. States can limit ther of nursing home beds that are available, or they can tighten the eligibility requirementsdicaid coverage of nursing home care — or they can do both. But if they adopt theseies without also developing home care services or supportive housing, people who need long-term care services and public dollars to pay for services could be left without anynce.
A. Restricting the growth of nursing home beds
Certificates of need and moratoria -- States can require nursing homes to obtain aate of need (CON) that demonstrates a need for additional beds before they can build acility or expand the number of beds in an existing facility. States can also impose arium on new bed construction. In 1996, 45 states regulated the growth of nursing homesing home beds either through a certificate of need requirement, a moratorium, or bothson and HCIA 1996).
A recent study looked at the effect of state certificate of need and moratoria policy on in nursing home bed growth over a 13-year period from 1981 through 1993. The studythat while some states had high bed growth rates over this period (such as Florida, Newo, and North Carolina), other states had little or no bed growth (including Colorado,sota, Oregon, and Wisconsin). The study was able to show, the researchers said, antion between CON and moratorium restrictions and lower growth in bed stockgton et al. 1997).
Controlling the use of beds – A number of states have been offering incentives to nursing to develop new uses for some of their beds, or take beds out of circulation (“bank” the
5
beds) for a time. For example, the Nebraska legislature passed a bill in April 1998 to create a$40 million trust fund for loans and grants to nursing homes willing to convert units to assistedliving or to build new units for that purpose. Maine provides another example:
• To encourage nursing homes to convert beds to a residential level of care, the Mainelegislature in 1996 eliminated the requirement that nursing homes obtain a CON forthis shift in the use of the beds. (A “residential level of care” in Maine refers tofacilities that provide personal care services, such as boarding homes, rather than anursing home level of care.)
• The legislature also allowed nursing homes to bank unused beds and then bring them
back into operation under an expedited CON approval process if the facility couldlater show need for the beds. (Maine bases its nursing home reimbursement rate on a90-percent-or-higher bed occupancy level, giving facilities with lower occupancyrates a financial incentive to bank the unfilled beds.)
B. Restricting access to nursing homes
Expanding preadmission screening to all nursing home applicants — Most states screenMedicaid applicants to nursing homes to ensure that the applicants meet the state’s financial,medical, and functional eligibility standards for Medicaid coverage of their care. In recent years,some states have extended the preadmission screening process to private-pay individuals. Stateofficials reason that people who pay their nursing home bills out of pocket will exhaust theirresources within a short period of time because of the high costs of nursing home care. Thoseindividuals might then qualify for Medicaid coverage. If the screening process determines that aperson’s needs could be met through home care services, the state can then advise the person ofalternative home and community-based care services.
It can be politically difficult for a state to institute mandatory preadmission screening forall nursing home applicants. States want to adopt such systems as a way of directing persons tohome and community-based care services if screening and assessment of need determines thatthe individual does not need nursing home level of care. Nursing home providers in some stateshave opposed mandatory preadmission screening as taking away from individuals their right tochoose nursing home care if they are willing and able to pay for such services. Some providershave also contended that many persons cannot be safely cared at home despite the findings of theassessment procedure.
Illinois is an example of a state where controversy arose over the imposition of amandatory preadmission screening process. In 1995, the Illinois legislature mandated apreadmission screening process for all nursing home applicants age 60 and over, regardless ofincome. Individuals retain the right to choose nursing home care, even if the evaluation does notsubstantiate a need for that level of care. However, if after entering a nursing home, anindividual exhausts his or her resources and still fails to meet the Illinois Medicaid standard ofimpairment, the individual could then be denied Medicaid coverage (Illinois Department onAging 1996 and 1998).
The Illinois law went into effect on July 1, 1996. The state nursing home industry triedunsuccessfully in 1996 to get the law repealed. In its first annual report on the screeningprogram, the state reported that the average monthly Medicaid nursing home caseload dropped by1,053 residents from FY 1996 to FY 1997 (Illinois Department on Aging 1997).
C. Rate-setting arrangements
Each state sets its own Medicaid reimbursement rates for nursing home care, which givesstates options for managing or restraining spending growth. A state can freeze rates or pegincreases to a national index of nursing facility cost increases, although these are generally short-term strategies that cannot be continued indefinitely. Forty-six states used varying prospectivepayment methods in 1996 that set rates in advance, by setting a flat rate for groups of facilities orgroups of clients or by setting rates for each facility based on historical costs and other factors.One state (Nebraska) used a retrospective reimbursement system that pays nursing homes for thecosts incurred in the previous year. The remaining four states used a combination of prospectiveand retrospective systems (Harrington et al. 1998).
Within these reimbursement systems, many states use case-mix reimbursement methodsthat base a portion of the total reimbursement rate on direct resident care costs.2 A higher rate ispaid for a resident who requires more nursing care than for a resident who requires less care. Useof case mix methods does not necessarily lead to cost savings, but is believed to be useful ininfluencing nursing homes to accept individuals with higher levels of disabilities. If nursing facilities objected to a state’s Medicaid reimbursement policies, the facilitiescould sue the state under the terms of the Boren Amendment. This law required states to setreasonable and adequate reimbursement rates for nursing homes that were operating efficientlyand economically. The Balanced Budget Act (BBA) of 1997 repealed the Boren Amendment. Governorsfought for repeal to give them greater flexibility to slow the rate of growth of nursing homereimbursements. However, the impact of repeal is not yet clear. States must provide justificationfor the rates they set for nursing homes, publish the proposed rates with an explanation of themethodology used, and give the public reasonable opportunity for review and comment. Advocates for nursing home residents also have two major concerns about repeal of theBoren Amendment: 1) facilities that are forced to tighten their budgets may reduce expendituresfor direct patient care, thus lowering the quality of care, and 2) nursing homes might try to attractmore private-pay applicants, thus limiting access by poor persons.
2 Direct care accounts for between 40 and 60 percent of the total reimbursement rate. The remainder includes capitalcosts and indirect costs, such as laundry and general administration.
6
7
Selected State Examples
The following describes the actions by two states to slow the number of admissions tonursing homes and thus slow the rate of growth of spending for nursing home care.
Oregon
Oregon public officials and advocates have long contended that, if a state provides asufficient number of home and community-based care alternatives to nursing home care,individuals and their families will overwhelmingly choose those alternatives. If that happens,state officials say, fewer people will enter nursing homes, and the number of nursing home bedswill shrink — without the state’s needing to take drastic actions to curtail nursing home use.
In 1982, the state adopted the principle that nursing homes were to be placements of “lastresort.” During the 1980s, the state developed a number of home and community-based careprograms, from assisted living to adult foster care to home care programs. The state combined anumber of strategies, which included:
• Gaining approval from the federal government for the first Medicaid waiver thatallowed the state to provide a range of Medicaid home and community-based servicesto persons at risk of having to enter a nursing home.
• Implementing a statewide system of screening for all nursing home applicants —private-pay as well as publicly funded applicants to ensure that they needed nursinghome level of care.
• Using the certificate-of-need system to set a target range for nursing home bedcapacity from 35 to 45 beds per 1,000 persons age 65 and older. The range allows forvariations in demand factors in different regions of the state. In 1996, the ratio ofnursing home beds per 1,000 was 32.4, one of the lowest ratios in the country.
In 1980, the number of Medicaid residents in Oregon nursing homes totaled about 8,000.In 1996, that total had dropped to about 7,100. (Over the same period of time, the number ofOregonians age 85 and over had increased by over 40 percent. ) The number of nursing homefacilities dropped from 193 in 1981-82 to 161 in 1995 (Graves and Bectel 1996; Kutza 1993).
At the same time, Oregon encouraged the development of alternative residential settingsfor people needing supportive housing, such as adult foster homes and assisted living facilities.Today, about 5,000 Medicaid beneficiaries live in adult foster homes out of a total of about15,000 persons in about 6,500 homes; another 1,000 Medicaid beneficiaries live in about 50assisted living facilities. (The state’s Medicaid home and community-based waiver programscover the costs of services for the Medicaid beneficiaries in these residential settings.)
The state spent $153.9 million for Medicaid coverage of nursing home care in fiscal1992. Nursing home care expenditures have risen by only 2 to 3 percent over subsequent years,

8
with the fiscal 1997 amount ($169.2 million) 2.6 percent over the fiscal 1996 total ($164.9percent). Nationally, Medicaid nursing home costs rose between 7.2 percent and 7.9 percentfrom fiscal 1993 through fiscal 1995, dropping to 2.2 percent between fiscal 1995 and 1996 andthen increasing by 4.8 percent between fiscal 1996 and 1997 (Burwell 1998).
Maine
A 1993 budget crisis forced Maine to review its long-term care spending patterns. Thegovernor and legislature agreed that one major step would be to cut nursing home admissions by10 percent. The strategy involved:
• targeting nursing home services only to people with the most severe disabilities ormedical needs;
• providing incentives to nursing homes to convert some beds to lower levels of care; • increasing appropriations for home care services; and • developing additional residential care beds (Goldberg, Fralich, and Pears 1996).
As shown in Table 1, Medicaid expenditures for nursing facilities dropped from $240million to $202 million and the number of Medicaid residents declined by almost 1,000 fromfiscal 1995 through fiscal 1997. Over the same period, spending on the Medicaid home andcommunity-based “elder and adults” waiver program increased by over $3 million. Anadditional 2,028 persons received home care services under the two waiver programs and twoHome-Based Care programs from 1995 to 1997.

Table 1Maine Long-Term Care Expenditures FY 1995 & 1997
FY 1995 FY 1997Total
ExpenditureClients Per
CapitaCost
TotalExpenditure
Clients PerCapitaCost
MEDICAIDNursingFacilities
$239,648,555 9,945 $24,097 $202,292,500 8,963 $22,570
ResidentialCare
$16,711,742 2,174 $7,687 $24,555,594 3,017 $8,139
Waiver:PhysicallyDisabled
$1,993,971 183 $10,896 $5,062,143 269 $18,818
Waiver:Elder &Adults
$7,080,916 1,052 $6,731 $10,272,214 1,343 $7,649
GENERAL FUNDHome BasedCare: Elder& Adults
$4,671,076 1,296 $3,604 $6,747,308 2,899 $2,327
Home BasedCare:PhysicallyDisabled
$1,475,077 125 $11,801 $2,484,207 173 $14,360
Source: Maine Department of Human Services, 1998.
III. EXPANDING HOME AND COMMUNITY-BASED CARE SERVICES
Background
National spending for Medicaid-financed home and community-based care (HCBC)services (home and community-based waiver services, personal care, and home health) totaled$13.5 billion in fiscal 1997 — more than double the $5.8 billion Medicaid spent on these threeservices in fiscal 1992 (Burwell 1998). The $13.5 billion was composed of:
• $8.1 billion (60 percent) for home and community-based care waiver services,3
• $3.2 billion (24 percent) for personal care, and
3 The $8.1 billion reflects total expenditures for various target populations in waiver programs: elderly and disabled,mentally retarded/developmentally disabled (MR/DD), persons with AIDS, etc. About 80 percent of the total isspent on services for MR/DD beneficiaries (Lakin et al. May 1998).
9

10
• $2.2 billion (16 percent) for home health services.
Twenty-three states devoted more than 25 percent of their Medicaid long-term caredollars to home and community-based services in fiscal 1997. Oregon outpaced all the otherstates by allocating 50.3 percent of its total Medicaid long-term care spending for home andcommunity-based care (Burwell 1998).
Thirty-one states and the District of Columbia provided personal care services as anoptional Medicaid benefit in fiscal 1997. New York State spent about half ($1.6 billion) of thenational total of $3.2 billion for personal care. California, Michigan, Texas, New Jersey, andNorth Carolina spent close to another billion (Burwell 1998).
Another significant source of funds for home and community-based care services inrecent years has been state general revenues. Many states have developed state-funded programsso that they can provide services to persons whose incomes exceed Medicaid limits or whosefunctional impairments are less severe than required for Medicaid coverage. General revenuesalso allow states more flexibility in designing programs and selecting services to offer (Kassnerand Williams 1997).
In 1996, 32 states reported operating one or more state-funded programs that provided asingle home and community-based service for older persons. Examples include a nutritionprogram or case management or homemaker services. Thirty-nine states reported having one ormore state-funded multi-service home and community-based programs. State spending for multi-service programs ranged in amount from about $317,000 for the Community Home-BasedInitiatives Program in Nevada to the $290.5 million In-Home Supportive Services Program inCalifornia (Kassner and Williams 1997).
State Strategies
States have used the Medicaid personal care program and home and community-basedwaiver programs in a variety of ways:
• To provide a range of services that include respite, homemaker, transportation, adultday care, home modification, emergency response systems, and nutrition programs.
• To set income eligibility standards for waiver services as high as 300 percent of the
monthly Supplemental Security Income level, $1,482 monthly in 1998. • • To allow persons to qualify for certain Medicaid services if their medical expenses
force them to “spend down” their income to the “medically needy” level. • To offer waiver or personal care services to eligible older persons in residential care
facilities, such as assisted living facilities.

11
• To protect the spouses of persons receiving home and community-based care fromimpoverishment. States are required to allow the at-home spouse of a Medicaidnursing home resident to retain a share of the couple’s income and assets.
Selected State Examples
The following section describes the efforts of three states to craft more extensive homeand community-based care programs using a combination of Medicaid and state funds.
Oregon
In 1981, Oregon adopted a set of principles to guide its long-term care efforts. Theseprinciples, incorporated into law, provide that older people will receive care “at the least cost andin the least confining situation” (Oregon Senior and Disabled Services Division 1981).
• Oregon began its community long-term care efforts in 1975 with a $500,000 state-funded program called Oregon Project Independence. In 1981, Oregon became thefirst state to receive approval from the federal government for a Medicaid waiverprogram for aged and disabled persons.
• In the mid-1980s, Oregon was providing home and community-based long-term careservices to about 14,000 people. The number had grown to about 24,000 by 1997.
• By the end of 1997, the state was serving over 76 percent of its Medicaid long-term
care clients in home and community-based care settings (Auerbach, 1998; Alecxih,Lutzky and Corea 1996).
Indiana
In the 1980s, older Hoosiers of low income had few choices if they needed long-term careassistance. Either they relied on family support that enabled them to remain at home, or theywent into a county home or nursing home. County homes provided room and board for poorolder persons.
This situation began to change when the Indiana General Assembly in 1989 established apilot program called CHOICE (Community and Home Options to Institutional Care for theElderly and Disabled) in two areas of the state. The legislature expanded the state-fundedprogram to all 92 counties in 1992 (Indiana Family and Social Services Administration 1997).
C(althoughyear). Thpoverty. the aged (ADLs), waiver pr
•
•
•
Arkansa
Inpopulatio
Figure 3Total Long-Term Care Expenditures in Indiana
(by funding source*)
Local$5.7 million
7.6%
Other$7.7 million
2.4%
Title III$8.8 million
11.7%
CHOICE$20.7 million
27.3%
Medicaid Waiver$28.4 million
37.5%
Social Service Block Grant$10.1 million
13.3%
Source: Indiana Family and Social Services Administration, 1997*Percentages do not add to 100% because of rounding.
12
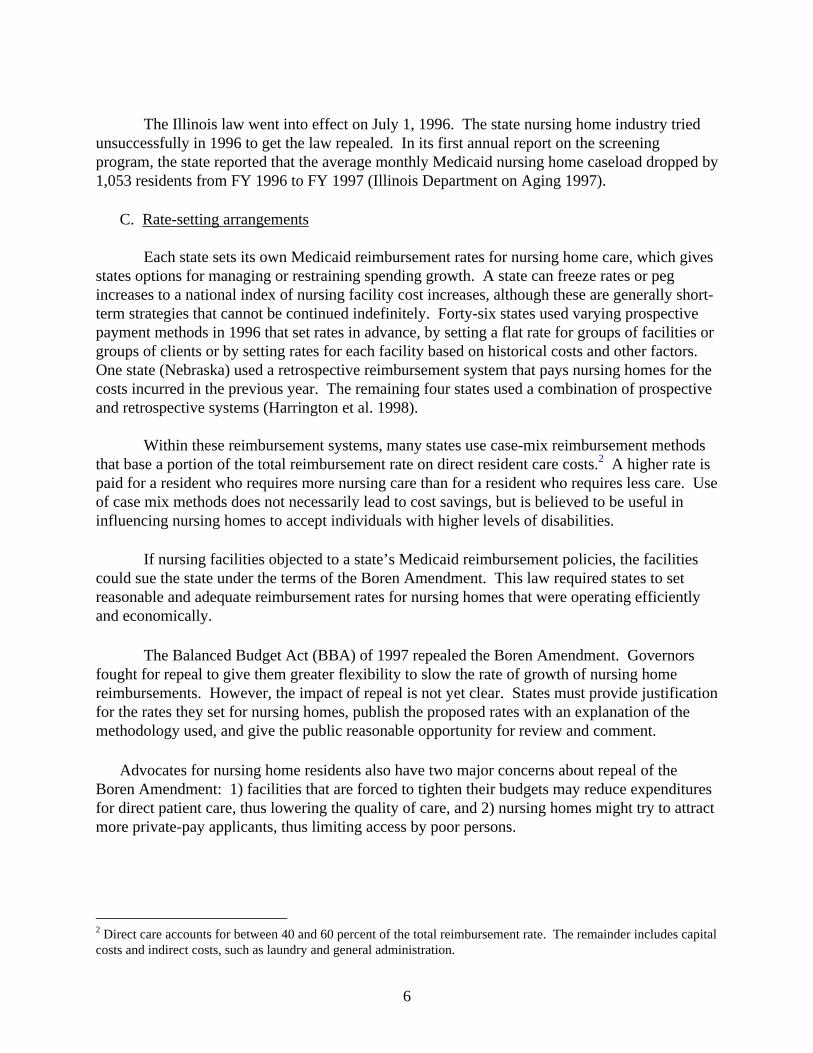
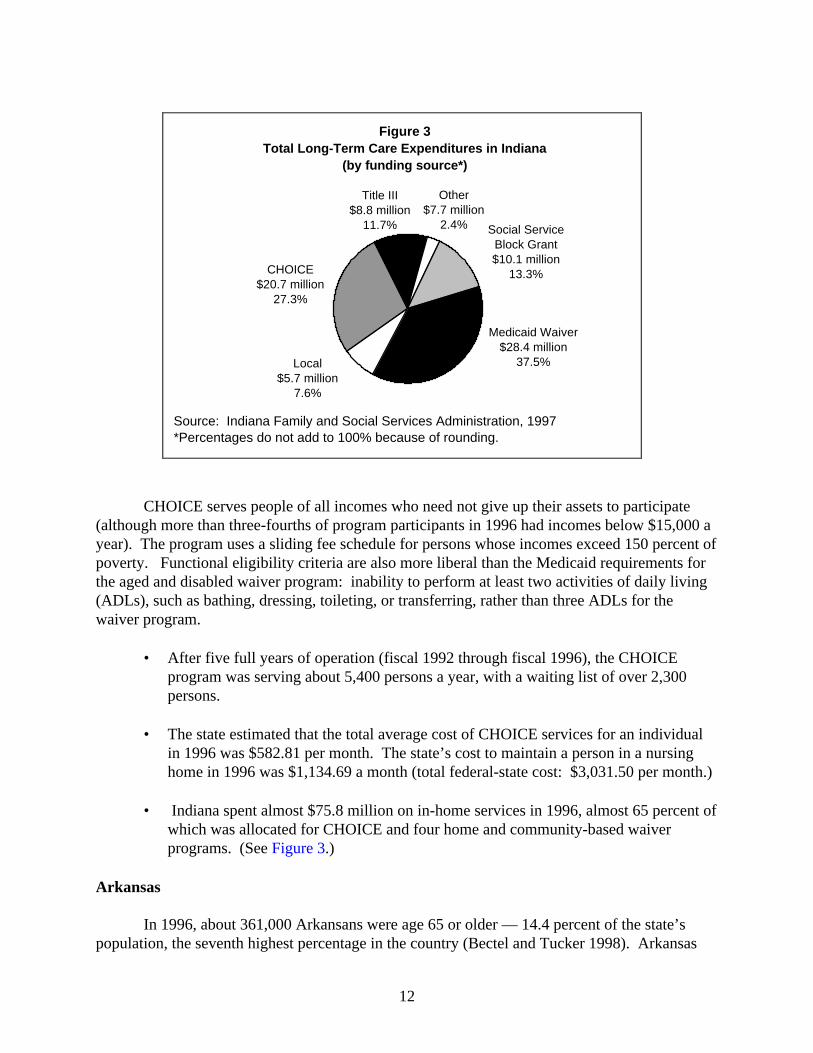
HOICE serves people of all incomes who need not give up their assets to participate more than three-fourths of program participants in 1996 had incomes below $15,000 ae program uses a sliding fee schedule for persons whose incomes exceed 150 percent of
Functional eligibility criteria are also more liberal than the Medicaid requirements forand disabled waiver program: inability to perform at least two activities of daily livingsuch as bathing, dressing, toileting, or transferring, rather than three ADLs for theogram.
After five full years of operation (fiscal 1992 through fiscal 1996), the CHOICEprogram was serving about 5,400 persons a year, with a waiting list of over 2,300persons.
The state estimated that the total average cost of CHOICE services for an individualin 1996 was $582.81 per month. The state’s cost to maintain a person in a nursinghome in 1996 was $1,134.69 a month (total federal-state cost: $3,031.50 per month.)
Indiana spent almost $75.8 million on in-home services in 1996, almost 65 percent ofwhich was allocated for CHOICE and four home and community-based waiverprograms. (See Figure 3.)
s
1996, about 361,000 Arkansans were age 65 or older — 14.4 percent of the state’sn, the seventh highest percentage in the country (Bectel and Tucker 1998). Arkansas

13
ranked third highest among the states for percentage of persons age 65 and over with incomesbelow the poverty level in 1993-95 (U.S. Administration on Aging 1997).
Those two figures suggest that demand for long-term care services is also likely to behigh. Arkansas has met that demand largely through nursing home services. In 1996, Arkansashad 68.5 beds per 1,000 persons age 65 and older compared to a national average of 49.1 bedsper 1,000. Still, Arkansas has also been trying in recent years to counterbalance that institutionalbias by expanding the use of the Medicaid personal care program for older persons of lowincome. One study of state long-term care systems ranked Arkansas ninth among the states interms of its progress toward a system that emphasizes home and community-based services overnursing home care (Ladd 1996).
• Arkansas ranked second in the country (behind New York) in spending per capita onMedicaid personal care in fiscal 1997, at $23.83 per capita.
• The state provided personal care services to 13,663 older persons in fiscal 1997, withexpenditures totaling about $59.8 million.
• Arkansas’ total Medicaid spending on personal care services in fiscal 1996 waseleventh highest in the country, exceeded only by states with much larger populations,such as New York, California, and Texas.
• Arkansas also operates a Medicaid home and community-based services waiverprogram, ElderChoices, which the state began in July 1991. The program served5,900 beneficiaries in fiscal 1997 and cost $12.6 million (Arkansas Department ofHuman Services 1998).
IV. DEVELOPING RESIDENTIAL OPTIONS
Background
More than 28 percent of persons age 65 and over lived alone in 1990 (Bectel and Tucker1998). Persons living alone who have difficulties with activities of daily living may not be ableto get the help they need, unless they have family or community supports. They may be afraid toremain in their homes, even if they want to avoid a nursing home.
An important alternative for these frail elderly persons can be supportive housing —housing with services. Many states are exploring a variety of ways to expand the supply ofsupportive housing for older persons, which includes congregate housing, board and care homes,and assisted living facilities. Definitions of supportive housing are continually shifting. Some ofthe basic differences among these types of housing are described below.

14
Congregate housing
Congregate housing generally refers to residential buildings with separate apartments andshared dining facilities and other community space. Congregate housing typically includes aprogram of supportive services, such as housekeeping and transportation plus one meal a day.This type of supportive housing does not usually include personal care or protective supervision.Residents are typically living independently but with access to specified services.
Board and care homes
Board and care homes may, depending on state regulations, also be referred to asresidential care homes or facilities, sheltered care facilities, personal care homes, or adult fostercare. These homes often offer a home-like setting, providing rooms (often semi-private), sharedcommon areas, meals, protective oversight, and some measure of help with activities of dailyliving. Currently, about one-half of board and care residents have low incomes, which meansthat the facilities often rely on the public benefit checks (often Supplemental Security Income) ofthe residents for payment of room and board charges (Clemmer 1995).
Assisted Living
An assisted living facility is a residential setting that provides or coordinates personalcare services, 24-hour supervision, scheduled and unscheduled assistance, social activities, andsome health-related services. Typically, assisted living facilities house fewer than 100 residents,have apartment-like rooms (often private, with bedroom, bath, and kitchenette), and have centraldining facilities and activity rooms.
Assisted living is the fastest growing type of senior housing. In the absence of federalregulation or guidelines, states are grappling with how to protect individuals and ensureresidents’ safety and quality of care, while allowing providers flexibility for innovation andindividuality. As of June 1998, state legislative activity included:
• twenty-two states with assisted living regulations;
• five states with regulations drafted as a result of authorizing legislation;
• seven states with assisted living services covered under existing board and careregulations;
• three states with assisted living pilot projects; and
• fourteen states studying the issue (Mollica 1998).
$2,000Orego(SSI) incomliving
State
strategfor adhousinhomesStates
Select
Orego
includavaila
Figure 4Average Monthly Rent and Fees in Assisted Living Facilities
2%
2%
7%
13%
25%
23%
27%
1%
0 5 10 15 20 25 30
Less than $500
$501-1,000
$1,001-1,500
$1,501-2,000
$2,001-2,500
$2,501-3,000
$3,001-3,500
More than $3500
Percent of FacilitiesSource: AHCA, Survey of Assisted Living Facilities, 1996.
15
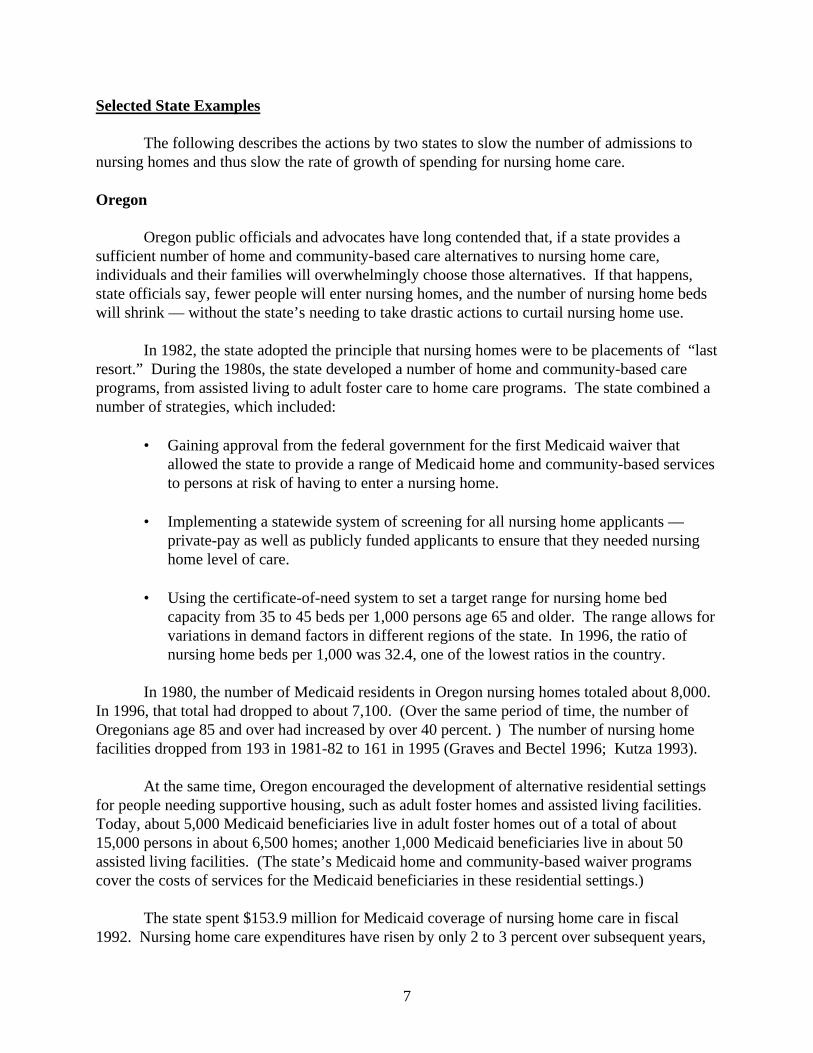
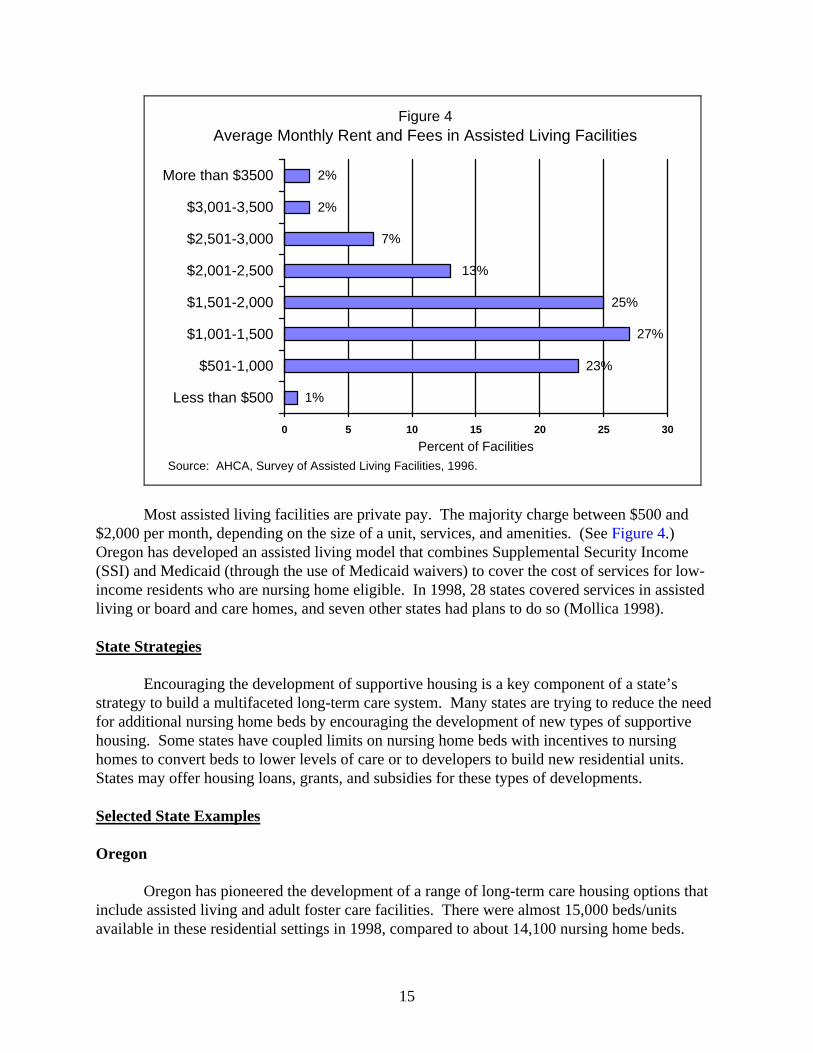
Most assisted living facilities are private pay. The majority charge between $500 and per month, depending on the size of a unit, services, and amenities. (See Figure 4.)
n has developed an assisted living model that combines Supplemental Security Incomeand Medicaid (through the use of Medicaid waivers) to cover the cost of services for low-e residents who are nursing home eligible. In 1998, 28 states covered services in assistedor board and care homes, and seven other states had plans to do so (Mollica 1998).
Strategies
Encouraging the development of supportive housing is a key component of a state’sy to build a multifaceted long-term care system. Many states are trying to reduce the need
ditional nursing home beds by encouraging the development of new types of supportiveg. Some states have coupled limits on nursing home beds with incentives to nursing to convert beds to lower levels of care or to developers to build new residential units. may offer housing loans, grants, and subsidies for these types of developments.
ed State Examples
n
Oregon has pioneered the development of a range of long-term care housing options thate assisted living and adult foster care facilities. There were almost 15,000 beds/unitsble in these residential settings in 1998, compared to about 14,100 nursing home beds.

16
• Oregon began licensing adult foster homes (nonmedical living arrangements withfive or fewer residents) in April 1986. Oregon recruits homes for participation inthe adult foster home program, trains staff, and encourages family members to runthe homes.
• • The state had licensed 2,023 adult foster homes with 9,055 beds as of March
1998. The Medicaid waiver program paid for in-home services for over 5,000residents of adult foster homes in 1997.
• During the 1988-89 period, the state designed an assisted living program as a
licensed category, reimbursable under the state’s Medicaid waiver programs. Thestate had licensed 98 assisted living facilities with 5,792 units by April 1998(Oregon Senior and Disabled Services 1998).
Florida
With one of the highest concentrations of older people in the country, Florida has beentrying in recent years to curtail nursing home admissions by placing people in supportiveresidential housing, such as assisted living facilities (ALFs), extended congregate care facilities(ECCs), and adult family care homes.
• ALFs offer personal care and other services in a group setting. As of April, 1998,Florida had licensed 2,094 ALFs, with about 67,000 beds. About 84 percent of theALF beds are private-pay, with the rest supported by Supplemental Security Incomewith state supplementation.
• The number of assisted living beds is fast approaching the number of nursing homebeds in the state, which totaled about 73,000 in 1998.
• The Extended Congregate Care program went into effect in December 1992. As of
April 1998, the state had licensed 224 ECC facilities. This form of supportivehousing provides a greater range of nursing services than a person may receive in anassisted living facility.
• Florida had licensed 365 adult family care homes with a total of 1,391 beds as ofApril 1998. Adult family care homes provide room, board, personal services, healthmonitoring, and general supervision for one to three older persons or disabled adultsin a family-type setting (Florida Agency for Health Care Administration 1998).
V. CONSOLIDATING STATE LONG-TERM CARE SYSTEMS
Background
A completely coordinated long-term care system does not exist in most states today. Anarray of state and federal programs are administered by different state and local agencies.

17
Services are delivered by state and local agencies, private nonprofit organizations, and private-sector providers.
Many long-term care experts believe that states could make more effective use of limitedpublic dollars for long-term care if they would develop a cohesive policy for long-term care andadminister that policy through a single agency. But consolidation can be difficult to achieve.State agencies generally have their own constituencies in advocate and provider groups and alsoin the legislature. Also, each agency is likely to resist loss of budgets and staffs.
• Several states have created cabinet-level departments on aging, while other stateshave created a single aging entity (bureau, department, or division) within an umbrellaagency that manages social services and welfare programs.
• The long-term care component that has been most effectively consolidated in moststates today is home and community-based care services. Most departments on agingbegan their existence by administering Older Americans Act social and nutritionalprograms for older persons. Now those departments are administering all federallyand state-funded home and community-based care programs for older persons.
• Medicaid agencies are generally responsible for the development of financial andfunctional eligibility criteria for Medicaid coverage of nursing home care. (Under theMedicaid waiver programs, participants must also meet these nursing home standards,although the programs themselves may be managed by an aging agency.)
• • State health departments typically license, regulate, and set payment rates for nursinghomes and other long-term care facilities.
State Strategies
States use a variety of models for administering long-term care financing and services.Increasingly in recent years, states have been consolidating previously scattered long-term careprograms and services into one department of aging. For example, the New Jersey governorcreated the Department of Health and Senior Services in 1996. The new department consolidated20 state and federal programs previously run by four departments. In 1997, the West Virginialegislature dissolved its Commission on Aging and the State Office of Aging, and created a newcabinet-level Bureau of Senior Services, reporting directly to the governor.
Selected State Examples
Oregon
Under a legislative mandate in 1981, Oregon began to bring all long-term care andservices into a single agency, which became the Senior and Disabled Services Division of theHuman Resources Department. The agency was created by merging the functions of the previousstate aging agency with the long-term care unit of the state Medicaid agency.
18
Only two long-term care activities had been left out in the 1981 reorganization — afederally mandated review process for nursing homes seeking Medicaid certification, and nursinghome licensure. In 1985, the Division became responsible for the Medicaid certification reviewand in 1987 for survey and licensure functions. The agency also administers Older AmericansAct programs, all the state’s Medicaid-funded long-term care services (including Medicaidpayments to nursing homes), and cash assistance and food stamps for older persons.
Kansas
During the early 1990s, Kansas commissioned several studies of its long-term careadministrative structure. At that time, responsibility for major long-term care services wasmainly divided between the Department of Social and Rehabilitation Services (SRS), whichhouses the Medicaid agency, and the Kansas Department on Aging (KDOA).
In 1996, the legislature mandated the transfer of specific programs from SRS to KDOA,effective June 30, 1997. At that time, the Department on Aging was administering OlderAmericans Act services and the state-funded Senior Care Act Program for persons age 60 andover who needed in-home services and who had incomes at 150 percent of poverty or higher.Table 2 depicts the range of responsibilities assumed by KDOA after the consolidation.
The programs administered by KDOA now range from assessment and case managementto state- and Medicaid-funded home care programs and nursing facility services payment. (SRSretained responsibility for determining financial eligibility for Medicaid services.)

Table 2Kansas Department On Aging Services
(after transfer of programs)Program Target Population &
EligibilityServices
Medicaid Home & CommunityBased Service Waiver for theFrail Elderly
• Ages 65 and older• Meet Medicaid LTC
threshold criteria*• Meet Medicaid financial
eligibility criteria• Consumers help pay for
services if countable income>$658 per month
• Adult day care• Sleep cycle support• Personal emergency response• Health care attendant• Wellness monitoring• Respite care
CARE Assessment • All ages• Must be seeking nursing
facility admission• No income requirement
• Individual assessment,referral to community-basedservices, appropriateplacement in LTC facilities
Nursing Facilities (NF) • Ages 65 and older• Meet Medicaid NF-LTC
threshold criteria• Meet Medicaid financial
eligibility criteria
• 24-hour skilled nursing care
Income Eligible Program • Ages 60 and older• <150% of poverty• Meet LTC threshold eligib.
for HCBS-FE waiver• Voluntary donation
• Non-medical attendant care• Homemaker• Income Eligible
individualized tailoredservices
Senior Care Act • Ages 60 and older• Cannot access any other
programs• Targeted to >150% poverty• Sliding fee scale
• Attendant care, homemaker,adult day care, respite, choreservices, transportation,assisted living, case mngmt
Case Management, State Funded • Ages 60 and older• No income test• At risk for nursing home care
• Assessment, coordination,resource development, careplanning, advocacy
Targeted Case Management • Ages 65 and older• Meet LTC threshold
eligibility• Meet Medicaid financial
eligibility criteria
• Assessment, coordination,resource development, careplanning, gatekeeping,advocacy
*Impairment in Activities of Daily Living (bathing, dressing, etc.) and Instrumental Activities ofDaily Living (shopping, medication management, housekeeping, etc.)
Source: Kansas Department on Aging, 1998
19

20
VI. ESTABLISHING A SINGLE POINT OF ENTRY SYSTEM Background
Many state aging units delegate responsibility for the administration of home andcommunity-based care services to local agencies around the state: Area Agencies on Aging,county agencies, or private, nonprofit organizations. These designated agencies are oftenreferred to as “single points of entry” through which individuals enter the state’s long-term caresystem. The responsibilities of a single point of entry agency may be only to provide informationand referral on long-term care services in the community. But many states assign greaterauthority to these local agencies, including allowing them to authorize the allocation of publiclong-term care dollars and to direct people to home and community-based care services.
In many states, single point of entry agencies conduct preadmission screening andassessment for nursing home applicants, or contract with other local agencies for these services.The preadmission screening and assessment process evaluates a person’s long-term care needs.If a case manager concludes that a person does not need nursing home level of care or will notmeet Medicaid functional eligibility requirements, the care manager will advise the individual ofhome and community-based care options, and help develop a plan of care. If a person meets theMedicaid criteria for nursing facility admission but would like to receive home care services,some case managers are able to authorize HCBC waiver or state-funded services.
By directing people away from nursing homes if they do not need that level of care, asingle point of entry system may help to conserve public long-term care dollars. By providinginformation on other long-term care options and helping to steer people to those services, asingle point of entry system helps people stay in their homes or in their communities.
Single point of entry systems vary from state to state. No one system can serve as amodel because states vary in demographics, geography, and state and local government structure.Creating a single point of entry system can spark controversy among government agencies, socialservice providers, and advocacy organizations because the single point agencies generallybecome “gatekeepers” for long-term care services. As such, the single point agencies haveconsiderable control over the allocation of dollars for services.
State Strategies
Selecting a local or regional organization to serve as a single entry point can be asensitive issue, and result in heated competition from existing local agencies. The following areillustrative of the range of approaches that states have taken:
• Oregon allows Area Agencies on Aging (AAAs) to be designated if they wish. If theydecline, local offices of the state Senior and Disabled Services Administration serveas the single entry point agency.
21
• Massachusetts has had an aging network for years made up mainly of Home CareCorporations (HCCs), with which the state’s Executive Office of Elder Affairs hascontracted to provide social support services for older people. Recent state legislationhas expanded the role of the HCCs into “Aging Services Access Points” or points ofentry into community-based long-term care services.
• The single point of entry in Indiana is the care management system operated by thestate’s 16 AAAs.
Selected State Examples
New Jersey
New Jersey has developed a system called NJ EASE (Easy Access Single Entry). Using aplanning grant from the Robert Wood Johnson Foundation, the state has established workingmodels of single entry systems in seven counties with another six counties expected to be inoperation by the end of calendar year 1998 (of a total of 21 counties in the state).
The county authority (e.g., Board of Chosen Freeholders or County Executive) designatesa county agency to take the lead in designing and operating the system. The lead agencyidentifies other agencies that can help the county provide a full range of core services. (Coreservices include information and assistance, outreach, benefits screening and counseling,comprehensive assessment, care planning, care management, and reassessment.) Counties mustuse existing funds from the Older Americans Act, Medicaid, and state and county programs tocover the costs of the new single entry point system.
One example of the models being developed is Atlantic County, which is using thecounty’s Division of Intergenerational Services as the lead agency. The division, in turn, hascontracted with two nonprofit agencies and one municipal office to provide outreach and caremanagement services for older people in two municipalities and one rural area in the county(New Jersey Department of Health and Senior Services, 1998).
Colorado
Colorado began planning its single point of entry system in the late 1980s.Implementation began in 1992 and was completed throughout the state by July 1, 1995. Thesystem called for county commissioners to group their counties into districts, with each districtresponsible for designating a single point of entry agency (now known as Options for Long TermCare (OLTC) agencies).
The OLTC agencies are varied and include county social service departments, countyhealth departments, area agencies on aging, and private nonprofit agencies. The mainresponsibility for these agencies has been to provide case management services for Medicaid andprivate-pay individuals. In May 1997, the Colorado legislature provided funding for a project toexpand the role of OLTC agencies to include services for persons in nursing homes. Three OLTC

agencies (in Denver and Jefferson and El Paso counties) were selected for a new two-year projectto identify nursing home residents who could be relocated to less restrictive settings (ColoradoDepartment of Health Care Policy and Financing 1997).
VII. INTEGRATING HEALTH AND LONG-TERM CARE
Background
Several states have begun to develop service delivery and financing systems that integratehealth and long-term care services and financing for persons dually eligible for Medicare andMedicaid. Generally, a managed care organization receives a capitated (or fixed) payment perenrollee through the pooling of Medicare and Medicaid funding to provide a full range ofmedical and social services for the enrollees.
Many states already require Medicaid-eligible families with children to participate inmanaged care programs. States have been slower to enroll persons with disabilities in theseplans because of uncertainty about costs and the complexity of design issues.
In 1995, about six million persons were enrolled in both Medicare and Medicaid at somepoint in the year. The 16 percent of Medicare’s beneficiaries who were also Medicaid eligibleaccounted for 30 percent of Medicare spending. While dually eligible individuals constituteabout 17 percent of the Medicaid population, they account for about 35 percent of total Medicaidexpenditures (HCFA 1997).
Various public and private organizations have been experimenting in recent years withways of providing integrated care, and have been testing different models in different types ofsettings. An integrated managed care system was pioneered in 1983 by On Lok Senior HealthServices in San Francisco. The Program of All-inclusive Care for the Elderly (PACE) developedfrom that project to become one of the first federally-managed demonstration projects to providea comprehensive program of health and long-term care services for dually eligible persons whorequire nursing home care.
The PACE program was authorized by Congress in 1986 as a demonstration project; theBalanced Budget Act of 1997 made the program permanent. PACE sites provided services toalmost 5,000 individuals during 1996. At the end of 1996, 26 PACE sites were operating in 16states. PACE participants receive assessment, care planning, and services from aninterdisciplinary medical and social work team, with the services generally provided at an adultday health care center (National PACE Association 1997).
State Strategies
Thirteen states4 have been developing programs to integrate health and long-term careservices for dually eligible persons. Policymakers reason that bringing health and long-term care
4Arizona, Colorado, Florida, Minnesota, Oregon, Texas, Wisconsin, and six New England states working jointly(Connecticut, Maine, Massachusetts, New Hampshire, Rhode Island, and Vermont).22

services into an integrated system for dually eligible beneficiaries will not only improve carecoordination but also help restrain costs.
Although state demonstration projects share a common objective to serve dually eligiblebeneficiaries, the characteristics of each program differ. (See Table 3.) For example, theArizona program integrates Medicaid health and long-term care, but Medicare still operatesseparately. Medicare services are, however, usually provided by the Medicaid contractor, whichfacilitates limited integration. On the other hand, Mesa County, Colorado is an example of afully integrated program, which combines Medicare and Medicaid health and long-term careservices through the Rocky Mountain health maintenance organization in Mesa County.
Table 3Summary of Selected Programs Serving Dually Eligible Beneficiaries
TargetPopulation
Scope ofService
Voluntary orMandatory
Statewide? Status
Arizona Long-Term CareSystem
Nursing facilityeligible elderly,physical ordevelopmentallydisabled
Primary, acuteand long-termcare
Mandatory forMedicaid
Yes Operatingsince 1989
Colorado Int.Care andFinancing
Medicaid benefi-ciaries, includingdually eligible
Primary, acuteand long-termcare
Voluntary No Waiverapproved July1997
MinnesotaSenior HealthOptions
Elderly duallyeligible
Primary, acuteand long-termcare
Voluntary No Operatingsince 1997
PACE 55+ years,nursing facilityeligible
Primary, acuteand long-termcare
Voluntary No On Lok since1983;replicationsites since1990
TexasStar+Plus
Elderly anddisabled,including duallyeligible
Primary, acuteand long-termcare
Mandatory forMedicaid
No WaiversapprovedJanuary 1998
Source: National Academy for State Health Policy, 1997.
23
Selected State Examples
Minnesota (Senior Health Options)
Minnesota has been enrolling Medicaid beneficiaries, including older persons, inmanaged care health plans since 1985 through its Public Medical Assistance Program (PMAP).Some of these enrollees have also participated in a Medicare plan operated by their PMAP.
After years of planning, Minnesota became the first state to receive Medicare andMedicaid waivers to integrate acute and long-term care for dually eligible older people. The
24
waivers allow the state to combine the purchase of both Medicare and Medicaid services into onecontract managed by the state.
• The program, called Minnesota Senior Health Options (MSHO), began operating inthe seven-county Minneapolis-St.Paul metropolitan area in January 1997.
• The state estimates that about 15,000 dually eligible older persons live in thedesignated area. As of May 1998, about 2,400 persons had enrolled in MSHO.
• Enrollees are entitled to receive all Medicaid services previously provided underPMAP, plus all Medicare services under Parts A and B. Plans are also providingextended home care benefits to persons eligible for nursing home care.
• Plans are also financially responsible for the first 180 days of care in a nursing homefor those who enroll in Senior Health Options while still living in the community.They continue to coordinate care after 180 days, and the nursing facility is paid a perdiem fee-for-service amount for services covered by Medicaid (MinnesotaDepartment of Human Services 1997).
Texas
On January 20, 1998, HCFA approved a health and long-term care integration projectcalled STAR+PLUS for Harris County (Houston) Texas. The project serves about 60,000 agedand disabled Medicaid beneficiaries in Harris County, about half of whom are dually eligible.
Participants may choose from three health maintenance organizations (HMOs), two ofwhich also have Medicare managed care contracts. The program offers unlimited prescriptionsfor dual eligibles who choose one HMO for both Medicare and Medicaid. The traditional TexasMedicaid prescription limit is three per month.
All participants are assigned a Care Coordinator, an HMO employee who is responsiblefor coordinating health and long-term care services. The Care Coordinator develops anindividual plan of care with the individual, family members, and provider, and can authorizeservices for the individual.
Long-term care services provided by the HMOs include day health care, personalassistance, and nursing facility care. Additional services are available to persons enrolled in thestate’s Community Based Alternatives Medicaid waiver program, which include adult fosterhome services, nursing services, respite care, and minor home modifications.
25
VIII. CREATING CONSUMER-DIRECTED PROGRAMS
Background
A number of states have created consumer-directed programs that permit persons withdisabilities or their families to manage their own long-term care services. The funding sourcesare generally either Medicaid personal care or waiver program funds or state general revenues.States hope to save money by using such programs because program participants can purchaseservices directly and need not go through provider agencies, which adds overhead costs. Self-directed care is also very popular with many young adults with disabilities who want the freedomto select their personal care worker and direct the assistance provided by that worker.
Several studies of these programs have been conducted. In one study, researcherssurveyed Medicaid beneficiaries who received home care services in Maryland, Michigan, andTexas. The purpose of the research was to determine how consumer choice affected Medicaidbeneficiary satisfaction with their lives and their aides (Tilly, forthcoming).
The authors constructed an index of choice, and compared the responses of participantswho had little or no choice regarding their home care workers to the responses of participantswho had a great deal of choice. Ninety-two percent of beneficiaries with the greatest amount ofchoice in home care said their aide was very concerned about their well being, compared with 74percent of those with some element of choice and 63 percent of those with no choice. Seventy-six percent of those who had a high level of choice said the presence of their aide made them feelsafer at home, compared to 47 percent of those with little or no choice (The CommonwealthFund 1993).
The study reported that state programs providing beneficiaries with the greatest flexibilityand choice in regard to personal care services ranked highest among the beneficiaries in terms ofimproving their quality of life. A key factor was the ability to select one’s own home care aide(The Commonwealth Fund 1993).
State Strategies
States employ a variety of consumer-directed cash payment models, with variations onthe age of the recipient, nature of disability, provider to be selected, hiring and firing practices,reporting requirements, and other issues.
The Robert Wood Johnson Foundation is collaborating with the US Department of Healthand Human Services to support a multistate demonstration and evaluation of a “cash andcounseling” program. Arkansas and New York were selected for the project in 1996 and Floridaand New Jersey in 1997. The program has given the four states planning grants to experimentwith giving cash to Medicaid beneficiaries with disabilities. The beneficiaries will choose theirown long-term care arrangements, and receive counseling on how to manage a cash allowance,including selecting and working with a personal assistant.
26
Selected State Examples
Colorado
The Colorado Home Care Allowance is one of the earliest state models of cash grants toindividuals to purchase long-term care services. The state-funded program began in 1979 as anadded cash grant to the state’s Old Age Pension Program.
• Services are targeted to persons who are financially needy and unable to meet theirphysical or personal care needs themselves. About 67 percent of the clients are age60 and older.
• Payments are made directly to clients for purchase of services from relatives, friends,or agency providers.
• State officials estimate that the program will serve 5,735 persons in fiscal 1997-98.Program beneficiaries receive a monthly amount based on functional needs, with theamounts ranging from a minimum of $123 for a person with low levels of need to amaximum of $358 for high levels of need. The average monthly payment in fiscal1996-97 was $214.04; the average is expected to be $222.99 for fiscal 1997-98(Colorado Department of Health Care Policy and Financing, 1998).
Michigan
Michigan began operating its Home Help Program in October 1980 as part of itsMedicaid Personal Care optional benefit program. Counseling services are provided locally byadult services workers of the state Family Independence Agency. In addition to conducting aneeds assessment, the adult services worker develops a service plan with the individual.
• As of March 1998, the program had 36,355 enrollees, about half of whom were age60 and older.
• Enrollees receive an average monthly payment of about $307 in 1998.
• Enrollees are free to choose their own providers from available family members(about 47 percent of all providers), and friends and neighbors (47 percent). Publicand private service agencies make up the remaining 6 percent (Michigan Departmentof Community Health 1998).
IX. CONCLUSION
A state faces a daunting task in developing a comprehensive long-term care system thatoffers choice to consumers and cost savings to the state. Many states have chosen to reorganizeservices or expand services gradually. A governor might transfer certain home and community-

27
based care programs from a Medicaid agency to an aging agency. A state legislature mightincrease expenditures for state-funded home care. A state regulatory agency might adjust thereimbursement rates paid to nursing homes to control increases in payments.
Most of the states discussed in this report have, however, chosen to adopt morecomprehensive strategies to tie together financing and delivery components of long-term care.These strategies are based on the premise that controlling the use of nursing home care canpromote choice and independence only if home and community-based care alternatives areavailable and affordable. Creation of a single point of entry system will help improve access toservices only if case managers have programs and providers to whom they can refer their clients.
Evidence that many states are expanding home and community-based care service optionsand increasing spending on these services comes from Medicaid spending reports and fromrecent surveys of state general revenue funding of HCBC services. Medicaid spending for homeand community-based care has more than doubled in the last decade as a proportion of Medicaidexpenditures for long-term care. Nonetheless, Medicaid spending for institutional care ($42.5billion) was still more than three times higher than Medicaid spending on home and community-base care ($13.5 billion) in fiscal 1997.
Progress in expanding home and community-based care services has been slowed by gapsin the research about the most cost-effective strategies. These gaps leave many policymakersreluctant to increase spending too rapidly on HCBC services. Some policymakers are uncertainabout whether they will be substituting HCBC services for costly nursing home care or addingadditional HCBC recipients while nursing home costs continue to rise.
Cost is a legitimate concern for advocates and consumers as well as policymakers andresearchers. State models need to be tested, comparative studies need to be conducted, andoutcomes need to be assessed. But a debate over costs could paralyze further progress indeveloping a rational long-term care system in this country. Many vulnerable people will gowithout services if cost effectiveness is the only issue.
States must move ahead in developing long-term care systems that offer a range ofservices in various settings so that the millions of people who need long-term care have access tothe most appropriate and affordable services. Important lessons can be learned from the long-term care models that have already been developed. These models demonstrate a broad range ofoptions that have been explored and implemented.
This report has sought to highlight some of these models. State officials must be willingto experiment and innovate as have the states mentioned in this report and others. At the sametime, researchers need to continue their search for quantifiable data on cost-effective methodsand successful outcomes.

28
REFERENCES
Arkansas Department of Human Services. Division of Medical Services. 1998.
Auerbach, Roger. Administrator, Oregon Senior and Disabled Services Division. Testimony before US Senate Special Committee on Aging. March 9, 1998.
Bectel, Robert W. and Natalie Graves Tucker. Across the States 1998: Profiles of Long- Term Care Systems. Third Edition. American Association of Retired Persons. Washington,
DC. 1998.
Booth, Maureen; Julie Fralich; Paul Saucier, Muskie School of Public Service (University of Southern Maine); and Robert Mollica and Trish Riley, National Academy for State Health Policy. Integration of Acute and Long-Term Care for Dually Eligible Beneficiaries through Managed Care. Robert Wood Johnson Foundation Medicare/Medicaid Integration Program. University of Maryland Center on Aging. College Park, MD. 1997.
Burwell, Brian. Medicaid Long-Term Care Expenditures, FY 1997. The MEDSTAT Group. Cambridge, MA. April 6, 1998.
Citro, Jeremy. “Assisted Living in the United States.” Fact Sheet Number 62. American Association of Retired Persons. Washington, DC. January 1998.
Clemmer, Elizabeth. “Assisted Living and its Implications for Long-Term Care.” Issue Brief No. 20. American Association of Retired Persons. Washington, DC. 1995.
Colorado Department of Social Services. Single Entry Point System for Long Term Care: Detailed Implementation Plan. Denver, CO. September 1, 1991.
Colorado Department of Health Care Policy and Financing. “Deinstitutionalization Project.” July 1997. Telephone interview with state official. May 1998.
Commonwealth Fund Commission on Elderly People Living Alone. “The Importance of Choice in Home Care Programs: Maryland, Michigan, and Texas. The Commonwealth Fund. New York, NY. June 9, 1993.
Concannon, Kevin W. “Home and Community Care in Oregon,” Public Welfare. Spring 1995: 10-16.
Feder, Judith; Jeanne Lambrew, and Michelle Huckaby. “Medicaid and Long-Term Care for the Elderly: Implications of Restructuring.” The Commonwealth Fund. New York, NY. December 1996.
29
Florida Agency for Health Care Administration. Telephone interview. May, 1998.
Fralich, Julie, Trish Riley, Robert L. Mollica, and Deborah J. Carr. “Reducing the Cost of Institutional Care: Downsizing, Diversion, Closing and Conversion of Nursing Homes, A Working Paper.” National Academy for State Health Policy. Portland, ME. August 1994.
Goldberg, Eleanor J.; Julie Fralich, and Kathryn Pears. “Medicaid and Long Term Care.” Maine Choices: 1997, A Preview of State Budget Issues.. Maine Center for Economic Policy. Augusta, ME, November, 1996.
HCIA Inc. and Arthur Andersen LLP. The Guide to the Nursing Home Industry, 1996. Baltimore, MD, 1996.
Harrington, Charlene; James H. Swan, Carrie Griffin, Wendy Clemena, Barbara Bedney, Helen Carrillo, and Sara Shostak. 1996 State Data Book on Long Term Care Program and Market Characteristics. University of California at San Francisco and Wichita State University at Wichita, KS. May 1998.
Harrington, Charlene; James H. Swan, John A. Nyman, and Helen Carrillo. “The Effect of Certificate of Need and Moratoria Policy on Change in Nursing Home Beds in the United States.” Medical Care 35, no. 6 (1997) 574-588.
Holahan, John and David Liska. “Reassessing the Outlook for Medicaid Spending Growth.” Series A. No. A-6. The Urban Institute, Washington, DC. March 1997.
Indiana Family and Social Services Administration. “Statewide IN-Home Services Program, Annual Report — 1996.” Indianapolis, IN. March 1997.
Justice, Diane. State Long Term Care Reform: Development of Community Care Systems in Six States. Health Policy Studies, Center for Policy Research, National Governors’ Association. Washington, DC. April 1988.
Kaiser Commission on the Future of Medicaid. “Long-Term Care” The Role of Medicaid,” August 1994.
Kansas Department on Aging. “KDOA’s Programs.” Topeka, KS. 1998.
Kassner, Enid and Loretta Williams. “Taking Care of Their Own: State-funded Home and Community-Based Care Programs for Older Persons.” American Association of Retired Persons. Washington, DC. September 1997.
Ladd, Richard. “Oregon’s LTC System: A Case Study by the National LTC Mentoring Program. Case Report Number 1.” University of Minnesota School of Public Health,

30
Institute for Health Services Research. Minneapolis, MN. April 1996.
Ladd, Richard C., Robert L. Kane, Rosalie A. Kane, and Wendy J. Nielsen. “State LTC Profiles Report.” National LTC Mentoring Program. Institute for Health Services Research, School of Public Health, University of Minnesota. November 1995.
Lakin, K. Charlie; Barbara Polister, and Robert W. Prouty. “Utilization of and Expenditures for Medicaid Institutional and Home and Community Based Services.” Residential Services for Persons with Developmental Disabilities: Status and Trends Through 1997. Research and Training Center on Community Living. University of Minnesota. Minneapolis, MN. May 1998.
Maine Department of Human Services. Bureau of Elder and Adult Services. “Long- Term Care Reform: A Status Report.” Augusta, ME. 1997.
Michigan Department of Community Health. Home Health Services. Telephone conversation. June 1998.
Mollica, Robert L. State Assisted Living Policy 1998. National Academy for State Health Policy. Portland, ME. July 1998.
Muskie School of Public Service/National Academy for State Health Policy. Integration of Acute and Long-Term Care for Dually Eligible Beneficiaries through Managed Care. Technical Assistance Paper for Robert Wood Johnson Foundation Medicare/Medicaid Integration Program, University of Maryland. College Park, MD: 1997.
National PACE Association. “PACE Profile.” San Francisco, CA. August 1997.
New Jersey Department of Health and Senior Services. “Final Grant Report: Long-Term Care Advantage Initiative, January, 1995 through April 1998.” Trenton, NJ. May 1998.
Oregon Senior and Disabled Services Division. “The Graying of Oregon: Some Facts about Oregon’s System of Services for the Elderly and Disabled.” Salem, OR. January 1993.
Strahan, Genevieve. “An Overview of Nursing Homes and Their Current Residents, Data from the 1995 National Nursing Home Survey.” Advance Data, Number 280. National Center for Health Statistics, US Department of Health and Human Services. Washington, DC. January 23, 1997.
US Health Care Financing Administration. “A Profile of Dually Eligible Beneficiaries.” Data from the Medicare Current Beneficiary Survey. US Health Care Financing Administration: Baltimore, MD. March 1997.

31