Embed Size (px)
Citation preview
Item 2E Approve Long Term Financial
Projection (LTFP)
25
Agenda Item: 2E Date: February 13, 2014
FIRST 5 LA
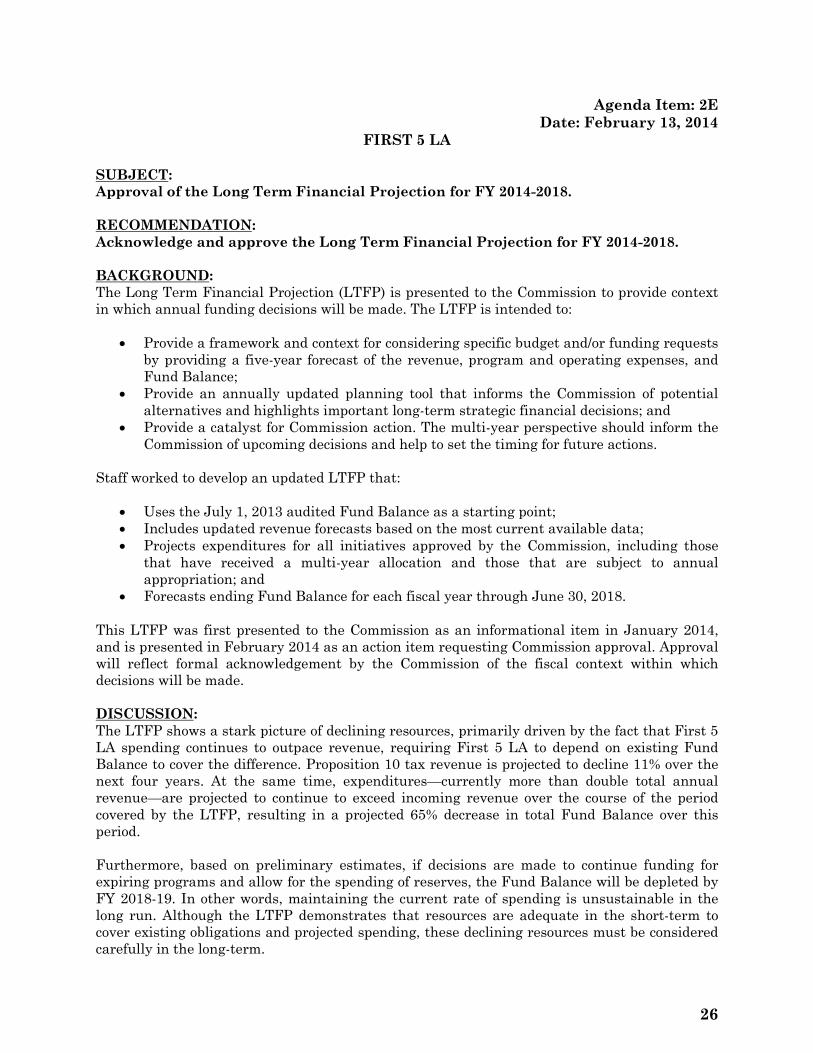
SUBJECT: Approval of the Long Term Financial Projection for FY 2014-2018. RECOMMENDATION: Acknowledge and approve the Long Term Financial Projection for FY 2014-2018. BACKGROUND: The Long Term Financial Projection (LTFP) is presented to the Commission to provide context in which annual funding decisions will be made. The LTFP is intended to:
• Provide a framework and context for considering specific budget and/or funding requests by providing a five-year forecast of the revenue, program and operating expenses, and Fund Balance;
• Provide an annually updated planning tool that informs the Commission of potential alternatives and highlights important long-term strategic financial decisions; and
• Provide a catalyst for Commission action. The multi-year perspective should inform the Commission of upcoming decisions and help to set the timing for future actions.
Staff worked to develop an updated LTFP that:
• Uses the July 1, 2013 audited Fund Balance as a starting point; • Includes updated revenue forecasts based on the most current available data; • Projects expenditures for all initiatives approved by the Commission, including those
that have received a multi-year allocation and those that are subject to annual appropriation; and
• Forecasts ending Fund Balance for each fiscal year through June 30, 2018. This LTFP was first presented to the Commission as an informational item in January 2014, and is presented in February 2014 as an action item requesting Commission approval. Approval will reflect formal acknowledgement by the Commission of the fiscal context within which decisions will be made. DISCUSSION: The LTFP shows a stark picture of declining resources, primarily driven by the fact that First 5 LA spending continues to outpace revenue, requiring First 5 LA to depend on existing Fund Balance to cover the difference. Proposition 10 tax revenue is projected to decline 11% over the next four years. At the same time, expenditures—currently more than double total annual revenue—are projected to continue to exceed incoming revenue over the course of the period covered by the LTFP, resulting in a projected 65% decrease in total Fund Balance over this period. Furthermore, based on preliminary estimates, if decisions are made to continue funding for expiring programs and allow for the spending of reserves, the Fund Balance will be depleted by FY 2018-19. In other words, maintaining the current rate of spending is unsustainable in the long run. Although the LTFP demonstrates that resources are adequate in the short-term to cover existing obligations and projected spending, these declining resources must be considered carefully in the long-term.
26
The LTFP illustrates that now is the time to begin making critical, strategic decisions that will determine the future direction of First 5 LA, including transitioning to a more sustainable spending portfolio—one that aligns annual spending with annual revenue with limited reliance on Fund Balance. By balancing future investments with declining resources, First 5 LA will have an opportunity to bring sharper focus to the directed areas of investment and realign them in a manner that ensures sustainability. This fiscal outlook should help to inform any Commission decisions with a fiscal impact, ensuring that both existing and new funding commitments are sustainable and aligned with the Strategic Plan and the Building Stronger Families Framework. Attachments:
1. Long Term Financial Projection – FY 2014-2018 2. Attachment 1 – Long Term Financial Projection – Multi-Year Forecast Detail 3. Attachment 2 – Footnotes to the Long Term Financial Projection – Multi-Year Forecast
Detail 4. Long Term Financial Projection – PowerPoint Presentation
For Office Use
Board Action Taken:
Referred to Committee/Work Group:
Approved: Yes No Further Discussion
27

First 5 LA
Long Term Financial Projection FY 2014 – 2018
28
2
I. Introduction: Purpose of the Long Term Financial Projection This updated Long Term Financial Projection (LTFP) is intended to aid in the Commission’s financial stewardship role by providing a framework that shows the long-term implications of fiscal actions. It includes a multi-year outlook of anticipated expenditures of allocated funds, as well as annual operating and program demands against forecasted revenue. Specifically, staff worked to develop an updated LTFP that:
• Uses the July 1, 2013 audited Fund Balance as a starting point; • Includes updated revenue forecasts based on the most current available data; • Projects expenditures for all initiatives approved by the Commission, including those
that have received a multi-year allocation and those that are subject to annual appropriation; and
• Forecasts ending Fund Balance for each fiscal year through June 30, 2018. It is important to note that the LTFP does not formally obligate or commit any funds and is not a spending plan—funds must be committed as part of the annual budget or through a Resolution that specifically allocates funds for an initiative or program. The LTFP is presented to the Commission in advance of the annual budget process to provide context in which annual funding decisions will be made. The period covered by this update is July 1, 2013 through June 30, 2018. In sum, the LTFP is intended to:
• Provide a framework and context for considering specific budget and/or funding requests by providing a five-year forecast of the revenue, program and operating expenses, and Fund Balance.
• Provide an annually updated planning tool that informs the Commission of potential alternatives and highlights important long-term strategic financial decisions.
• Provide a catalyst for Commission action. The multi-year perspective should inform the Commission of upcoming decisions and help to set the timing for future actions.
II. Methodology/Approach This LTFP represents a collaborative effort between Finance and Program staff throughout the organization. Staff used the FY 2013-14 Budget as a baseline and forecast program expenditures through FY 2017-18. This period extends three years beyond the current Strategic Planning period (FY 2014-15) to account for major programs funded through this time. The current Strategic Plan period is from July 1, 2010 through June 30, 2015, not including the one-year transition period from July 1, 2009 through June 30, 2010. The LTFP was developed using the following approach and methods:
• The baseline year is the approved FY 2013-14 Budget. At the time the LTFP was developed, only first quarter expenditure data were available, so actual expenditures for FY 2013-14 were not used to test reliability of budget forecasts. This may overstate actual expenses for the current fiscal year.
• As part of the action taken to approve the FY 2013-14 Budget in June 2013, the Commission reauthorized multi-year commitments and allocations. This schedule,
29
3
known as the GASB 54 schedule, was approved by formal Resolution and designates funds for those specific purposes as directed by the Commission.
• The LTFP distinguishes between and provides forecasts for all known program and operating expenses as follows: o Initiative Allocations – As indicated above, the Commission has approved a number
of multi-year allocations for specific initiatives. Staff conducted analyses to forecast how funding would be expended over the approved funding term for each initiative.
o Annual Program Demands – Other initiatives have not received a multi-year allocation, but have been identified as priorities in the current Strategic Plan. Funding for these programs is a demand against annual revenue and Uncommitted Fund Balance, and the specific funding requests are approved through the annual budget process.
o Operating Expenses – Costs for operating First 5 LA and associated staffing are the third element of the forecast. The administrative portion of the Operating Budget is assumed to be within the 5% limit as currently defined by First 5 LA policy.
III. Assumptions
A. Beginning Fund Balance The FY 2013-14 beginning Fund Balance utilized in the LTFP reflects the ending Fund Balance per the Comprehensive Annual Financial Report (CAFR) for the fiscal year ending June 30, 2013. Beginning Fund Balance in future years is calculated based on projected revenue and expenditures for the year prior.
B. Revenue First 5 LA is funded through the Proposition 10 Tobacco Tax, 80% of which is distributed to the County Commissions based on their proportion of statewide births. Los Angeles County receives the greatest share, typically approximately 26% of the total County allocations. Tobacco tax revenue, projected to be roughly $90.0 million in FY 2013-14, is anticipated to continue declining in future years based on the most recent estimate from the State Department of Finance (DOF), which forecasts an average 2 to 4% annual decline in tax revenue. The DOF forecast incorporates assumptions related to the State Board of Equalization (BOE) administrative costs, which increased 35% from FY 2008-09 to FY 2012-13, with an additional 8% increase projected for FY 2013-14. First 5 LA will continue to work with other county Commissions and the State First 5 Association to track and evaluate the disproportionately increasing BOE administrative costs and possible actions to address. Interest earnings are projected based on a 1.12% return on anticipated cash balances. Interest earnings for FY 2013-14 are projected at approximately $7.3 million. Lease revenue of $99,000 is also expected for FY 2013-14 based on the negotiated lease agreement for the preschool occupying space on the first floor of the First 5 LA building. C. Program Expenditure Assumptions The expenditure projections contained in the LTFP were developed based on the following overarching assumptions:
• Fidelity to existing Commission-approved allocations, as well as other funding decisions made by the Commission.
30
4
• Allocations for programs currently scheduled to expire are not extended. For example, expenditure projections only include funding for Los Angeles Universal Preschool (LAUP) through June 2016, when the existing contract is scheduled to end.
• Continued Commission approval of annually appropriated funds for investment areas associated with the current Strategic Plan that adhere to a zero-based budgeting platform, under which appropriations are approved annually by the Commission.
• Acknowledgement in the Strategic Plan Implementation Plan that its investments (Place-Based Investments and Countywide Strategies) would require more than the Plan’s five years to fully implement. As such, the projections assume that the Commission will continue to approve funding for these investments beyond June 2015.
• Initiatives and strategies will be implemented according the planned schedule. As First 5 LA transitioned to the current Strategic Plan and investments in place-based strategies, implementation occurred slower than anticipated. Similarly, many Countywide Initiatives that were approved in FY 2010-11 are just beginning to reach full implementation (while most Countywide Initiatives were approved by the Commission in FY 2010-11, several new initiatives were also approved in subsequent fiscal years).
D. Operating Expenditure Assumptions The approved FY 2013-14 Operating Budget of $17.8 million included assumptions related to staffing, salary and benefit costs, and other operating costs. The LTFP assumes that total operating costs will increase at a rate of 2% annually through FY 2015-16, a rate that is consistent with historical trends. Assuming programs scheduled to expire are not extended (as described above), expenditures are projected to decrease substantially in FY 2016-17. As a result, the LTFP assumes level funding for operating costs in FY 2016-17 and FY 2017-18. The LTFP also assumes compliance with First 5 LA’s annual administrative limit of 5%. The annual administrative expense will be adjusted as necessary to stay within this limit. Per adopted policy, administrative expenses are assumed to include all costs incurred in support of the general management and administration of First 5 LA for a common or joint purpose that benefits more than one cost objective (other than evaluation activities), and/or those costs not readily assignable to a specifically benefited cost objective. Costs are defined as follows:
• 100% of the following Departments’ costs proposed within the annual fiscal Operating Budget: Board of Commissioners, Executive, Chief Administrative Office, Contract Compliance, Facilities Management, Finance, Finance – Medi-Cal Administrative Activities, Human Resources, Information Technology, Chief Program Office and Public Affairs; and
• Estimated salary and benefit costs for Director and Administrative positions for the following Departments: Best Start Communities, Community Investments, Grants Management, Policy, Program Development and Research and Evaluation.
IV. Analysis: The Five-year Outlook Resources are adequate to cover existing obligations through the course of the current Strategic Plan (June 2015). However, over the long-term, the LTFP shows a stark picture of declining resources, including both incoming revenue and existing Fund Balance. This is primarily driven by the fact that First 5 LA spending continues to outpace revenue, requiring First 5 LA to depend on existing Fund Balance to cover the difference.
31
5
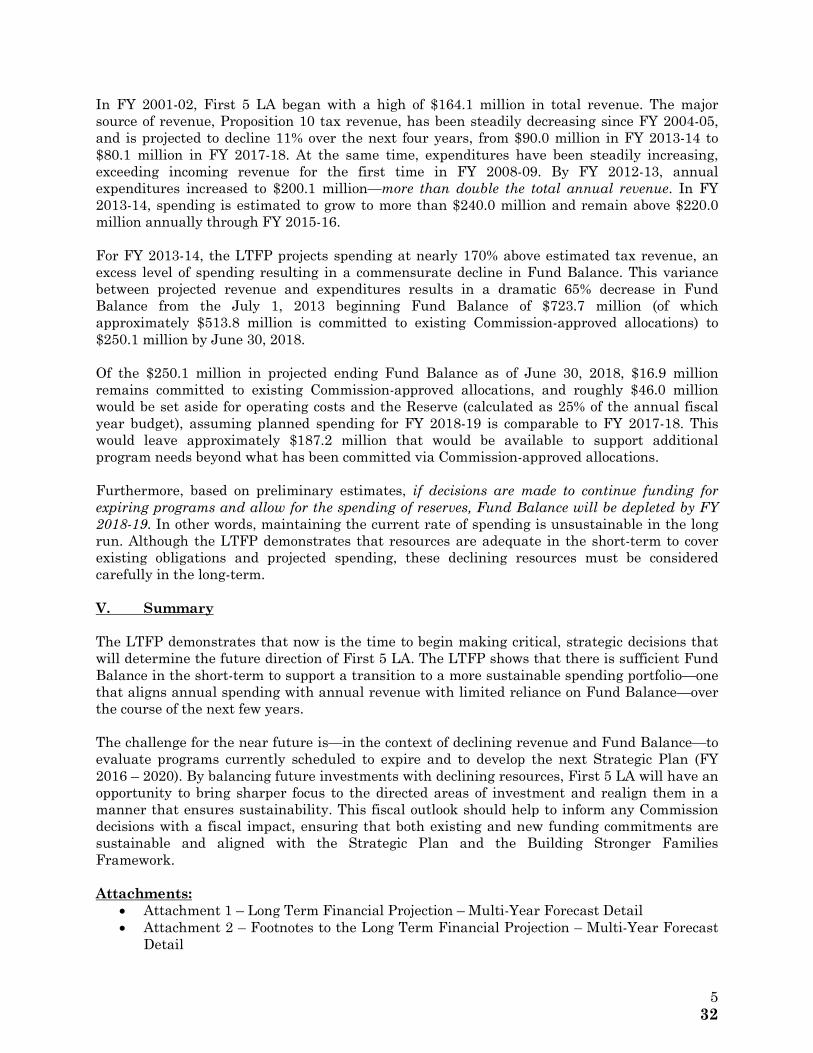
In FY 2001-02, First 5 LA began with a high of $164.1 million in total revenue. The major source of revenue, Proposition 10 tax revenue, has been steadily decreasing since FY 2004-05, and is projected to decline 11% over the next four years, from $90.0 million in FY 2013-14 to $80.1 million in FY 2017-18. At the same time, expenditures have been steadily increasing, exceeding incoming revenue for the first time in FY 2008-09. By FY 2012-13, annual expenditures increased to $200.1 million—more than double the total annual revenue. In FY 2013-14, spending is estimated to grow to more than $240.0 million and remain above $220.0 million annually through FY 2015-16. For FY 2013-14, the LTFP projects spending at nearly 170% above estimated tax revenue, an excess level of spending resulting in a commensurate decline in Fund Balance. This variance between projected revenue and expenditures results in a dramatic 65% decrease in Fund Balance from the July 1, 2013 beginning Fund Balance of $723.7 million (of which approximately $513.8 million is committed to existing Commission-approved allocations) to $250.1 million by June 30, 2018. Of the $250.1 million in projected ending Fund Balance as of June 30, 2018, $16.9 million remains committed to existing Commission-approved allocations, and roughly $46.0 million would be set aside for operating costs and the Reserve (calculated as 25% of the annual fiscal year budget), assuming planned spending for FY 2018-19 is comparable to FY 2017-18. This would leave approximately $187.2 million that would be available to support additional program needs beyond what has been committed via Commission-approved allocations. Furthermore, based on preliminary estimates, if decisions are made to continue funding for expiring programs and allow for the spending of reserves, Fund Balance will be depleted by FY 2018-19. In other words, maintaining the current rate of spending is unsustainable in the long run. Although the LTFP demonstrates that resources are adequate in the short-term to cover existing obligations and projected spending, these declining resources must be considered carefully in the long-term. V. Summary The LTFP demonstrates that now is the time to begin making critical, strategic decisions that will determine the future direction of First 5 LA. The LTFP shows that there is sufficient Fund Balance in the short-term to support a transition to a more sustainable spending portfolio—one that aligns annual spending with annual revenue with limited reliance on Fund Balance—over the course of the next few years. The challenge for the near future is—in the context of declining revenue and Fund Balance—to evaluate programs currently scheduled to expire and to develop the next Strategic Plan (FY 2016 – 2020). By balancing future investments with declining resources, First 5 LA will have an opportunity to bring sharper focus to the directed areas of investment and realign them in a manner that ensures sustainability. This fiscal outlook should help to inform any Commission decisions with a fiscal impact, ensuring that both existing and new funding commitments are sustainable and aligned with the Strategic Plan and the Building Stronger Families Framework. Attachments:
• Attachment 1 – Long Term Financial Projection – Multi-Year Forecast Detail • Attachment 2 – Footnotes to the Long Term Financial Projection – Multi-Year Forecast
Detail
32
Attachment 1
January 13, 2014
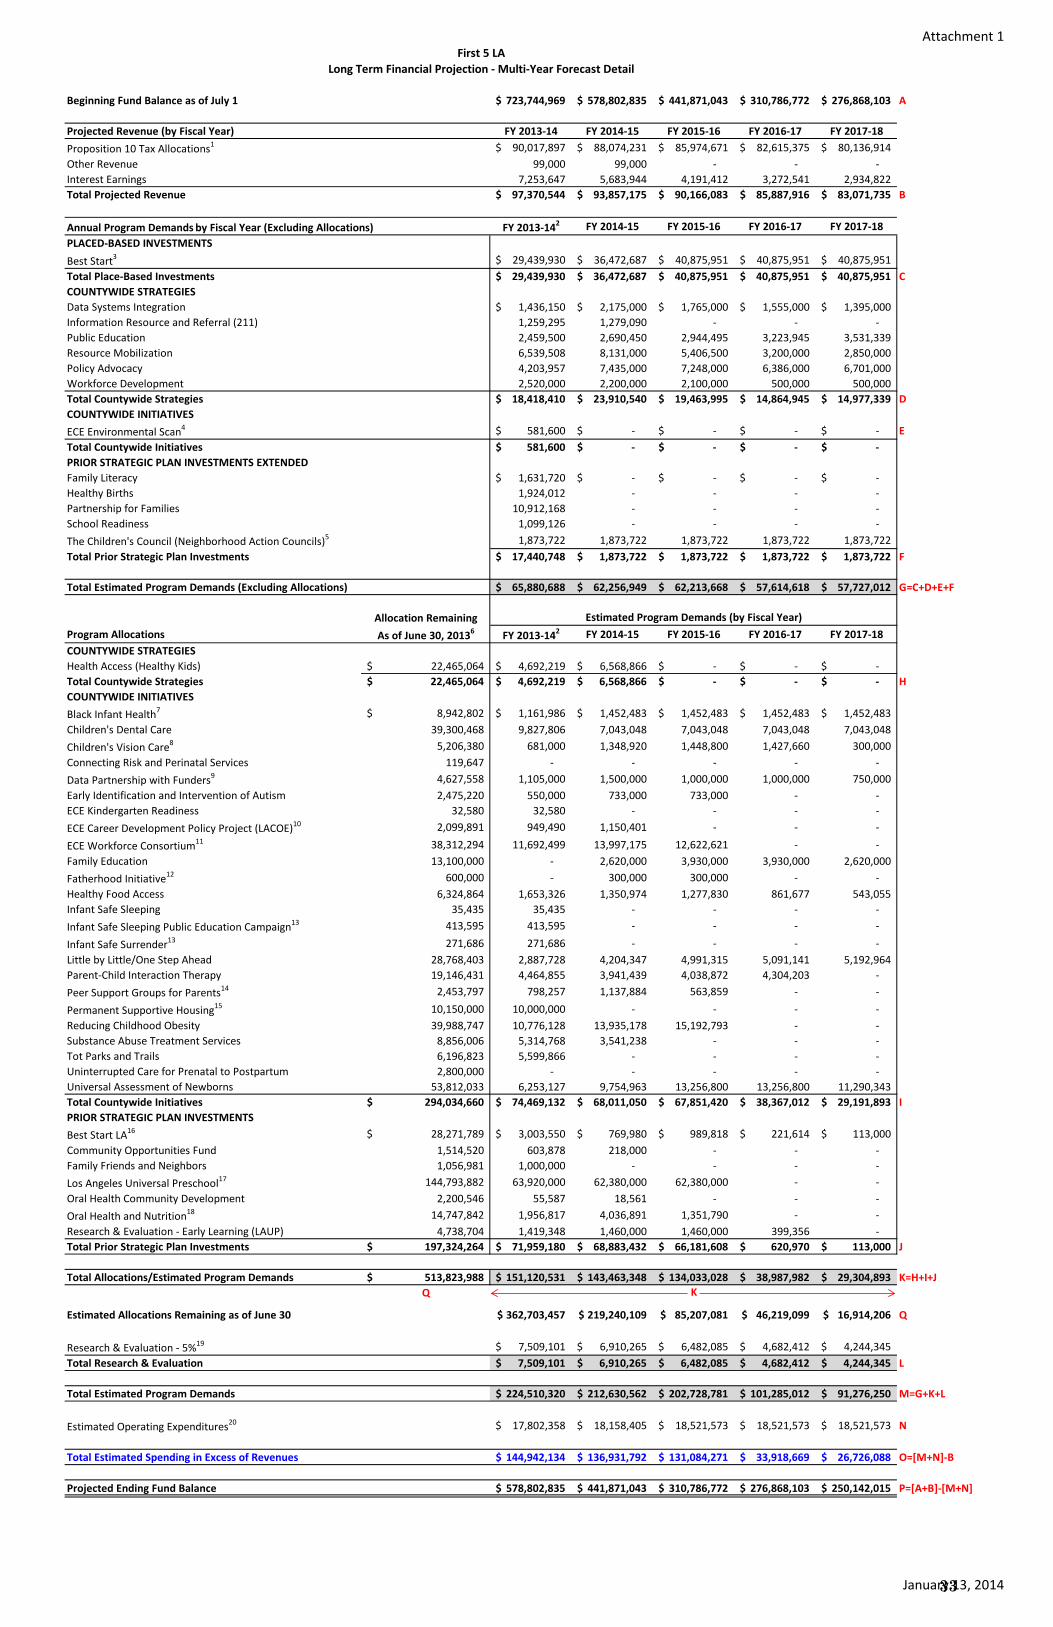
Beginning Fund Balance as of July 1 723,744,969$ 578,802,835$ 441,871,043$ 310,786,772$ 276,868,103$ A
Projected Revenue (by Fiscal Year) FY 2013-14 FY 2014-15 FY 2015-16 FY 2016-17 FY 2017-18Proposition 10 Tax Allocations1 90,017,897$ 88,074,231$ 85,974,671$ 82,615,375$ 80,136,914$ Other Revenue 99,000 99,000 - - - Interest Earnings 7,253,647 5,683,944 4,191,412 3,272,541 2,934,822 Total Projected Revenue 97,370,544$ 93,857,175$ 90,166,083$ 85,887,916$ 83,071,735$ B
Annual Program Demands by Fiscal Year (Excluding Allocations) FY 2013-142 FY 2014-15 FY 2015-16 FY 2016-17 FY 2017-18PLACED-BASED INVESTMENTSBest Start3 29,439,930$ 36,472,687$ 40,875,951$ 40,875,951$ 40,875,951$ Total Place-Based Investments 29,439,930$ 36,472,687$ 40,875,951$ 40,875,951$ 40,875,951$ CCOUNTYWIDE STRATEGIESData Systems Integration 1,436,150$ 2,175,000$ 1,765,000$ 1,555,000$ 1,395,000$ Information Resource and Referral (211) 1,259,295 1,279,090 - - - Public Education 2,459,500 2,690,450 2,944,495 3,223,945 3,531,339 Resource Mobilization 6,539,508 8,131,000 5,406,500 3,200,000 2,850,000 Policy Advocacy 4,203,957 7,435,000 7,248,000 6,386,000 6,701,000 Workforce Development 2,520,000 2,200,000 2,100,000 500,000 500,000 Total Countywide Strategies 18,418,410$ 23,910,540$ 19,463,995$ 14,864,945$ 14,977,339$ DCOUNTYWIDE INITIATIVESECE Environmental Scan4 581,600$ -$ -$ -$ -$ ETotal Countywide Initiatives 581,600$ -$ -$ -$ -$ PRIOR STRATEGIC PLAN INVESTMENTS EXTENDEDFamily Literacy 1,631,720$ -$ -$ -$ -$ Healthy Births 1,924,012 - - - - Partnership for Families 10,912,168 - - - - School Readiness 1,099,126 - - - - The Children's Council (Neighborhood Action Councils)5 1,873,722 1,873,722 1,873,722 1,873,722 1,873,722 Total Prior Strategic Plan Investments 17,440,748$ 1,873,722$ 1,873,722$ 1,873,722$ 1,873,722$ F
Total Estimated Program Demands (Excluding Allocations) 65,880,688$ 62,256,949$ 62,213,668$ 57,614,618$ 57,727,012$ G=C+D+E+F
Allocation RemainingProgram Allocations As of June 30, 20136 FY 2013-142 FY 2014-15 FY 2015-16 FY 2016-17 FY 2017-18COUNTYWIDE STRATEGIESHealth Access (Healthy Kids) 22,465,064$ 4,692,219$ 6,568,866$ -$ -$ -$ Total Countywide Strategies 22,465,064$ 4,692,219$ 6,568,866$ -$ -$ -$ HCOUNTYWIDE INITIATIVESBlack Infant Health7 8,942,802$ 1,161,986$ 1,452,483$ 1,452,483$ 1,452,483$ 1,452,483$ Children's Dental Care 39,300,468 9,827,806 7,043,048 7,043,048 7,043,048 7,043,048 Children's Vision Care8 5,206,380 681,000 1,348,920 1,448,800 1,427,660 300,000 Connecting Risk and Perinatal Services 119,647 - - - - - Data Partnership with Funders9 4,627,558 1,105,000 1,500,000 1,000,000 1,000,000 750,000 Early Identification and Intervention of Autism 2,475,220 550,000 733,000 733,000 - - ECE Kindergarten Readiness 32,580 32,580 - - - - ECE Career Development Policy Project (LACOE)10 2,099,891 949,490 1,150,401 - - -
ECE Workforce Consortium11 38,312,294 11,692,499 13,997,175 12,622,621 - - Family Education 13,100,000 - 2,620,000 3,930,000 3,930,000 2,620,000 Fatherhood Initiative12 600,000 - 300,000 300,000 - - Healthy Food Access 6,324,864 1,653,326 1,350,974 1,277,830 861,677 543,055 Infant Safe Sleeping 35,435 35,435 - - - - Infant Safe Sleeping Public Education Campaign13 413,595 413,595 - - - -
Infant Safe Surrender13 271,686 271,686 - - - - Little by Little/One Step Ahead 28,768,403 2,887,728 4,204,347 4,991,315 5,091,141 5,192,964 Parent-Child Interaction Therapy 19,146,431 4,464,855 3,941,439 4,038,872 4,304,203 - Peer Support Groups for Parents14 2,453,797 798,257 1,137,884 563,859 - -
Permanent Supportive Housing15 10,150,000 10,000,000 - - - - Reducing Childhood Obesity 39,988,747 10,776,128 13,935,178 15,192,793 - - Substance Abuse Treatment Services 8,856,006 5,314,768 3,541,238 - - - Tot Parks and Trails 6,196,823 5,599,866 - - - - Uninterrupted Care for Prenatal to Postpartum 2,800,000 - - - - - Universal Assessment of Newborns 53,812,033 6,253,127 9,754,963 13,256,800 13,256,800 11,290,343 Total Countywide Initiatives 294,034,660$ 74,469,132$ 68,011,050$ 67,851,420$ 38,367,012$ 29,191,893$ IPRIOR STRATEGIC PLAN INVESTMENTSBest Start LA16 28,271,789$ 3,003,550$ 769,980$ 989,818$ 221,614$ 113,000$ Community Opportunities Fund 1,514,520 603,878 218,000 - - - Family Friends and Neighbors 1,056,981 1,000,000 - - - - Los Angeles Universal Preschool17 144,793,882 63,920,000 62,380,000 62,380,000 - - Oral Health Community Development 2,200,546 55,587 18,561 - - - Oral Health and Nutrition18 14,747,842 1,956,817 4,036,891 1,351,790 - - Research & Evaluation - Early Learning (LAUP) 4,738,704 1,419,348 1,460,000 1,460,000 399,356 - Total Prior Strategic Plan Investments 197,324,264$ 71,959,180$ 68,883,432$ 66,181,608$ 620,970$ 113,000$ J
Total Allocations/Estimated Program Demands 513,823,988$ 151,120,531$ 143,463,348$ 134,033,028$ 38,987,982$ 29,304,893$ K=H+I+JQ
Estimated Allocations Remaining as of June 30 362,703,457$ 219,240,109$ 85,207,081$ 46,219,099$ 16,914,206$ Q
Research & Evaluation - 5%19 7,509,101$ 6,910,265$ 6,482,085$ 4,682,412$ 4,244,345$ Total Research & Evaluation 7,509,101$ 6,910,265$ 6,482,085$ 4,682,412$ 4,244,345$ L
Total Estimated Program Demands 224,510,320$ 212,630,562$ 202,728,781$ 101,285,012$ 91,276,250$ M=G+K+L
Estimated Operating Expenditures20 17,802,358$ 18,158,405$ 18,521,573$ 18,521,573$ 18,521,573$ N
Total Estimated Spending in Excess of Revenues 144,942,134$ 136,931,792$ 131,084,271$ 33,918,669$ 26,726,088$ O=[M+N]-B
Projected Ending Fund Balance 578,802,835$ 441,871,043$ 310,786,772$ 276,868,103$ 250,142,015$ P=[A+B]-[M+N]
Estimated Program Demands (by Fiscal Year)
K
First 5 LALong Term Financial Projection - Multi-Year Forecast Detail
33
Attachment 2
January 13, 2014
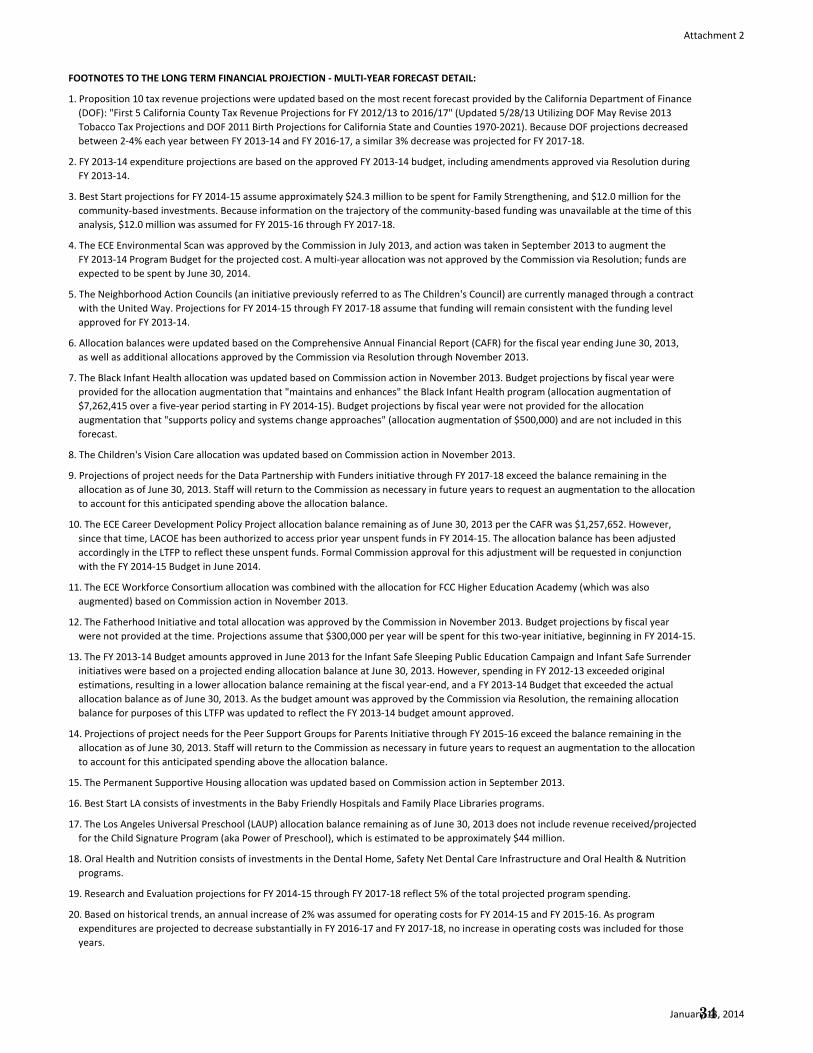
FOOTNOTES TO THE LONG TERM FINANCIAL PROJECTION - MULTI-YEAR FORECAST DETAIL:
1. Proposition 10 tax revenue projections were updated based on the most recent forecast provided by the California Department of Finance(DOF): "First 5 California County Tax Revenue Projections for FY 2012/13 to 2016/17" (Updated 5/28/13 Utilizing DOF May Revise 2013Tobacco Tax Projections and DOF 2011 Birth Projections for California State and Counties 1970-2021). Because DOF projections decreasedbetween 2-4% each year between FY 2013-14 and FY 2016-17, a similar 3% decrease was projected for FY 2017-18.
2. FY 2013-14 expenditure projections are based on the approved FY 2013-14 budget, including amendments approved via Resolution duringFY 2013-14.
3. Best Start projections for FY 2014-15 assume approximately $24.3 million to be spent for Family Strengthening, and $12.0 million for thecommunity-based investments. Because information on the trajectory of the community-based funding was unavailable at the time of thisanalysis, $12.0 million was assumed for FY 2015-16 through FY 2017-18.
4. The ECE Environmental Scan was approved by the Commission in July 2013, and action was taken in September 2013 to augment theFY 2013-14 Program Budget for the projected cost. A multi-year allocation was not approved by the Commission via Resolution; funds areexpected to be spent by June 30, 2014.
5. The Neighborhood Action Councils (an initiative previously referred to as The Children's Council) are currently managed through a contractwith the United Way. Projections for FY 2014-15 through FY 2017-18 assume that funding will remain consistent with the funding levelapproved for FY 2013-14.
6. Allocation balances were updated based on the Comprehensive Annual Financial Report (CAFR) for the fiscal year ending June 30, 2013,as well as additional allocations approved by the Commission via Resolution through November 2013.
7. The Black Infant Health allocation was updated based on Commission action in November 2013. Budget projections by fiscal year wereprovided for the allocation augmentation that "maintains and enhances" the Black Infant Health program (allocation augmentation of$7,262,415 over a five-year period starting in FY 2014-15). Budget projections by fiscal year were not provided for the allocationaugmentation that "supports policy and systems change approaches" (allocation augmentation of $500,000) and are not included in thisforecast.
8. The Children's Vision Care allocation was updated based on Commission action in November 2013.
9. Projections of project needs for the Data Partnership with Funders initiative through FY 2017-18 exceed the balance remaining in theallocation as of June 30, 2013. Staff will return to the Commission as necessary in future years to request an augmentation to the allocationto account for this anticipated spending above the allocation balance.
10. The ECE Career Development Policy Project allocation balance remaining as of June 30, 2013 per the CAFR was $1,257,652. However,since that time, LACOE has been authorized to access prior year unspent funds in FY 2014-15. The allocation balance has been adjustedaccordingly in the LTFP to reflect these unspent funds. Formal Commission approval for this adjustment will be requested in conjunctionwith the FY 2014-15 Budget in June 2014.
11. The ECE Workforce Consortium allocation was combined with the allocation for FCC Higher Education Academy (which was alsoaugmented) based on Commission action in November 2013.
12. The Fatherhood Initiative and total allocation was approved by the Commission in November 2013. Budget projections by fiscal yearwere not provided at the time. Projections assume that $300,000 per year will be spent for this two-year initiative, beginning in FY 2014-15.
13. The FY 2013-14 Budget amounts approved in June 2013 for the Infant Safe Sleeping Public Education Campaign and Infant Safe Surrenderinitiatives were based on a projected ending allocation balance at June 30, 2013. However, spending in FY 2012-13 exceeded originalestimations, resulting in a lower allocation balance remaining at the fiscal year-end, and a FY 2013-14 Budget that exceeded the actualallocation balance as of June 30, 2013. As the budget amount was approved by the Commission via Resolution, the remaining allocationbalance for purposes of this LTFP was updated to reflect the FY 2013-14 budget amount approved.
14. Projections of project needs for the Peer Support Groups for Parents Initiative through FY 2015-16 exceed the balance remaining in theallocation as of June 30, 2013. Staff will return to the Commission as necessary in future years to request an augmentation to the allocationto account for this anticipated spending above the allocation balance.
15. The Permanent Supportive Housing allocation was updated based on Commission action in September 2013.
16. Best Start LA consists of investments in the Baby Friendly Hospitals and Family Place Libraries programs.
17. The Los Angeles Universal Preschool (LAUP) allocation balance remaining as of June 30, 2013 does not include revenue received/projectedfor the Child Signature Program (aka Power of Preschool), which is estimated to be approximately $44 million.
18. Oral Health and Nutrition consists of investments in the Dental Home, Safety Net Dental Care Infrastructure and Oral Health & Nutritionprograms.
19. Research and Evaluation projections for FY 2014-15 through FY 2017-18 reflect 5% of the total projected program spending.
20. Based on historical trends, an annual increase of 2% was assumed for operating costs for FY 2014-15 and FY 2015-16. As programexpenditures are projected to decrease substantially in FY 2016-17 and FY 2017-18, no increase in operating costs was included for thoseyears.
34
FIRST 5 LA LONG TERM FINANCIAL PROJECTION
FY 2014-2018 January 13, 2014 35
Agenda
January 13, 2014
2
• Long Term Financial Projection (LTFP) Overview and Purpose
• Assumptions
• Highlights
• Summary
36
LTFP: Overview
January 13, 2014
3
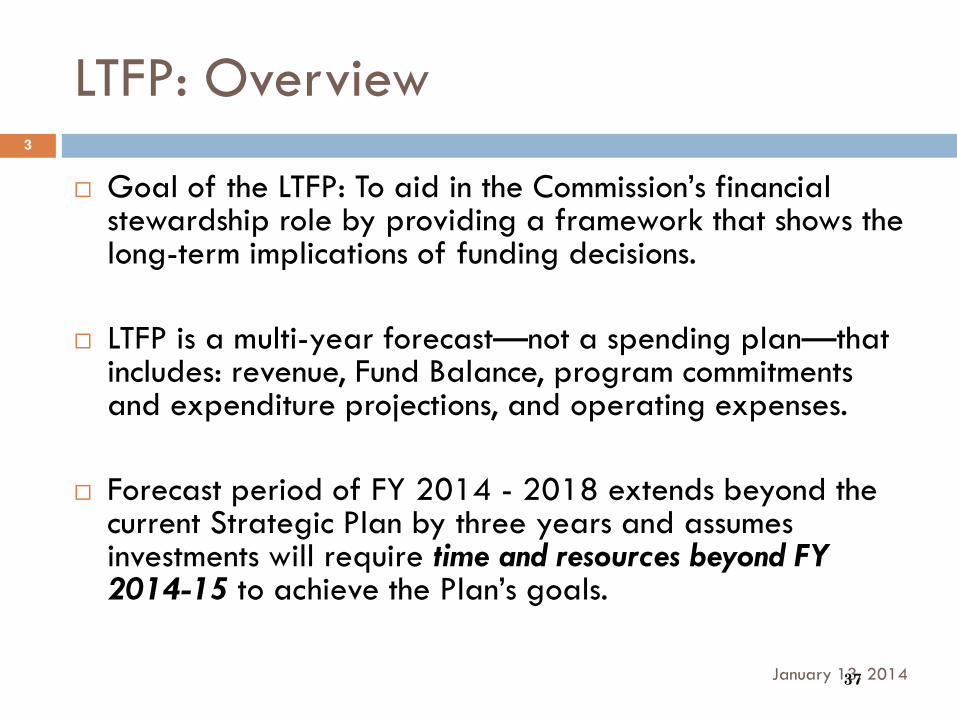
Goal of the LTFP: To aid in the Commission’s financial stewardship role by providing a framework that shows the long-term implications of funding decisions.
LTFP is a multi-year forecast—not a spending plan—that includes: revenue, Fund Balance, program commitments and expenditure projections, and operating expenses.
Forecast period of FY 2014 - 2018 extends beyond the current Strategic Plan by three years and assumes investments will require time and resources beyond FY 2014-15 to achieve the Plan’s goals.
37
Assumptions
January 13, 2014
4
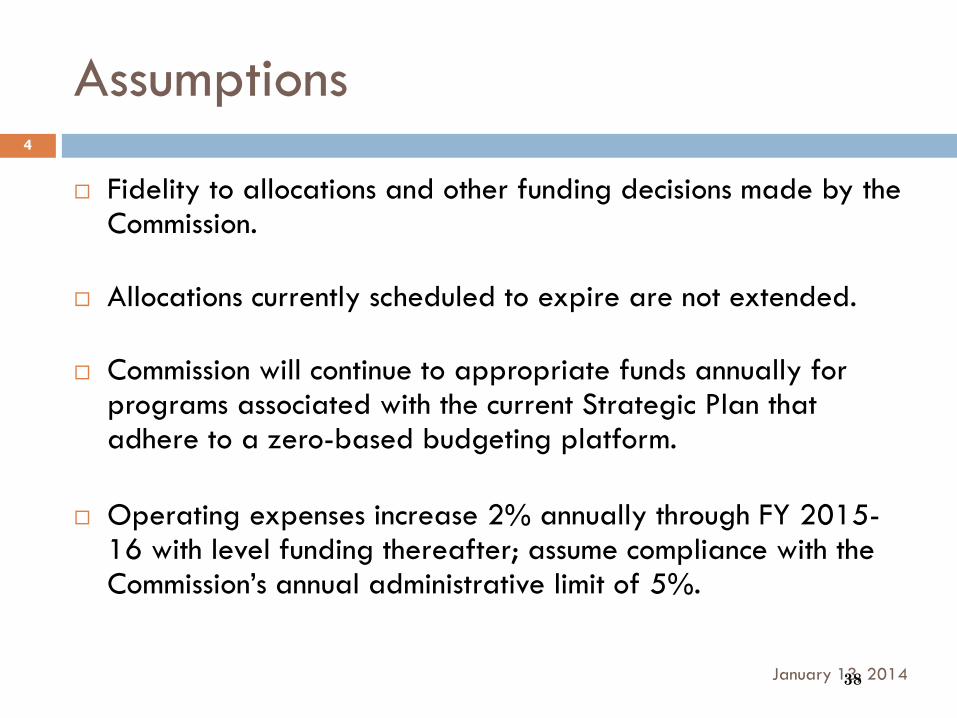
Fidelity to allocations and other funding decisions made by the Commission.
Allocations currently scheduled to expire are not extended.
Commission will continue to appropriate funds annually for programs associated with the current Strategic Plan that adhere to a zero-based budgeting platform.
Operating expenses increase 2% annually through FY 2015-16 with level funding thereafter; assume compliance with the Commission’s annual administrative limit of 5%.
38
Highlights: Revenue & Expenditures
January 13, 2014
5
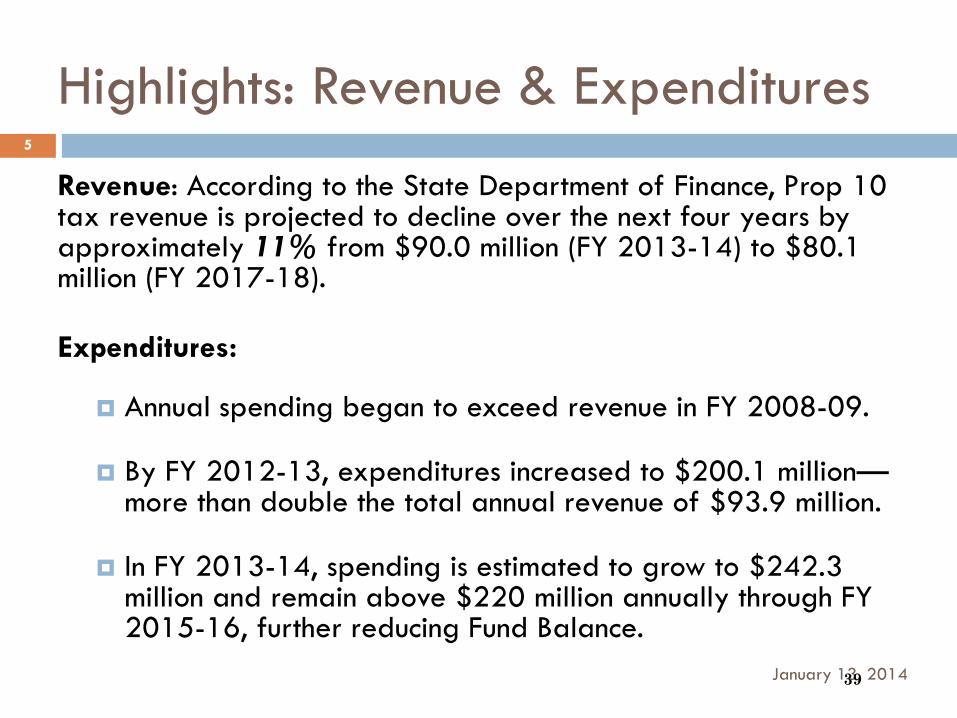
Revenue: According to the State Department of Finance, Prop 10 tax revenue is projected to decline over the next four years by approximately 11% from $90.0 million (FY 2013-14) to $80.1 million (FY 2017-18).
Expenditures:
Annual spending began to exceed revenue in FY 2008-09.
By FY 2012-13, expenditures increased to $200.1 million—more than double the total annual revenue of $93.9 million.
In FY 2013-14, spending is estimated to grow to $242.3 million and remain above $220 million annually through FY 2015-16, further reducing Fund Balance.
39
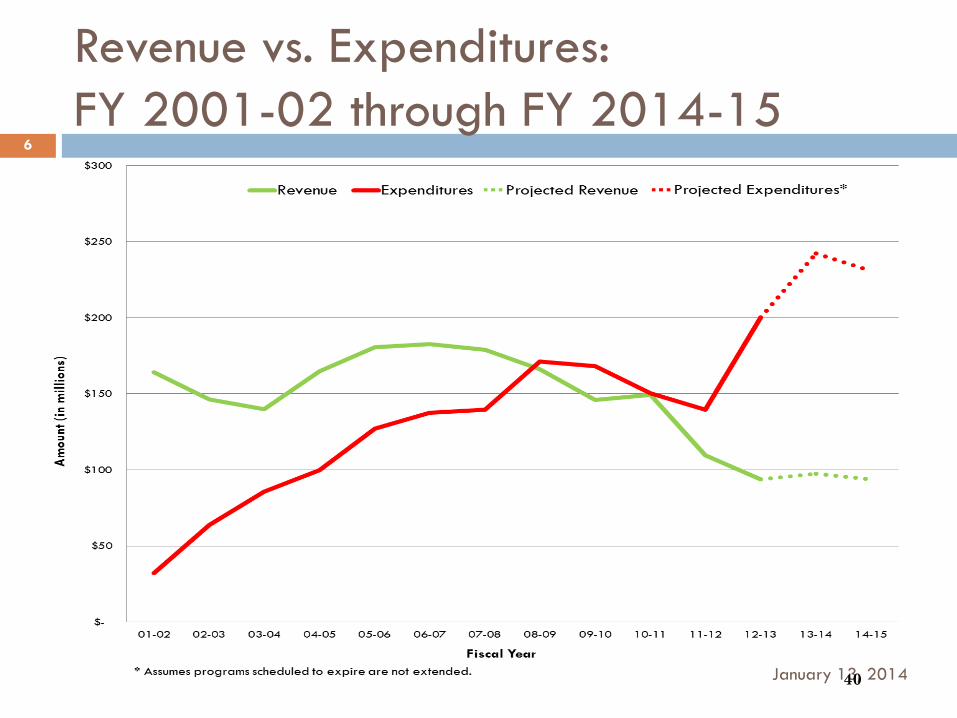
Revenue vs. Expenditures: FY 2001-02 through FY 2014-15
January 13, 2014
6
40
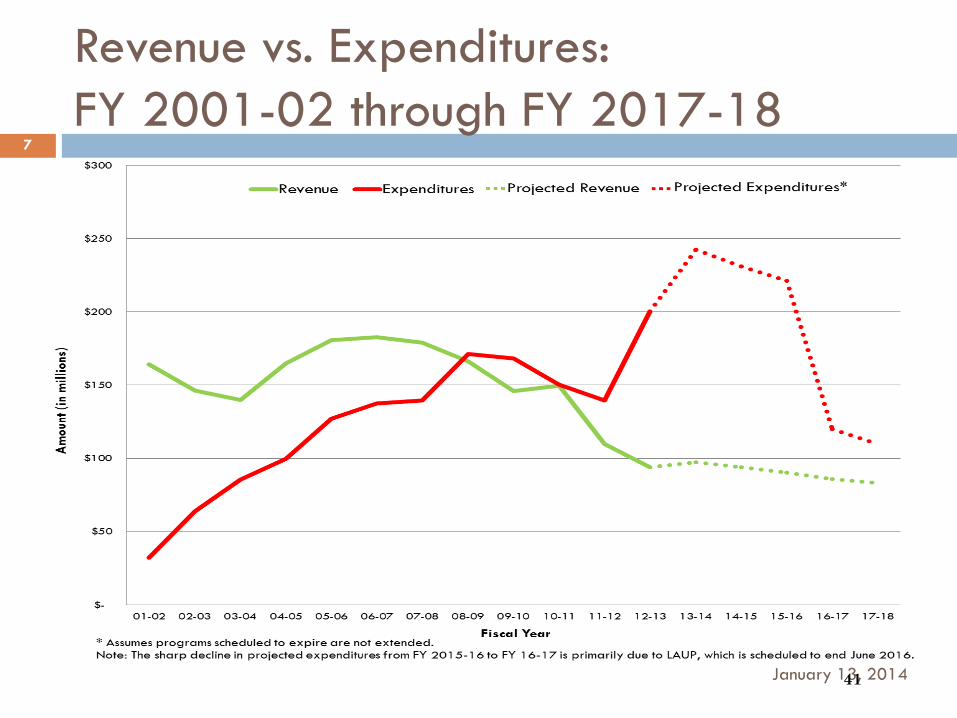
Revenue vs. Expenditures: FY 2001-02 through FY 2017-18
January 13, 2014
7
41
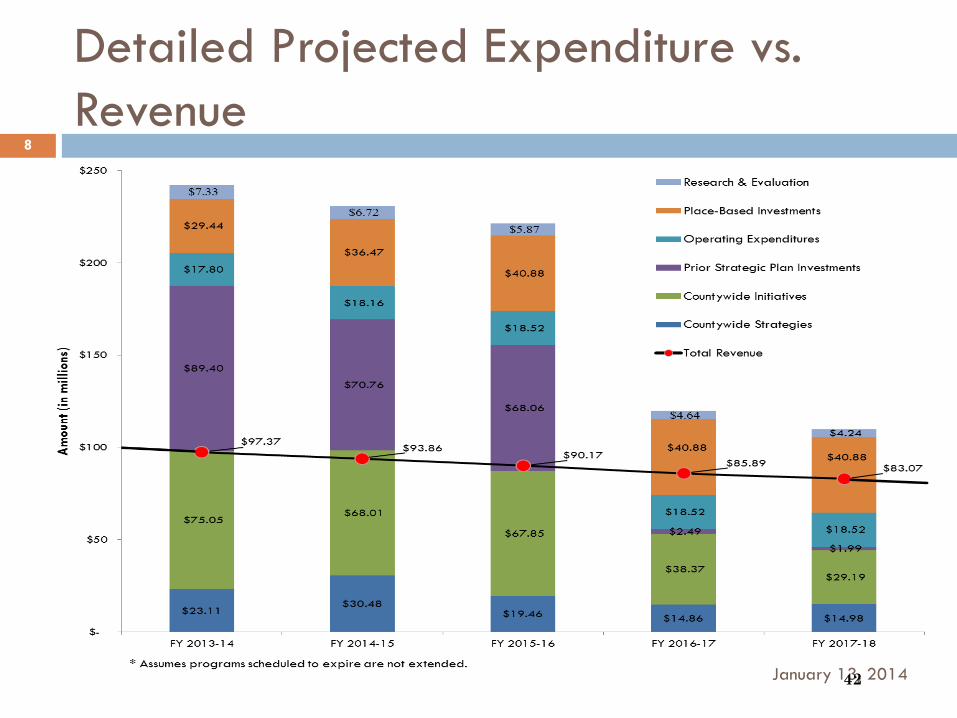
Detailed Projected Expenditure vs. Revenue
January 13, 2014
8
42
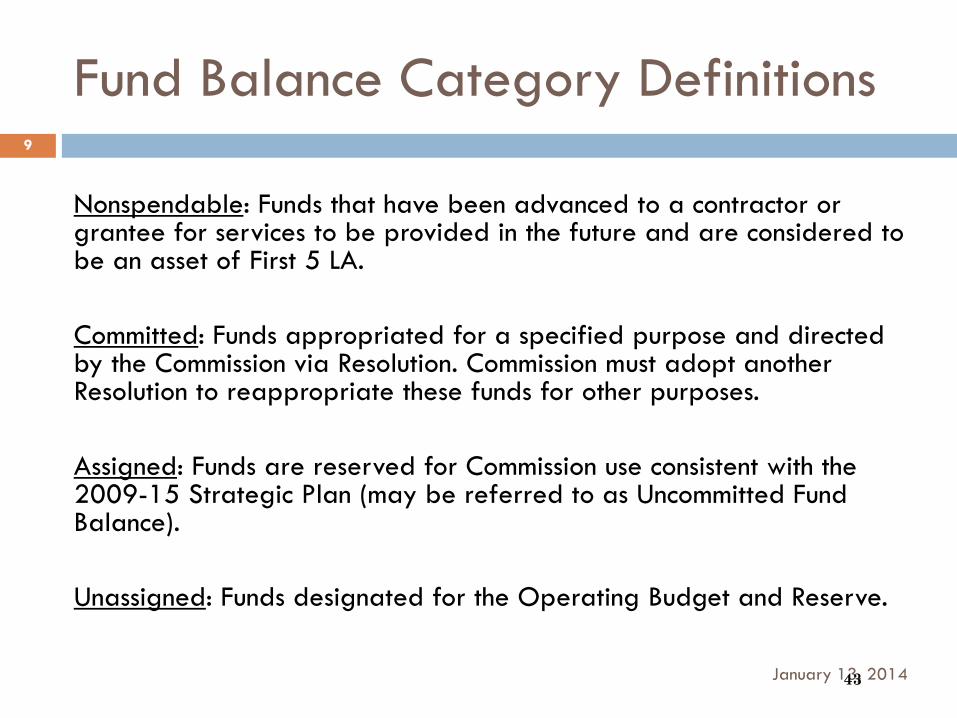
Fund Balance Category Definitions
January 13, 2014
9
Nonspendable: Funds that have been advanced to a contractor or grantee for services to be provided in the future and are considered to be an asset of First 5 LA.
Committed: Funds appropriated for a specified purpose and directed by the Commission via Resolution. Commission must adopt another Resolution to reappropriate these funds for other purposes.
Assigned: Funds are reserved for Commission use consistent with the 2009-15 Strategic Plan (may be referred to as Uncommitted Fund Balance).
Unassigned: Funds designated for the Operating Budget and Reserve.
43
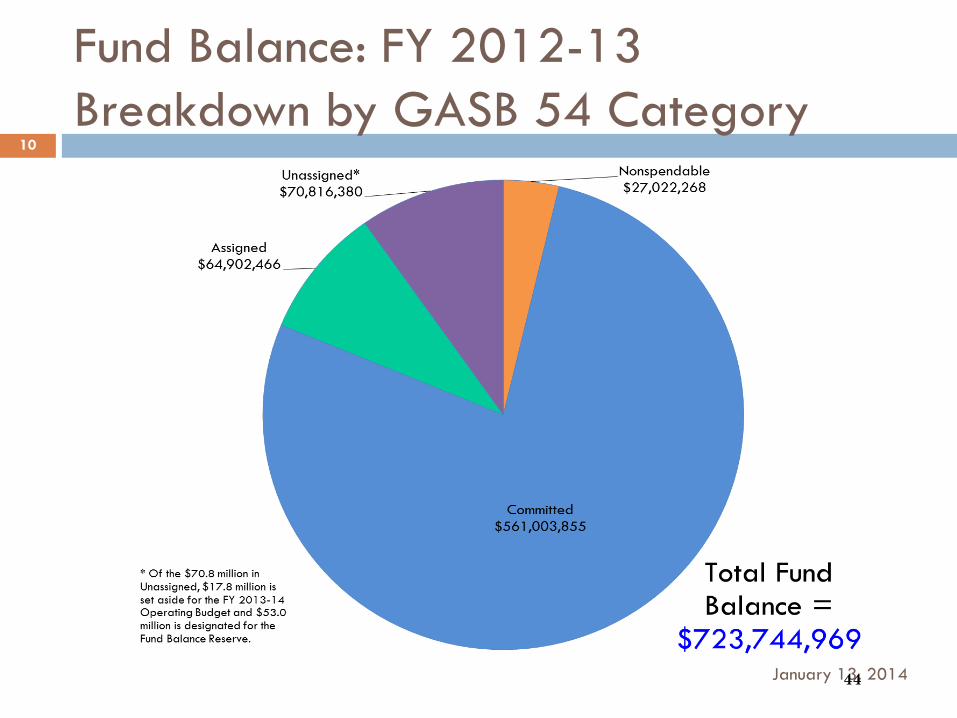
Fund Balance: FY 2012-13 Breakdown by GASB 54 Category
January 13, 2014
10
44
Fund Balance
January 13, 2014
11
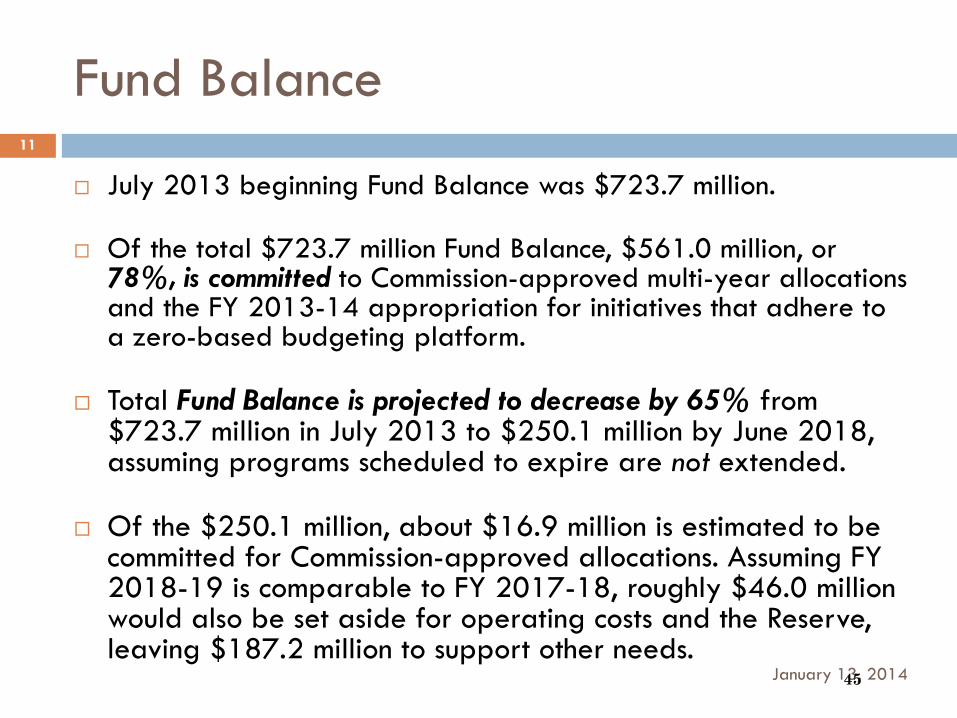
July 2013 beginning Fund Balance was $723.7 million.
Of the total $723.7 million Fund Balance, $561.0 million, or 78%, is committed to Commission-approved multi-year allocations and the FY 2013-14 appropriation for initiatives that adhere to a zero-based budgeting platform.
Total Fund Balance is projected to decrease by 65% from $723.7 million in July 2013 to $250.1 million by June 2018, assuming programs scheduled to expire are not extended.
Of the $250.1 million, about $16.9 million is estimated to be committed for Commission-approved allocations. Assuming FY 2018-19 is comparable to FY 2017-18, roughly $46.0 million would also be set aside for operating costs and the Reserve, leaving $187.2 million to support other needs.
45
Fund Balance: Future Outlook Assuming Programs are not Extended
January 13, 2014
12
46
Fund Balance: Future Outlook Assuming Programs are Extended
January 13, 2014
13
47
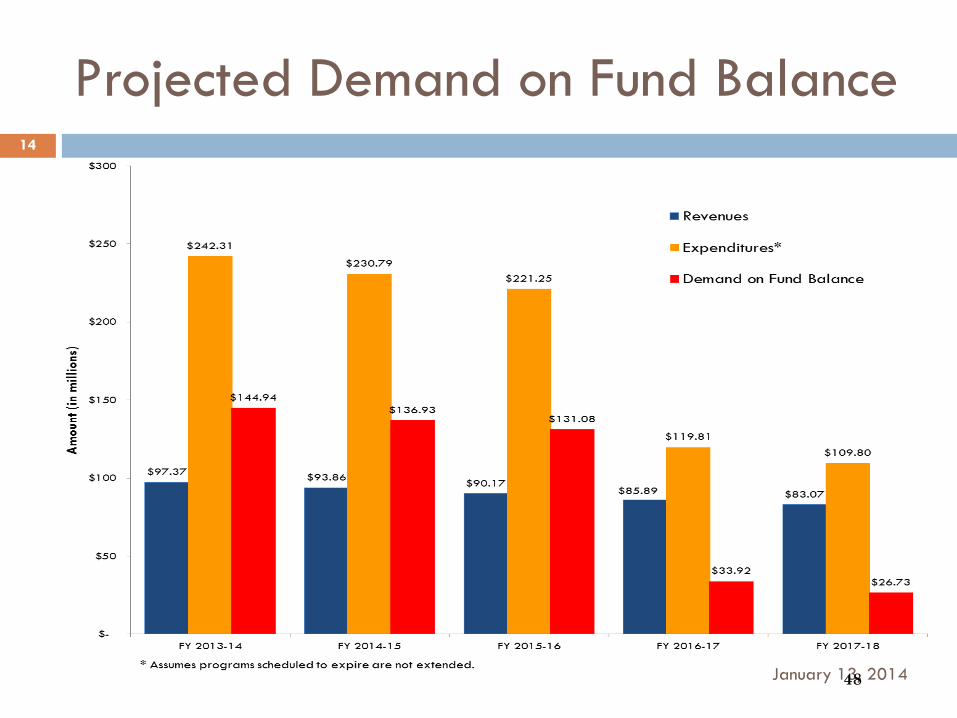
Projected Demand on Fund Balance
January 13, 2014
14
48
Summary
January 13, 2014
15
Short Term: Resources are adequate to cover existing obligations through the course of the current Strategic Plan (June 2015).
Long Term: LTFP shows a stark picture of spending continuing to exceed revenue, putting pressure on the diminishing Fund Balance.
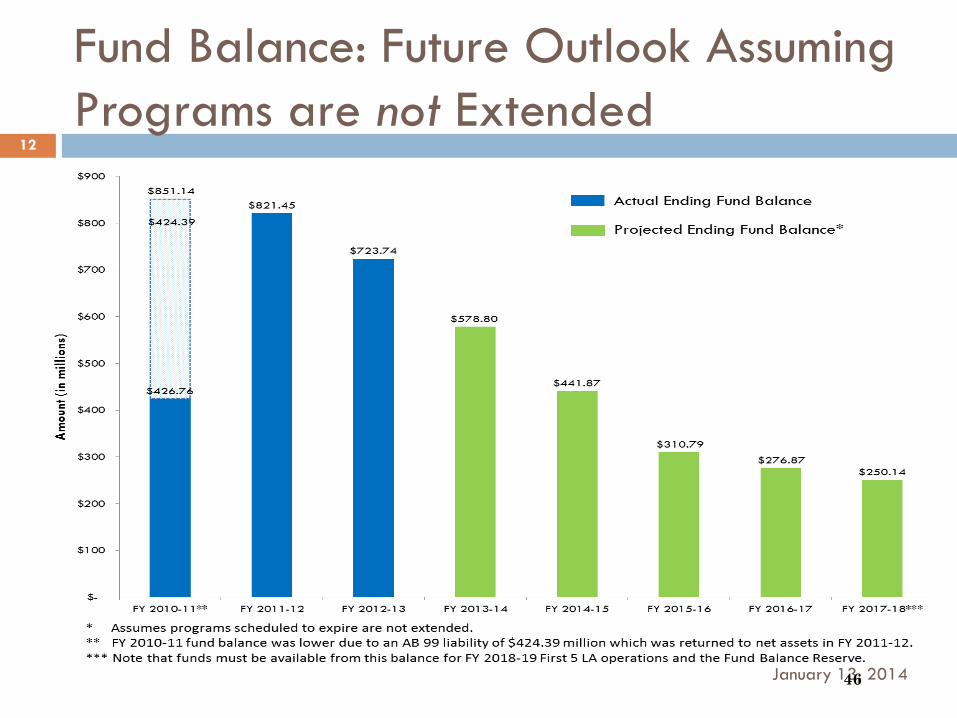
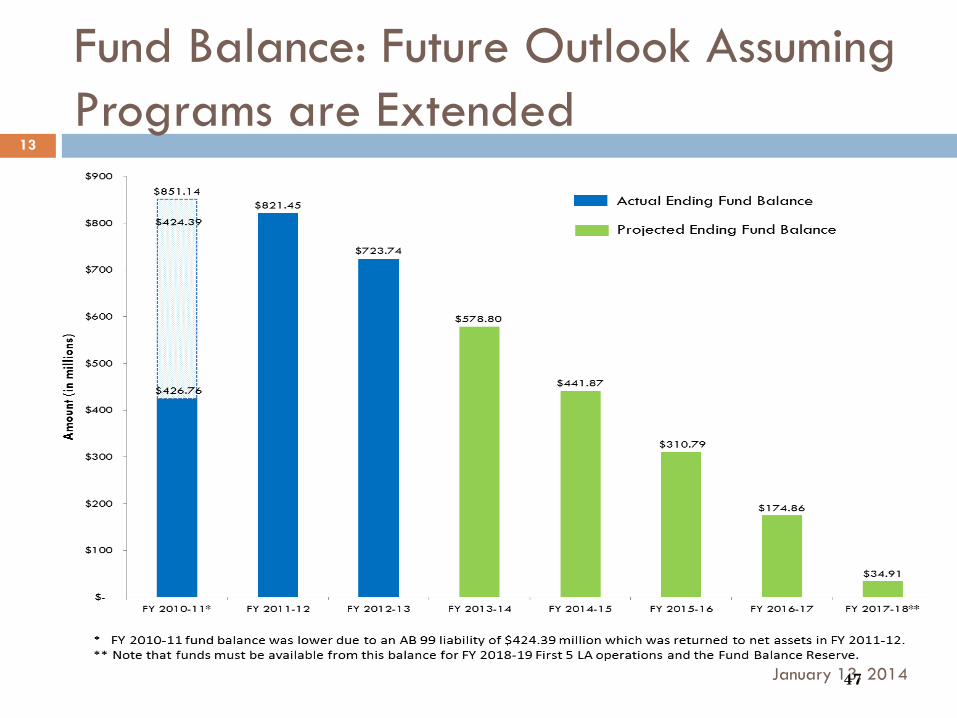
LTFP assumes that programs scheduled to expire are not extended. However, if programs are extended, Fund Balance is projected to be depleted in FY 2018-19.
49
Conclusion
January 13, 2014
16
Maintaining the current rate of spending is unsustainable in the long run. The Commission will face important and difficult choices to align annual spending with annual revenue.
Now is the time to begin making critical decisions—sufficient Fund Balance in the near-term exists to transition to a more sustainable spending portfolio.
The LTFP can help inform Commission decisions with a fiscal impact, ensuring that both existing and new funding commitments are sustainable and aligned with the Strategic Plan and the Building Stronger Families Framework.
50