Embed Size (px)
Citation preview

New concepts and ideas New concepts and ideas in air pollution strategiesin air pollution strategies
Richard BallamanRichard BallamanChairman of the Working Group Chairman of the Working Group
on Strategies and Reviewon Strategies and Review

Future challengesFuture challenges
Accession to protocols by as many Parties as Accession to protocols by as many Parties as possiblepossibleEffective implementation of Protocols by EECCA Effective implementation of Protocols by EECCA countriescountries
Further reduction of emissions: NHFurther reduction of emissions: NH33, NO, NOxx, VOC, , VOC, SOSO22, HMs and POPs , HMs and POPs
Derive new and lower NECsDerive new and lower NECsGood cooperation on transatlantic or Good cooperation on transatlantic or hemispheric issues: Hg, Ohemispheric issues: Hg, O33, PM and POPs, PM and POPs

What remains to be done ?What remains to be done ?
Reduce acidification, especially from NHReduce acidification, especially from NH33
DecreaseDecrease eutrophication (N deposition) eutrophication (N deposition)
Limit violations of AOT40 CL to avoid vegetation Limit violations of AOT40 CL to avoid vegetation damagedamage
Decrease ODecrease O33 as significant cause of premature as significant cause of premature
deathdeath
Decrease population exposure to PMDecrease population exposure to PM

Health & environmental impactHealth & environmental impact(RAINS_BL_CLE, August 2004, C. Agren)(RAINS_BL_CLE, August 2004, C. Agren)
Estimated loss in SLE in EU25 from anthropogenic PM2.5 (months)
0
1
2
3
4
5
6
7
8
9
10
2000 2010 2020
Percentage forest area in EU25 with acid deposition exceeding critical loads
0
5
10
15
20
25
2000 2010 2020
Percentage ecosystem area in EU25 with nitrogen deposition exceeding critical loads
0
10
20
30
40
50
60
70
2000 2010 2020

Acid deposition to forestsAcid deposition to forests (IIASA)(IIASA)
Percentage of forest area with acid deposition above critical loads, using ecosystem-specific deposition.Average of calculations for 1997, 1999, 2000 & 2003 meteorologies
2000 2010 2020
Excess of critical loads for eutrophicationExcess of critical loads for eutrophication (IIASA)(IIASA)
Percentage of ecosystems area with nitrogen deposition above critical loads, using grid-average deposition. Average of calculations for 1997, 1999, 2000 & 2003 meteorologies
2000 2010 2020
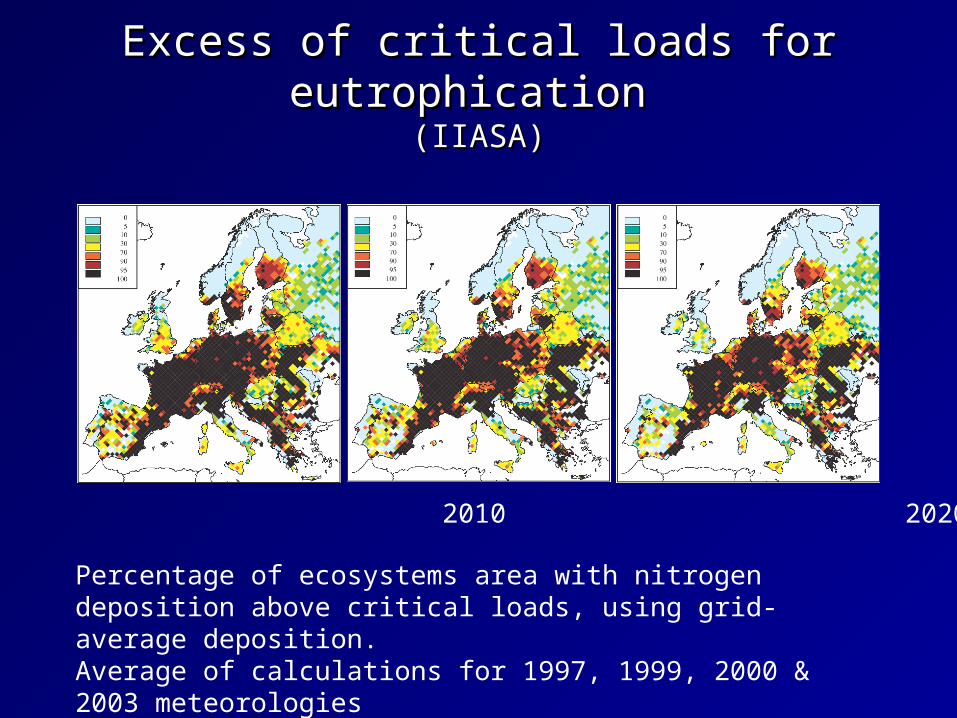
Vegetation-relevant ozone concentrationsVegetation-relevant ozone concentrationsAOT40 [ppm.hours]AOT40 [ppm.hours] (IIASA)(IIASA)
2000 2010 2020
Critical level for forests = 5 ppm.hours Average of calculations for 1997, 1999, 2000 & 2003 meteorologies

Premature deaths attributable to ozonePremature deaths attributable to ozone[cases/year][cases/year] (IIASA)(IIASA)
0
1000
2000
3000
4000
5000
Au
stri
a
Be
lgiu
m
De
nm
ark
Fin
lan
d
Fra
nce
Ge
rma
ny
Gre
ece
Ire
lan
d
Ita
ly
Lu
xem
bo
urg
Ne
the
rla
nd
s
Po
rtu
ga
l
Sp
ain
Sw
ed
en
UK
Cze
ch R
ep
.
Est
on
ia
Hu
ng
ary
La
tvia
Lith
ua
nia
Po
lan
d
Slo
vaki
a
Slo
ven
ia
2000 2010 2020
Provisional calculations with 50X50 km resolution

Loss in life expectancy attributable to Loss in life expectancy attributable to
anthropogenic PM2.5 [months]anthropogenic PM2.5 [months] (IIASA)(IIASA)
Average of calculations for 1997, 1999, 2000 & 2003 meteorologies
2000 2010 2020

Loss in life expectancy Loss in life expectancy attributable to anthropogenic PM2.5 attributable to anthropogenic PM2.5
[months][months]
0
3
6
9
12
15
Au
stri
a
Be
lgiu
m
De
nma
rk
Fin
lan
d
Fra
nce
Ge
rma
ny
Gre
ece
Ire
land
Italy
Lu
xem
bou
rg
Ne
ther
lan
ds
Po
rtu
ga
l
Sp
ain
Sw
ede
n
UK
To
tal E
U-1
5
Cze
ch R
ep
.
Est
on
ia
Hu
nga
ry
La
tvia
Lith
ua
nia
Ma
lta
Po
lan
d
Slo
vaki
a
Slo
ven
ia
To
tal N
MS
To
tal E
U-2
5
2000 2010 2020 Source: RAINS / IIASA

What can be done ?What can be done ?
Use PM health effects as driving force to further Use PM health effects as driving force to further reduce emissions of primary and secondary reduce emissions of primary and secondary pollutantspollutants
Identify the potential for new technical measuresIdentify the potential for new technical measures(define BAT to derive ELV)(define BAT to derive ELV)
Make use of synergies to abate air pollution and Make use of synergies to abate air pollution and avoid climate changeavoid climate change
Consider structural changes and alternative Consider structural changes and alternative energy policiesenergy policies
Acidification
Eutrophication
Tropospheric ozone
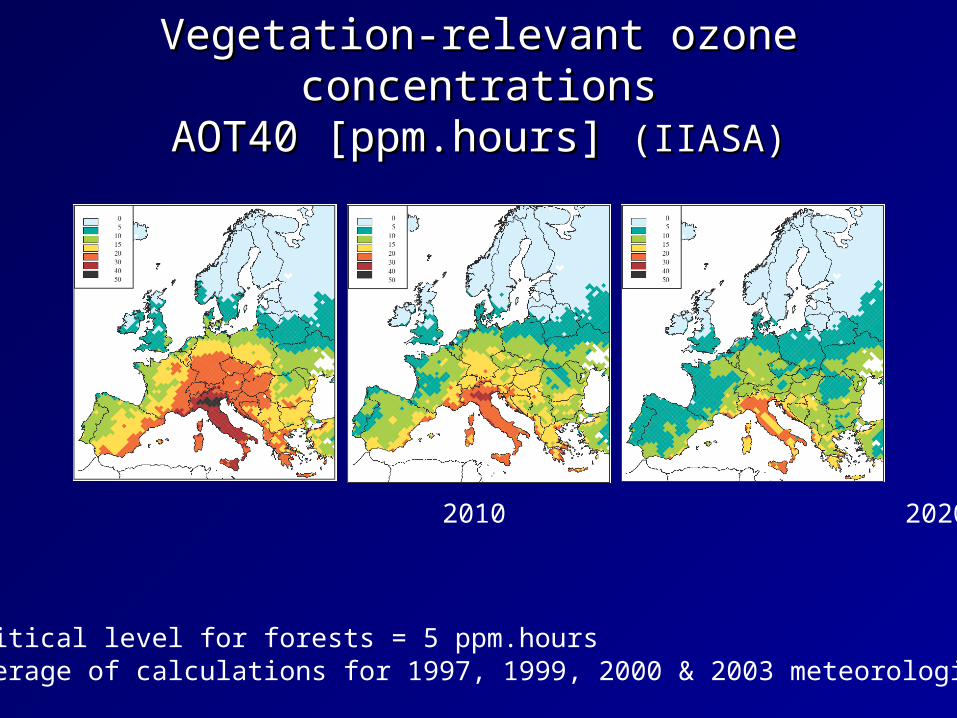
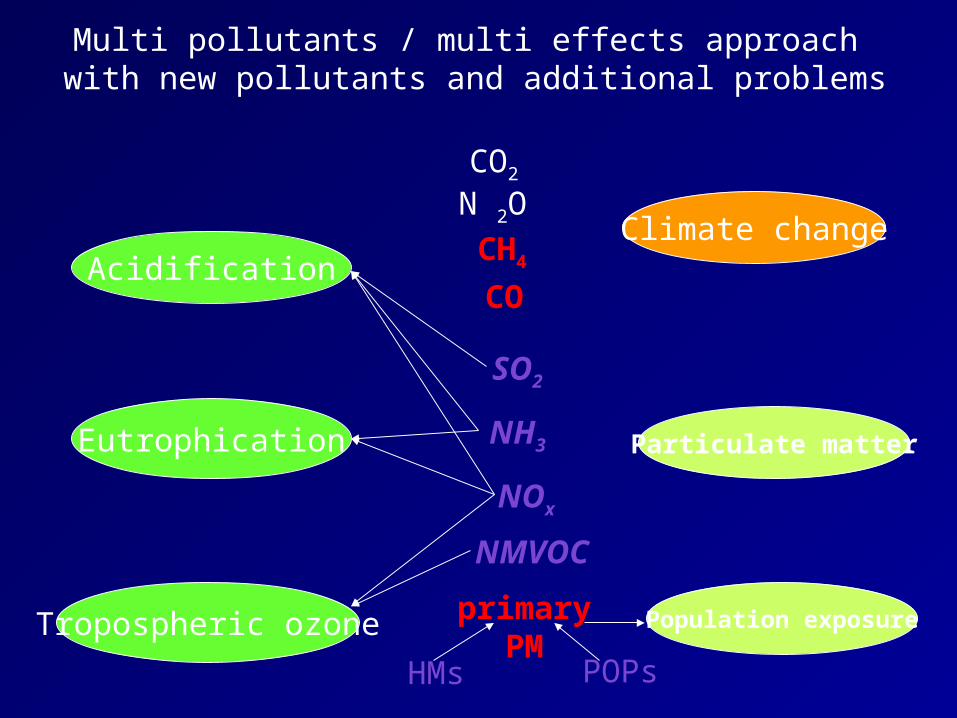
Multi pollutants / multi effects approach with new pollutants and additional problems
SO2
NH3
NOx
NMVOC
Climate change
Particulate matter
Population exposure
CO
CH4
CO2
N 2O
primaryPM
HMs POPs

Acidification
Eutrophication
Tropospheric ozone
Multi pollutants / multi effects approach: extended version with new avenues for action
SO2
NH3
NOx
NMVOC
Climate change
Particulate matter
Population exposure
CO
CH4
CO2
N 2O
primaryPMHMs POPs

Emissions 1990 – 2020 Emissions 1990 – 2020 (RAINS BL_ CLE, Aug. 04)(RAINS BL_ CLE, Aug. 04)
0
10000
20000
30000
40000
50000
1990 1995 2000 2005 2010 2015 2020
SO2 emissions
Sea regionsRem. Eur.EU10 newEU15 old
0
1500
3000
4500
6000
7500
1990 1995 2000 2005 2010 2015 2020
NOx emissions (in kTonnes N)
0
1500
3000
4500
6000
7500
1990 1995 2000 2005 2010 2015 2020
NH3 emissions (in kTonnes N)
0
4000
8000
12000
16000
20000
1990 1995 2000 2005 2010 2015 2020
VOC emissions

Source categories to further considerSource categories to further consider
Ships, diesel vehicles, off-road sectorShips, diesel vehicles, off-road sector
Industrial processes, solventsIndustrial processes, solvents
Small combustion (wood burning) Small combustion (wood burning)
Agriculture (animal housing, manure storage and Agriculture (animal housing, manure storage and spreading)spreading)
Retrofitting of existing sourcesRetrofitting of existing sources
Increased use of alternative fuels (fuel switching)Increased use of alternative fuels (fuel switching)

Relevance of sources will changeRelevance of sources will change
Cattle number Cattle number
EF per veh. EF per veh.
Diesel engines Diesel engines
Aviation Aviation Shipping Shipping
Milk productivity per animal Milk productivity per animal NHNH33 emissions emissions
Road traffic (driven mileage) Road traffic (driven mileage) Total emissions Total emissions
PM PM NOx NOx
Total emissions Total emissions

WHO European Centre for Environment and Health
Source: Pope et al, JAMA 2002
Long term exposure to PM and risk of mortalityin ACS cohort
TFH 2003: “..apply the relative risk for all cause mortality… in the extended American Cancer Society (ACS) cohort study Pope et al. (2002).”

Possible challenges beyond 2010 Possible challenges beyond 2010
Increase life expectancy of European population Increase life expectancy of European population by at least 6 months by at least 6 months
Reduce by 50% remaining excess of Reduce by 50% remaining excess of acidification and eutrophicationacidification and eutrophication
Contribute to the avoidance of climate change Contribute to the avoidance of climate change by reducing Oby reducing O33 and PM concentrations, and PM concentrations, as well as abatement of CHas well as abatement of CH44 and CO emissions and CO emissions on a regional scaleon a regional scale