Embed Size (px)
DESCRIPTION
Millipore offers the largest array of ELISAs and Luminex xMAP-based MILLIPLEX Neuroscience panels for the research of neurological function and dysfunction. The enormously complex nervous system relies upon extracellular signaling molecules such as neurotrophins, transmitters and neurohormones for the regulation, survival and differentiation of neurons and glia. Neurodegenerative diseases such as Alzheimer's and Parkinson's disease, Multiple Sclerosis and Amyotrophic Lateral Sclerosis (ALS) result from cumulative deterioration of neurons or their myelin sheath over time. Research into these and other neurological diseases suggests multiple interacting biochemical pathways underlie their unique pathologies, increasing the need for more sensitive and quantitative biomarker studies.
Citation preview
Data SheetProduct Selection Guide
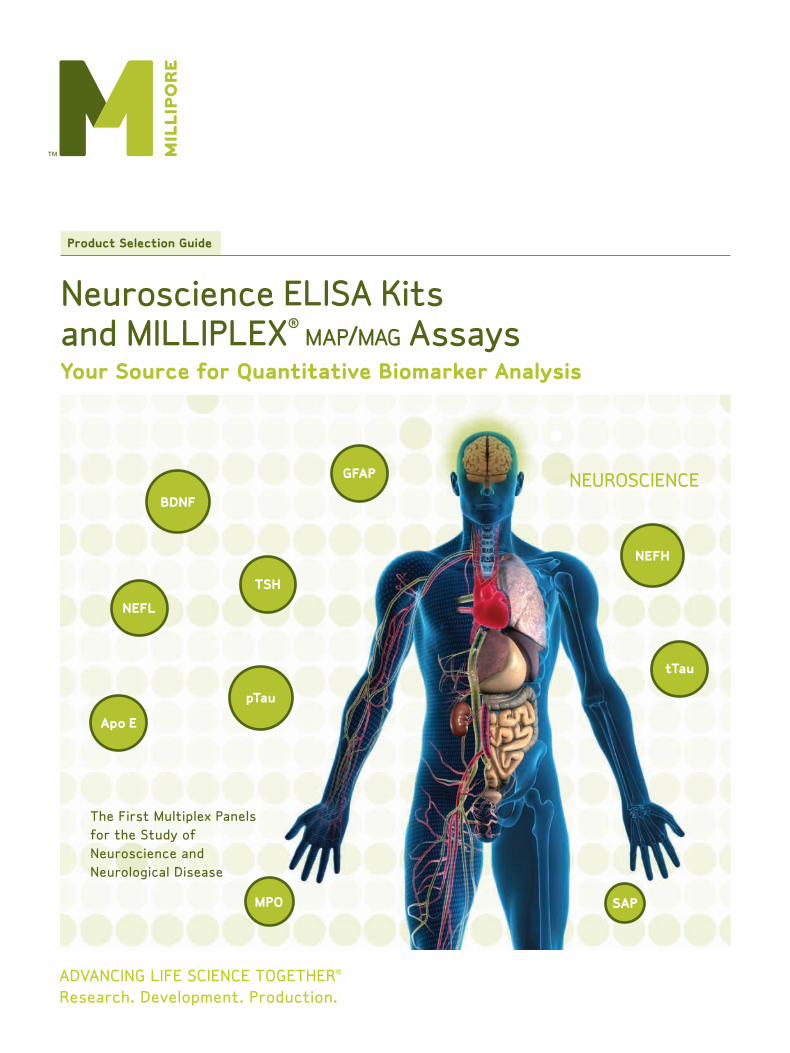
Neuroscience ELISA Kits and MILLIPLEX® map/mag AssaysYour Source for Quantitative Biomarker Analysis
NEUROSCIENCE
MPO
TSH
BDNF
SAP
The First Multiplex Panels for the Study of Neuroscience and Neurological Disease
Apo E
GFAP
NEFH
NEFL
tTau
pTau
2
NEW Neuroscience ELISAs and Multiplex Panels
Description Catalogue No.
HS Human Amyloid β40 ELISA EZHS40
HS Human Amyloid β42 ELISA EZHS42
HS Human Amyloid β40 & β42, ELISA Set EZHS-SET
HS Human Amyloid β40 (Brain), ELISA EZBRAIN40
Description Catalogue No.
MILLIPLEX map Human Neurodegenerative Disease Panel 4 Available Nov. 2010! HNDG4-36K
MILLIPLEX mag Human Neurological Disorders Panel 1 Available Nov. 2010! HND1MAG-39K
MILLIPLEX mag Human Neurological Disorders Panel 2 Available Nov. 2010! HND2MAG-39K
MILLIPLEX map Human Brain-Derived Protein Panel HBDP-33K
Description Catalogue No.
Human Amyloid β42 (Brain), ELISA EZBRAIN42
Human Amyloid β40 & β42 (Brain), ELISA Set EZBRAIN-SET
Available Oct. 2010! GFAP ELISA NS830
Available Oct. 2010! APP ELISA NS690
Description Qty Limit of Detection Catalogue No.
Luminata Crescendo ELISA HRP Substrate 100 mL 0.4 pg ELLUR0100
200 mL 0.4 pg ELLUR0200
Luminata Forte ELISA HRP Substrate 100 mL 0.1 pg ELLUF0100
New Neuroscience AssaysMillipore is committed to excellence in neuroscience research. Our neuroscience assays are provided to fit both your
enzyme-linked immunosorbent assay (ELISA) and Luminex®-based multiplex needs. Our new products are listed below and/or
are highlighted within this guide. For more information, please refer to the page numbers listed or visit our website.
New Neuroscience ELISAsThe ratio of the Amyloid β40 and β42 biomarkers has been shown to be important for Alzheimer’s disease research and may
be correlated with cognitive decline. Our new amyloid β ELISAs (see page 6 for more on EZHS40 and EZHS42) specifically
provide rapid, sensitive and quantitative analysis of amyloid β40 and β42 in cerebrospinal fluid, cell culture supernatants,
primary neurons, brain tissue homogenates and plasma.
Discover our new ELISAs for neuroscience research:
New Luminata ELISA HRP SubstratesSensitivity and dynamic range for even your most demanding ELISAs.
Neuroscience ELISAs and MILLIPLEX map/mag Multiplex PanelsMillipore offers the largest array of ELISAs and Luminex-technology based multiplex panels for the research of neurological
function and dysfunction. Millipore is committed to continuing development of neuroscience assays and providing these to
the research community. For more details on the MILLIPLEX map Human Brain-Derived Protein Panel, please refer to page 10.
1
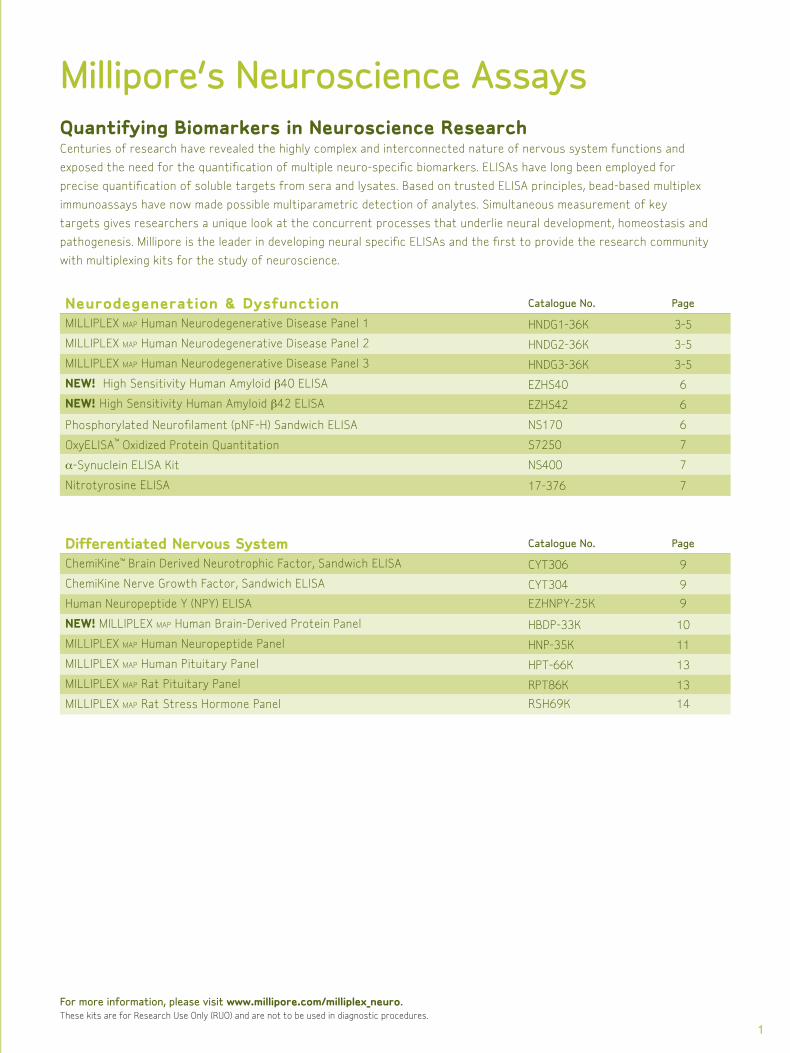
Quantifying Biomarkers in Neuroscience ResearchCenturies of research have revealed the highly complex and interconnected nature of nervous system functions and
exposed the need for the quantification of multiple neuro-specific biomarkers. ELISAs have long been employed for
precise quantification of soluble targets from sera and lysates. Based on trusted ELISA principles, bead-based multiplex
immunoassays have now made possible multiparametric detection of analytes. Simultaneous measurement of key
targets gives researchers a unique look at the concurrent processes that underlie neural development, homeostasis and
pathogenesis. Millipore is the leader in developing neural specific ELISAs and the first to provide the research community
with multiplexing kits for the study of neuroscience.
Millipore’s Neuroscience Assays
Neurodegeneration & Dysfunction Catalogue No. Page
MILLIPLEX map Human Neurodegenerative Disease Panel 1 HNDG1-36K 3-5
MILLIPLEX map Human Neurodegenerative Disease Panel 2 HNDG2-36K 3-5
MILLIPLEX map Human Neurodegenerative Disease Panel 3 HNDG3-36K 3-5
NEW! High Sensitivity Human Amyloid β40 ELISA EZHS40 6
NEW! High Sensitivity Human Amyloid β42 ELISA EZHS42 6
Phosphorylated Neurofilament (pNF-H) Sandwich ELISA NS170 6
OxyELISA™ Oxidized Protein Quantitation S7250 7
a-Synuclein ELISA Kit NS400 7
Nitrotyrosine ELISA 17-376 7
For more information, please visit www.millipore.com/milliplex_neuro.These kits are for Research Use Only (RUO) and are not to be used in diagnostic procedures.
Differentiated Nervous System Catalogue No. Page
ChemiKine™ Brain Derived Neurotrophic Factor, Sandwich ELISA CYT306 9
ChemiKine Nerve Growth Factor, Sandwich ELISA CYT304 9
Human Neuropeptide Y (NPY) ELISA EZHNPY-25K 9
NEW! MILLIPLEX map Human Brain-Derived Protein Panel HBDP-33K 10
MILLIPLEX map Human Neuropeptide Panel HNP-35K 11
MILLIPLEX map Human Pituitary Panel HPT-66K 13
MILLIPLEX map Rat Pituitary Panel RPT86K 13
MILLIPLEX map Rat Stress Hormone Panel RSH69K 14
2
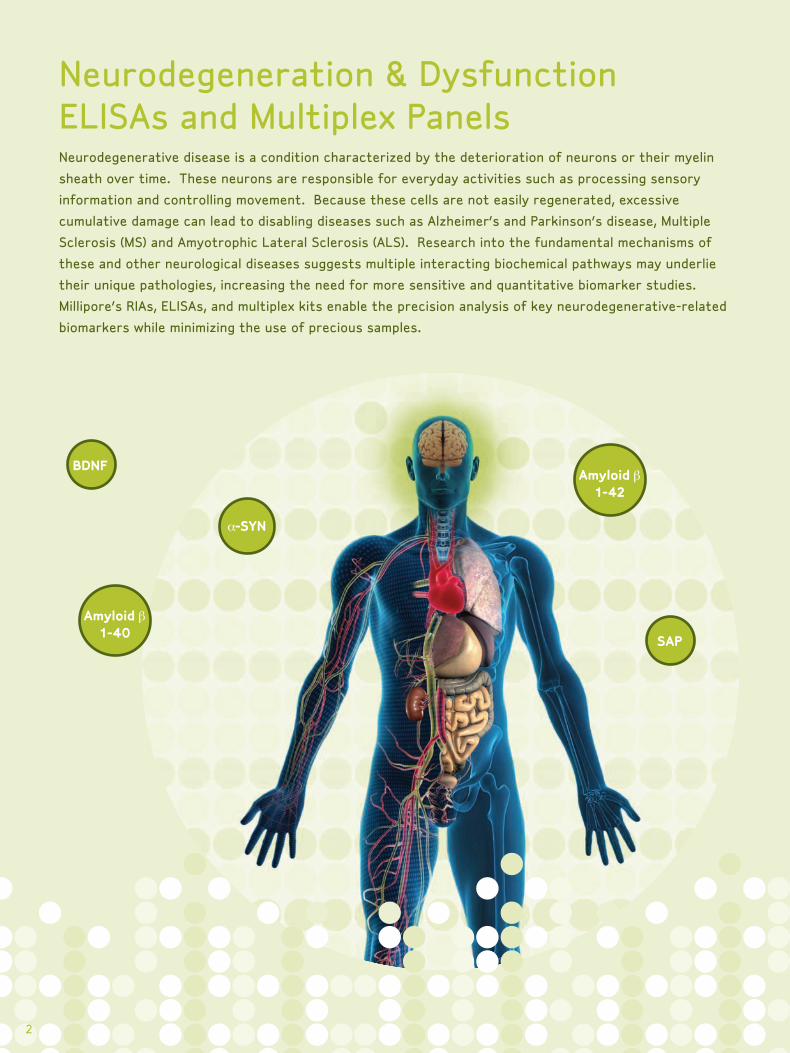
Neurodegenerative disease is a condition characterized by the deterioration of neurons or their myelin
sheath over time. These neurons are responsible for everyday activities such as processing sensory
information and controlling movement. Because these cells are not easily regenerated, excessive
cumulative damage can lead to disabling diseases such as Alzheimer’s and Parkinson’s disease, Multiple
Sclerosis (MS) and Amyotrophic Lateral Sclerosis (ALS). Research into the fundamental mechanisms of
these and other neurological diseases suggests multiple interacting biochemical pathways may underlie
their unique pathologies, increasing the need for more sensitive and quantitative biomarker studies.
Millipore’s RIAs, ELISAs, and multiplex kits enable the precision analysis of key neurodegenerative-related
biomarkers while minimizing the use of precious samples.
2
Neurodegeneration & Dysfunction ELISAs and Multiplex Panels
2
a-SYN
SAP
Amyloid β 1-40
BDNFAmyloid β
1-42
3
PAN
EL H
ND
G3
-36
KPA
NEL
HN
DG
2-3
6K
PAN
EL H
ND
G1
-36
K
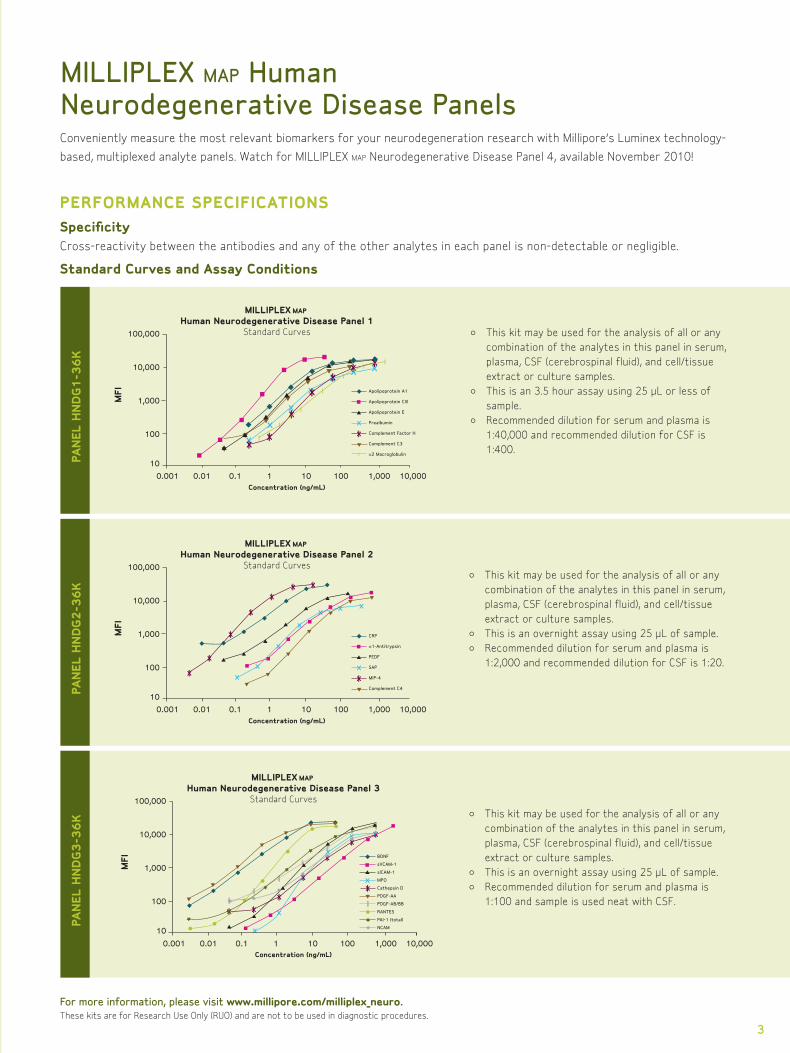
• This kit may be used for the analysis of all or any combination of the analytes in this panel in serum, plasma, CSF (cerebrospinal fluid), and cell/tissue extract or culture samples.• This is an 3.5 hour assay using 25 μL or less of
sample.• Recommended dilution for serum and plasma is
1:40,000 and recommended dilution for CSF is 1:400.
MILLIPLEX map Human Neurodegenerative Disease Panels
Concentration (ng/mL)
Apolipoprotein A1
Apolipoprotein CIII
Apolipoprotein E
Prealbumin
Complement Factor H
Complement C3
α2 Macroglobulin
x
xxxx
x
xx
xIxI
xI
xI
xIxI
xI xI
I
I
I
I
I
II
I
MILLIPLEX MAP
Human Neurodegenerative Disease Panel 1Standard Curves
MFI
0.001 0.01 0.1 1 10 100 1,000 10,000
100,000
10,000
1,000
100
10
• This kit may be used for the analysis of all or any combination of the analytes in this panel in serum, plasma, CSF (cerebrospinal fluid), and cell/tissue extract or culture samples.• This is an overnight assay using 25 μL of sample.• Recommended dilution for serum and plasma is
1:2,000 and recommended dilution for CSF is 1:20.
• This kit may be used for the analysis of all or any combination of the analytes in this panel in serum, plasma, CSF (cerebrospinal fluid), and cell/tissue extract or culture samples.• This is an overnight assay using 25 μL of sample.• Recommended dilution for serum and plasma is
1:100 and sample is used neat with CSF.
Concentration (ng/mL)
CRP
α1-Antitrypsin
PEDF
SAP
MIP-4
Complement C4
x
xx
x
x
xx
x
xIxI
xI
xI
xI
xIxI xI
MILLIPLEX MAP
Human Neurodegenerative Disease Panel 2Standard Curves
MFI
0.001 0.01 0.1 1 10 100 1,000 10,000
100,000
10,000
1,000
100
10
xI
Concentration (ng/mL)
BDNF
sVCAM-1
slCAM-1
MPO
Cathepsin D
PDGF-AA
PDGF-AB/BB
RANTES
PAI-1 (total)
NCAM
x
x
x
x
x
x
x
xI
xIxI
xI
xI
xIxI
MILLIPLEX MAP
Human Neurodegenerative Disease Panel 3Standard Curves
MFI
100,000
10,000
1,000
100
10
0.001 0.01 0.1 1 10 100 1,000 10,000
For more information, please visit www.millipore.com/milliplex_neuro.These kits are for Research Use Only (RUO) and are not to be used in diagnostic procedures.
Conveniently measure the most relevant biomarkers for your neurodegeneration research with Millipore’s Luminex technology-
based, multiplexed analyte panels. Watch for MILLIPLEX map Neurodegenerative Disease Panel 4, available November 2010!
PERFORMANCE SPECIFICATIONSSpecificityCross-reactivity between the antibodies and any of the other analytes in each panel is non-detectable or negligible.
Standard Curves and Assay Conditions
4
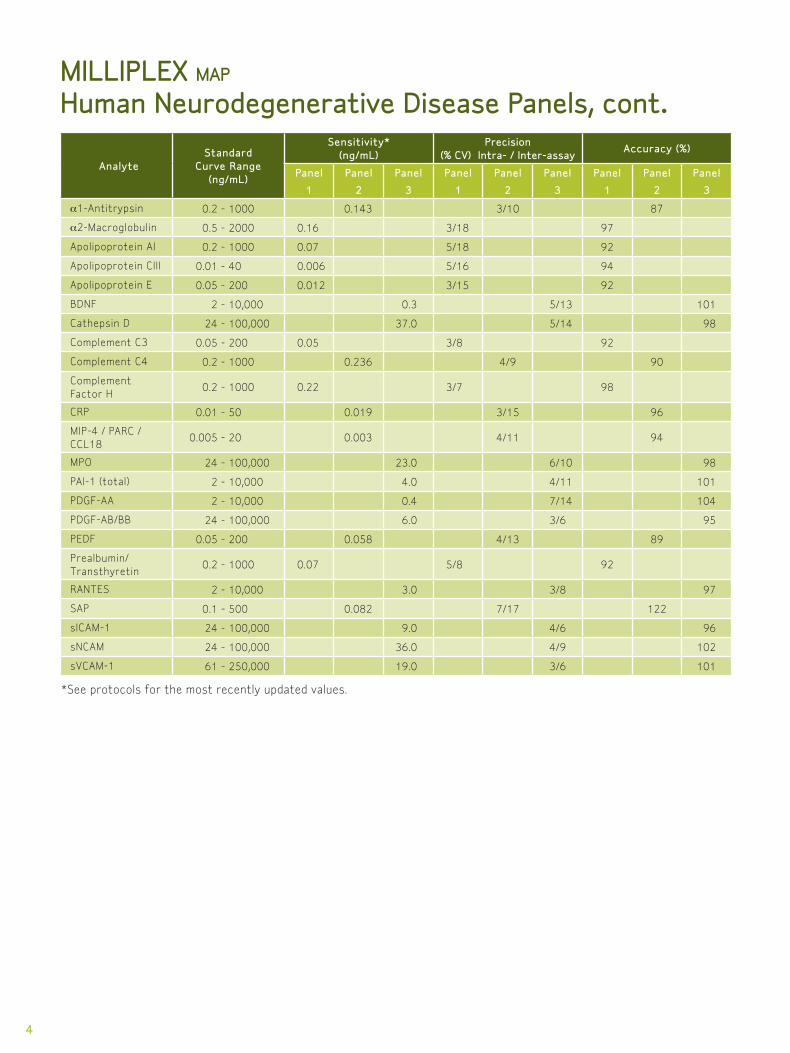
AnalyteStandard
Curve Range (ng/mL)
Sensitivity* (ng/mL)
Precision(% CV) Intra- / Inter-assay
Accuracy (%)
Panel
1
Panel
2
Panel
3
Panel
1
Panel
2
Panel
3
Panel
1
Panel
2
Panel
3
a1-Antitrypsin 0.2 - 1000 0.143 3/10 87
a2-Macroglobulin 0.5 - 2000 0.16 3/18 97
Apolipoprotein AI 0.2 - 1000 0.07 5/18 92
Apolipoprotein CIII 0.01 - 40 0.006 5/16 94
Apolipoprotein E 0.05 - 200 0.012 3/15 92
BDNF 2 - 10,000 0.3 5/13 101
Cathepsin D 24 - 100,000 37.0 5/14 98
Complement C3 0.05 - 200 0.05 3/8 92
Complement C4 0.2 - 1000 0.236 4/9 90
Complement Factor H
0.2 - 1000 0.22 3/7 98
CRP 0.01 - 50 0.019 3/15 96
MIP-4 / PARC / CCL18
0.005 - 20 0.003 4/11 94
MPO 24 - 100,000 23.0 6/10 98
PAI-1 (total) 2 - 10,000 4.0 4/11 101
PDGF-AA 2 - 10,000 0.4 7/14 104
PDGF-AB/BB 24 - 100,000 6.0 3/6 95
PEDF 0.05 - 200 0.058 4/13 89
Prealbumin/ Transthyretin
0.2 - 1000 0.07 5/8 92
RANTES 2 - 10,000 3.0 3/8 97
SAP 0.1 - 500 0.082 7/17 122
sICAM-1 24 - 100,000 9.0 4/6 96
sNCAM 24 - 100,000 36.0 4/9 102
sVCAM-1 61 - 250,000 19.0 3/6 101
*See protocols for the most recently updated values.
MILLIPLEX map Human Neurodegenerative Disease Panels, cont.
5
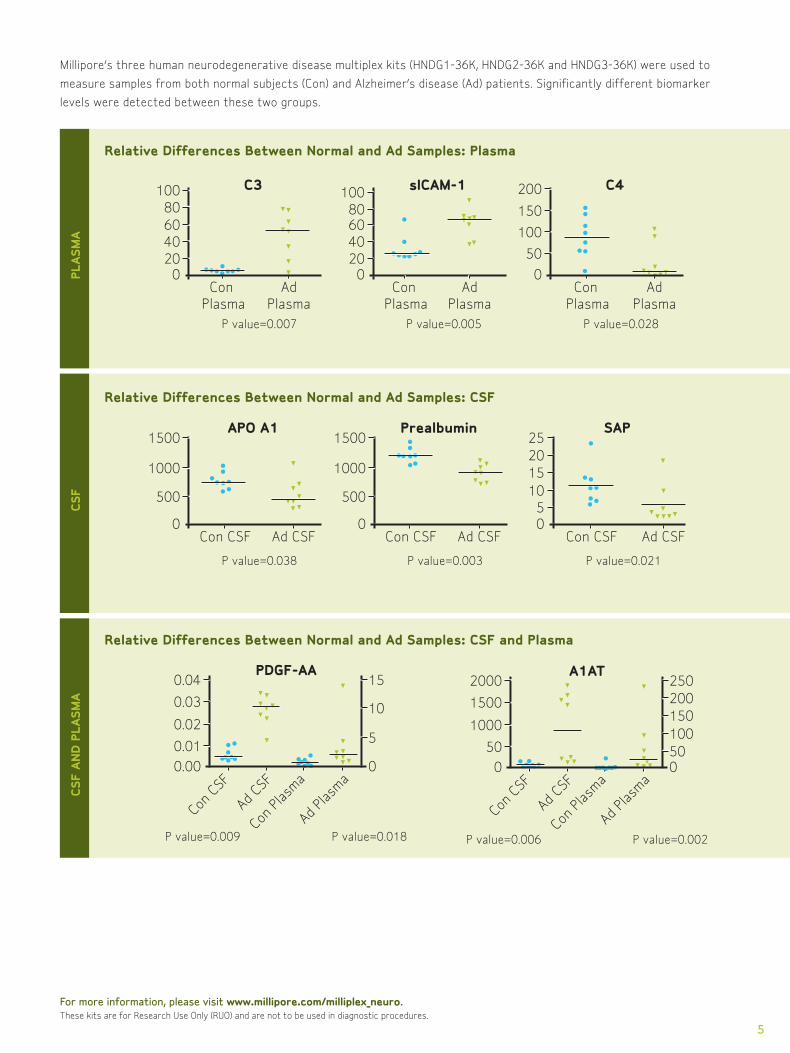
Millipore’s three human neurodegenerative disease multiplex kits (HNDG1-36K, HNDG2-36K and HNDG3-36K) were used to
measure samples from both normal subjects (Con) and Alzheimer’s disease (Ad) patients. Significantly different biomarker
levels were detected between these two groups.
CSF
AN
D P
LASM
ACSF
PLA
SMA
For more information, please visit www.millipore.com/milliplex_neuro.These kits are for Research Use Only (RUO) and are not to be used in diagnostic procedures.
10080604020
Con Plasma
P value=0.007
AdPlasma
0
C3 10080604020
Con Plasma
P value=0.005
AdPlasma
0
sICAM-1
1500
1000
500
Con CSF
P value=0.038
Ad CSF0
APO A11500
1000
500
Con CSF
P value=0.003
Ad CSF0
Prealbumin252015105
Con CSF
P value=0.021
Ad CSF0
SAP2000
1500
1000
50
Con
CSF
Ad C
SF
P value=0.006 P value=0.002
0
250200
100150
500
A1AT
Con
Plasm
a
Ad P
lasma
200
150
100
50
Con Plasma
P value=0.028
AdPlasma
0
C4 0.04
0.03
0.02
0.01
Con
CSF
Ad C
SF
P value=0.009 P value=0.018
0.00
15
10
5
0
PDGF-AA
Con
Plasm
a
Ad P
lasma
Relative Differences Between Normal and Ad Samples: Plasma
Relative Differences Between Normal and Ad Samples: CSF
Relative Differences Between Normal and Ad Samples: CSF and Plasma
6
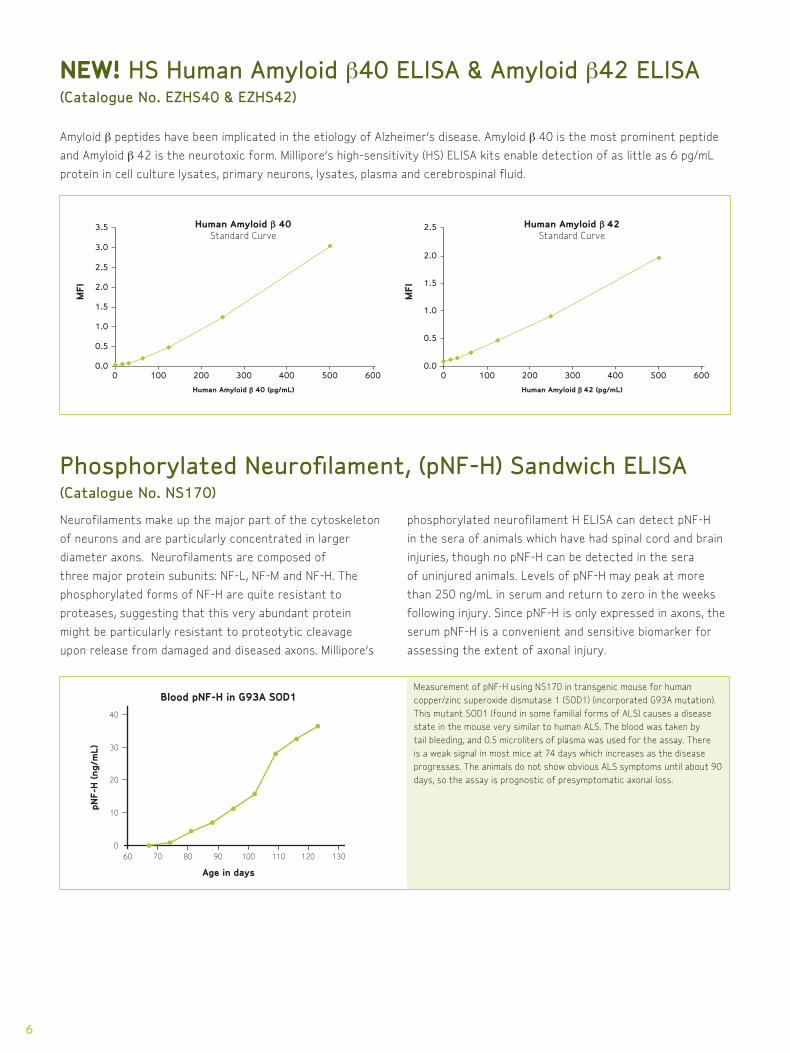
Measurement of pNF-H using NS170 in transgenic mouse for human
copper/zinc superoxide dismutase 1 (SOD1) (incorporated G93A mutation).
This mutant SOD1 (found in some familial forms of ALS) causes a disease
state in the mouse very similar to human ALS. The blood was taken by
tail bleeding, and 0.5 microliters of plasma was used for the assay. There
is a weak signal in most mice at 74 days which increases as the disease
progresses. The animals do not show obvious ALS symptoms until about 90
days, so the assay is prognostic of presymptomatic axonal loss.
NEW! HS Human Amyloid β40 ELISA & Amyloid β42 ELISA (Catalogue No. EZHS40 & EZHS42)
Phosphorylated Neurofilament, (pNF-H) Sandwich ELISA (Catalogue No. NS170)
Amyloid β peptides have been implicated in the etiology of Alzheimer’s disease. Amyloid β 40 is the most prominent peptide
and Amyloid β 42 is the neurotoxic form. Millipore’s high-sensitivity (HS) ELISA kits enable detection of as little as 6 pg/mL
protein in cell culture lysates, primary neurons, lysates, plasma and cerebrospinal fluid.
Neurofilaments make up the major part of the cytoskeleton
of neurons and are particularly concentrated in larger
diameter axons. Neurofilaments are composed of
three major protein subunits: NF-L, NF-M and NF-H. The
phosphorylated forms of NF-H are quite resistant to
proteases, suggesting that this very abundant protein
might be particularly resistant to proteotytic cleavage
upon release from damaged and diseased axons. Millipore’s
phosphorylated neurofilament H ELISA can detect pNF-H
in the sera of animals which have had spinal cord and brain
injuries, though no pNF-H can be detected in the sera
of uninjured animals. Levels of pNF-H may peak at more
than 250 ng/mL in serum and return to zero in the weeks
following injury. Since pNF-H is only expressed in axons, the
serum pNF-H is a convenient and sensitive biomarker for
assessing the extent of axonal injury.
Human Amyloid β 40 (pg/mL)
Human Amyloid β 40Standard Curve
MFI
0 100
3.5
3.0
2.5
2.0
1.5
1.0
0.5
0.0200 300 400 500 600
Human Amyloid β 42 (pg/mL)
Human Amyloid β 42Standard Curve
MFI
0 100
2.5
2.0
1.5
1.0
0.5
0.0200 300 400 500 600
060 70
20
10
30
40
pNF-
H (n
g/m
L)
Age in days
Blood pNF-H in G93A SOD1
80 90 100 110 120 130
7
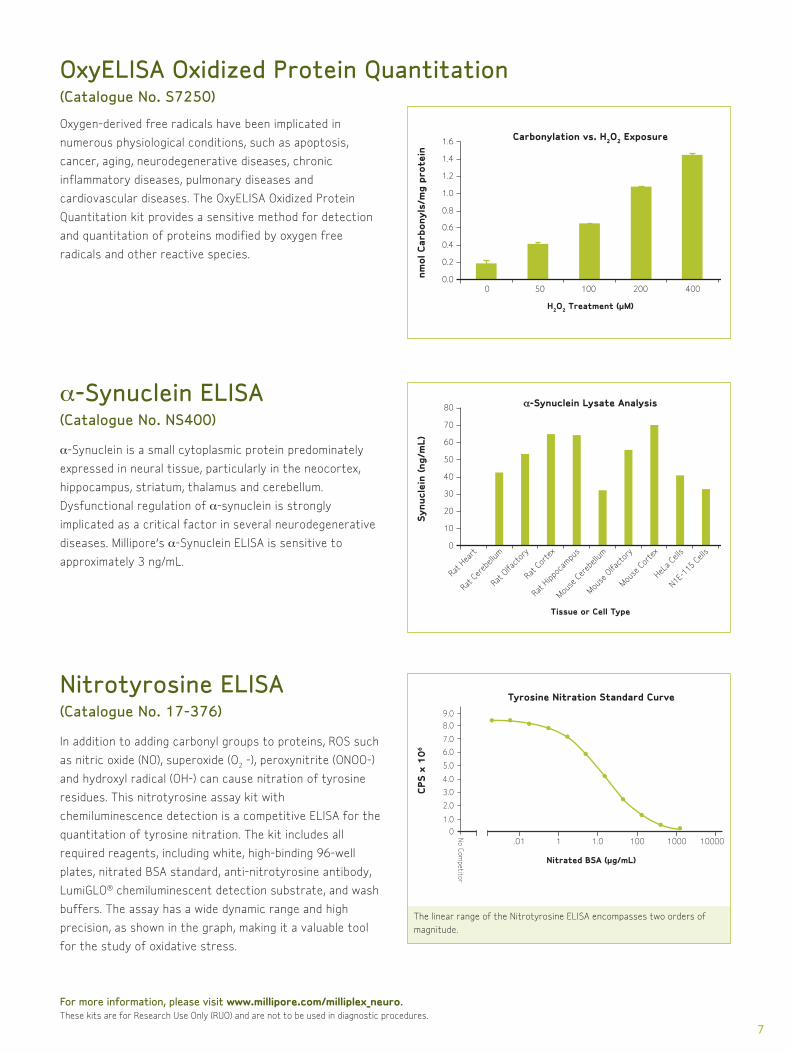
The linear range of the Nitrotyrosine ELISA encompasses two orders of
magnitude.
OxyELISA Oxidized Protein Quantitation (Catalogue No. S7250)
Oxygen-derived free radicals have been implicated in
numerous physiological conditions, such as apoptosis,
cancer, aging, neurodegenerative diseases, chronic
inflammatory diseases, pulmonary diseases and
cardiovascular diseases. The OxyELISA Oxidized Protein
Quantitation kit provides a sensitive method for detection
and quantitation of proteins modified by oxygen free
radicals and other reactive species.
nmol
Car
bony
ls/m
g pr
otei
n
H2O2 Treatment (µM)
50
1.0
1.2
1.4
1.6
0.8
0.6
0.4
0.2
0.00 100 200 400
Carbonylation vs. H2O2 Exposure
For more information, please visit www.millipore.com/milliplex_neuro.These kits are for Research Use Only (RUO) and are not to be used in diagnostic procedures.
a-Synuclein ELISA(Catalogue No. NS400)
Nitrotyrosine ELISA (Catalogue No. 17-376)
a-Synuclein is a small cytoplasmic protein predominately
expressed in neural tissue, particularly in the neocortex,
hippocampus, striatum, thalamus and cerebellum.
Dysfunctional regulation of a-synuclein is strongly
implicated as a critical factor in several neurodegenerative
diseases. Millipore’s a-Synuclein ELISA is sensitive to
approximately 3 ng/mL.
In addition to adding carbonyl groups to proteins, ROS such
as nitric oxide (NO), superoxide (O2 -), peroxynitrite (ONOO-)
and hydroxyl radical (OH-) can cause nitration of tyrosine
residues. This nitrotyrosine assay kit with
chemiluminescence detection is a competitive ELISA for the
quantitation of tyrosine nitration. The kit includes all
required reagents, including white, high-binding 96-well
plates, nitrated BSA standard, anti-nitrotyrosine antibody,
LumiGLO® chemiluminescent detection substrate, and wash
buffers. The assay has a wide dynamic range and high
precision, as shown in the graph, making it a valuable tool
for the study of oxidative stress.
Synu
clei
n (n
g/m
L)
Tissue or Cell Type
50
60
70
80
40
30
20
10
0
Rat H
eart
Rat C
ereb
ellum
Rat O
lfact
ory
Rat C
orte
x
Rat H
ippoc
ampu
s
Mouse
Cer
ebell
um
Mouse
Olfa
ctor
y
Mouse
Cor
tex
HeLa C
ells
N1E-1
15 C
ells
α-Synuclein Lysate Analysis
CPS
x 1
06
0 No Com
petitor
.01
6.0
5.0
4.0
3.0
2.0
1.0
7.0
8.0
9.0
Nitrated BSA (µg/mL)
1 1.0 100 1000 10000
Tyrosine Nitration Standard Curve
8
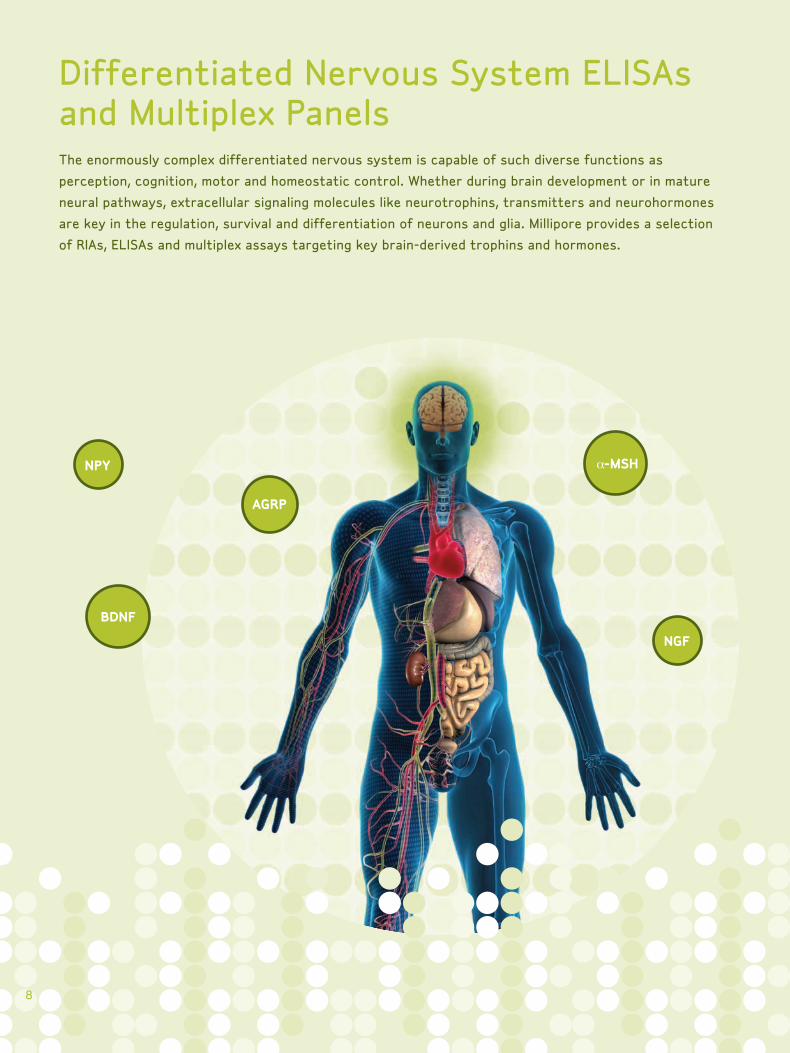
The enormously complex differentiated nervous system is capable of such diverse functions as
perception, cognition, motor and homeostatic control. Whether during brain development or in mature
neural pathways, extracellular signaling molecules like neurotrophins, transmitters and neurohormones
are key in the regulation, survival and differentiation of neurons and glia. Millipore provides a selection
of RIAs, ELISAs and multiplex assays targeting key brain-derived trophins and hormones.
Differentiated Nervous System ELISAs and Multiplex Panels
888
AGRP
NGF
BDNF
NPY a-MSH
9
For more information, please visit www.millipore.com/milliplex_neuro.These kits are for Research Use Only (RUO) and are not to be used in diagnostic procedures.
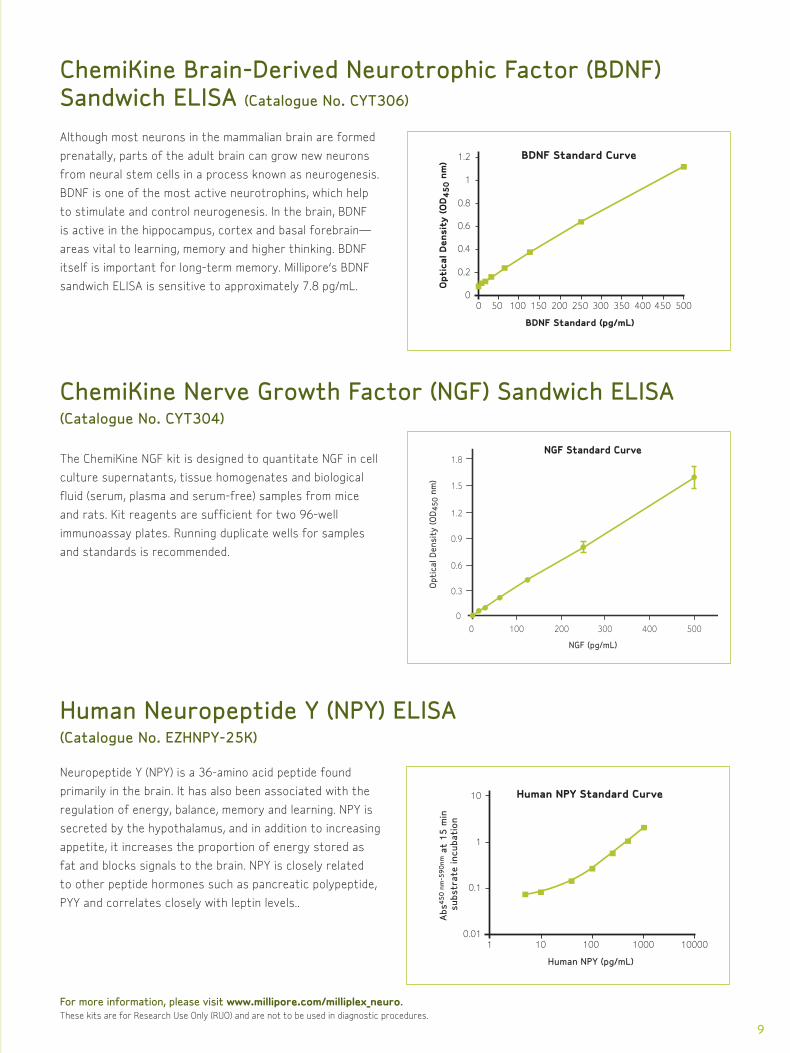
ChemiKine Brain-Derived Neurotrophic Factor (BDNF) Sandwich ELISA (Catalogue No. CYT306)
ChemiKine Nerve Growth Factor (NGF) Sandwich ELISA (Catalogue No. CYT304)
Although most neurons in the mammalian brain are formed
prenatally, parts of the adult brain can grow new neurons
from neural stem cells in a process known as neurogenesis.
BDNF is one of the most active neurotrophins, which help
to stimulate and control neurogenesis. In the brain, BDNF
is active in the hippocampus, cortex and basal forebrain—
areas vital to learning, memory and higher thinking. BDNF
itself is important for long-term memory. Millipore’s BDNF
sandwich ELISA is sensitive to approximately 7.8 pg/mL.
Neuropeptide Y (NPY) is a 36-amino acid peptide found
primarily in the brain. It has also been associated with the
regulation of energy, balance, memory and learning. NPY is
secreted by the hypothalamus, and in addition to increasing
appetite, it increases the proportion of energy stored as
fat and blocks signals to the brain. NPY is closely related
to other peptide hormones such as pancreatic polypeptide,
PYY and correlates closely with leptin levels..
The ChemiKine NGF kit is designed to quantitate NGF in cell
culture supernatants, tissue homogenates and biological
fluid (serum, plasma and serum-free) samples from mice
and rats. Kit reagents are sufficient for two 96-well
immunoassay plates. Running duplicate wells for samples
and standards is recommended.
BDNF Standard Curve
Opt
ical
Den
sity
(O
D4
50 n
m)
BDNF Standard (pg/mL)
500 100 150 200 250 300 350 400 450 5000
0.2
0.4
0.6
0.8
1
1.2
0
0 100
0.9
0.6
0.3
1.2
1.5
1.8
Opt
ical
Den
sity
(OD
45
0 n
m)
NGF (pg/mL)
NGF Standard Curve
200 300 400 500
Human NPY Standard Curve
Abs
45
0 n
m-5
90nm
at
15
min
su
bstr
ate
incu
bati
on
Human NPY (pg/mL)
1 10 100 1000 100000.01
0.1
1
10
Human Neuropeptide Y (NPY) ELISA (Catalogue No. EZHNPY-25K)
10
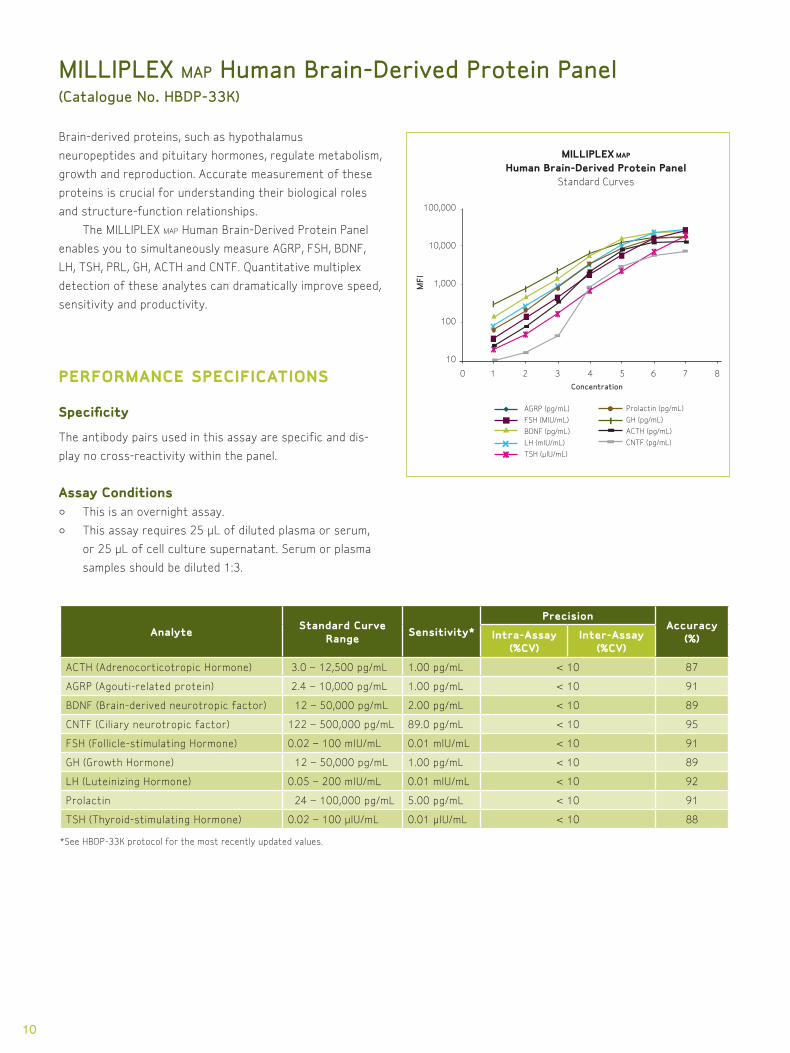
MILLIPLEX map Human Brain-Derived Protein Panel (Catalogue No. HBDP-33K)
Brain-derived proteins, such as hypothalamus
neuropeptides and pituitary hormones, regulate metabolism,
growth and reproduction. Accurate measurement of these
proteins is crucial for understanding their biological roles
and structure-function relationships.
The MILLIPLEX map Human Brain-Derived Protein Panel
enables you to simultaneously measure AGRP, FSH, BDNF,
LH, TSH, PRL, GH, ACTH and CNTF. Quantitative multiplex
detection of these analytes can dramatically improve speed,
sensitivity and productivity.
PERFORMANCE SPECIFICATIONS Specificity
The antibody pairs used in this assay are specific and dis-
play no cross-reactivity within the panel.
Assay Conditions• This is an overnight assay.
• This assay requires 25 μL of diluted plasma or serum,
or 25 μL of cell culture supernatant. Serum or plasma
samples should be diluted 1:3.
100,000
10,000
1,000
100
10
0 1 2 3 4 5 6 7 8
Concentration
MILLIPLEX MAP
Human Brain-Derived Protein PanelStandard Curves
AGRP (pg/mL)
FSH (MIU/mL)
BDNF (pg/mL)
LH (mIU/mL)
TSH (µIU/mL)
Prolactin (pg/mL)
GH (pg/mL)
ACTH (pg/mL)
CNTF (pg/mL)
MFI
x
x
x
x
xx
x x
x
xx
x
x
xx
x
Analyte Standard Curve Range Sensitivity*
PrecisionAccuracy
(%)Intra-Assay (%CV)
Inter-Assay (%CV)
ACTH (Adrenocorticotropic Hormone) 3.0 – 12,500 pg/mL 1.00 pg/mL < 10 87
AGRP (Agouti-related protein) 2.4 – 10,000 pg/mL 1.00 pg/mL < 10 91
BDNF (Brain-derived neurotropic factor) 12 – 50,000 pg/mL 2.00 pg/mL < 10 89
CNTF (Ciliary neurotropic factor) 122 – 500,000 pg/mL 89.0 pg/mL < 10 95
FSH (Follicle-stimulating Hormone) 0.02 – 100 mIU/mL 0.01 mIU/mL < 10 91
GH (Growth Hormone) 12 – 50,000 pg/mL 1.00 pg/mL < 10 89
LH (Luteinizing Hormone) 0.05 – 200 mIU/mL 0.01 mIU/mL < 10 92
Prolactin 24 – 100,000 pg/mL 5.00 pg/mL < 10 91
TSH (Thyroid-stimulating Hormone) 0.02 – 100 μIU/mL 0.01 μIU/mL < 10 88
*See HBDP-33K protocol for the most recently updated values.
11
For more information, please visit www.millipore.com/milliplex_neuro.These kits are for Research Use Only (RUO) and are not to be used in diagnostic procedures.
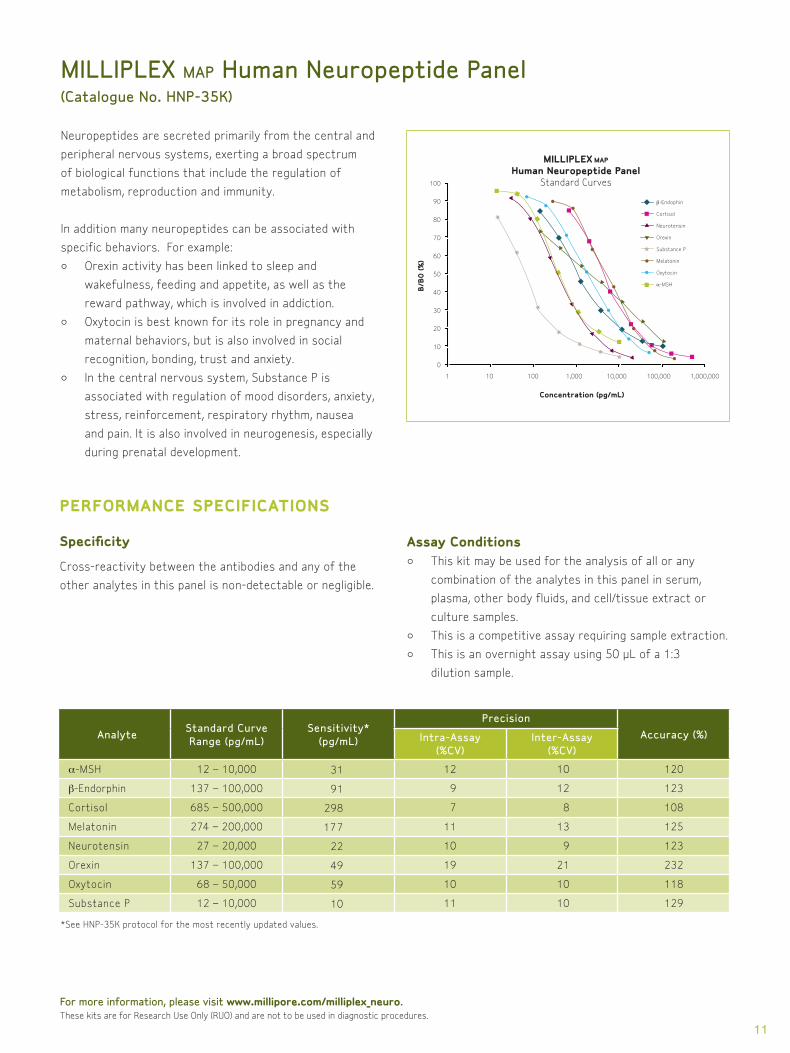
MILLIPLEX map Human Neuropeptide Panel (Catalogue No. HNP-35K)
Neuropeptides are secreted primarily from the central and
peripheral nervous systems, exerting a broad spectrum
of biological functions that include the regulation of
metabolism, reproduction and immunity.
In addition many neuropeptides can be associated with
specific behaviors. For example:
• Orexin activity has been linked to sleep and
wakefulness, feeding and appetite, as well as the
reward pathway, which is involved in addiction.
• Oxytocin is best known for its role in pregnancy and
maternal behaviors, but is also involved in social
recognition, bonding, trust and anxiety.
• In the central nervous system, Substance P is
associated with regulation of mood disorders, anxiety,
stress, reinforcement, respiratory rhythm, nausea
and pain. It is also involved in neurogenesis, especially
during prenatal development.
PERFORMANCE SPECIFICATIONS Specificity
Cross-reactivity between the antibodies and any of the
other analytes in this panel is non-detectable or negligible.
Assay Conditions• This kit may be used for the analysis of all or any
combination of the analytes in this panel in serum,
plasma, other body fluids, and cell/tissue extract or
culture samples.
• This is a competitive assay requiring sample extraction.
• This is an overnight assay using 50 μL of a 1:3
dilution sample.
MILLIPLEX MAP
Human Neuropeptide PanelStandard Curves
Concentration (pg/mL)
B/B
0 (%
)
100
90
80
70
60
50
40
30
20
10
0
1 10 100 1,000 10,000 100,000 1,000,000
β-Endophin
Cortisol
Neurotensin
Orexin
Substance P
Melatonin
Oxytocin
α-MSH
AnalyteStandard Curve Range (pg/mL)
Sensitivity* (pg/mL)
Precision
Accuracy (%)Intra-Assay (%CV)
Inter-Assay (%CV)
a-MSH 12 – 10,000 31 12 10 120
β-Endorphin 137 – 100,000 91 9 12 123
Cortisol 685 – 500,000 298 7 8 108
Melatonin 274 – 200,000 177 11 13 125
Neurotensin 27 – 20,000 22 10 9 123
Orexin 137 – 100,000 49 19 21 232
Oxytocin 68 – 50,000 59 10 10 118
Substance P 12 – 10,000 10 11 10 129
*See HNP-35K protocol for the most recently updated values.
12
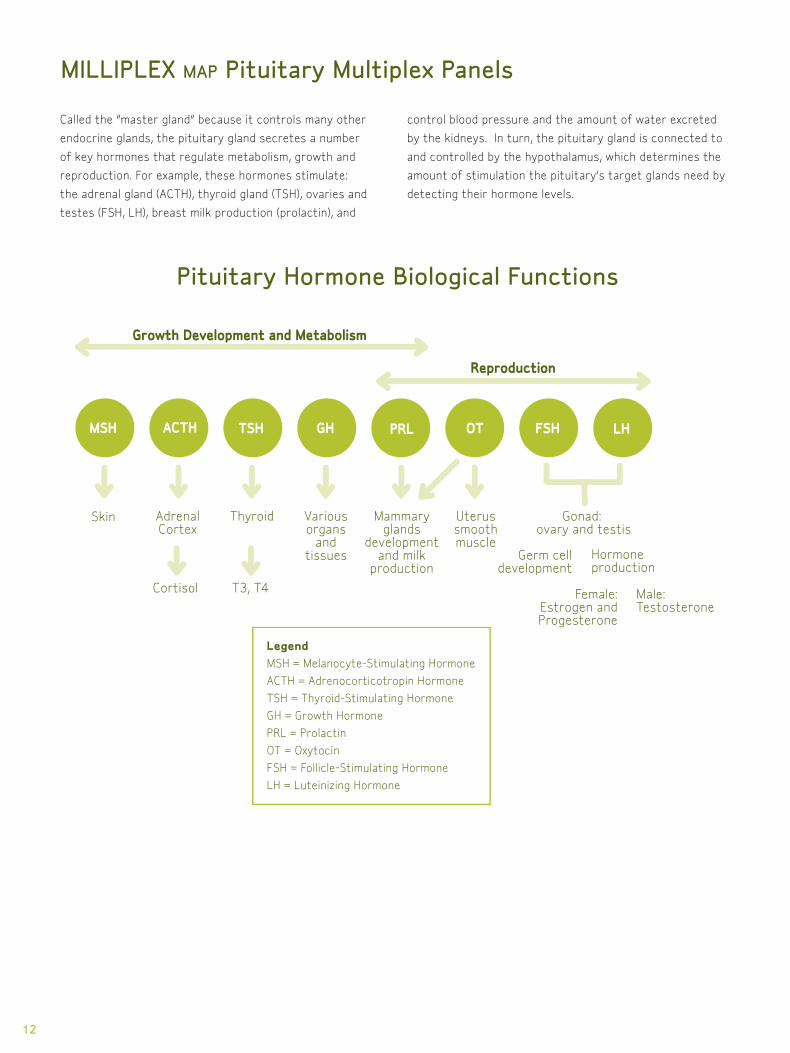
Called the “master gland” because it controls many other
endocrine glands, the pituitary gland secretes a number
of key hormones that regulate metabolism, growth and
reproduction. For example, these hormones stimulate:
the adrenal gland (ACTH), thyroid gland (TSH), ovaries and
testes (FSH, LH), breast milk production (prolactin), and
MILLIPLEX MAP Pituitary Multiplex Panels
control blood pressure and the amount of water excreted
by the kidneys. In turn, the pituitary gland is connected to
and controlled by the hypothalamus, which determines the
amount of stimulation the pituitary’s target glands need by
detecting their hormone levels.
Skin AdrenalCortex
LegendMSH = Melanocyte-Stimulating Hormone
ACTH = Adrenocorticotropin Hormone
TSH = Thyroid-Stimulating Hormone
GH = Growth Hormone
PRL = Prolactin
OT = Oxytocin
FSH = Follicle-Stimulating Hormone
LH = Luteinizing Hormone
Cortisol
MSH ACTH TSH GH
Growth Development and MetabolismGrowth Development and Metabolism
ReproductionReproduction
PRL FSHOT LH
Thyroid
T3, T4
Variousorgans
andtissues
Mammaryglands
developmentand milk
production
Uterussmoothmuscle
Gonad: ovary and testis
cleGerm cell
development
Female:Estrogen andProgesterone
Male:Testosterone
Hormoneproduction
Pituitary Hormone Biological Functions
13
AnalyteStandard
Curve RangesSensitivity*
MinDC
Precision
Accuracy (%)Intra-Assay (%CV)
Inter-Assay (%CV)
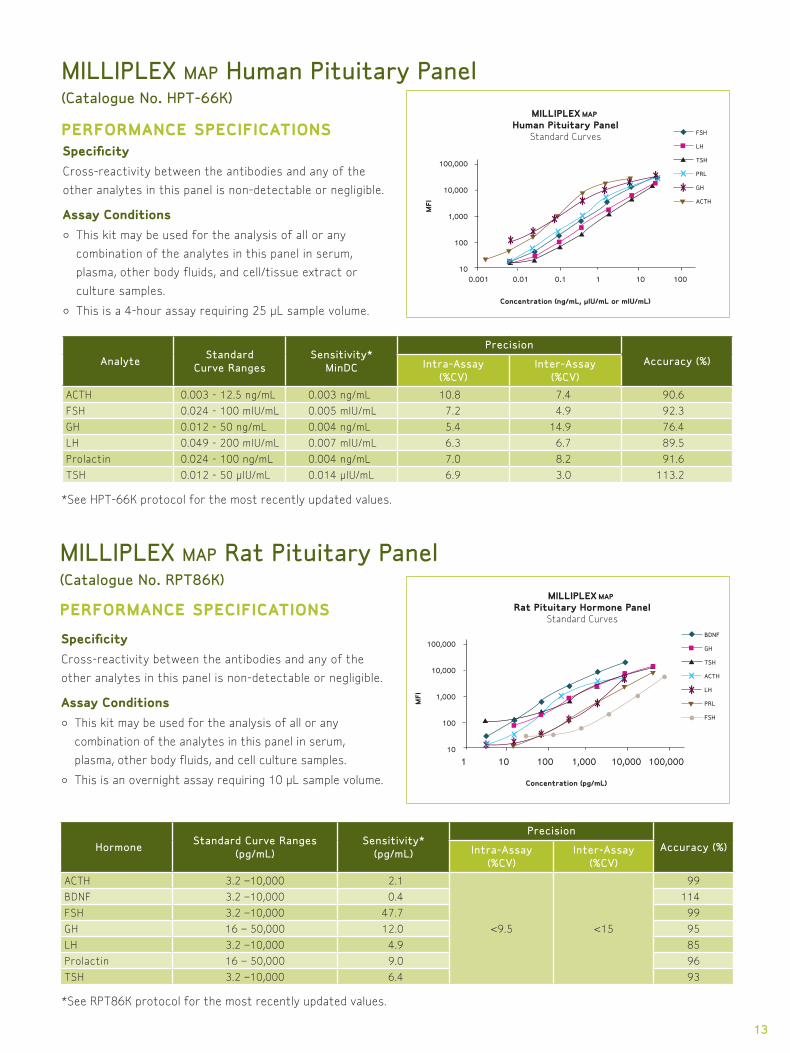
ACTH 0.003 - 12.5 ng/mL 0.003 ng/mL 10.8 7.4 90.6
FSH 0.024 - 100 mIU/mL 0.005 mIU/mL 7.2 4.9 92.3
GH 0.012 - 50 ng/mL 0.004 ng/mL 5.4 14.9 76.4
LH 0.049 - 200 mIU/mL 0.007 mIU/mL 6.3 6.7 89.5
Prolactin 0.024 - 100 ng/mL 0.004 ng/mL 7.0 8.2 91.6
TSH 0.012 - 50 μIU/mL 0.014 μIU/mL 6.9 3.0 113.2
MILLIPLEX MAP Human Pituitary Panel(Catalogue No. HPT-66K)
Specificity
Cross-reactivity between the antibodies and any of the
other analytes in this panel is non-detectable or negligible.
Assay Conditions
• This kit may be used for the analysis of all or any
combination of the analytes in this panel in serum,
plasma, other body fluids, and cell/tissue extract or
culture samples.
• This is a 4-hour assay requiring 25 μL sample volume.
PERFORMANCE SPECIFICATIONS
HormoneStandard Curve Ranges
(pg/mL)Sensitivity*
(pg/mL)
Precision
Accuracy (%)Intra-Assay (%CV)
Inter-Assay (%CV)
ACTH 3.2 –10,000 2.1
<9.5 <15
99
BDNF 3.2 –10,000 0.4 114
FSH 3.2 –10,000 47.7 99
GH 16 – 50,000 12.0 95
LH 3.2 –10,000 4.9 85
Prolactin 16 – 50,000 9.0 96
TSH 3.2 –10,000 6.4 93
xI
x
Concentration (pg/mL)
MFI
100,000
10,000
1,000
100
10
1 10 100 1,000 10,000 100,000
BDNF
GH
TSH
ACTH
LH
PRL
FSH
xxxx
xx
xIxI
xIxI
xIxI
MILLIPLEX MAP
Rat Pituitary Hormone PanelStandard Curves
Concentration (ng/mL, µIU/mL or mIU/mL)
MFI
0.001 0.01 0.1 1 10 100
FSH
LH
TSH
PRL
GH
ACTH
x
x
xx
xx
xx
xI
xIxI
xI
xI
xIxI
xI
MILLIPLEX MAP
Human Pituitary PanelStandard Curves
100,000
10,000
1,000
100
10
MILLIPLEX MAP Rat Pituitary Panel(Catalogue No. RPT86K)
Specificity
Cross-reactivity between the antibodies and any of the
other analytes in this panel is non-detectable or negligible.
Assay Conditions
• This kit may be used for the analysis of all or any
combination of the analytes in this panel in serum,
plasma, other body fluids, and cell culture samples.
• This is an overnight assay requiring 10 μL sample volume.
PERFORMANCE SPECIFICATIONS
*See HPT-66K protocol for the most recently updated values.
*See RPT86K protocol for the most recently updated values.
14
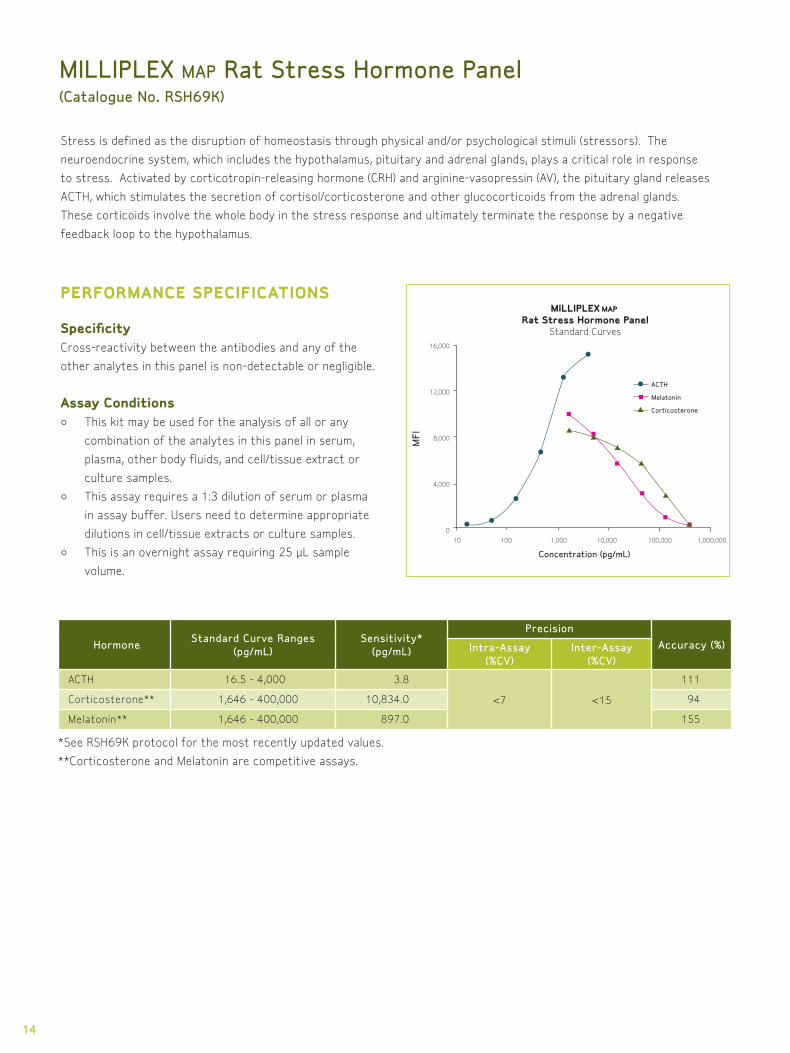
MILLIPLEX MAP Rat Stress Hormone Panel(Catalogue No. RSH69K)
Stress is defined as the disruption of homeostasis through physical and/or psychological stimuli (stressors). The
neuroendocrine system, which includes the hypothalamus, pituitary and adrenal glands, plays a critical role in response
to stress. Activated by corticotropin-releasing hormone (CRH) and arginine-vasopressin (AV), the pituitary gland releases
ACTH, which stimulates the secretion of cortisol/corticosterone and other glucocorticoids from the adrenal glands.
These corticoids involve the whole body in the stress response and ultimately terminate the response by a negative
feedback loop to the hypothalamus.
PERFORMANCE SPECIFICATIONS SpecificityCross-reactivity between the antibodies and any of the
other analytes in this panel is non-detectable or negligible.
Assay Conditions• This kit may be used for the analysis of all or any
combination of the analytes in this panel in serum,
plasma, other body fluids, and cell/tissue extract or
culture samples.
• This assay requires a 1:3 dilution of serum or plasma
in assay buffer. Users need to determine appropriate
dilutions in cell/tissue extracts or culture samples.
• This is an overnight assay requiring 25 μL sample
volume.
Concentration (pg/mL)
16,000
12,000
8,000
4,000
0
10 100 1,000 10,000 100,000 1,000,000
ACTH
Melatonin
CorticosteroneM
FI
MILLIPLEX MAP
Rat Stress Hormone PanelStandard Curves
HormoneStandard Curve Ranges
(pg/mL)Sensitivity*
(pg/mL)
Precision
Accuracy (%)Intra-Assay (%CV)
Inter-Assay (%CV)
ACTH 16.5 - 4,000 3.8
<7 <15
111
Corticosterone** 1,646 - 400,000 10,834.0 94
Melatonin** 1,646 - 400,000 897.0 155
*See RSH69K protocol for the most recently updated values.
**Corticosterone and Melatonin are competitive assays.
15
PRODUCTS • Higher Quality – Industry-leading QC, QA and Six Sigma Principles
• More Efficient – Analytically validated panels for consistency and reproducibility
• All-In-One Kit – A single kit with a single catalogue number
• More Flexible – Select only the analytes needed or choose a pre-mixed kit
• Continuity of Knowledge Is the Key – Millipore “owns” every step of the process,
from R&D to manufacturing
• More Choices – The broadest range of multiplex analytes for the Luminex xMAP® platform
INSTRUMENTS • Speed/High Throughput – Simultaneously measure the concentration of a large number
of different analytes, allowing you to do more faster, gaining early and comprehensive
data so critical to your work
• Accuracy – xMAP technology generates real-time analysis and accurate quantification of
the biological interactions
• Reproducibility – High-volume production of xMAP microspheres allows assay
standardization that solid-phased flat arrays cannot provide
• Low Sample Volume – With minimal hands-on time, you can screen more than 40
analytes in a single sample using as little as 25 μL
SOFTWARE • MILLIPLEX Analyst software, developed exclusively for Millipore by VigeneTech®. This
data analysis package helps you do your best work with increased speed and efficiency.
MILLIPLEX Analyst software provides a whole new level of data analysis by allowing you to
import large data sets and benefit from the ability to calculate your results in seconds.
The user-friendly plate setup feature lets you work with speed and efficiency while the
unique algorithms on even the most challenging data sets give you the performance you
need for multiplexing analysis.
SERVICES • Services available for RIAs, ELISAs, IRMAs and multiplex assays
• Rapid and reliable results
• Quality control, reproducible results, and confidentiality are of paramount importance to
our Assay Services team
• We offer proven bioanalytical services for Biomarkers from research grade analysis to
fully GXP compliant assay validation and sample analysis. We employ a “Fit-for-Purpose”
validation strategy to customize the assay to meet your specific regulatory needs
MILLIPLEX MAP: Everything You Need – All In One Place
For a complete and up-to-date list of MILLIPLEX MAP analytes, visit www.millipore.com/analytes.
TM
TM
TM
TM
TM
TM
TM
TM
16
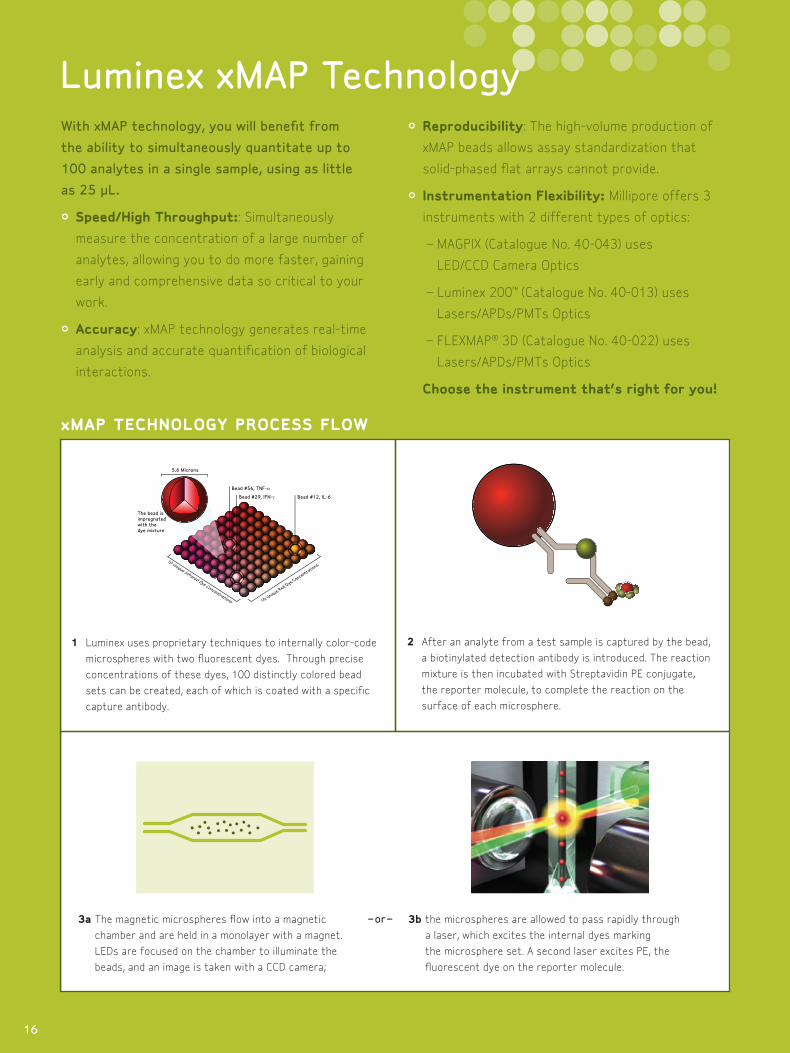
xMAP TECHNOLOGY PROCESS FLOW
With xMAP technology, you will benefit from
the ability to simultaneously quantitate up to
100 analytes in a single sample, using as little
as 25 µL.
• Speed/High Throughput:: Simultaneously
measure the concentration of a large number of
analytes, allowing you to do more faster, gaining
early and comprehensive data so critical to your
work.
• Accuracy: xMAP technology generates real-time
analysis and accurate quantification of biological
interactions.
• Reproducibility: The high-volume production of
xMAP beads allows assay standardization that
solid-phased flat arrays cannot provide.
• Instrumentation Flexibility: Millipore offers 3
instruments with 2 different types of optics:
– MAGPIX (Catalogue No. 40-043) uses
LED/CCD Camera Optics
– Luminex 200™ (Catalogue No. 40-013) uses
Lasers/APDs/PMTs Optics
– FLEXMAP® 3D (Catalogue No. 40-022) uses
Lasers/APDs/PMTs Optics
Choose the instrument that’s right for you!
Luminex xMAP Technology
3a The magnetic microspheres flow into a magnetic
chamber and are held in a monolayer with a magnet.
LEDs are focused on the chamber to illuminate the
beads, and an image is taken with a CCD camera;
2 After an analyte from a test sample is captured by the bead,
a biotinylated detection antibody is introduced. The reaction
mixture is then incubated with Streptavidin PE conjugate,
the reporter molecule, to complete the reaction on the
surface of each microsphere.
Bead #12, IL-6Bead #29, IFN-γ
Bead #56, TNF-α
16
1 Luminex uses proprietary techniques to internally color-code
microspheres with two fluorescent dyes. Through precise
concentrations of these dyes, 100 distinctly colored bead
sets can be created, each of which is coated with a specific
capture antibody.
– or – 3b the microspheres are allowed to pass rapidly through
a laser, which excites the internal dyes marking
the microsphere set. A second laser excites PE, the
fluorescent dye on the reporter molecule.

17
MILLIPLEX magYour Source for Magnetic Bead Kits
Millipore now offers two multiplex formats for
use with Luminex xMAP technology—magnetic
bead and nonmagnetic bead formats. Magnetic
polystyrene beads contain encapsulated magnetite
with bead surface chemistries that are identical
to nonmagnetic beads. New magnetic bead panels,
including neuroscience analytes, will be introduced
into our portfolio each quarter!
• Walk-away washing - Simultaneous full-plate
washing for higher throughput
• Flexible - For use with traditional vacuum
manifold/filter plates or magnetic bead washers
• Efficient - Simultaneously detect multiple analytes
in a small sample size (10-50 μL)
• Customizable - Select only the analytes you need
or choose a pre-mixed kit
• Consistent - Lower, more consistent coefficients
of variation (CVs)
• Convenient - Packaged in a single kit with a single
catalogue number
Available in November 2010!
MILLIPLEX mag Human Neurological Disorders Multiplex PanelsMillipore’s upcoming MILLIPLEX mag Human Neurological Disorders Multiplex Panels enable
scientists to simultaneously quantify multiple biomarkers with known associations to specific
neurological diseases and disorders. Even with limited amounts of sample, multiplexing can yield
faster, improved decisions about research hypotheses. Especially because many neurological
disorders involve interconnected molecular pathways, multiparametric sample analysis is
essential for successful neurology research. The magnetic bead format of Millipore’s new panels
provides the flexibility you need to efficiently run your experiments.
Visit www.millipore.com/milliplex_neuro.
17
18
Related Products
Featured Products
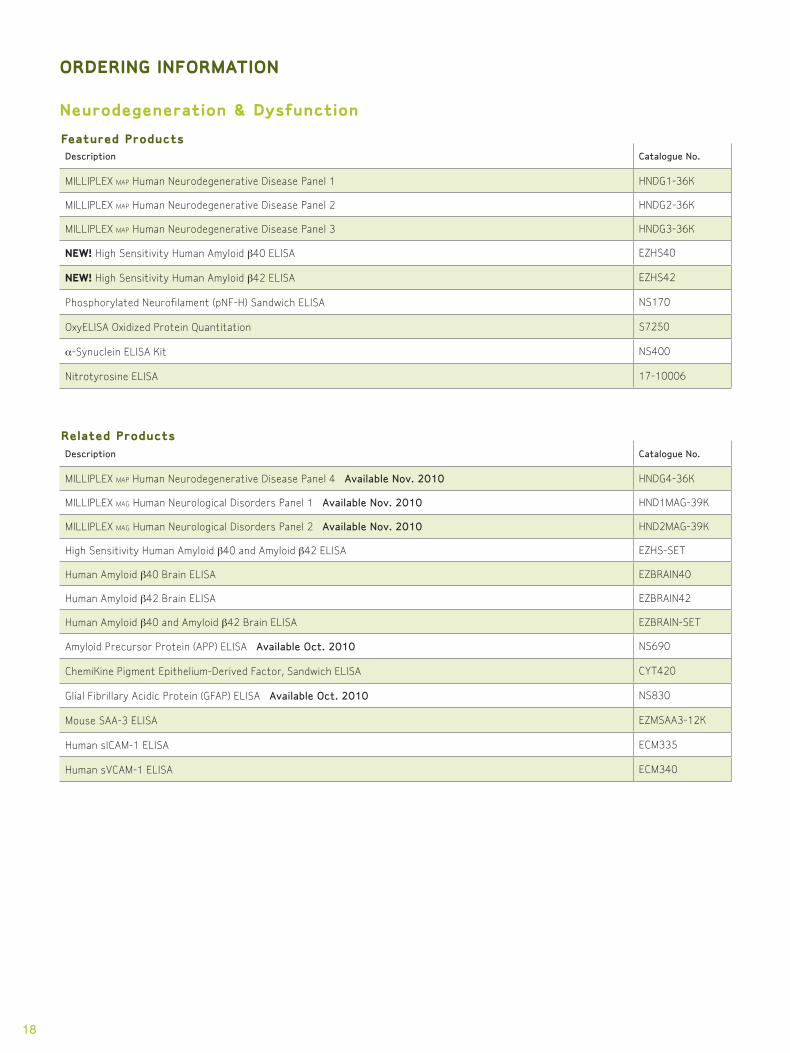
Neurodegeneration & Dysfunction
Description Catalogue No.
MILLIPLEX map Human Neurodegenerative Disease Panel 1 HNDG1-36K
MILLIPLEX map Human Neurodegenerative Disease Panel 2 HNDG2-36K
MILLIPLEX map Human Neurodegenerative Disease Panel 3 HNDG3-36K
NEW! High Sensitivity Human Amyloid β40 ELISA EZHS40
NEW! High Sensitivity Human Amyloid β42 ELISA EZHS42
Phosphorylated Neurofilament (pNF-H) Sandwich ELISA NS170
OxyELISA Oxidized Protein Quantitation S7250
a-Synuclein ELISA Kit NS400
Nitrotyrosine ELISA 17-10006
Description Catalogue No.
MILLIPLEX map Human Neurodegenerative Disease Panel 4 Available Nov. 2010 HNDG4-36K
MILLIPLEX mag Human Neurological Disorders Panel 1 Available Nov. 2010 HND1MAG-39K
MILLIPLEX mag Human Neurological Disorders Panel 2 Available Nov. 2010 HND2MAG-39K
High Sensitivity Human Amyloid β40 and Amyloid β42 ELISA EZHS-SET
Human Amyloid β40 Brain ELISA EZBRAIN40
Human Amyloid β42 Brain ELISA EZBRAIN42
Human Amyloid β40 and Amyloid β42 Brain ELISA EZBRAIN-SET
Amyloid Precursor Protein (APP) ELISA Available Oct. 2010 NS690
ChemiKine Pigment Epithelium-Derived Factor, Sandwich ELISA CYT420
Glial Fibrillary Acidic Protein (GFAP) ELISA Available Oct. 2010 NS830
Mouse SAA-3 ELISA EZMSAA3-12K
Human sICAM-1 ELISA ECM335
Human sVCAM-1 ELISA ECM340
ORDERING INFORMATION
19
For more information, please visit www.millipore.com/milliplex_neuro.These kits are for Research Use Only (RUO) and are not to be used in diagnostic procedures.
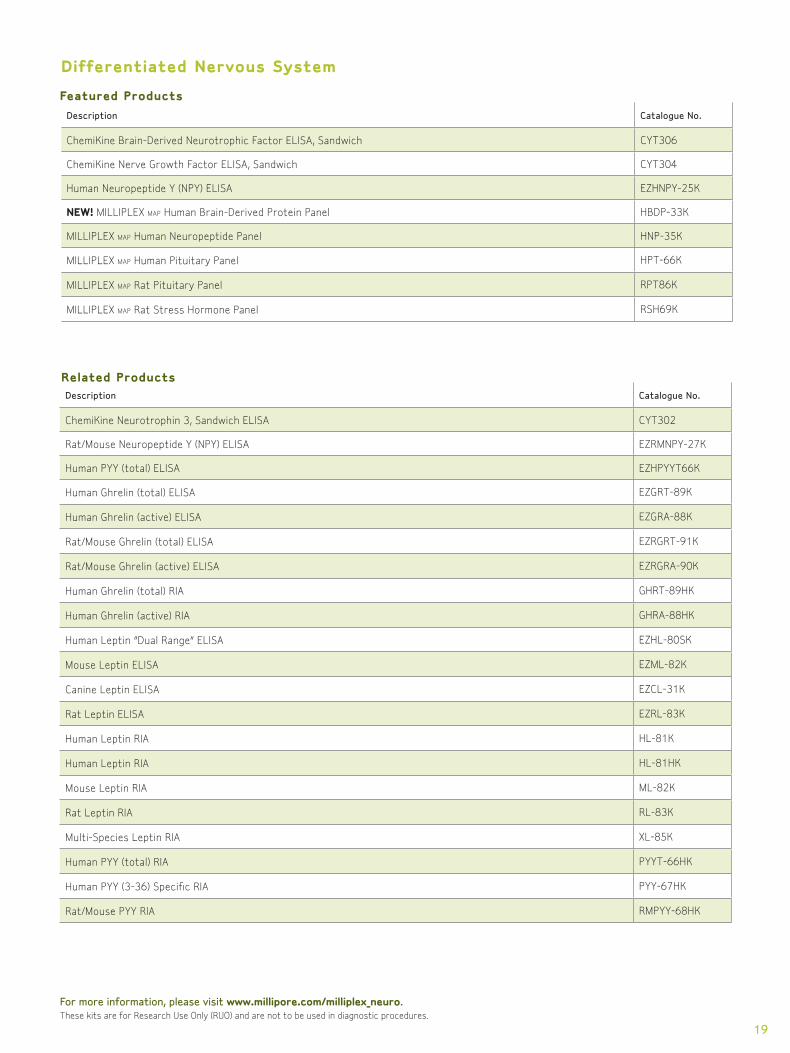
Differentiated Nervous System
Description Catalogue No.
ChemiKine Brain-Derived Neurotrophic Factor ELISA, Sandwich CYT306
ChemiKine Nerve Growth Factor ELISA, Sandwich CYT304
Human Neuropeptide Y (NPY) ELISA EZHNPY-25K
NEW! MILLIPLEX map Human Brain-Derived Protein Panel HBDP-33K
MILLIPLEX map Human Neuropeptide Panel HNP-35K
MILLIPLEX map Human Pituitary Panel HPT-66K
MILLIPLEX map Rat Pituitary Panel RPT86K
MILLIPLEX map Rat Stress Hormone Panel RSH69K
Related ProductsDescription Catalogue No.
ChemiKine Neurotrophin 3, Sandwich ELISA CYT302
Rat/Mouse Neuropeptide Y (NPY) ELISA EZRMNPY-27K
Human PYY (total) ELISA EZHPYYT66K
Human Ghrelin (total) ELISA EZGRT-89K
Human Ghrelin (active) ELISA EZGRA-88K
Rat/Mouse Ghrelin (total) ELISA EZRGRT-91K
Rat/Mouse Ghrelin (active) ELISA EZRGRA-90K
Human Ghrelin (total) RIA GHRT-89HK
Human Ghrelin (active) RIA GHRA-88HK
Human Leptin “Dual Range” ELISA EZHL-80SK
Mouse Leptin ELISA EZML-82K
Canine Leptin ELISA EZCL-31K
Rat Leptin ELISA EZRL-83K
Human Leptin RIA HL-81K
Human Leptin RIA HL-81HK
Mouse Leptin RIA ML-82K
Rat Leptin RIA RL-83K
Multi-Species Leptin RIA XL-85K
Human PYY (total) RIA PYYT-66HK
Human PYY (3-36) Specific RIA PYY-67HK
Rat/Mouse PYY RIA RMPYY-68HK
Featured Products
20
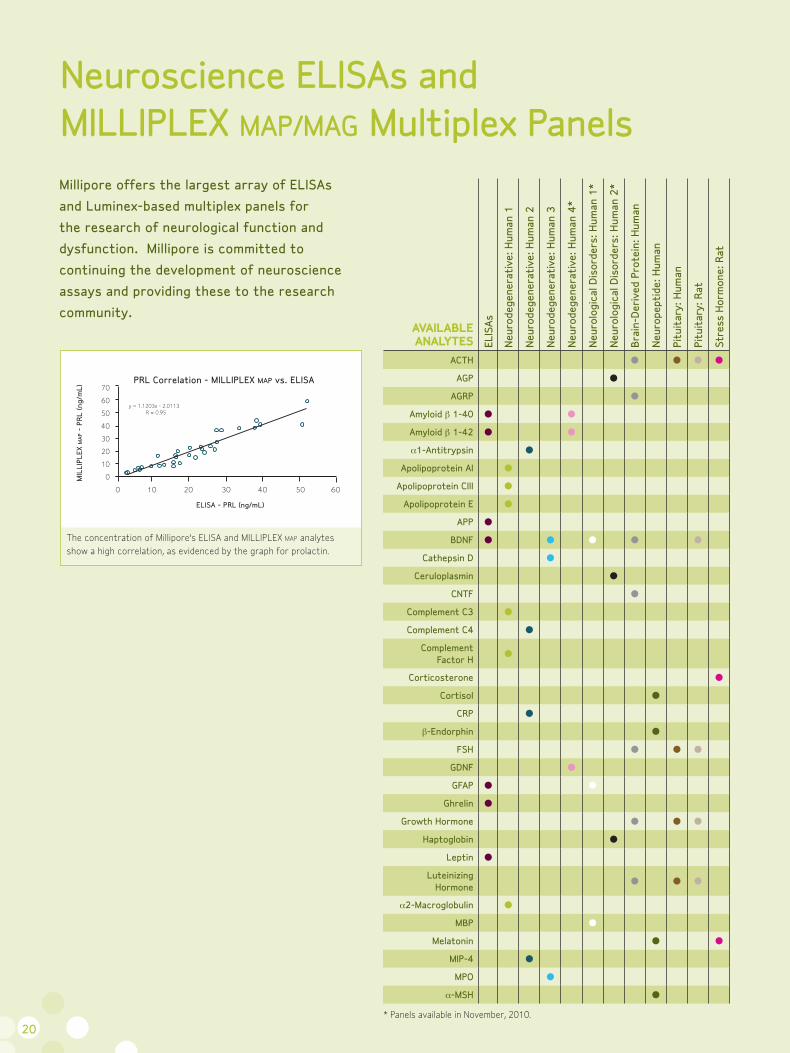
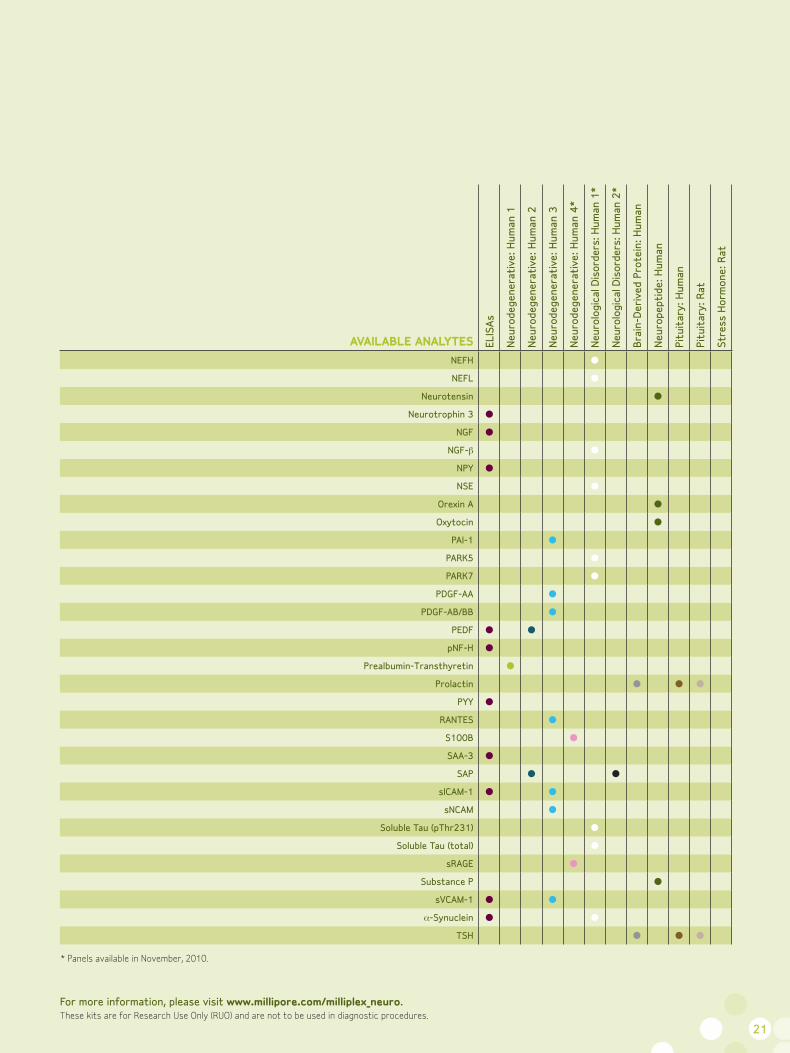
Millipore offers the largest array of ELISAs
and Luminex-based multiplex panels for
the research of neurological function and
dysfunction. Millipore is committed to
continuing the development of neuroscience
assays and providing these to the research
community.AVAILABLE ANALYTES EL
ISAs
Neu
rode
gene
rati
ve: H
uman
1
Neu
rode
gene
rati
ve: H
uman
2
Neu
rode
gene
rati
ve: H
uman
3
Neu
rode
gene
rati
ve: H
uman
4*
Neu
rolo
gica
l Dis
orde
rs: H
uman
1*
Neu
rolo
gica
l Dis
orde
rs: H
uman
2*
Bra
in-D
eriv
ed P
rote
in: H
uman
Neu
rope
ptid
e: H
uman
Pitu
itar
y: H
uman
Pitu
itar
y: R
at
Stre
ss H
orm
one:
Rat
ACTH
AGP
AGRP
Amyloid β 1-40
Amyloid β 1-42
a1-Antitrypsin
Apolipoprotein AI
Apolipoprotein CIII
Apolipoprotein E
APP
BDNF
Cathepsin D
Ceruloplasmin
CNTF
Complement C3
Complement C4
Complement Factor H
Corticosterone
Cortisol
CRP
β-Endorphin
FSH
GDNF
GFAP
Ghrelin
Growth Hormone
Haptoglobin
Leptin
Luteinizing Hormone
a2-Macroglobulin
MBP
Melatonin
MIP-4
MPO
a-MSH
20
Neuroscience ELISAs and MILLIPLEX MAP/MAG Multiplex Panels
The concentration of Millipore’s ELISA and MILLIPLEX MAP analytes
show a high correlation, as evidenced by the graph for prolactin.
A) LH Correlation - MILLIPLEX MAP vs. RIA
y = 1.4957x - 1036.2 R = 0.98 y = 10.762x - 22.28
R = 0.98
y = 2.4615x - 7211 R = 0.89
y = 0.3333x - 113.83 R = 0.85
MIL
LIPL
EX M
AP -
LH
(pg
/mL)
MIL
LIPL
EX M
AP -
ACTH
(pg
/mL)
MIL
LIPL
EX M
AP -
PR
L (n
g/m
L)M
ILLI
PLEX
MA
P -
FSH
(ng
/mL)
MIL
LIPL
EX M
AP -
FSH
(ng
/mL)
MIL
LIPL
EX M
AP -
FSH
(pg
/mL)
MIL
LIPL
EX M
AP -
PR
L (p
g/m
L)
C) ACTH Correlation - MILLIPLEX MAP vs. RIA
RIA - ACTH (pg/mL)
RIA - LH (pg/mL)
RIA - FSH (pg/mL)
RIA - PRL (pg/mL)
ELISA - PRL (ng/mL)
ELISA - FSH (ng/mL)
ELISA - FSH (ng/mL)
D) FSH Correlation - MILLIPLEX MAP vs. RIA
E) PRL Correlation - MILLIPLEX MAP vs. ELISAF) FSH Correlation (Rat Serum Samples) MILLIPLEX MAP vs. ELISA
G) FSH Correlation (Rat Plasma Samples) MILLIPLEX MAP vs. ELISA
B) PRL Correlation - MILLIPLEX MAP vs. RIA
25,000
20,000
15,000
10,000
5,000
0
1,600
1,400
1,200
1,000
800
600
400
200
0
70,000
60,000
50,000
40,000
30,000
20,000
10,000
0
140,000
120,000
100,000
80,000
60,000
40,000
20,000
0
35
30
25
20
15
10
5
0
70
60
50
40
30
20
10
0
20
15
10
5
0
0 5,000 10,000 15,000
0 1 2 3 4
0 1,000 2,000 3,000 4,000 5,000
0 10 20 30 40 50 60 0 0.5 1 1.5 2 2.5 3 3.5
0 10,000 20,000 30,000 40,000 50,000
0 2,000 4,000 6,000 8,000
y = 1.1203x - 2.0113 R = 0.95
y = 4.8624x + 0.8678 R = 0.96
y = 7.8427x + 3.2567 R = 0.95
* Panels available in November, 2010.
21
AVAILABLE ANALYTES ELIS
As
Neu
rode
gene
rati
ve: H
uman
1
Neu
rode
gene
rati
ve: H
uman
2
Neu
rode
gene
rati
ve: H
uman
3
Neu
rode
gene
rati
ve: H
uman
4*
Neu
rolo
gica
l Dis
orde
rs: H
uman
1*
Neu
rolo
gica
l Dis
orde
rs: H
uman
2*
Bra
in-D
eriv
ed P
rote
in: H
uman
Neu
rope
ptid
e: H
uman
Pitu
itar
y: H
uman
Pitu
itar
y: R
at
Stre
ss H
orm
one:
Rat
NEFH
NEFL
Neurotensin
Neurotrophin 3
NGF
NGF-β
NPY
NSE
Orexin A
Oxytocin
PAI-1
PARK5
PARK7
PDGF-AA
PDGF-AB/BB
PEDF
pNF-H
Prealbumin-Transthyretin
Prolactin
PYY
RANTES
S100B
SAA-3
SAP
sICAM-1
sNCAM
Soluble Tau (pThr231)
Soluble Tau (total)
sRAGE
Substance P
sVCAM-1
a-Synuclein
TSH
21
For more information, please visit www.millipore.com/milliplex_neuro.These kits are for Research Use Only (RUO) and are not to be used in diagnostic procedures.
* Panels available in November, 2010.
* Panels available in November, 2010.

TO PLACE AN ORDER Visit www.millipore.com/milliplex for our new MILLIPLEX MAP
online ordering system. The best way to multiplex is now
the easiest to order online.
Or call 1-800-MILLIPORE
TO RECEIVE TECHNICAL ASSISTANCEIn the U.S. and Canada, call US toll-free 1-866-441-8400, or
1-636-441-8400.
In Europe, please call Customer Service:
• France: 0825.045.645
• Spain: 900.516.645 Option 1
• Germany: 01805.045.645
• Italy: 848.845.645
• United Kingdom: 0870.900.46.45
For other countries across Europe and the world, please visit
www.millipore.com/offices
For Technical Service, please visit
www.millipore.com/techservice.
TO REQUEST A SALES REP Email: [email protected].
Millipore, Advancing Life Science Together and MILLIPLEX are registeredtrademarks of Millipore Corporation.The M mark, ChemiKine and OxyELISA are trademarks of Millipore Corporation.Luminex, FLEXMAP and xMAP are registered trademarks of Luminex Corporation.Luminex 200 is a trademark of Luminex Corporation.LumiGLO is a registered trademark of Kirkegaard & Perry Laboratories, Inc.VigeneTech is a registered trademark of VigeneTech, Inc. Lit. No. PB2673EN00 Rev. B Printed in U.S.A. and France 09/10 LS-SBU-10-03500© 2010 Millipore Corporation, Billerica, MA 01821 U.S.A. All rights reserved.
www.millipore.com/milliplex
VigeneTech


![Femtogram Electroanalytical Detection of Prostatic ...Enzyme-linked immunosorbent assays (ELISA), ... (QDs) [25], or with quantum dot functionalized graphene sheets as labels [26],](https://img.pdfslide.us/doc/110x75/607ac047dc695a764a7c4b13/femtogram-electroanalytical-detection-of-prostatic-enzyme-linked-immunosorbent.jpg)