Embed Size (px)
Citation preview

Neuronal Signals - NBDS 5161
Session 7: Detecting Events
Lectures can be downloaded from
http://hayar.net/NBDS5161
Abdallah HAYAR

Updated Tentative Schedule for Neuronal Signals (NBDS 5161)
One Credit–Hour, Summer 2010
Location: Biomedical Research Building II, 6th floor, conference room,
Time: 9:00 -10:20 am
Session Day Date Topic Instructor
1 Tue 6/1 Design of an electrophysiology setup Hayar
2 Thu 6/3 Neural population recordings Hayar
3 Thu 6/10 Single cell recordings Hayar
4 Fri 6/11 Analyzing synaptic activity Hayar
5 Mon 6/14 Data acquisition and analysis Hayar
6 Wed 6/16 Analyzing and plotting data using OriginLab Hayar
7 Fri 6/18 Detecting electrophysiological events Hayar
8 Mon 6/21 Writing algorithms in OriginLab® Hayar
9 Wed 6/23 Imaging neuronal activity Hayar
10
Fri
6/25
Laboratory demonstration of an electrophysiology and imaging experiment
Hayar
11 Fri 7/9 Article presentation I: Electrophysiology Hayar
12 Mon 7/12 Article presentation II: Imaging Hayar
13 Wed 7/14 Exam and students’ survey about the course Hayar

Student List
Name E-mail Regular/Auditor Department Position
1 Simon, Christen [email protected] Regular
(form signed)
Neurobiology &
Developmental Sciences
Graduate Neurobiology –
Mentor: Dr. Garcia-Rill
2 Kezunovic, Nebojsa [email protected] Regular
(form signed)
Neurobiology &
Developmental Sciences
Graduate Neurobiology –
Mentor: Dr. Garcia-Rill
3 Hyde, James R [email protected] Regular (form signed)
Neurobiology & Developmental Sciences
Graduate Neurobiology – Mentor: Dr. Garcia-Rill
4 Yadlapalli, Krishnapraveen
[email protected] Regular (form signed)
Pediatrics Research Technologist – Mentor: Dr. Alchaer
5 Pathan, Asif [email protected] Regular
(form signed)
Pharmacology & Toxicology Graduate Pharmacology –
Mentor: Dr. Rusch
6 Kharade, Sujay [email protected] Regular
(form signed)
Pharmacology & Toxicology Graduate Pharmacology –
4th year - Mentor: Dr. Rusch
7 Howell, Matthew [email protected] Regular (form signed)
Pharmacology & Toxicology Graduate Interdisciplinary Toxicology - 3
rd year -
Mentor: Dr. Gottschall
8 Beck, Paige B [email protected] Regular (form signed)
College of Medicine Medical Student – 2nd
Year - Mentor: Dr. Garcia-Rill
9 Atcherson, Samuel R [email protected] Auditor (form signed)
Audiology & Speech Pathology
Assistant Professor
10 Detweiler, Neil D [email protected] Auditor (form not signed)
Pharmacology & Toxicology Graduate Pharmacology –1
st year
11 Thakali, Keshari M [email protected] Unofficial auditor Pharmacology & Toxicology Postdoctoral Fellow –
Mentor: Dr. Rusch
12 Boursoulian, Feras [email protected] Unofficial auditor Neurobiology & Developmental Sciences
Postdoctoral Fellow – Mentor: Dr. Hayar
13 Steele, James S [email protected] Unofficial auditor College of Medicine Medical Student – 1st Year –
Mentor: Dr. Hayar
14 Smith, Kristen M [email protected] Unofficial auditor Neurobiology &
Developmental Sciences
Research Technologist –
Mentor: Dr. Garcia-Rill
15 Gruenwald, Konstantin [email protected] Unofficial auditor Neurobiology &
Developmental Sciences
High school Student –
Mentor: Dr. Hayar
16 Rhee, Sung [email protected] Unofficial auditor Pharmacology & Toxicology Assistant Professor
17 Light, Kim E [email protected] Unofficial auditor Pharmaceutical Sciences Professor
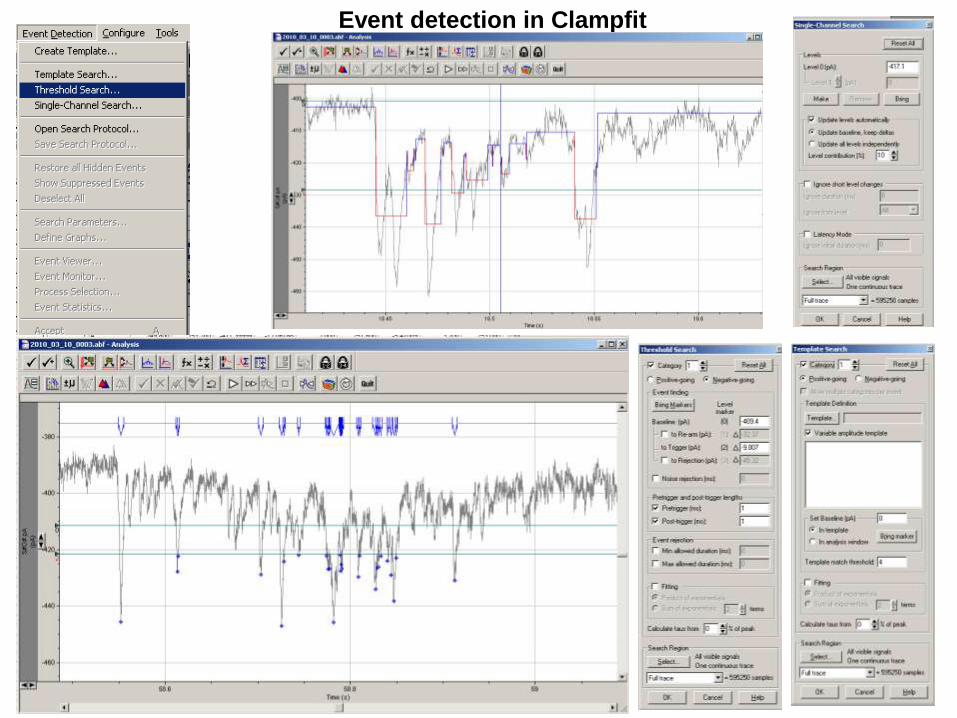
Event detection in Clampfit

Synaptosft, Inc.
3098 Anderson Place, Decatur, GA 30033, USA
Tel: 770-939-4366 Fax: 770-939-9478
http://www.synaptosoft.com/
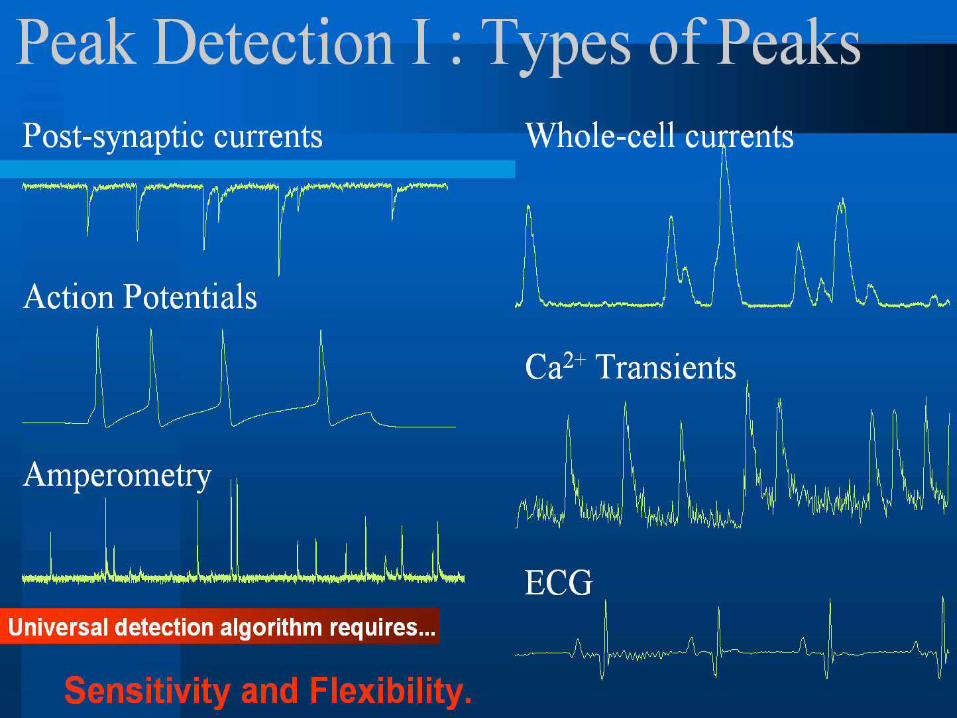
Event Detection


Single peak
Double peakVarious file formats are converted
-Binary files (Pulse dat, Igor wave, Tida, Chart, etc.)
-ASCII (tab delimited text, Ca2+ imaging)
Unifying file format – ABF
-File header: 2048 bytes
-Data block: 16 bit integer (2 byte) array.
Data Conversion: by ABF Utility
http://www.synaptosoft.com/MiniAnalysis/Tutorial
Convert pclamp10 to pclamp9 so that it can be read by
MiniAnalysis Program: File-Save as- Type ABF 1.8 (integer)

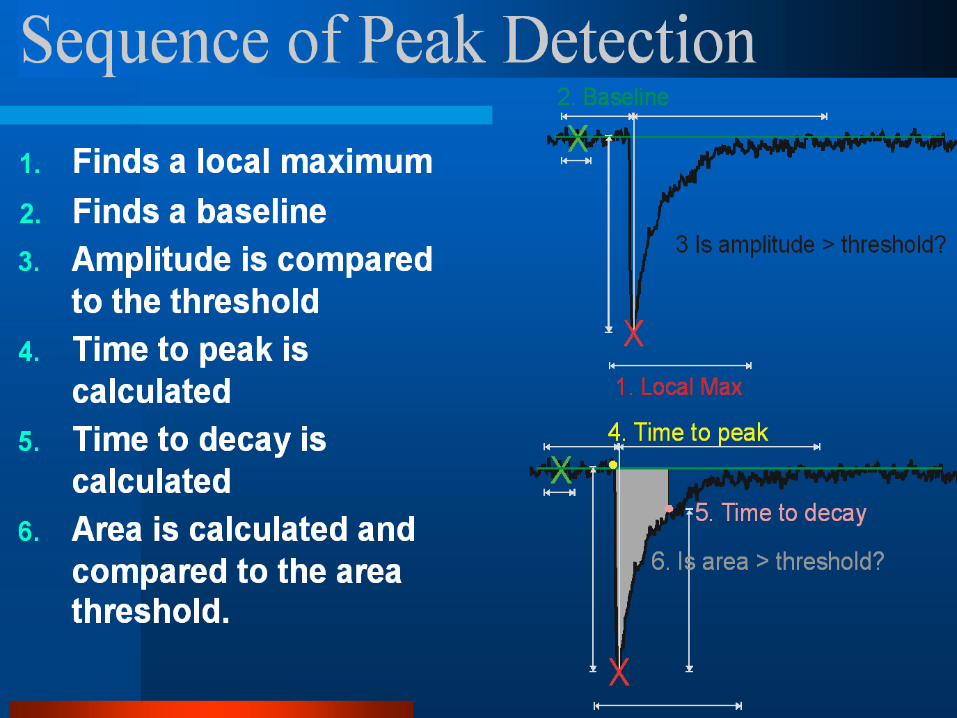
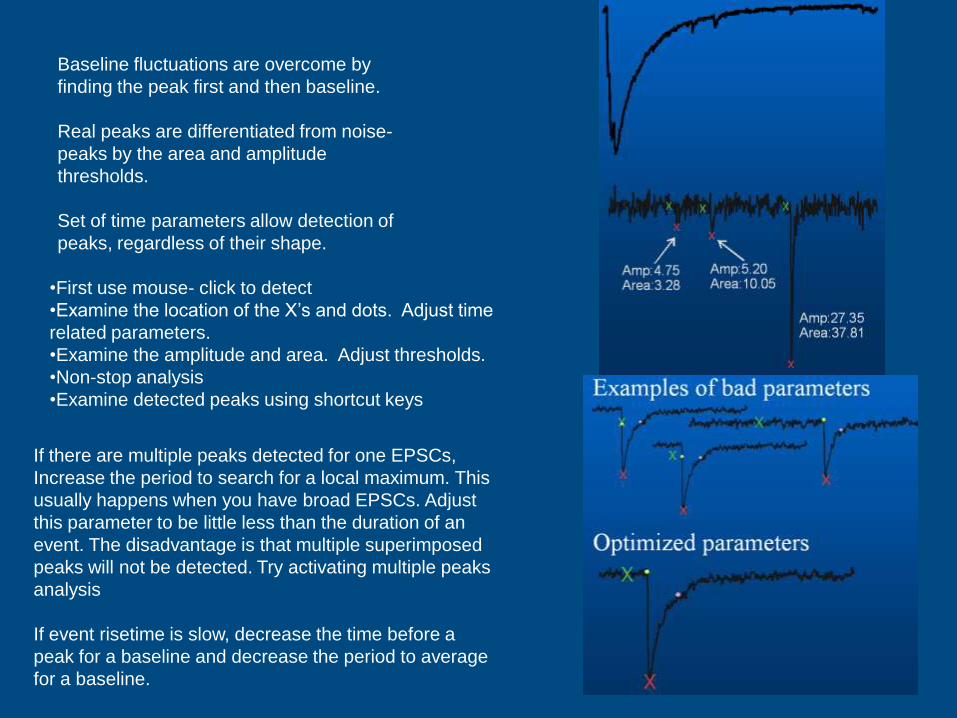
Baseline fluctuations are overcome by
finding the peak first and then baseline.
Real peaks are differentiated from noise-
peaks by the area and amplitude
thresholds.
Set of time parameters allow detection of
peaks, regardless of their shape.
•First use mouse- click to detect
•Examine the location of the X’s and dots. Adjust time
related parameters.
•Examine the amplitude and area. Adjust thresholds.
•Non-stop analysis
•Examine detected peaks using shortcut keys
If there are multiple peaks detected for one EPSCs,
Increase the period to search for a local maximum. This
usually happens when you have broad EPSCs. Adjust
this parameter to be little less than the duration of an
event. The disadvantage is that multiple superimposed
peaks will not be detected. Try activating multiple peaks
analysis
If event risetime is slow, decrease the time before a
peak for a baseline and decrease the period to average
for a baseline.


Event Detection

Peristimulus Time Histogram (PSTH)
ON stimulation causes synchronous burst oscillations in ET cellsPSTH are histograms of the times at which neurons fire. They are used to visualize the rate and timing of neuronal spike
discharges in relation to an external stimulus or event.

Event autocorrelograms can be used to study regularity

Event autocorrelograms can be used for burst analysis

Event Crosscorrelogram vs. Wave Crosscorrelogram

Events (spikes, EPSCs) cross-correlograms: Normalization and significance

Synchrony decreases as a function of distance

Events Crosscorrelogram: Spikes- Spikes
Events Crosscorrelogram: EPSCs - EPSCs

Events Crosscorrelogram: Spikes - EPSCs

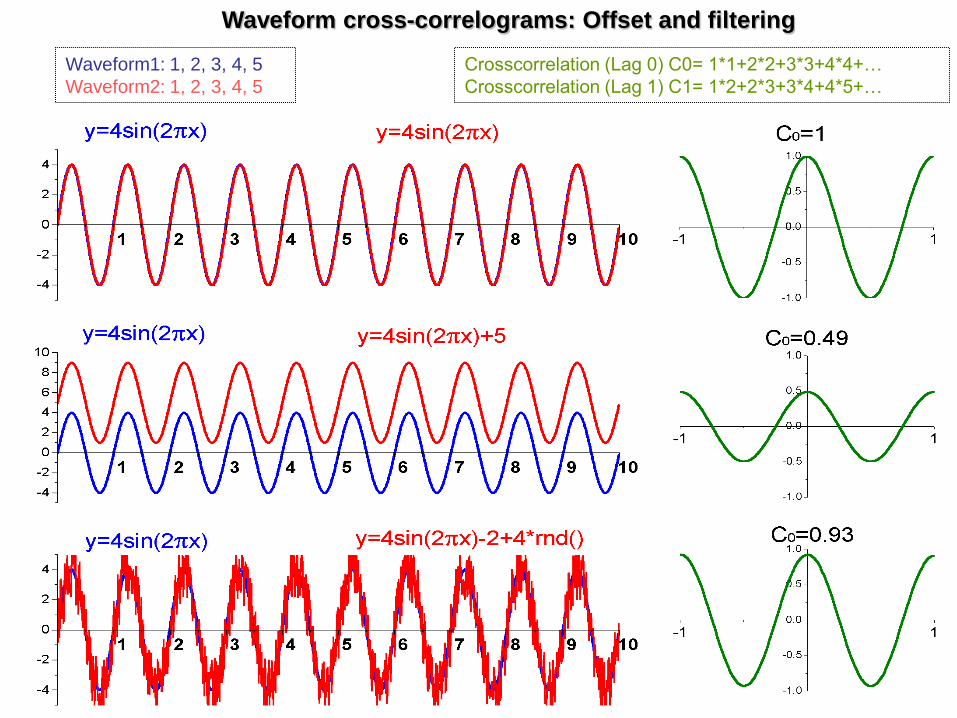
Waveform cross-correlograms: Offset and filtering
Waveform1: 1, 2, 3, 4, 5
Waveform2: 1, 2, 3, 4, 5
Crosscorrelation (Lag 0) C0= 1*1+2*2+3*3+4*4+…
Crosscorrelation (Lag 1) C1= 1*2+2*3+3*4+4*5+…
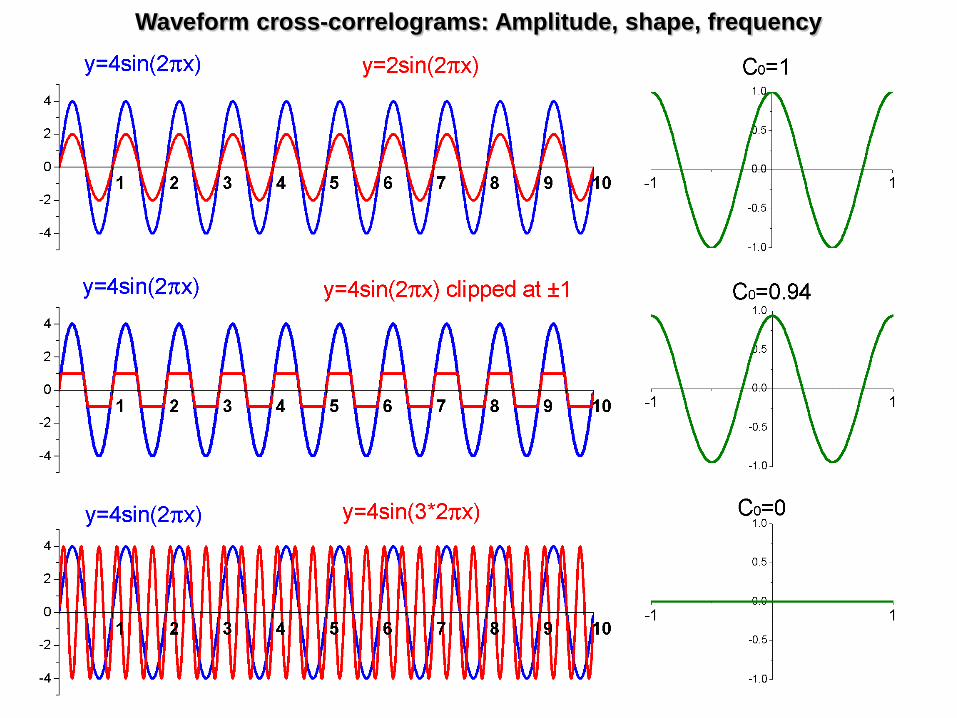
Waveform cross-correlograms: Amplitude, shape, frequency

Waveform cross-correlograms: Phase-shift
Waveform1: 1, 2, 3, 4,
5
Waveform2: 1, 2, 3, 4,
5
Crosscorrelation (Lag 0) C0=
1*1+2*2+3*3+4*4+…
Crosscorrelation (Lag 1) C1=
1*2+2*3+3*4+4*5+…

Bursting is highly synchronous among ET cells the same glomerulus


ET cell bursting coordinate tufted/mitral cell spiking

Frequency is the number of
occurrences of a repeating event
per unit time.
A periodic function is a function that
repeats its values in regular intervals
or periods.

The fundamental tone, abbreviated f0 or F0, is
the lowest frequency in a harmonic series.
The fundamental frequency of a periodic signal is
the inverse of the period length.
The period is, in turn, the smallest repeating unit
of a signal. One period thus describes the
periodic signal completely.
The significance of defining the period as the
smallest repeating unit can be appreciated by
noting that two or more concatenated periods
form a repeating pattern in the signal. However,
the concatenated signal unit obviously contains
redundant information.
The fundamental frequency is the lowest
frequency component of a signal that excites
(imparts energy) to a system.
In terms of a superposition of sinusoids (for
example, fourier series), the fundamental
frequency is the lowest frequency sinusoidal in
the sum.

Superposition of sinusoidal wave basis
functions (bottom) to form a sawtooth
wave (top); the basis functions have
wavelengths λ/k (k = integer) shorter
than the wavelength λ of the sawtooth
itself (except for k = 1).
The additive synthesis of a square wave
with an increasing number of harmonics
The convention is that a sawtooth wave
ramps upward and then sharply drops.
Fourier series decomposes a periodic function
or periodic signal into a sum of simple
oscillating functions, namely sines and cosines

The power spectrum or
frequency spectrum is a
simple way of showing the
total amplitude at each of
frequency; it is calculated as
the square root of the sum of
the squares of the coefficients
of the sine and cosine
components.
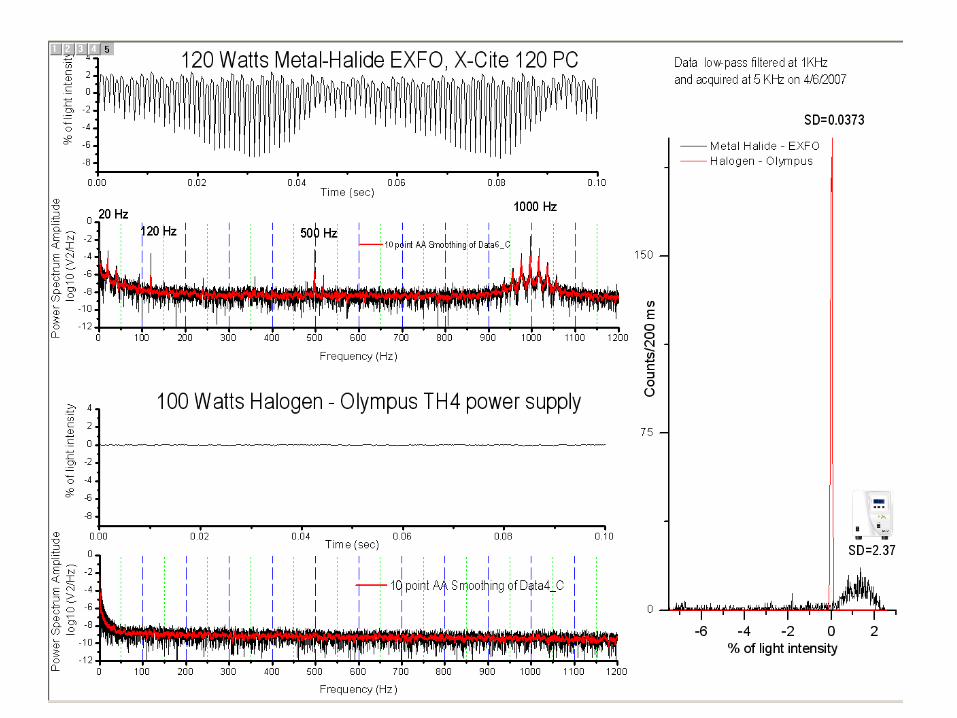
The signal on the left (x = time; y = voltage), which was expected to contain a single peak, is clearly very noisy. The power
spectrum of this signal (x-axis = frequency in Hz) shows a strong component at 60 Hz, suggesting that much of the noise
is caused by stray pick-up from the 60 Hz power line. The smaller peak at 120 Hz (the second harmonic of 60 Hz)
probably comes from the same source.
The units of the x-axis of the power spectrum are simply the reciprocal of the units of the x-axis of the original signal (e.g.
sec-1 = Hz for a signal whose x-axis is in sec).
It is possible to analyze any arbitrary set of data into periodic components, whether or not the data appear periodic.
Harmonic analysis is conventionally based on the Fourier transform, which is a way of expressing a signal as a sum of
sine and cosine waves.
Any arbitrary discretely sampled signal can be described completely by the sum of a finite number of sine and cosine
components whose frequencies are 0,1,2,3 ... n/2 times the fundamental frequency f=1/nx, where x is the interval
between adjacent x-axis values and n is the total number of points. The Fourier transform is simply the coefficients of
these sine and cosine components.
For example if you have a trace of 2 sec sampled at 1 kHz (n=2000 points- duration of each point: x=1 ms),
The fundamental frequency f=1/nx = 1/ (2000 X 0.001sec) =1/2 =0.5 Hz
The power spectrum will be from 0, 0.5,1, 1.5, 2, 2.5,……., n/2=1000 Hz


Autocorrelation and crosscorrelation in Clampfit