Embed Size (px)
Citation preview
HAL Id: insu-00854043https://hal-insu.archives-ouvertes.fr/insu-00854043
Submitted on 26 Mar 2021
HAL is a multi-disciplinary open accessarchive for the deposit and dissemination of sci-entific research documents, whether they are pub-lished or not. The documents may come fromteaching and research institutions in France orabroad, or from public or private research centers.
L’archive ouverte pluridisciplinaire HAL, estdestinée au dépôt et à la diffusion de documentsscientifiques de niveau recherche, publiés ou non,émanant des établissements d’enseignement et derecherche français ou étrangers, des laboratoirespublics ou privés.
Detecting climatic signals in an anthropogenicallydisturbed catchment: The late-Holocene record from the
Petit Lac d’Annecy, French Alps.Richard T. Jones, Liam J. Reinhardt, John A. Dearing, Darren Crook,
Richard C. Chiverrell, Katharine Welsh, Elisabeth Lallier-Vergès
To cite this version:Richard T. Jones, Liam J. Reinhardt, John A. Dearing, Darren Crook, Richard C. Chiverrell, et al..Detecting climatic signals in an anthropogenically disturbed catchment: The late-Holocene recordfrom the Petit Lac d’Annecy, French Alps.. The Holocene, London: Sage, 2013, 23 (9), pp.1329-1339.�10.1177/0959683613486940�. �insu-00854043�

ORE Open Research Exeter
TITLE
Detecting climatic signals in an anthropogenically disturbed catchment: The late-Holocene record fromthe Petit Lac d'Annecy, French Alps
AUTHORS
Jones, RT; Reinhardt, LJ; Dearing, JA; et al.
JOURNAL
Holocene
DEPOSITED IN ORE
13 February 2018
This version available at
http://hdl.handle.net/10871/31469
COPYRIGHT AND REUSE
Open Research Exeter makes this work available in accordance with publisher policies.
A NOTE ON VERSIONS
The version presented here may differ from the published version. If citing, you are advised to consult the published version for pagination, volume/issue and date ofpublication

For Peer Review
Detecting climatic signals in an anthropogenically disturbed
catchment : The Late Holocene record from the Lac d’Annecy.
Journal: The Holocene
Manuscript ID: HOL-12-0038.R1
Manuscript Type: Paper
Date Submitted by the Author: n/a
Complete List of Authors: Jones, Richard; University of Exeter, Geography Reinhardt, Liam; University of Exeter, Geography Dearing, John; University of Southampton, School of Geography; Crook, Darren; University of Hertfordshire, Geography Chiverrell, Richard; University of Liverpool, Geography Welsh, Katharine; University of Chester, Geography Verges, Elisabeth; CNRS, Matière Organique
Keywords: Lac d’Annecy, sedimentation rates, anthropocene, soil erosion, landscape dynamics, signal shredding
Abstract:
Historical and documentary records from the Lac d’Annecy, indicate that human activities have been the dominant ‘geomorphic process’ shaping the catchment during the late Holocene, with deforestation, agriculture and artificial drainage profoundly affecting both the pace and spatial distribution of soil erosion. The impact of past climatic change on the evolution of the catchment is less certain due to the lack of long-term climate records for the site. Previous attempts to use the sediment record from the lake to investigate the role past climate change may have played was hampered by the difficulty in isolating and disentangling the climatic signal preserved within the archive due to overprinting of human activity. This is a common problem in regions with a long history of human activity in the landscape. In this study we use a range of advanced statistical techniques to assess the relative importance of climate in driving landscape dynamics. The statistical analysis is carried out on an updated high-resolution palaeo-environmental data set from the Petit Lac. The results of the statistical analysis indicate for the first time that regional climate phenomena such as the Atlantic multi-decadal oscillation are partly responsible for landscape dynamics at Lac d‘Annecy throughout the late Holocene. We find that the Lac d‘Annecy landscape typically requires decades, or longer, to respond to changes in precipitation, reflecting the stochastic nature of river sediment storage and transport. The use of a 4 year integrated lake core records effectively attenuates the ‘signal shredding’ effect of shorter-term internally generated sediment transport processes. Nonetheless, the lake record of climatically-induced geormorphic process-responses is weak compared to the pervasive impact of human activities.
http://mc.manuscriptcentral.com/holocene
HOLOCENE

For Peer Review
Page 1 of 35
http://mc.manuscriptcentral.com/holocene
HOLOCENE
123456789101112131415161718192021222324252627282930313233343536373839404142434445464748495051525354555657585960

For Peer Review
Detecting climatic signals in an anthropogenically disturbed catchment : The Late
Holocene record from the Lac d’Annecy
Jones R.T.1, Reinhardt LW.
1, Dearing, J.A.
2 Crook D
3, Chiverrell, R.
4 Welsh. K
5, Verges, E
6.
1Geography, College of Life and Environmental Science, University of Exeter, Exeter, EX4 4RJ,
UK.
2Geography and Environment, University of Southampton, SO17 1BJ, UK
3Department of Geography, University of Hertfordshire, Herts, AL10 9AB, UK.
4Department of Geography, University of Liverpool, Liverpool, L69 7ZT, UK.
5Department of Geography and Development Studies, University of Chester, Chester, CH1 4BJ,
UK
6Institut des Sciences de la Terre d'Orléans - ISTO, Université Orléans, France.
Abstract
Historical and documentary records from the Lac d’Annecy, indicate that human activities have
been the dominant ‘geomorphic process’ shaping the catchment during the late Holocene, with
deforestation, agriculture and artificial drainage profoundly affecting both the pace and spatial
distribution of soil erosion. The impact of past climatic change on the evolution of the catchment
is less certain due to the lack of long-term climate records for the site. Previous attempts to use
the sediment record from the lake to investigate the role past climate change may have played
was hampered by the difficulty in isolating and disentangling the climatic signal preserved within
the archive due to overprinting of human activity. This is a common problem in regions with a
Page 2 of 35
http://mc.manuscriptcentral.com/holocene
HOLOCENE
123456789101112131415161718192021222324252627282930313233343536373839404142434445464748495051525354555657585960

For Peer Review
long history of human activity in the landscape. In this study we use a range of advanced
statistical techniques to assess the relative importance of climate in driving landscape dynamics.
The statistical analysis is carried out on an updated high-resolution palaeo-environmental data set
from the Petit Lac. The results of the statistical analysis indicate for the first time that regional
climate phenomena such as the Atlantic multi-decadal oscillation are partly responsible for
landscape dynamics at Lac d‘Annecy throughout the late Holocene. We find that the Lac
d‘Annecy landscape typically requires decades, or longer, to respond to changes in precipitation,
reflecting the stochastic nature of river sediment storage and transport. The use of a 4 year
integrated lake core records effectively attenuates the ‘signal shredding’ effect of shorter-term
internally generated sediment transport processes. Nonetheless, the lake record of climatically-
induced geormorphic process-responses is weak compared to the pervasive impact of human
activities.
Keywords
Lac d’Annecy, sedimentation rates, anthropocene, soil erosion, signal shredding, lake-catchment
Page 3 of 35
http://mc.manuscriptcentral.com/holocene
HOLOCENE
123456789101112131415161718192021222324252627282930313233343536373839404142434445464748495051525354555657585960

For Peer Review
Introduction
The post-glacial period is characterised by significant changes in climate, changes that are now
accelerating due to human activities. Until recently it was widely accepted that researchers could
observe the impact of these changes in the sediment record; indeed this is the basis of much
palaeo-environmental research (e.g. Dearing and Oldfield 2002; Dearing and Jones 2003; Dearing
et al., 2006). However, this simple relationship between climatic-cause and depositional-effect
has been challenged in various modelling studies (Dearing and Zolitschka 1999; Jerolmack and
Paola, 2010; Coulthard and Van de Wiel 2007; Van de Wiel and Coulthard, 2010; Ganti et al.,
2011). These studies argue that sediment transport through catchments is controlled by internally
generated critically self-organised (SOC) processes that act as non-linear filters that ‘shred’
externally generated signals such as climate change. Part of this filtering process is the ‘smearing’
effect of stochastic sediment transport. Rivers typically respond to periods of accelerated erosion
through increasing local deposition that can persist for decades or even centuries in the case of
large landslides. Depending on a host of climatic and tectonic factors these deposits are gradually
eroded and transported out of the system but this too can take centuries (Benda and Dunne, 1997).
Thus stochastic sediment transport may lead to a pattern of lake sedimentation that simply reflects
the internal dynamics of a catchment rather than environmental conditions (Coulthard and Van de
Wiel 2007; Van de Wiel and Coulthard, 2010). Also critical is the magnitude of the climate or
environmental signal. Signals of sufficient magnitude or sufficiently low frequency should be
preserved in the stratigraphic record (Jerolmack and Paola, 2010) though what constitutes ‘low’
frequency remains ambiguous as ‘signal shredding’ has only been explored in unscaled or short-
term (daily) numerical and physical models (Coulthard and Van de Wiel 2007; Van de Wiel and
Coulthard, 2010; Jeromack and Paola, 2010). In recent centuries (and perhaps millennia) a far
more pervasive and intensive unnatural ‘signal filtering’ mechanism has arisen, namely human
Page 4 of 35
http://mc.manuscriptcentral.com/holocene
HOLOCENE
123456789101112131415161718192021222324252627282930313233343536373839404142434445464748495051525354555657585960

For Peer Review
land-use. Activities such as agriculture and mining are now the dominant mechanisms of erosion
and sediment transport worldwide (Hooke, 2000; Wilkinson and McElroy, 2007; Reinhardt et al.,
2010). It seems logical to assume that human activities will also ‘shred’ environmental signals but
exactly how and over what timescales is unknown.
Here we attempt to discern a climate signal from lake sediment proxies of geomorphic
processes in the Lac d’Annecy catchment which has been subject to varying landuse over the late
Holocene in order to explore whether non-linear geomorphic processes are as pervasive a signal
shredding mechanism as recently claimed. The impact of land use change on geomorphic
processes is already well established for this catchment (Dearing, 1979, 2001; Higgitt et al., 1991;
Thorndycraft et al., 1998; Crook et al., 2002, 2004, 2011; Foster et al., 2003; Dearing et al.,
2001;Noel et al., 2001) but previous studies have been unable to discern the impact of climate
change in the lake sediment record. Here we analyze a new high-resolution dataset and apply a
novel statistical approach to identify the impact of precipitation change in driving catchment
dynamics during the late Holocene. We focus on precipitation as our climate proxy because data
is available for the late Holocene and it is the climatic forcing mechanism most closely associated
with the (non-linear) processes of sediment transport and deposition in a catchment.
The Petit Lac d’Annecy catchment
The Lac d'Annecy is located in the Haute Savoie region of Eastern France (Lat 45°48’N;
Long 6°8’E) within the foreland of the French Alps (Figure 1). The lake is oligotrophic and lies at
an altitude of 460 m, within a traverse tectonic valley that reaches a maximum altitude of ~2250
m. The lake consists of two basins the Grand Lac (20.25 km2) and Petit Lac (6.25 km
2), which
have a combined surface area of ~26.5 km2 and a catchment area of ~ 251 km
2. The Petit lac is
fed by three main river systems that drain across an extensive floodplain; the Bornette, the Ire and
Eau Morte-St Ruph. The Eau Morte is the largest of the three draining ~ 54% of the Petit Lac
catchment, with an altitudinal drop of ~ 1800m (Foster et al 2003). Precipitation in the catchment,
Page 5 of 35
http://mc.manuscriptcentral.com/holocene
HOLOCENE
123456789101112131415161718192021222324252627282930313233343536373839404142434445464748495051525354555657585960
For Peer Review
while highly variable is not seasonal, with mean monthly values (over the past 321 years) ranging
between 0 mm and 228 mm, alongside a few exceptional months beyond this range (Figure 2:
Casty et al, 2005). Mean (monthly) temperatures are seasonally variable ranging between a
summer high of 20°C and winter low of -7°C. Only January has a median monthly temperature
below zero. Thus there is a short winter period when precipitation falls primarily as snow, with a
strong dependency upon elevation.
An Environmental History of the Lac d'Annecy catchment
The Lac d'Annecy catchment has been permanently occupied since the Neolithic with
only sporadic occupation prior to this (Crook et al., 2004; Della Casa, 2005). A progressive
increase in human activity resulted in significant changes to the hydro-geomorphic system
through a combination of land cover change and river channel/floodplain modifications (e.g.
Crook et al., 2004; Dearing et al., 2001). The initial phase of agricultural development spans the
Bronze, Iron and Roman periods and is characterised by lowland crop production and forest
clearance at both low and high altitude (Crook et al., 2004, 2011). The onset of upland forest
clearance is linked to the development of high altitude alpages for grazing starting in the Bronze /
Iron Age (Crook et al., 2011). A similar pattern of upland clearance is recorded at upland sites
across the European Alps at this time (e.g. Carrier 1932; Wick and Tinner 1997; Tinner et al.,
1999; Rösch et al., 1998; Gobet et al., 2003; Wick et al., 2003), where it is often coincident with
enhanced soil erosion as a result of the fragile nature of the soils at this altitude (e.g. Crook et al.,
2004 ; Jacob et al., 2009).
Upland destablisation is seen to intensify with the onset of the Roman period (~120 BC
and 260 AD) and the development of upland villa complexes that would later form into
communes, such as the Sextinacus Villa, that is now the commune of Seythenex (Crook et al.,
2004). In the lowlands the intensification of agricultural production necessitated the large-scale
drainage of marshland for farming, with the Romans focusing initially on the Eau Morte flood
Page 6 of 35
http://mc.manuscriptcentral.com/holocene
HOLOCENE
123456789101112131415161718192021222324252627282930313233343536373839404142434445464748495051525354555657585960
For Peer Review
plain (e.g. Boisonnade 1937; Crook et al., 2004). The intensity of agricultural activity increases
significantly during the Carolingian Dynastic period (~ 500 – ~1000 AD) with the building of a
Benedictine Monastery at Talloires in AD 879. The Cistercians followed in AD 1132,
establishinga monastery at Tame. A key feature of both monastic orders was the exploitation of
land for agricultural use (Grande and Delatouche 1950; Crook et al., 2004). The Benedictines
were the first group to actively clear and develop the uplands for summer grazing across what is
now the Parish of Montmin. The Cistercians followed a similar pattern opening up the upland
areas across the west of the catchment for agro-pastoral activities and settlement (Crook et al.,
2004). Despite the loss of a significant area of upland forest, the environmental impact is thought
to have been minimal as a result of the approach that the monasteries took to farming; particularly
their attempts to retain soil fertility and reduce erosion rates (Crook et al., 2004).
With the transition into the Middle Ages (~1000 - 1450 AD), the monastic approach to
farming proved untenable. A rapidly expanding catchment population led to the development of
marginal land across the catchment, kick-starting a long term trend of accelerating environmental
degradation (Crook et al., 2002; 2004). Soil erosion became a widespread issue across the
uplands, whilst on the valley floor a rapid decline in soil fertility was noted (Crook et al., 2004).
A combination of plagues, wars and deteriorating climatic conditions led to several phases of
reduced population pressure throughout the 15th Century. The net effect was a contraction in
agricultural lands, reduced agricultural output and the abandonment of marginal land in the
catchment. In many areas erosion rates declined and soil fertility increased (Crook et al., 2004).
The Catchment population continued to fluctuate throughout the Savoy Period (~AD 1450 –
1860), with similar consequences.
Environmental pressures peaked again in the 18th Century, when arable farming fell into
decline, with reduced soil fertility, increased flood damage and further land abandonment.
Historical records point to widespread evidence for increased flooding and soil degradation across
the catchment over the next 200 years (Crook et al., 2002, 2004, 2011; Mougin, 1914). The
Page 7 of 35
http://mc.manuscriptcentral.com/holocene
HOLOCENE
123456789101112131415161718192021222324252627282930313233343536373839404142434445464748495051525354555657585960

For Peer Review
impact of flooding across the catchment was exacerbated by continued clear-felling across the
catchment, a practice that peaked in 1840 AD when forest cover declined to < 3500 ha from a
high of 6157 ha in 1730 (Crook et al., 2002, 2004).
By the start of the 20th Century, successive flood remediation schemes had modified all
three river systems and many of the upland torrent systems, which had either been straightened,
deepened and where necessary dyked (e.g. Crook et al., 2002, 2011). The main river systems are
now confined in their lower reaches; with reduced storage capacity across the floodplain and
overbank deposition minimal. As a result the majority of the river sediment load is deposited
directly into the lake (e.g. Dearing et al., 2001; Stanley and Jorstad 2004; Welsh et al., 2009;
Crook et al., 2011). Over this same time period, forest cover has increased dramatically from
1850 AD onwards with the area of modern forest cover equal to the levels recorded in the AD
1730 survey (Crook et al., 2002); an example of a modern forest transition in a high-income
country (Lambin and Meyfroidt, 2010).
Today, the modern environment is under increasing pressure from farmers, foresters,
tourism and the leisure industry that frequently have mutually incompatible aims for
development. The environmental stress points have shifted away from geomorphic processes and
flood control to maintaining water quality as the result of nutrient enrichment from agricultural
intensification and domestic and industrial effluent. Despite the size of the lake, the increase in
nutrient enrichment after AD 1900 was significant enough to impact the structure of planktonic
food webs in the lake (e.g. Pergaet al., 2012). Although compared to a number of other large
alpine lakes, Annecy is still one of the cleanest lakes in the region due to careful water
management (Kaiblingeret al., 2009).
Methodology
The proxy sediment record
This study is based in part on the existing proxy record for LA13, a 8.15m Kullenberg sediment
Page 8 of 35
http://mc.manuscriptcentral.com/holocene
HOLOCENE
123456789101112131415161718192021222324252627282930313233343536373839404142434445464748495051525354555657585960

For Peer Review
core recovered from the centre of the Petit Lac (Dearing et al 2001; Noel et al 2001). The upper
most sediment record was not recovered in LA13 and the last few centuries of the record were
lost. To extend the record through to the present day, the LA13 record was combined with a short
overlapping sequence (SCLA13, 0.7m), recovered at the same time as the long core but was not
used in the previously published study. The two cores were cross-correlated on the basis of their
mineral magnetic records to produce a composite core record (LA13C) of 8.55 m.
The range of analyses carried out on LA13 by Dearing et al., (2001) and Noel et
al.,(2001) were replicated for SCLA13. All sub-samples were weighed prior to freeze-drying to
calculate down core variation in water loss and bulk density. A full suite of magnetic
measurements was then undertaken following Walden et al., (1999). Magnetisation and
remanence measurements were carried out on a Molspin vibrating magnetometer (VSM) using
the LOOP 2 routine at low (1mT and 5mT) and high (800mT and 1000mT) AC field strengths,
using a suite of reverse fields. The relative contribution of Fe-bearing paramagnetic minerals was
determined by the high field (800 mT and 1000 mT) susceptibility as a proportion of the low field
(1mT and 5mT) susceptibility (PARA%). The presence of haematite and goethite rich samples
was determined using isothermal remanences at backfields of 1000mT (HIRMH) and 300mT
(HITMG) supported by low temperature remanence measurements (e.g. France, 1997). This suite
of magnetic parameters has previously been used to discriminate different sediment sources
within the Annecy catchment (Dearing et al., 2001): PARA% (unweathered marls / limestones),
HIRMG (high altitude valley soils), HIRMH (medium altitude soils) and Soft % (low – mid altitude
surface soils). Discrimination of the various sources contributing to the organic carbon content of
the sediment record (soil, geological and aquatic) was undertaken following Noel et al. (2001)
and included both chemical (Total Organic Carbon (TOC), pyrolisis, hydrogen index, LOI) and
petrographic analyses. Pollen analysis was undertaken on 1 – 2 cm contiguous samples, and
prepared following standard laboratory procedures (e.g. Faegri and Iversen, 1989).
Geochronological control for the LA13C was secured through a combination of absolute
Page 9 of 35
http://mc.manuscriptcentral.com/holocene
HOLOCENE
123456789101112131415161718192021222324252627282930313233343536373839404142434445464748495051525354555657585960

For Peer Review
dating techniques (210
Pb and 14
C) and the correlation between magnetic and palynological proxy
data. Nine radiocarbon age determinations were obtained using terrestrial plant macrofossils
(wood and leaves). These macrofossils were processed at the Beta Analytic and French
laboratories, with all age determinations measured by accelerator mass spectrometry.
Conventional 14
C ages were calibrated using the calibration curve of Reimer et al (2009) and the
computer program OxCal (v4.10, Bronk Ramsey (2008). Radiocarbon results are quoted in
accordance with the Trondheim international standard (Stuiver and Kra 1986); age ranges are
quoted at 95% (2 σ) confidence interval (Table 1). The uppermost 1m was analyzed for 210
Pb,
137Cs and
241Am using direct gamma assay.
210Pb radiometric dates were calculated using CRS
and CIC dating models where appropriate (Appleby and Oldfield 1978); results were validated
against 137
Cs/241
Am stratigraphical records to provide ages for the upper 23 cm back to AD 1954
(Table 1).
Further chronological control was achieved by correlation of magnetic proxy data
between LA13C and the GLA profile sampled from the Grand lac d’Annecy (Nomade, 2005). A
robust chronology has been produced from the Grand Lac sequence from annual laminations.
Comparison of the SIRM stratigraphy between LA13 and GLA reveals a strong correspondence
(Table 1) with a striking similarity to other Annecy sediment cores (Higgitt et al., 1991). Events
observed in the pollen sequence are well represented in other pollen records from the region
including the decline in Abies (~ 4000 - 4400 BP), and the first appearance (2000-1800 BP) and
rise to prominence (1200-800 BP) of Juglans.
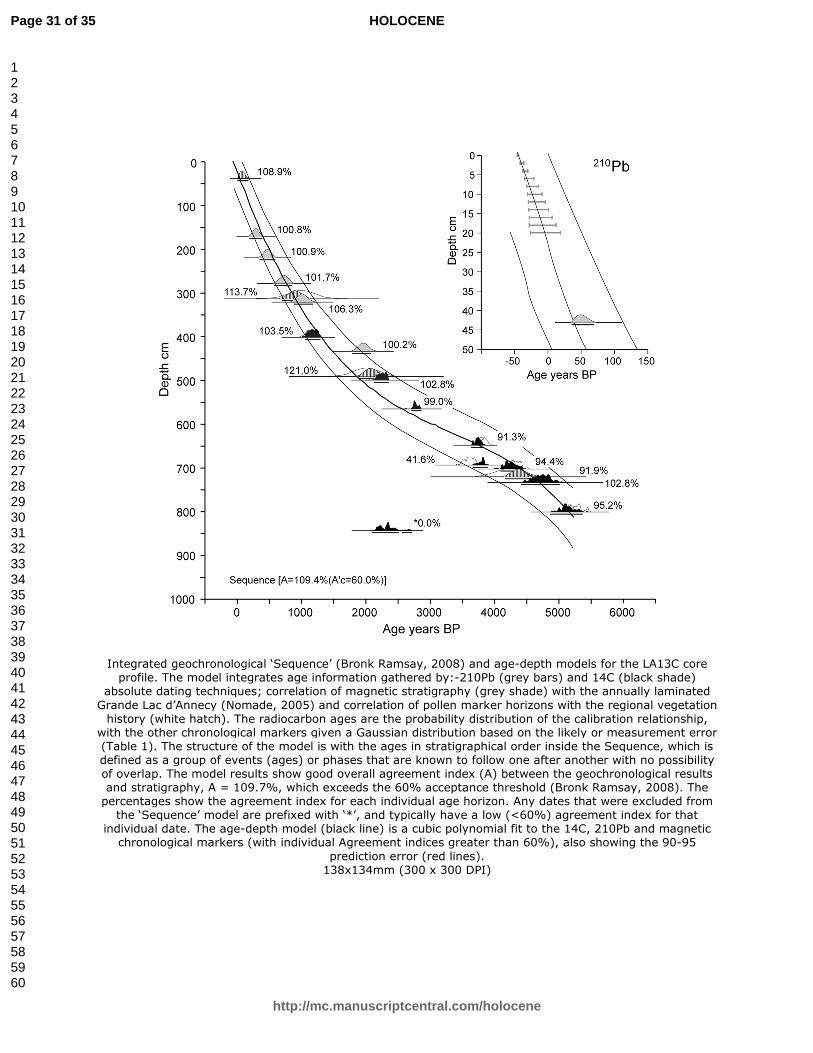
To assess the robustness of the chronology, all the age control and errors have been
incorporated in a sequence model and tested for conformability using OxCal (v4.10, Bronk
Ramsey, 2008). The sequence model (Figure 3) shows good overall agreement between
geochronological results and stratigraphy (A = 109.4%). To achieve this level of agreement, only
one outlier (2310 ± 70 BP at 840 cm depth) had to be excluded from the analysis (Figure 3). The
conformability of pollen and magnetic marker horizons with radiocarbon dates suggests that some
Page 10 of 35
http://mc.manuscriptcentral.com/holocene
HOLOCENE
123456789101112131415161718192021222324252627282930313233343536373839404142434445464748495051525354555657585960

For Peer Review
of the problems often associated with carbonate catchments (e.g. artificially old ages owing to
hard-water and residual carbon) have been circumvented through the use of plant macrofossils.
The accepted age information was used to construct an age–depth model for the lake sediment
sequence (Figure 3). Pollen markers were excluded from this process owing to the imprecise
nature of the age control, although they are in line with the age-depth relationship.
Mean sediment accumulation rates (SAR) per year (cm.yr-1
) and sediment loadings were
calculated over the length of the core in 100 to 1000 year time-slices. Total sediment mass
deposited each year was calculated as measured mass multiplied by the area of the lake (6.25
km2). Sediment loadings were then converted to total sediment production per year per km
2 by
dividing by the catchment area (170.4 km2). For this calculation the Petit lac was treated as a
separate basin with negligible sediment exchange with the Grand lac. The lake sediments are
principally detrital in origin (Dearing et al.,2001; Foster et al., 2003) allowing the use of SAR as
a proxy for allocthonous sediment load.
Statistical Analysis
Previous work in the Lac d’Annecy has clearly shown that human activity has had an
observed quantified impact upon catchment dynamics. What we have hitherto not been able to
discern is a signal of precipitation change upon catchment dynamics. To address this issue we
focused on the primary landscape proxies (Soft, HIRMG, HIRMH, PARA% and TOC) on the
assumption that these proxies for erosion and deposition would normally vary synchronously with
multi-annual (cyclical) changes in precipitation (allowing for some lagged time interval between
climate forcing and landscape response(s)). Such a spatially synchronous signature will contrast
with one created by human activities, which should have a more variable signature as disruption
occurs sporadically in time and space.
In comparing our proxy records against precipitation data we focus on two aspects of the
data, a) the cyclical nature of climate data and thus on a hypothesised cyclical impact upon the
Page 11 of 35
http://mc.manuscriptcentral.com/holocene
HOLOCENE
123456789101112131415161718192021222324252627282930313233343536373839404142434445464748495051525354555657585960

For Peer Review
proxies; and b) the likelihood that our landscape proxies would take some unknown number of
years to respond to changing precipitation regimes. Lagged proxy response times were estimated
using cross-correlation, which quantifies the similarity between two waveforms (signals) as a
function of a time-lag applied to one of the signals. It is not a classic correlation technique such as
Pearsons or Spearmans but when normalised to range between -1 and 1 can be interpreted in
much the same way. Next the frequency domain of the data was explored using cross-spectral
analysis. The cross-spectral density can be thought of as a Fourier transform of the cross-
covariance function (Chatfield, 2004). It enables one to ‘correlate’ between frequency peaks in
the autospectrum of each time-series.
Significance levels in our spectral and cross-correlation data were calculated using a
Monte Carlo approach. This involved randomising each dataset set, calculating the cross-
correlation or cross-spectra and then iterating 5000 times. In doing so we ‘respected’ the structure
of our data whilst exploring the full range of permutations that might arrive by random chance.
For the cross correlated data we used the 2 sigma standard deviation of these 5000 results as the
significance level at each lagged interval. The iterated randomised data returned from cross-
spectral analysis is non-parametric so is this instance we used the 99th percentile of the 5000
results as our significance level. We choose the 99th percentile as a conservative interpretation of
significance in a non-parametric dataset.
Our aim was to test the null hypothesis that there is no significant correlation between the
pattern of precipitation change (direction and magnitude) and the pattern of change in our
landscape proxies. In rejecting this hypothesis we could reasonably infer that precipitation is a
significant driver of catchment dynamics. However, seasonal temperature variability is a
complicating factor in this assumption. In Annecy (non-seasonal) precipitation falls as snow
during winter months (Figure 2a). This must impart some seasonality to the landscape response to
changes in long-term precipitation, for example, due to spring floods driven by snowmelt. Whilst
the seasonality of a landscape response is largely irrelevant to our analysis, which focuses on
Page 12 of 35
http://mc.manuscriptcentral.com/holocene
HOLOCENE
123456789101112131415161718192021222324252627282930313233343536373839404142434445464748495051525354555657585960
For Peer Review
proxy landscape records that are integrated over multi-annual timescales, it is logical for us to
demonstrate (where possible) that our proxies are sensitive to monthly precipitation if we are to
conclude that there is a precipitation signal in the stratigraphic record. Therefore in the following
analysis we use the modelled 321 year (monthly) precipitation record of Casty et al., (2005) as
well as a 3850 yr multi-annual proxy-precipitation created by Charman et al. (2006; 2009).
The Casty et al data are compiled from instrumental and documentary evidence and are
available at monthly resolution in 0.5° x 0.5° grid squares covering central Europe from 1659 –
2000 AD. We extracted the 45.75N/6.25E grid square over Annecy from this dataset.We then
down-sampled each column of monthly data to a 4 year resolution to match the maximum
resolution of our (lake core) proxy data, after first applying a 4 year moving window to smooth
the data. This down-sampling also necessitated us deleting the oldest 20 years of precipitation
data because our proxy landscape data changes to a resolution >4 years beyond this point. All
data were linearly detrended and expressed in standard deviation units.
To investigate our hypothesis over longer (millennial) timescales we use the bog surface
wetness (BSW) record of Charman et al., (2006); we focus on this UK because no suitable long
termclimate record is currently available for the Annecy region. This is a single UK-wide
integrated record compiled from multiple UK bogs covering the period 4000 BC to 1995 AD. We
focus on the last 3850 years of this record as it offered the best resolution. These data are already
detrended and expressed in units of standard deviation so we simply resampled at 25year
resolution to create constant intervals.
Charman et al., (2009) discussed the interpretation of BSW data concluding that it is
most sensitive to precipitation, with summer temperature having an important secondary effect.
BSW records throughout NW Europe change at similar times and seem to be controlled by a
common climatic forcing, namely the North Atlantic Multidecadal Oscillation (NAO) (Barber
and Charman, 2003; Barber, 2006; Hughes et al., 2006; Sutton and Hodson, 2005; Charman et
al., 2010). The regional nature of this climate forcing means that it is reasonable for us to use it as
Page 13 of 35
http://mc.manuscriptcentral.com/holocene
HOLOCENE
123456789101112131415161718192021222324252627282930313233343536373839404142434445464748495051525354555657585960

For Peer Review
a proxy for a fluctuating precipitation in the French Alps, i.e. both locations are sensitive to the
same regional fluctuations in climate that have occurred through the late Holocene. We tested this
assertion by comparing average monthly precipitation patterns between the UK as a whole
(downloaded from the UK Met office website;
http://www.metoffice.gov.uk/climate/uk/datasets/Rainfall/date/UK.txt) and Geneva (40km North
of Annecy) between 1910 and 2011 AD (ECA&D; http://eca.knmi.nl). We could not directly
compare the Charman precipitation record with the 20th C Geneva record because of its low
resolution. Somewhat surprisingly annual precipitation in the UK and at Geneva is significantly
(Spearman) correlated (0.36). More importantly the cyclicity of annual precipitation in the UK
and Geneva evidences significant cross-spectra (at 95% sig.) (Figure 2c). Breaking precipitation
down into monthly time-series shows that the dominant correlating periodicities lie in February,
September and December (Figure 2c). Interestingly these 4-10 year periodicities match the NAO,
offering good support for common climate forcing in the UK and Annecy. It is important to stress
here that this comparison is confined to the last century; at the lower (>1/100 yr) frequencies most
relevant to this study other months might also share common climate frequencies. Indeed this is
what we find in the results sections. Nevertheless, it is clear the UK and Annecy precipitation
records are sensitive to the same multi-annual periodicities thereby justifying our use of the
Charman et al., (2006) BSW dataset.
Results and Interpretation
The sediment record
The key elements of the proxy environmental record for LA13C are summarised in Figures 4a
and b. The proxy record is curtailed to match the timespan covered by the Charman et al., (2006;
2009) precipitation data set. The proxy record broadly conforms to the existing historical record
for the catchment, reinforcing the role anthropogenic activity has had driving catchment processes
Page 14 of 35
http://mc.manuscriptcentral.com/holocene
HOLOCENE
123456789101112131415161718192021222324252627282930313233343536373839404142434445464748495051525354555657585960
For Peer Review
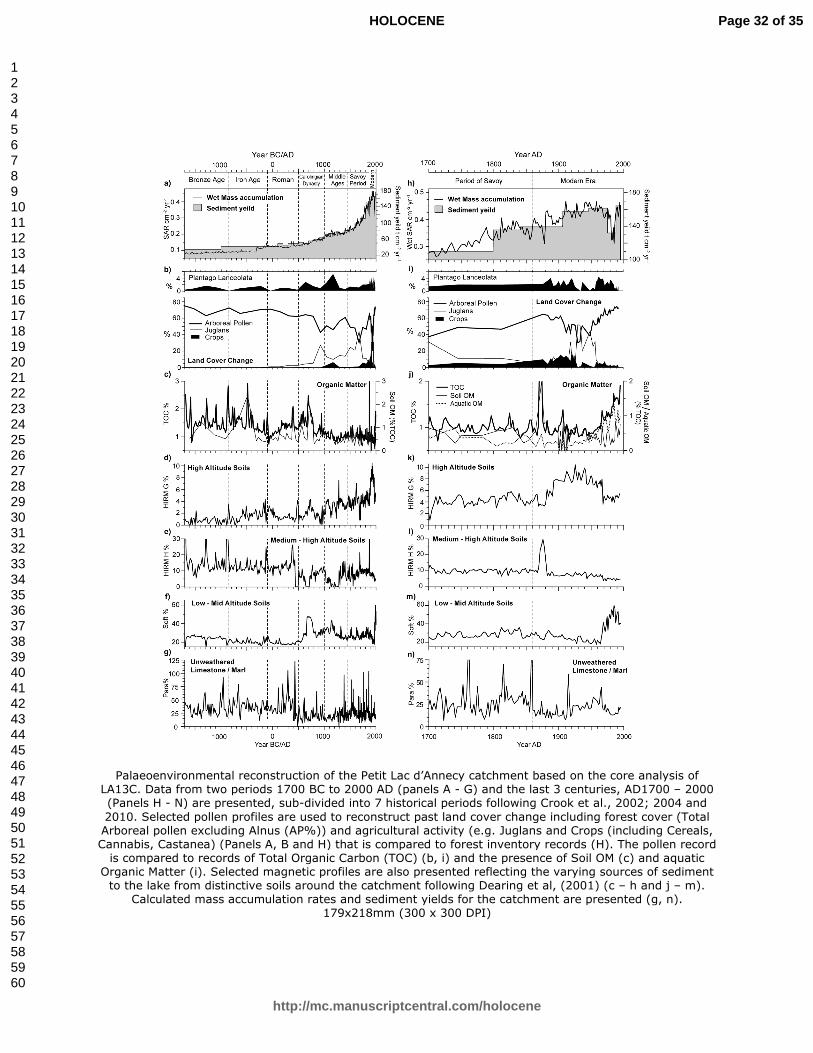
over the Late Holocene. The record is dominated by a pronounced increase in sediment
accumulation rates (SAR) /sediment yields (SY) from the Bronze Age (SAR ~0.5 g cm3 yr
-1 : SY
30 t km2 yr
-1) through into the modern Era (SAR ~4.5 g cm
3 yr
-1 : SY 160 t km
2 yr
-1), reflecting a
long-termtrend of increasing erosion rates in the catchment (Figure 4a and h). The changing
pattern of sedimentation in the lake occurs against a backdrop of changing land cover
characterised by periods of forest clearance (AP curve) coincident with the start and expansion of
agricultural activity across the catchment (e.g. Juglans and Crop plants).
The first cereal grains are noted in the Iron Age preceded by a steady decline in AP
through the Bronze Age. Low AP values point to, major woodland clearance phases in the
Roman/Carolingian period (Figure 4b) and the Savoy/Modern Era (Figure 4i). Agricultural taxa
are a permanent feature of the pollen record from the Roman period onwards. The Early land
cover changesin the Iron Age are coincident with a sharp rise in soil derived organic matter
entering the lake (Figure 4c). There is also a gradual rise in the contribution of soil derived from
the high altitude valleys (HIRMG) at a time when the high altitude alpage were being developed
for the first time (Figure 4d). Significant spikes in Soil OM and TOC are also noted for the other
two major clearance phases.
The observed changes in SAR/sediment yield and the observed episodes of land cover
change are paralleled by significant changes in sediment source over the Late Holocene. After the
increase in the Iron Age, High Altitude Valley soils (HIRMG) again increase in significance from
the Middle Ages onwards, reflecting the clearance of land for pasture (Figure 4d and k). In the
Modern Era, the rise in HIRMG after 1890AD is coincident with low AP value suggesting these
peak sediment yields are likely have resulted from the last major phase of forest clearance in the
catchment. The contribution of soil from Medium-High valleys (HIRMH) remain significant
throughout the record (Figure 4e and l) although there is a marked shift at the start of the
Carolingian Dynasty and a pronounced spike centered on 1910AD that is coincident with an
equally sharp rise in TOC and Soil OM (Figure 4j). The most pronounced sediment source
Page 15 of 35
http://mc.manuscriptcentral.com/holocene
HOLOCENE
123456789101112131415161718192021222324252627282930313233343536373839404142434445464748495051525354555657585960

For Peer Review
changes are noted for the Low-Mid Altitude Valley Soils (Soft%) the contribution of which
increases significantly in the Coralingian Dyansty. The timing of this rise is coincident with the
development of the lower lying areas of the catchment by the monasteries. The sharp rise in
SOFT% in the last 50 years, suggests the low – mid altitude valleys are again increasing in
significance as a sediment source to the lake. The rise in SOFT% is mirrored by rising soil OM
values and also aquatic OM (Figure 4b) indicative of cultural eutrophication.
The final sediment source tracer, PARA% is thought to reflect the in-wash of
unweathered limestones and marls presumably transported during high energy flood events in the
bedrock river channels in the Eau Morte and Ire catchments (e.g. Dearing et al 2001). The pattern
of change is not as pronounced as other markers, but there appear to have been a significant
decline in the contribution of unweathered limestone’s and marls with the transition into the
Carolingian Dynasty. Comparable values are also recorded over the last 300 years and may
impact reflect the increased flood control measured in place across the catchment by this time,
although clearly high-energy floods remain a feature of the hydro-geomorphic system over the
entire Late Holocene period.
Statistical analysis of proxy records
In analysing the proxies (HIRMG, HIRMH, SOFT and TOC, PARA%) we choose to work at two
different temporal resolutions covering two different time spans. This enabled us to test whether
the landscape proxies correlate with precipitation over both centaury and millennial timescales;
ideally we would have used a single high-resolution millennial long precipitation dataset but none
exist. The maximum resolution of our landscape proxy data is 4-years and this is the resolution
we use when drawing comparisons with the Casty et al., (2005) 321 year precipitation data. To
perform a similar comparison over longer timescales we used the Charman et al., (2006) 3850 yr
long precipitation data; for this purpose we down-sampled/ interpolated our geomorphic-proxy
data and Charman et al’s data to a 25 yr resolution. Thus in the following paragraphs each
Page 16 of 35
http://mc.manuscriptcentral.com/holocene
HOLOCENE
123456789101112131415161718192021222324252627282930313233343536373839404142434445464748495051525354555657585960

For Peer Review
analysis is performed twice with the added complication that we also analyze monthly
precipitation over the shorter 321 year period: see methods.
We first calculated the Spearman rank correlation coefficient (at a 4-year resolution)
between each geomorphic proxy and the 321 year precipitation record of Casty et al., (2005).
Only one of the proxies significantly correlated with precipitation (TOC = -0.28), while generally
correlating more strongly with each other (Table 2). Given the obvious inter-dependence between
each of these proxies we choose to combine them into a reduced dimension dataset using
principal component analysis (PCA). At both resolutions each PCA axis accounted for similar
variability: respectively at 4/25 years PCA 1= 36%/33%, PCA2 = 27%/27%, PCA3= 20%/21%.In
order to determine which, if any, of the PCAs correspond to the long-term precipitation record we
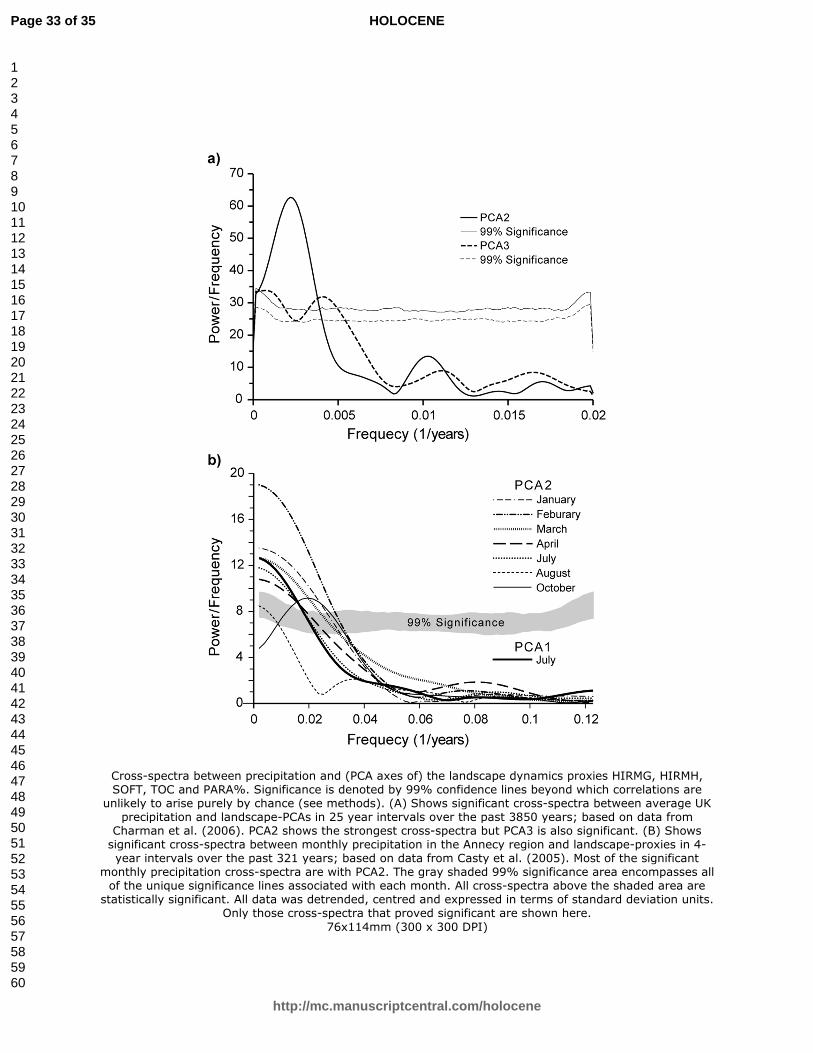
performed a cross spectrum analysis between the proxies and precipitation: see methods. We
found a significant (99%) correspondence between the precipitation and PCA2 spectra over both
3850 and 321 year time spans (Figure 5). PCAs 1 and 3 also display significance but to a far
lesser degree. The common periodicities in these datasets are > 291 years in the long 3850 record
and >32 years in the shorter term 320 year record (Figure 5). The use of a maximum 4-year
resolution precludes identification of shorter annual periodicities that might be related to the
NAO. However, the high-resolution data (Casty et al. 2005) data did allow us to compare
monthly precipitation against each PCA to determine which months might best explain variability
in the landscape proxies. The strongest monthly relationships are found between January-March
but all 4 seasons evidence statistically significant months (Figure 5b). This is good evidence that
variability in precipitation is driving the landscape-dynamics proxies.
We used cross-correlation to determine if the proxies for landscape dynamics lag in their
response to precipitation change. Given that PCA2 shows the strongest cross-spectra (Figure 5)
we focused on this axis. There are many weak but statistically significant cross-correlations with
precipitation over the past 3850 year (e.g. 350, 850 and 1175 years: Figure 6a). Similar but
slightly stronger correlations are observed over the past 321 years, where both decadal and
Page 17 of 35
http://mc.manuscriptcentral.com/holocene
HOLOCENE
123456789101112131415161718192021222324252627282930313233343536373839404142434445464748495051525354555657585960
For Peer Review
centennial lags are observed (Figure 6b). When the monthly precipitation data are summed to
give total annual precipitation, significant cross-correlation remains at a 36 year lag with a cross-
correlation of 0.28 (Figure 6b). The closeness of this lagged annual relationship to April (at a 28
year lag) suggests that April dominates the annual signal. This observation is consistent with the
recognised importance of spring floods to Annecy landscape dynamics (Foster et al 2003).
Discussion
We have shown that the five proxies for landscape dynamics (HIRMG, HIRMH, SOFT, TOC and
PARA%) relate, albeit weakly, to long-medium term precipitation patterns. The strongest
monthly relationships between precipitation and landscape dynamics are found between January-
March but all four seasons have statistically significant months (Figure 5). It is beyond the scope
of this paper to resolve the detailed causal relationships between each month, concerned as we are
with annual-millennial timescales, but the correlating cross-spectra during winter months is
confounding given that precipitation would fall as snow during these months (Figure 2b). We
here speculate that this relationship is due to the depth of snowpack created and the corresponding
size of spring floods in April, the month that dominates the annual cross-correlation signal.
Regional climate phenomena such as the Atlantic multi-decadal oscillation appear to be
at least partly responsible for landscape dynamics at Lac d‘Annecy during the late Holocene.
Comparison between 20th century precipitation in the UK and Geneva clearly show significant
correlating periodicities in the 2-10 year range (Figure 2c) consistent with a regional NAO signal.
These periodic changes in precipitation are also reflected in the long term sediment record. The
landscape proxies (PCA2) share significant correlating periodicities with UK and local
precipitation (Figure 5). The effect of periodic changes in precipitation on landscape dynamics is
also observed in the cross-correlation analysis, which shows numerous (lagged) cross-correlations
between precipitation and PCA 2 (Figure 6). These wide ranging cross-correlations, ranging from
Page 18 of 35
http://mc.manuscriptcentral.com/holocene
HOLOCENE
123456789101112131415161718192021222324252627282930313233343536373839404142434445464748495051525354555657585960
For Peer Review
zero years to centuries and beyond, are likely a reflection of sediment ‘smearing’. River sediment
typically moves downstream in waves characterized by relatively long periods of sediment
storage (e.g. in alluvial terraces) followed by brief bursts of bedload transport. This transport
mechanism can stretch the sedimentary response to precipitation across decades and centuries.
Moreover, Benda and Dunne (1997) have shown that in a catchment similar to Annecy a single
pulse of accelerated hillslope erosion can produce multiple solitary pulses of sediment that
migrate downstream over centuries. This type of multi-phase response is a likely reason why we
see such a wide range of lagged responses to precipitation change, i.e. no single lag interval
represents a single erosion event. It is important to stress that despite evidence to support
‘smearing of environmental signals’ the effect of precipitation variability is still recognizable in
the sedimentary record, albeit stretched over multiple timescales.
The presence of a weak but significant precipitation signal in the lac d’Annecy sediments
implies that the processes of sediment transport and deposition are of insufficient magnitude
and/or frequency to effectively ‘shred’ the precipitation signal. Recent modelling work had
suggested that environmental signals cannot survive ‘filtering’ by non-linear transport processes
(Van de Wiel and Coulthard, 2007, 2010; Jeromack and Paola, 2010). However, our results are
not necessarily in conflict given that Jeromack and Paola (2010) also argued that signals of
sufficiently low frequency would survive non-linear filtering. Thus we interpret our results to
indicate that 4 year integrated records are of sufficiently coarse resolution to effectively average
out the effects of shorter-term SOC transport processes, while also allowing us to identify the
effect of environmental ‘smearing’ across decades to centuries. This is encouraging as it supports
the widespread application of palaeo-environmental techniques that typically operate at multi-
annual resolutions.
Conclusions
Page 19 of 35
http://mc.manuscriptcentral.com/holocene
HOLOCENE
123456789101112131415161718192021222324252627282930313233343536373839404142434445464748495051525354555657585960

For Peer Review
The assessment of Holocene sedimentary records is often hampered by an antagonistic interplay
between climate change and anthropogenic activity, which operate over similar spatial and
temporal scales. In this study we have for the first time to used a combination of principal
component and spectral analysis and cross-correlation to clearly discern a climate signal in a
catchment heavily impacted by human activities throughout the late Holocene. These activities
first began impacting geomorphic processes during the Late-Bronze/Early Iron Age, probably
linked to the development of upland Alpage. This initial phase was then followed by a long term
increase in sedimentation accumulation rates and sediment yields, that rise from ~0.5 g cm3 yr
-
1(30 t km
2 yr
-1) at the start of the Bronze Age to over ~ 4.5cm
3 yr
-1 in the Modern Era equivalent
to 160 t km2 yr
-1. This pronounced rise in sedimentation is driven by the long-term modification
of the hydro-geomorphic system through a combination of land cover change and river
channel/floodplain modifications.
The results of the statistical analysis indicate for the first time that regional climate
phenomena such as the Atlantic multi-decadal oscillation are partly responsible for landscape
dynamics at Lac d‘Annecy, during the late Holocene. The Lac d‘Annecy landscape typically
requires decades, or longer, to respond to changes in precipitation, reflecting the stochastic nature
of river sediment storage and transport. The use of a 4 year integrated lake core records appears to
effectively attenuate the ‘signal shredding’ effect of shorter-term internally generated sediment
transport processes. However, the lake record of climatically-induced geormorphic process-
responses is weak compared to the impact of human activities, which clearly dominate the
sedimentary record.
Page 20 of 35
http://mc.manuscriptcentral.com/holocene
HOLOCENE
123456789101112131415161718192021222324252627282930313233343536373839404142434445464748495051525354555657585960
For Peer Review
Acknowledgments
This project was funded by the Leverhulme Trust (Grant No F/25/BQ). The reconstructed water
table record for Northern England Peatlands was accessed through the NOAA website (Charman,
D.J., and D. Hendon, 1999, Reconstructed Water Table Depths in Northern England Peatlands,
IGBP PAGES/World Data Center A for Paleoclimatology Data Contribution Series #1999-059.
NOAA/NGDC Paleoclimatology Program, Boulder CO, USA). Logistical help in the field was
provided by Fernand Bertier and Gez Foster, whilst Sandra Mather and Sue Rouillard provided
invaluable help with the figures. Dan Charman, Bob Jude, Sue Franklin, Peter Hamilton and
Malcolm Young are thanked for their assistance in the laboratory and discussion of the data.
Finally three anonymous reviewers are thanked for their insightful comments on the first version
of this manuscript.
Page 21 of 35
http://mc.manuscriptcentral.com/holocene
HOLOCENE
123456789101112131415161718192021222324252627282930313233343536373839404142434445464748495051525354555657585960
For Peer Review
REFERENCES
Appleby PG and Oldfield F (1978) The calculation of lead-210 dates assuming a constant rate of
supply of unsupported 210
Pb to the sediment. Catena 5: 1–8.
Barber, K.E., 2006. Peatland records of Holocene climate change. In: Elias S (ed.)
Encyclopedia of Quaternary Science. Elsevier: Oxford, 1884–1895.
Barber KE, Charman DJ (2003) Holocene palaeoclimate records from peatlands. In: Mackay AW,
Battarbee RW, Birks HJB, Oldfield F (eds.) Global Change in the Holocene. Edward Arnold:
London, 210–226.
Benda L and Dunne T (1997) Stochastic forcing of sediment routing and storage in channel
networks. Water Resources Research 33: 2865-2880.
Boisonnade P (1937) Life and work in medieval Europe (fifth to fifteenth centuries). Kegan Paul :
London.
Bronk Ramsey C (2008) Deposition models for chronological records, Quaternary Science
Reviews 27: 42-60.
Carrier EH (1932) Water and grass. Christophers : London.
Casty C, Wanner H, Luterbacher J, Esper J, Böhm R (2005) Temperature and precipitation
variability in the European Alps since 1500. International Journal of Climatology 25: 1855-1880.
Charman DJ, Blundell A, Chiverrell RC, Hendon D and Langdon PG (2006) Compilation of non-
annually resolved Holocene proxy climate records: stacked Holocene peatland palaeo-water
table reconstructions from northern Britain. Quaternary Science Reviews 25: 336–350.
Charman DJ, Barber KE, Blaauw M, Langdon PG, Mauquoy D, Daley TJ, Hughes PDM,
Karofeld E (2009) Climate drivers for peatlandpalaeoclimate records.Quaternary Science
Reviews 28: 1811-1819.
Charman DJ (2010) Centennial climate variability in the British Isles during the mid-late
Holocene.Quaternary Science Reviews 29: 1539–1554.
Coulthard TJ and Van De Wiel MJ (2007) Quantifying fluvial non-linearity and finding self
organized criticality? Insights from simulations of river basin evolution. Geomorphology 91:
216–235.
Crook DS, Siddle DJ, Jones RT, Dearing JA, Foster GC and Thompson R (2002). Forestry and
flooding in the Annecy Petit Lac Basin, 1730-2000. Environment and History 8: 403-28.
Crook DS, Siddle DJ, Dearing JA and Thompson R (2004) Human Impact on the Environment in
the Annecy Petit Lac catchment, Haute-Savoie: A documentary approach. Environment and
Page 22 of 35
http://mc.manuscriptcentral.com/holocene
HOLOCENE
123456789101112131415161718192021222324252627282930313233343536373839404142434445464748495051525354555657585960

For Peer Review
History 10: 247-284.
Crook DS, Dearing JA, Jones RT and Elvin M (2011) An inter-continental comparison between
the environmental histories of two Lake Catchment systems in montane environments of
France and South West China. Water History Journal 3: 95-120.
Dearing JA (1979) The application of magnetic measurements to studies of particulate flux in a
lake-watershed ecosystem. Ph.D. Thesis : University of Liverpool, 235 pp.
Dearing JA andZolitschka B (1999) System dynamics and environmental change: an exploratory
study of Holocene lake sediments at Holzmaar, Germany.The Holocene 9: 531-540.
Dearing JA, Hu YQ, Doody P, James PA and Brauer A (2001) Preliminary reconstruction of
sediment-source linkages for the past 6000 yrs at the Petit Lac d'Annecy, France, based on
mineral magnetic data. Journal of Paleolimnology 25 : 245-258.
Dearing JA and Oldfield F (2002) The role of human activities in past environmental
change.In:AlversonK, Bradley RS and Pedersen TF (eds.). Paleoclimate, global change, and
the future. Springer Verlag: 143 – 162.
Dearing JA and Jones RT (2003) Coupling temporal and spatial dimensions of global sediment
flux through lake and marine sediment records. Global and Planetary Change 39: 147–168.
Dearing JA, Battarbee RW, Dikau R, Larocque I and Oldfield F (2006) Human–environment
interactions: learning from the past. Regional Environmental Change 6: 1-16.
Della-Casa PH (2005) Lithic resources in the early prehistory of the Alps. Archaeometry 47: 222-
234.
Faegri K and Iversen J (1989) Textbook of pollen analysis, 5th Edition, Wiley: Chichester
Foster GC, Dearing JA, Jones RT, Crook DS, Siddle DJ, Harvey AM, James PA, Appleby PG,
Thompson R, Nicholson J and Loizeaux J-L (2003) Meteorological and land use controls on
geomorphic and fluvial processes in the pre-Alpine environment: an integrated lake-catchment
study at the Petit Lac d'Annecy. Hydrological Processes 17: 3287-3305.
France D (1997) The mineral magnetic characterisation of goethite and haematite in soils and
sediments. Ph.D. Thesis: University of Liverpool, 194 pp.
Ganti V, Straub KM, Foufoula-Georgiou E, Paola C (2011) Space-time dynamics of depositional
systems: Experimental evidence and theoretical modeling of heavy-tailed statistics: Journal of
Geophysical Research, doi:10.1029/2010JF001893
Gobet E, Tinner, W, Hochueli PA, van Leeuwen, JFNH, Amman B (2003) Middle to Late
Holocene vegetation history of the Upper Engadine (Swiss Alps): the role of man and fire.
Vegetation History and Archaeobotany 12:143−163.
Grand R and Delatouche R 1950 Agriculture au Moyen Age de la fin de l0’empire Romain au
Page 23 of 35
http://mc.manuscriptcentral.com/holocene
HOLOCENE
123456789101112131415161718192021222324252627282930313233343536373839404142434445464748495051525354555657585960

For Peer Review
XVI siècle Tome III. Paris: E. de Boccard.
Higgitt SR, Oldfield F and Appleby PG (1991) The record of land use change and soil erosion in
the Late Holocene sediments of the Petit Lac d’Annecy, eastern France. The Holocene 1: 14 -
18.
Hooke RLB (2000) On the history of humans as geomorphic agents. Geology 28: 843–846.
Hughes PDM, Blundell A, Charman DJ, Bartlett S, Daniell JRG, Wotjatschke A, Chambers FM,
2006. An 8500 cal. year multi-proxy climate record from a bog in eastern Newfoundland:
contributions of meltwater discharge and solar forcing. Quaternary Science Reviews 25: 1208–
1227.
Jacob J, Disnar J-R, Arnaud F,Gauthier E, Billaud Y, Chapron E and Bardoux G (2009) Impacts
of new agricultural practices on soil erosion during the Bronze Age in the French Prealps. The
Holocene 19: 241 – 249.
Jerolmack DJ and Paola C (2010) Shredding of environmental signals by sediment transport:
Geophysical Research Letters 37 : L19401, doi:10.1029/2010GL044638.
Kaiblinger C,Anneville O,Tadonleke R, RimetF, Druart JC, Guillard J, Dokulil MT (2009)
Central European water quality indices applied to long-term data from peri-alpine lakes: test
and possible improvements. Hydrobiologia 633: 67–74.
Lambin EF and Meyfroidt P (2010) Land use transitions: Ecological feedback versus exogenous
socio-economic dynamics. Land Use Policy 27: 108-118.
Mougin P (1914) Les torrents de Savoie: Grenoble.
Noel H, Garbolino E, Brauer A, Lallier-Verges E, de Beaulieu JL and Disnar JR (2001) Human
impact and soil erosion during the last 5000 yrs as recorded in lacustrine sedimentary organic
matter at Lac d'Annecy, the French Alps. Journal of Paleolimnology 25: 229-244.
Nomade J (2005) Chronologieetsédimentologie du remplissage du lac d’Annecy depuis le
Tardiglaciaire: implications paléoclimatologiquesetpaléhydrologiques. Unpublished PhD
thesis, Laboratoire de Géodynamique des Chaines Alpines:Université Joseph Fourier,
Grenoblepp 181.
Perga M-E, Desmet M, Enters D and Reyss JL (2010) A century of bottom-up- and top-down-
driven changes on a lake planktonic food web: A paleoecological and paleoisotopic study of
Lake Annecy, France. Limnology and Oceanography 55:803 -816.
Reimer PJ, Baillie MGL, Bard E, Bayliss A, Beck JW, Blackwell PG, BronkRamse, C, Buck CE,
Burr GS, Edwards RL, Friedrich M, Grootes PM, Guilderson TP, Hajdas I, Heaton TJ, Hogg
AG, Hughen KA, Kaiser KF, Kromer B, McCormac FG, Manning SW, Reimer RW, Richards,
DA, Southon JR, Talamo S, Turney CSM, van der Plicht J, Weyhenmeyer CE (2009) IntCal09
Page 24 of 35
http://mc.manuscriptcentral.com/holocene
HOLOCENE
123456789101112131415161718192021222324252627282930313233343536373839404142434445464748495051525354555657585960

For Peer Review
and Marine09 radiocarbon age calibration curves, 0 - 50,000 years cal BP. Radiocarbon 51:
1111-1150.
Reinhardt LW, Jerolmack D, Cardinale B, Vanacker V and Wright J (2010) Dynamic Interactions
of Life and its Landscape: feedbacks at the interface of geomorphology and ecology. Earth
Surface Processes and Landforms 35: 78-101.
Rösch M (1998) The history of crops and crop weeds in south-western Germany from the
Neolithic period to modern times, as shown by archaeobotanical evidence. Vegetation History
and Archaeobotany7: 109–25.
Stanley and Jorstad, TF (2004)Direct Sediment Dispersal from Mountain to Shore, with
Bypassing via Three Human-Modified Channel Systems to Lake Annecy, SE France. Journal
of Coastal Science 20: 958 – 969.
Stuiver M and Kra RS (eds.) (1986) Calibration issue, Proceedings of the 12th International 14C
conference.Radiocarbon 28: 805-1030.
Sutton RT andHodson DLR (2005) Atlantic Ocean forcing of north American and European
summer climate. Science 309: 115–118.
Thorndycraft V, Hu Y, Oldfield F, Crooks PRJ and Appleby PG (1998) Individual flood events
detected in the recent sediments of the Petit Lac d'Annecy, eastern France. The Holocene 8: 741-
746.
Tinner W, Hubschmid P, Wehrli M, Ammann B, Conedera M (1999) Long-term forest fire
ecology and dynamics in southern Switzerland.Journal of Ecology 87: 273-289.
Van De Wiel MJ and Coulthard TJ (2010) Self-organized criticality in river basins: Challenging
sedimentary records of environmental change. Geology 38: 87–90.
Walden J, Oldfield F and Smith JP (eds.) (1999) Environmental Magnetism, a practical guide.
Technical Guide, No. 6.Quaternary Research Association: London.
Welsh KE, Dearing JA, Chiverrell RC and Coulthard TJ (2009) Testing a cellular modelling
approach to simulating late-Holocene sediment and water transfer from catchment to lake in
the French Alps since 1826. The Holocene 19: 783-796.
Wick L and Tinner W (1997) Vegetation changes and timberline fluctuations in the Central Alps
as indicators of Holocene cli-matic oscillations.Arctic and Alpine Research 29: 445–458.
Wick L, Leeuwen JFN van, Knaap WO van der, Lotter AF (2003) Holocene vegetation
development in the catchment of Sägistalsee (1935 m a.s.l.), a small lake in the Swiss Alps.
Journal of Paleolimnology 30: 261–272
Wilkinson BH and McElroy BJ (2007) The impact of humans on continental erosion and
sedimentation. GSA Bulletin 119: 140–156.
Page 25 of 35
http://mc.manuscriptcentral.com/holocene
HOLOCENE
123456789101112131415161718192021222324252627282930313233343536373839404142434445464748495051525354555657585960
For Peer Review
FIGURE CAPTIONS
Figure 1: Topographic map of the Petit Lac d’Annecy catchment. The major commune
boundaries and population centres are marked on the map along with the major river tributaries
and the location of the sediment core LA13C (LA13 and LA13SC).
Figure 2: Monthly (A) precipitation and (B) temperature in the Annecy region over the past 321
years (from Casty et al., 2005) plus (C) a comparison between spectral patterns of precipitation in
the UK and Geneva between 1910 and 2011 AD. Significant precipitation cross spectra between
the UK and Geneva are shown over both monthly and annual intervals; both 95% and 99 %
significance levels are also shown. All data was detrended, centred and expressed in terms of
standard deviation units prior to Fourier transformation.
Figure 3: Integrated geochronological ‘Sequence’ (Bronk Ramsay, 2008) and age-depth models
for the LA13C core profile. The model integrates age information gathered by:-210
Pb (grey bars)
and 14
C (black shade) absolute dating techniques; correlation of magnetic stratigraphy (grey
shade) with the annually laminated Grande Lac d’Annecy (Nomade, 2005) and correlation of
pollen marker horizons with the regional vegetation history (white hatch). The radiocarbon ages
are the probability distribution of the calibration relationship, with the other chronological
markers given a Gaussian distribution based on the likely or measurement error (Table 1). The
structure of the model is with the ages in stratigraphical order inside the Sequence, which is
defined as a group of events (ages) or phases that are known to follow one after another with no
possibility of overlap. The model results show good overall agreement index (A) between the
geochronological results and stratigraphy, A = 109.7%, which exceeds the 60% acceptance
threshold (Bronk Ramsay, 2008). The percentages show the agreement index for each individual
age horizon. Any dates that were excluded from the ‘Sequence’ model are prefixed with ‘*’, and
typically have a low (<60%) agreement index for that individual date. The age-depth model
(black line) is a cubic polynomial fit to the 14
C, 210
Pb and magnetic chronological markers (with
individual Agreement indices greater than 60%), also showing the 90-95 prediction error (red
lines).
Figure 4: Palaeoenvironmental reconstruction of the Petit Lac d’Annecy catchment based on the
core analysis of LA13C. Data from two periods 1700 BC to 2000 AD (panels A - G) and the last
Page 26 of 35
http://mc.manuscriptcentral.com/holocene
HOLOCENE
123456789101112131415161718192021222324252627282930313233343536373839404142434445464748495051525354555657585960
For Peer Review
3 centuries, AD1700 – 2000 (Panels H - N) are presented, sub-divided into 7 historical periods
following Crook et al., 2002; 2004 and 2010. Selected pollen profiles are used to reconstruct past
land cover change including forest cover (Total Arboreal pollen excluding Alnus (AP%)) and
agricultural activity (e.g. Juglans and Crops (including Cereals, Cannabis, Castanea) (Panels A, B
and H) that is compared to forest inventory records (H). The pollen record is compared to records
of Total Organic Carbon (TOC) (b, i) and the presence of Soil OM (c) and aquatic Organic Matter
(i). Selected magnetic profiles are also presented reflecting the varying sources of sediment to the
lake from distinctive soils around the catchment following Dearing et al, (2001) (c – h and j – m).
Calculated mass accumulation rates and sediment yields for the catchment are presented (g, n).
Figure 5: Cross-spectra between precipitation and (PCA axes of) the landscape dynamics proxies
HIRMG, HIRMH, SOFT, TOC and PARA%. Significance is denoted by 99% confidence lines
beyond which correlations are unlikely to arise purely by chance (see methods). (A) Shows
significant cross-spectra between average UK precipitation and landscape-PCAs in 25 year
intervals over the past 3850 years; based on data from Charman et al. (2006). PCA2 shows the
strongest cross-spectra but PCA3 is also significant. (B) Shows significant cross-spectra between
monthly precipitation in the Annecy region and landscape-proxies in 4-year intervals over the
past 321 years; based on data from Casty et al. (2005). Most of the significant monthly
precipitation cross-spectra are with PCA2. The gray shaded 99% significance area encompasses
all of the unique significance lines associated with each month. All cross-spectra above the
shaded area are statistically significant. All data was detrended, centred and expressed in terms of
standard deviation units. Only those cross-spectra that proved significant are shown here.
Figure 6: Cross-correlations showing the lagged response of landscape-proxies to changes in
precipitation at Annecy. Significance is denoted by 95% confidence lines beyond which
correlations are unlikely to arise purely by chance. (A) Cross correlations between Charman et al.,
(2006) UK precipitation and PCA2 in 25 year intervals over the past 3850 years. Weak but
significant lagged landscape responses to precipitation change are seen over both centaury and
millennial scales. (B) Cross-correlations between Casty et al. (2005) Annecy-region precipitation
in 4 year intervals over the past 321 years. Weak but significant lagged landscape responses to
precipitation change are observed over decadal (0, 28 & 36 years) to centaury timescales. Only
those months that show both; a) a significant cross-spectra between precipitation and PCA 2 in
Figure 5; and b) significant cross-correlations with PCA2 are shown here, i.e. Feb, March, April
and August.
Page 27 of 35
http://mc.manuscriptcentral.com/holocene
HOLOCENE
123456789101112131415161718192021222324252627282930313233343536373839404142434445464748495051525354555657585960
For Peer Review
Table 1: The composite core chronology for LA13C a combination of 14
C AMS radiocarbon
dates in terrestrial macrofossils (A); 210
Pb age determinations for the upper sediments (B); Cross-
correlated dates transferred from Nomade (2005) core taken in the Grand Lac, based on the
mineral magnetic record (C, D) and regional vegetation markers recorded in pollen diagrams
across the Pre-Alps.
Table 2: Spearmans correlation coefficients for each of the landscape proxies (HIRMG, HIRMH,
SOFT, TOC and PARA%) and the 321 year Casty et al (2005) precipitation record. Statistically
significant correlations are highlighted in bold italics. All data was smoothed and either down-
sampled or interpolated to create a complete record at 4 year sample intervals. These data were
detrended, centered and expressed in terms of standard deviation units.
Page 28 of 35
http://mc.manuscriptcentral.com/holocene
HOLOCENE
123456789101112131415161718192021222324252627282930313233343536373839404142434445464748495051525354555657585960

For Peer Review
Topographic map of the Petit Lac d’Annecy catchment. The major commune boundaries and population centres are marked on the map along with the major river tributaries and the location of the sediment core
LA13C.
146x186mm (300 x 300 DPI)
Page 29 of 35
http://mc.manuscriptcentral.com/holocene
HOLOCENE
123456789101112131415161718192021222324252627282930313233343536373839404142434445464748495051525354555657585960

For Peer Review
Monthly (A) precipitation and (B) temperature in the Annecy region over the past 321 years (from Casty et al., 2005) plus (C) a comparison between spectral patterns of precipitation in the UK and Geneva between 1910 and 2011 AD. Significant precipitation cross spectra between the UK and Geneva are shown over both
monthly and annual intervals; both 95% and 99 % significance levels are also shown. All data was detrended, centred and expressed in terms of standard deviation units prior to Fourier transformation.
80x186mm (300 x 300 DPI)
Page 30 of 35
http://mc.manuscriptcentral.com/holocene
HOLOCENE
123456789101112131415161718192021222324252627282930313233343536373839404142434445464748495051525354555657585960
For Peer Review
Integrated geochronological ‘Sequence’ (Bronk Ramsay, 2008) and age-depth models for the LA13C core profile. The model integrates age information gathered by:-210Pb (grey bars) and 14C (black shade)
absolute dating techniques; correlation of magnetic stratigraphy (grey shade) with the annually laminated
Grande Lac d’Annecy (Nomade, 2005) and correlation of pollen marker horizons with the regional vegetation history (white hatch). The radiocarbon ages are the probability distribution of the calibration relationship,
with the other chronological markers given a Gaussian distribution based on the likely or measurement error (Table 1). The structure of the model is with the ages in stratigraphical order inside the Sequence, which is defined as a group of events (ages) or phases that are known to follow one after another with no possibility of overlap. The model results show good overall agreement index (A) between the geochronological results and stratigraphy, A = 109.7%, which exceeds the 60% acceptance threshold (Bronk Ramsay, 2008). The percentages show the agreement index for each individual age horizon. Any dates that were excluded from
the ‘Sequence’ model are prefixed with ‘*’, and typically have a low (<60%) agreement index for that individual date. The age-depth model (black line) is a cubic polynomial fit to the 14C, 210Pb and magnetic
chronological markers (with individual Agreement indices greater than 60%), also showing the 90-95
prediction error (red lines). 138x134mm (300 x 300 DPI)
Page 31 of 35
http://mc.manuscriptcentral.com/holocene
HOLOCENE
123456789101112131415161718192021222324252627282930313233343536373839404142434445464748495051525354555657585960
For Peer Review
Palaeoenvironmental reconstruction of the Petit Lac d’Annecy catchment based on the core analysis of LA13C. Data from two periods 1700 BC to 2000 AD (panels A - G) and the last 3 centuries, AD1700 – 2000 (Panels H - N) are presented, sub-divided into 7 historical periods following Crook et al., 2002; 2004 and
2010. Selected pollen profiles are used to reconstruct past land cover change including forest cover (Total Arboreal pollen excluding Alnus (AP%)) and agricultural activity (e.g. Juglans and Crops (including Cereals, Cannabis, Castanea) (Panels A, B and H) that is compared to forest inventory records (H). The pollen record is compared to records of Total Organic Carbon (TOC) (b, i) and the presence of Soil OM (c) and aquatic
Organic Matter (i). Selected magnetic profiles are also presented reflecting the varying sources of sediment to the lake from distinctive soils around the catchment following Dearing et al, (2001) (c – h and j – m).
Calculated mass accumulation rates and sediment yields for the catchment are presented (g, n). 179x218mm (300 x 300 DPI)
Page 32 of 35
http://mc.manuscriptcentral.com/holocene
HOLOCENE
123456789101112131415161718192021222324252627282930313233343536373839404142434445464748495051525354555657585960
For Peer Review
Cross-spectra between precipitation and (PCA axes of) the landscape dynamics proxies HIRMG, HIRMH, SOFT, TOC and PARA%. Significance is denoted by 99% confidence lines beyond which correlations are
unlikely to arise purely by chance (see methods). (A) Shows significant cross-spectra between average UK precipitation and landscape-PCAs in 25 year intervals over the past 3850 years; based on data from
Charman et al. (2006). PCA2 shows the strongest cross-spectra but PCA3 is also significant. (B) Shows significant cross-spectra between monthly precipitation in the Annecy region and landscape-proxies in 4-year intervals over the past 321 years; based on data from Casty et al. (2005). Most of the significant
monthly precipitation cross-spectra are with PCA2. The gray shaded 99% significance area encompasses all of the unique significance lines associated with each month. All cross-spectra above the shaded area are
statistically significant. All data was detrended, centred and expressed in terms of standard deviation units. Only those cross-spectra that proved significant are shown here.
76x114mm (300 x 300 DPI)
Page 33 of 35
http://mc.manuscriptcentral.com/holocene
HOLOCENE
123456789101112131415161718192021222324252627282930313233343536373839404142434445464748495051525354555657585960

For Peer Review
Page 34 of 35
http://mc.manuscriptcentral.com/holocene
HOLOCENE
123456789101112131415161718192021222324252627282930313233343536373839404142434445464748495051525354555657585960

For Peer Review
Cross-correlations showing the lagged response of landscape-proxies to changes in precipitation at Annecy. Significance is denoted by 95% confidence lines beyond which correlations are unlikely to arise purely by
chance. (A) Cross correlations between Charman et al., (2006) UK precipitation and PCA2 in 25 year
intervals over the past 3850 years. Weak but significant lagged landscape responses to precipitation change are seen over both centaury and millennial scales. (B) Cross-correlations between Casty et al. (2005) Annecy-region precipitation in 4 year intervals over the past 321 years. Weak but significant lagged
landscape responses to precipitation change are observed over decadal (0, 28 & 36 years) to centaury timescales. Only those months that show both; a) a significant cross-spectra between precipitation and PCA
2 in Figure 5; and b) significant cross-correlations with PCA2 are shown here, i.e. Feb, March, April and August.
172x66mm (300 x 300 DPI)
Page 35 of 35
http://mc.manuscriptcentral.com/holocene
HOLOCENE
123456789101112131415161718192021222324252627282930313233343536373839404142434445464748495051525354555657585960

For Peer Review
177x157mm (300 x 300 DPI)
Page 36 of 35
http://mc.manuscriptcentral.com/holocene
HOLOCENE
123456789101112131415161718192021222324252627282930313233343536373839404142434445464748495051525354555657585960

For Peer Review
Spearmans correlation coefficients for each of the landscape proxies (HIRMG, HIRMH, SOFT, TOC and PARA%) and the 321 year Casty et al (2005) precipitation record. Statistically significant correlations are highlighted in bold italics. All data was smoothed and either down-sampled or interpolated to create a
complete record at 4 year sample intervals. These data were detrended, centered and expressed in terms of standard deviation units. 121x53mm (300 x 300 DPI)
Page 37 of 35
http://mc.manuscriptcentral.com/holocene
HOLOCENE
123456789101112131415161718192021222324252627282930313233343536373839404142434445464748495051525354555657585960


![Detecting Carbon Monoxide Poisoning Detecting Carbon ...2].pdf · Detecting Carbon Monoxide Poisoning Detecting Carbon Monoxide Poisoning. Detecting Carbon Monoxide Poisoning C arbon](https://img.pdfslide.us/doc/110x75/5f551747b859172cd56bb119/detecting-carbon-monoxide-poisoning-detecting-carbon-2pdf-detecting-carbon.jpg)