Embed Size (px)
Citation preview

1
DISSERTATION
Titel der Dissertation
“Neuronal basis for directed walking in Drosophila melanogaster”
Verfasser
Salil Sanjay Bidaye (Masters in Biotech.)
angestrebter akademischer Grad
Doktor der Naturwissenschaften (Dr.rer.nat.)
Wien, June, 2012
Studienkennzahl lt. Studienblatt: A 091 490
Dissertationsgebiet It. Studienblatt: Molekulare Biologie
Betreuerin / Betreuer: Dr. Barry J. Dickson

2

3
To Abha and my parents, for their unconditional support throughout my PhD.
4
Acknowledgments:
This work would not have been possible without the help and support of the following people
Barry Dickson conceived the VT library project and provided constant support and supervision
throughout my PhD. He also directly contributed in the design of the VT tiles and the derivatives and in
development of computer tracker for analysis of the behavior.
Christopher Masser shared my work during cloning of the VT library and also helped me in getting
introduced to several molecular biology techniques. Alex Stark performed the computational part for
design of the VT library. Michaella Fellner provided guidance during VT library cloning and has been
directly involved in cloning large parts of the library. Katarina Bartalska also cloned certain sections of
the library (promoter constructs) and was involved along with Evgeny Kvon for verification of the VT
lines. Thomas Micheler created and maintained the constructs database. The injections and generation
of transformants was carried out by the VDRC injection team, Genetic Services Inc. and BestGene Inc,
and coordinated by Krystena Keleman and Barry J. Dickson. Further maintenance of the VT stocks is
carried out by the VDRC team. The staining of VT lines was a combined effort of the VT staining team
(several students and technicians of Dickson lab) and Ann-Shynn Chiang Lab in Taiwan. Tianxiao Liu and
Jai Yu were involved in setting up the image registration system used for all image analysis. Steffanie
Wandl cloned derivate VT lines and corresponding reporters.
Yang Wu shared my work during the activation screen. Anne von Philipsborn established the activation
screen set up. Olga Antonova and Wendan Li carried out large part of the silencing screen. Christian
Machacek developed the computer tracker used for quantifying the behavior for silencing screen.
Andrew Straw provided guidance for clustering techniques. Martin Columbini and David Kummerer from
IMP workshop helped in building different assay setups.
5
Anne von Philipsborn, Tianxiao Liu and Barry Dickson provided helpful feedback on my thesis.
My PhD committee members, Simon Rumpel and Alex Stark monitored my progress throughout my PhD
and provided valuable suggestions. All service departments of IMP/IMBA provided indispensible support
throughout the project (specifically I am grateful to the media kitchen and Mochizuki Lab for providing
their autoclave during the VT cloning project). All past and current members of Dickson lab provided a
great working atmosphere and invaluable scientific discussions and support throughout my PhD.

6
Table of Contents
Acknowledgments: ................................................................................................................................... 4
Synopsis ........................................................................................................................................................ 8
Zusammenfassung ........................................................................................................................................ 9
Chapter 1: Introduction .............................................................................................................................. 11
1.1 Studying neural circuits and behaviors in the invertebrate, Drosophila melanogaster: ............ 11
1.2 Directed walking in insects: ........................................................................................................ 13
References .............................................................................................................................................. 34
Chapter 2: Generation of enhancer-Gal4 Library (VT library): ................................................................... 37
2.1 Background: ...................................................................................................................................... 37
2.2 Design of the enhancer tiles. ............................................................................................................ 39
2.3 Work-flow for generating the VT library. .......................................................................................... 41
2.4 Characterization of the VT library. .................................................................................................... 43
2.5 Extending the VT library: Beyond GAL4 lines .................................................................................... 44
2.6 Methods. ........................................................................................................................................... 46
References .............................................................................................................................................. 49
Chapter 3: Neuronal basis for backward directed walking in fruit flies. .................................................... 50
3.1 Background: ...................................................................................................................................... 50
3.2 Results: .............................................................................................................................................. 51
3.3 Discussion: ........................................................................................................................................ 80

7
3.4: Materials and Methods .................................................................................................................... 87
References. ............................................................................................................................................. 92
Supplementary Figures ........................................................................................................................... 93
Chapter 4: A neuronal silencing screen for forward and backward directed walking. ............................... 95
4.1 Background ....................................................................................................................................... 95
4.2 Results ............................................................................................................................................... 95
4.3 Discussion: ...................................................................................................................................... 112
4.4 Methods .......................................................................................................................................... 113
References ............................................................................................................................................ 114
Supplementary Figures: ........................................................................................................................ 115
Appendices ................................................................................................................................................ 119
Appendix A: Design of the enhancer library ......................................................................................... 119
Appendix B: Current Status of VT library .............................................................................................. 121
Appendix C: Description of 1D-walking tracker parameters. ............................................................... 121
Curriculum vitae ........................................................................................................................................ 122
8
Synopsis
Insects show remarkable adaptability and flexibility in their walking behavior. Although
considerable progress has been made in understanding the mechanisms of motor control and central
pattern generators, very little is known about how higher order neuronal centers control these motor
circuits to determine the walking direction. The objective of the current work was to exploit the power
of Drosophila genetics in order to identify these higher order neuronal centers.
The first part of this work focused on generation of an enhancer GAL4 library which would
enable targeting small populations of neurons in the Drosophila melanogaster nervous system. This
GAL4 library was used to conduct screens for flies in which walking direction is altered upon activation
or silencing of specific neurons. These screens employ either the thermosensitive cation channel dTrpA1
or tetanus toxin light chain (TNT), respectively, which are expressed in subsets of neurons using the
enhancer GAL4 lines. Several GAL4 lines have been identified in each screen, some in both, that result in
altered walking direction without a dramatic effect on the coordination or pace of walking. Further work
was focused on lines that label neurons which on activation induce backward walking, and on silencing
abolish backward walking. Using intersectional genetics and stochastic labeling approaches, it was
possible to pinpoint specific neurons involved in backward directed walking. The last part of the work
focused on systematically analyzing behavioral data from the silencing screen and resulted in providing a
foundation for finding additional neurons involved in backward and forward directed walking.
Thus, in this project, potential higher order neurons responsible for directional control of
walking could be identified. These studies provide an entry point into mapping and ultimately
9
characterizing the neuronal circuitry responsible for higher order control of walking behavior in
Drosophila melanogaster.
Zusammenfassung Insekten zeigen eine bemerkenswerte Anpassungsfähigkeit und Flexibilität in ihrem
Laufverhalten. Die Mechanismen motorischer Kontrolle und die Funktionsweise von „central pattern
generators“ sind vergleichsweise gut erforscht. Sehr wenig ist jedoch bekannt darüber, wie neuronale
Zentren höherer Ordnung motorische Schaltkreise kontrollieren, zielgerichtetes Laufverhalten steuern
und die Laufrichtung bestimmen. Ziel der vorliegenden Arbeit war es, mit Hilfe genetischer Methoden in
Drosophila Komponenten diese neuronalen Zentren höherer Ordnung zu identifizieren und zu
untersuchen.
In der erste Hälfte der Arbeit wird die Erstellung einer Bibliothek von „enhancer tile“ GAL4
Linien beschrieben, mit der spezifische Neuronengruppen im Drosophila Nervensystem manipuliert
werden können. Diese Sammlung von GAL4 Linien wurde mit Aktivierungs- und Deaktivierungsscreens
getestet, um Neuronen zu identifizieren, deren Aktivität Einfluss auf die Laufrichtung der Fliege hat.
Gruppen von Neuronen wurden mit dem thermosensitiven Kationenkanal dTrpA1 aktiviert bzw.mit
Tetanustoxin (TNT) deaktiviert. In den beiden Screens wurden mehrere, zum Teil überlappende GAL4
Linien identifiziert, die nach der jeweiligen Manipulation Veränderungen in der Laufrichtung aufweisen,
während die Laufkoordination oder die Laufgeschwindigkeit unbeeinträchtigt ist. Besonderes Interesse
galt im Weiteren solchen GAL4 Linien, die Neuronen markierten, deren Aktivierung Rückwärtslaufen
herbeiführt oder deren Deaktivierung Rückwärtslaufen verhindert. Mit Hilfe von intersektioneller
genetischer Methoden und stochastischer Markierung von Zellen war es in der Tat möglich, solche
spezifischen Neuronenklassen zu identifizieren und zu untersuchen. Im letzten Teil der Arbeit wurde der
10
gesamte Datensatz des Deaktivierungsscreens systematisch analysiert, was eine wichtige Grundlage
dafür legte, weitere Neuronen zu finden, die eine Rolle für den Vorwärts- und Rückwärtslauf spielen.
In der vorliegenden Arbeit konnten Komponenten neuronaler Zentren höherer Ordnung
identifiziert werden, die Einfluss auf die Laufrichtung haben. Letzteres eröffnet neue Möglichkeiten, den
neuronalen Schaltkreis für die umfassende Kontrolle des Laufverhaltens in Drosophila melanogaster mit
zellulärer Auflösung zu entschlüsseln und funktional zu charakterisieren.

11
Chapter 1: Introduction
1.1 Studying neural circuits and behaviors in the invertebrate,
Drosophila melanogaster:
Invertebrates have been extensively used as model systems for studying neural circuits, since
the times of Fridtjof Nansen, who worked on the mollusk (Myxine glutinosa) and Ramon Cajal, who
worked among other things also on the house fly (Calliphora vomitoria), more than a century
(Strausfeld 2012). The most important advantage of invertebrate nervous systems is the reduced
number of neurons and connections as compared to vertebrate systems (invertebrates have on an order
of < 105 neurons whereas vertebrates have on the order of 107 to 1010 neurons, (North and Greenspan
2007)). This makes it possible in invertebrates to physically identify single neurons and test their
functionality. However, across the several invertebrate phyla, the nervous systems span from those of
relatively simple organisms like mollusks and nematodes with few hundred to thousand neurons, to
relatively complex systems of arthropods (insects and crustaceans) with hundred to thousand fold
higher neuron numbers. Correspondingly, it has been easier to study the lower invertebrates and there
exists a better understanding of structure and function of their nervous systems. However, at a
behavioral level these animals are much simpler and exhibit less complex behaviors. Higher
invertebrates like insects and crustaceans on the other hand display a spectacular array of behaviors and
at the same time have nervous systems much simpler than vertebrates. Moreover, these animals occupy
similar ecological niche as several vertebrates and hence have to solve similar behavioral problems and
seem to have evolved similar solutions at the behavioral level (convergent evolution). It would be
therefore interesting to find out if the behavioral similarities also extend to the level of workings of the
underlying neural circuitry.

12
Although it is possible to identify and test single neurons of the invertebrate nervous systems, it
is not a trivial task to identify every single neuron and every single connection. To date this has been
only achieved in the case of the nematode Caenorhabditis elegans which has only 302 neurons. Every
single neuron and its connection (the connectome) of this organism has been mapped using electron
microscopy as a result of a comprehensive effort (White, Southgate et al. 1986). In present times, we are
still far from finishing a similar map in case of higher invertebrates which probably have around
thousand fold higher neuron numbers as compared to C. elegans. This poses a challenge, how does one
identify and access every single neuron, or at least every single functionally relevant neuron for the
behavior of interest, in a higher invertebrate organism? There are two broad categories of solutions to
this problem.
The first approach is to focus on easily accessible and partially isolated subsets of the entire
nervous system and try to understand the functioning of this relatively small neuronal network. This was
the traditionally opted approach and has yielded very insightful results. Usually the easiest access points
for any neural circuit are the regions near the input (sensory systems) or output (motor systems), and
hence most of the early work in the field focused on these two regions. Electrophysiological recordings
from these regions have been performed in several arthropods ranging from the crab stomatogastric
ganglion to stick insect leg motor and sensory feedback circuits to the optic lobes of the house fly. This
approach continues to yield important new insights about the basic principles of neural circuit functions.
The second approach is to use genetic strategies for targeting specific neuronal populations and
then addressing the functionality of these neurons. The fruit fly, Drosophila melanogaster, which has
been one of the most popular genetic model organisms since more than hundred years, provides a
plethora of genetic tools for carrying out such neuronal targeting. The biggest advantage of this
approach over the first one is that this is not restricted to any particular region of the nervous system. In
13
principle one can label any neuron in the entire nervous system and hence try to address questions that
go beyond the level of sensory and motor systems. The most prevalent technique used for this approach
is based on the use of the Gal4/UAS system. Gal4 is a yeast transcriptional activator that binds to a
genomic region containing UAS (Upstream Activating Sequence) element and activates the expression of
any gene downstream to this. This Gal4/UAS system in Drosophila employs expression of “Gal4” in a
neuronal population by creating transgenic flies which contain a Gal4 coding region under the influence
of transcriptional regulators of a neuronally expressed gene. When such transgenic “driver lines” are
crossed to transgenic “reporter lines” which contain a UAS element followed by reporter gene (e.g. GFP)
then the reporter protein will be expressed in same neuronal population that expresses Gal4. One can
also exchange the reporter for a neuronal silencer or activator and thereby manipulate the activity of
the Gal4 targeted neurons. The major problem of this approach however is the difficulty of labeling
single neurons at a time. Since the Drosophila CNS contains over 100000 neurons it is not easy to
employ genomic regulators to express the Gal4 in one or few neurons at a time. This has been a subject
of constant interest in the field of Drosophila Neuroscience and Chapter 2 of this thesis will address this
issue in further detail.
1.2 Directed walking in insects:
Locomotion towards or away from the source of a sensory input is probably one of the most
basic and commonly observed behavioral response. E.g. A bacterium moving along a chemical gradient
or a gazelle running away from a sprinting cheetah. Goal directed locomotion forms an integral part of
an animal’s most crucial behaviors like foraging, seeking a mate or escaping predators. In most
terrestrial animals locomotion is achieved by walking on supporting appendages (legs). Although many
insects can fly, walking forms an important component of several essential behaviors, like courtship,

14
foraging and selecting appropriate sites for egg laying. In all these behaviors insects exhibit amazingly
precise and dynamic control over the direction of walking. Change in the walking direction is a
behavioral output of a neural circuit that receives information through several sense organs (eyes,
antennae, proprioceptors etc), then processes this information and makes decisions about choosing the
direction of the next walking step. Thus, directed walking in insects can serve as an excellent model for
studying neural processing at different levels.
1.2.1 Mechanics of Insect Walking:
Before trying to understand the neuronal basis of a behavior it is important to get a detailed
view of the behavioral readout. Insect walking is a temporally coordinated execution of motor outputs.
During walking an insect leg can be defined to be in either a stance phase (leg touching the surface) or a
swing phase (leg in the air) (Figure 1.1A). As each leg can exist in 2 states, an insect with 6 legs can in
theory exhibit 26 = 64 configurations. A temporal walking sequence must consist of transition between
at least two such consecutive configurations. Therefore total number of transitions possible is basically
all possible permutations between pairs of configurations (64P2 = 4032). However there is a strong
constraint on which configurations and transitions are realized in an actual walking insect. The major
driving force for this constraint is the necessity to maintain mechanical stability. Insects don’t usually
hop like kangaroos (there are exceptions like grasshoppers) and hence the obvious exclusion to the
possible configurations is the one in which all legs are in swing phase at the same time. Moreover for
proper stability at least three legs of an insect should be in stance phase at the same time. However,
three legs can only provide stability if they are present in a tripod configuration (Figure 1.1B, C). Apart
from the two possible tripod configurations in all other configurations insects have at least four legs in
stance phase at the same time. The problem boils down to all possible ways of choosing 4 out of 6 legs
to be in stance(6C4 = 15) OR 5 out of 6 legs to be in stance (6C5 = 6) OR all legs in stance(6C6 = 1). Summing
up the tripod and other mechanically possible configurations we are now left with only 24 possible
15
configurations which can still yield 552 ((24P2) possible transitions. Out of these, which transitions should
actually take place is a non-trivial problem and the solution is chosen so as to optimize the current
walking state of the insect which is defined by its walking speed and direction. A walking pattern is a
repeating pattern found in a temporal series of such configurations.
Experimental observations of insect walking carried out in stick insects (Wilson 1966; Epstein
and Graham 1983), cockroaches(Delcomyn 1971; Bender, Simpson et al. 2011), fruit flies(Strauss and
Heisenberg 1990) and other insect species have provided insightful results as to which walking patterns
occur frequently in a particular walking state. The following sections will contain a brief overview of
patterns occurring in different walking states, viz. Forward Walking, Turning and Backward walking and
will also mention the similarities and differences between the studied insect species, particularly the
stick insect (Carausius morosus), cockroach (Periplaneta americana or Blaberus discoidalis) and fruit fly
(Drosophila melanogaster). The gross difference between these species is evident when one looks at
their walking speeds: stick insects are very slow walking whereas cockroaches are fast walking. Fruit flies
are relatively fast walking as compared to stick insects but their walking speed is slower than
cockroaches. However if one looks at their stepping frequencies then flies are much similar to
cockroaches.
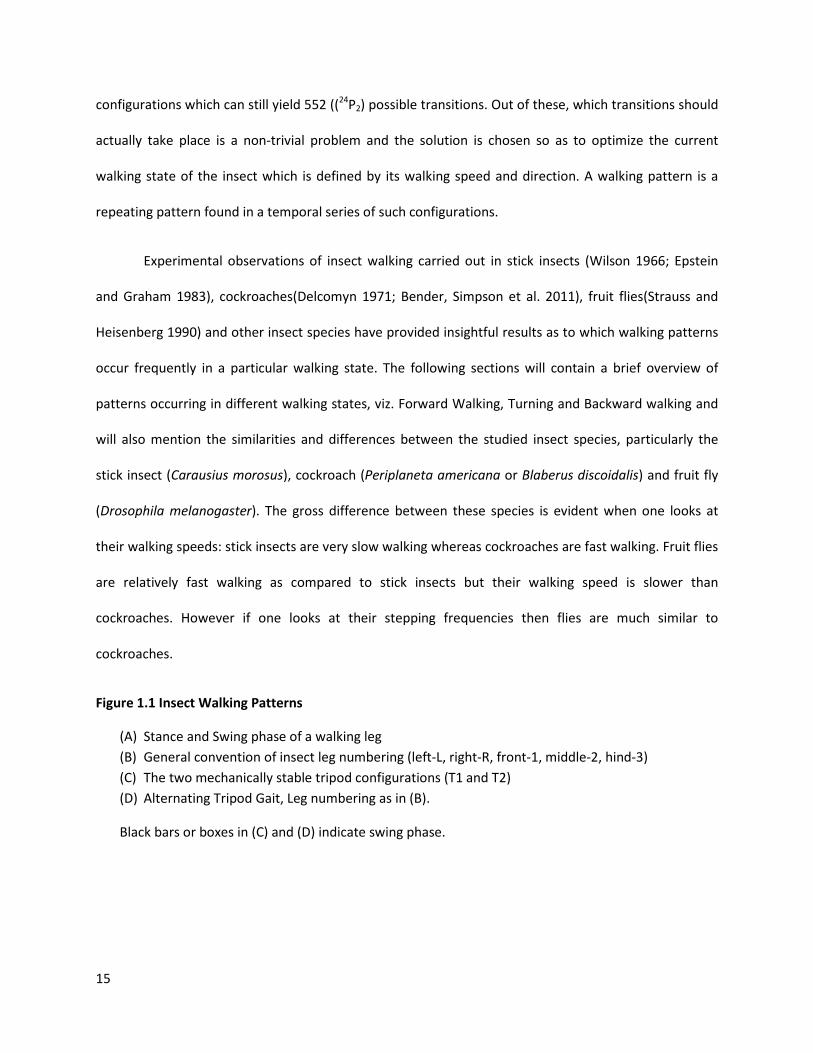
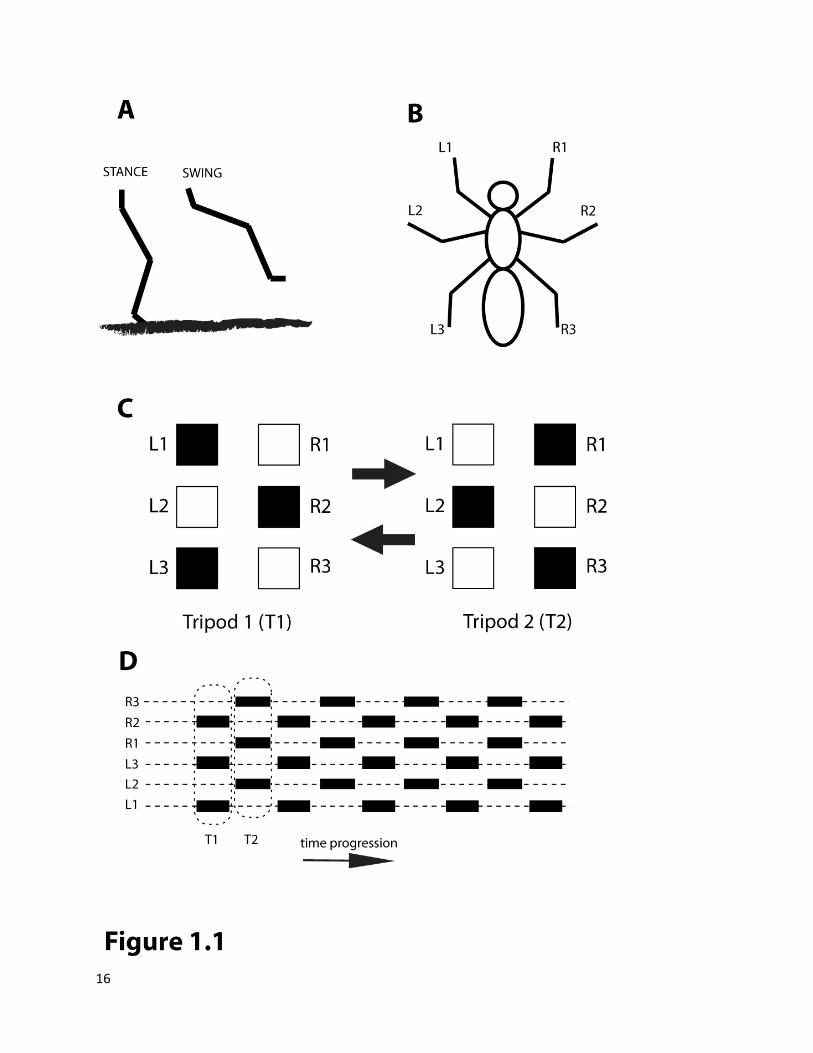
Figure 1.1 Insect Walking Patterns
(A) Stance and Swing phase of a walking leg (B) General convention of insect leg numbering (left-L, right-R, front-1, middle-2, hind-3) (C) The two mechanically stable tripod configurations (T1 and T2) (D) Alternating Tripod Gait, Leg numbering as in (B).
Black bars or boxes in (C) and (D) indicate swing phase.
16
17
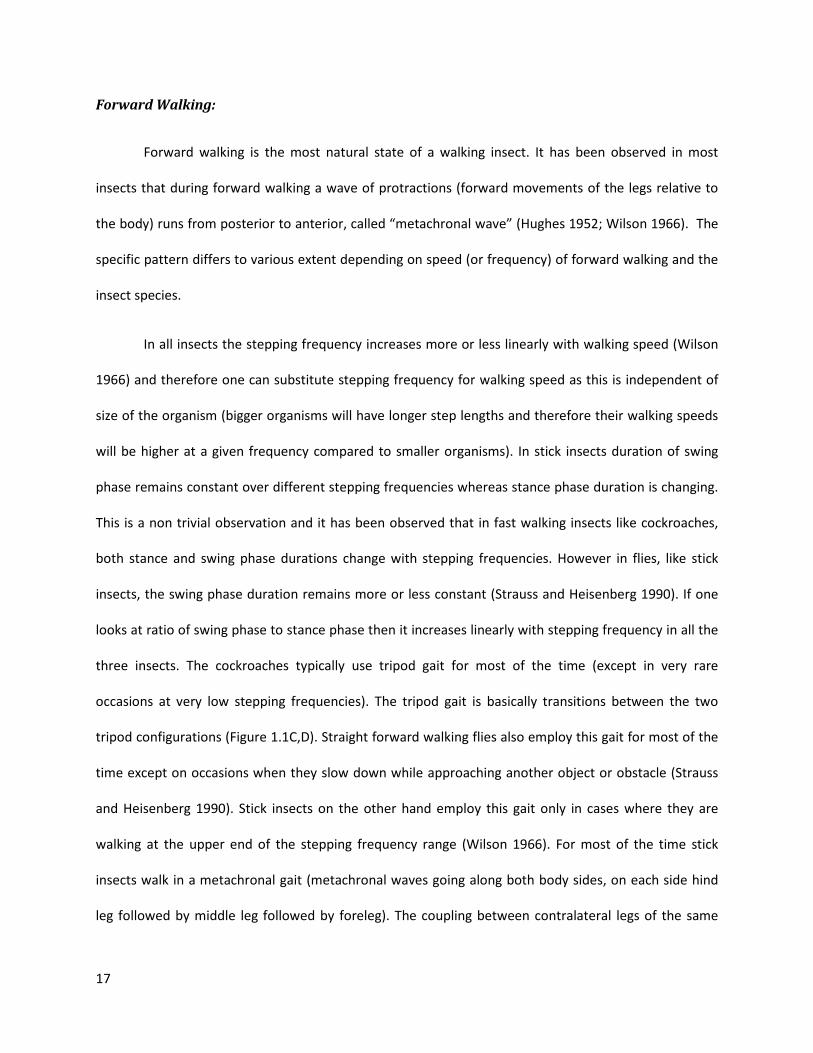
Forward Walking:
Forward walking is the most natural state of a walking insect. It has been observed in most
insects that during forward walking a wave of protractions (forward movements of the legs relative to
the body) runs from posterior to anterior, called “metachronal wave” (Hughes 1952; Wilson 1966). The
specific pattern differs to various extent depending on speed (or frequency) of forward walking and the
insect species.
In all insects the stepping frequency increases more or less linearly with walking speed (Wilson
1966) and therefore one can substitute stepping frequency for walking speed as this is independent of
size of the organism (bigger organisms will have longer step lengths and therefore their walking speeds
will be higher at a given frequency compared to smaller organisms). In stick insects duration of swing
phase remains constant over different stepping frequencies whereas stance phase duration is changing.
This is a non trivial observation and it has been observed that in fast walking insects like cockroaches,
both stance and swing phase durations change with stepping frequencies. However in flies, like stick
insects, the swing phase duration remains more or less constant (Strauss and Heisenberg 1990). If one
looks at ratio of swing phase to stance phase then it increases linearly with stepping frequency in all the
three insects. The cockroaches typically use tripod gait for most of the time (except in very rare
occasions at very low stepping frequencies). The tripod gait is basically transitions between the two
tripod configurations (Figure 1.1C,D). Straight forward walking flies also employ this gait for most of the
time except on occasions when they slow down while approaching another object or obstacle (Strauss
and Heisenberg 1990). Stick insects on the other hand employ this gait only in cases where they are
walking at the upper end of the stepping frequency range (Wilson 1966). For most of the time stick
insects walk in a metachronal gait (metachronal waves going along both body sides, on each side hind
leg followed by middle leg followed by foreleg). The coupling between contralateral legs of the same

18
segment seems to be more stringent (perfect antiphase) in case of cockroaches and flies as compared to
stick insects.
Turning:
Turning during walking in insects is achieved by manipulating the following parameters:
1) Change in direction of stepping of every leg
2) Change in number of steps on inner versus outer body-side of the turn.
3) Change in step length of inner versus outer body-side of the turn.
In stick insects all of the above mentioned parameters are seen to be manipulated (Gruhn, Zehl
et al. 2009) whereas in flies the number of steps seems to remain always constant on both sides of the
body and the other two parameters are manipulated (Strauss and Heisenberg 1990). Flies and
cockroaches (Camhi and Levy 1988) also show pure rotational turns in which the insect almost turns on
the spot by manipulating only the stepping direction of the legs.
Backward Walking:
In a freely walking insect in a natural environment, backward walking is seen only as a
component of tight turns (turns > 180o). In this type of walking usually the legs on only one side are
walking backwards whereas the other side provides the turning component (Graham and Epstein 1985;
Strauss and Heisenberg 1990). Long straight backward walks where legs on both sides are walking
backwards are almost never observed in freely walking insects. These kind of walks are fairly common in
crustaceans like lobsters (Clarac and Cruse 1982). However stick insects and cockroaches can be
artificially stimulated to induce straight backward walks by gently plucking on their antennae. When
such induced backward walks were analyzed in the stick insect it was seen that the walking pattern is
well coordinated and insects walked using either the usual metachronal pattern (hind-middle-forward)
or sometimes even the exact reverse pattern (front-middle-hind) (Graham and Epstein 1985). Also it is

19
obvious that the stepping direction of every leg is directed backwards in this case. Furthermore, it has
also been shown in tethered stick insects that just like forward walking, only duration of stance phase
changes with changes in the backward stepping frequency (Rosenbaum, Wosnitza et al. 2010).
1.2.2 Neuronal control of walking in insects:
Muscles and Motor Neurons:
The actual effectors of walking behavior are the muscles that control every joint in every leg of
an insect. Insect legs are multi-segmented appendages. The major leg segments in a proximal to distal
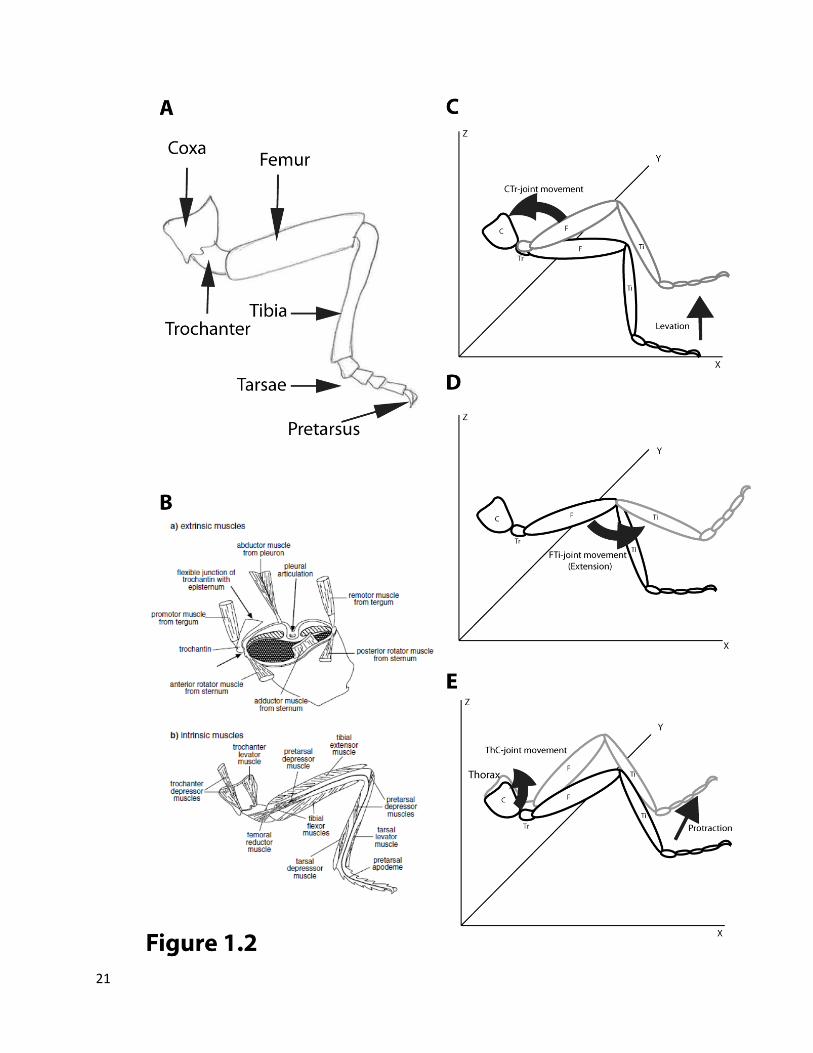
order are coxa, trochanter, femur, tibia and the tarsi (Figure 1.2A) (Chapman 1998). The movement of a
leg during walking is controlled at three major joints: the Thorax-Coxa joint (ThC) the Coxa-Trochanter
joint (CTr) and the Femur-Tibia joint (FTi). The femur is usually immovably fused with the trochanter
(there are some exceptions like in cockroach this joint moves during climbing behavior) (Chapman
1998). The segmental structure of legs and the muscle attachments that move these segments seems to
be well conserved over different studied insect species. The muscles involved in moving the walking legs
can be divided into two categories:
a) Extrinsic Muscles: These have their attachments outside the legs, on the thorax and are mainly
involved in the movement of the ThC-joint (Figure1.2B). The promoter-remotor muscles are
mainly important for protraction and retraction movements of the legs (forward-backward, see
Figure 1.2E) whereas the other muscles are important in changing leg stepping directions,
especially important in turning state.
b) Intrinsic Leg Muscles: These have attachments inside the legs. Apart from the ThC-joint, the
other joints are associated with pairs of antagonistic muscle groups (Figure 1.2B). The

20
Figure 1.2 Insect legs, muscles and joint movements.
(A) Segments of an insect leg. (B) Musculature controlling movement of leg joints. Extrinsic muscles a) have attachments in thorax
whereas intrinsic muscles b) have attachments inside the leg. This panel has been adopted from (Chapman 1998).
(C) Movement of Coxa Trochanter (CTr-) joint results in levation (lifting up) of the leg. (D) Movement of Femur Tibia (FTi-) joint results in flexion or extension. (E) Movement of Thorax Coxa (ThC-) joint results in protraction (moving forward) of the leg,
21
22
trochanter levator and depressor muscles are important in elevating and depressing the leg
(lifting the leg in the air and putting it down, Figure 1.2C). The tibial flexor and extensor muscles
are important for flexing and extending the FTi-joint (Figure 1.2D) and thereby generating
pulling and pushing forces on the surface while walking (Chapman 1998) The well coordinated
and antiphasic contractions of antagonistic muscle pairs drives the entire walking sequence of
the insect. A single forward walking step cycle can be divided into the following pattern of
muscle activities (Figure 1.3A):
1) Forward Swing Phase
2)
: Trochanter levator muscle contracts and elevates the leg above the
surface. At the same time or slightly before this, the Tibia is relaxed off the surface by either
extending FTi joint using the tibia extensor muscle (in case of front or middle leg) or by
contracting FTi joint using tibia flexor muscle (in case of hind legs). The elevated leg is then
moved in the forward direction (protracted) by contraction of the coxal promoter muscles.
Forward Stance Phase
Each of these muscles controlling leg movements are innervated by motor neurons that are the
source of induction for the muscle action. Some of these motor neurons are fast spiking neurons
whereas others are slow (Chapman 1998), and there are also some inhibitory neurons innervating the
muscles (Iles and Pearson 1971; Pearson and Iles 1971) . These motor neurons have their cell bodies and
dendritic arborizations in the Central Nervous System (CNS), specifically in the thoracic ganglia and send
their axonal projections to defined muscles in the legs and thorax. Most of the motor neurons in insects
are glutamatergic, i.e. use glutamate as neurotransmitter (North and Greenspan 2007). Therefore, in
: The leg is brought down on the substrate by contracting the
trochanter depressor muscle. At the same time or slightly before this, the Tibia is either
pushed against the surface by extending the tibia using contraction of tibia extensor muscle
(in case of hind leg), or the tibia is pulled against the surface using the contraction of the
tibia flexor muscle (in case of front or middle leg).
23
Drosophila melanogaster, it is possible to genetically target this population using a Vglut-Gal4 (Vesicular
glutamate transporter) driver (Mahr and Aberle 2006). This targeting strategy has been successfully
used to characterize the anatomy and development of these motor neurons (Baek and Mann 2009;
Brierley, Rathore et al. 2011). Electrophysiological recordings from motor neurons innervating the
before mentioned antagonistic muscles has successfully demonstrated that their activity is in exact
temporal correlation with expected muscle activities. Moreover it has been shown in stick insects and
cockroaches that upon activation of a locomotor state, the leg motor neurons get tonically depolarized
to a subthreshold level. This increases their excitability and the alternating activation and inactivation of
these motor neurons is brought about by excitatory and inhibitory inputs overlaid on this tonic
excitation. The tonic excitation is speculated to originate from descending neurons arising in the
subesophageal ganglion (SOG) since this is not abolished by circumesophageal legion but abolished by
lesion downstream of SOG (Buschges, Ludwar et al. 2004).
Central Pattern Generators (CPGs):
It is apparent from the previous section that the rhythmic firing of the motor neurons connected
to antagonistic muscles controlling the different leg joints is crucial for generation of walking behavior in
insects. What drives these motor neurons to fire in a specific rhythm?
Rhythmic motor output is a common feature of several behaviors like respiration, ingestion,
peristalsis, locomotion etc. The existence of central neuronal circuits that can autonomously produce
rhythmic motor outputs (CPGs) was proposed in the early 20th century (Brown 1914) while analyzing the
locomotor activity of cat. However for a long time after that, most neuroscientists believed that
rhythmic motor patterns are simply a consequence of chains of sensory-motor reflexes (Marder and
Bucher 2001). One of the earliest experiments to prove the existence of central pattern generating
circuits was in fact related to insect locomotion. Wilson and colleagues showed that even after
24
disconnecting brain connections to the ventral nerve cord (deafferenting) of a locust, it is still possible to
observe rhythmic flight like motor patterns (Wilson and Wyman 1965). The conclusive experiments for
proving existence of CPGs however came from completely isolated neuronal circuits (circuits devoid of
any sensory pathways), placed in a Petri dish which could still be stimulated to produce rhythmic firing
patterns (Marder and Bucher 2001). The crustacean stomatogastric ganglion is one such example.
Electrophysiological studies on such systems have provided a wealth of information about how these
neuronal elements are able to produce rhythmic motor outputs. The CPGs are usually comprised of
premotor interneurons, although in certain cases motor neurons have also been showed to be a part of
pattern generating mechanism (Heitler 1978). There are two basic neuronal elements (not mutually
exclusive) that may contribute to the production of rhythmic output of the CPGs:
1) Pacemaker Neurons: These are neurons that have an inherent ability to produce oscillating
outputs owing to their membrane ion channels. Several ion channels have been shown to
contribute towards production of pacemaker kind of activity of a neuron (Harris-Warrick
2010). Typically, these neurons are usually capable of depolarizing-followed by sustained
firing or plateau region which generally leads to fatigue and hyperpolarization- followed by
hyperpolarization induced depolarizing currents which start the cycle all over again. The
unique mix of ion channels in a pacemaker neuron, typically defines the frequency of its
rhythm. These type of neurons are involved in generation of the pyloric rhythm in the crab
stomatogastric ganglion (Marder and Bucher 2001).
2) Oscillating circuits: Rhythmic output can even be achieved at a circuit level by employing
similar strategies as the pacemaker neurons, specifically fatigue based inhibition in an
excitatory interneuron circuit. This type of mechanism has been shown to generate the
rhythmic pattern in the segmental unit CPG of a lamprey(Grillner, McClellan et al. 1981). On
the other hand, certain neuronal circuit elements can also attain a rhythmic firing output in
25
absence of pacemaker neurons or similar strategies. A mutually inhibitory half oscillator
circuit is most common such example in which inhibitory interneurons feedback on
antagonistic excitatory neurons to alternate the firing pattern. This type of network has
been observed in several locomotor like CPGs including the cat limb extensors and flexors
which were first suggested by Brown (Brown 1914; Marder and Bucher 2001).
Looking at the high degree of flexibility and adaptability observed in walking insects it may be
guessed that this is not a result of one but in fact several CPGs acting in concord but which can be
modulated independently to some extent. It has been indeed shown in stick insects that there are
separate CPGs controlling every joint of every leg during walking. Evidence comes from the fact that
neuronal activity of the motor neurons at every joint can be decoupled from that of the neurons at
other joints of the same leg or between different legs (Bassler and Wegner 1983; Buschges, Schmitz et
al. 1995; Bassler and Buschges 1998). However precise identification of neurons comprising the CPGs is
not clear apart from few premotor interneurons that have been identified in stick insects and locusts
(Burrows 1992; Bassler and Buschges 1998).
Sensory Feedback:
Since every joint of every leg is controlled by an individual CPG, the entire walking sequence is
basically an output of 18 CPGs. It is obvious that the activity of these CPGs has to be precisely
coordinated for the emergence of a proper walking pattern. In addition to muscles and motor neurons
each leg also contains a variety of sensory neurons. Specifically the sensory neurons that convey the
information about movement and position of the leg (by femoral chordotonal organ,fCO) and about
load or cuticular strain on the leg (by campaniform sensilla, CS) are thought to be major contributors for
bringing about the proper coordination of the CPGs. Coordination has to happen at two levels, between
26
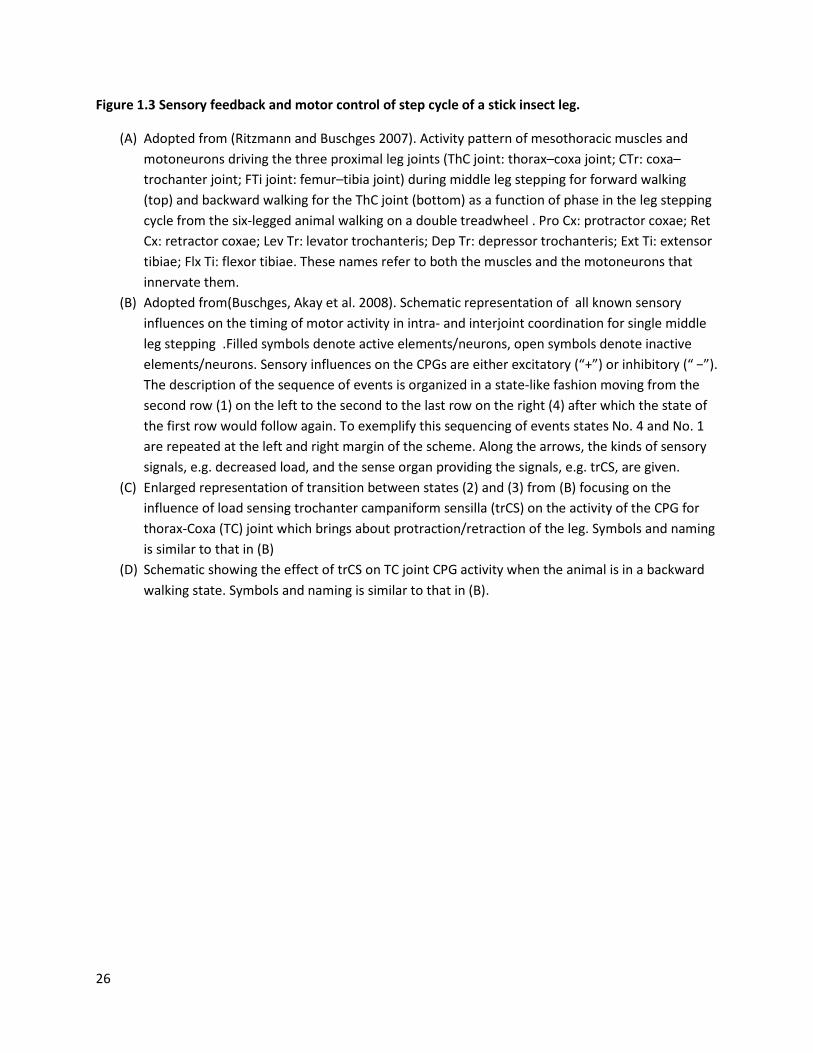
Figure 1.3 Sensory feedback and motor control of step cycle of a stick insect leg.
(A) Adopted from (Ritzmann and Buschges 2007). Activity pattern of mesothoracic muscles and motoneurons driving the three proximal leg joints (ThC joint: thorax–coxa joint; CTr: coxa–trochanter joint; FTi joint: femur–tibia joint) during middle leg stepping for forward walking (top) and backward walking for the ThC joint (bottom) as a function of phase in the leg stepping cycle from the six-legged animal walking on a double treadwheel . Pro Cx: protractor coxae; Ret Cx: retractor coxae; Lev Tr: levator trochanteris; Dep Tr: depressor trochanteris; Ext Ti: extensor tibiae; Flx Ti: flexor tibiae. These names refer to both the muscles and the motoneurons that innervate them.
(B) Adopted from(Buschges, Akay et al. 2008). Schematic representation of all known sensory influences on the timing of motor activity in intra- and interjoint coordination for single middle leg stepping .Filled symbols denote active elements/neurons, open symbols denote inactive elements/neurons. Sensory influences on the CPGs are either excitatory (“+”) or inhibitory (“ −”). The description of the sequence of events is organized in a state-like fashion moving from the second row (1) on the left to the second to the last row on the right (4) after which the state of the first row would follow again. To exemplify this sequencing of events states No. 4 and No. 1 are repeated at the left and right margin of the scheme. Along the arrows, the kinds of sensory signals, e.g. decreased load, and the sense organ providing the signals, e.g. trCS, are given.
(C) Enlarged representation of transition between states (2) and (3) from (B) focusing on the influence of load sensing trochanter campaniform sensilla (trCS) on the activity of the CPG for thorax-Coxa (TC) joint which brings about protraction/retraction of the leg. Symbols and naming is similar to that in (B)
(D) Schematic showing the effect of trCS on TC joint CPG activity when the animal is in a backward walking state. Symbols and naming is similar to that in (B).

27
28
the joints of a single leg (inter-joint coordination) and across the CPGs of different legs (inter-leg
coordination).
1) Inter-joint coordination: This is necessary for the proper stepping cycle execution and
defines the stance and swing phase duration as well as the stepping direction of the leg.
Sensory feedback seems to play a major role in bringing about this coordination. A typical
stick insect stepping cycle and role of sensory feedback is illustrated in the Figure 1.3B
(Buschges, Akay et al. 2008). The femoral chordotonal organ and femur tibia joint sensors
sense the flexion and extension of the tibia and convey the information to CTr joint and
influence levation or depression of the leg. Similarly load signals sensed by femoral
campaniform sensilla (fCS) convey the information to FTi-joint and bring about
flexion/extension movement, and load signals sensed by trochanteral campaniform sensilla
(trCS) convey the information to the ThC-joint and bring about protraction/retraction of
legs. Thus sequential activity of the joint CPGs is brought about by sequential recruitment of
these sensory neurons. As mentioned in a previous section when a stick insect is forced to
switch from forward to backward walking state, the only change at the level of muscle and
motor neuron activity is reversal of the phase of protractor-retractor (also called promoter
remoter) muscles and motor neurons. In the light of the role of sensory feedback
mechanisms, this basically boils down to the fact that same load signals conveyed by the
trCS to the ThC-joint bring about a reverse effect (Figure 1.3 C and D) when the insect is in
backward walking state as compared to a forward walking state (Rosenbaum, Wosnitza et
al. 2010; Buschges 2012; Hellekes, Blincow et al. 2012). At the same time, it is important to
note that activities of all other joints are completely unaffected.
2) Inter-leg coordination: This is what defines the walking pattern of the insect. Just analyzing
the walking pattern at a behavioral level, Cruse and colleagues were able to come up with
29
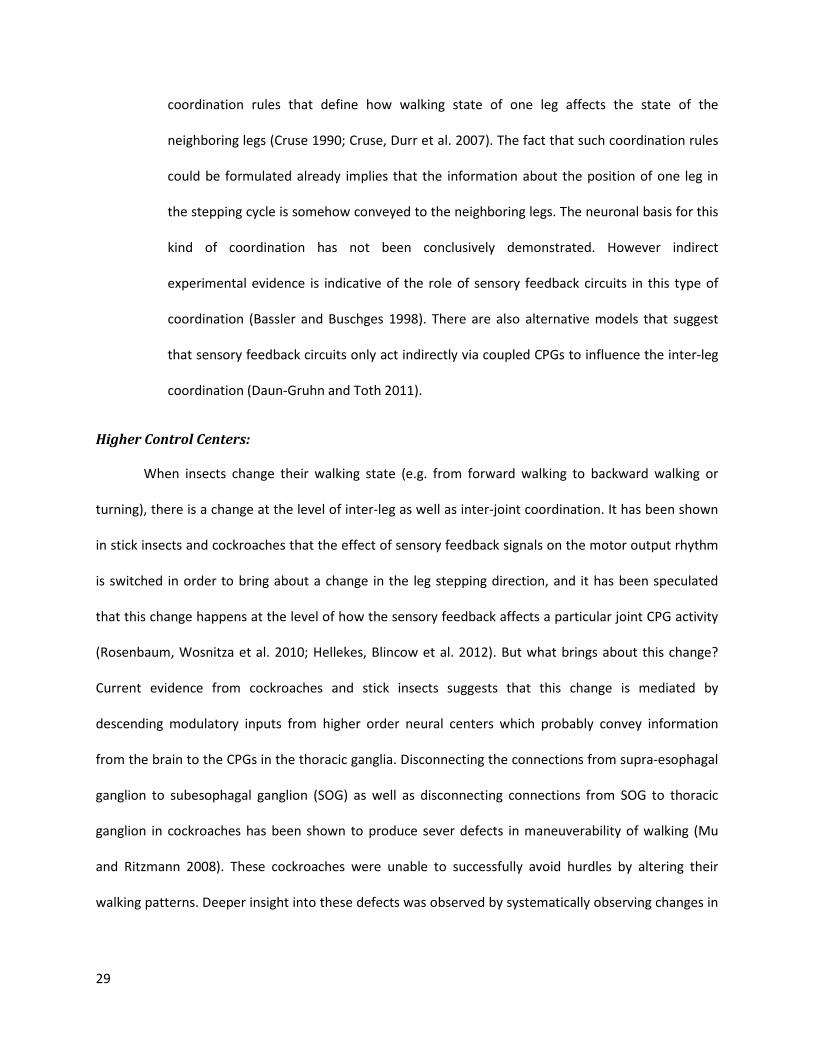
coordination rules that define how walking state of one leg affects the state of the
neighboring legs (Cruse 1990; Cruse, Durr et al. 2007). The fact that such coordination rules
could be formulated already implies that the information about the position of one leg in
the stepping cycle is somehow conveyed to the neighboring legs. The neuronal basis for this
kind of coordination has not been conclusively demonstrated. However indirect
experimental evidence is indicative of the role of sensory feedback circuits in this type of
coordination (Bassler and Buschges 1998). There are also alternative models that suggest
that sensory feedback circuits only act indirectly via coupled CPGs to influence the inter-leg
coordination (Daun-Gruhn and Toth 2011).
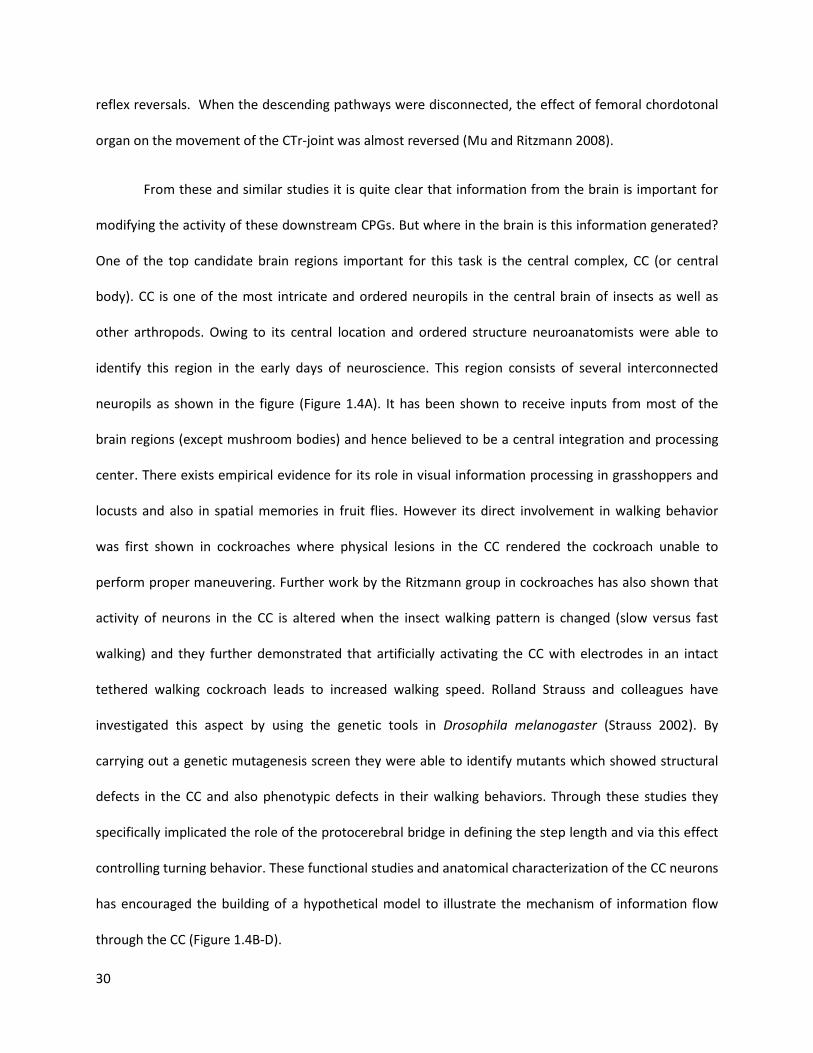
Higher Control Centers:
When insects change their walking state (e.g. from forward walking to backward walking or
turning), there is a change at the level of inter-leg as well as inter-joint coordination. It has been shown
in stick insects and cockroaches that the effect of sensory feedback signals on the motor output rhythm
is switched in order to bring about a change in the leg stepping direction, and it has been speculated
that this change happens at the level of how the sensory feedback affects a particular joint CPG activity
(Rosenbaum, Wosnitza et al. 2010; Hellekes, Blincow et al. 2012). But what brings about this change?
Current evidence from cockroaches and stick insects suggests that this change is mediated by
descending modulatory inputs from higher order neural centers which probably convey information
from the brain to the CPGs in the thoracic ganglia. Disconnecting the connections from supra-esophagal
ganglion to subesophagal ganglion (SOG) as well as disconnecting connections from SOG to thoracic
ganglion in cockroaches has been shown to produce sever defects in maneuverability of walking (Mu
and Ritzmann 2008). These cockroaches were unable to successfully avoid hurdles by altering their
walking patterns. Deeper insight into these defects was observed by systematically observing changes in
30
reflex reversals. When the descending pathways were disconnected, the effect of femoral chordotonal
organ on the movement of the CTr-joint was almost reversed (Mu and Ritzmann 2008).
From these and similar studies it is quite clear that information from the brain is important for
modifying the activity of these downstream CPGs. But where in the brain is this information generated?
One of the top candidate brain regions important for this task is the central complex, CC (or central
body). CC is one of the most intricate and ordered neuropils in the central brain of insects as well as
other arthropods. Owing to its central location and ordered structure neuroanatomists were able to
identify this region in the early days of neuroscience. This region consists of several interconnected
neuropils as shown in the figure (Figure 1.4A). It has been shown to receive inputs from most of the
brain regions (except mushroom bodies) and hence believed to be a central integration and processing
center. There exists empirical evidence for its role in visual information processing in grasshoppers and
locusts and also in spatial memories in fruit flies. However its direct involvement in walking behavior
was first shown in cockroaches where physical lesions in the CC rendered the cockroach unable to
perform proper maneuvering. Further work by the Ritzmann group in cockroaches has also shown that
activity of neurons in the CC is altered when the insect walking pattern is changed (slow versus fast
walking) and they further demonstrated that artificially activating the CC with electrodes in an intact
tethered walking cockroach leads to increased walking speed. Rolland Strauss and colleagues have
investigated this aspect by using the genetic tools in Drosophila melanogaster (Strauss 2002). By
carrying out a genetic mutagenesis screen they were able to identify mutants which showed structural
defects in the CC and also phenotypic defects in their walking behaviors. Through these studies they
specifically implicated the role of the protocerebral bridge in defining the step length and via this effect
controlling turning behavior. These functional studies and anatomical characterization of the CC neurons
has encouraged the building of a hypothetical model to illustrate the mechanism of information flow
through the CC (Figure 1.4B-D).

31
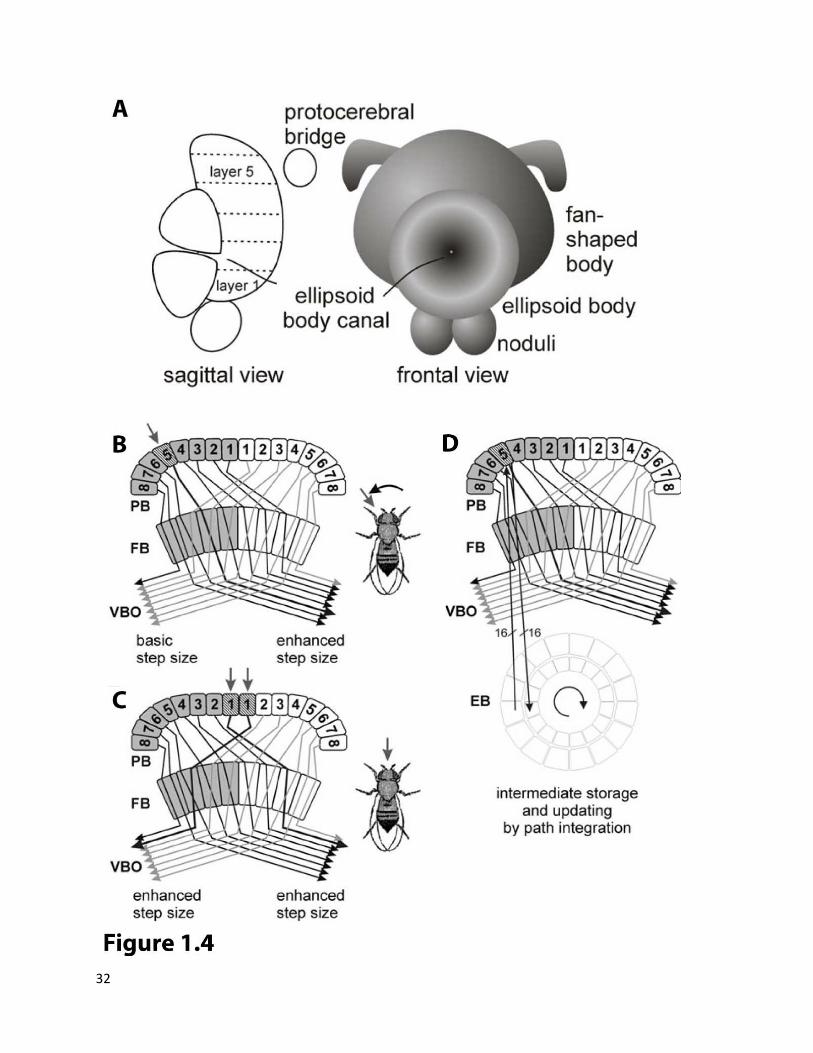
Figure 1.4 Model of role of Central Complex in turning (adopted from (Strauss, Krause et al. 2011)):
(A) Schematic representation of the central complex of Drosophila melanogaster. It is comprised of four neuropilar regions which are interconnected by many projection systems. The diameter of the fan-shaped body is about 100μm.
(B) The azimuth angle of a target is represented on the protocerebral bridge (PB) ipsi-laterally to the eye seeing it. By virtue of the horizontal fiber system of projection neurons from the PB through the fan-shaped body (FB) to the ventral bodies (VBO) step sizes are enhanced contra-laterally to the representation on the PB.
(C) The fly will turn until the object is seen by the binocular ranges of both eyes which are represented by the innermost glomeruli of the PB. Both body sides will enhance their step lengths.
(D) All the information entering the PB is copied to the ellipsoid body (EB; for clarity only one of the 16 glomeruli-to-segment connections is shown). If the target disappears from sight, the EB will feed information back to the PB which is updated by path integration. Its concentric ring structure seems ideal for translating body centered into world centered coordinates.
32

33
All this is indicative of the fact that various sensory stimuli received by the brain are somehow
used to make a decision (probably in the CC) about change or maintenance of the current walking
pattern and then this decision is conveyed to the thoracic ganglia via descending neurons. These
neurons now have an important task of appropriately modifying the activities of one or more joint CPGs
and other inter-leg coordinating centers which will in the end result in execution of the desired walking
pattern and thereby manifest as a directed walking behavior. However, it is striking to note that
currently neither such descending neurons nor the exact locomotor CPG neurons have been identified
and therefore we are still far from asking the question of how these neurons modulate the CPG activity.
34
References
Baek, M. and R. S. Mann (2009). "Lineage and birth date specify motor neuron targeting and dendritic architecture in adult Drosophila." J Neurosci
Bassler, U. and A. Buschges (1998). "Pattern generation for stick insect walking movements--multisensory control of a locomotor program."
29(21): 6904-16.
Brain Res Brain Res RevBassler, U., E. Foth, et al. (1985). "The Inherent Walking Direction Differs for the Prothoracic and
Metathoracic Legs of Stick Insects."
27(1): 65-88.
Journal of Experimental BiologyBassler, U. and U. Wegner (1983). "Motor Output of the Denervated Thoracic Ventral Nerve Cord in the
Stick Insect Carausius-Morosus."
116(May): 301-311.
Journal of Experimental BiologyBender, J. A., E. M. Simpson, et al. (2011). "Kinematic and behavioral evidence for a distinction between
trotting and ambling gaits in the cockroach Blaberus discoidalis."
105(Jul): 127-145.
J Exp BiolBischof, J., R. K. Maeda, et al. (2007). "An optimized transgenesis system for Drosophila using germ-line-
specific phi C31 integrases."
214(Pt 12): 2057-64.
Proceedings of the National Academy of Sciences of the United States of America
Borgmann, A., S. L. Hooper, et al. (2009). "Sensory Feedback Induced by Front-Leg Stepping Entrains the Activity of Central Pattern Generators in Caudal Segments of the Stick Insect Walking System."
104(9): 3312-3317.
Journal of NeuroscienceBrand, A. H. and E. L. Dormand (1995). "The GAL4 system as a tool for unravelling the mysteries of the
Drosophila nervous system."
29(9): 2972-2983.
Curr Opin NeurobiolBrand, A. H. and N. Perrimon (1993). "Targeted Gene-Expression as a Means of Altering Cell Fates and
Generating Dominant Phenotypes."
5(5): 572-8.
DevelopmentBraun, E., B. Geurten, et al. (2010). "Identifying prototypical components in behaviour using clustering
algorithms."
118(2): 401-415.
PLoS OneBrierley, D., K. Rathore, et al. (2011). "Developmental origins and architecture of Drosophila leg
motoneurons."
5(2): e9361.
J Comp NeurolBrown, T. G. (1914). "On the nature of the fundamental activity of the nervous centres; Together with an
analysis of the conditioning of rhythmic activity in progression, and a theory of the evolution of function in the nervous system."
.
Journal of Physiology-LondonBurrows, M. (1992). "Local circuits for the control of leg movements in an insect."
48(1): 18-46. Trends Neurosci
Buschges, A. (2012). "Lessons for circuit function from large insects: towards understanding the neural basis of motor flexibility."
15(6): 226-32.
Curr Opin NeurobiolBuschges, A., T. Akay, et al. (2008). "Organizing network action for locomotion: insights from studying
insect walking."
.
Brain Res RevBuschges, A., B. Ludwar, et al. (2004). "Synaptic drive contributing to rhythmic activation of
motoneurons in the deafferented stick insect walking system."
57(1): 162-71.
Eur J NeurosciBuschges, A., J. Schmitz, et al. (1995). "Rhythmic Patterns in the Thoracic Nerve Cord of the Stick Insect
Induced by Pilocarpine."
19(7): 1856-62.
Journal of Experimental BiologyCamhi, J. M. and A. Levy (1988). "Organization of a Complex Movement - Fixed and Variable
Components of the Cockroach Escape Behavior."
198(2): 435-456.
Journal of Comparative Physiology a-Sensory Neural and Behavioral Physiology
Chapman, R. F. (1998). 163(3): 317-328.
The insects : structure and function
Clarac, F. and H. Cruse (1982). "Comparison of Forces Developed by the Leg of the Rock Lobster When Walking Free or on a Treadmill."
. Cambridge, UK ; New York, NY, Cambridge University Press.
Biological Cybernetics 43(2): 109-114.

35
Cruse, H. (1990). "What mechanisms coordinate leg movement in walking arthropods?" Trends Neurosci
Cruse, H., V. Durr, et al. (2007). "Insect walking is based on a decentralized architecture revealing a simple and robust controller."
13(1): 15-21.
Philos Transact A Math Phys Eng SciDaun-Gruhn, S. and T. I. Toth (2011). "An inter-segmental network model and its use in elucidating gait-
switches in the stick insect."
365(1850): 221-50.
J Comput NeurosciDelcomyn, F. (1971). "Locomotion of Cockroach Periplaneta-Americana."
31(1): 43-60. Journal of Experimental
BiologyDietzl, G., D. Chen, et al. (2007). "A genome-wide transgenic RNAi library for conditional gene
inactivation in Drosophila."
54(2): 443-&.
NatureEpstein, S. and D. Graham (1983). "Behavior and Motor Output of Stick Insects Walking on a Slippery
Surface .1. Forward Walking."
448(7150): 151-6.
Journal of Experimental BiologyGeurten, B. R., R. Kern, et al. (2010). "A syntax of hoverfly flight prototypes."
105(Jul): 215-229. J Exp Biol
Gordon, M. D. and K. Scott (2009). "Motor control in a Drosophila taste circuit."
213(Pt 14): 2461-75.
NeuronGraham, D. and S. Epstein (1985). "Behavior and Motor Output for an Insect Walking on a Slippery
Surface .2. Backward Walking."
61(3): 373-84.
Journal of Experimental BiologyGroth, A. C., M. Fish, et al. (2004). "Construction of transgenic Drosophila by using the site-specific
integrase from phage phi C31."
118: 287-296.
GeneticsGruhn, M., L. Zehl, et al. (2009). "Straight walking and turning on a slippery surface."
166(4): 1775-1782. J Exp Biol
Hamada, F. N., M. Rosenzweig, et al. (2008). "An internal thermal sensor controlling temperature preference in Drosophila."
212(Pt 2): 194-209.
NatureHarris-Warrick, R. M. (2010). "General principles of rhythmogenesis in central pattern generator
networks."
454(7201): 217-20.
Prog Brain ResHeitler, W. J. (1978). "Coupled motoneurones are part of the crayfish swimmeret central oscillator."
187: 213-22.
NatureHellekes, K., E. Blincow, et al. (2012). "Control of reflex reversal in stick insect walking: effects of
intersegmental signals, changes in direction, and optomotor-induced turning."
275(5677): 231-4.
J Neurophysiol
Hughes, G. M. (1952). "The Co-Ordination of Insect Movements .1. The Walking Movements of Insects."
107(1): 239-49.
Journal of Experimental BiologyIles, J. F. and K. G. Pearson (1971). "Coxal Depressor Muscles of Cockroach and Role of Peripheral
Inhibition."
29(2): 267-&.
Journal of Experimental BiologyLai, S. L. and T. Lee (2006). "Genetic mosaic with dual binary transcriptional systems in Drosophila."
55(1): 151-&. Nat
NeurosciMahr, A. and H. Aberle (2006). "The expression pattern of the Drosophila vesicular glutamate
transporter: a marker protein for motoneurons and glutamatergic centers in the brain."
9(5): 703-9.
Gene Expr Patterns
Marder, E. and D. Bucher (2001). "Central pattern generators and the control of rhythmic movements." 6(3): 299-309.
Curr BiolMarkstein, M., C. Pitsouli, et al. (2008). "Exploiting position effects and the gypsy retrovirus insulator to
engineer precisely expressed transgenes."
11(23): R986-96.
Nature GeneticsMu, L. and R. E. Ritzmann (2008). "Interaction between descending input and thoracic reflexes for joint
coordination in cockroach. II comparative studies on tethered turning and searching."
40(4): 476-483.
J Comp Physiol A Neuroethol Sens Neural Behav Physiol 194(3): 299-312.
36
Mu, L. and R. E. Ritzmann (2008). "Interaction between descending input and thoracic reflexes for joint coordination in cockroach: I. descending influence on thoracic sensory reflexes." J Comp Physiol A Neuroethol Sens Neural Behav Physiol
North, G. and R. J. Greenspan (2007). 194(3): 283-98.
Invertebrate neurobiology
Pearson, K. G. and J. F. Iles (1971). "Innervation of Coxal Depressor Muscles in Cockroach, Periplaneta-Americana."
. Cold Spring Harbor, N.Y., Cold Spring Harbor Laboratory Press.
Journal of Experimental BiologyPfeiffer, B. D., A. Jenett, et al. (2008). "Tools for neuroanatomy and neurogenetics in Drosophila."
54(1): 215-&. Proc
Natl Acad Sci U S APfeiffer, B. D., T. T. Ngo, et al. (2010). "Refinement of tools for targeted gene expression in Drosophila."
105(28): 9715-20.
GeneticsRitzmann, R. E. and A. Buschges (2007). "Adaptive motor behavior in insects."
186(2): 735-55. Curr Opin Neurobiol
Rosenbaum, P., A. Wosnitza, et al. (2010). "Activity patterns and timing of muscle activity in the forward walking and backward walking stick insect Carausius morosus."
17(6): 629-36.
J NeurophysiolStrausfeld, N. J. (2012).
104(3): 1681-95. Arthropod Brains: Evolution, Functional Elegance, and Historical Significance
Strauss, R. (2002). "The central complex and the genetic dissection of locomotor behaviour."
, Harvard University Press.
Curr Opin Neurobiol
Strauss, R. and M. Heisenberg (1990). "Coordination of legs during straight walking and turning in Drosophila melanogaster."
12(6): 633-8.
J Comp Physiol AStrauss, R., T. Krause, et al. (2011). Higher Brain Centers for Intelligent Motor Control in Insects
167(3): 403-12.
Intelligent Robotics and Applications, Springer Berlin / Heidelberg. 7102: 56-64. Sweeney, S. T., K. Broadie, et al. (1995). "Targeted expression of tetanus toxin light chain in Drosophila
specifically eliminates synaptic transmission and causes behavioral defects." Neuron
von Philipsborn, A. C., T. X. Liu, et al. (2011). "Neuronal Control of Drosophila Courtship Song."
14(2): 341-51.
Neuron
White, J. G., E. Southgate, et al. (1986). "The structure of the nervous system of the nematode Caenorhabditis elegans."
69(3): 509-522.
Philos Trans R Soc Lond B Biol SciWilson, D. M. (1966). "Insect Walking."
314(1165): 1-340. Annual Review of Entomology
Wilson, D. M. and R. J. Wyman (1965). "Motor Output Patterns during Random and Rhythmic Stimulation of Locust Thoracic Ganglia."
11: 103-&.
Biophys JYu, J. Y., M. I. Kanai, et al. (2010). "Cellular organization of the neural circuit that drives Drosophila
courtship behavior."
5: 121-43.
Curr Biol
20(18): 1602-14.
37
Chapter 2: Generation of enhancer-Gal4 Library (VT library):
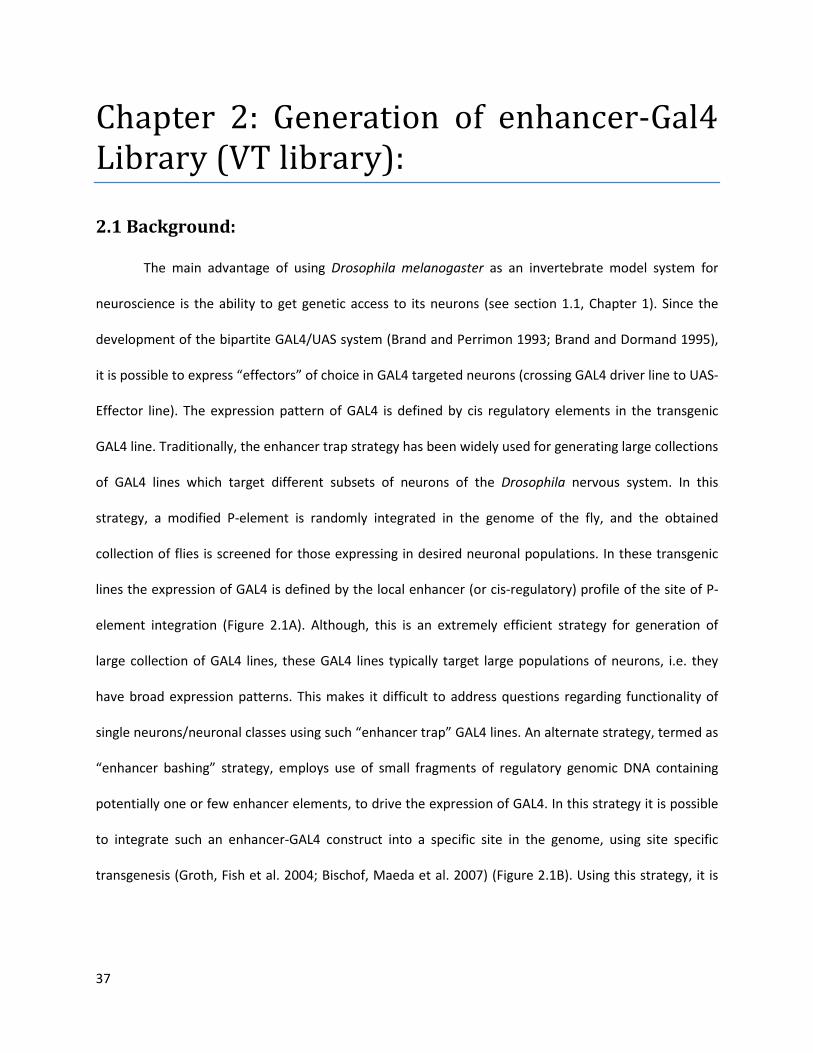
2.1 Background:
The main advantage of using Drosophila melanogaster as an invertebrate model system for
neuroscience is the ability to get genetic access to its neurons (see section 1.1, Chapter 1). Since the
development of the bipartite GAL4/UAS system (Brand and Perrimon 1993; Brand and Dormand 1995),
it is possible to express “effectors” of choice in GAL4 targeted neurons (crossing GAL4 driver line to UAS-
Effector line). The expression pattern of GAL4 is defined by cis regulatory elements in the transgenic
GAL4 line. Traditionally, the enhancer trap strategy has been widely used for generating large collections
of GAL4 lines which target different subsets of neurons of the Drosophila nervous system. In this
strategy, a modified P-element is randomly integrated in the genome of the fly, and the obtained
collection of flies is screened for those expressing in desired neuronal populations. In these transgenic
lines the expression of GAL4 is defined by the local enhancer (or cis-regulatory) profile of the site of P-
element integration (Figure 2.1A). Although, this is an extremely efficient strategy for generation of
large collection of GAL4 lines, these GAL4 lines typically target large populations of neurons, i.e. they
have broad expression patterns. This makes it difficult to address questions regarding functionality of
single neurons/neuronal classes using such “enhancer trap” GAL4 lines. An alternate strategy, termed as
“enhancer bashing” strategy, employs use of small fragments of regulatory genomic DNA containing
potentially one or few enhancer elements, to drive the expression of GAL4. In this strategy it is possible
to integrate such an enhancer-GAL4 construct into a specific site in the genome, using site specific
transgenesis (Groth, Fish et al. 2004; Bischof, Maeda et al. 2007) (Figure 2.1B). Using this strategy, it is
38
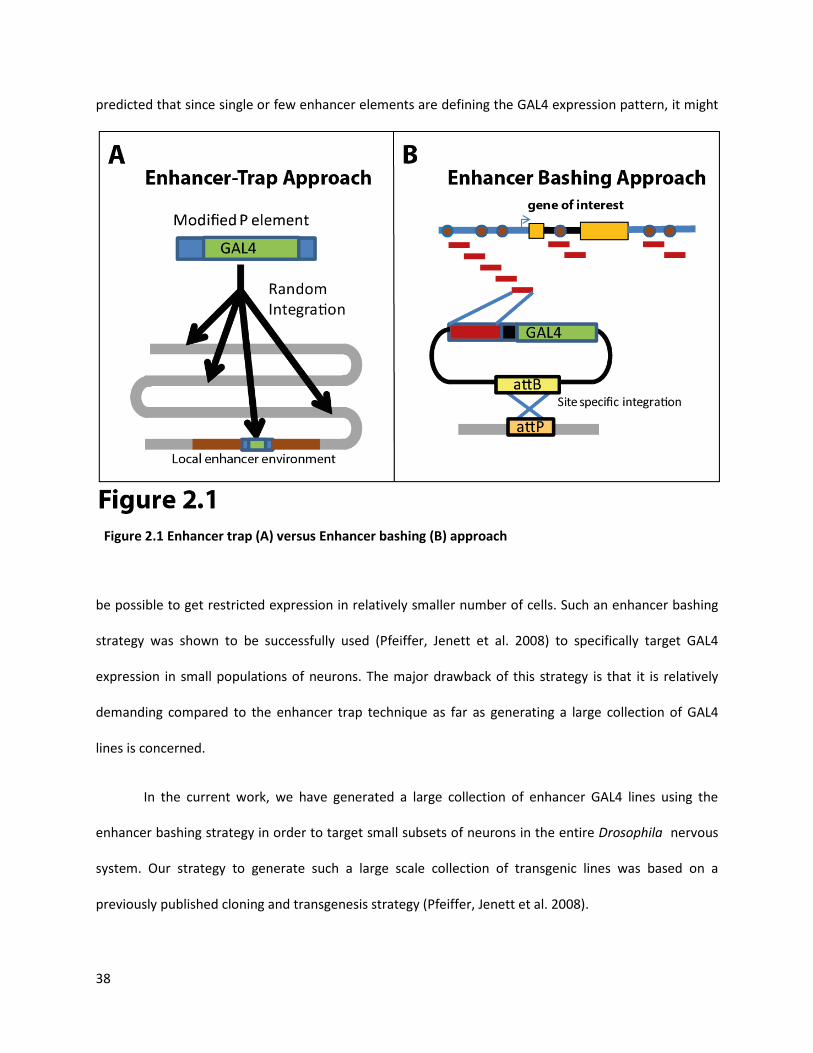
predicted that since single or few enhancer elements are defining the GAL4 expression pattern, it might
be possible to get restricted expression in relatively smaller number of cells. Such an enhancer bashing
strategy was shown to be successfully used (Pfeiffer, Jenett et al. 2008) to specifically target GAL4
expression in small populations of neurons. The major drawback of this strategy is that it is relatively
demanding compared to the enhancer trap technique as far as generating a large collection of GAL4
lines is concerned.
In the current work, we have generated a large collection of enhancer GAL4 lines using the
enhancer bashing strategy in order to target small subsets of neurons in the entire Drosophila nervous
system. Our strategy to generate such a large scale collection of transgenic lines was based on a
previously published cloning and transgenesis strategy (Pfeiffer, Jenett et al. 2008).
Figure 2.1 Enhancer trap (A) versus Enhancer bashing (B) approach

39
2.2 Design of the enhancer tiles.
As a first step in the enhancer bashing approach, we computationally tiled the entire Drosophila
melanogaster genome sequence into small overlapping fragments which contain potential enhancer
elements (please see Appendix A for details of the tiling strategy; work carried out by Stark, A. and
Dickson, B. J.). In order to get one or few enhancers per tile, the size of every tile has to be small
(average enhancer length ~100-200bp). But decreasing the tile size increases the total number of tiles
and leads to increased cost and effort in the following steps of the wok flow. As a compromise between
efficiency and specificity, we chose an average tile size of 2 kb with an overlap of 200-400 bp with the
adjacent tile. Also in order to prevent splitting of potential enhancers at the ends of the tile, we avoided
having tile boundaries in genomic regions with high conservation scores (when compared across several
Drosophila species) (Figure 2.2). With these defined criteria (see Appendix A for full list of parameters
considered), we tiled the entire non-coding genomic region of Drosophila melanogaster into 63000 tiles.
Figure 2.2 Tiling Strategy
40
We named these tiles as Vienna Tiles (VT) and the GAL4 lines will be henceforth referred to as VT lines.
Each tile is numbered as VTXXXXX starting from outmost end of X chromosome (VT0001, VT0002, …..).
The tiles containing the promoter element are referred to as “promoter tiles” and the rest as “enhancer
tiles” and will be treated separately in some of the following sections.
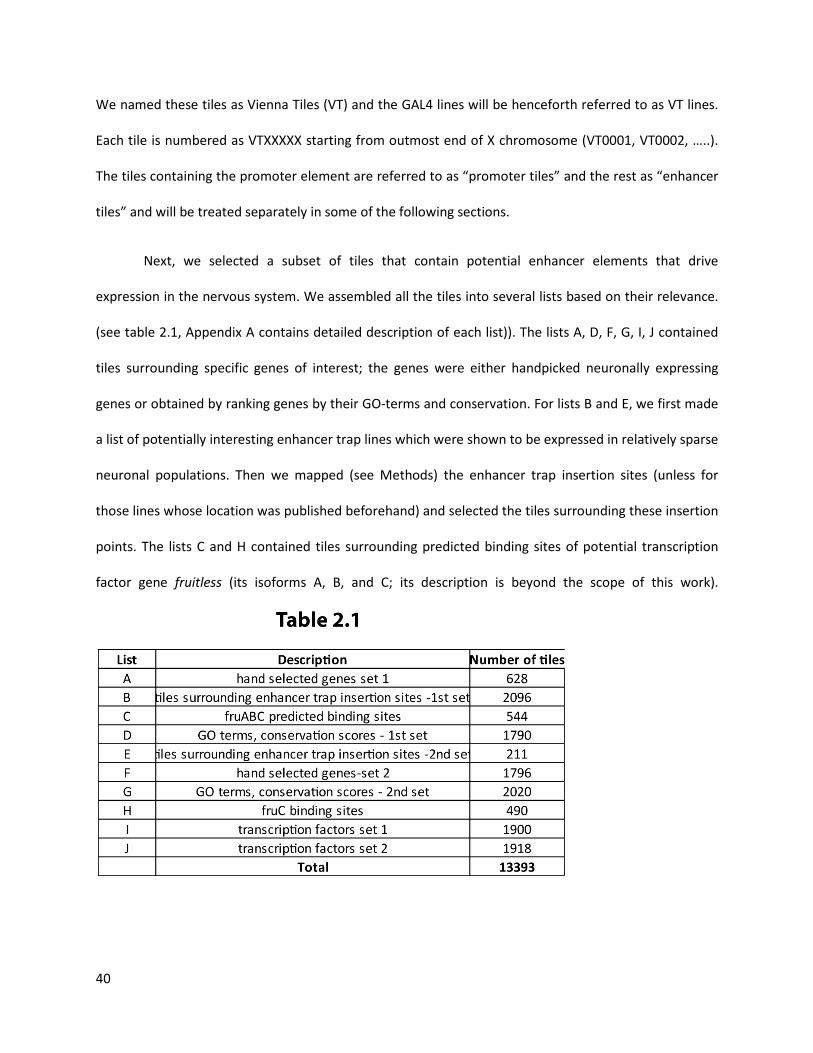
Next, we selected a subset of tiles that contain potential enhancer elements that drive
expression in the nervous system. We assembled all the tiles into several lists based on their relevance.
(see table 2.1, Appendix A contains detailed description of each list)). The lists A, D, F, G, I, J contained
tiles surrounding specific genes of interest; the genes were either handpicked neuronally expressing
genes or obtained by ranking genes by their GO-terms and conservation. For lists B and E, we first made
a list of potentially interesting enhancer trap lines which were shown to be expressed in relatively sparse
neuronal populations. Then we mapped (see Methods) the enhancer trap insertion sites (unless for
those lines whose location was published beforehand) and selected the tiles surrounding these insertion
points. The lists C and H contained tiles surrounding predicted binding sites of potential transcription
factor gene fruitless (its isoforms A, B, and C; its description is beyond the scope of this work).

41
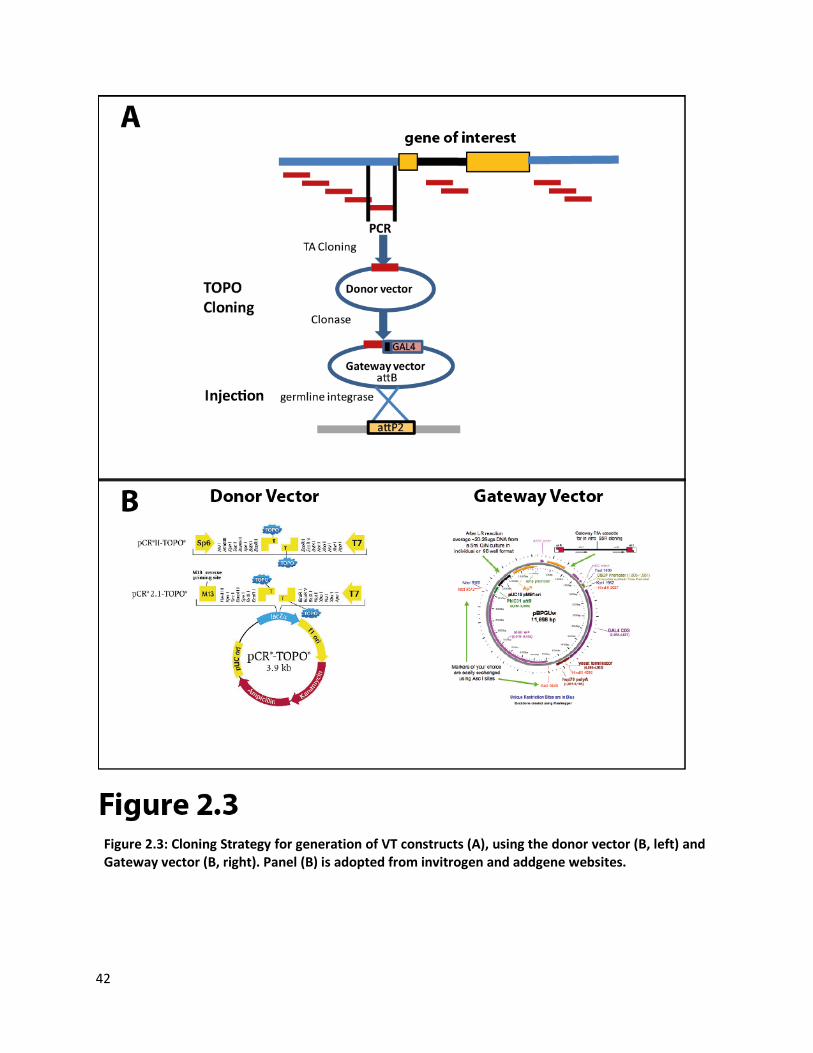
2.3 Work-flow for generating the VT library.
We PCR amplified the selected tiles and then cloned them using a TA-cloning strategy into a
TOPO “Donor” vector. The constructs were directly sequence verified and unless the fragment
contained a promoter tile, we did not care about the orientation of the PCR fragment. In the next step
we transferred the fragment from the donor vector into the GAL4 destination vector using the “Gateway
cloning” (see Methods for details). We used the GAL4 vector pBPGUw for enhancer tiles and pBPGw for
promoter tiles, the latter lacks a minimal promoter upstream of GAL4 element (Pfeiffer, Jenett et al.
2008). The cloning efficiency was ~60% for the TOPO reaction and ~90% for the Gateway reaction.
The generated GAL4 constructs after sequence verification, were injected into attp2 landing site
flies using ΦC31 mediated site specific integration strategy (Groth, Fish et al. 2004; Bischof, Maeda et al.
2007). The landing site attp2 was specifically chosen based on its low level of leakiness (Markstein,
Pitsouli et al. 2008) and its good induction of expression in the nervous system (Pfeiffer, Jenett et al.
2008). The average transformation efficiency was ~40% in the initial stages and has improved over time.
As of June 2012, we have cloned 10494 VT constructs and we have obtained the transgenic fly lines for
7729 constructs (please see Appendix B for detailed status report for every list of tiles).
42
Figure 2.3: Cloning Strategy for generation of VT constructs (A), using the donor vector (B, left) and Gateway vector (B, right). Panel (B) is adopted from invitrogen and addgene websites.
43
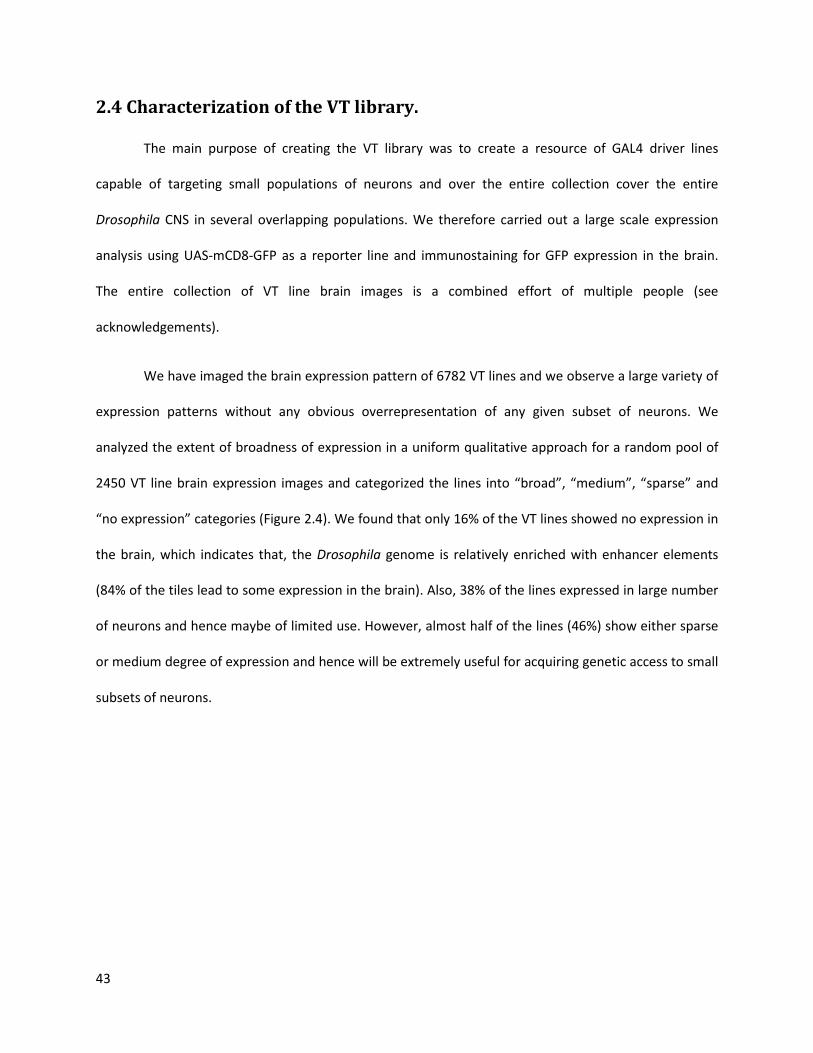
2.4 Characterization of the VT library.
The main purpose of creating the VT library was to create a resource of GAL4 driver lines
capable of targeting small populations of neurons and over the entire collection cover the entire
Drosophila CNS in several overlapping populations. We therefore carried out a large scale expression
analysis using UAS-mCD8-GFP as a reporter line and immunostaining for GFP expression in the brain.
The entire collection of VT line brain images is a combined effort of multiple people (see
acknowledgements).
We have imaged the brain expression pattern of 6782 VT lines and we observe a large variety of
expression patterns without any obvious overrepresentation of any given subset of neurons. We
analyzed the extent of broadness of expression in a uniform qualitative approach for a random pool of
2450 VT line brain expression images and categorized the lines into “broad”, “medium”, “sparse” and
“no expression” categories (Figure 2.4). We found that only 16% of the VT lines showed no expression in
the brain, which indicates that, the Drosophila genome is relatively enriched with enhancer elements
(84% of the tiles lead to some expression in the brain). Also, 38% of the lines expressed in large number
of neurons and hence maybe of limited use. However, almost half of the lines (46%) show either sparse
or medium degree of expression and hence will be extremely useful for acquiring genetic access to small
subsets of neurons.
44
2.5 Extending the VT library: Beyond GAL4 lines
[The following work is mainly carried out by Fellner, M., Wandl, S and Dickson B.J (see
acknowledgments). This has been included in this section for the sake of completeness and as a
reference for following chapter].
Figure 2.4: Expression analysis of 2450 VT line staining images with examples images for each of the categories.

45
In addition to getting sparse neuronal expression, the enhancer bashing strategy, due to its
usage of defined VT constructs injected in specific landing sites, offers another important advantage. If
in a VT construct, one replaces the GAL4 with any other gene, then theoretically, it must also be
expressed in the exact same pattern as the original VT line. The utility of the GAL4-UAS bipartite system
in Drosophila has inspired the generation of other functionally equivalent independent systems like
LexA-LexAop system (Lai and Lee 2006; Pfeiffer, Ngo et al. 2010). Also the split-GAL4 system has been
developed which expresses each functional half of the GAL4 (either DNA binding domain or Activation
domain) under different enhancers and then a functional reconstituted GAL4 is formed in only those
cells that express both halves of the GAL4 (Pfeiffer, Ngo et al. 2010). We exploited the versatility of the
enhancer bashing strategy (see above) and the availability of recently developed targeting systems to
expand the VT library by generating VT.LexA and VT.split-GAL4 driver lines, for selected tiles. Since our
initial cloning strategy employed a two step process (Figure 2.3) we could re-use the same donor vectors
and just replace the Gateway vectors with LexA and split GAL4 vectors. We also injected some of these
new driver lines into a different landing site, attp40, which may make it easier to use these lines in
combination with those injected in the previously used attp2 landing site.
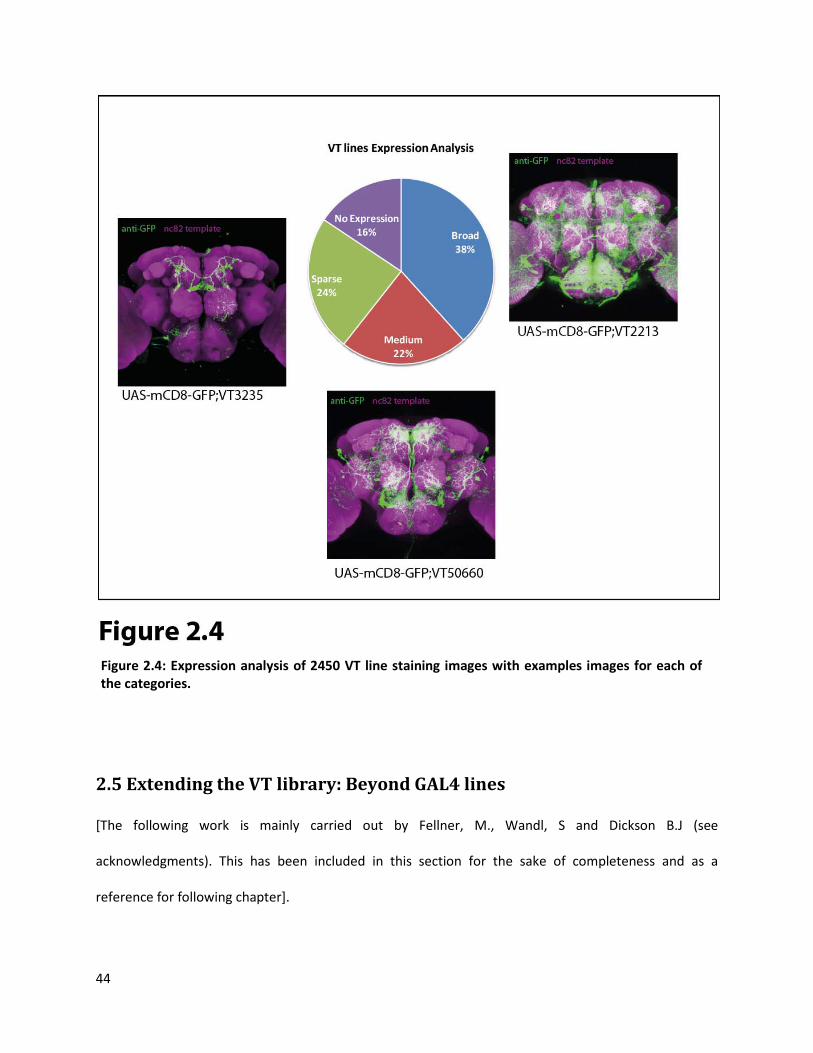
Preliminary expression analysis for VT.LexAs and VT-split-GAL4 lines indicates that in many of
the cases most of the expression pattern of the corresponding orginal VT line is reproduced in these
derivative lines (Figure 2.5). These tools add great diversity to the type of questions that can be
addressed. E.g. Using split-GAL4 system one can target the intersection of two previously known VT
lines, or using LexA-LexAop system one can express different effector molecules in the same fly in
different neurons which opens up the doors for experiments like double labeling or neuronal epistasis
(activate one set of neurons and silence another set in the same fly).
46
2.6 Methods.
Fly Stocks
Flies were raised on standard cornmeal yeast agar medium at 25oC and 60% humidity. yhh;;UAS-mCD8-
GFP reporter flies were as used in (Yu, Kanai et al. 2010). Attp2 landing site flies (Groth, Fish et al. 2004)
and zh-11 germline integrase flies (Bischof, Maeda et al. 2007) were used for transgenesis.
Figure 2.5: Examples of brain expression patterns of 4 VT.LexA lines (bottom row) and their corresponding original VT lines (top row).

47
Inverse PCR
Large scale inverse PCR for mapping of P-element insertion sites was carried out using an optimized
protocol based on BDGP (Berkeley Drosophila Genome Project) iPCR protocol by Rehm, J. E.
(http://www.fruitfly.org/about/methods/inverse.pcr.html).
PCR of tiles
PCR was performed using the following parameters: initial denaturation at 94 oC for 4 min, denaturation
at 94 oC for 30 sec, annealing at 62 oC for 30 sec, extension at 72 oC for 5 min, for 35 cycles and a final
extension step at 72 oC for 10 min.
TOPO Cloning
We set up the TOPO reaction for 30 min at room temperature as follows: 1μl pCR8/TOPO/GW vector
(Invitrogen, 1:10 diluted in H2O), 1μl PCR product, 1 μl TOPO salt solution (1.2 M NaCl, 0.06 M MgCl2), 3
μl H2O. We then added 40 μl of chemically competent Mach1 cells (Invitrogen) to the whole 6 μl TOPO
reaction mix and did a standard transformation with a 30 sec heat shock at 42 ◦C. The cells were
incubated in 1 ml SOC at 37◦C for 30 min and then plated on LB, agar with 100 μg / mL spectinomycin
using custom made incubation blocks (Dietzl, Chen et al. 2007). We inoculated two colonies per
construct for 16-20 hours in 3.5 ml LB medium with 100 μg/mL spectinomycin using deep 48-well plates.
We prepared the DNA using the QIAprep 96 Turbo Miniprep Kit (Qiagen). We confirmed successful
cloning of the PCR fragment by restriction enzyme digest with EcoRI and sequencing using the following
primer: GTTGCAACAAATTGATGAGCAATTA.
Gateway Cloning
We set up the Gateway reaction over night at 25 ◦C as follows: 1.6 μl Gateway LR Clonase enzyme mix
(Invitrogen; diluted 1:5 in H2O), 1 μl TOPO entry clone, 0.5 μl Gateway destination vector and 0.9 μl TE
buffer (pH8.0). All further steps are as described above, except now using 100 μg / mL ampicillin as a
48
selective antibiotic. We confirmed successful transfer of the fragment by sequencing from one end,
using the following primer: GAACATTCATTCACAACTGATG.
Injection and establishment of VT stocks.
DNA for injection was taken directly out of the 96-well miniprep plate without further purification. The
DNA was injected into the progeny of the cross of the germ-line integrase Zh-11 (Bischof, Maeda et al.
2007) and the 3rd chromosome landing site attP2 (Groth, Fish et al. 2004), using site-specific
recombination. The injected flies were crossed to w1118 (w-) flies. All flies coming out of this cross with
red eyes must have acquired the mini-white gene due to vector insertion on the 3rd chromosome. We
selected only red eyed males (in order to get rid of the germline integrase on the X chromosome later
on) and balanced them on the 3rd chromosome with w-;;Ly/TM3 flies. If we obtained only red-eyed
females and no males, we crossed the females to w- males again. Next we crossed red-eyed, balanced
males to w-;;Ly-hs-hid / TM3 females. We heat shocked the pupae coming out of this cross to obtain the
final stock: w- ; ; attP2miniwhite - insert) / TM3. Wherever possible we also obtained the homozygous
VT stock.
Immunostaining:
Described in Chapter 3, Methods.
49
References
Bischof, J., R. K. Maeda, et al. (2007). "An optimized transgenesis system for Drosophila using germ-line-specific phi C31 integrases." Proceedings of the National Academy of Sciences of the United States of America
Brand, A. H. and E. L. Dormand (1995). "The GAL4 system as a tool for unravelling the mysteries of the Drosophila nervous system."
104(9): 3312-3317.
Curr Opin NeurobiolBrand, A. H. and N. Perrimon (1993). "Targeted Gene-Expression as a Means of Altering Cell Fates and
Generating Dominant Phenotypes."
5(5): 572-8.
DevelopmentDietzl, G., D. Chen, et al. (2007). "A genome-wide transgenic RNAi library for conditional gene
inactivation in Drosophila."
118(2): 401-415.
NatureGroth, A. C., M. Fish, et al. (2004). "Construction of transgenic Drosophila by using the site-specific
integrase from phage phi C31."
448(7150): 151-6.
GeneticsLai, S. L. and T. Lee (2006). "Genetic mosaic with dual binary transcriptional systems in Drosophila."
166(4): 1775-1782. Nat
NeurosciMarkstein, M., C. Pitsouli, et al. (2008). "Exploiting position effects and the gypsy retrovirus insulator to
engineer precisely expressed transgenes."
9(5): 703-9.
Nature GeneticsPfeiffer, B. D., A. Jenett, et al. (2008). "Tools for neuroanatomy and neurogenetics in Drosophila."
40(4): 476-483. Proc
Natl Acad Sci U S APfeiffer, B. D., T. T. Ngo, et al. (2010). "Refinement of tools for targeted gene expression in Drosophila."
105(28): 9715-20.
GeneticsYu, J. Y., M. I. Kanai, et al. (2010). "Cellular organization of the neural circuit that drives Drosophila
courtship behavior."
186(2): 735-55.
Curr Biol
20(18): 1602-14.
50
Chapter 3: Neuronal basis for backward directed walking in fruit flies.
3.1 Background:
Directed walking forms an integral component of most of the essential insect behaviors. What
we see as directed walking, is in fact the output of a complex neuronal circuit that responds dynamically
to the changing sensory environment of an insect. A lot of work in invertebrate neurobiology has been
focused on understanding the sensory and motor systems involved in this process. It has been shown
that walking is a coordinated rhythmic output of individual central pattern generators (CPGs) controlling
every joint of every leg of an insect, and change in the walking direction is a consequence of change in
the activity of these CPG elements (see Chapter 1 for detailed discussion). It has been shown in stick
insects and cockroaches that descending neural tracts connecting the brain and the thoracic ganglion
are required for bringing about these changes (Mu and Ritzmann 2008; Mu and Ritzmann 2008).
However, barring the experiments showing the importance of central complex of the insect brain in
controlling speed and direction of walking, there is no literature describing functioning of higher order
neural centers (upstream of CPGs) in directed walking in insects. In the current work we decided to
exploit the genetic tools available in Drosophila melanogaster (VT library, see Chapter 2) in order to gain
access to such higher order neurons involved in directed walking.

51
3.2 Results:
A neuronal activation screen identifies GAL4 lines which trigger backward
directed walking on thermo-activation:
We carried out an unbiased neuronal activation screen of the enhancer GAL4 library (VT lines,
see Chapter 2) in order to look for neurons that generate interesting behavioral phenotypes on transient
activation. We employed the thermosensitive cation channel dTrpA1 for inducing artificial activation of
GAL4 targeted neurons (Hamada, Rosenzweig et al. 2008). In a previous study (von Philipsborn, Liu et al.
2011), dTrpA1 has been successfully used to induce courtship behavior in male flies by activating specific
classes of neurons. Using similar assay conditions (see Methods), we screened more than 3000 GAL4
lines and manually analyzed their video recorded behavior at temperature varying from 25oC to 32oC
over a period of 10 minutes (Figure 3.1A). Around 60% of the GAL4 lines did not show any observable
phenotype under our assay conditions. Among the GAL4 lines that showed some phenotype, we
categorized them as ” weak phenotypes” (phenotypes unclear and non uniform across individuals) or
“strong phenotypes” (robust and uniform phenotypes) (Figure 3.1B). For the strong phenotypes we also
recorded the minimum temperature at which the phenotype first appeared. Most phenotypes were
induced below 30oC (Fig 3.1C), and hence our assay temperature range of 25oC-32oC, is well justified.
Moreover while analyzing every video several aspects of the behavior were carefully annotated. The
annotations are qualitative and additional comments are added

52
Figure 3.1: Overview of neuronal activation screen
A. Work Flow chart for thermo genetic neuronal activation screen
B. Overview of broad phenotype categories.
C. Temperature range for minimum temperature(Tm) required to observe phenotype for “strong
phenotypes” category
D. Overview of manual scoring of GAL4 lines showing “strong phenotype”. X axis shows different
parameters being scored and Y axis represents each GAL4 line. Red bar indicates there is a
phenotype related to the corresponding attribute, white bar indicates no change compared to
wild type flies. Inset: different categories of locomotion phenotypes observed.
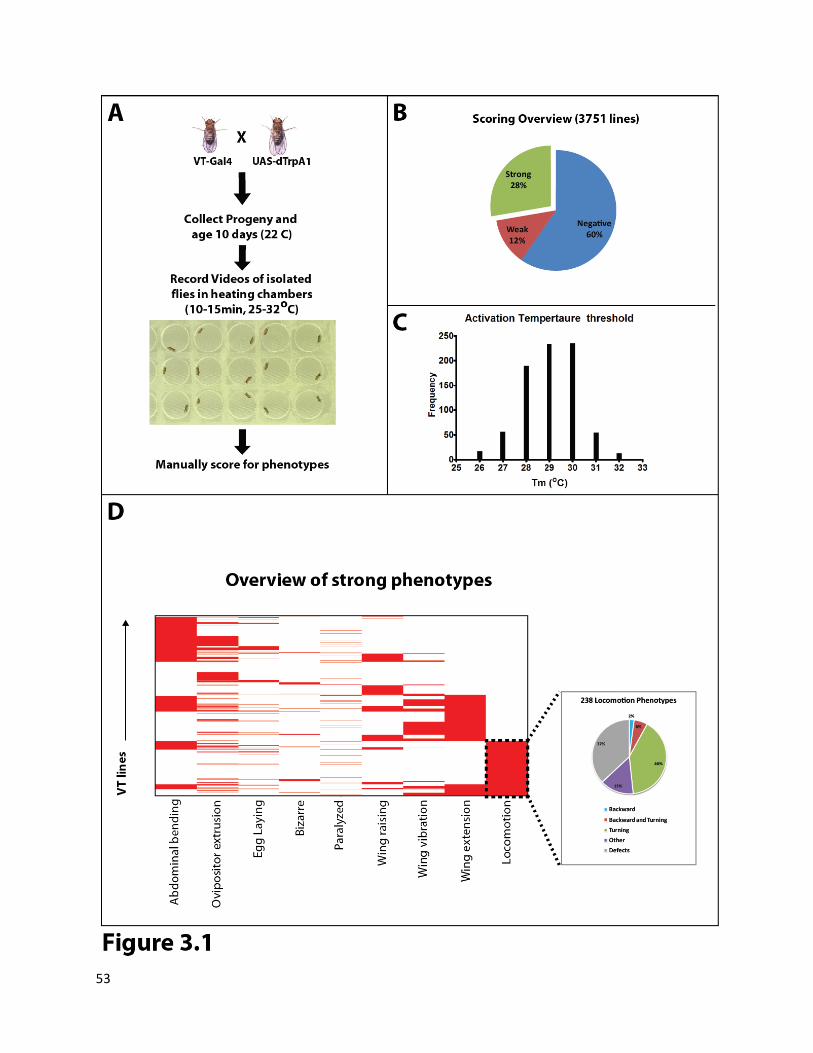
53

54
to describe the phenotype in details (detailed table can be found in Appendix). A general overview of
annotations for GAL4 lines showing strong phenotypes (Figure 3.1D) shows a glimpse of the variety of
phenotypes observed on activation of different subsets of neuronal populations.
The collection of GAL4 lines showing locomotion phenotypes can be further subdivided into
several categories as shown in Figure 3.1D (inset). We were particularly interested in GAL4 lines which
showed directional walking phenotypes, viz. turning or backward walking. For the purpose of this study
we specifically focused on the lines showing “backward walking” on activation. These consisted of GAL4
lines which showed straight backward walking (termed as “moonwalking”) or those that turned
backwards. We retested these GAL4 lines two times in the same assay conditions in order to confirm the
observed phenotypes. 6 out of 10 “moonwalking” lines and 10 out of 14 “backward turning” lines
reproducibly showed the phenotype (Figure 3.2A and C). However among the moonwalkers, VT50660,
VT44845 and VT37220 showed robust and apparently well coordinated backward walking whereas the
others showed uncoordinated walking and also fell over several times while walking. Among the
backward turners, VT449, VT1606 and VT44841 showed continuous backward turning in circles,
VT44166, VT43152 and VT3228 showed tight turns (180o turns with backward walking component)
whereas others showed somewhat weaker and uncoordinated phenotypes. We then analyzed the
expression patterns of these GAL4 lines. Concerning the degree of broadness, these GAL4 lines showed
an intermediate level of expression in the central nervous system (CNS) (Figure 3.2B and D shows
expression patterns of prominent members of both classes of backward walking phenotypes).

55
Figure 3.2: GAL4 lines showing backward walking phenotype on thermo-activation
A. Table for primary and retest confirmed GAL4 lines for “moonwalking” phenotype on thermo
genetic activation.
B. Expression patterns of representative GAL4 lines showing “moonwalking” phenotype.
C. Table for primary and retest confirmed GAL4 lines for backward turning phenotype on thermo
genetic activation.
D. Expression patterns of representative GAL4 lines showing backward turning phenotype.
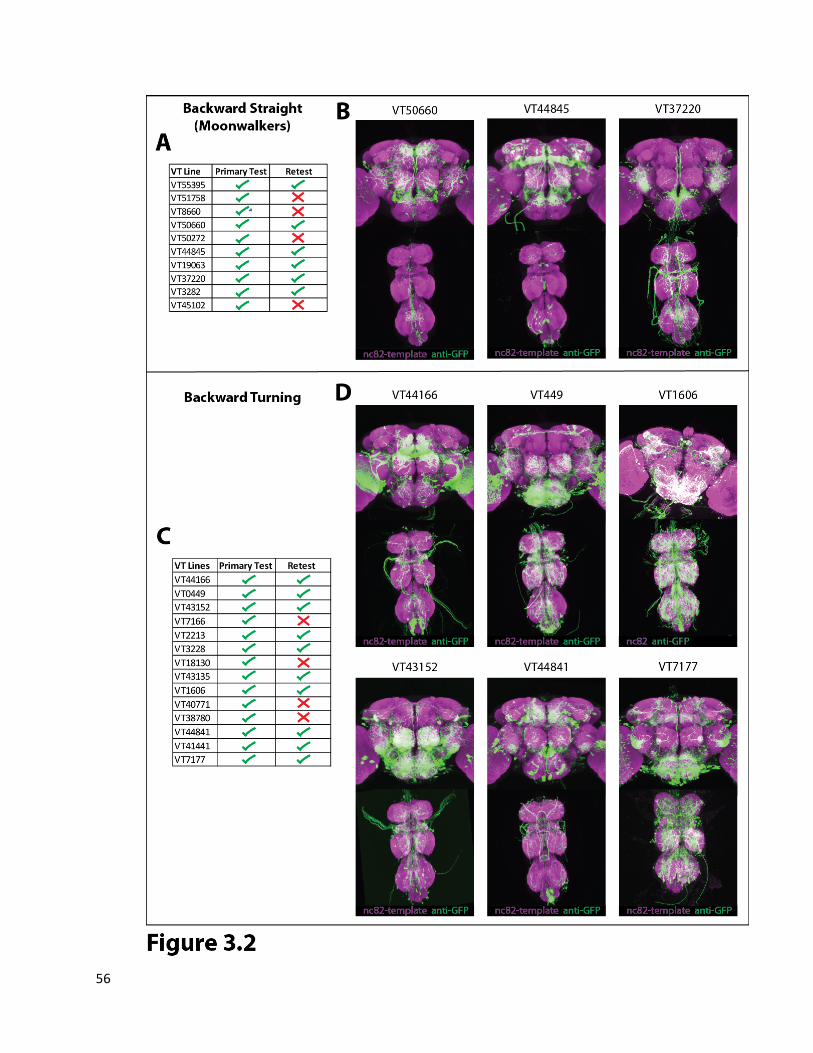
56
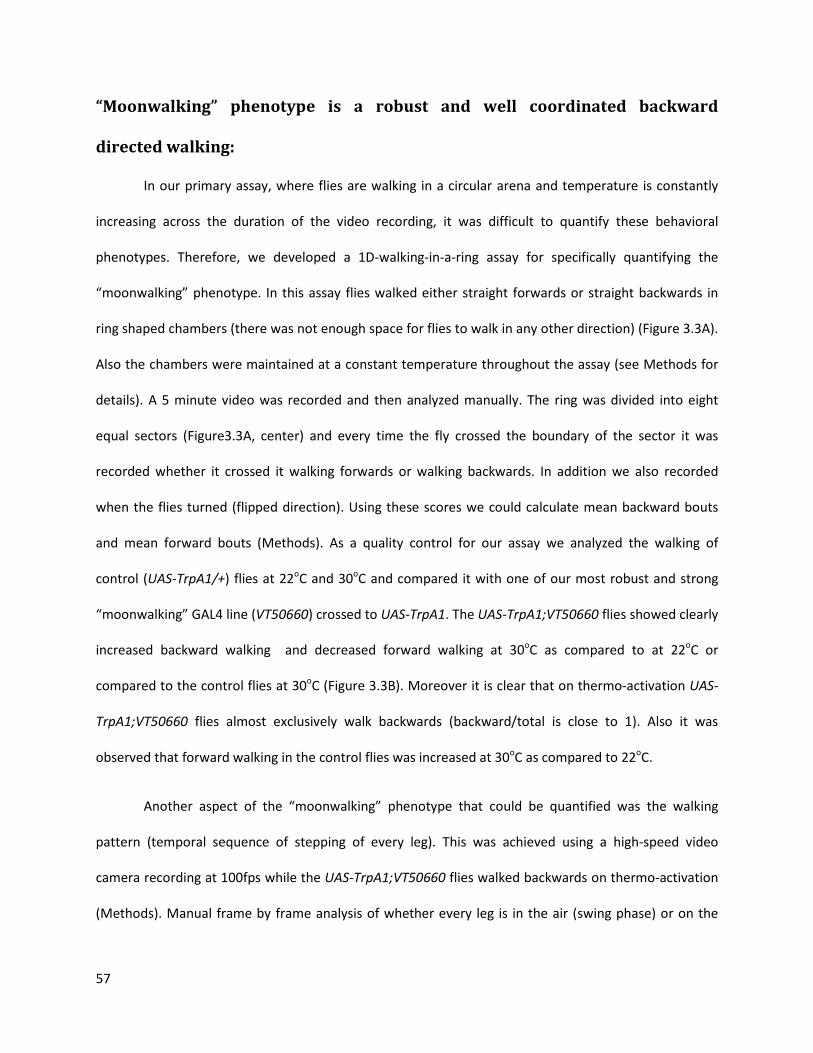
57
“Moonwalking” phenotype is a robust and well coordinated backward
directed walking:
In our primary assay, where flies are walking in a circular arena and temperature is constantly
increasing across the duration of the video recording, it was difficult to quantify these behavioral
phenotypes. Therefore, we developed a 1D-walking-in-a-ring assay for specifically quantifying the
“moonwalking” phenotype. In this assay flies walked either straight forwards or straight backwards in
ring shaped chambers (there was not enough space for flies to walk in any other direction) (Figure 3.3A).
Also the chambers were maintained at a constant temperature throughout the assay (see Methods for
details). A 5 minute video was recorded and then analyzed manually. The ring was divided into eight
equal sectors (Figure3.3A, center) and every time the fly crossed the boundary of the sector it was
recorded whether it crossed it walking forwards or walking backwards. In addition we also recorded
when the flies turned (flipped direction). Using these scores we could calculate mean backward bouts
and mean forward bouts (Methods). As a quality control for our assay we analyzed the walking of
control (UAS-TrpA1/+) flies at 22oC and 30oC and compared it with one of our most robust and strong
“moonwalking” GAL4 line (VT50660) crossed to UAS-TrpA1. The UAS-TrpA1;VT50660 flies showed clearly
increased backward walking and decreased forward walking at 30oC as compared to at 22oC or
compared to the control flies at 30oC (Figure 3.3B). Moreover it is clear that on thermo-activation UAS-
TrpA1;VT50660 flies almost exclusively walk backwards (backward/total is close to 1). Also it was
observed that forward walking in the control flies was increased at 30oC as compared to 22oC.
Another aspect of the “moonwalking” phenotype that could be quantified was the walking
pattern (temporal sequence of stepping of every leg). This was achieved using a high-speed video
camera recording at 100fps while the UAS-TrpA1;VT50660 flies walked backwards on thermo-activation
(Methods). Manual frame by frame analysis of whether every leg is in the air (swing phase) or on the
58
ground (stance phase) was carried out and the detailed moonwalking pattern could be analyzed. A well
coordinated metachronal walking gait could be observed (Figure 3.3C). It can be seen that on each body-
side the sequence of leg stepping was front-middle-hind (1-2-3). This is exact reverse of the commonly
observed 3-2-1 stepping sequence in forward walking flies or stick insects (Wilson 1966; Strauss and
Heisenberg 1990). This shows that the “moonwalking” phenotype is a well coordinated backward
walking behavior with a walking pattern reverse as that for forward walking.
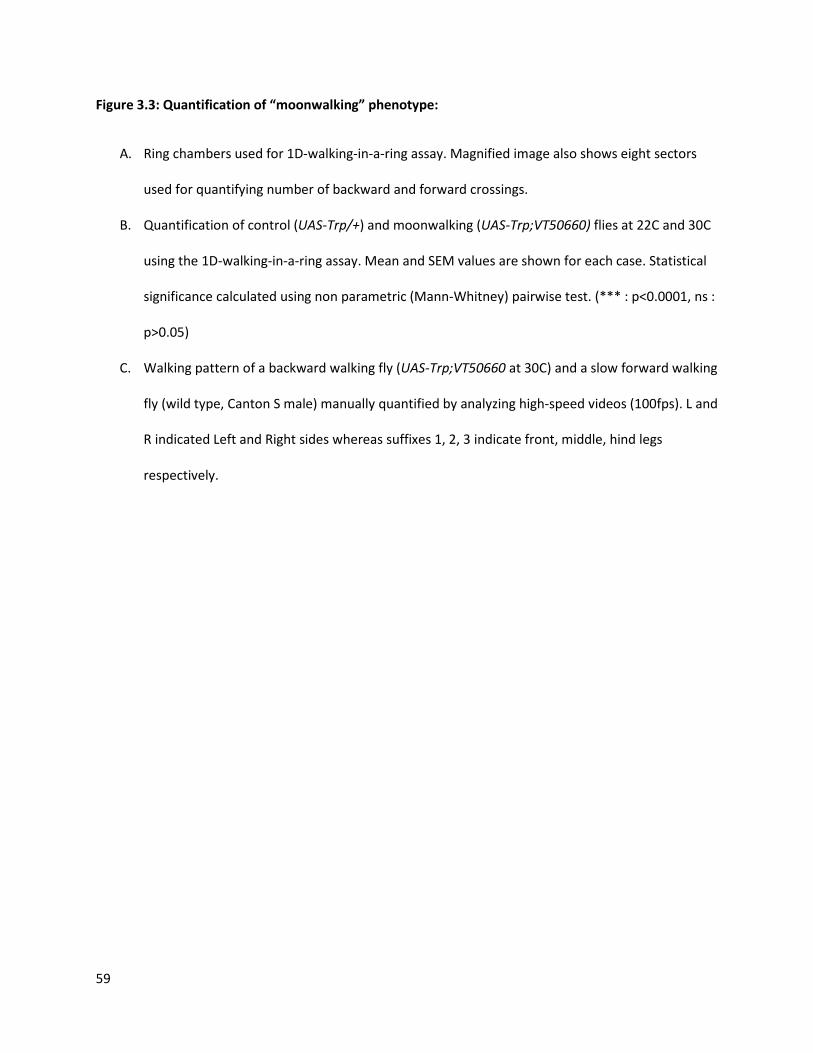
59
Figure 3.3: Quantification of “moonwalking” phenotype:
A. Ring chambers used for 1D-walking-in-a-ring assay. Magnified image also shows eight sectors
used for quantifying number of backward and forward crossings.
B. Quantification of control (UAS-Trp/+) and moonwalking (UAS-Trp;VT50660) flies at 22C and 30C
using the 1D-walking-in-a-ring assay. Mean and SEM values are shown for each case. Statistical
significance calculated using non parametric (Mann-Whitney) pairwise test. (*** : p<0.0001, ns :
p>0.05)
C. Walking pattern of a backward walking fly (UAS-Trp;VT50660 at 30C) and a slow forward walking
fly (wild type, Canton S male) manually quantified by analyzing high-speed videos (100fps). L and
R indicated Left and Right sides whereas suffixes 1, 2, 3 indicate front, middle, hind legs
respectively.
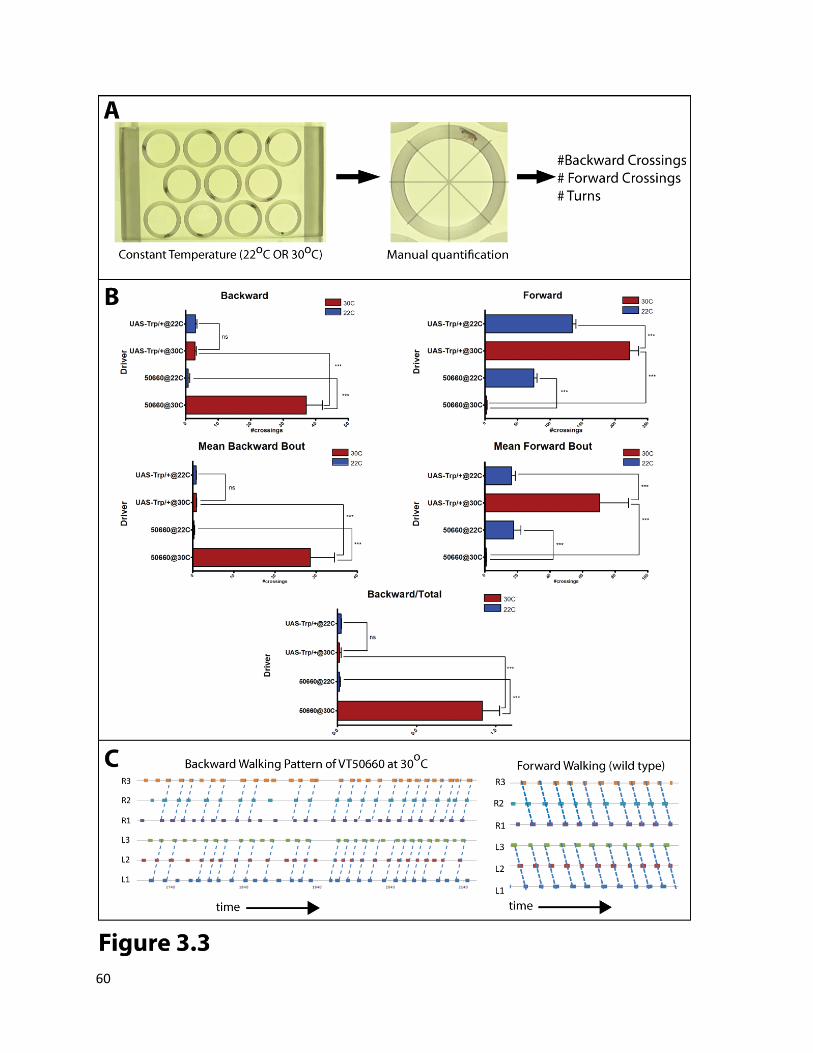
60
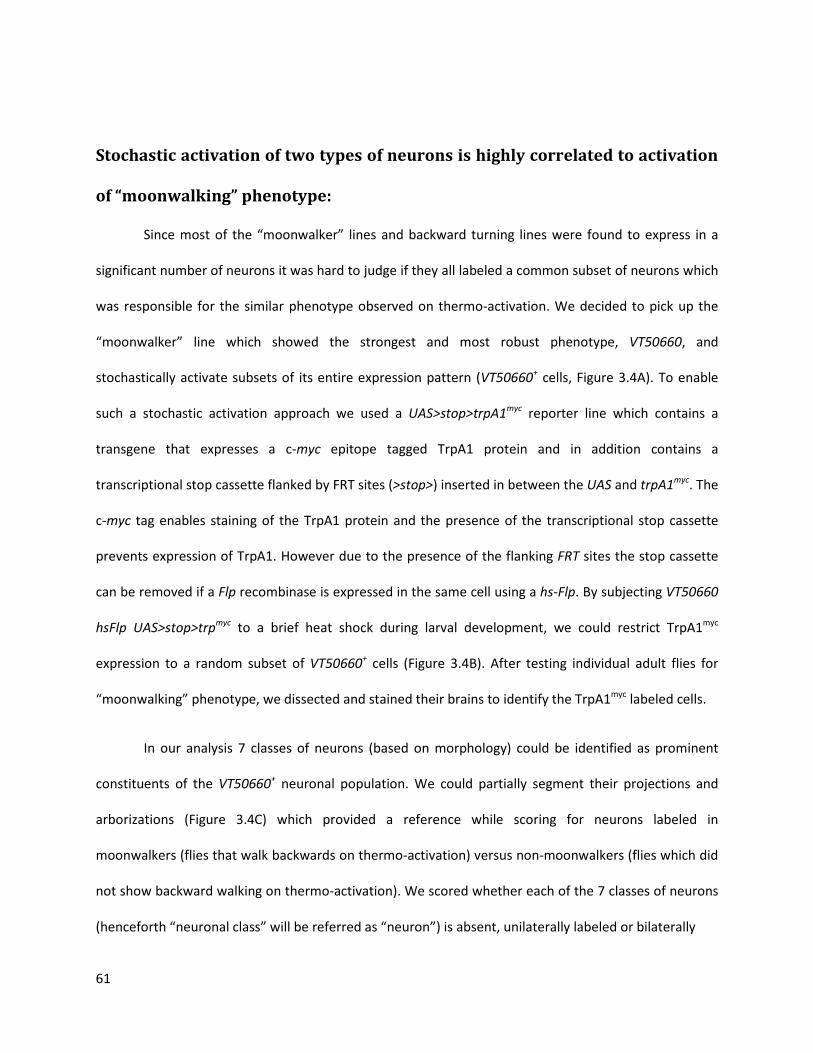
61
Stochastic activation of two types of neurons is highly correlated to activation
of “moonwalking” phenotype:
Since most of the “moonwalker” lines and backward turning lines were found to express in a
significant number of neurons it was hard to judge if they all labeled a common subset of neurons which
was responsible for the similar phenotype observed on thermo-activation. We decided to pick up the
“moonwalker” line which showed the strongest and most robust phenotype, VT50660, and
stochastically activate subsets of its entire expression pattern (VT50660+ cells, Figure 3.4A). To enable
such a stochastic activation approach we used a UAS>stop>trpA1myc reporter line which contains a
transgene that expresses a c-myc epitope tagged TrpA1 protein and in addition contains a
transcriptional stop cassette flanked by FRT sites (>stop>) inserted in between the UAS and trpA1myc. The
c-myc tag enables staining of the TrpA1 protein and the presence of the transcriptional stop cassette
prevents expression of TrpA1. However due to the presence of the flanking FRT sites the stop cassette
can be removed if a Flp recombinase is expressed in the same cell using a hs-Flp. By subjecting VT50660
hsFlp UAS>stop>trpmyc to a brief heat shock during larval development, we could restrict TrpA1myc
expression to a random subset of VT50660+ cells (Figure 3.4B). After testing individual adult flies for
“moonwalking” phenotype, we dissected and stained their brains to identify the TrpA1myc labeled cells.
In our analysis 7 classes of neurons (based on morphology) could be identified as prominent
constituents of the VT50660+ neuronal population. We could partially segment their projections and
arborizations (Figure 3.4C) which provided a reference while scoring for neurons labeled in
moonwalkers (flies that walk backwards on thermo-activation) versus non-moonwalkers (flies which did
not show backward walking on thermo-activation). We scored whether each of the 7 classes of neurons
(henceforth “neuronal class” will be referred as “neuron”) is absent, unilaterally labeled or bilaterally

62
Figure 3.4: Stochastic activation strategy to pinpoint neurons responsible for “moonwalking”:
A. Complete expression pattern of moonwalking GAL4 line VT50660.
B. Stochastic activation and labeling strategy
C. Partial segmentation of frequently occurring neurons (neurons 1-7) during the stochastic
activation experiments.
D. Scoring for neurons labeled in “moonwalkers” and flies showing “no moonwalk”.
E. Quantification of scoring in D. Significance calculated using Fisher’s exact test.
F. Quantification for scores grouped into classes according to unilateral, bilateral, or no labeling of
neuron 1 and neuron 7. On the X axis 1_BI: neuron 1 bilaterally labeled, 1_Uni: neuron 1
unilaterally labeled, 1_none: neuron 1 not labeled and similarly for neuron 7.
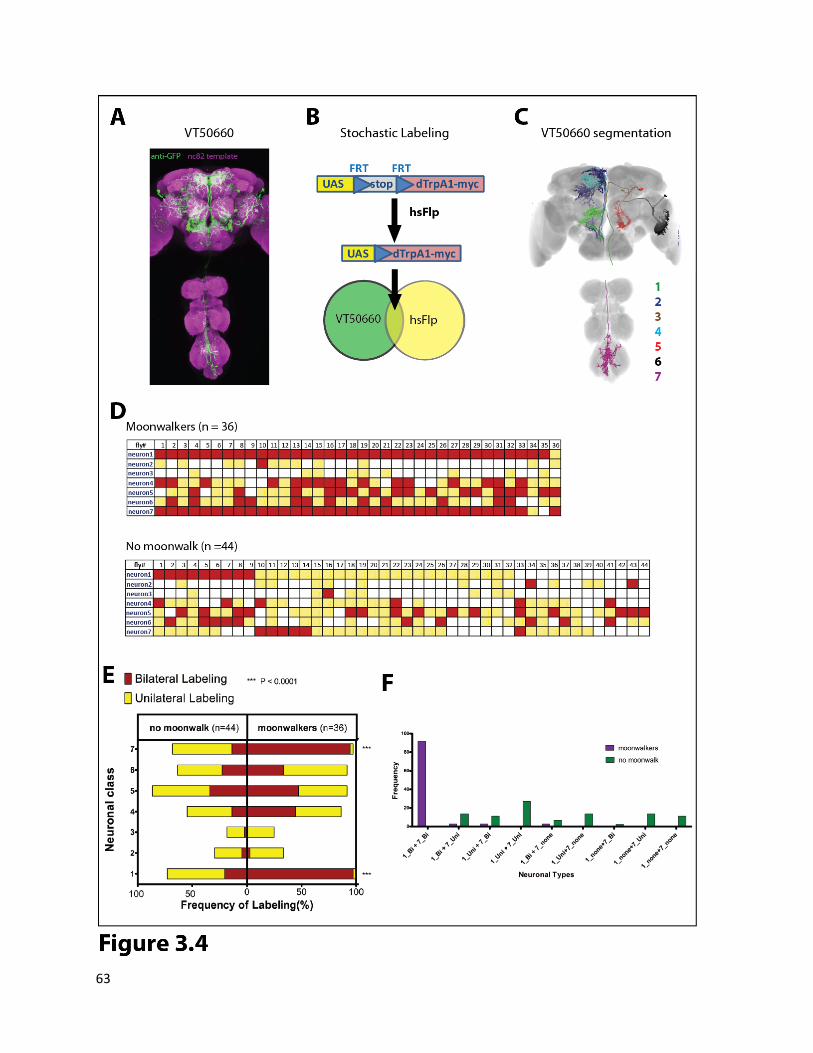
63
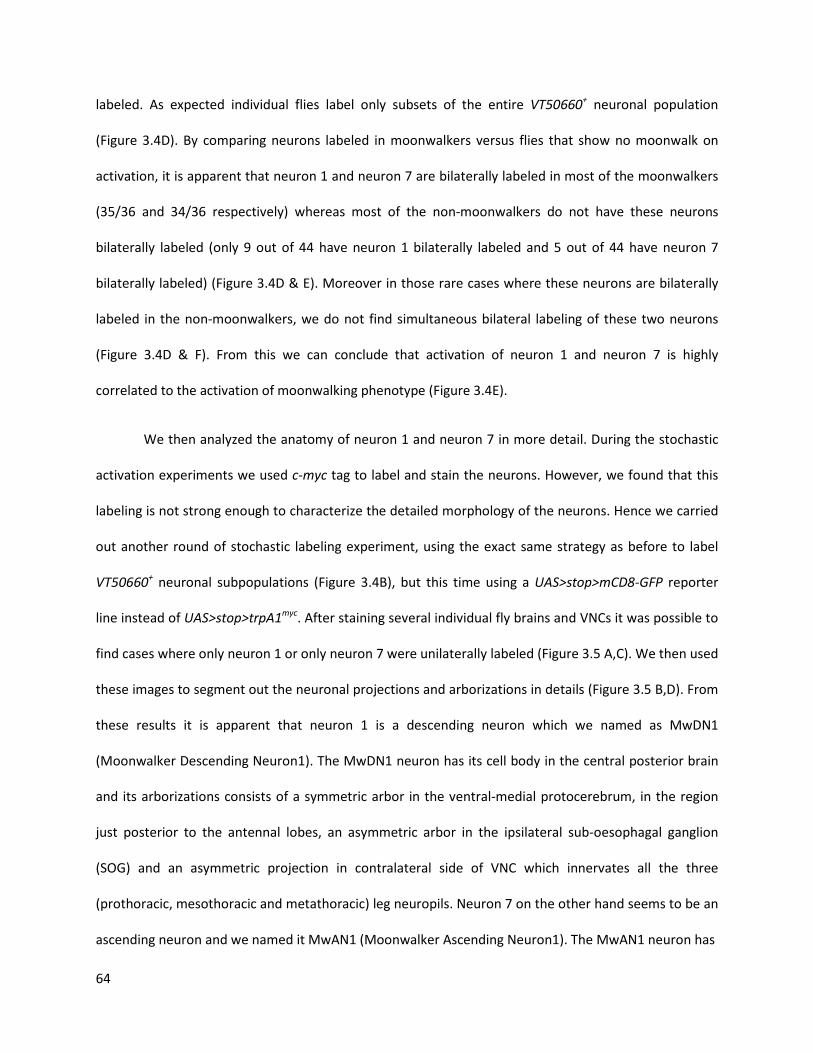
64
labeled. As expected individual flies label only subsets of the entire VT50660+ neuronal population
(Figure 3.4D). By comparing neurons labeled in moonwalkers versus flies that show no moonwalk on
activation, it is apparent that neuron 1 and neuron 7 are bilaterally labeled in most of the moonwalkers
(35/36 and 34/36 respectively) whereas most of the non-moonwalkers do not have these neurons
bilaterally labeled (only 9 out of 44 have neuron 1 bilaterally labeled and 5 out of 44 have neuron 7
bilaterally labeled) (Figure 3.4D & E). Moreover in those rare cases where these neurons are bilaterally
labeled in the non-moonwalkers, we do not find simultaneous bilateral labeling of these two neurons
(Figure 3.4D & F). From this we can conclude that activation of neuron 1 and neuron 7 is highly
correlated to the activation of moonwalking phenotype (Figure 3.4E).
We then analyzed the anatomy of neuron 1 and neuron 7 in more detail. During the stochastic
activation experiments we used c-myc tag to label and stain the neurons. However, we found that this
labeling is not strong enough to characterize the detailed morphology of the neurons. Hence we carried
out another round of stochastic labeling experiment, using the exact same strategy as before to label
VT50660+ neuronal subpopulations (Figure 3.4B), but this time using a UAS>stop>mCD8-GFP reporter
line instead of UAS>stop>trpA1myc. After staining several individual fly brains and VNCs it was possible to
find cases where only neuron 1 or only neuron 7 were unilaterally labeled (Figure 3.5 A,C). We then used
these images to segment out the neuronal projections and arborizations in details (Figure 3.5 B,D). From
these results it is apparent that neuron 1 is a descending neuron which we named as MwDN1
(Moonwalker Descending Neuron1). The MwDN1 neuron has its cell body in the central posterior brain
and its arborizations consists of a symmetric arbor in the ventral-medial protocerebrum, in the region
just posterior to the antennal lobes, an asymmetric arbor in the ipsilateral sub-oesophagal ganglion
(SOG) and an asymmetric projection in contralateral side of VNC which innervates all the three
(prothoracic, mesothoracic and metathoracic) leg neuropils. Neuron 7 on the other hand seems to be an
ascending neuron and we named it MwAN1 (Moonwalker Ascending Neuron1). The MwAN1 neuron has
65
Figure3.5: Morphology of MwDN1 and MwAN1 neurons:
A. Template registered image showing expression pattern of unilaterally labeled MwDN1 (or
neuron 1 from Figure 3,4)
B. Segmented image of MwDN1.
C. Template registered image showing expression pattern of unilaterally labeled MwAN1 (or
neuron 7 from Figure 3,4)
D. Segmented image of MwAN1.
E. Overlap of segmented MwDN1 and MwAN1 showing small overlap in the SOG (Subesophagal
ganglion).
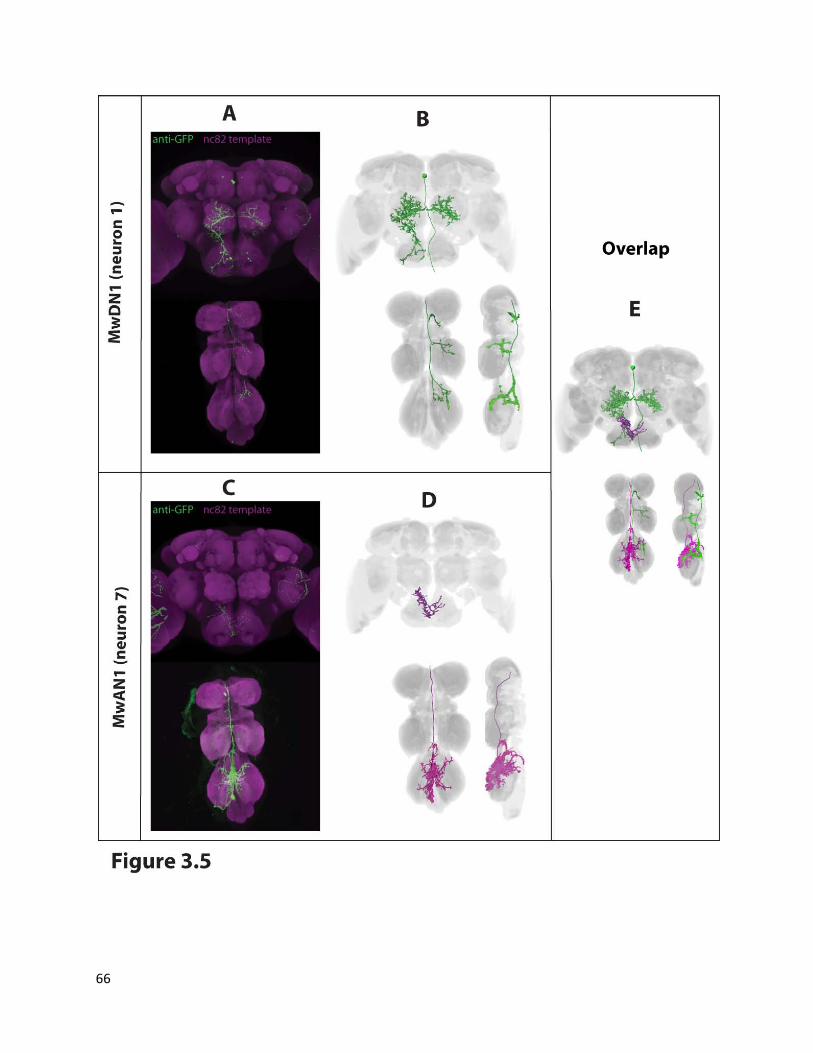
66
67
its cell body in the ventral metathoracic ganglion of the VNC and has extensive arborization in the
metathoracic ganglion and an ascending partially asymmetric arbor in the SOG. The ascending arbor of
MwAN1 partially overlaps with the asymmetric brain arbor of MwDN1 as shown in Figure 3.5E. Also
from our analysis we could conclude that MwDN1 consists of maximum of 2 cells per hemisphere
whereas MwAN1 consists of 1 cell per hemisphere as far as VT50660+ neuronal population is concerned.
Activation of MwDN1 and MwAN1 is sufficient to trigger “moonwalking
phenotype:
In order to better characterize the functional role of MwDN1 and MwAN1 neurons we employed
intersectional genetics strategies. In the first approach we generated a VT50660.Flp line which consists
of the same enhancer element (VT50660) as our strong “moonwalking” GAL4 line, but now driving the
expression of a Flp recombinase instead of GAL4. This Flp line in combination with a UAS>stop>Effector
can now be used to label subsets of VT50660+ neurons that overlap with other GAL4 lines (Figure 3.6A).
As a proof of principle, when the UAS>stop>mCD8-GFP;VT50660.Flp line was crossed to a pan neuronal
GAL4 line (nsyb-GAL4) it labeled the entire VT50660+ neuronal population(Figure 3.6B left and central).
We then crossed this Flp line with several GAL4 lines to see overlapping expression with VT50660+
neurons (data not shown for all lines). When the Flp line was crossed to a thorax specific GAL4 line (Tsh-
GAL4), it labeled the MwAN1 neuron and few ectopic neurons, but did not label majority of the brain
neurons (including MwDN1) of the VT50660+ neuronal population (Figure 3.6B, right). Also, its overlap
with VT37220.GAL4@attp40, another of our activation screen positives (but now injected in a different
landing site) was limited to MwDN1 and MwAN1 and stochastic labeling of another neuron (neuron 5 as
per labeling in Figure 3.4C). A thorough analysis of expression in individual flies (n=21) was carried out
similar to one carried out during stochastic labeling experiments, and it was seen that MwDN1 and
68
Figure 3.6: Intersectional strategy using VT50660.Flp to specifically label MwDN1 and MwAN1.
A. Intersectional genetics strategy used.
B. Expression patterns of different combinations which show that this strategy works
C. Expression scoring, similar to Figure 3.4D for VT50660+ neurons that may be labeled during
combination of VT50660.Flp with VT37220@attp40.
D. Quantification of behavior for important combinations of GAL4 and VT50660Flp (n=18-24 per
genotype); TshGal4_50660Flp@attp2 (full genotype is UAS-mCD8-
GFP/TshGal4;VT50660.Flp@attp2) for labeling MwAN1 and 37220@attp40_50660Flp@attp2
(full genotype is UAS-mCD8-GFP/VT37220@attp40;VT50660.Flp@attp2) for labeling MwDN1
and MwAN1 as shown in C and D. Mean and SEM are shown for each case. Statistical test used
was non parametric (Mann-Whitney) pairwaise test. ns: p>0.05, *:0.001<p<0.05, ***: p<0.0001.
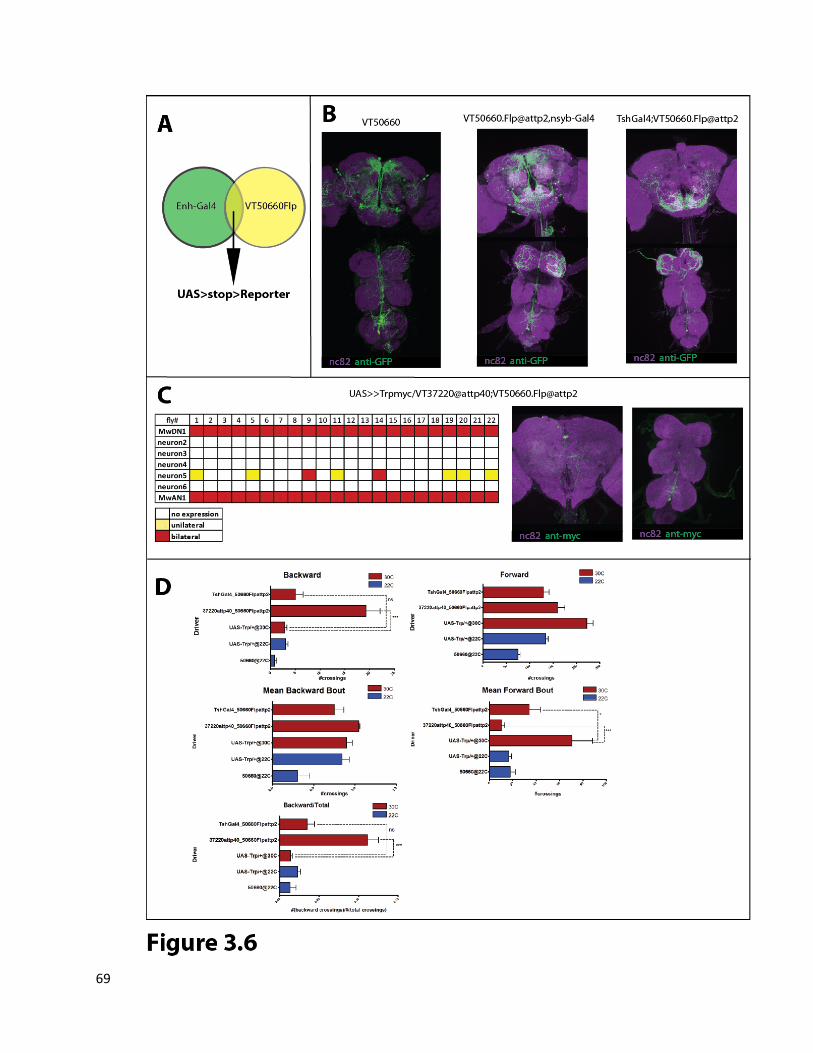
69
70
MwAN1 were the only neurons consistently labeled in all the flies of this combination and all the flies
were observed to show the “moonwalking” phenotype on activation. We tried to further quantify the
phenotypes of these interesting Flp and GAL4 combinations in our 1D-walking-in-a-ring assay. A clear
“moonwalking” phenotype was observed when MwDN1 and MwAN1 were simultaneously activated
(combination of VT37220@attp40 and VT50660.Flp), whereas activation of MwAN1 alone (combination
of Tsh-GAL4 and VT50660.Flp) did not show a significant phenotype (Figure 3.6D). At this point it is
important to mention that in general the phenotypes observed with this strategy (Figure3.6A) are
weaker as compared to those with direct GAL4 and UAS-TrpA1 (compare with figure 3.3B). Therefore it
is probably inappropriate to conclude that activation of MwAN1 does not cause any “moonwalking”
phenotype. Probably the phenotype is weak and difficult to observe with this strategy. But it is safe to
conclude that activation of MwDN1 and MwAN1 is enough to cause the “moonwalking” phenotype.
MwDN1 activation triggers initiation of backward directed walking.
Another intersectional genetics strategy that we applied employed the use of split GAL4 system
for labeling overlapping expression patterns of two enhancer-GAL4 lines. In this approach we generated
transgenic lines in which enhancer tiles corresponding to our activation screen “moonwalking”
phenotype GAL4 lines were used to drive the expression of half of the GAL4 (either activation domain or
DNA binding domain) and a functional transcriptional activator is only reconstituted in those cells where
both of these are simultaneously expressed (Figure 3.7A). Using this approach we found four
combinations that label MwDN1 neuron. The two combinations (different landing sites) using VT44845
and VT37220 enhancer tiles expressed in MwDN1 and only 2 other clusters in the brain and 2 clusters in
the VNC, but not in MwAN1 (note there is a neuronal cluster which has cell bodies in location similar to
MwAN1 cells but they lack the characteristic MwAN1 metathoracic arborization (Figure3.5D) (Figure
3.7B,C left). The two combinations using VT44845 and VT50660 enhancer tiles express in MwDN1 and

71
Figure 3.7: Intersectional strategies to specifically label MwDN1.
A. Spli-GAL4 strategy scheme.
B,C. Expression patterns observed in different split GAL4 combinations which label MwDN1.
D. Intersectional strategy using Tsh-Gal80 to suppress expression of GAL4 in MwAN1 as indicated
by loss of UAS-mCD8-GFP expression (right bottom inset)

72

73
some projections probably coming from antennae and have no other expression in brain or VNC (Figure
3.7B,C right).
Another intersectional genetics strategy employs expression of GAL80, a GAL4 suppressor to
eliminate UAS-Reporter expression in subset of GAL4 expressing neurons. Tsh-GAL80 line can be used to
eliminate GAL4 expression in most of the VNC neurons. When used in combination with VT50660, this
yields a combination which labels most of the VT50660+ brain neurons (including MwDN1), but does not
label MwAN1 (Figure 3.7D).
Thus, through the above mentioned strategies we managed to generate five genetically
independent ways of labeling MwDN1 neurons but not MwAN1. We now asked what happens when we
thermo-activate MwDN1 but not MwAN1. Quantification in the 1D-walking-in-a-ring assay showed that
MwDN1 activation is sufficient to trigger the “moonwalking” phenotype (Figure 3.8A, B). But
interestingly, although total backward walking triggered by MwDN1 alone is comparable to that
triggered by MwDN1+MwAN1 activation (Figure 3.8A), the duration of individual backward bouts is
significantly reduced when MwDN1 is activated as against MwDN1+MwAN1 (Figure3.8C). When MwDN1
alone is activated, the flies initiate a lot of backward walks, however they do not maintain this backward
walking state for a long time and constantly keep switching between backward and forward walking
states. This is even more apparent when one looks at the fraction of backward to total number of
crossings (Figure 3.8E). When MwDN1 and MwAN1 are both activated the flies are in backward walking
state for most of the time, whereas when only MwDN1 is activated only about half of the time the flies
are walking backwards. One might argue that level of expression of TrpA1 is different in the split GAL4
combinations as against the original GAL4 line and this might account for difference in the phenotype
strength. However, the combination of the GAL4 line with Tsh-GAL80 argues against this, as in this case
only MwAN1 expression is affected whereas MwDN1 expression is unchanged. As there is no significant
74
difference between activation phenotypes of split GAL4 combinations and the Tsh-GAL80 combination
(Figure 3.8E), it is safe to conclude that activation of MwDN1 triggers initiations of backward walking
whereas both MwDN1 and MwAN1 need to be simultaneously activated to trigger prolonged
“moonwalking” phenotype.
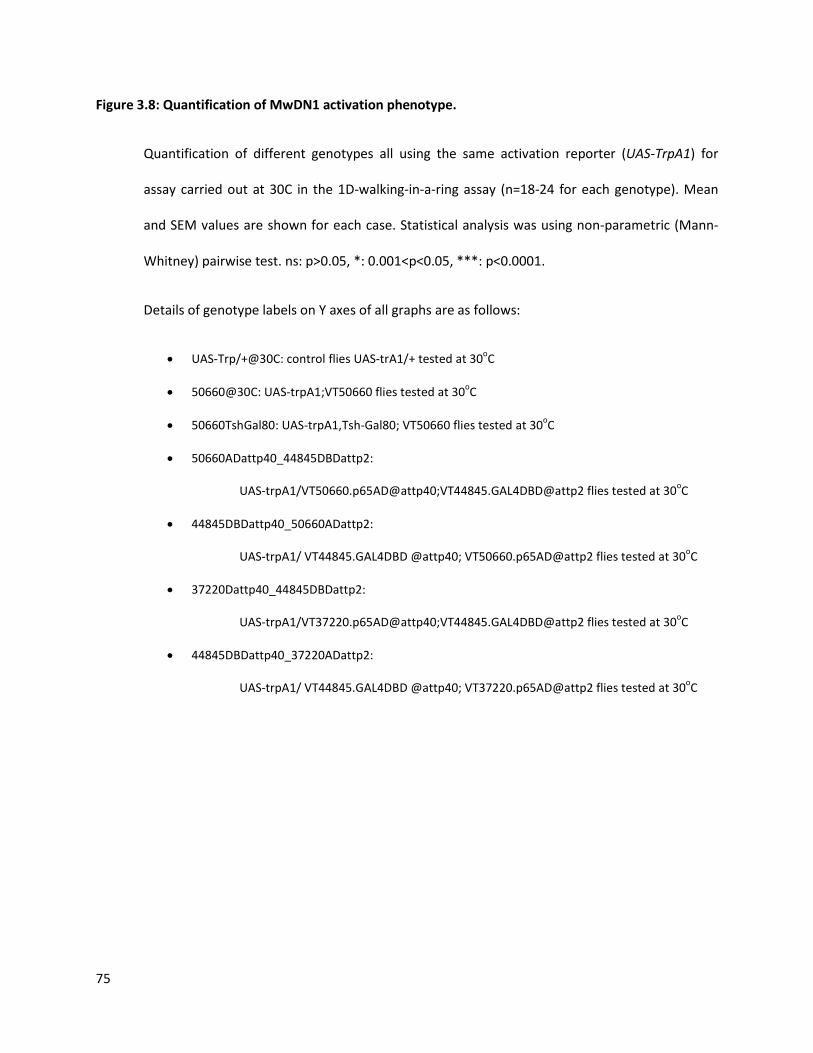
75
Figure 3.8: Quantification of MwDN1 activation phenotype.
Quantification of different genotypes all using the same activation reporter (UAS-TrpA1) for
assay carried out at 30C in the 1D-walking-in-a-ring assay (n=18-24 for each genotype). Mean
and SEM values are shown for each case. Statistical analysis was using non-parametric (Mann-
Whitney) pairwise test. ns: p>0.05, *: 0.001<p<0.05, ***: p<0.0001.
Details of genotype labels on Y axes of all graphs are as follows:
• UAS-Trp/+@30C: control flies UAS-trA1/+ tested at 30oC
• 50660@30C: UAS-trpA1;VT50660 flies tested at 30oC
• 50660TshGal80: UAS-trpA1,Tsh-Gal80; VT50660 flies tested at 30oC
• 50660ADattp40_44845DBDattp2:
UAS-trpA1/VT50660.p65AD@attp40;VT44845.GAL4DBD@attp2 flies tested at 30oC
• 44845DBDattp40_50660ADattp2:
UAS-trpA1/ VT44845.GAL4DBD @attp40; VT50660.p65AD@attp2 flies tested at 30oC
• 37220Dattp40_44845DBDattp2:
UAS-trpA1/VT37220.p65AD@attp40;VT44845.GAL4DBD@attp2 flies tested at 30oC
• 44845DBDattp40_37220ADattp2:
UAS-trpA1/ VT44845.GAL4DBD @attp40; VT37220.p65AD@attp2 flies tested at 30oC
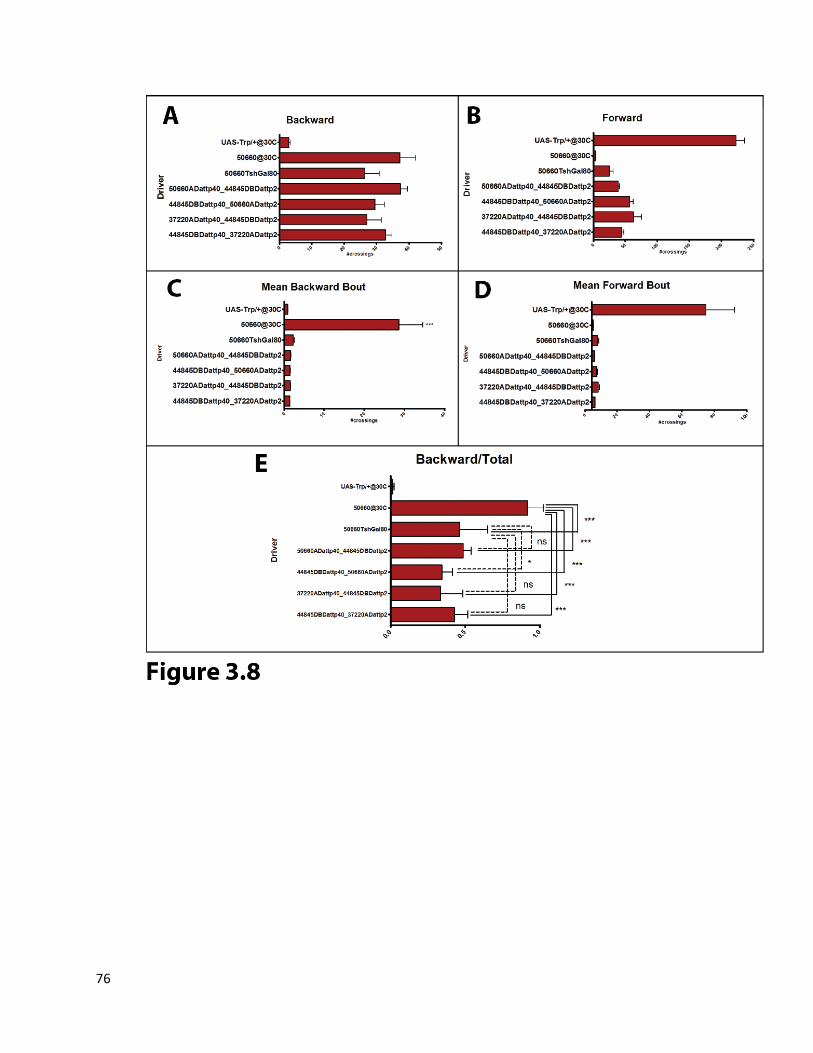
76
77
Synaptic silencing of MwDN1 specifically inhibits backward walking:
In order to observe the effects of neuronal silencing on backward walking we developed a new
1D-walking-in-a-groove assay. In this assay flies walk in a thin groove chamber in a straight line (Figure
3.9A). When the flies reach the end of the chamber (there is a wall, unlike in the 1D-walking-in-a-ring
assay), they are faced with three options, either to stop walking, or to walk backwards, or to squeeze
their bodies and perform a difficult turning maneuver and walk forwards again. Most wild type flies tend
to start walking backwards when they reach the wall (the size of the groove was optimized for this
behavior, see Methods). We also developed a computer vision based software, to automatically track
the heading and the trajectory of the flies (Figure3.9B, Methods). We further applied a velocity
threshold (velocity < 1.8 pixels/sec) in order to define whether the fly is in a walking state or just
oscillating when at the end of the chamber (see Methods). Our analysis for control flies (UAS-TNT/+)
shows that they spend almost equal time in forward versus backward walking states (Figure 3.9C). We
then used UAS-TNT (Tetanus toxin light chain) to specifically silence the synaptic transmission in GAL4
labeled neurons (Sweeney, Broadie et al. 1995). When we silenced the neurons labeled by the activation
screen “moonwalking” line VT50660, these flies were unable to walk backwards. Moreover their
forward walking was unaffected and when they reach the end of the groove chamber, these flies tend to
squeeze and turn or stop walking, instead of walking backwards (Figure 3.9D). We further tested all of
our activation screen “moonwalking” and “backward turning” GAL4 lines in this neuronal silencing 1D-
walking-in-a-groove assay. Two more GAL4 lines VT44845 and VT1606 showed a similar phenotype to
VT50660 (Figure 3.9E), whereas the remaining GAL4 lines were either lethal when crossed to the UAS-
TNT line or showed a general locomotion defect (both forward and backward walking defective). The
expression patterns of VT44845 and VT50660 overlap in the MwDN1 neuronal cluster on the basis of the
split-GAL4 intersectional genetics strategy (Figure 3.7B and C; right panels). This indicates that synaptic

78
Figure 3.9: 1D-walking-in-a-groove assay for neuronal silencing experiments.
A. Snapshot of 1D-walking-in-a-groove assay. Note the extremely narrow chambers which prevent
flies from turning easily.
B. Graphical output of automated video tracking showing trajectory of the flies (black line) and
forward and backward walking states depicted by green and magenta background respectively.
C. Graphical output for tracking of control (UAS-TNT/+) flies (n=12, 1 column per fly) shows both
backward and forward walking (magenta and green background)
D. Graphical output of tracking of UAS-TNT;VT50660 (n=12, 1 column per fly)shows specific
reduction of backward walking but forward walking seems unaffected (mostly green
background).
E. Quantification of backward walking state, forward walking state and fraction of time spent in
backward walking state for control flies (pink bars) and activation screen positive VT lines (blue
bars) that showed strong specific inhibition of backward walking on neuronal silencing (n=24-36
for each case). Mean and SEM values are shown for each case. Statistical analysis is using non-
parametric pairwise comparison (Mann-Whitney test). ns: p>0.05, *: 0.001<p<0.05, ***:
p<0.0001.
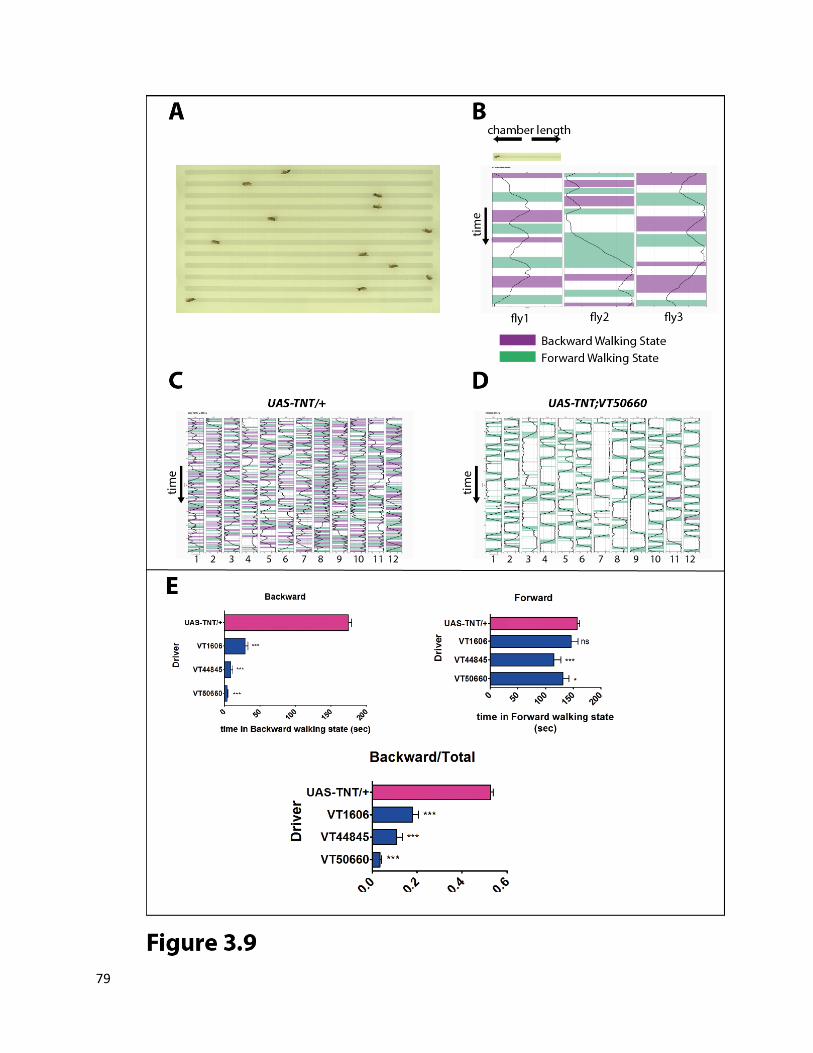
79
80
silencing of MwDN1 neuron is leading to a strong and specific reduction in naturally triggered backward
walking. This shows that MwDN1 is essential for naturally triggered backward walking behavior.
3.3 Discussion:
Thermogenetic activation of higher order neurons triggers coordinated
directed walking in Drosophila melanogaster.
In our search for higher order neurons involved in directed walking significant number of
directed walking phenotypes could be observed by thermo genetic neuronal activation strategy. The fact
that we were able to trigger well coordinated directed walking indicates that neurons that are
functionally upstream of CPGs and motor elements of the walking circuit are being thermo-activated in
these experiments. It is of course likely, that some of our phenotypes are cause by activation of specific
sensory neurons that trigger a directed walking response, however it is also possible that certain
phenotypes are a result of activating decision making or command centers involved in selection of
walking direction. By focusing on the GAL4 lines that showed backward directed walking (or
“moonwalking”) phenotype, we were able to pinpoint two clusters of higher order neurons, MwDN1
and MwAN1 responsible for triggering this behavior.
Probable models to explain MwDN1 and MwAN1 functioning in backward
directed walking.
Using intersectional genetics strategies we were able to show that activation of MwDN1 alone is
sufficient to trigger backward walking but these backward walks last for only a short duration (Figure
3.8), however simultaneous activation of MwDN1 and MwAN1 leads to prolonged backward walking
instances. On the other hand, activation of MwAN1 alone doesn’t trigger strong backward walking
phenotype (Figure 3.6), however as these experiments were carried out using a weaker activation
81
strategy (UAS>>Trpmyc,VT50660FLp), we need to reconfirm this result. Also, silencing of MwDN1 alone
(VT44845) is sufficient to cause strong and specific decrease in backward walking (as strong as silencing
MwDN1 and MwAN1). This result must be confirmed using intersectional genetics strategies to
specifically silence MwDN1. Also specific silencing of MwAN1 must be carried out using other
intersectional strategies.
From our analysis of morphology of these neurons, we can assume that MwDN1 is a descending
“command” neuron that triggers backward walks, whereas MwAN1 is an ascending neuron important
for enhancing backward walking phenotype. Preliminary data for polarity staining of these two neurons
confirms that MwDN1 indeed has presynaptic sites in the three thoracic ganglia whereas MwAN1 has its
presynaptic sites in the SOG and strong dendritic arborization in metathoracic ganglion (Figure 3S). Also
looking at template registered images of these neurons it seems that there is small overlap between
MwDN1 and MwAN1 arborizations in the SOG (Figure 3S). On the basis of the anatomy and known
functional data for these two neurons, we can speculate about a functional model for the neuronal basis
of backward walking behavior. A first possibility is that MwDN1 and MwAN1 are components of parallel
independent pathways that trigger backward walking and activation of one in absence of other is not
sufficient to give a phenotype as strong as simultaneous activation of both. However, our silencing
results seem to suggest that silencing MwDN1 alone is enough for almost complete abolishing of
backward walking. This hints at the possibility that they form elements of a common pathway.
It has been reported that in stick insects the inherent stepping direction of a hind-leg is
backwards whereas that of front leg is forwards and the middle leg steps more often forwards than
backwards (Bassler, Foth et al. 1985; Bassler and Buschges 1998; Borgmann, Hooper et al. 2009). It was
further reported that in an intact forward walking stick insect the activity of front leg entrains the middle
and hind legs to start stepping in forward direction. This entrainment was abolished in decapitated

82
insects, which showed that certain brain centers (at least the SOG) were required for maintaining a
forward directed stepping in the middle and hind legs. This finding proposed the existence of a neural
circuit originating in the prothoracic ganglion which via certain brain centers, influences activity of CPGs
in the mesothoracic and metathoracic ganglia. Bassler et al, (Bassler, Foth et al. 1985) also speculate
that “For backwards walking there may be an equivalent channel in the opposite direction with signals
originating in the metathoracic ganglion that induce the forelegs and middle legs to walk backwards”.
In the light of these results and speculations, we propose that MwAN1 might be a neuronal
correlate of a metathoracic centre which senses hind leg backward stepping and conveys this signal to
the SOG and then either directly or indirectly activates MwDN1 which triggers backward stepping of all
the legs. However this puts MwAN1 upstream to MwDN1 in our model and therefore potentially
contradicts with our observation that thermo-activation of MwAN1 alone cannot trigger a strong
backward walking phenotype. This might be explained by the fact that natural backward walking is only
triggered in response to certain sensory stimuli (like our 1D-walking-in-a-groove assay, or antenna
plucking in stick insects(Graham and Epstein 1985)). Therefore MwDN1 might need additional inputs via
other sensory stimuli in order to be activated and hence MwAN1 on its own might not be sufficient to
activate MwDN1. Also, MwDN1 has a contralateral projection in the VNC which might indicate its
directed output in response to asymmetric sensory inputs. This compliments with the fact that in a
natural surround, flies usually exhibit backward turning and not straight backward walking. This
backward turning might be achieved if MwDN1 in one brain hemisphere directly or indirectly inhibits the
contralateral MwDN1 thereby biasing backward walking to one side determined by the asymmetric
sensory input. In the case of MwAN1, its symmetric dendritic arborization in metathoracic ganglion
suggests that both neurons of this cluster (1 neuron per hemisphere) might get activated by induced
backward stepping of any of the hind leg and then feedback on both clusters of MwDN1 in the brain.
However MwDN1 in only one hemisphere will be receiving the sensory inputs and thereby tipping the

83
Figure 3.10: Models for functioning of MwDN1 and MwAN1 during backward walking.
Arrows indicate a functional activation whereas blunt ended lines indicate functional inhibitory
interaction. All connections are hypothetical.
A. This model assumes MwAN1 directly activates MwDN1 via its ascending projections.
B. This model assumes MwAN1 activates (or dis-inhibits) contralateral MwDN1 via inhibitory inter-
neurons (IIN).
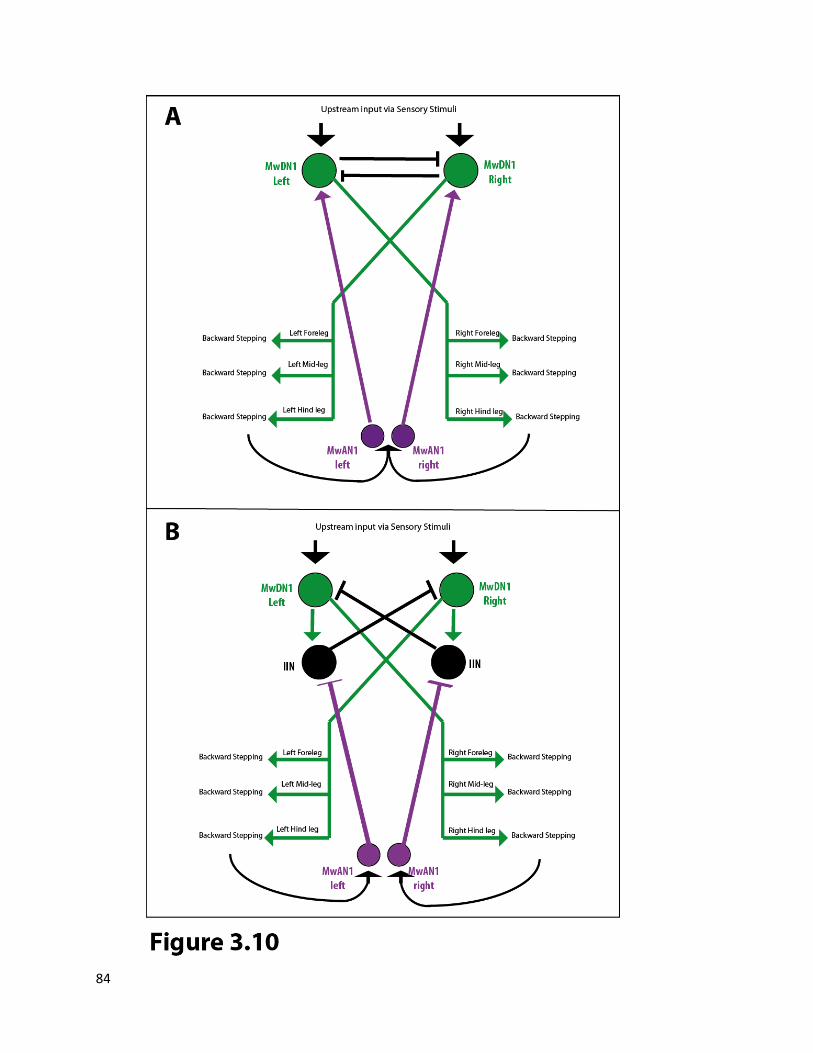
84
85
balance of contralateral inhibition (Figure 3.15A). Another way to model this interaction is possible if we
assume that MwDN1 inhibits its contralateral sister cluster indirectly via inhibitory interneurons. In this
scenario we can postulate that MwAN1 inhibits its ipsilateral inhibitory interneuron (through its
ipsilateral projection in SOG) and therefore indirectly activates (or dis-inhibits) the contralateral
MwDN1, leading to sustained activity of MwDN1 in only one hemisphere (Figure 3.15B). (The lack of
such unidirectional back turning phenotype in our stochastic labeling experiments might be simply
because of the use of weaker neuronal activation strategy that relies on UAS>>Trpmyc, Figure 3.6).
However wild type flies normally show only transient backward turning bouts. Even in the 1D-
walking-in-a-groove assay the induced backward walking bouts in control flies are relatively small, (flies
rarely walk entire length of the chamber backwards, Figure 3.9). This means that in a sensory triggered
backward walking state this MwDN1 and MwAN1 feedback circuit can only lead to a transient backward
walking bout which over time gets overridden by inhibitory signals either from MwDN1 mutual
inhibition or via other elements promoting forward walking. However in the situation where we
artificially activate both MwDN1 and MwAN1 neurons this backward walk promoting feedback circuit
(corresponding to any of the two proposed models) remains in a constitutively active state (maybe
overcoming inhibitory influences) and therefore leads to an unusually prolonged and straight backward
walking (or “moonwalking”) phenotype. Artificial bilateral activation of MwDN1 alone is probably not
enough to maintain prolonged activity of the feedback circuit, similar to receiving bilateral sensory
stimuli and therefore results in transient backward bouts similar to that observed in wild type flies in the
1D-walking-in-a-groove assay. It is also important to realize that there must be always a competing drive
for forward walking in our artificially triggered situations since flies usually prefer forward walking in our
activation chambers (control flies almost never walk backwards). Moreover we also observed (data not
shown) that if we increase the drive for forward walking by placing a wild type female fly in front of a
male fly whose VT50660+ neurons are thermo-activated, the male interrupts its induced backward bouts
86
in order to follow and court the female. A similar phenotype also occurs if the test fly is placed in a
chamber with inclined floors (beveled chambers) where it tries to walk uphill (due to negative gravitaxis)
forwards and interrupts its backward bouts in such situations.
Further analysis including neurotransmitter profiling and functional imaging experiments will
provide better evidence for or against these speculated models. These results and models however
provide an entry point for the dissection of higher order neuronal centers in backward directed walking.
This, according to our knowledge, is the first demonstration of specific identified higher order neurons
generating a coordinated directed walking behavior in an insect model system and therefore adds to the
existing knowledge of sensory and motor circuits involved in insect walking.
Other neurons (apart from MwDN1 and MwAN1) involved in backward
directed walking:
From the neuronal activation screen we have also obtained a number of GAL4 lines that show
backward turning phenotype and according to a preliminary analysis these do not express in either
MwDN1 or MwAN1 neurons. Since they show a backward turning phenotype, it is likely that they label
sensory neurons upstream of MwDN1 and may strongly activate MwDN1 similar to natural sensory
inputs. It must be noted that the turning seems to switch direction from time to time (data not shown)
which might be due to alternate inhibition of contralateral MwDN1s. Further investigation of these lines
using intersectional genetics strategies will shed light on specific neurons responsible for this behavior.
87
3.4: Materials and Methods
Fly stocks
All VT lines (Enhancer GAL4 lines) were a part of the VT library as described in Chapter 2. The
neuronal activation effector lines UAS-TrpA1 and UAS>stop>trpA1myc flies were generated as described
in (von Philipsborn, Liu et al. 2011), using original UAS-TrpA1 stock kindly provided by P. Garrity
(Hamada, Rosenzweig et al. 2008). The hs-Flp line used in stochastic labeling experiments corresponds
to the weak hs-Flp provided by K. Scott lab ((Gordon and Scott 2009).The neuronal silencing effector line
UAS-TNT was obtained from (Sweeney, Broadie et al. 1995). The VT50660.Flp line is generated by
replacing GAL4 part of VT50660 construct with a FLP(Flip recombinase), and injecting the construct in
the same landing site attp2 flies as the original VT line. The split GAL4 lines were generated in a similar
way by replacing GAL4 part of the VT construct with ZpGAL4DBD (GAL4 DNA binding domain with
leucine Zipper domain) or p65ADZp (p65 activation domain with a leucine Zipper domain). The cloning
was performed using constructs published by (Pfeiffer, Ngo et al. 2010), see acknowledgments.
Thermal Activation Experiments
All control and trpA1 expressing flies using in neuronal activation experiments were reared at 22oC and
males and females were collected shortly after eclosion in separate vials (15-20 flies per vial). The
collected flies were then aged (unless otherwise mentioned) for a period of 10-14 days at 22oC prior to
screening for behavior.
Neuronal Activation Screen
From the collected and aged flies, 6-7 males and 6-7 females per genotype were placed in
10mm diameter circular chambers (1 fly per chamber) and the chamber was placed on a heating plate

88
which heated it from 25oC to 32 oC over a period of 10-15 minutes. During this time the flies were video
recorded with a high definition video camera.
1D-walking-in-a-ring Assay
In this assay female flies were placed in narrow ring chambers (Figure 3.3A), (height = width =
2.5mm and diameter = 18mm, size optimized to just fit an average female fly; age = 10 days post
eclosion at 22 oC). The entire assay area consisted of 11 such rings; one of the rings contains a feedback
temperature sensor which helps to maintain the chamber at a constant temperature with the help of a
heating glass which covers the chamber on the top. 10 female flies were tested in a single video of 5
minute duration which was later analyzed manually for quantifying forward and backward walking.
For quantification of phenotype, we divided the chamber into 8 equal sectors and scored the
number of times the fly crossed the sector boundaries in forward or backward direction. One crossing
was scored only if the entire body length of the fly crossed the sector boundary and the distance
between 2 sector boundaries was ~ 2 body lengths (~7mm). One revolution around the ring = 8
consecutive crossings in same direction = 56.52 mm. We also scored for number of turns. The following
values were then quantified for measuring the phenotype
1. Backward: corresponds to total backward walking = total backward crossings
2. Forward: corresponds to total forward walking = total forward crossings
3. Backward/Total = total backward crossings/total crossings
4. Mean Backward Bout = total backward crossings/ number of backward bouts, where a backward
bout is defined by one or more consecutive backward crossings without being interrupted by
forward crossings or turns.
89
5. Mean Forward Bout = total forward crossings/ number of forward bouts, where a forward bout
is defined by one or more consecutive forward crossings without being interrupted by backward
crossings or turns.
All graphical plotting and statistical analysis was performed GraphPad Prism version 5.00 for
Windows, GraphPad Software, San Diego California USA, www.graphpad.com
Stochastic Labeling/Activation Experiments
In these experiments the F1 progeny were heat shocked for 90 minutes at 37 oC during the mid-late
larval stage (6-7 days post eclosion at 22 oC). The time window for optimal heat-shock conditions was
obtained by an initial set of experiments where we heat shocked at different developmental stages and
aimed at finding a stage and condition where we get ~ 10% moonwalking flies (data not shown). Single
flies were then assayed for behavior in a setup similar to the activation screen set up and then
individually dissected to prepare their brains and VNCs (Ventral Nerve Cords) for immunohistochemistry
with anti-myc.
Intersectional Genetics Experiments
The VT50660.Flp experiments were performed in the 1D-walking-in-a-ring assay at inactive (22
oC) and active (30 oC) temperatures and their behavior was quantified as mentioned before. Individual
flies expressing trpA1myc were assayed for their expression similar to stochastic labeling experiments.
The split GAL4 and Tsh-Gal80 experiments were also performed in similar conditions in the 1D
walking-in-a-ring assay. These flies were assayed for expression analysis using UAS-mCD8-GFP reporter
line.
90
Neuronal Silencing Experiments:
All control and TNT (tetanus toxin light chain) expressing flies used in neuronal silencing experiments
were reared at 25 oC and males were collected (15-20 per vial) shortly after eclosion. The collected flies
were aged for a period of 4-5 days before the behavioral assay.
1D-walking-in-a-groove assay
In this assay male flies were aspirated into narrow straight line chambers (height=width=1.5mm and
length = mm). The dimensions of the chambers were optimized so that male flies could just fit length-
wise in the chambers and are not able to easily turn around (Figure 3.9A), but at the same time can
comfortably walk forwards and backwards. We recorded 12 flies at the same time as shown in Figure
3.9A for a period of 10 minutes per video. Top of the chambers was covered with transparent hard
plastic.
Tracking Software
The computer tracking software for analyzing the videos obtained from 1D-walking-in-a-groove assay is
a part of a fly tracking software package produced by Christian Machacek and Barry Dickson
(unpublished work) and a detailed description of this is beyond the scope of this thesis. The output of
the software provides the position and orientation of the fly in every frame of the video and from this
the entire trajectory of the fly for the duration of the video is calculated. In these chambers some flies,
when stuck near the ends of the chamber, show small oscillatory movements which in reality do not
correspond to a walking like state. In order to omit these kind of situations from being scored as walking
state we applied a minimum velocity threshold (1.8 pixels per frame), to define time periods of forward
or backward walking states.
91
Immunohistochemistry and Image Analysis.
Unless otherwise stated, flies were reared at 25 oC and aged for 4-6 days post eclosion before
dissecting their brains and VNCs for staining purpose. Staining protocol was as described in (Yu, Kanai et
al. 2010). Antibodies used were rabbit anti-GFP (1:6000, Torri Pines), mouse mAB nc82 (1:20, Hybridoma
Bank), rabbit anti-myc (1:12000, abcam), and secondary Alexa 488 and 568 antibodies (1:1000,
Invitrogen).
Confocal stacks of stained brains and VNCs were acquired with Zeiss LSM710 with a Multi
Immersion Plan NeoFluor 25x/0.8 objective. Image z-projections and analysis were performed using
Image J or Amira software (Visage Imaging). Non-rigid registration, segmentation and image preparation
were performed as described previously in (Yu, Kanai et al. 2010).

92
References.
Bassler, U. and A. Buschges (1998). "Pattern generation for stick insect walking movements--multisensory control of a locomotor program." Brain Res Brain Res Rev
Bassler, U., E. Foth, et al. (1985). "The Inherent Walking Direction Differs for the Prothoracic and Metathoracic Legs of Stick Insects."
27(1): 65-88.
Journal of Experimental BiologyBorgmann, A., S. L. Hooper, et al. (2009). "Sensory Feedback Induced by Front-Leg Stepping Entrains the
Activity of Central Pattern Generators in Caudal Segments of the Stick Insect Walking System."
116(May): 301-311.
Journal of NeuroscienceGordon, M. D. and K. Scott (2009). "Motor control in a Drosophila taste circuit."
29(9): 2972-2983. Neuron
Graham, D. and S. Epstein (1985). "Behavior and Motor Output for an Insect Walking on a Slippery Surface .2. Backward Walking."
61(3): 373-84.
Journal of Experimental BiologyHamada, F. N., M. Rosenzweig, et al. (2008). "An internal thermal sensor controlling temperature
preference in Drosophila."
118: 287-296.
NatureMu, L. and R. E. Ritzmann (2008). "Interaction between descending input and thoracic reflexes for joint
coordination in cockroach. II comparative studies on tethered turning and searching."
454(7201): 217-20.
J Comp Physiol A Neuroethol Sens Neural Behav Physiol
Mu, L. and R. E. Ritzmann (2008). "Interaction between descending input and thoracic reflexes for joint coordination in cockroach: I. descending influence on thoracic sensory reflexes."
194(3): 299-312.
J Comp Physiol A Neuroethol Sens Neural Behav Physiol
Pfeiffer, B. D., T. T. Ngo, et al. (2010). "Refinement of tools for targeted gene expression in Drosophila." 194(3): 283-98.
GeneticsStrauss, R. and M. Heisenberg (1990). "Coordination of legs during straight walking and turning in
Drosophila melanogaster."
186(2): 735-55.
J Comp Physiol ASweeney, S. T., K. Broadie, et al. (1995). "Targeted expression of tetanus toxin light chain in Drosophila
specifically eliminates synaptic transmission and causes behavioral defects."
167(3): 403-12.
Neuron
von Philipsborn, A. C., T. X. Liu, et al. (2011). "Neuronal Control of Drosophila Courtship Song."
14(2): 341-51.
Neuron
Wilson, D. M. (1966). "Insect Walking."
69(3): 509-522.
Annual Review of EntomologyYu, J. Y., M. I. Kanai, et al. (2010). "Cellular organization of the neural circuit that drives Drosophila
courtship behavior."
11: 103-&.
Curr Biol
20(18): 1602-14.
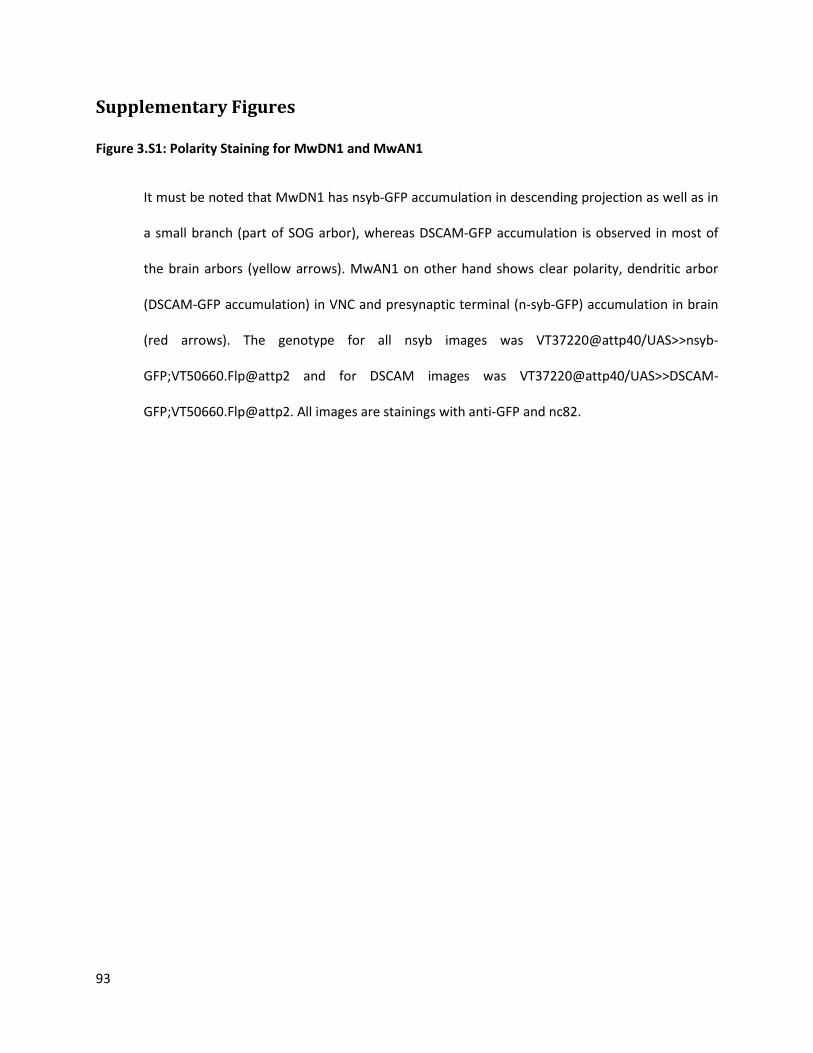
93
Supplementary Figures
Figure 3.S1: Polarity Staining for MwDN1 and MwAN1
It must be noted that MwDN1 has nsyb-GFP accumulation in descending projection as well as in
a small branch (part of SOG arbor), whereas DSCAM-GFP accumulation is observed in most of
the brain arbors (yellow arrows). MwAN1 on other hand shows clear polarity, dendritic arbor
(DSCAM-GFP accumulation) in VNC and presynaptic terminal (n-syb-GFP) accumulation in brain
(red arrows). The genotype for all nsyb images was VT37220@attp40/UAS>>nsyb-
GFP;VT50660.Flp@attp2 and for DSCAM images was VT37220@attp40/UAS>>DSCAM-
GFP;VT50660.Flp@attp2. All images are stainings with anti-GFP and nc82.
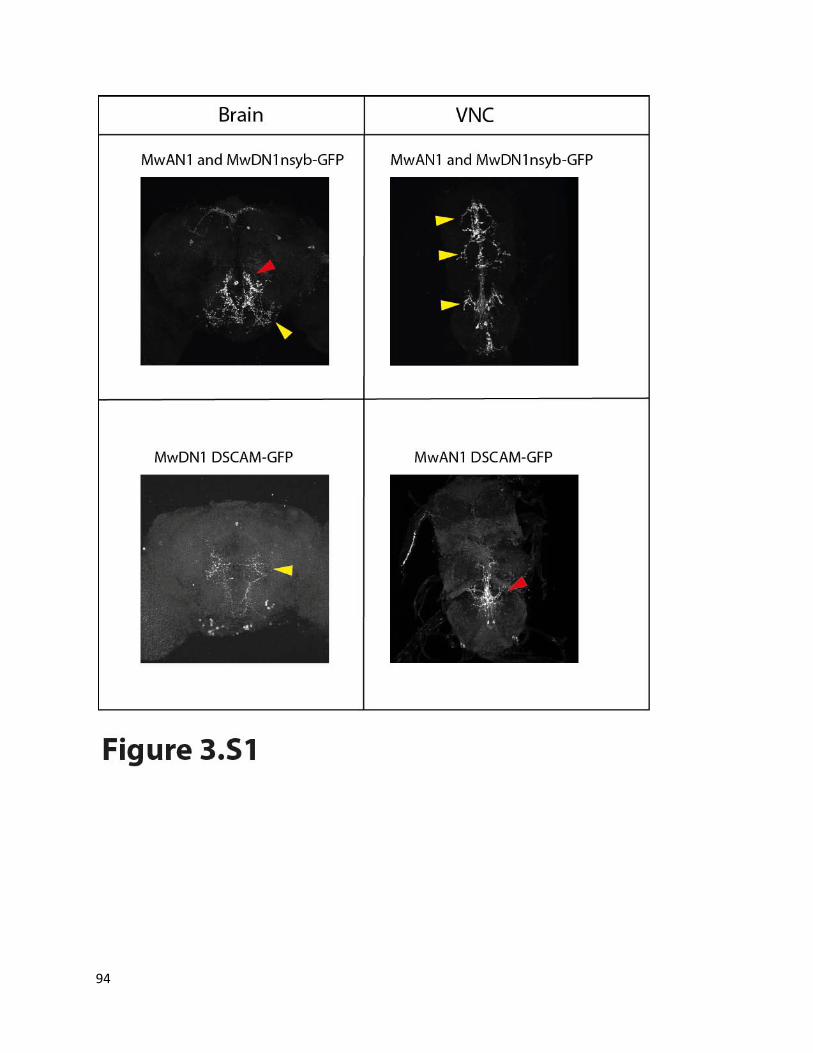
94
95
Chapter 4: A neuronal silencing screen for forward and backward directed walking.
4.1 Background
We have shown (in Chapter 3) that it is possible to trigger backward directed walking by
artificially activating specific neurons in the fly nervous system. We further developed an assay to induce
wild type flies to walk backwards (Figure 3.10) and demonstrated that synaptic silencing of certain
neurons (MwDN1) leads to inhibition of this naturally triggered walking behavior. Since we developed an
assay in which flies only walk forwards or backwards, in the current work, we decided to use this for
screening for other neuronal elements of forward and backward directed walking (in addition to
MwDN1 and MwAN1, from Chapter 3). Also, since we had a way of objectively quantifying the
phenotypes with the help of an automated computational tracker, it provided and extremely efficient
way to analyze the output of a large scale neuronal silencing screen. Via such a screen, we aim to find
additional neurons that might be important for directed walking behavior.
4.2 Results
Neuronal Silencing Screen for forward and backward directed walking
We carried out an unbiased neuronal silencing screen of the enhancer GAL4 library (VT lines, see
chapter 2) using the 1D-walking-in-a-groove assay (see Methods from Chapter 3 and Figure 3.9) to find
neurons important for forward and backward directed walking. We employed the synaptic silencer TNT
(tetanus toxin light chain) for silencing the GAL4 targeted (UAS-TNT) neurons. We screened over 3000
GAL4 lines and tested 12 flies per genotype and tracked their behavior using the computer vision based

96
Figure 4.1: Neuronal silencing screen for forward and backward walking.
A. Screening work-flow.
B. Lethality percentage from total lines crossed to UAS-TNT
C. Scatter plot of median values (n=12-36) for forward versus backward walking state for 2331
screened lines.
D. Definitions for nomenclature of transitions between forward and backward walking states.
E. List of 24 selected parameters for further analysis of the phenotypes observed in the screen.

97

98
program (Figure 4.1A and B). 23% of the GAL4 lines were lethal when crossed to the UAS-TNT silencer
line. For 2331 viable lines, the scatter plot of median values for “time in backward walking state” Vs
“time in forward walking state” shows the different degrees of silencing phenotypes that were observed
(Figure 4.1C). It can already be seen that we have several GAL4 lines showing phenotypes similar to our
positive control (VT50660).
It is important to note that just looking at forward and backward walking sates may not be
sufficient to assess the real behavioral phenotype. In our assay, where wild type flies walk half of the
time forwards and other half backwards, a defect in any one state will also cause an effect in the other
state. e.g. Although VT50660 silenced flies can walk forwards the absolute value of forward walking
state is reduced compared to controls just because these flies have to spend more time in turning or
being stalled at the ends of the chamber compared to wild type flies which can back off easily. Therefore
we decided to extract additional attributes from our tracker output. Since we already defined backward
(backward left and backward right) and forward (forward left and forward right) walking states (see
above) we also scored for transitions between these states (Figure 4.1D). The transitions were defined
as
1. Turns: Change in walking direction and in heading of the fly but maintains walking state. Most
commonly forward left to forward right or vice versa.
2. Flips: Change in walking direction and heading but also changes walking state. Most commonly
backward left/right to forward right/left.
3. Reversals: Change in walking direction but heading remains constant. Most commonly forward
left/right to backward right/left.
4. Stalls: Halts in between the same walking state.
99
We also calculated the number of bouts and bout durations for each state and stalls. We next made a
list of all possible attributes comprising of the above mentioned parameters and their various
meaningful ratios. When the entire dataset of median values for all these 90 attributes was clustered we
could see that some of the attributes were redundant. We then selected 24 attributes which were not
completely redundant and at the same time which would help us in making a biologically meaningful
interpretation of the phenotype (Figure 4.1E). From the entire dataset of 2331 genotypes and 24
attributes, we selected those genotypes that were at least two standard deviations away from control
(UAS-TNT/+) mean with respect to at least one of the attributes. This set consisting of 463 genotypes
was now retested one to two more times in the same assay, making the total number of flies tested per
genotype to be between 24-36 (since we test 12 flies per genotype per test). This yielded a new dataset
of median values (with n=24-36) of the 24 attributes for 463 genotypes.
The best way to mine this extremely rich dataset was to carry out an unbiased clustering and try
to group GAL4 lines showing similar phenotypes together. There are two prevalent techniques to carry
out such an unbiased clustering: agglomerative hierarchical clustering and k-means (partition)
clustering. The drawback of an unbiased clustering approach is that certain interesting phenotypes
might be ignored or misinterpreted just because they are clustered together with biologically unrelated
phenotypes. We therefore decided to explore both of clustering approaches and look for similar and
prominent clusters. We followed the approach for both clustering methods as described by Braun,
Geurten et al (Braun, Geurten et al. 2010; Geurten, Kern et al. 2010). In order to carry out the clustering
we first normalized the dataset with respect to control mean and control standard deviation for every
attribute. This normalized dataset is a 463x24 matrix which we will refer to as the phenotype matrix
comprised of 463 phenotypes.
100
Hierarchical Clustering Approach:
We clustered this phenotype matrix using agglomerative hierarchical clustering with ward’s
linkage method (see Methods for details). The agglomerative clustering starts with each genotype being
treated as an independent cluster and then at every iteration it groups two most similar phenotypes
(based on the Euclidean distance) together until all phenotypes are grouped into a single cluster. Every
such grouping is associated with a grouping cost, the ward linkage cost, which depends on how similar
the elements of grouping are, and this is reflected in the branch length of the dendrogram or “clustering
tree” (Figure 4.2A). If one plots the ward joining cost as a function of number of clusters present at that
iteration, then it is clear that the joining cost starts to increase once there are less than 30 clusters
remaining (Figure 4.2B). A closer look at the region (Figure 4.2C) shows there is a sudden significant
increase in the cost if there are less than 10 clusters left. It is even more apparent if one looks at the
local minima at 10 clusters when slope of ward linkage cost is plotted (Figure 4.2D). This shows that this
dataset can be efficiently clustered into 10 clusters. Although the increase in ward linkage cost between
cluster numbers 30 to 10 is not huge, it is still possible to find local minima of slope in this region when
cluster numbers are 27, 23, 20, 17 or 13. This shows that the 10 clusters maybe further sub-clustered
into smaller distinct clusters. As the whole purpose of clustering this dataset was to efficiently
characterize all possible phenotypes, we first clustered the dataset into 10 clusters (by setting the
appropriate ward linkage cost as a cutoff) and then looked into each of these clusters for possibility of
sub-clustering or even identifying individual outlier phenotypes. The 10 clusters obtained represented
significantly different phenotypes as can be seen in the heat map (clustergram) where different clusters
are highlighted by different coloring of the dendrogram and are numbered from top to bottom as shown
in the figure. (Figure 4.2E) (see supplementary Figure 4.S1 for detailed description of each cluster). We
observed the following prominent phenotypic classes:

101
Figure 4.2: Hierarchical Clustering of all the phenotypes.
A. Agglomerative hierarchical clustering of 463 x 24 phenotype matrix shown as a clustered heat
map with coloring range going from -5 (std dev) to +5 (std dev) compared to control mean..
B. Plot of ward linkage costs as number of clusters decreases from 463 to 1.
C. Zoom of plot shown in B, in the interesting range of 50-4 clusters where linkage cost changes
significant.
D. Plot of slope of plot shown in C.
E. Enlarged view of entire clustering but now applying a threshold of linkage cost in order to get 10
clusters separated as shown by colored dendrograms and numbers on the left side. Coloring
range is as shown in A. Enlarged view of each cluster is shown in Figure 4.S1

102

103
Decreased Backward Walking: Cluster 7 consists of phenotypes that represent strong and specific
reduction in backward walking. One prominent sub-cluster of this cluster contains the positive control
(VT50660). These flies turn often when they reach the end of the groove chamber instead of reversing
or stalling (Figure 4.3A). Another activation screen positive line VT1606 also belongs to this sub-cluster.
Another of our activation screen moonwalker positive line (VT44845 which labels MwDN1 but not
MwAN1 according to split GAL4 results, Figure 3.7) belongs to a neighboring sub-cluster in the
dendrogram (Figure 4.3B). This shows almost similar phenotype with strong reduction in backward
walking but these flies stall more often when they reach the end. Since this doesn’t seem like a big
difference (probably depending on slight differences in body size of the fly) the sub-clustering of cluster
7 might be unnecessary. This strong and specific reduction of backward walking is most probably caused
by silencing of neurons essential for naturally triggered backward walking.
Increased Backward Walking: A prominent sub-cluster of cluster 1 (Figure 4.2E) shows increase in the
fraction of time spent in the backward walking state and a corresponding decrease in forward walking
fraction (Figure 4.3C). Some of the lines in this cluster show increase in number of backward bouts
which indicate increased backward initiations and this correspond well with their preference for
reversals instead of turns. This class of phenotypes might be caused by silencing of neurons essential for
inhibiting backward directed walking. A similar type of phenotype (increased backward walking
fraction), is observed in some lines in another sub-cluster (Figure 4.3D). However these flies spend
increased time in regions close to the wall of the chamber (“time in periphery” attribute is increased)
and hence show increased reversals that might contribute to increased fraction of time in backward
walking state.

104
Figure 4.3: Important sub-clusters from hierarchical clustering approach.
Important sub-clusters of clusters shown in Figure 4.2E and Figure 4.S1 are shown as clustered
heat maps with coloring range -5 to +5. The name and description of each sub-cluster is written
on top of the heat map, nomenclature includes cluster number (same as depicted in Figure 1.4E)
as a prefix.

105
106
Decreased Forward Walking: Three lines in another sub-cluster (top 3 rows in Figure 4.3E) show
extremely high backward walking fraction. However both backward and forward walking is reduced in
these flies and they show increased stall durations. Careful analysis of videos corresponding to these
phenotypes suggests that these flies might have a specific defect in forward walking and are still able to
walk backwards. However since flies normally do not prefer to walk backwards they often turn around
while walking backwards and then continue to walk back again. This behavior is specifically highlighted
in VT33050 (top row in Fig 4.3E). A neighboring sub-cluster from the dendrograms (Figure 4.2E) also
shows reduced forward and backward walking but this might be because flies tend to stall instead of
turning when they reach the end of the chamber (as reflected by increased “forced stalls/total stalls”
attribute) (Figure 4.3F).
General Locomotion Defect: Clusters 4 and 5 show phenotypes that correspond to general locomotion
defect as reflected by extremely reduced forward and backward walking and increased stall duration.
There are clear differences in certain attributes however no biologically relevant information can be
extracted since most of the differences are related to attributes corresponding to ratios of highly
reduced parameter values. A sub-cluster of cluster 5 from dendrograms (Figure 4.2E) is shown as a
representative of this class of phenotypes (Figure 4.3G).
Increased Orientation Changes: Another sub-cluster shows phenotypes that consist of increased
changes in walking direction (Figure 4.3H) primarily caused by increased number of turns and flips
compared to wild type flies. Moreover these flies show moderate decrease in forward and backward
walking state indicating that increase in turns and flips is not caused by increased walking but just by an
increased tendency to change orientation. This is also reflected by reduced number of reversals. This
kind of increased orientation change might caused by silencing of neurons that lead to inhibition of
107
turning behavior or whose silencing leads to increased sensitivity of sensory stimuli triggering
orientation change.
K-means Clustering Approach:
This approach demands the knowledge of number of desired clusters before doing the actual
clustering of the dataset. From the hierarchical clustering approach it was apparent that the data can be
clustered into 10 clusters. However unlike hierarchical clustering, it is not possible to sub-cluster the
clusters formed by a k-means clustering. For getting smaller clusters it is necessary to re-cluster the
entire dataset with higher number of clusters. The k-means approach starts with a random configuration
of centroids in the feature space and then iteratively optimizes the centroid positions and assigns data
points to the centroid so that sum of distances of the data points from the centroids is minimized. We
used two parameters described by Braun, Geurtner et al., in order to explore the optimum number of
clusters. The two parameters are:
1. Instability: Represents how stable the clustering is with respect different starting positions of
centroids.
2. Quality: Represents how dense and well-separated are the clusters which are formed. In our
analysis we slightly modified the quality measure to ignore clusters which contain one or few
data points and therefore have a quality value nearing to infinity.
The Instability value is low for clustering up to 7 clusters but increases for higher cluster numbers (Figure
4.4A). However the instability value again drops for clustering with 9 to 10 clusters. On the other hand,
the quality value is also low for lower cluster numbers and only starts increasing from 10 clusters
onwards (Figure 4.4B). This indicates that even though stable clusters can be formed for cluster numbers
less than 8, those clusters are not well separated (low quality). Therefore we first clustered the
phenotype matrix into 10 clusters which has relatively low instability value and relatively high quality.
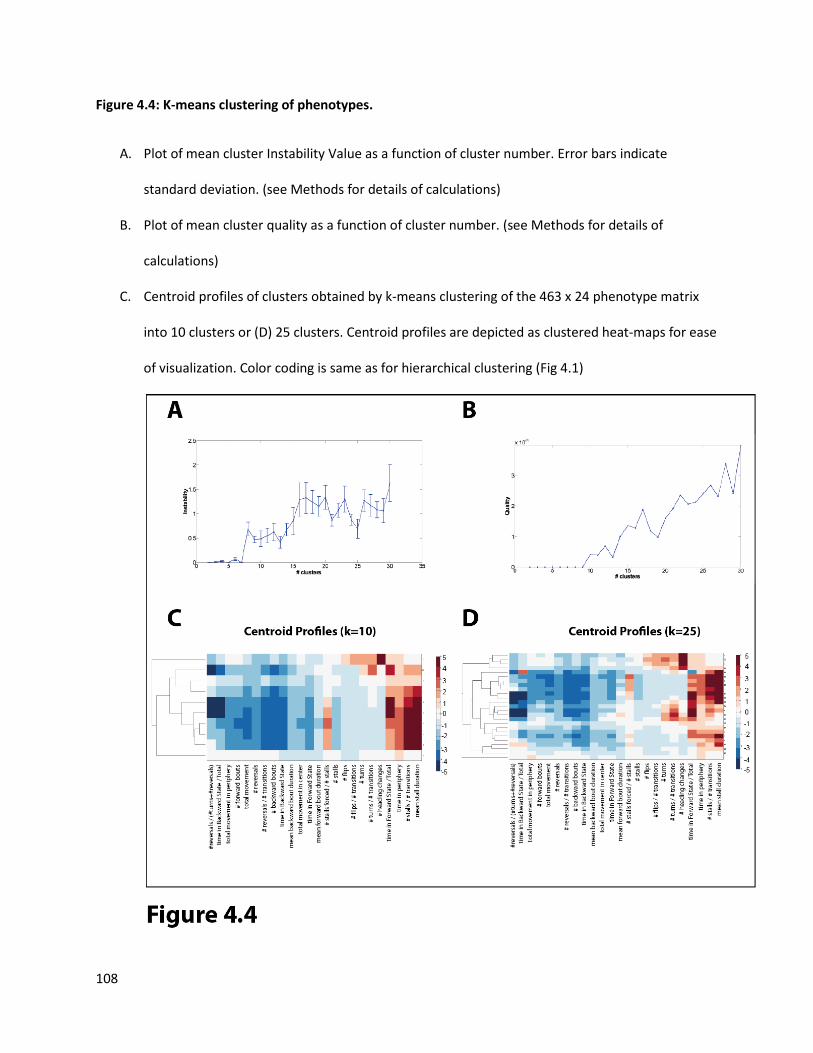
108
Figure 4.4: K-means clustering of phenotypes.
A. Plot of mean cluster Instability Value as a function of cluster number. Error bars indicate
standard deviation. (see Methods for details of calculations)
B. Plot of mean cluster quality as a function of cluster number. (see Methods for details of
calculations)
C. Centroid profiles of clusters obtained by k-means clustering of the 463 x 24 phenotype matrix
into 10 clusters or (D) 25 clusters. Centroid profiles are depicted as clustered heat-maps for ease
of visualization. Color coding is same as for hierarchical clustering (Fig 4.1)
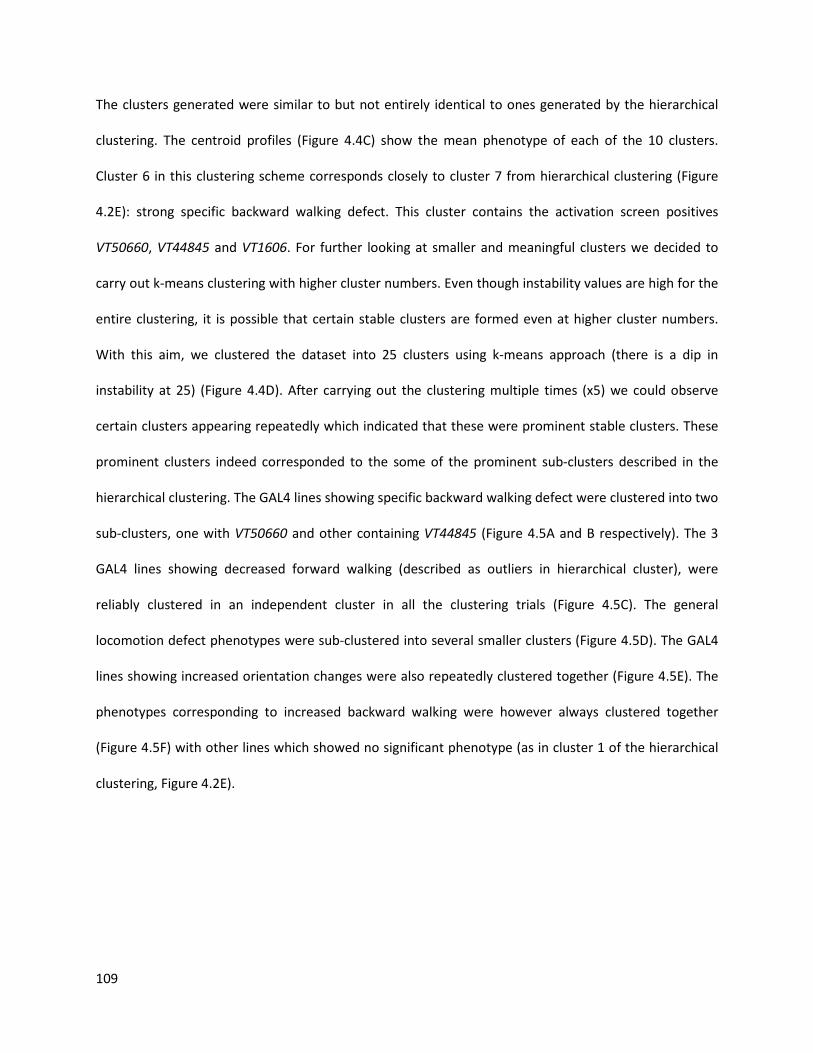
109
The clusters generated were similar to but not entirely identical to ones generated by the hierarchical
clustering. The centroid profiles (Figure 4.4C) show the mean phenotype of each of the 10 clusters.
Cluster 6 in this clustering scheme corresponds closely to cluster 7 from hierarchical clustering (Figure
4.2E): strong specific backward walking defect. This cluster contains the activation screen positives
VT50660, VT44845 and VT1606. For further looking at smaller and meaningful clusters we decided to
carry out k-means clustering with higher cluster numbers. Even though instability values are high for the
entire clustering, it is possible that certain stable clusters are formed even at higher cluster numbers.
With this aim, we clustered the dataset into 25 clusters using k-means approach (there is a dip in
instability at 25) (Figure 4.4D). After carrying out the clustering multiple times (x5) we could observe
certain clusters appearing repeatedly which indicated that these were prominent stable clusters. These
prominent clusters indeed corresponded to the some of the prominent sub-clusters described in the
hierarchical clustering. The GAL4 lines showing specific backward walking defect were clustered into two
sub-clusters, one with VT50660 and other containing VT44845 (Figure 4.5A and B respectively). The 3
GAL4 lines showing decreased forward walking (described as outliers in hierarchical cluster), were
reliably clustered in an independent cluster in all the clustering trials (Figure 4.5C). The general
locomotion defect phenotypes were sub-clustered into several smaller clusters (Figure 4.5D). The GAL4
lines showing increased orientation changes were also repeatedly clustered together (Figure 4.5E). The
phenotypes corresponding to increased backward walking were however always clustered together
(Figure 4.5F) with other lines which showed no significant phenotype (as in cluster 1 of the hierarchical
clustering, Figure 4.2E).

110
Figure 4.5: Prominent stable clusters obtained for k=25 k-means clustering.
6 stable clusters obtained in k-means clustering of the 463x24 phenotype matrix into 25
clusters (Figure 4.4D) are depicted as clustered heat maps. Coloring range is same as in
hierarchical clustering (-5 to +5). Phenotypes of each cluster are summarized on top of the heat
map.
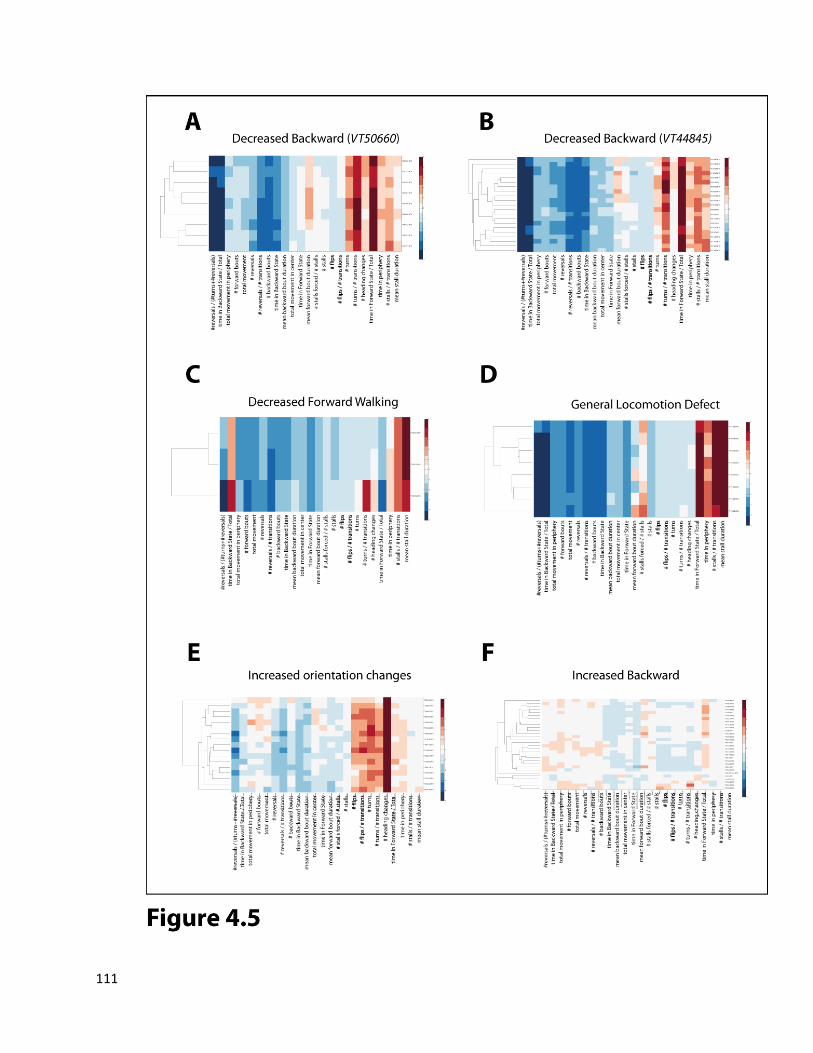
111
112
Thus, via an unbiased clustering strategy we were able to efficiently scan through our entire
phenotype matrix. In addition to finding the phenotypes closely related to our positive control (VT50660
which shows specific decrease in backward walking), we were also able to extract additional potentially
interesting phenotypes which might help us understand the neuronal basis of backward and forward
directed walking in more detail. Neuronal expression of representative GAL4 lines for each of the
prominent phenotypes is shown in supplementary figure (Figure 4.S2). A detailed expression analysis is
yet to be completed and this will be further investigated by intersectional genetics strategies like split-
GAL4 system (similar to that described in Chapter 3).
4.3 Discussion:
Our proposed models for the backward walking circuit (Figure 3.10) already point to several
cases where other neurons might interact with this circuit to enhance or diminish backward directed
walking. From the analysis of our neuronal silencing screen we obtained several GAL4 lines that showed
specific defect in backward walking. A preliminary expression analysis of these lines indicate that most
of these GAL4 lines (the ones that are not positive in activation assay) do not label MwDN1. MwAN1
analysis is not easy since a lot of VNC neurons have similar morphology and intersectional genetics
methods will further clarify these results. However there is a possibility that there are other neurons
either upstream or downstream of MwDN1 that are essential for naturally triggered backward walking
in our assay.
The silencing screen also revealed other classes of phenotypes. The increased backward walking
might be caused by neurons that normally inhibit backward walking (probably the MwDN1 inhibitory
interneurons) and lead to interruptions of the backward bouts. On the other hand the strong reduction
of forward walking observed in 3 GAL4 lines might be caused by silencing of forward walking neurons
functionally analogous to MwAN1 or MwDN1. The general locomotion defect phenotypes might be a

113
result of silencing of central complex neurons important for initiation of walking or CPG or motor
neurons important for execution of the leg stepping cycle. A preliminary expression analysis of many of
the GAL4 lines occurring in the above mentioned phenotypic classes shows enrichment of expression in
central complex region (Figure 4.S2). This region has been implicated in directional walking behaviors
(Strauss 2002), by previous work and hence a good candidate for focus of future research.
A thorough analysis using intersectional genetics strategies with GAL4 lines belonging to many
of these phenotypic classes will provide further insights into important neuronal elements that interact
with the MwDN1-MwAN1 circuit (Chapter 3, Figure 3.10) and govern the switching between forward
and backward walking states.
4.4 Methods
Fly stocks, behavioral assay, computer tracker and immunohistochemistry are as described in Chapter 3,
Methods.
Clustering:
The clustering of the phenotype matrix was carried out in Matlab (version) environment with the
statistics and bioinformatics toolboxes.
Hierarchical Clustering
The agglomerative Hierarchical Clustering was carried using the “clustergram” function on the
phenotype matrix, with “ward linkage” as the linkage method. The analyses of ward linkage cost based
on the approach by (Braun, Geurten et al. 2010) was carried out using the “linkage” function with
“Euclidean” as the distance parameter and “ward linkage method” (Figure 4.2B and C). The color-scale
of all “clustergrams” was always adjusted to the same range (-5 to +5) so as to enable comparison across
any clustering output.
114
K-means Clustering
The k-means clustering was carried out using the “k-means” function with squared Euclidean distance
measures and 10 replicates per clustering. For calculating the mean Instability values, we used the
instability function provided by (Braun, Geurten et al. 2010) and for every cluster number we performed
40 runs on the entire dataset with above mentioned k-means parameters. For calculating the mean
Quality value we used the quality function provided by (Braun, Geurten et al. 2010), but with a slightly
modified approach. Since our dataset is relatively small for higher cluster numbers there is a possibility
of generating very small clusters (with only one element per cluster), in which case the inner cluster
distance becomes 0 and the quality value becomes infinity. We therefore removed such clusters before
calculating the mean quality measure. For the sake of presentation, we plotted the clusters obtained via
the k-means method as heat maps obtained by the “clustergram” function.
References
Braun, E., B. Geurten, et al. (2010). "Identifying prototypical components in behaviour using clustering algorithms." PLoS One
Geurten, B. R., R. Kern, et al. (2010). "A syntax of hoverfly flight prototypes." 5(2): e9361.
J Exp Biol
Strauss, R. (2002). "The central complex and the genetic dissection of locomotor behaviour."
213(Pt 14): 2461-75.
Curr Opin Neurobiol
12(6): 633-8.

115
Supplementary Figures:
Figure 4.S1: Magnified image of 10 clusters obtained in hierarchical clustering.
The clusters are numbered according to nomenclature in Figure 3.11E and are shown as heat
maps with color coding similar to all other figure (-5 to +5)
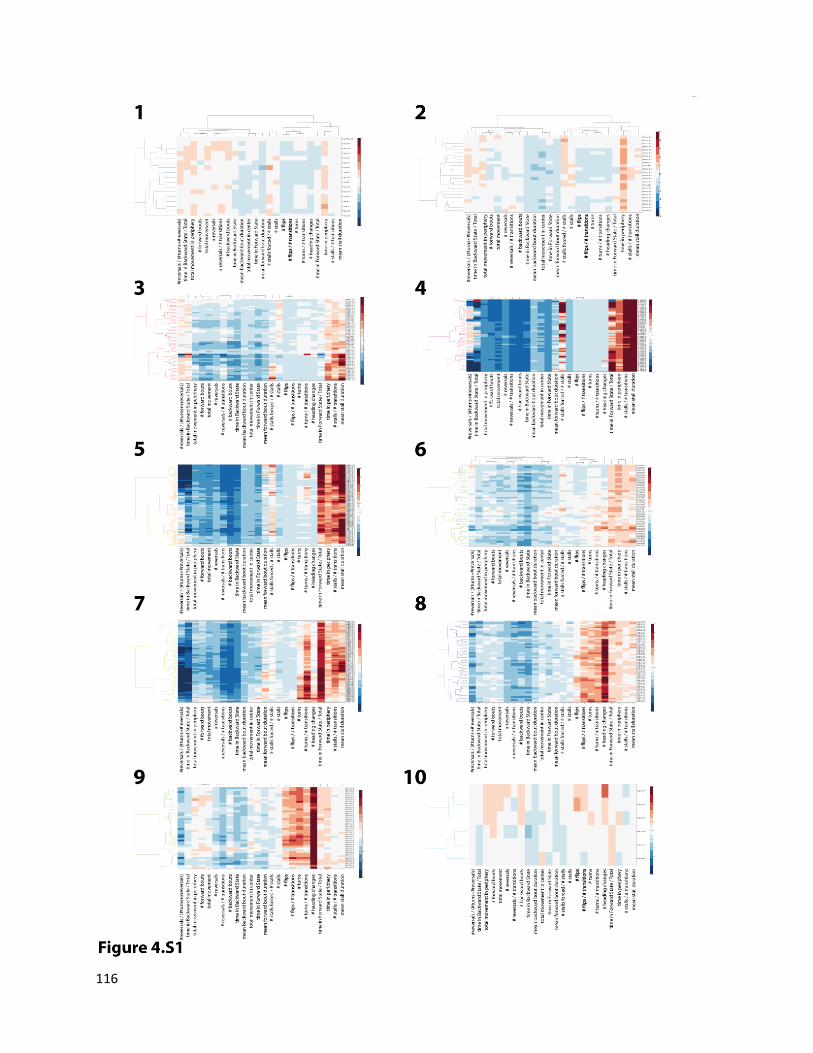
116

117
Figure 4.S2: Expression Patterns of sample GAL4 lines from prominent sub-clusters from figure 3.12.
Maximum projection confocal stacks, green: anti-GFP, magenta-nc82.
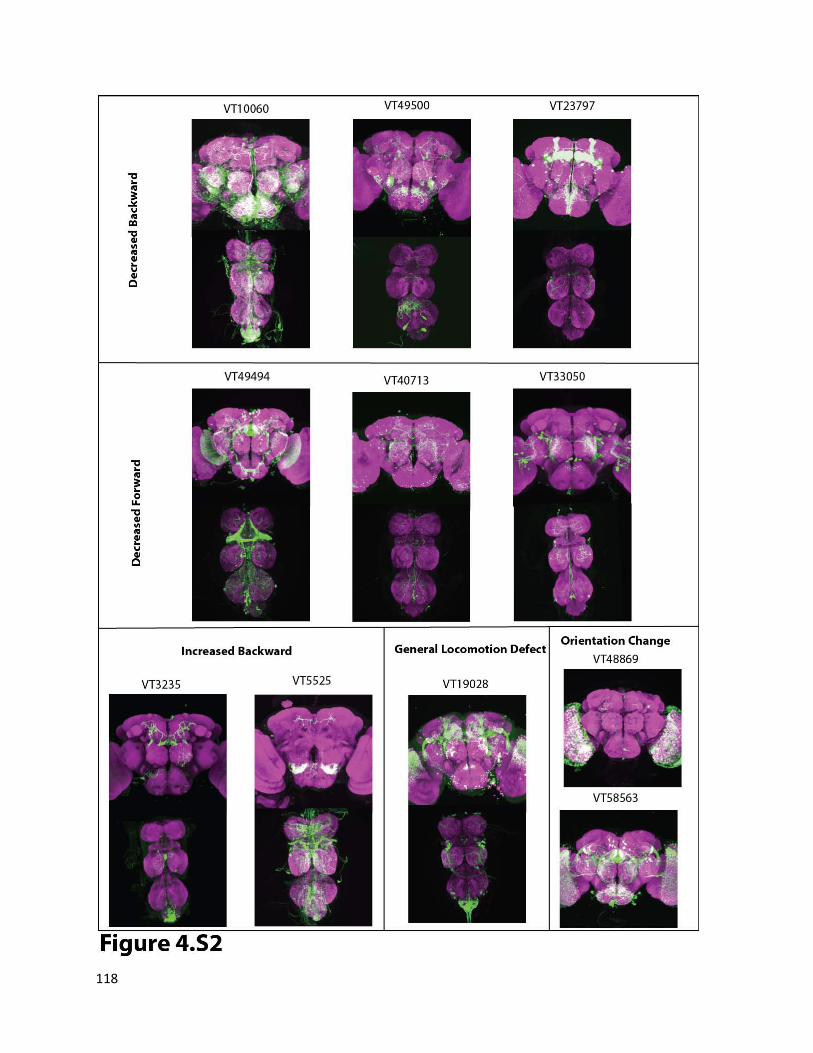
118

119
Appendices
Appendix A: Design of the enhancer library
This is work done by Alex Stark (design and computation) and Barry Dickson (design). In the following, a
summary of the design process is outlined.
Tiling
Promoter tiles were designed as the 2.5 kb region upstream of known protein coding genes including
the genes endogenous core-promoter, incorporating 50bp of the transcribed region. These tiles were
shortened if they ended in a repeat region and extended to up to 3 kb if the regions were between two
diverging genes. Enhancer tiles were created from the remaining genome sequence apart from non-
coding RNA, 3UTRs, coding, and repeat regions. The tiles are roughly 2 kb in length with roughly 400 bp
overlap between adjacent tiles. In order not to overly fragment the genome, extremely short regions
were re-included. Also, to avoid cutting off functional enhancers, highly conserved tile ends were
extended into regions of low sequence conservation. Primers were designed using primer3 within 300bp
windows flanking both sides of the tiles. For promoter tiles, one of the primers was specified to be
within the genes 5UTR.
Choosing the tiles Tiles were chosen based on their proximity to manually selected genes or enhancer-trap insertions. In
addition, ad hoc scores were determined for each tile based on the neighboring genes expression, the
tiles conservation as measured by phastcons scores and the presence and conservation of fruitless
transcription factor motifs. The actual ranking manifests itself in the following lists with various
preferences:
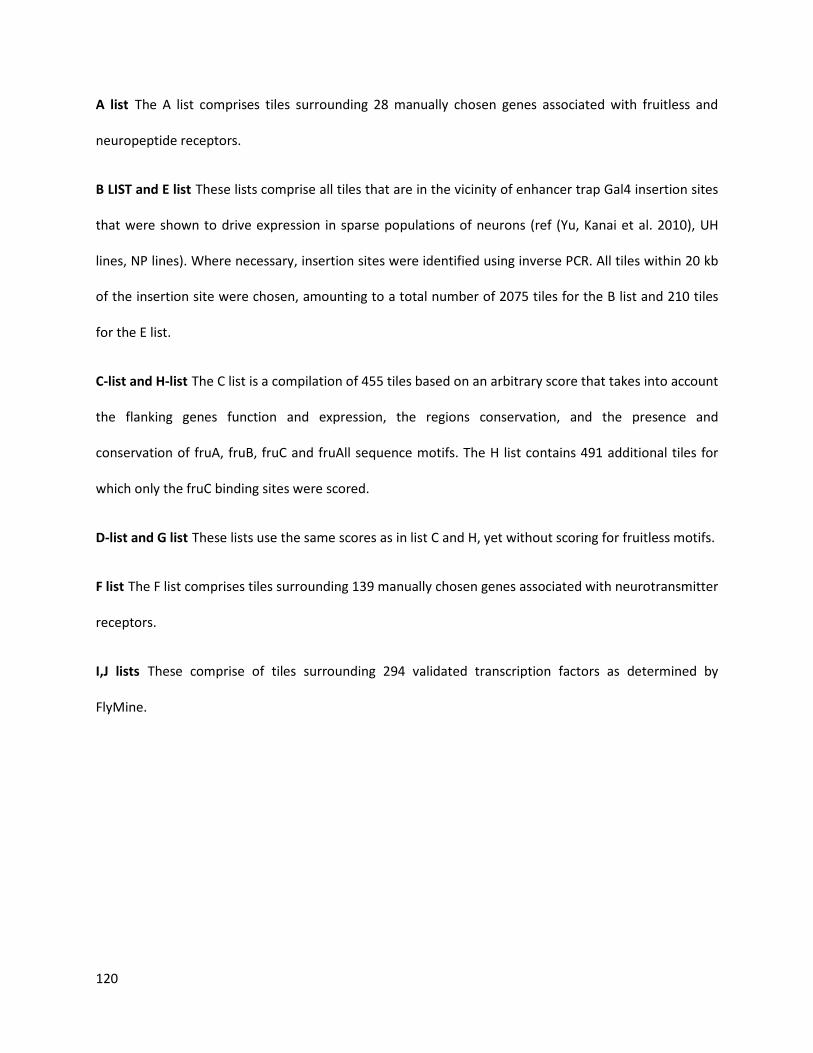
120
A list The A list comprises tiles surrounding 28 manually chosen genes associated with fruitless and
neuropeptide receptors.
B LIST and E list These lists comprise all tiles that are in the vicinity of enhancer trap Gal4 insertion sites
that were shown to drive expression in sparse populations of neurons (ref (Yu, Kanai et al. 2010), UH
lines, NP lines). Where necessary, insertion sites were identified using inverse PCR. All tiles within 20 kb
of the insertion site were chosen, amounting to a total number of 2075 tiles for the B list and 210 tiles
for the E list.
C-list and H-list The C list is a compilation of 455 tiles based on an arbitrary score that takes into account
the flanking genes function and expression, the regions conservation, and the presence and
conservation of fruA, fruB, fruC and fruAll sequence motifs. The H list contains 491 additional tiles for
which only the fruC binding sites were scored.
D-list and G list These lists use the same scores as in list C and H, yet without scoring for fruitless motifs.
F list The F list comprises tiles surrounding 139 manually chosen genes associated with neurotransmitter
receptors.
I,J lists These comprise of tiles surrounding 294 validated transcription factors as determined by
FlyMine.
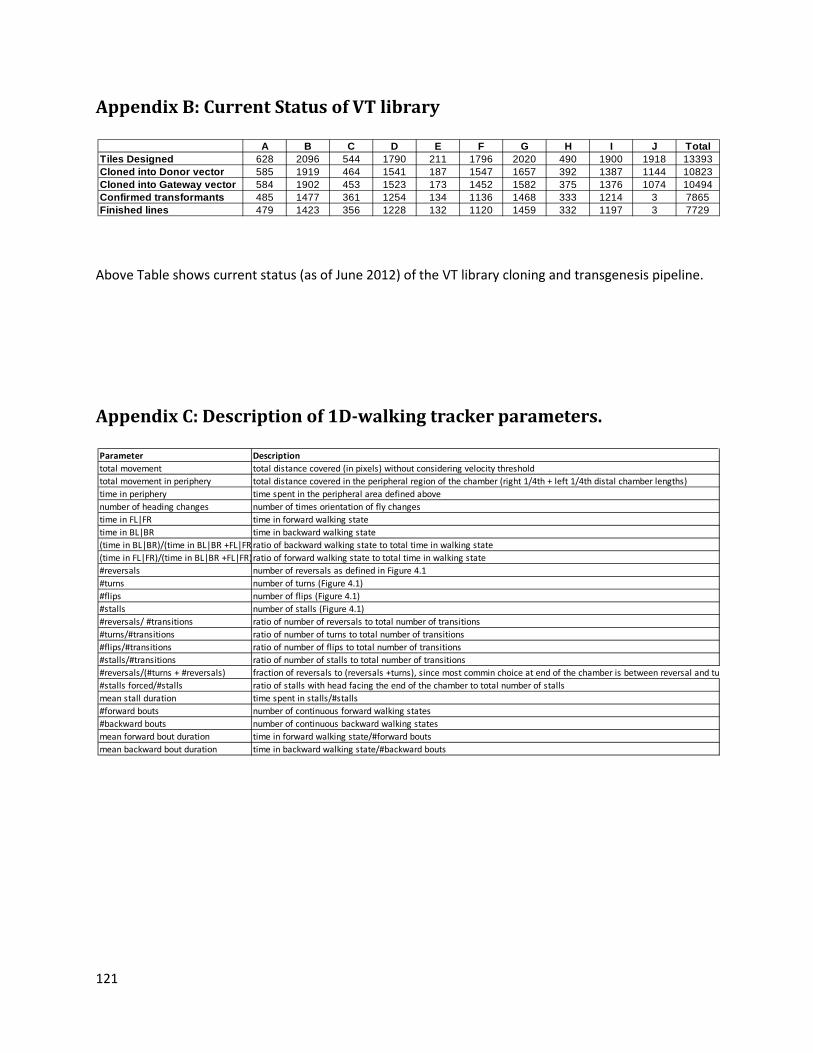
121
Appendix B: Current Status of VT library
Above Table shows current status (as of June 2012) of the VT library cloning and transgenesis pipeline.
Appendix C: Description of 1D-walking tracker parameters.
A B C D E F G H I J TotalTiles Designed 628 2096 544 1790 211 1796 2020 490 1900 1918 13393Cloned into Donor vector 585 1919 464 1541 187 1547 1657 392 1387 1144 10823Cloned into Gateway vector 584 1902 453 1523 173 1452 1582 375 1376 1074 10494Confirmed transformants 485 1477 361 1254 134 1136 1468 333 1214 3 7865Finished lines 479 1423 356 1228 132 1120 1459 332 1197 3 7729
Parameter Descriptiontotal movement total distance covered (in pixels) without considering velocity thresholdtotal movement in periphery total distance covered in the peripheral region of the chamber (right 1/4th + left 1/4th distal chamber lengths)time in periphery time spent in the peripheral area defined abovenumber of heading changes number of times orientation of fly changestime in FL|FR time in forward walking statetime in BL|BR time in backward walking state(time in BL|BR)/(time in BL|BR +FL|FR ratio of backward walking state to total time in walking state(time in FL|FR)/(time in BL|BR +FL|FR)ratio of forward walking state to total time in walking state#reversals number of reversals as defined in Figure 4.1#turns number of turns (Figure 4.1)#flips number of flips (Figure 4.1)#stalls number of stalls (Figure 4.1)#reversals/ #transitions ratio of number of reversals to total number of transitions#turns/#transitions ratio of number of turns to total number of transitions#flips/#transitions ratio of number of flips to total number of transitions#stalls/#transitions ratio of number of stalls to total number of transitions#reversals/(#turns + #reversals) fraction of reversals to (reversals +turns), since most commin choice at end of the chamber is between reversal and tu#stalls forced/#stalls ratio of stalls with head facing the end of the chamber to total number of stallsmean stall duration time spent in stalls/#stalls#forward bouts number of continuous forward walking states#backward bouts number of continuous backward walking statesmean forward bout duration time in forward walking state/#forward boutsmean backward bout duration time in backward walking state/#backward bouts

122
Curriculum vitae
Salil Bidaye Email: [email protected]
-------------------------------------------------------------------- Date of Birth: 30/11/1984 Place of Birth: Pune, India Nationality: Indian Current Address: Landstrasser Hauptstrasse, 34/23, Vienna 1030 Phone:+43 1 79730 - 3025
Education
• 2008-2012 Dr. rer. Nat. The University of Vienna, Vienna, Austria.
• 2003-2008 Integrated Masters in Biotechnology Institute of Bioinformatics and Biotechnology, University of Pune, Pune, India. [Cumulative GPA = 7.9 corresponds to the highest possible GPA Grade of “O” (Outstanding, given for GPA > 7.5 on a scale of 0-10)]
Research Experience:
• 2008-2012 Neuronal basis for directed walking in Drosophila melanogaster Dr. Barry J. Dickson Research Institute of Molecular Pathology Vienna, Austria
• 2007-2008 Hydra Developmental Biology and RTK evolution: Final year Masters Project: under the guidance of Dr. S. M. Ghaskadbi, Scientist in charge, Zoology Group, Agharkar Research Institute (ARI), Pune.
• May-July, 2007: Sequencing and Analysis of Drosophila kinesin-2 mutants:
Dr. Krishanu Ray Tata Institute of Fundamental Research, Mumbai, India

123
• 2005-06: Simulation studies of the process of mammalian cell Electroporation.
Prof. P.B. Vidyasagar, Department of Physics, University of Pune. Pune, India.
• 2004-05: Effects of gravitational force on Human Blood Circulation Prof. P.B. Vidyasagar, Department of Physics, University of Pune, Pune, India.
Conferences: • 2011
Oral Presentation: Cold Spring Harbor Laboratory “Neurobiology of Drosophila” meeting, CSHL, New York, USA. Title: Neuronal basis of directed walking in Drosophila melanogaster: Backward Walking
• 2011 Poster: EMBO conference, Vienna. Title: “Activation and silencing screens reveal neurons that direct Drosophila melanogaster walking behavior
• 2010 ESF-EMBO Conference on Functional Neurobiology in Minibrains From Flies to Robots and Back Again.
Publications: • Von Philipsborn AC, Liu T, Yu JY, Masser C, Bidaye SS, Dickson BJ: ”Neuronal control of
Drosophila courtship song.” Neuron. 2011 Feb 10;69(3):509-22.
• Reddy PC, Bidaye SS, Ghaskadbi S: “Genome-wide screening reveals the emergence and divergence of RTK homologues in basal Metazoan Hydra magnipapillata.” J Biosci. 2011 Jun;36(2):289-96.
• Shil P, Bidaye S and Vidyasagar PB: “Analysing the effects of surface distribution of pores in cell electroporation for a cell membrane containing cholesterol” 2008 J. Phys. D: Appl. Phys. 41 055502 (7pp)
• Vidyasagar PB, Santosh B, Bidaye S,: “Gravitational Effects on Blood Circulation.” Physics Education, 21 (1), 2004, 43-49.

124