Embed Size (px)
Citation preview

lable at ScienceDirect
Neurobiology of Aging 74 (2019) 225e233
Contents lists avai
Neurobiology of Aging
journal homepage: www.elsevier .com/locate/neuaging
Hippocampal transcriptome profiling combined withprotein-protein interaction analysis elucidatesAlzheimer’s disease pathways and genes
Jeroen G.J. van Rooij a,b,*, Lieke H.H. Meeter a, Shami Melhem a, Diana A.T. Nijholt a,Tsz Hang Wong a, Netherlands Brain Bankc, Annemieke Rozemuller d,Andre G. Uitterlinden b, Joyce G. van Meurs b,1, John C. van Swieten a,1
aDepartment of Neurology, Erasmus Medical Center, Rotterdam, the NetherlandsbDepartment of Internal Medicine, Erasmus Medical Center, Rotterdam, the NetherlandscNetherlands Institute for Neuroscience, Amsterdam, the NetherlandsdDepartment of Pathology, VU University Medical Center, Amsterdam, the Netherlands
a r t i c l e i n f o
Article history:Received 18 December 2017Received in revised form 12 October 2018Accepted 24 October 2018Available online 29 October 2018
Keywords:Alzheimer’s diseaseRNA sequencingProtein-protein interactionsHippocampus
* Corresponding author at: Department of NeuroloRoom Ee-2238, Wytemaweg 80, 3015 CN, Rotterdþ31107043822; fax: þ31107044721.
E-mail address: [email protected] (J.G.J. van1 These authors contributed equally.
0197-4580/� 2018 The Authors. Published by Elsevierhttps://doi.org/10.1016/j.neurobiolaging.2018.10.023
a b s t r a c t
Knowledge about the molecular mechanisms driving Alzheimer’s disease (AD) is still limited. To learnmore about AD biology, we performed whole transcriptome sequencing on the hippocampus of 20 ADcases and 10 age- and sex-matched cognitively healthy controls. We observed 2716 differentiallyexpressed genes, of which 48% replicated in a second data set of 84 AD cases and 33 controls. We used anintegrative network-based approach for combining transcriptomic and protein-protein interaction datato find differentially expressed gene modules that may reflect key processes in AD biology. A total of 735differentially expressed genes were clustered into 33 modules, of which 82% replicated in a second dataset, highlighting the robustness of this approach. These 27 modules were enriched for signal trans-duction, transport, response to stimulus, and several organic and cellular metabolic pathways. Tenmodules interacted with previously described AD genes. Our study indicates that analyzing RNA-expression data based on annotated gene modules is more robust than on individual genes. We pro-vide a comprehensive overview of the biological processes involved in AD, and the detected differentiallyexpressed gene modules may provide a molecular basis for future research into mechanisms underlyingAD.� 2018 The Authors. Published by Elsevier Inc. This is an open access article under the CC BY-NC-ND
license (http://creativecommons.org/licenses/by-nc-nd/4.0/).
1. Introduction
Alzheimer’s disease (AD) is a neurodegenerative disorder hall-marked by progressive loss of memory, currently affecting over 40million individuals worldwide (Prince et al., 2013; Scheltens et al.,2016). Previous studies have shown neurodegenerative changes inthe hippocampus 15e20 years before symptom onset (Boyle et al.,2013; Karran et al., 2011; Murray et al., 2011). Themain pathologicalfeatures are amyloid plaques and tau tangles throughout the brain(Braak and Braak, 1995; Holtzman et al., 2016; Jellinger, 2008;Selkoe and Hardy, 2016; Thal et al., 2014; Tomiyama, 2010). Mul-tiple AD-associated genetic loci have been identified, although their
gy, Erasmus Medical Center,am, the Netherlands. Tel.:
Rooij).
Inc. This is an open access article u
pathophysiological mechanisms remain largely unknown (Bekriset al., 2010; Lambert et al., 2013; Van Cauwenberghe et al., 2016).
Transcriptomic studies on postmortem AD brain tissue havebeen performed to further our understanding of AD biology(Kavanagh et al., 2013; Sutherland et al., 2011). Most of thesestudies report differentially expressed genes and pathways in braintissue of AD cases compared with controls (Ashburner et al., 2000;Gene Ontology, 2015; Ogata et al., 1999). Most of these studiesreport a decrease in synaptic transmission, mitochondrial function,and cytoskeleton biology. By contrast, an increase is often reportedin immune response, inflammation, and apoptosis in AD cases(Liang et al., 2008; Ray and Zhang, 2010; Sekar et al., 2015; Twineet al., 2011). Recently, network-based analysis are used to providemore extensive and robust insights in these data, for example,based on protein-protein interaction (PPI) data (Chi et al., 2016; C.Humphries et al., 2015; C.E. Humphries et al., 2015; Kong et al.,2014, 2015). The largest among these studies investigated gene
nder the CC BY-NC-ND license (http://creativecommons.org/licenses/by-nc-nd/4.0/).

J.G.J. van Rooij et al. / Neurobiology of Aging 74 (2019) 225e233226
expression (measured with RNA arrays) in more than a thousandbrain samples, spread across 19 regions in 125 individuals (Wanget al., 2016). By performing gene coexpression analysis on ADcases of varying severity and nondemented controls, they identifieddysregulated gene modules and pathways. The study concludedthat some of those originated from early disease stages and mightreflect causal mechanisms, but also highlighted to use of genemodules rather than individual genes. In this study, these modulesare based on only coexpression type PPI data.
The goal of our study was to compare whole transcriptomesequencing of 20 AD cases with 10 age- and sex-matched cogni-tively healthy controls. We aim to identify differentially expressedgenes and cluster these into functional gene modules using PPIdata. We aim to replicate these differentially expressed genes, genemodules, and functions in a second independent RNA sequencingdata set (van der Brug et al., 2017) to determine the robustness ofreplication based on gene modules compared with individualgenes.
2. Materials and methods
2.1. Data generation
Hippocampus samples were selected from the NetherlandsBrain Bank for 20 AD cases (Braak and Braak, 1995; Mirra et al.,1991) and matched for age and gender with brains from 10 non-demented cognitively healthy controls (Table 1). The dentate gyrusand cornu amonis were macrodissected from the hippocampustissue, and total RNAwas isolated using themanufacturer’s protocol(Qiagen AllPrep RNA isolation, Cat No. 80224). Sequencing wasperformed after poly-A selection and TruSeq library prep at theHuman Genomics facility (www.glimdna.org) on a HiSeq2000 at2 � 50 bp. Data were processed per sample using trim-o-matic(v0.33), STAR (v2.3.0) (Bolger et al., 2014; Dobin et al., 2013), pic-ard (v1.90), and fastQC (v0.11.3). Transcript quantification wasperformed using featureCounts (v1.4.3) against all 57,820 genefeatures in GENCODE (version date; 2013-12-05) (Harrow et al.,2012; Liao et al., 2014). For replication, data set GSE95587 wasdownloaded from the Gene Expression Omnibus. This data setcontained raw RNA-seq counts of the fusiform gyrus for 84 AD casesand 33 controls and was processed in parallel to the discovery dataset in all subsequent steps (van der Brug et al., 2017).
2.2. Data analysis
Counts were normalized using the edgeR (v3.8.6) trimmedmean of M-values method to counts per million values, and all low-abundant features were omitted (<1 counts per million in 75% ofsamples). Principal components (PCs) were calculated using“prcomp” in R, and then plotted to visually identify sample outliers.
Table 1Study sample characteristics
Characteristic Controls Cases Cases_QC
Number 10 20 18Gender (% male) 50% 30% 44%Age (�SD) 76 � 12 75 � 7 75 � 7Braak 1.5 � 1.3 5.5 � 0.5* 5.6 � 0.5*Amyloid 0.9 � 1.1 2.9 � 0.3* 2.9 � 0.3*pmd 551 � 297 348 � 108* 329 � 98*pH 6.6 � 0.3 6.3 � 0.3* 6.3 � 0.3*Brain weight 1319 � 240 1045 � 119* 1035 � 113*apoe (32/33/44) 4/6/0 1/9/10* 1/8/9*
An asterisk denotes statistically significant difference compared with controls.All values represent means with standard deviations unless otherwise indicated.“Cases_QC” indicates metrics after removing two outlier cases.
Statistical analysis was performed per gene using the exacTestfunction in edgeR, correcting for age, gender, and the first 2 PCs(McCarthy et al., 2012; Robinson et al., 2010). We combined FDR-corrected p-values and log fold changes to calculate a differential
expression score; �log10pðFDRÞ10 *
ffiffiffiffiffiffiffiffiffiffiffiffiffiffiffiffiffiffiffiffi
logFC*logFCp
3 . Genes with a differentiallyexpressed score�0.10 are considered differentially expressed genes(DE genes) and retained for further analysis. All steps were per-formed identically and separately for the discovery and replicationdata sets Table 2.
2.3. Protein-protein interaction clustering
For all DE genes, we extracted experimental, coexpression, anddatabase interactions scored �500 from STRING v10 (von Meringet al., 2003). This network was imported to Cytoscape (v3.4.0)and subjected to the Markov Clustering Algorithm (MCL) to identifygene modules (Morris et al., 2011; Smoot et al., 2011). In short, MCLclusters graphical data to determine groups of genes (modules)with more interactions within the module than to the rest of thenetwork (Enright et al., 2002). This clustering method revolvesaround one main parameter which determines the module sizes;the inflation factor. We optimized the inflation factor to retainmodules between 10e100 genes to allow for subsequent gene setenrichment analysis (Subramanian et al., 2005). Each gene can onlybe assigned to a single module. Modules smaller than 10 genes areexcluded. All steps are performed separately for the discovery andreplication data set.
2.4. Functional annotation of modules
For each identified gene module, enrichments for geneontology biological processes (GOBPs) were performed usingWebGestalt (v27-1-17) (Gene Ontology, 2001; Ogata et al., 1999).For GOBP enrichment the “noRedundant” terms were used. Allenrichments were FDR (Benjamini-Hochberg) corrected, using athreshold of p < 0.05 for statistical significance. Only the firstthree enriched GOBP terms were extracted for each gene module.All three GOBP terms for all gene modules were then pooled anddivided into shared common ancestor terms, denoted as GOBPbranches (Ashburner et al., 2000; Carbon et al., 2009). Therefore,each gene module can be annotated with three GOBP terms andtheir respective GOBP branch. Modules from discovery andreplication are divided in to the same GOBP branches. They canthus be enriched for the same GOBP term or enriched for differentGOBP terms that are closely related by sharing a commonancestor term.
2.5. Replication of DE genes and modules
DE genes and gene modules were generated separately for thediscovery and replication data sets using the exact same method-ology. Replication of discovery modules is assessed by the numberof overlapping genes and overlapping GOBP terms within thereplication modules. Different degrees of robustness of overlapbetween our data and the replication data set were classified.Category (1) a gene module overlaps in genes and in GOBP term(s)with a gene module from the replication data set. Category (2) agene module overlaps in GOBP term(s), but not in genes with areplication module. Category (3) a gene module overlaps in geneswith a replicationmodule, but not in GOBP term(s). When amodulefrom discovery shares a parent GOBP term with a replicationmodule this was also considered replication.
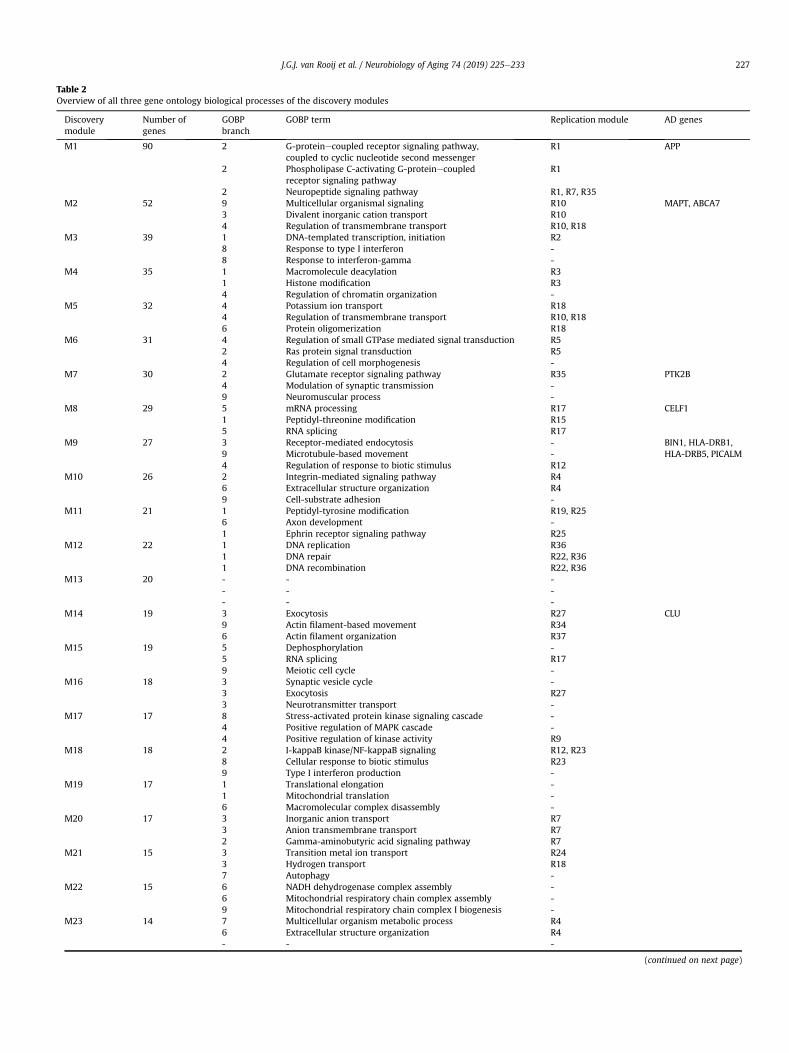
Table 2Overview of all three gene ontology biological processes of the discovery modules
Discoverymodule
Number ofgenes
GOBPbranch
GOBP term Replication module AD genes
M1 90 2 G-proteinecoupled receptor signaling pathway,coupled to cyclic nucleotide second messenger
R1 APP
2 Phospholipase C-activating G-proteinecoupledreceptor signaling pathway
R1
2 Neuropeptide signaling pathway R1, R7, R35M2 52 9 Multicellular organismal signaling R10 MAPT, ABCA7
3 Divalent inorganic cation transport R104 Regulation of transmembrane transport R10, R18
M3 39 1 DNA-templated transcription, initiation R28 Response to type I interferon -8 Response to interferon-gamma -
M4 35 1 Macromolecule deacylation R31 Histone modification R34 Regulation of chromatin organization -
M5 32 4 Potassium ion transport R184 Regulation of transmembrane transport R10, R186 Protein oligomerization R18
M6 31 4 Regulation of small GTPase mediated signal transduction R52 Ras protein signal transduction R54 Regulation of cell morphogenesis -
M7 30 2 Glutamate receptor signaling pathway R35 PTK2B4 Modulation of synaptic transmission -9 Neuromuscular process -
M8 29 5 mRNA processing R17 CELF11 Peptidyl-threonine modification R155 RNA splicing R17
M9 27 3 Receptor-mediated endocytosis - BIN1, HLA-DRB1,HLA-DRB5, PICALM9 Microtubule-based movement -
4 Regulation of response to biotic stimulus R12M10 26 2 Integrin-mediated signaling pathway R4
6 Extracellular structure organization R49 Cell-substrate adhesion -
M11 21 1 Peptidyl-tyrosine modification R19, R256 Axon development -1 Ephrin receptor signaling pathway R25
M12 22 1 DNA replication R361 DNA repair R22, R361 DNA recombination R22, R36
M13 20 - - -- - -- - -
M14 19 3 Exocytosis R27 CLU9 Actin filament-based movement R346 Actin filament organization R37
M15 19 5 Dephosphorylation -5 RNA splicing R179 Meiotic cell cycle -
M16 18 3 Synaptic vesicle cycle -3 Exocytosis R273 Neurotransmitter transport -
M17 17 8 Stress-activated protein kinase signaling cascade -4 Positive regulation of MAPK cascade -4 Positive regulation of kinase activity R9
M18 18 2 I-kappaB kinase/NF-kappaB signaling R12, R238 Cellular response to biotic stimulus R239 Type I interferon production -
M19 17 1 Translational elongation -1 Mitochondrial translation -6 Macromolecular complex disassembly -
M20 17 3 Inorganic anion transport R73 Anion transmembrane transport R72 Gamma-aminobutyric acid signaling pathway R7
M21 15 3 Transition metal ion transport R243 Hydrogen transport R187 Autophagy -
M22 15 6 NADH dehydrogenase complex assembly -6 Mitochondrial respiratory chain complex assembly -9 Mitochondrial respiratory chain complex I biogenesis -
M23 14 7 Multicellular organism metabolic process R46 Extracellular structure organization R4- - -
(continued on next page)
J.G.J. van Rooij et al. / Neurobiology of Aging 74 (2019) 225e233 227

Table 2 (continued )
Discoverymodule
Number ofgenes
GOBPbranch
GOBP term Replication module AD genes
M24 13 7 Glycerolipid metabolic process -7 Lipid modification -5 Phospholipid metabolic process -
M25 13 1 Peptidyl-serine modification R15, R19, R25- - -- - -
M26 12 1 Protein ubiquitination involved inubiquitin-dependent protein catabolic process
-
1 Protein polyubiquitination -7 Amine metabolic process R20
M27 12 9 Neuron projection guidance R34- - -- - -
M28 11 5 Organophosphate catabolic process -1 Carbohydrate derivative catabolic process R135 Aromatic compound catabolic process -
M29 11 - - -- - -- - -
M30 10 5 Pyruvate metabolic process R327 Small molecule catabolic process -7 Carbohydrate catabolic process -
M31 10 - - -- - -- - -
M32 10 3 Mitochondrial transport R85 Nucleoside monophosphate metabolic process R133 Hydrogen transport R18
M33 10 6 Chromatin remodeling R39 Protein acylation R3- - -
Per module, the number of genes is shown. For each term, the name and respective GOBP branch is shown. The column “replication module” indicates which replicationmodule also had this GOBP term. The last column indicates interaction of discovery module with known AD genes.Key: GOBP, gene ontology biological process; AD, Alzheimer’s disease.
Fig. 1. Flowchart of data analysis. Discovery and replication data set are analyzed anddifferentially expressed genes are determined. An interaction network is constructedfor each data set, which is then clustered in gene modules. These modules arecompared directly on overlapping genes and on enriched gene ontology biologicalprocesses. Interactions of modules identified in discovery with known AD genes arealso investigated. Abbreviations: AD, Alzheimer’s disease.
J.G.J. van Rooij et al. / Neurobiology of Aging 74 (2019) 225e233228
2.6. Mapping known AD genes
We selected a list of 27 known AD risk genes, compiled fromknown AD GWAS loci and Mendelian causal genes (Lambert et al.,2013; Van Cauwenberghe et al., 2016). All experimental and data-base interactions between these 27 AD genes and the genes indiscovery modules were extracted from STRING, using a cutoff of�500. An AD gene was considered to interact with a discoverymodule when it interacted with at least two of the genes in thatmodule.
3. Results
3.1. Study sample characteristics
The demographic data of the AD group did not differ from thecontrol group, as shown in Table 1. As expected, mean brainweight,Braak and CERAD stages and postmortem delay differed signifi-cantly between AD cases and controls. On average, 48,772,000reads were sequenced per sample. All sequencing quality andalignment QC metrics were similar between groups. Two outlierswere identified by PCs, driven by high expression of TTR. This geneis specifically expressed in the choroid plexus, which wasconfirmed using routine staining and both cases were excluded. Thereplication data set GSE95587 consisted of fusiform gyrus from 84AD cases and 33 controls and is described elsewhere (van der Bruget al., 2017).
3.2. Differentially expressed genes and modules
A total of 2716 genes was differentially expressed in the dis-covery data set (DE score �0.1), as shown in Fig. 1. Examination of

J.G.J. van Rooij et al. / Neurobiology of Aging 74 (2019) 225e233 229
known interactions between these DE genes showed that 1610 DEgenes shared one or more interaction(s). Using this interactionnetwork, we clustered 735 discovery DE genes into 33 discoverygene modules. The expression table and gene-module assign-ments can be found in supplemental Table 1. In the replicationdata set, 2490 DE genes were identified. A total of 1311 DE genesfrom the discovery data set (48%) replicated in the replicationdata set, as shown in Fig. 2. From the interaction network ofreplication DE genes, 653 DE genes were clustered into 37 repli-cation modules.
Fig. 2. Volcano plot of 14,564 analyzed protein-coding genes. Each dot is a gene, those dardisplayed by dotted lines. The solid line displays the default FDR-corrected �0.05 threshold.and replication cohorts. Abbreviations: DE, differentially expressed.
3.3. Functional annotation and replication of modules
Gene set enrichment analysis of each module resulted in threesignificantly enriched gene ontology biological processes permodule in discovery and replication. These enriched GOBP termswere pooled across all discovery and replication modules andassigned to eight main GOBP branches: “Organic substancemetabolic process”, “Signal Transduction”, “Transport”, “Regula-tion of biological process”, “Cellular metabolic process”, “Cellularcomponent organization”, “Other metabolic processes,” and
k-gray pass the 0.1 DE score threshold. Upper score limits (set to maximum of 1) areThe Venn diagram displays the number of overlapping DE genes between the discovery

J.G.J. van Rooij et al. / Neurobiology of Aging 74 (2019) 225e233230
“Response to stimulus”. The remaining terms are grouped under a9th branch: “Other biological processes”. Table 2 shows the threeGOBP terms for all discovery modules, their respective branchesand category of overlap with the replication modules. Furtherdetails about these branches and overlap can be found insupplementary Fig. 2.
Combined across all 33 differentially expressed gene modules inthe discovery data set, we identified 84 GOBP terms (at maximumthree per gene module, see Table 2). For 19 of the 33 discoverymodules, the discovery module overlaps both in genes and GOBPterm with a replication module (overlap category 1), as shown inFig. 3. Another eight gene modules overlap a GOBP term with areplication module, but do not overlap in genes (overlap category2). Five modules overlapped in genes but did not overlap in GOBPterm with the same replication module (overlap category 3). Asingle module did not overlap in either genes or GOBP term withthe replication modules. This result brings the replication results of
Fig. 3. Overlap between discovery and replication modules. Each module of discovery is shoindicate the overlapping number of genes between two modules. Intersections marked in bindicates the category of overlap for each discovery module (1: overlap in genes and GOBPterm). Abbreviations: GOBP, gene ontology biological process.
gene modules with the replication data set at 73% when based onoverlapping genes (category 1 and 3) compared with 82% based onoverlapping GOBP term(s) (category 1 and 2).
3.4. Interaction with AD genes
Of 27 known AD risk genes, 25 were expressed in the braintissue that was studied. Three genes (11%) showed a DE score of�0.1: CD2AP (score 0.18), MEF2C (�0.29), and PTK2B (�0.50); noneof these were assigned to a module. Only MEF2C and PTK2B arereplicated with a DE score of �0.39 and �0.13, respectively. Ten ADgenes interacted at least twicewith a discoverymodule: ABCA7, APP,BIN1, CELF1, CLU, HLA-DRB1, HLA-DRB5,MAPT, PICALM, and PTK2B, asshown in Table 2. Six AD genes interacted only once with a dis-covery module: APOE, CD2AP, INPP5D, MEF2C, PSEN1, and PSEN2.Nine AD genes did not interact with any discovery module: CASS4,CD33, CR1, FERMT2, MS4A6A, RIN3, SLC24A4, SORL1, and ZCWPW1.
wn horizontally, and the replication modules are shown vertically. The numbers shownlack indicate modules that share a gene ontology biological process. The last columnterm, 2: overlap in GOBP term, but not in genes, 3: overlap in genes, but not in GOBP

J.G.J. van Rooij et al. / Neurobiology of Aging 74 (2019) 225e233 231
4. Discussion
Our study identified 2716 differentially expressed genes (DEgenes) in hippocampus of 18 AD cases compared with 10 age- andsex-matched nondemented controls. Of these 2716 DE genes, 735were clustered in 33 genemodules based on PPI data. These 33 genemodules were assigned 84 gene ontology biological processes(GOBP terms, at maximum three for each gene module) whichtogether comprise nine main GOBP branches. All nine brancheswere frequently observed in previous AD studies.
4.1. Replication by gene modules and GOBP terms is more robustand identifies the most central AD changes
Replication of our results in an independent data set (GSE95587,fusiform gyrus of 84 AD cases and 33 controls, [van der Brug et al.,2017]) was based on different categories of overlap, reflecting therobustness of these overlapping processes in the underlying path-ophysiology of AD. The finding that most of our gene modules fallsinto category 1 (n ¼ 19) indicates that the combined approach ofGOBP annotated and PPI clustered genemodules identifies themostrobust changes in AD gene expression. The gene modules in cate-gory 2 (n ¼ 8) and category 3 (n ¼ 5) might reflect some variabilityof gene expression between hippocampus in our study and fusiformgyrus of AD brains in the replication study.
The present comparative study supports the idea that theoverlapping data sets based on gene modules or GOBP term permodule is more robust than based on overlapping genes only, as theoverlap of all DE genes (48%) can be improved by categorization intogene modules (72%), and even more by overlap based on GOBPterms (82%).
4.2. GOBP branches represent common AD pathways
The nine main GOBP branches are previously observed in liter-ature of AD expression studies (Chi et al., 2016; C.E. Humphrieset al., 2015; Liang et al., 2008; Ray and Zhang, 2010; Sekar et al.,2015; Twine et al., 2011; Wang et al., 2016). These GOBP branchescan be found in detail, containing all module annotations insupplemental Table 2.
GOBP branch 1, named “organic substance metabolic process”,consists of metabolic processes such as DNA replication and repairand RNA translation and post-translational modifications. Thesemetabolic processes underlie many other biological processes andare dysregulated in AD cases as a response to the various disease-related changes in the AD hippocampus (C.E. Humphries et al.,2015; Liang et al., 2008; Sekar et al., 2015; Twine et al., 2011;Wang et al., 2016). The second GOBP branch, called “signal trans-duction”, consists of six gene modules that represent the samedistinct neurotransmitter signaling pathways in both the discoveryand replication data sets (all six gene module are in overlap cate-gory 1). These results indicate a broad dysfunction of synaptictransmission in the AD brain. These are likely the result of neuronaldegeneration in AD hippocampus and are often found dysregulatedin AD literature (Chi et al., 2016; C.E. Humphries et al., 2015; Lianget al., 2008; Ray and Zhang, 2010; Sekar et al., 2015; Wang et al.,2016). GOBP branch 3, enriched for “transport”, mostly representsion transport GOBP terms, as shown in supplemental Fig. 2. Manymodules in this GOBP branch are involved in energy production,which is often described as dysfunctional in previous AD studies(C.E. Humphries et al., 2015; Wang et al., 2016). These results arelikely caused by neuronal degradation, and thus reduced energyconsumption, although activation of glial cells might also influencethis process (Sekar et al., 2015). GOBP branch 4 “regulation of bio-logical processes” is largely complementary to the other GOBP
branches. It contains modules annotated to both an executive bio-logical process, for example, “transmembrane transport” and itsregulative process, “regulation of transmembrane transport”. Six ofits seven gene modules fall into overlap category 1, indicating arobust dysfunction in this GOBP branch.
These first four GOBP branches are the largest and thereforeunderlie changes in AD pathophysiology that stand out the most inour study. Of the 33 identified gene modules in our study, 23 areinvolved in these four GOBP branches. With 17 gene modules inoverlap category 1, this indicates that these four GOBP branches areamong the most robust changes in AD pathophysiology. Given thefunctions of these central GOBP branches, we conclude that organicsubstance metabolic processes, neurotransmitter signaling, energytransport, and regulation of biological processes are maindysfunctional pathways in AD pathophysiology.
Of the remaining GOBP branch 5 (including RNA splicing anddephosphorylation), branch 6 (incl axon development), and branch7 (other metabolic processes), gene modules overlap mostly on incategory 2 and category 3 with the replication data set. These threeGOBP branches do not contain any unique gene modules and arelikely not as robustly involved in AD as the other GOBP branches.GOBP branch 8, “response to stimulus,” is the smallest GOBPbranch, indicating a response to neurodegeneration resulting ininflammation and glial cell activation which has often beenobserved in previous studies (C.E. Humphries et al., 2015; Sekaret al., 2015; Wang et al., 2016). All three gene modules in GOBPbranch 8 overlapped in category 1 with the replication data set,suggesting that this small GOBP branch represents a robust changeto AD pathophysiology. The biological processes of GOBP branch 9,including “neuromuscular process”, “actin-filament based move-ment,” and “neuron projection guidance might also be robustchanges in AD, but are represented by only a small number of genemodules in our data, possibly because of the late stage of the dis-ease in our samples.
4.3. Interactions with AD genes
Of 27 AD genetic risk factor genes, only three were differentiallyexpressed in our data set, and two replicated (MEF2C and PTK2B).Several discovery modules interacted with these AD genes, sug-gesting a degree of overlap in biological function. HLA-DRB1, HLA-DRB5, BIN1, and PICALM interact with M9 and might be involved inendocytosis and/or microtubule-basedmovement (Baig et al., 2010;Zhou et al., 2014). ABCA7 and MAPT interact with a gene moduleinvolved in ion transport and signaling (M2). APP interacts with M1and is involved in signal transduction (Cheng et al., 2014; Cirritoet al., 2008). PTK2B is differentially expressed in both discoveryand replication and interacts with modules involved in receptorsignaling and protein modification (M7, M10, and M25) (Beechamet al., 2014; Han et al., 2017). CELF1 interacts with genes involvedin RNA processing and protein modification (M8) and CLU interactsgenes involved in exocytosis and actin-based filament organization(M14). These interactions suggest roles of these genes also in laterstages of AD and do not represent the typical associations of thesegenes in a causal inference (Lambert et al., 2013; Van Cauwenbergheet al., 2016).
4.4. Limitations of this study
This study holds several limitations. First, PPI networkscomprise existing databases, which generate bias to well-knowngenes and biological processes (Gillis et al., 2014; Schaefer et al.,2015; von Mering et al., 2003). Indeed, of the 2716 DE genesidentified in discovery, only 1610 held an interaction in the STRING

J.G.J. van Rooij et al. / Neurobiology of Aging 74 (2019) 225e233232
database, and some relevant genes might have been excluded as aresult.
An important issue in using PPI data for your network analysis isthat there are no clear guidelines on what to use for the interactionscore cutoff, Markov clustering inflation factor threshold, or on theproper functional annotation of modules. Nevertheless, someconsensus is emerging and these most commonly used parameterswere also applied in this study. These parameters are (1) priori-tizing or limiting to experimental interactions types, or not usingtext-mining based types because this minimizes bias of the results(Szklarczyk et al., 2017; von Mering et al., 2003); (2) optimizing theMCL inflation factor to generate modules of 10e100 genes(Subramanian et al., 2005; van Dongen and Abreu-Goodger, 2012);3. replication, preferably on a functional annotation level as geneontology (Ashburner et al., 2000; Gene Ontology, 2015).
To optimize clustering of the gene modules, additional metricsof the generated PPI network could be included, for example, thedirection of effect, or weighting PPI interactions. This study wasdesigned as a cross-sectional case-control analysis, and many of theobserved differences might be caused by neurodegeneration. Oursample size of 18 cases and 10 controls is not optimal to robustlydetect all deviations in AD, and some genes/GOBP termsmight havebeen missed.
4.5. Conclusions
Our method provides a comprehensive and complete overviewof dysregulation based on GOBPs in AD. We show that the PPI andMCL clustering approach identifies functional gene modules whichreplicate in other data sets. Where individual genes might differbetween studies, overall GOBP terms are preserved and can beidentified in this manner. Replication based on gene module GOBPterms was more robust than based on individual genes (82% vs48%).
Disclosure statement
This work was supported by the Joint Programming InitiativeNeurodegenerative Diseases (JPND) and ZonMW (grant number[733051022]).
Appendix A. Supplementary data
Supplementary data associated with this article can be found, inthe online version, at https://doi.org/10.1016/j.neurobiolaging.2018.10.023.
References
Ashburner, M., Ball, C.A., Blake, J.A., Botstein, D., Butler, H., Cherry, J.M., Davis, A.P.,Dolinski, K., Dwight, S.S., Eppig, J.T., Harris, M.A., Hill, D.P., Issel-Tarver, L.,Kasarskis, A., Lewis, S., Matese, J.C., Richardson, J.E., Ringwald, M., Rubin, G.M.,Sherlock, G., 2000. Gene ontology: tool for the unification of biology. The GeneOntology Consortium. Nat. Genet. 25, 25e29.
Baig, S., Joseph, S.A., Tayler, H., Abraham, R., Owen, M.J., Williams, J., Kehoe, P.G.,Love, S., 2010. Distribution and expression of picalm in Alzheimer disease.J. Neuropathol. Exp. Neurol. 69, 1071e1077.
Beecham, G.W., Hamilton, K., Naj, A.C., Martin, E.R., Huentelman, M., Myers, A.J.,Corneveaux, J.J., Hardy, J., Vonsattel, J.P., Younkin, S.G., Bennett, D.A., DeJager, P.L., Larson, E.B., Crane, P.K., Kamboh, M.I., Kofler, J.K., Mash, D.C.,Duque, L., Gilbert, J.R., Gwirtsman, H., Buxbaum, J.D., Kramer, P., Dickson, D.W.,Farrer, L.A., Frosch, M.P., Ghetti, B., Haines, J.L., Hyman, B.T., Kukull, W.A.,Mayeux, R.P., Pericak-Vance, M.A., Schneider, J.A., Trojanowski, J.Q.,Reiman, E.M., Alzheimer’s Disease Genetics, C., Schellenberg, G.D., Montine, T.J.,2014. Genome-wide association meta-analysis of neuropathologic features ofAlzheimer’s disease and related dementias. Plos Genet. 10, e1004606.
Bekris, L.M., Yu, C.E., Bird, T.D., Tsuang, D.W., 2010. Genetics of Alzheimer disease.J. Geriatr. Psychiatry Neurol. 23, 213e227.
Bolger, A.M., Lohse, M., Usadel, B., 2014. Trimmomatic: a flexible trimmer for Illu-mina sequence data. Bioinformatics 30, 2114e2120.
Boyle, P.A., Wilson, R.S., Yu, L., Barr, A.M., Honer, W.G., Schneider, J.A., Bennett, D.A.,2013. Much of late life cognitive decline is not due to common neurodegener-ative pathologies. Ann. Neurol. 74, 478e489.
Braak, H., Braak, E., 1995. Staging of Alzheimer’s disease-related neurofibrillarychanges. Neurobiol. Aging 16, 271e278 discussion 8-84.
Carbon, S., Ireland, A., Mungall, C.J., Shu, S., Marshall, B., Lewis, S., Ami, G.O.H., WebPresence Working, G., 2009. AmiGO: online access to ontology and annotationdata. Bioinformatics 25, 288e289.
Cheng, X., Wu, J., Geng, M., Xiong, J., 2014. Role of synaptic activity in the regulationof amyloid beta levels in Alzheimer’s disease. Neurobiol. Aging 35, 1217e1232.
Chi, L.M., Wang, X., Nan, G.X., 2016. In silico analyses for molecular genetic mech-anism and candidate genes in patients with Alzheimer’s disease. Acta Neurol.Belg. 116, 543e547.
Cirrito, J.R., Kang, J.E., Lee, J., Stewart, F.R., Verges, D.K., Silverio, L.M., Bu, G.,Mennerick, S., Holtzman, D.M., 2008. Endocytosis is required for synapticactivity-dependent release of amyloid-beta in vivo. Neuron 58, 42e51.
Dobin, A., Davis, C.A., Schlesinger, F., Drenkow, J., Zaleski, C., Jha, S., Batut, P.,Chaisson, M., Gingeras, T.R., 2013. STAR: ultrafast universal RNA-seq aligner.Bioinformatics 29, 15e21.
Enright, A.J., Van Dongen, S., Ouzounis, C.A., 2002. An efficient algorithm for large-scale detection of protein families. Nucleic Acids Res. 30, 1575e1584.
Gene Ontology, C., 2001. Creating the gene ontology resource: design and imple-mentation. Genome Res. 11, 1425e1433.
Gene Ontology, C., 2015. Gene ontology consortium: going forward. Nucleic AcidsRes. 43, D1049eD1056.
Gillis, J., Ballouz, S., Pavlidis, P., 2014. Bias tradeoffs in the creation and analysis ofprotein-protein interaction networks. J. Proteomics 100, 44e54.
Han, Z., Huang, H., Gao, Y., Huang, Q., 2017. Functional annotation of Alzheimer’sdisease associated loci revealed by GWASs. PLoS One 12, e0179677.
Harrow, J., Frankish, A., Gonzalez, J.M., Tapanari, E., Diekhans, M., Kokocinski, F.,Aken, B.L., Barrell, D., Zadissa, A., Searle, S., Barnes, I., Bignell, A., Boychenko, V.,Hunt, T., Kay, M., Mukherjee, G., Rajan, J., Despacio-Reyes, G., Saunders, G.,Steward, C., Harte, R., Lin, M., Howald, C., Tanzer, A., Derrien, T., Chrast, J.,Walters, N., Balasubramanian, S., Pei, B., Tress, M., Rodriguez, J.M., Ezkurdia, I.,van Baren, J., Brent, M., Haussler, D., Kellis, M., Valencia, A., Reymond, A.,Gerstein, M., Guigo, R., Hubbard, T.J., 2012. GENCODE: the reference humangenome annotation for the ENCODE Project. Genome Res. 22, 1760e1774.
Holtzman, D.M., Carrillo, M.C., Hendrix, J.A., Bain, L.J., Catafau, A.M., Gault, L.M.,Goedert, M., Mandelkow, E., Mandelkow, E.M., Miller, D.S., Ostrowitzki, S.,Polydoro, M., Smith, S., Wittmann, M., Hutton, M., 2016. Tau: from research toclinical development. Alzheimers Dement 12, 1033e1039.
Humphries, C., Kohli, M.A., Whitehead, P., Mash, D.C., Pericak-Vance, M.A., Gilbert, J.,2015a. Alzheimer disease (AD) specific transcription, DNA methylation andsplicing in twenty AD associated loci. Mol. Cell Neurosci 67, 37e45.
Humphries, C.E., Kohli, M.A., Nathanson, L., Whitehead, P., Beecham, G., Martin, E.,Mash, D.C., Pericak-Vance, M.A., Gilbert, J., 2015b. Integrated whole tran-scriptome and DNA methylation analysis identifies gene networks specific tolate-onset Alzheimer’s disease. J. Alzheimers Dis. 44, 977e987.
Jellinger, K.A., 2008. Neuropathological aspects of Alzheimer disease, Parkinsondisease and frontotemporal dementia. Neurodegener Dis. 5, 118e121.
Karran, E., Mercken, M., De Strooper, B., 2011. The amyloid cascade hypothesis forAlzheimer’s disease: an appraisal for the development of therapeutics. Nat. Rev.Drug Discov. 10, 698e712.
Kavanagh, T., Mills, J.D., Kim, W.S., Halliday, G.M., Janitz, M., 2013. Pathway analysisof the human brain transcriptome in disease. J. Mol. Neurosci. 51, 28e36.
Kong, W., Mou, X., Zhang, N., Zeng, W., Li, S., Yang, Y., 2015. The construction ofcommon and specific significance subnetworks of Alzheimer’s disease frommultiple brain regions. Biomed. Res. Int. 2015, 394260.
Kong, W., Zhang, J., Mou, X., Yang, Y., 2014. Integrating gene expression and proteininteraction data for signaling pathway prediction of Alzheimer’s disease.Comput. Math. Methods Med. 2014, 340758.
Lambert, J.C., Ibrahim-Verbaas, C.A., Harold, D., Naj, A.C., Sims, R., Bellenguez, C.,DeStafano, A.L., Bis, J.C., Beecham, G.W., Grenier-Boley, B., Russo, G., Thorton-Wells, T.A., Jones, N., Smith, A.V., Chouraki, V., Thomas, C., Ikram, M.A.,Zelenika, D., Vardarajan, B.N., Kamatani, Y., Lin, C.F., Gerrish, A., Schmidt, H.,Kunkle, B., Dunstan, M.L., Ruiz, A., Bihoreau, M.T., Choi, S.H., Reitz, C., Pasquier, F.,Cruchaga, C., Craig, D., Amin, N., Berr, C., Lopez, O.L., De Jager, P.L.,Deramecourt, V., Johnston, J.A., Evans, D., Lovestone, S., Letenneur, L., Moron, F.J.,Rubinsztein, D.C., Eiriksdottir, G., Sleegers, K., Goate, A.M., Fievet, N.,Huentelman, M.W., Gill, M., Brown, K., Kamboh, M.I., Keller, L., Barberger-Gateau, P., McGuiness, B., Larson, E.B., Green, R., Myers, A.J., Dufouil, C., Todd, S.,Wallon, D., Love, S., Rogaeva, E., Gallacher, J., St George-Hyslop, P., Clarimon, J.,Lleo, A., Bayer, A., Tsuang, D.W., Yu, L., Tsolaki, M., Bossu, P., Spalletta, G.,Proitsi, P., Collinge, J., Sorbi, S., Sanchez-Garcia, F., Fox, N.C., Hardy, J., DenizNaranjo, M.C., Bosco, P., Clarke, R., Brayne, C., Galimberti, D., Mancuso, M.,Matthews, F., European Alzheimer’s Disease, I., Genetic, Environmental Risk inAlzheimer’s, D., Alzheimer’s Disease Genetic, C., Cohorts for, H., Aging Researchin Genomic, E., Moebus, S., Mecocci, P., Del Zompo, M., Maier, W., Hampel, H.,Pilotto, A., Bullido, M., Panza, F., Caffarra, P., Nacmias, B., Gilbert, J.R.,Mayhaus, M., Lannefelt, L., Hakonarson, H., Pichler, S., Carrasquillo, M.M.,Ingelsson, M., Beekly, D., Alvarez, V., Zou, F., Valladares, O., Younkin, S.G.,Coto, E., Hamilton-Nelson, K.L., Gu, W., Razquin, C., Pastor, P., Mateo, I.,Owen, M.J., Faber, K.M., Jonsson, P.V., Combarros, O., O’Donovan, M.C.,Cantwell, L.B., Soininen, H., Blacker, D., Mead, S., Mosley Jr., T.H., Bennett, D.A.,Harris, T.B., Fratiglioni, L., Holmes, C., de Bruijn, R.F., Passmore, P., Montine, T.J.,

J.G.J. van Rooij et al. / Neurobiology of Aging 74 (2019) 225e233 233
Bettens, K., Rotter, J.I., Brice, A., Morgan, K., Foroud, T.M., Kukull, W.A.,Hannequin, D., Powell, J.F., Nalls, M.A., Ritchie, K., Lunetta, K.L., Kauwe, J.S.,Boerwinkle, E., Riemenschneider, M., Boada, M., Hiltuenen, M., Martin, E.R.,Schmidt, R., Rujescu, D., Wang, L.S., Dartigues, J.F., Mayeux, R., Tzourio, C.,Hofman, A., Nothen, M.M., Graff, C., Psaty, B.M., Jones, L., Haines, J.L.,Holmans, P.A., Lathrop, M., Pericak-Vance, M.A., Launer, L.J., Farrer, L.A., vanDuijn, C.M., Van Broeckhoven, C., Moskvina, V., Seshadri, S., Williams, J.,Schellenberg, G.D., Amouyel, P., 2013. Meta-analysis of 74,046 individualsidentifies 11 new susceptibility loci for Alzheimer’s disease. Nat. Genet. 45,1452e1458.
Liang, W.S., Dunckley, T., Beach, T.G., Grover, A., Mastroeni, D., Ramsey, K.,Caselli, R.J., Kukull, W.A., McKeel, D., Morris, J.C., Hulette, C.M., Schmechel, D.,Reiman, E.M., Rogers, J., Stephan, D.A., 2008. Altered neuronal gene expressionin brain regions differentially affected by Alzheimer’s disease: a reference dataset. Physiol. Genomics 33, 240e256.
Liao, Y., Smyth, G.K., Shi, W., 2014. featureCounts: an efficient general purposeprogram for assigning sequence reads to genomic features. Bioinformatics 30,923e930.
McCarthy, D.J., Chen, Y., Smyth, G.K., 2012. Differential expression analysis ofmultifactor RNA-Seq experiments with respect to biological variation. NucleicAcids Res. 40, 4288e4297.
Mirra, S.S., Heyman, A., McKeel, D., Sumi, S.M., Crain, B.J., Brownlee, L.M., Vogel, F.S.,Hughes, J.P., van Belle, G., Berg, L., 1991. The consortium to establish a registryfor Alzheimer’s disease (CERAD). Part II. Standardization of the neuropathologicassessment of Alzheimer’s disease. Neurology 41, 479e486.
Morris, J.H., Apeltsin, L., Newman, A.M., Baumbach, J., Wittkop, T., Su, G., Bader, G.D.,Ferrin, T.E., 2011. clusterMaker: a multi-algorithm clustering plugin for Cyto-scape. BMC Bioinformatics 12, 436.
Murray, M.E., Graff-Radford, N.R., Ross, O.A., Petersen, R.C., Duara, R., Dickson, D.W.,2011. Neuropathologically defined subtypes of Alzheimer’s disease with distinctclinical characteristics: a retrospective study. Lancet Neurol. 10, 785e796.
Ogata, H., Goto, S., Sato, K., Fujibuchi, W., Bono, H., Kanehisa, M., 1999. KEGG: Kyotoencyclopedia of genes and genomes. Nucleic Acids Res. 27, 29e34.
Prince, M., Bryce, R., Albanese, E., Wimo, A., Ribeiro, W., Ferri, C.P., 2013. The globalprevalence of dementia: a systematic review and metaanalysis. AlzheimersDement 9, 63e75.e2.
Ray, M., Zhang, W., 2010. Analysis of Alzheimer’s disease severity across brain re-gions by topological analysis of gene co-expression networks. BMC Syst. Biol. 4,136.
Robinson, M.D., McCarthy, D.J., Smyth, G.K., 2010. edgeR: a Bioconductor package fordifferential expression analysis of digital gene expression data. Bioinformatics26, 139e140.
Schaefer, M.H., Serrano, L., Andrade-Navarro, M.A., 2015. Correcting for the studybias associated with protein-protein interaction measurements reveals differ-ences between protein degree distributions from different cancer types. FrontGenet. 6, 260.
Scheltens, P., Blennow, K., Breteler, M.M., de Strooper, B., Frisoni, G.B., Salloway, S.,Van der Flier, W.M., 2016. Alzheimer’s disease. Lancet 388, 505e517.
Sekar, S., McDonald, J., Cuyugan, L., Aldrich, J., Kurdoglu, A., Adkins, J., Serrano, G.,Beach, T.G., Craig, D.W., Valla, J., Reiman, E.M., Liang, W.S., 2015. Alzheimer’sdisease is associated with altered expression of genes involved in immuneresponse and mitochondrial processes in astrocytes. Neurobiol. Aging 36,583e591.
Selkoe, D.J., Hardy, J., 2016. The amyloid hypothesis of Alzheimer’s disease at 25years. EMBO Mol. Med. 8, 595e608.
Smoot, M.E., Ono, K., Ruscheinski, J., Wang, P.L., Ideker, T., 2011. Cytoscape 2.8: newfeatures fordata integrationandnetworkvisualization. Bioinformatics27,431e432.
Subramanian, A., Tamayo, P., Mootha, V.K., Mukherjee, S., Ebert, B.L., Gillette, M.A.,Paulovich, A., Pomeroy, S.L., Golub, T.R., Lander, E.S., Mesirov, J.P., 2005. Gene setenrichment analysis: a knowledge-based approach for interpreting genome-wide expression profiles. Proc. Natl. Acad. Sci. U.S.A. 102, 15545e15550.
Sutherland, G.T., Janitz, M., Kril, J.J., 2011. Understanding the pathogenesis of Alz-heimer’s disease: will RNA-Seq realize the promise of transcriptomics?J. Neurochem. 116, 937e946.
Szklarczyk, D., Morris, J.H., Cook, H., Kuhn, M., Wyder, S., Simonovic, M., Santos, A.,Doncheva, N.T., Roth, A., Bork, P., Jensen, L.J., von Mering, C., 2017. The STRINGdatabase in 2017: quality-controlled protein-protein association networks,made broadly accessible. Nucleic Acids Res. 45, D362eD368.
Thal, D.R., Attems, J., Ewers, M., 2014. Spreading of amyloid, tau, and microvascularpathology in Alzheimer’s disease: findings from neuropathological and neuro-imaging studies. J. Alzheimers Dis. 42 (Suppl 4), S421eS429.
Tomiyama, T., 2010. Involvement of beta-amyloid in the etiology of Alzheimer’sdisease. Brain Nerve 62, 691e699.
Twine, N.A., Janitz, K., Wilkins, M.R., Janitz, M., 2011. Whole transcriptomesequencing reveals gene expression and splicing differences in brain regionsaffected by Alzheimer’s disease. PLoS One 6, e16266.
Van Cauwenberghe, C., Van Broeckhoven, C., Sleegers, K., 2016. The genetic land-scape of Alzheimer disease: clinical implications and perspectives. Genet. Med.18, 421e430.
van der Brug, H., Huntly, M., Cao, Y., 2017. Heterogeneity in neurodegenerativedisease (GSE95587). NCBI GEO.
van Dongen, S., Abreu-Goodger, C., 2012. Using MCL to extract clusters from net-works. Methods Mol. Biol. 804, 281e295.
von Mering, C., Huynen, M., Jaeggi, D., Schmidt, S., Bork, P., Snel, B., 2003. STRING: adatabase of predicted functional associations between proteins. Nucleic AcidsRes. 31, 258e261.
Wang, M., Roussos, P., McKenzie, A., Zhou, X., Kajiwara, Y., Brennand, K.J., DeLuca, G.C., Crary, J.F., Casaccia, P., Buxbaum, J.D., Ehrlich, M., Gandy, S., Goate, A.,Katsel, P., Schadt, E., Haroutunian, V., Zhang, B., 2016. Integrative networkanalysis of nineteen brain regions identifies molecular signatures and networksunderlying selective regional vulnerability to Alzheimer’s disease. GenomeMed. 8, 104.
Zhou, Y., Hayashi, I., Wong, J., Tugusheva, K., Renger, J.J., Zerbinatti, C., 2014. Intra-cellular clusterin interacts with brain isoforms of the bridging integrator 1 andwith the microtubule-associated protein Tau in Alzheimer’s disease. PLoS One 9,e103187.