Embed Size (px)
Citation preview
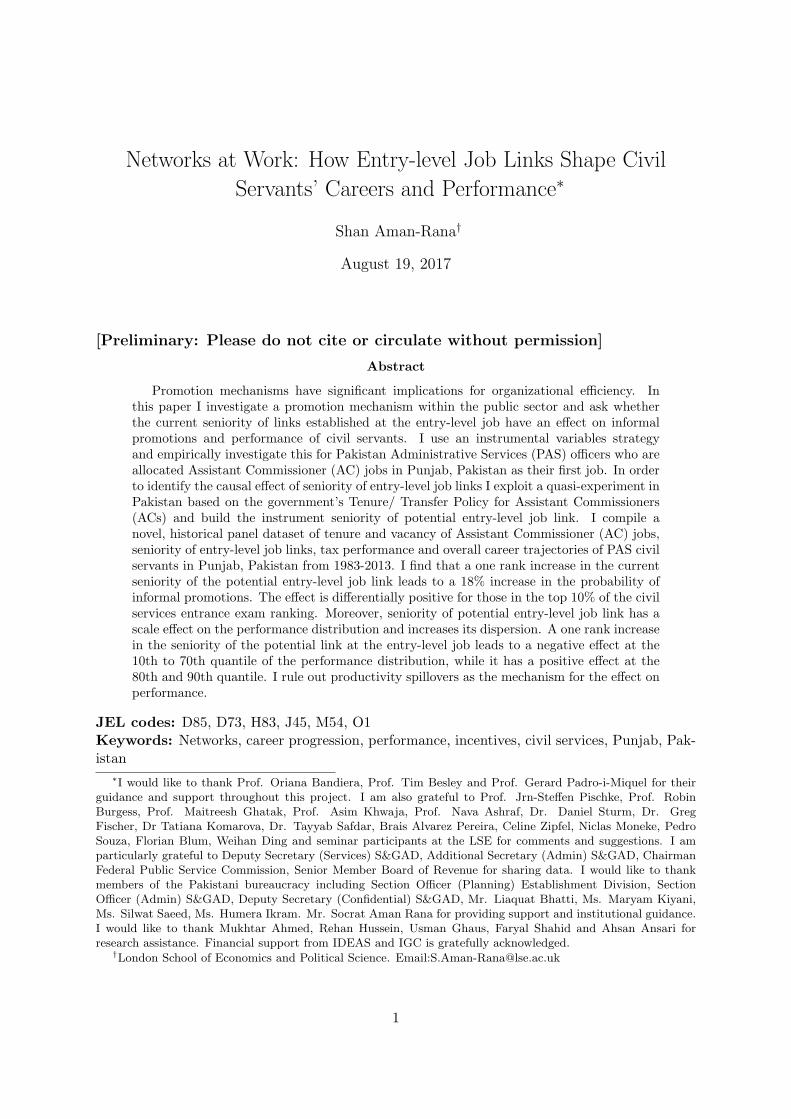
Networks at Work: How Entry-level Job Links Shape Civil
Servants’ Careers and Performance∗
Shan Aman-Rana†
August 19, 2017
[Preliminary: Please do not cite or circulate without permission]
Abstract
Promotion mechanisms have significant implications for organizational efficiency. Inthis paper I investigate a promotion mechanism within the public sector and ask whetherthe current seniority of links established at the entry-level job have an effect on informalpromotions and performance of civil servants. I use an instrumental variables strategyand empirically investigate this for Pakistan Administrative Services (PAS) officers who areallocated Assistant Commissioner (AC) jobs in Punjab, Pakistan as their first job. In orderto identify the causal effect of seniority of entry-level job links I exploit a quasi-experiment inPakistan based on the government’s Tenure/ Transfer Policy for Assistant Commissioners(ACs) and build the instrument seniority of potential entry-level job link. I compile anovel, historical panel dataset of tenure and vacancy of Assistant Commissioner (AC) jobs,seniority of entry-level job links, tax performance and overall career trajectories of PAS civilservants in Punjab, Pakistan from 1983-2013. I find that a one rank increase in the currentseniority of the potential entry-level job link leads to a 18% increase in the probability ofinformal promotions. The effect is differentially positive for those in the top 10% of the civilservices entrance exam ranking. Moreover, seniority of potential entry-level job link has ascale effect on the performance distribution and increases its dispersion. A one rank increasein the seniority of the potential link at the entry-level job leads to a negative effect at the10th to 70th quantile of the performance distribution, while it has a positive effect at the80th and 90th quantile. I rule out productivity spillovers as the mechanism for the effect onperformance.
JEL codes: D85, D73, H83, J45, M54, O1Keywords: Networks, career progression, performance, incentives, civil services, Punjab, Pak-istan
∗I would like to thank Prof. Oriana Bandiera, Prof. Tim Besley and Prof. Gerard Padro-i-Miquel for theirguidance and support throughout this project. I am also grateful to Prof. Jrn-Steffen Pischke, Prof. RobinBurgess, Prof. Maitreesh Ghatak, Prof. Asim Khwaja, Prof. Nava Ashraf, Dr. Daniel Sturm, Dr. GregFischer, Dr Tatiana Komarova, Dr. Tayyab Safdar, Brais Alvarez Pereira, Celine Zipfel, Niclas Moneke, PedroSouza, Florian Blum, Weihan Ding and seminar participants at the LSE for comments and suggestions. I amparticularly grateful to Deputy Secretary (Services) S&GAD, Additional Secretary (Admin) S&GAD, ChairmanFederal Public Service Commission, Senior Member Board of Revenue for sharing data. I would like to thankmembers of the Pakistani bureaucracy including Section Officer (Planning) Establishment Division, SectionOfficer (Admin) S&GAD, Deputy Secretary (Confidential) S&GAD, Mr. Liaquat Bhatti, Ms. Maryam Kiyani,Ms. Silwat Saeed, Ms. Humera Ikram. Mr. Socrat Aman Rana for providing support and institutional guidance.I would like to thank Mukhtar Ahmed, Rehan Hussein, Usman Ghaus, Faryal Shahid and Ahsan Ansari forresearch assistance. Financial support from IDEAS and IGC is gratefully acknowledged.†London School of Economics and Political Science. Email:[email protected]
1
1 Introduction
Information relevant for personnel management in organizations is generally dispersed amongstits many members. An important question in organizational design is whether this decentralizedinformation should be used in designing contracts for workers. On the one hand the use ofdecentralized information reduces information asymmetries while on the other hand it opensthe door to a possibility of collusion amongst the ‘nexus of the informed parties’ (Tirole (1986)).In the presence of an efficiency-collusion trade-off any use of decentralized information canhave significant implications for incentives and overall organizational efficiency. Promotionmechanisms in organizations is one such that potentially faces this trade-off with significantramifications for incentives and efficiency. This is especially true when market fails and non-price based promotion mechanisms emerge.In this paper I investigate a promotion mechanism and ask whether links that workers get in theentry-level job affect their future career progression and whether that has an impact on theirearly-career performance. I empirically investigate this in the context of public sector workersin Pakistan.Public sector labour markets are potentially highly reliant on non-price or rule based promotionand incentivizing mechanisms with limited use of information from co-workers or supervisors.Public sector workers operate under low powered incentives defined by rules and regulationsincluding flat wage structures, job security, limited censure for shirking, multiple tasks andoutcome measures that are hard to quantify, multiplicity of principals with conflicting interestsand lack of competition and profit motive. The fraction of internal promotions in the publicsector is quite significant1. These features of the public sector are precisely the reason thatfindings in the personnel economics literature that focus on the private sector can rarely beextrapolated to the public sector context (Dixit (2002); Finan et al. (2015))2.Having said that it is very difficult to incentivize public sector workers, one cannot overstatethe importance of doing so. Understanding their incentives has significant implications fordevelopment. In a vast majority of the world, especially the developing world, civil servantsare tasked with the implementation of policies that have substantial welfare implications suchas decreasing infant mortality, improving education outcomes, increasing revenue collection,ensuring secure property rights, adjudicating on property right disputes, maintaining propertyright documents etc. Needless to say that the effectiveness of these tasks ultimately relies on theincentives of the civil servants to exert effort on the job. Thus, it is crucial for any developmenteffort to understand how countries can effectively incentivize public sector employees and howchanges in the institutional design has an impact on the incentives for public service delivery.In this paper I study promotions of one group of civil servants, the Pakistan AdministrativeServices (PAS) civil servants that were allocated Assistant Commissioner (AC) jobs in Punjab,Pakistan as their first one. ACs head the revenue administration in tehsils in Punjab, Pakistan4.A civil servant is meant to work as an AC at the very start of their career in grade 17. The
1In most public services, conditional on competitively entering the civil services, rules dictate that only servingpublic servants can be considered for senior public sector jobs.
2For instance, performance pay which seems like an obvious choice to incentivise effort in the private sector hasprovided mixed results in the public sector context (cf. Jacob & Levitt (2003); Jacob (2005); Cullen & Reback(2006); and Neal & Schanzenbach (2010); Duflo, Dupas & Kremer (2012); Fryer (2013); Lavy (2002); Glewweet al. (2010); Muralidharan & Sundararaman (2010); Khan et al. (2016)). The incentive effects of non-financialincentives is also not straight forward within the public sector context. While importance or seniority of entry-leveljob links, career concern, idealism and professionalism can be an inexpensive, informal, non-financial incentivisingtools for budget constraint developing countries, it has been argued that increasing extrinsic rewards, financial ornon-financial can crowd out pro-social preference to work (Benabou & Tirole (2003), Benabou & Tirole (2005),Dixit (2002), Besley & Ghatak (2005))3
4There are 36 district with 141 tehsils in the whole of Punjab.
2
average time spent as an AC is 2.4 years5. Restricting attention to this group of civil servantshas a couple of advantages. First, I can exploit the initial placement and promotion rules ofthe government to create an instrument for entry-level job links and identify a causal effect.Second, unlike the other jobs that are pure ‘paper pushers’, a big part of the performance ofACs is quantifiable. By rule, PAS civil servants are meant to work as an AC at the very startof their career in rank 176. Approximately, 315 out of 417 PAS new recruits i.e. 75.5% areallocated AC jobs7.I compile a novel and historical panel dataset of tenure and vacancy of Assistant Commissioner(AC) positions as well as a novel, historical panel dataset of career progression, performance andseniority of entry-level job links from 1983-2013. The two outcomes I investigate are informalpromotions and tax performance. Informal promotions are defined as a dummy that turns onone whenever the actual rank of the job they occupy is greater than their official rank.8 Informalpromotions are centralized and are completely at the Chief Minister’s discretion. The spell alsolasts as long as the Chief Minister pleases. Although informal promotions have no bearingon official promotions it does entail a lot of benefits like a greater sphere of influence, moremanpower reporting to them, bigger office space, higher wage allowance in the specific casesof telephone, car and petrol. Informal promotion is quantified from the career charts of civilservants available from the S&GA Department of Government of the Punjab. Tax performanceis monthly tax collected as a percentage of annual target set by the provincial Board of Revenue.The performance measure is compiled from historical records of the Board of Revenue on LandRevenue/Agriculture Income Tax (AIT).For the purpose of this study what I call entry-level job links are objective professional links andI only consider the set of direct links. I classify the endogenous measure as the 75th percentileof the seniority of those set of links that new recruits get in the very first month of their veryfirst job as an Assistant Commissioners (AC). I consider the set of links fixed over time. Whatchanges is the seniority or rule based official promotions of these set of links.In order to identify a causal effect of seniority of job link I employ an instrumental variablesstrategy and exploit a quasi-experiment in Pakistan based on the Tenure/ Transfer Policy of theGovernment of the Punjab. Various versions of this policy state that Assistant Commissionersmay not be transferred from their job before the end of at least 1 year9. This means that whencohorts of new recruits enter they can only be allocated AC positions that are either vacant
5Assistant Commissioners mainly supervise a team of ‘Patwaris’, ‘Naib-tehsildars’ and ‘Tehsildars’ all of whomare referred to as revenue officers in general. The jurisdiction of the ‘Patwaris’ spans a couple of villages groupedtogether to form a ‘patwar’ circle. The ‘Naib-Tehsildar’ is the supervisory tier for a team of ‘Patwaris’. Thereis one or two designated ‘Tehsildars’ in tehsils. ACs work under the supervision of the Collector, who furtherworks under the Commissioner. The Board of Revenue (BOR) is the provincial oversight body. Restrictingattention to Assistant Commissioner positions has a couple of advantages. First this position is the one thatthe majority of the new recruits are meant to occupy at least in the 17 grade, by rules. 160 out of 189 newrecruits i.e. approximately 85% occupy Assistant Commissioner positions in their first job. The nature of the jobremains the same across ACs and any heterogeneity stems from being in a different location eg. AC Lahore Cityversus AC Multan city. Second, unlike the other grade 17 jobs which are pure ‘paper pushers’, a big part of theperformance of ACs is quantifiable. ACs are mainly responsible for collection of land revenue/agricultural incometax (AIT) against annual targets set by the provincial Board of Revenue (BOR). Third, restricting attention toAC positions has the added benefit that I can exploit a tenure/transfer policy of the government of the Punjabto identify a causal effect of job links that I explain later.
6Inter-provincial Transfers of DMG/PSP Officers, Government of Pakistan, Cabinet Secretariat, Establish-ment Division, 10th April, 1988, (5/9/86-E.5)
7If I restrict attention to those for whom I have the performance measure 162 out of 191 PAS new recruitsi.e. approximately 85% are allocated AC positions.
8Ranks are called grades within civil services and I use rank and grade interchangeably.9The Punjab Government Transfer Policy 1980; Inter-Provincial Transfers of DMG/PSP Officers 1988; Gov-
ernment of Punjab Circular Letter 2004; Guidelines for Transfer of Assistant Commissioners 2013
3

(so the policy doesn’t apply) or where the incumbent ACs have worked for at least 1 year.What further aids identification is the fact that the end of on-the-job training of the PAS newrecruits is centrally determined. Approximately 62% of new recruits get allocated AssistantCommissioner positions following this policy.This policy allows me to classify a cohort level instrument i.e. seniority of potential job links,which is the 75th percentile of the official rank of all those civil servants that, in the monthof end of training of the new recruits, worked in a district where either any AC had alreadyenjoyed a tenure greater than equal to one year or any AC position was vacant. I freeze thepotential job links in the month that training ended for the new recruits. Time variation inthe measure comes through changes in their official rank. The reason that there is variation isbecause job links at different points in their career trajectory. Both the endogenous measureand the instrument is quantified from the career charts of civil servants available from theS&GA Department of Government of the Punjab. Moreover, to categorize the instrument it isimportant to observe the tenure of AC positions and vacancies across all of Punjab and not justfor the set of civil servants in my sample. Therefore, I collected data on incumbency boards fromAssistant Commissioner offices in the Punjab. Incumbency boards are placed in AC offices andcontain the name of past civil servants who acted as ACs in that location. They also containinformation on the start and end dates of the tenures of ACs10.I find that a one rank increase in the seniority of the potential job link leads to an 18% increasein the probability of informal promotions of civil servants. For the most part the effect isheterogeneous according to ability. I classify ability from the recruitment exam based cohortranking of civil servants. I find that the top 10% having a differentially higher probability ofinformal promotions. This is quite interesting and counter-intuitive given the context. Whatis more interesting is the fact that those top 10% who have junior colleagues have a negativeprobability of being informally promoted. It is only through a senior set of links that theoverall probability of informal promotions for the top 10% is positive. I then look at the directheterogeneous effect of seniority of job link on the performance distribution of new recruits.I estimate quantile treatment effects following Koenker (2005), Parente & Santos Silva (2016)and Canay (2011). The reduced form quantile treatment effects suggest that the seniority ofpotential job link has a scale effect and increases the dispersion of the distribution of the taxperformance. A one rank increase in the seniority of potential job link leads to a negative andstatistically significant at the 10th quantile all the way till the 70th quantile, while it has apositive and statistically significant at the 90th quantile. In other words changes in seniority ofpotential job link results in an increase in inequality in performance with the lower and middle ofthe performance distribution shifting further left and the higher tail shifting rightwards. I find asomewhat similar scale effect using another measure of performance i.e. subjective performanceevaluation. Results remain robust to a battery of robustness checks.I also investigate the mechanism of the effect on performance. I investigate whether productivityspillovers or provision of information for promotions by the links is the main mechanism throughwhich seniority of potential job link has an affect on performance. For that purpose I restrictattention to the seniority of those set of links that work in the CM secretariat in the provincialcapital away from the new recruits. Results show that a rise in the seniority of the potential linkleads to a reduction in performance at almost all quantiles of the performance distribution. Ialso find that seniority of the links in the CM secretariat only results in a differentially positiveprobability of informal promotions for those in the top 10% of their cohort ranking. Results
10Incumbency boards are a tradition inherited from the colonial times. There is an incumbency board in nearlyall of the Pakistani civil services offices. Owing to the special attention paid by each civil servant to ensure his/hername is added to the list of past civil servants in any office there is very small chance of errors in the incumbencyboard. 138 out of 141 AC offices supplied their incumbency board information which was then digitized.
4
suggest that productivity spillovers do not appear to be the mechanism through which seniorityof job links has an effect on performance especially. First, productivity spillovers seem lessplausible from links that are working far off in the provincial capital. Second, productivityspillovers should be smooth over the career of civil servants and it seems less plausible forthem to change discontinuously with the official promotion of the entry-level links. Third, thereduced form quantile treatment effects show that a rise in the seniority of the potential linkleads to a reduction in performance at almost all quantiles of the performance distribution. If itwere productivity spillovers then performance effects would have been non-negative in the least.Fourth, I see that the high ability have a differentially positive probability of being informallypromoted with a rise in the seniority of their job link despite the fact that the top end ofthe performance distribution did not have a positive performance effect. Overall, it seems lessplausible that productivity spillovers are the main mechanism through which seniority of joblinks has an effect on performance.This study has significant policy implications. Although this paper is based in the context ofthe public sector of a developing country it sheds light on the potential use of decentralizedinformation and its efficiency effects in other situations eg. job committees-PhD supervisors-PhD students; shareholders/auditor/managers (Kofman & Lawarree (1993)), CEO and internalsuppliers (Laffont & Martimort (1998)).This paper uses quasi-experimental variation in entry-level links to provide empirical evidenceon not just short run but long run career progression effects. Note that the effect of the linksthat I investigate are the set of links that the new recruits get in the very first month of their veryfirst job. Chaos Theory in mathematics, with applications in many fields including economics,argues that seemingly insignificant differences in initial conditions can result in vastly differentoutcomes over time. I have different set of initial conditions for the set of new recruits i.e. theirentry-level links. I observe these new recruits not just in the first 5 years but throughout mostof their career as civil servants. This allows me to investigate whether these different initialconditions have any long run career impact.Methodologically the paper makes the following contributions. First, using quasi-experimentalvariation in seniority of entry-level links ensures that, unlike other studies that use pre-existingcollege or school links to study outcomes, there is no omitted variable bias from a third omittedlink resulting in a spurious correlations. In addition, I do not have to make strong assumptionsaround why two people self-selected into a network at t− k (for k> 0), and why at time t theseunobservable characteristics are uncorrelated with their potential outcomes. Second, I make aclear distinction between the subjects of network effects i.e. the newly recruited civil servantsand the link which potentially provides the variation to identify a causal effect overcomingreflection problems typical of the networks literature (Manski (1993);Angrist (2014)). Third,since who works, when and with whom is objectively quantifiable this study overcomes themeasurement error and subjectivity bias that results from self-reported network data (Jackson(2013)). Finally, it compiles a novel and historical dataset of career progression and performanceas well as seniority of job links of public servants in a developing country.This paper will contribute to the literature on public sector work incentives (Benabou & Tirole(2003), Benabou & Tirole (2005); Dixit (2002); Besley & Ghatak (2005); Ashraf, Bandiera& Lee (2014), Ashraf, Bandiera, Lee et al. (2014), Ashraf, Bandiera & Jack (2014) and Iyer& Mani (2012)). While this literature investigates the incentives of public sector workers ingeneral it has not focused on the incentive effects of the seniority of entry-level job links. Itwill also contribute to the literature on incentive effects of social connections ( Bandiera et al.(2008, 2009, 2010); Jia et al. (2015)). However, while this literature is focused on the privatesector, in this paper I consider the incentive effects of seniority of job links in the public sector.Moreover, even for the private sector workers the literature focuses in the most part on short
5

run outcomes while this study is able to look at the effect on the long run career progressionoutcomes for civil servants. This paper also indirectly contributes to the literature on socialcapital at workplace (Fernandez et al. (2000); Suzuki et al. (2010)). This paper is also related tothe literature on nepotism and performance (Perez-Gonzalez (2006); Scoppa (2009); Jia et al.(2015); Xu (2016)). What differentiates this paper from others in the literature is both themethodology used and the effects that seniority of job links has on outcomes.The paper is organized as follows: Section 2 describes the institutional background, while Section3 discusses the Tenure/Transfer Policy of the government. Section 4 explains the theoreticalframework. Section 5 and 6 has data and descriptive statistics and Section 7 to 9 describes allthe main results. Section 10 discusses mechanism and Section 11 robustness checks.
2 Institutional Background
2.1 Civil Services of Pakistan - Pakistan Administrative Services
Like the Indian Administrative Services, Pakistan Administrative Services is a successor ofthe Indian Civil Services (ICS). Pakistan Administrative Services officers are responsible fornon-specialist administrative jobs. They are recruited through the Central Superior Services(CSS) examination conducted by the Federal Public Service Commission (FPSC). They starttheir careers in grade 17. The maximum grade is 22. Both male and female including disabledpersons having at least 2nd Division Bachelors degree between the ages of 21 to 28 years areeligible to sit the CSS exam. Entry into PAS is highly competitive. According to the resultsannounced by the Federal Public Service Commission (FPSC), only 238 candidates out of atotal of 12,176 cleared the CSS examination and were recommended for final appointments in2015. Only 0.3% i.e. 36 were appointed to Pakistan Administrative Services.
2.1.1 Training after recruitment and definition of cohorts
After recruitment, the new recruits form part of the federal government’s ‘pool’ of civil ser-vants. They undergo two types of training i.e. academic and on-the-job training. The academictraining lasts for 1.5 years. After academic training the federal government allocates the newrecruits to various provinces based on the Rotation Policy of the government. Provincial gov-ernments are responsible for on-the-job training and further job allocations as per their ownrequirements and rules and regulations. The on-the-job training (called Assistant Commissioner(Under Training) (AC (UT))) currently lasts for 22 weeks (historically it ranged from 18 weeksto 37 weeks). Despite all practicalities being arranged by the provincial government, the du-ration and date of termination of training is still determined by the Director General of thefederal government training academy. The civil servants are still considered on probation tillthe termination of the training period by the Director General.Although in principle all civil servants in a cohort should start and end their on-the-job trainingtogether, in practise, in most cases, the end of AC (UT) is decided for a cohort in a staggeredfashion (see appendix figure A.1). To ensure a clean identification of a causal effect and a correctclassification of the ‘potential’ network, I, therefore, consider each cohort as those new recruitsthat have completed their UT period together. For instance if a, b, c and x, y, z are all part ofone cohort of civil services i.e. they took the exam and academic training together but if theDG notified x, y and z to have completed their on-the-job training in March 1999 and a, b, cin April 1999, they are classified as two separate cohorts. I discuss the potential identificationconcerns that can stem from this definition of cohorts in Section 11.2.
6
2.1.2 Job allocation post-recruitment
Human resource function in the Punjab is carried out by the Services and General Adminis-tration Department (S&GAD) under the Chief Minister (CM) of the province. S&GAD hasdetailed information on all civil servants (PAS and PMS), including their CSS and academictraining exam based merit position within their cohort, their performance evaluation reports,education, training, age, experience etc. The jobs against which PAS and PMS civil servants canbe allocated are mainly administrative in nature but they are hugely heterogenous and rangefrom tax collection, to education and health management, project management etc. Total num-ber of government positions is determined by the Finance Department through rules. Generallycreating new positions requires a long procedure vetted by the a committee of governmentdepartments.The civil services has centralised job allocations. The final authority for job allocations isdetermined by rank of the job not rank of civil servant. Rank 17 jobs are allocated by a seniorcivil servant in grade 21, Additional Chief Secretary (ACS). While rank 18 jobs are allocatedby the senior most civil servant in grade 22, the Chief Secretary. The Chief Minister (CM) ofthe province is responsible for all other job allocations. In addition, all rank 17 and 18 jobsthat are not in the secretariat sometimes need the informal nod of the CM despite the formalauthority being with the ACS and CS respectively. Under the rules once a position is allocated,civil servants cant walk away from their allocation and have to start work within a pre-set timeperiod.
Assistant Commissioner jobs
Rules dictate that PAS new recruits should be allocated Assistant Commissioner (AC) jobswhen they start off their careers in rank 17. Approximately 315 out of 417 PAS new recruitsi.e. 75% were allocated AC jobs. The average PAS new recruit spends 2.4 years of their careeracting as ACs. The minimum length of time that civil servants are meant to be in rank 17is 5 years and approximately 2 years is spent under training. This means that after trainingnew recruits spend 80% of their rank 17 years acting as Assistant Commissioners. AssistantCommissioners head the revenue administration in tehsils in Punjab, Pakistan. They mainlysupervise a team of ‘patwaris’, ‘naib-tehsildars’ and ‘tehsildars’ all of whom are referred to asrevenue officers in general11. ACs work under the supervision of the Collector, who furtherworks under the Commissioner12. The Board of Revenue (BOR) is the provincial oversightbody.Many different legal and civil services reforms have resulted in a change in the role played byACs over the years. Pre-1997, the functions carried out by the office of the AC fell undertwo main heads: Revenue and maintenance of law and order. Post Legal Reforms Act 1997,Local Government Act 2001, and various executive orders, the law and order aspect of the jobhas mostly been withdrawn and replaced with other miscellaneous responsibilities. The set ofmiscellaneous activities depends on the prerogative of the government and can change fromtime to time, however, they are generally allocated to all ACs in Punjab together. There can bespurts of responsibilities like an anti-encroachment drive, organising activities around Islamic
11‘Patwari’ (grade 5) is the official at the lowest rung of the revenue collection machinery. Their jurisdictionspans a couple of villages grouped together to form a ‘patwar’ circle. The ‘Naib-Tehsildar’ is the supervisory tierfor a team of ‘Patwaris’ and is generally a grade 14 official. There is one or two designated ‘Tehsildars’ in tehsilsand depending on their seniority are generally a grade 16/17 official.
12Deputy Commissioner (grade 18) was the Collector before 2001. Post 2001 this post was restructured andredesignated as the District Officer (Revenue). During 2001-2011 the Executive District Officer (Revenue) (grade19) performed the functions of the Commissioner. The post of Executive District Officer (Revenue) was abolishedin April 2011 and replaced again with Commissioners.
7
festivals or more general coordination and monitoring activities. Since AC is the linchpin of thegovernment in the tehsil the usual practise is to refer to the AC for any queries.
2.1.3 Official promotions
I study outcomes of Pakistan Administrative Services new recruits. However, their entry-level job contacts can be from any branch of civil service i.e. Provincial Management Services(PMS), Provincial Secretariat Services (PSS), Provincial Civil Service (PCS) or even PakistanAdministrative Services (PAS)13. In all cases promotions are based on rigid rules and are largelycarried out cohort-by-cohort in a sequential manner. The process is not very far from theIndian Administrative Services case described in Bertrand et al. (2015). In general, seniorityis respected for promotions within all civil services. There are two kinds of seniority i.e. inter-cohort and intra-cohort both of which play a role in determining who gets promoted first. Inthe case of PAS civil servants, the intra-cohort seniority is drawn according to the result ofthe CSS exam, academic training and final passing out exam (FPOE) which takes place beforestarting the first job. For PCS and PSS, the intra-cohort seniority is based on the PCS andPSS exam respectively. Same was the case with PMS till 2012. From 2012 onwards new cohortsof PMS had their intra-cohort seniority drawn according to the result of the PMS exam (50%weight), academic training (25% weight) and final passing out exam (FPOE) (25% weight).In all cases, once drawn up, intra-cohort seniority is set in stone for the rest of the career ofthe civil servant and cannot be changed. The senior cohort as well as the senior civil servantwithin each cohort, conditional on meeting the eligibility criteria for promotion, has a rightto be considered for promotion before juniors. Officers are considered superseded if they areunable to meet the threshold requirements for promotions. A civil servant, once superseded forpromotion is eligible for promotion after he gets one more PER. Once promoted supersededofficers are still considered senior to the juniors who superseded them. In the case of next roundof promotions these superseded seniors are considered before the juniors. In addition, sometimescivil servants’ promotion decisions are deferred for the following potential reasons: if they havenot undergone the prescribed training; they have not submitted the required PERs; there aredisciplinary or departmental proceedings pending against the officer; they are on deputationabroad to a foreign government, private organization or international agency; or if their intra-cohort seniority is being contested in a court of law. The civil servant whose promotion hasbeen deferred is considered for promotion as soon as the reason on the basis of which defermenttook place ceases to exist. However, in the case of deputation the civil servant is considered forpromotion only on their return to Pakistan and after earning at least one PER for one full year(for details refer to Appendix C).
2.1.4 Informal Promotions
When jobs are notified by the government the rank of the civil servant meant to occupy thesejobs is also specified. Formally the official rank of the civil servant and the notified rank of thejob must match. However, the Chief Minister exercises considerable discretion in allocating ahigher ranked position to a junior civil servant, resulting in an informal promotion of the juniorcivil servant. Informal promotions is a practice sometimes owing to a shortage of officers inthe higher grade but mostly to incentivise performance by creating heterogeneity of the actualrank of the civil servants within the same cohort. Informal promotions are not linear i.e. thespell lasts as long as the Chief Minister pleases. I reiterate that while temporary, informal
13With the introduction of the PMS Rules, 2004, PMS was created and there was no further hiring underProvincial Secretariat Services (PSS) or Provincial Civil Service (PCS). These services were to be called ex-PCSand ex-PSS and came under the same rules as PMS.
8
promotions happen, civil servants are officially promoted only on the basis of the promotionpolicy as outlined in appendix table A1 and these informal promotions do not have a bearingon the official promotions. As already explained, while official promotions alone dictate thebasic wage rate enjoyed by civil servants as well as most of the allowances they enjoy, informalpromotions have their own benefits. They provide a greater sphere of influence for the juniorofficer, bigger office space in most cases, higher manpower reporting to them, higher wageallowance in the specific cases of telephone14, car and petrol15. In general, informal promotionsare at least weakly preferred by the junior officers to their correct official rank positions.
3 The Tenure/Transfer Policy of the government
The Punjab Government Transfer Policy, 1980 followed by the Inter-Provincial Transfers ofDMG/PSP Officers Policy, 1988 dictated that Assistant Commissioners may not be transferredfrom their job before the end of 3 years16. However, practical considerations resulted in the defacto policy being different from de jure17. First, at a given point in time there are fewer civilservants than jobs. As explained, recruitment is carried out by a Public Service Commission onbehalf of the government. In most cases it takes at least 4 years from the time of request forrecruitment to the start of the first job of the new recruits. In addition to that, in some years,despite the Public Service Commission’s efforts, if they do not find the right candidates suchvacancies are left unfilled. They are then aimed to be filled in the next round of recruitment,which is once a year in the case of PAS. The number of rank 17 positions left unfilled by theFPSC have been increasing over the years. They were 45 in 2011, 30 in 2012, 71 in 2013 and82 in 201418. Second, policy makers have the role of allocation of existing civil servants to ACjobs. Owing to the shortage of civil servants, they face the tradeoff between ensuring no oneAC job is vacant for too long and ensuring tenure of Assistant Commissioners. Third, sincecivil servants have security of jobs, similar to the Indian Administrative Services (IAS) case(cf. Iyer & Mani (2012)), the threat of transfers is used to sometimes incentivize effort on thejob. Fourth, like any other labour market, there is some amount of ‘frictional’ vacancy resultingin the tenure policy not being followed19. Civil servants get promoted to rank 18 and so canno longer work as an AC or quit the civil service or take long leave for training courses or forpersonal reasons. This may or not be before 3 years of working as an AC.Recognising that de facto tenures under the policy were different from de jure AC tenures,the Punjab government issued a circular letter where the tenure under the policy was officiallybrought close to the de facto tenure of 1 year20. The Tenure Policy stated:
‘The Provincial Cabinet in its meeting held on 06.10.2004 approved a minimumtenure of one year for government servants for all grades/scales.’
14Revision of Mobile Phone Policy, Government of Pakistan, Cabinet Secretariat, Cabinet Division, 15th April,2016, (OM. No. 3(30)/T&M/2015-RA-IV)
15Rules for the Use of Staff Cars, 1980, Government of Pakistan, Cabinet Secretariat, Cabinet Division, Octo-ber, 2008
16The Punjab Government Transfer Policy, Services & General Administration Department, Government ofthe Punjab, 16th March, 1980; Inter-Provincial Transfers of DMG/PSP Officers Policy, Establishment Division,Government of Pakistan, 10th April, 1988
17The de facto policy is such that the average tenure of an AC in Punjab in any one tehsil is approximately 1year
18Riazul Haq, ‘CSS 2015: Only 379 candidates pass FPSC exams,’ The Express Tribune, Pakistan, 28th April,2016 (accessed at: http://tribune.com.pk/story/1093334/css-2015-only-379-candidates-pass-fpsc-exams/)
19I am not referring to the vacancy against which fresh recruitment would be carried out by the FPSC. InsteadI am referring to those tehsils that don’t have an AC as yet, as the S&GAD has not allocated that job to anycivil servant, conditional on recruitment.
20Government of Punjab circular letter No. SI.1-1/2003 dated 18th Jan, 2005, on Tenure Policy
9
This was further reiterated in guidelines for transfer of Assistant Commissioners, which stated:
‘The Cabinet Committee in its meeting held on 05.07.2013, decided that beforecompletion of at least one year tenure, an Assistant Commissioner may not betransferred.’
The Tenure/Transfer Policy for Assistant Commissioners offers a source of quasi-experimentalvariation that I exploit to causally identify the effect of work networks on outcomes of PASnew recruits. As already discussed the end of on-the-job training of the PAS new recruits isdecided by the Director General of the federal government training institute. When PAS newrecruits finish their on-the-job training, by rules, they have to be allocated AC jobs. Since theTenure/Transfer Policy aims to guarantee a tenure of at least 1 year to those ACs that arealready working in the Punjab, the new recruits can only be allocated AC positions that areeither vacant (so the Policy doesn’t apply) or where the incumbent ACs have worked for atleast 1 year21.Figure A.3 presents evidence for the compliance of the Tenure/Transfer Policy. On the verticalaxis is the percentage of new recruits that are allocated Assistant Commissioner positions. Onthe horizontal axis is the tenure of the incumbent Assistant Commissioners, whom the newrecruits replaced. It also shows what percentage of the newly recruited were allocated AC jobsthat were already vacant. The first thing to note is that there is partial compliance with theTenure/Transfer Policy. New recruits have replaced ACs in the 3rd or even the 1st and 2nd
quarter of their AC tenure. This means that tenures of all ACs in this setting, despite thePolicy, are not perfectly predictable. In compliance of the Policy there is a spike at 1 yearas well as a spike for those ACs allocated vacant positions. Approximately 30 percent of newrecruits replace Assistant Commissioners that have worked for 1 year as an AC in a particularlocation. Around 12 percent and 2 percent replace ACs whose tenures have been 2 and 3 yearsrespectively. 18 percent are allocated AC positions that were already vacant. Taken together asystematically higher percentage of new recruits i.e. approximately 62% get allocated AssistantCommissioner jobs that are either vacant or where the incumbent AC’s tenure has been atleast 1 year. I discuss potential concerns stemming from my definition of cohorts as well as theendogenous supply of vacancies for PAS new recruits in section 11.2.
4 Theoretical Framework
In this section I present a simple theoretical framework to illustrate how supervisory discretionover workers’ promotions affects effort levels of workers. The principal i.e. the Chief Ministerwants to maximize expected tax collection by the workers and grants them promotions. Heobserves the types of the worker but cant observe effort. However, he can hire a supervisor whohas an information advantage and can observe both type and effort of the workers. Supervisorsare meant to refer the more productive worker for promotion to the CM. For simplicity insteadof referrals I assume that the supervisor has complete discretion over worker promotions andthe CM completely delegates the task to the supervisor. Although delegation of the promotiondecision helps the CM overcome information asymmetry there is the possibility of collusionbetween the supervisor and worker. Supervisor’s utility depends on reputation from beinglinked to the more productive workers and that makes his incentives in line with the CM.However, the supervisor can receive kickbacks or bribes from the workers for promotions and
21In this subsection when I refer to an AC vacancy, I am not referring to the vacancy against which freshrecruitment would be carried out by the FPSC. Instead I am referring to those tehsils that don’t have an AC asyet, as the S&GAD has not allocated that job to any civil servant, conditional on recruitment.
10
therefore, promote a worker despite observing low effort. We can think of kickbacks as monetaryor non-monetary favors that the workers can commit to for the supervisor.Supervisory discretion over workers’ promotion can have an ambiguous effect on effort by work-ers of different types. The higher the reputation gains from being linked to a productive workerthe better the chance of CM-supervisor incentive alignment, resulting in the first best effortand promotion decisions. However, if the reputation gains for the supervisor are low, effortdecreases for all types and promotions are not a function of effort of the workers.The framework illustrates the implications of using decentralized information for decision mak-ing within organizations. If reputation gains for supervisory tiers are not important thencentralized decision making might be a superior option than allowing discretion, despite theinformation loss it entails.
4.1 The set up
Consider a risk neutral Chief Minister (CM) that hires a risk averse worker to collect taxes. Theworker is of two types i ∈ {L,H}. Types are observable by the CM, however, effort is not. Taxesare random and can be y ∈ IR+ with probability ei and 0 with probability 1−ei where e ∈ [0, 1)and i ∈ {L,H}. The effort cost of type H is cH= e
θ where θ > 1 is an ability parameter. Theeffort cost of the low type is cL=el. The CM maximises expected taxes and grants promotionsto workers of both types. The agent does not directly care about taxes but effort increases theprobability of a higher tax collection and that results in promotions. Promotions are Ri ∈ IR+
where i ∈ {L,H}. Ri can be thought of as wages that workers can get at the higher position.The outside option of both type of workers is assumed to be zero for simplicity. As is the casein most bureaucracies rules protect the payoffs of the workers. The agent, therefore, has limitedliability i.e. the payoff of the worker is non negative in all states of the world. It is Ri ≥ 0 onobserving y and Ri ≥ 0 on observing 0 for i ∈ {L,H}.The CM can delegate the task of promotions and hire a supervisor from the market at theexogenous wage rate w ∈ IR+. The supervisor manages the workers and does not produce anyoutput. He observes both type and effort of the workers and promotes them for the CM. Thesupervisor’s outside option is zero for simplicity. The supervisor cares about his own reputationin the organisation. Repute is based on expected tax collection of the workers. However, thesupervisor can collude with the worker, receive kickbacks or bribes σi ∈ IR+, i ∈ {L,H} andpromote them despite observing low effort. For simplicity, reputation gains from expected taxcollection by the workers and kickbacks are assumed to be perfect substitutes for the supervisor.
4.2 Observable effort
The Chief Minister observes effort and grants promotions. His problem is:
maxeh,el,Rh,Rl
ehy −Rh + ely −Rl
subject to √Rh −
ehθ≥ 0 (1)
√Rl − el ≥ 0 (2)
where equation 1 and 2 are the participation constraints of H and L respectively.
11
Proposition 4.1. Under perfect information the effort level of the high type is higher than theeffort level of the low type e∗FBh >e∗FBl . Promotions are a function of the effort of each type andtherefore, the high type receive more promotions than the low type R∗FBh >R∗FBl . Moreover, asθ increases the effort and promotion of the high type goes up.
Proof. The proof is straight forward. The participation constraint of both H and L, equations 1and 2 respectively, will always bind. Otherwise the CM can reduce Rh and Rl a little, increasehis payoff and the agent will still accept the contract. Using the participation constraints andsubstituting for Rh, Rl in the objective function and maximizing with respect to effort results in
e∗FBh =yθ2
2 and e∗FBl =y2 . Using these values in the expressions for Rh and Rl gives R∗FBh =(yθ2 )2
and R∗FBl =(y2 )2. As θ increases so does the effort exerted by the H type as it is now cheaperfor him to exert effort. As effort eh increases so does promotions Rh.
4.3 Unobservable effort - without supervisor
In this case the Chief Minister maximizes expected taxes minus promotions subject to partici-pation, incentive compatibility and limited liability constraint of the worker.
maxRh,Rh,Rl,Rl
eh(y −Rh) + (1− eh)(0−Rh) + el(y −Rl) + (1− el)(0−Rl)
subject to √ehRh + (1− eh)Rh −
ehθ≥ 0 (3)
√elRl + (1− el)Rl − el ≥ 0 (4)
maxeh
√ehRh + (1− eh)Rh −
ehθ
(5)
maxel
√elRl + (1− el)Rl − el (6)
Rh, Rh ≥ 0 (7)
Rl, Rl ≥ 0 (8)
3 and 4 are the participation constraints, 5 and 6 the incentive compatibility constraints and 7and 8 are the limited liability constraints of H and L respectively.It is straightforward to see that if the limited liability constraint binds then only Rh, Rl = 0and Rh,Rl>0. In the good state of the world the CM would like to reward the agent so thatthe agent exerts effort. Moreover, if all the limited liability constraints for each type bind thenthe participation constraint is not satisfied. Therefore, Rh, Rl = 0 and Rh,Rl>0 whenever thelimited liability constraint binds.
Lemma 4.2. Either the participation constraint or the limited liability constraint for each typebinds.
Proof. See Appendix A.
12
Proposition 4.3. When the limited liability constraint does not bind for both types but partic-ipation constraint binds then Rh − Rh and Rl − Rl is such that the agent exerts the first bestlevel of effort.
Proof. See Appendix B
Proposition 4.4. If the limited liability constraint binds and the participation constraint doesn’t
bind, then promotions are the same for each type R∗CMh = R
∗CMl . The effort exerted by each
type is less than the first best level of effort e∗CMi < e∗FBi for i ∈ {L,H}. Under imperfectinformation the effort of the high type is still higher than the low type as θ > 1.
Proof. See Appendix C
When the CM cant observe effort he can condition promotions on observable taxes. On observing
y > 0 the CM grants R∗CMh = R
∗CMl = y
2 and on observing y = 0 he grants R∗CMh = R∗CMl = 0for H and L respectively. The high type exerts more effort as effort is cheaper for him. However,it is still not equal to the first best level.In the next subsection I will discuss the case of unobservable effort by the CM where he hiresa supervisor for promotion decisions. To compare equilibrium effort and promotions with andwithout supervisor I will focus on the more interesting case where, without a supervisor, thelimited liability constraint binds and the agent does not exert the fist best level of effort.
4.4 Unobservable effort - with supervisor
The CM decides whether to hire a supervisor at wage w. The supervisor on the other handobserves effort and type of the worker and has the following objective function:
maxeh,el,σh,σl,Rh,Rl
w + ehy + σh −Rh + ely + σl −Rl
subject to √Rh −
ehθ− σh ≥ 0 (9)
√Rl − el − σl ≥ 0 (10)
where equations 9 and 10 are the participation constraints of type H and L respectively. Usingsimilar arguments as before I know that the participation constraint of both type of workerswill bind. If not then the supervisor can increase his payoff by reducing promotions and theworkers will still accept. Expected tax collection and kickbacks are perfect substitutes for thesupervisor. Therefore, there will be a corner solution depending on the ratio of marginal benefitof e and σ versus the ratio of their marginal cost.
13
Proposition 4.5. If y > 1 then kickbacks σh, σl = 0 and workers exert the first best level ofeffort with e∗Sh >e∗Sl . As compared to the centralised decision making under the CM, hiring asupervisor increases effort for both type of workers e∗Si >e∗CMi for i ∈ {L,H}. Promotions arealso at their first best level and are a function of effort of the workers with R∗Sh > R∗Sl . The
CM hires a supervisor and the supervisor accepts the job if 0 ≤ w < y2(3θ2−1)2 .
Proof. If y > 1 =⇒ y > 1θ where θ > 1. Put simply if the supervisor would like the low type
to exert effort then it implies that he would also want the high type to exert effort since thecost of effort of the high type is lower than that of the low type. Intuitively, if y > 1 then thereare sufficient reputation gains from a higher expected tax collection by the workers. The ratioof marginal benefit of effort to kickbacks is higher than the marginal cost of effort to kickbacksfor both types. Thus, σh, σl = 0. Substituting this into the supervisor’s problem and using thefact that the participation constraints of both type bind I get:
maxeh,el,Rh,Rl
w + ehy −Rh + ely −Rl
subject to √Rh −
ehθ
= 0 (11)
√Rl − el = 0 (12)
Equations 11 and 12 give Rh = ( ehθ )2 and Rl = e2l . Using the expressions for Rh, Rl in thesupervisor’s objective function and maximizing with respect to eh, el I get the following FOC:
y − 2ehθ2
= 0 (13)
y − 2el = 0 (14)
This results in e∗Sh = e∗FBh = yθ2
2 and e∗Sl = e∗FBl = y2 , which suggests that the effort level
under a decentralized system of promotions will be higher than the effort level under a ChiefMinister led centralized promotion system i.e. e∗Si >e∗CMi . To be more precise e∗Si = 4e∗CMi
for i ∈ {L,H}. Using the expression for effort in promotions gives R∗Sh = R∗FBh =(yθ2
)2and
R∗Sl = R∗FBl =(y2
)2. This implies that R∗Sh > R∗Sl as θ > 1 and
∂R∗Sh∂θ > 0. Therefore, in
equilibrium we will see promotions by supervisors go up with ability. Moreover, there will be apositive promotion level even for the low type.When for both H and L, the limited liability constraint binds and the participation constraint
doesn’t bind, the expected utility of the CM without a supervisor is y2(θ2+1)16 . The expected
utility of the CM from hiring a supervisor is y2θ2
4 −w. Therefore, the CM will hire the supervisor
and the supervisor accepts the job if 0 ≤ w < y2(3θ2−1)2 .
Proposition 4.6. If 1θ < y < 1 then the high type exerts the first best level of effort and
σh = 0 whereas the supervisor grants promotions to the low type in exchange for kickbacks andel = 0. As compared to the centralized decision making under the CM, hiring a supervisorincreases effort of the high type while reducing the effort of low type i.e. e∗Sh = e∗FBi > e∗CMh
14
but e∗Sl < e∗CMl < e∗FBl . Promotions of both types of workers are positive with R∗Sh = R∗FBh ,R∗Sl = 1
4 . However, promotions of the high type are more than the promotions of the lowtype R∗Sh > R∗Sl as θ > 1. The CM hires a supervisor and the supervisor accepts the job if0 < w < y2(12θ2 − 1)− 1.
Proof. If 1θ < y < 1 then the ratio of marginal benefit of effort to kickbacks is higher than the
marginal cost of effort to kickbacks for the high type while it is the other way around for thelow type. Thus, σh = 0 and el = 0. Substituting this into the supervisor’s problem and usingthe fact that the participation constraints of both type bind I get:
maxeh,σl,Rh,Rl
w + ehy −Rh + σl −Rl
subject to √Rh −
ehθ
= 0 (15)
√Rl − σl = 0 (16)
Using equations 15 and 16 I get Rh =(ehθ
)2and Rl = σ2l . Using these in the principal’s
objective function and taking FOC I get:
y − 2ehθ2
= 0 (17)
1− 2σl = 0 (18)
This results in e∗Sh = e∗FBh = yθ2
2 and σ∗Sl = 12 . Using this in the expression for promotions
gives R∗Sh = R∗FBh =(yθ2
)2and R∗Sl = 1
4 . This implies that R∗Sh > R∗Sl as θ > 1 and∂R∗Sh∂θ > 0.
Therefore, in equilibrium we will see promotion by supervisors go up with ability, with a positivepromotion level even for the low type.When for both H and L, the limited liability constraint binds and the participation constraint
doesn’t bind, the expected utility of the CM from not hiring the supervisor is y2(θ2+1)16 . With
1θ < y < 1, the expected utility of the CM from hiring a supervisor is y2θ2
4 −14 − w. Therefore,
the CM will hire the supervisor and the supervisor accepts if 0 ≤ w < y2(12θ2 − 1)− 1.
Proposition 4.7. If y < 1θ , compared to a centralized decision making under the CM, hiring
a supervisor decreases effort of both types of workers to zero and e∗Si < e∗CMi < e∗FBi fori ∈ {L,H}. Only kickbacks are used to grant promotions. Promotions of both types of workersare positive and the same for high and low type of worker with R∗Sh = R∗Sl = 1
4 . The CM prefers
not to hire a supervisor in this case as y2(θ2+1)4 > −(12 + w) always holds with w, y, θ > 0
Proof. If y < 1θ then the ratio of marginal benefit of effort to kickbacks is lower than the
marginal cost of effort to kickbacks for both types. Thus, eh, el = 0. Substituting this into thesupervisor’s objective function and using the binding participation constraint of H and L I get:
maxσh,σl,Rh,Rl
w + σh −Rh + σl −Rl
15
subject to √Rh − σh = 0 (19)
√Rl − σl− = 0 (20)
Using equations 19 and 20 I get Rh = σ2h and Rl = σ2l . Using these in the principal’s objectivefunction and taking FOC I get:
1− 2σh = 0 (21)
1− 2σl = 0 (22)
This results in σ∗Sh = σ∗Sl = 12 . Using this in the expression for promotion gives R∗Sh = R∗Sl = 1
4 .
Moreover,∂R∗Sh∂θ = 0. Therefore, in equilibrium we will see promotion by supervisors to be
constant and the same for H and L. In this case using the supervisor for promotion decisions isworse than a centralized decision making system under the CM, despite the information loss itentails. In this case supervisory discretion over promotions just generate incentives for exchangeof kickbacks and no effort is exerted. When for both H and L, the limited liability constraintbinds and the participation constraint doesn’t bind, the expected utility of the CM without a
supervisor is y2(θ2+1)16 . With y < 1
θ , the expected utility of the CM from hiring a supervisor is−(12 + w). Therefore, the CM will never hire a supervisor when y < 1
θ as w, y, θ > 0.
5 Data
5.1 Seniority of entry-level job link
Seniority of entry-level job links is the 75th percentile of the official rank of all those civilservants that worked in the district, in the very first month that the new recruits joined thedistrict as an Assistant Commissioner for the first time. I only consider outcomes for the newrecruits and use the set of links to provide a source of variation.Ranks are referred to as grades in the Pakistani bureaucracy. All federal and provincial civilservants start their career in grade 17 with 22 being the highest grade. The data on rankor promotions of the network link is compiled from the career charts of civil servants whichI acquired from the S&GAD, Punjab (refer to appendix figure A.7 for an illustration of acareer chart). This data is not publicly available. Section 19 of the chart titled ‘date ofentry/promotion’ contains details of the rank and date of promotion. I use the promotion datein section 19 of the career charts to categorize changes in rank of all civil servants. Ranks incivil services range from 17-22. To aid interpretation I normalize promotions from 0-5 so thatthe variable promotion stays zero for a civil servant in grade 17. It is 1 when the civil servantis promoted to grade 18, 2 in grade 19, 3 in grade 20, 4 in grade 21 and 5 in grade 22.I provide an illustration of how I built the variable in figure 1. Consider a cohort of new recruitsthat finished training together i.e. A B C. Imagine from within that cohort, A is allocated anAC job in district 7. All these nodes are people who are already working there. I will classifythe actual set of links of new recruit A as all those civil servants that were working in dist 7 inthe very first month that A starts working in dist 7 as an AC. For completeness I also considerother new recruits B and C as part of A’s actual link. I freeze these set of links and only use thetime variation that comes from arguably exogenous changes in their official rank or seniority.The reason there is variation in the seniority of the set of links is because of the fact that allthese people that are working in dist 7 are at different points in their career trajectories. Some
16
have spent 4 yrs in rank 17 and so will be promoted next yrs. Others might have just beenpromoted to rank 18 and so they wont be promoted for a long time. This allows me to buildthe variable seniority of entry-level job links.
5.2 Seniority of potential entry-level job link
I use the Tenure/Transfer policy of the government to classify the instrument seniority of po-tential entry-level job link. It is a cohort level instrument and it is the 75th percentile of theofficial rank of all those civil servants that in the month of end of training of the new recruits,worked in a district where either any AC had already enjoyed a tenure greater than equal toone year or any AC position was vacant. For completeness it also includes those that finishedtheir training together. I only consider the set of direct links. As already discussed the date ofend of training of the new recruits is also exogenously determined by the Director General ofthe training institute. I only consider outcomes for the new recruits and use the set of links toprovide a source of exogenous variation in the seniority of job link.The set of links don’t change over time. The variation over time in the ‘potential’ set of joblinks, just like the ‘actual’ links, stems from a change in their official promotion. In the first stepI use the promotion date in section 19 of the career charts to categorize changes in rank of allcivil servants. As with the endogenous measure, to aid interpretation, I normalize promotionsso that the variable promotion stays zero for a civil servant in grade 17. It is 1 when the civilservant is promoted to grade 18, 2 in grade 19, 3 in grade 20, 4 in grade 21 and 5 in grade 22.In order to correctly classify the ‘potential’ entry-level job links it is important that I correctlyclassify the tenure of ACs already working in Punjab on the date of end of training of the newrecruits. In addition I need to have a correct classification of AC positions that are vacant onthat date. This classification needs to be not just for the set of civil servant ACs in my samplebut for the whole of Punjab. I reiterate that when I refer to vacancy I am not referring to jobsrequiring fresh recruitment by the FPSC but those AC positions to which an AC has not beenallocated by the S&GAD or the CM.For that purpose I collected incumbency board data from nearly all the AC offices in Punjab.Incumbency boards are placed in AC offices and contain the name of civil servants who actedas ACs in that location in the past as well as the dates on which they started and endedwork. Incumbency boards are a tradition inherited from the British colonial times. In the civilbureaucracy in Pakistan there is an incumbency board in nearly all of the offices. There isspecial attention paid by each civil servant to ensure his/her name is added to the list of pastcivil servants in any office and so the chance of error in the incumbency board information isvery low.To acquire the data all ACs in Punjab were telephonically contacted. 138 out of 141 ACoffices supplied their incumbency board pictures. These were then converted to electronic form.Appendix figure A.8 contains an example of an incumbency board. It can be seen that theBoard has the name of the office, name of the past ACs as well as the start and end date inday-month-year format. This allows me to build a daily tehsil level panel of AC offices and thetenure of civil servants that worked there. I classify those time periods when there was no AClisted in the incumbency board as vacant. This tehsil panel of vacancies and tenures of AC wasthen combined with the administrative data on new recruits to observe whether on the date ofend of training, the new recruit was allocated a vacant position or replaced an AC with a tenuregreater than equal to 1 year. Note that there will be a first stage only if the new recruit wasallocated an AC position that was either vacant or where the previous ACs tenure was greaterthan 1 year. These will be the set of compliers of the Tenure Policy. Any effect that I identifywill be the Local Average Treatment Effect (LATE) for the set of new recruits for whom the
17
seniority of entry-level job link changes as the seniority of potential entry-level job link changes.I provide an illustration of the variable in figure 2. Consider the same cohort of A B C thatwe had previously. I consider a time-line for an actual cohort that was recruited in 2005. InOctober 2005 they are recruited and they start their centrally administered academic training.In March 2007 they finish their academic training and begin their on the job training. 15th ofAugust 2007 is the end of their on the job training. On 16th August is when say one of thenew recruit starts working and that is when the actual set of job links are characterized. InAugust 2007, the month in which their training ends is when I classify the potential entry-leveljob links. Imagine there are 3 districts in Punjab districts 1, 7 and 10. In dist 1 there is neitheran AC vacancy and all AC that are working there have a tenure of ≤ 1 yr. So say a new recruitis allocated this position against the tenure policy this person will not be in my set of compliersin an instrumental variables strategy way. Civil servants in district 1 will not be part of thepotential job links of this cohort. However, since in district 7 there is a vacancy and in dist10 the tenure of one of the ACs is more than 1 yr then these 2 districts and all the peoplethat work there will be the set of potential entry-level job links for the new recruits A, B andC. I freeze the ‘potential’ entry-level job links in the month that training ended for the newrecruits. Time variation then comes through changes in their official seniority or rank of theselinks. The reason there is time variation is because these job links at different points in theircareer trajectory. Seniority of ‘potential’ entry-level job links is an IV for seniority of the actualset of entry-level job links.
5.3 Tax Performance
The performance measure is compiled from historical records of the provincial Board of Revenue(BOR) on Land Revenue/Agriculture Income Tax (AIT) from 1983-2013. The record is notpublicly available (see appendix figure A.4 for an illustration of the files in their original formas well as the record room from which they were extracted). The Punjab Agricultural IncomeTax (AIT) Act 1997 replaced the Punjab Land Revenue Act,1967. While land revenue was atax on area cultivated, AIT was meant to be a tax on the agricultural income of an owner in atax year. However, for all practical purposes it remained a tax on area sown (Nasim (2013)).Section 4 of AIT Act, 1997 states that every person:
a whose total agricultural income or the total agricultural income of any otherperson in respect of which he is assessable under this Act, for any incomeyear (hereinafter referred to as the said income year) exceeds the maximumamount22 which is not chargeable to tax under this Act; or (emphasis added)
b who himself or any other person on whose behalf he is assessable under thisAct, has, during the said income year, cultivated land measuring (i) fifty acresor more of irrigated land; or (ii) one hundred acres or more of unirrigated land;or (iii) irrigated and unirrigated land the aggregate area of which is equal to ormore than fifty acres of irrigated land, one acre of irrigated land being reckonedas equivalent to two acres of unirrigated land, shall file a return of his totalagricultural income or the agricultural income of such other person, as the casemay be, for the said income year in such form and by such date as may beprescribed.
In the rural economy of Pakistan agricultural income is very hard to track and document bythe authorities. On the other hand the revenue administration by law has to keep a detailed
22The Punjab Agricultural Income Tax Rules 2001 states that this threshold is Rs. 80,000.
18
record of land owned. Thus, the only one which is enforceable in practise is the one for whichthe revenue authorities keep a detailed record i.e. farmland owned.The BOR sets annual tax collection targets based on official record of size and number offarmlands and farm income. Targets are conveyed to various tiers of the government till theyreach the Assistant Commissioner and his/her team of revenue officers all the way down to the‘patwari’. Assistant Commissioners are supposed to report back the tax collected each monthagainst these annual targets. This gives me a performance measure for the newly recruited ACs:
Tax performance =Tax collected in the month
Annual tax target
Appendix figures A.5 and A.6 contain an example of the official form that I used to quantify taxperformance23. As can be seen there are two kinds of targets. One is for the current financialyear and the other is for arrears from all the past financial years. The two heads can be seenas ‘current’ and ‘previous’ in the form. For the purpose of this study I restrict attention tothe performance against targets set for the current financial year. Since the current financialyear is the main priority of the government, ACs expend more effort trying to meet thesetargets. Moreover, arrears collection is not just a function of the effort of the AC but otherfactors as well, for example, whether the landowners have left the district and can no longer betraced. Annual targets are provided in the column titled ‘demand’. Tax collected each monthis under the title ‘current recovery’ or under ‘recovery during the month’ . Appendix figure A.6shows that sometimes the District Account Officer also verifies the deposit of the taxes with thegovernment. It is interesting to note that tax collection is not part of the official performanceevaluation of the ACs.
5.4 Long run career progression: Informal promotions
To classify informal promotions I use the career charts of civil servants from the S&GAD,Punjab (refer to appendix figure ??). The section on ‘Service’ contains details of ‘post held’.If the notified grade of the ‘post held’ is higher than the official grade of the civil servant thenthe dummy variable of informal promotions turns on 1, it stays zero otherwise 24.
5.5 Ability
I use a proxy for pre-determined ability. I compile the ability measure from the Federal PublicService Commission’s intra-cohort ranking of civil servants based on the recruitment exam (CSSexam) of each cohort. I categorize ability as a dummy that turns on 1 for those civil servantsthat are in top (bottom) 10% of the civil services entrance exam ranking. It remains zerootherwise.
6 Descriptive Statistics
Table 1 shows descriptive statistics of the data. The dataset is a civil servant-month panel.‘New recruits’ category includes federal Pakistan Administrative Services (PAS) officers thatwere allocated Assistant Commissioner positions on entry. The ‘all civil servants’ categoryincludes PAS officers other than the new recruits as well as Provincial Management Services(PMS) officers.
23This form is part of the correspondence between the BOR and the ACs and DCs regarding taxes.24For some posts for which I was not sure of the notified grade I telephonically consulted civil servants in the
S&GAD Sometimes if a position had a notified grade of say 18/19 I picked the conservative one i.e. 18.
19

Table 1 shows that on average the new recruits have a slightly higher probability of beinginformally promoted as compared to other civil servants. New recruits have a 12.7 percentchance of being informally promoted while other civil servants have a 10.3 percent chance ofbeing granted an informal promotion in a month. They also collect more taxes on average in amonth than other civil servants. The new recruits collect on average 8.6 percent monthly tax asa percentage of the annual target. The other civil servants collect approximately 7 percent. Taxperformance appears to be a noisy measure. The standard deviation is approximately 14 fornew recruits Appendix figure A.9 shows the distribution of tax performance for both categoriesof civil servants.Seniority of entry level job link is the main endogenous explanatory variable. The seniority ofthe entry-level links is on average 0.2 and 0.8 for the early career of the new recruit as an ACand when we consider their full career respectively. Official rank was normalized to be between0 to 5. This suggests that the links that new recruits get on their entry-level job are not verysenior. There appears to be sufficient variation in the network measure in the early career asan AC. The standard deviation is 0.384. However, if we consider the complete career of newrecruits the standard deviation is 0.932.The CM secretariat is the office that is de facto responsible for the informal promotions of thecivil servants.25 The subset of links that are in the CM secretariat are relatively senior. Theaverage seniority is 0.4 for the early career of the new recruits, while it is approximately 1 whenwe consider the entire career of the new recruits.Seniority of the potential set of links is on average 0.2 and 0.6 for the early and complete careerof the new recruits. This again suggests that the potential links are also not very senior. WhenI consider those potential links that are working in the CM secretariat I again see that theyare relatively senior. On average the seniority of the potential link in the CM secretariat isapproximately 0.7 for the duration of the early career of the new recruit. It is approximately 1when I consider the full career of the new recruit.In my sample of PAS civil servants, other than the new recruit, I see that 2 percent are thosethat were in the top 10 percent of their cohort. Only 0.5 percent are in the bottom 10 percent.However, when I restrict the sample to new recruits 7% are in the top 10% of the recruitmentexam ranking and 14 percent are in the bottom 10%.To have another measure of performance I also compiled data on subjective performance eval-uation of the new recruit by their immediate supervisors. I quantify subjective performanceevaluation from the summary measures in the career charts of the civil servants (refer to ap-pendix figure A.7). I use the section on ‘Service’ and ‘ACR assessment’ in the career charts26. The variable subjective performance evaluation turns on 1 if the civil servant is rankedoutstanding. It remains zero otherwise. On average there is a 2.5% chance that other civilservants are ranked outstanding by their immediate boss. The new recruits in particular have ahigher probability of being considered outstanding. They have a 10% chance that they will beranked as an outstanding civil servant by their immediate boss. On average the data suggeststhat the new recruits collect more taxes and also get better subjective performance evaluationfrom their immediate boss.
25I included the Services and General Administration Department (S & GAD) in the definition of CM secretariatas the department is key in helping the CM make informal promotion decisions. S & GAD is also the main HRdepartment of the provincial government. Background details of civil servants are with the department.
26PERs were initially referred to as annual confidential reports (ACR).
20
7 Seniority of Job Link and Informal Promotions
Methodology
Picrt = κc + κr + κcr + κt + πJLicrt + εicrt (23)
Picrt = ξc + ξr + ξcr + ξt + αJLpcrt + νicrt (24)
equations 23 and 24 are the structural and reduced form equations. Picrt is the probability ofinformal promotion of the new recruit i, of cohort c, in rank r, in month t. κc, ξc are cohortfixed effects. κr, ξr are rank fixed effects. κcr, ξcr are cohort rank fixed effects. κt and ξt aremonth fixed effects. JLicrt, JL
pcrt is the seniority of the entry-level job links and seniority of
the potential entry-level job links of a new recruit AC i, of cohort c, in rank r, in month trespectively. εicrt, νicrt are the error terms clustered at the level of the cohort.The main coefficient of interest in the structural and the reduced form equations are π and αrespectively. π captures the local average treatment effect. It captures the effect on the setof compliers i.e. those new recruits for whom the seniority of the job link changes owing to achange in the seniority of the potential job link. On the other hand, α captures the intention totreat (ITT) effect i.e. the effect on informal promotions of being offered a senior set of potentiallinks. The variation exploited in the structural equation is within cohort across civil servantsover time. While the variation exploited in the reduced form is within cohort over time.
Results
Table 2 reports results for the effect of seniority of the link on career progression of new recruits.The dependent variable is informal promotions. Column (1) reports the first stage, column (3)the second stage, column (2) reports OLS and column (4) the reduced form. In all specificationsI include cohort, rank, cohort-rank and month fixed effect. The Angrist- Pischke F-stat for thefirst stage is 37 suggesting that the instrument doesn’t suffer from a weak instrument bias.In column (1) a one rank increase in the seniority of the potential job link leads to a 0.29 increasein the rank of the actual job link. The effect is precisely estimated and statistically significant.Column (3) reports the second stage. It shows that a one rank increase in the seniority of theentry-level job link leads to a 61% increase in the probability of getting informal promotions.The effect on informal promotions is nearly 5 times the mean.OLS results in column (2) shows that a one rank increase in the seniority of job links is associatedwith a 15% increase in the probability of informal promotions. The effect is highly statisticallysignificant and precisely estimated. A comparison of the OLS and IV results would suggestthat OLS is downward biased. It would seem to suggest negative selection i.e. those cohortswith a more senior set of actual links has a differentially lower probability of being informallypromoted than the one with junior links. That does not seem to be plausible. More thannegative selection, the high magnitude of the IV results are consistent with a local averagetreatment effect. The set of compliers in this setting are those civil servants for whom theseniority of the job link changes because the rank of the potential link changes i.e. these arethose civil servants that followed the tenure/transfer policy of the government. Since theseare the ones that follow the policy it suggests that they did not have many powerful outsidenetworks that could allow them to flout the rules. Thus, for these civil servants the first setof people that they work with are their first set of professional links within the organization.It is quite possible that for these set of people the seniority of the entry-level job link plays amuch more important role in their career progression than the average civil servant. Thus, the
21
high magnitude of the IV is a result of heterogeneous treatment effect. Reduced form resultsin Column (4) suggest that a one rank increase in the rank of the potential job link leads to an18% increase in the probability of informal promotions of new recruits. The effect is preciselyestimated.
8 Seniority of Job Link, Ability and Informal Promotions
In this section I will look at the heterogeneous effect of seniority of job links according to ability.Propositions 4.5 and 4.6 suggested that promotions through the supervisor are positive for bothhigh and low ability worker, however, they will be higher for the high than the low ability.Figure 3 presents descriptive evidence to that effect. The y-axis has the probability of informalpromotions, while the x-axis has seniority of potential job links. The red line reports the averageeffect for those in the top 10% of their cohort. The blue, pink, black and green line is the averageeffect for those at the 90th, 50th, 30th and the 10th percentile respectively. Consistent withtheoretical prediction, preliminary descriptive evidence suggests that a rise in the seniority ofthe entry-level link leads to a better career progression for the high ability. Although this isjust descriptive evidence it does appear striking given that this is the public sector within adeveloping country with little or no incentivizing tools and a huge potential for the nepotistrole of links. However, despite the fact that promotions are higher for high ability workers, astheory suggests this doesn’t necessarily suggest that links play an efficiency enhancing role. Itis possible that there is collusion and the better career progression of the higher ability is theresult of collusion at the supervisor-worker level. Below I explore the heterogeneous effect inmore detail.
Results
Table 3 presents results of the heterogeneous effect of seniority of job link on career progressionof new recruits. The ability measure capture both the top and bottom end of the abilitydistribution. Top (bottom) 10% are those civil servants that were in the top (bottom) 10%of their cohort in the recruitment exam. Column (1), (3), (5) (7) report results including theability measure as explanatory variables in addition to the seniority of (potential) job link, whilecolumn (2), (4), (6) and (8) contains the interaction effect of ability and seniority of (potential)job link. Column (1) and (2) report the first stage, column (3) and (4) OLS, (5) and (6) reportIV results and (7) and (8) report the reduced form results. The F-stat in all the first stage incolumn (1) and (2) are greater than 35 on average. This suggests that the estimates don’t sufferfrom a weak instrument bias.OLS results in column (4) suggest that seniority of job link does have a heterogeneous effectaccording to ability. Consistent with the descriptive evidence presented earlier, a one rankincrease in the seniority of job link is associated with a 15% increase in the probability ofinformal promotions, however, the effect is 25% for those that are in the top 10% of theircohort. The effect is differentially lower for those that are in the bottom 10% of their cohort,however, the effect is not statistically significant.Reduced form results in column (8) suggest a similar effect. A one rank increase in the seniorityof the potential link leads to a 17% increase in the probability of informal promotions for thenew recruit, however, the effect is 14% more for the top 10%. Interestingly, the top% have a5% negative probability of being informally promoted without a senior set of potential links.However, the top 10% have a 9% probability of being informally promoted if they also have asenior set of links. Thus, seniority of entry-level job links lead to a better outcome for the top10%. The bottom 10% have a differentially negative probability of being informally promoted
22
as their links rise in rank in the organization. However, the effect is not precisely estimated orstatistically significant. The bottom 10% have a 17% chance of being informally promoted andit is the same as the mid 80%. Thus, consistent with theory both the top and the bottom 10%have a positive probability of being informally promoted. However, the top 10% have a higherprobability of being informally promoted as their link rises in seniority within the organization.The second stage results in column (6) suggest that the top 10% have a 6% differential probabil-ity of being informally promoted as their link rises in seniority. However, the effect is impreciselyestimated and not statistically significant. Same is the case with the bottom 10%. The bottom10% have a differentially negative effect of the seniority of the job link. A one rank increase inthe seniority of the job link leads to a 22% decrease in the probability of informal promotions forthe bottom 10%. However, the effect is not statistically significant. Interestingly, the bottom10% have a lower chance of being informally promoted as their link rises in seniority, while thetop 10% have a positive probability of being informally promoted with the seniority of theirlink.Overall the results in table 3 suggests that as the link rises in seniority it allows the more ablecivil servants to have a better career trajectory. The efficiency aspect of this remains to beinvestigated further. What causes these heterogeneous effects? It is possible that this is theresult of simple human capital externalities from the senior set of links to the new recruits anda consequent better performance at the lower tiers resulting in better career trajectory for thenew recruits. However, consistent with the theoretical model, it is equally possible that this isthe result of information provision by the link to the CM and that results in the high abilityrising faster. In the next section I investigate the direct effect of the seniority of the job link onearly career performance of civil servants.
9 Seniority of Job Link and Performance
This section sheds light on the early career incentives of new recruits as their links rise in theorganization. I directly tested whether seniority of job links determine allocation of new ACpositions to new recruits. I find that seniority of links has no linkage with AC job allocations.This gives me some confidence in saying that the performance results below work along theincentive rather than the selection margin.I investigate the effect of the seniority of the job link on the distribution of early career per-formance of civil servants. I implement quantile regression estimates using standard methodsdescribed in Koenker (2005) and Parente & Santos Silva (2016) and express the quantiles ofthe conditional distribution as linear functions of the independent variables. I implement thequantile regression estimates with fixed effects following Canay (2011) that proposes a simpletransformation of the data that gets rid of the cohort effects under the assumption that theseeffects are location shifters27.
Methodology
I estimate the conditional distribution of tax performance of new recruit AC i, of cohort c, inmonth t as a percentage of target set by the BOR, at different quantiles, θ. I therefore estimatethe following specification:
Quantθ(yict|.) = γc + γt + µθJLict + δexpict + κexp2ict (25)
27Following Canay (2011) I use the residuals of a regression of tax performance on cohort fixed effects, experienceand experience2 as the explanatory variable.
23
Quantθ(yict|.) = ρc + γt + πθJLpct + υexpict + φexp2ict (26)
Equations 25 is the quantile regression while equation 26 is the reduced form quantile treatmenteffects. yict is tax performance of new recruit AC i, of cohort c, in month t as a percentage oftarget set by the BOR. γc, ρc are cohort fixed effects. γt, ρt are month fixed effects. µθ is thequantile specific effect of the seniority of the entry-level job link on the θ quantile of the taxperformance distribution of the new recruit. πθ is the quantile specific effect of the seniority ofthe potential entry-level job link on the θ quantile of the tax performance distribution of thenew recruit. JLict, JL
p, expict, exp2ict are as described earlier.
Results
Table 4 presents the quantile regression estimates and figure 4 plots the coefficient and confidenceinterval. Table 5 reports the reduced form quantile treatment effects while figure 5 plots thecoefficient and confidence interval. The performance distribution is conditional on experience,month and cohort fixed effects. I consider all deciles from 10th to the 90th. Bootstrappedstandard errors with 1000 replications are reported in parenthesis. All standard errors areclustered at the cohort level. Column (1) in both tables report the mean effect while columns(2) - (10) present the quantile effects. Since tax performance is only measured in the first partof the civil servant’s career when they work as ACs, there are only 1479 observations which isa significant drop from the previous results.Column (1) of table Table 4 presents the mean effect. A one rank increase in the seniorityof the job link is associated with a 1.75% reduction in tax collected by new recruits in amonth. However, the effect is not statistically significant. Moreover, there also appears to beno heterogeneous effect across the performance distribution. Table 4 and figure 4 show thatthe seniority of job link has no effect on the performance distribution. All confidence intervalsinclude zero. The quantile regression coefficients are descriptive and do not have a causalinterpretation. I therefore, consider the reduced form effects in Table 5 and 5.The quantile treatment effect report a different result from the quantile regressions. Column(1) of table 5 reports the mean effect. It shows that a one rank increase in the seniority ofpotential job link leads to a 1% increase in tax performance. However, the effect is impreciselyestimated and not statistically significant. A clearer illustration of the quantile effects can beseen in figure 5. On the x-axis I have quantiles and on the y-axis is the quantile specific effect ofthe seniority of the potential job links on the performance distribution. The mean effect masksheterogeneity of the effect across the performance distribution.Results in figure 5 suggests that the seniority of the potential job link has a scale effect andincreases the dispersion of the distribution of the tax performance. A one rank increase in theseniority of the potential job link leads to a negative and statistically significant effect at the10th quantile all the way till the 70th quantile, while it has a positive effect at the 80th and90th quantile of the tax distribution. However, the effect at the 80th quantile is not statisticallysignificant. In other words, changes in seniority of the potential job link results in an increasein inequality in performance with the lower and middle of the performance distribution shiftingfurther left and the higher tail shifting right-wards. The results are consistent with proposition4.6. While the high ability increase effort, owing to the possibility of collusion, promotionsthrough supervisors can result in the low ability worker reducing effort.
24
10 Mechanism: Productivity spillover or referral for promo-tion?
Productivity spillovers and referrals for informal promotion can be the two major channelsthrough which seniority of the entry-level job link affects performance of the new recruit. Re-ferrals can generate career incentives and affect performance as discussed in the theoreticalframework and as seen in section 9 . On the other hand productivity spillovers from the moresenior colleague can result in a reduction in the cost of effort and thus, increase effort on thejob.In this setting productivity spillovers appear to be a less plausible reason for the effect onperformance in section 9. First, if productivity spillovers are at work then it ought to have anon-increasing effect on the cost of effort and hence on performance. However, the quantiletreatment effects suggest that a rise in seniority of the link leads to a fall in performance fromthe 10th to the 70th quantile.Second, seniority is based on the official rank of the entry-level job links. For the most partthis official rank follows a predetermined, rigid set of rules based on years of experience andmandatory training28. Seniority of job link is not smooth and changes at fixed times in thecivil servant’s careers (see appendix figure A.2 for details). If it is learning or productivityspillovers from the more senior set of links, it remains unclear why this spillover takes place insuch discontinuous fashion.To shed light on a possible mechanism I compile a measure of the seniority of the subset of linksthat work in the CM secretariat. Officers working in the CM secretariat are no longer workingwith the new recruits in the district offices. They work in the provincial capital. Moreover,since the CM makes nearly all the decisions regarding informal promotions of civil servants,the CM secretariat consists of civil servants that help him make those decisions. It is the officethrough which case files of informal promotions are routed. Having a senior link in the CMsecretariat means the link can refer the worker for informal promotions to the CM. However,despite the distance there is still the possibility of productivity spillovers, potentially throughinformal channels.I use the ‘service’ section of the career charts (refer to appendix figure A.7) and observe whetherthe link was working in the CM secretariat. I then compile the seniority of the entry-level joblink in a similar fashion as before restricting them to those links that work in the CM secretariat.
10.1 Seniority of Job Link in CM Secretariat and Informal promotion
Methodology
Picrt = θc + θr + θcr + θt + ωJLicrt + eicrt (27)
Picrt = ηc + ηr + ηcr + ηt + φJLpcrt + uicrt (28)
equations 27 and 28 are the structural and reduced form equations. Picrt is the probability ofinformal promotion of the new recruit i, of cohort c, in rank r, in month t. θc, ηc are cohortfixed effects. θr, ηr are rank fixed effects. θcr, ηcr are cohort-rank fixed effects. θt and ηt aremonth fixed effects. JLicrt, JLpcrt is the seniority of the entry-level job links and seniority ofthe potential entry-level job links in the CM secretariat. eicrt, uicrt are the error terms clustered
28As already discussed for the higher grades it also includes a score on efficiency index.
25

at the level of the cohort. The main coefficient of interest in the structural and the reducedform equations are ω and φ respectively.
Results
As a first step I test whether the seniority of these subset of links has an effect on the probabilityof informal promotions. Table 6 reports the results. Column (1) reports the first stage, column(3) the second stage and column (2) and (4) report the OLS and reduced form respectively. Inall specifications I control for cohort, rank, cohort-rank and month fixed effect. The numberof observations are less than before as I am restricting to a subset of links. Thus, there is lesspower to detect an effect than before. The Angrist-Pischke F-stat in column (1) is 14 which isnot as high but still suggests that the instrument does not suffer from a weak instrument bias.OLS results in column (2) suggest that a one rank increase in the seniority of a job link thatworks in the CM secretariat is associated with an 8% increase in the probability of informalpromotions. Second stage results in column (3) suggests that a one rank increase in the seniorityof the job link that works in the CM secretariat results in a 25% increase in the probabilityof informal promotions. However, the result is not statistically significant. The reduced formresults in column (4) are also marginally significant. A one rank increase in the seniority ofpotential job link in the CM secretariat leads to a 3% increase in the probability of informalpromotions. In the next subsection I explore the heterogeneity of the effect across differentability levels.
10.2 Seniority of Job Link in CM Secretariat, Ability and Informal promo-tion
Similar to 3, figure 6 presents descriptive evidence to that effect. The y-axis has the probabilityof informal promotions, while the x-axis has seniority of potential job links in the CM secretariat.The red line reports the average effect for those in the top 10% of their cohort. The blue, pink,black and green line is the average effect for those at the 90th, 50th, 30th and the 10th percentilerespectively. Consistent with theoretical prediction as well as the main results in section 8,preliminary descriptive evidence suggests that a rise in the seniority of the potential entry-levellink that works in the CM secretariat leads to a better career progression for the high ability.Below I explore the heterogeneous effect in more detail.
Results
Table 7 reports results similar to table table 3. However, I restrict the set of links to those thatwork in the CM secretariat. The ability measure is again the top and bottom end of the abilitydistribution. Top (bottom) 10% are those civil servants that were in the top (bottom) 10%of their cohort in the recruitment exam. Column (1), (3), (5) (7) report results including theability measure as explanatory variables in addition to the seniority of (potential) job link, whilecolumn (2), (4), (6) and (8) contains the interaction effect of ability and seniority of (potential)job link. Column (1) and (2) report the first stage, column (3) and (4) OLS, (5) and (6) reportIV results and (7) and (8) report the reduced form results.OLS results in column (4) suggest that seniority of job link in the CM secretariat does nothave a heterogeneous effect according to ability. A one rank increase in the seniority of joblink is associated with a 6% increase in the probability of informal promotions. The effect isdifferentially positive for both the top and bottom 10%. However, the differential effect is notstatistically significant.
26
Columns (5) and (7) suggest that the introduction of ability does not change the main effect intable 6. The more interesting results are in columns (6) and (8). Column (6) show that a onerank increase in the seniority of the job link in the CM secretariat leads to a 27% differentialincrease in the probability of informal promotions of the top 10% civil servants. The effect forthe bottom 10% is positive but not statistically significant. Interestingly those top 10% civilservants that do not have a senior set of links in the CM secretariat have a negative probabilityof being informally promoted. However, they have an overall 5% probability of being informallypromoted as their link in the CM secretariat rises in seniority. The trend remains the samewhen I consider the reduced form results in column (8). The top 10% with a junior set oflinks in the CM secretariat have a negative probability of being informally promoted. However,the overall effect is positive for those top 10% civil servants whose link rises in seniority whileworking in the CM secretariat. Overall the results in table 7 suggest that as the link in theCM secretariat rises in seniority it allows the more able civil servants to have a better careertrajectory. However, whether it is the result of referrals or simple productivity spillovers is stillnot clear. The following section considers the effect of seniority of the link in the CM secretariaton the performance distribution of the new recruits.
10.3 Seniority of Job Link in CM Secretariat and Tax performance
In this section I look at the direct effect on the tax performance distribution of the seniorityof the entry-level job links in the CM secretariat. I re-define the (potential) job links as the75th percentile of the subset of (potential) entry-level job links that are currently working inthe Chief Minister’s (CM) secretariat. The CM secretariat makes de facto decisions regardinginformal promotions of civil servants.
Methodology
Below I implement quantile regression estimates using similar methods as discussed in section9. As before I express the quantiles of the conditional distribution as linear functions of theindependent variables. I estimate the conditional distribution of tax performance of new recruitAC i, of cohort c, in month t as a percentage of target set by the BOR, at different quantiles,θ. I therefore estimate the following specification:
Quantθ(yict|.) = αc + αt + βθJLict + γexpict + κexp2ict (29)
Quantθ(yict|.) = φc + φt + τθJLpct + πexpict + µexp2ict (30)
Equations 29 is the quantile regression while equation 30 is the reduced form quantile treatmenteffects. yict is tax performance of new recruit AC i, of cohort c, in month t as a percentage oftarget set by the BOR. αc, φc are cohort fixed effects. αt, φt are month fixed effects. βθ is thequantile specific effect of the seniority of the entry-level job link in the CM secretariat on the θquantile of the tax performance distribution of the new recruit. τθ is the quantile specific effectof the seniority of the potential entry-level job link in the CM secretariat on the θ quantile ofthe tax performance distribution of the new recruit. I control for expict, exp
2ict are as before.
JLict, JLpct is the seniority of the entry-level job links and seniority of the potential entry-leveljob links in the CM secretariat respectively.
27
Results
Table 8 presents the quantile regression estimates and figure 7 plots the coefficient and confidenceinterval. Table 9 reports the reduced form quantile treatment effects while figure 8 plots thecoefficient and confidence interval. The performance distribution is conditional on experience,month and cohort fixed effects. I consider all deciles from 10th to the 90th. Bootstrappedstandard errors with 1000 replications are reported in parenthesis. All standard errors areclustered at the cohort level. Column (1) in both tables report the mean effect while columns(2) - (10) present the quantile effects. Since I restrict it to the set of links that work in the CMsecretariat the observations drop and I lose a bit of power.The more interesting results are the reduced form quantile effects in Table 9 and figure 8. Similarto table 5 and figure 5, a one rank increase in the seniority of the potential job link leads to anegative and statistically significant effect at the 20th quantile all the way till the 70th quantile.However, unlike the previous results, the effect at the top end of the distribution is negativeand highly imprecisely estimated. In other words, changes in seniority of the potential job linkresults in a scale effect and increases the dispersion of the distribution of the tax performance.However, it is owing to a left-ward shift of the performance distribution with no effect on thetop end.
Discussion
The results in section 10 suggest that productivity spillovers does not appear to be the mech-anism through which seniority of job links has an effect on performance. First, productivityspillovers seem less plausible from links that are working far off in the provincial capital. Sec-ond, productivity spillovers should be smooth over the career of civil servants and it seemsless plausible for them to change discontinuously with the official promotion of the entry-levellinks. Third, the reduced form quantile treatment effects show that a rise in the seniority of thepotential link leads to a reduction in performance at almost all quantiles of the performancedistribution. If it were productivity spillovers then performance effects would have been non-negative in the least. Note that I am not considering the act of moving away of the link, whichcan result in a reduction in productivity spillovers. The variation I am exploiting is the effectof a rise in seniority of the links that have already moved to the provincial capital to work inthe CM secretariat. Productivity spillovers cannot explain a negative effect of the rise in se-niority of the potential link in the CM secretariat. Fourth, although the effect at the top end ofthe distribution is imprecisely estimated assuming that the effect really is zero, if productivityspillovers was the mechanism then we should have seen a positive effect at the top end of thedistribution and that could have then been argued to have resulted in a rise in informal promo-tions. However, in table 7 I see that the high ability have a differentially positive probabilityof being informally promoted with a rise in the seniority of their job link despite the fact thatthe top end of the performance distribution did not have a positive performance effect. Over-all, it seems less plausible that productivity spillovers are the main mechanism through whichseniority of job links has an effect on performance. What seems more plausible is referrals forpromotions by the entry-level links. Referrals only for the top 10% could plausibly generatenegative incentives at other parts of the performance distribution.
28
11 Robustness Checks
11.1 Multitasking and the validity of the tax performance measure
Targets set by the BOR are based on official record of number of farmlands and farm incomesin the district and are independent of the unobservable characteristics of the new recruits. Ilater show that targets set by the BOR are orthogonal to the networks measure.The concern with this measure is that with miscellaneous responsibilities there could be multi-tasking problems. For instance, rank of networks might reduce tax collection but it could be aresult of the AC shifting effort towards other responsibilities. Despite limitations, tax collectionis a reasonable measure of performance for this study. First, any effect on tax performanceconveys information about behaviourial responses to changes in mean network rank. This hassignificant policy implications. In 2009-2010 in Pakistan while agriculture accounted for 21% ofthe GDP the cumulative collection of AIT was less than 1% of the total Nasim (2013). Moreover,Pakistan’s tax to GDP ratio was a mere 9.45 per cent in 2015. Though this study might notbe able to examine how civil servants substitute between tasks in response to networks, it stillhighlights that developing countries like Pakistan that want to increase tax collection cannotdiscard the incentive effects of workplace networks. Second, in any case revenue collection is oneof the core function of the office of the Assistant Commissioner. ACs entire team, particularlypost 2001, comprises of revenue officers whose main raison d’etre is revenue. Third, this functionis the only one that was not subject to major reforms throughout my sample period. Fourth,below I provide some evidence for the underlying assumption that performance on all measuresis positively correlated.Fifth, of all the set of tasks this is the most objectively measurable.(subject to the same caveats as PP studies that then reward the more objectively verifiabletasks.In some sense the arguments for the use of tax collection as a performance measure are not farfrom the way that teachers found actively teaching in class are considered a measure of teacherperformance (Kremer et al. (2005);Muralidharan & Sundararaman (2009, 2013); Duflo, Hanna& Rya (2012), Duflo et al. (2015)). Teachers dont just teach. In the production of learning,teachers write exams and assignments, provide feedback, organise extra-curricular events, holdmeetings with parents and administration. However, active teaching is still considered a validmeasure as it is objectively measured, forms a major part of the teacher’s overall set of tasksand provides useful information on behaviourial responses to incentives.
11.1.1 Relationship of tax performance and other measures of performance andability
Since there is multitasking in the context, for the performance measure to capture anythingmeaningful it has to be at least positively correlated with other aspects of performance. Column(1) and (2) of Table 10 reports the association between the objective and subjective measureof performance i.e. tax collection and performance evaluation of the new recruit by his or herimmediate boss respectively. To be clear performance evaluation is a dummy that turns on1 if the civil servant is ranked outstanding by the immediate boss. It remains zero otherwise.Column (1) does not control for civil servant or year fixed effects. It shows that a 1% increase inthe tax performance is correlated with a 0.001 increase in the subjective performance evaluationof the new recruit by the immediate boss. The effect doesn’t change in magnitude when Iinclude civil servant and year fixed effects, however, it does become more precisely estimatedand statistically significant. The magnitude of the correlation is not very large. However,despite the low magnitude Table 10 does suggest that the tax performance captures somethingabout performance of the new recruit.
29
Revenue court performance is the revenue court cases decided by the AC as a percentage of totalcases pending in a month. I observe court performance of all civil servants for 489 civil servant -months. However, there are just 66 observations for new recruits. The correlation presented hereis for all civil servants including new recruits for whom I have the tax performance data. Thetotal overlap between the tax performance and revenue court performance is 123 observations.Column (3) of Table 10 doesn’t control for civil servant and year fixed effects and exploits acrosscivil servant-time variation. Column (3) shows that a 1% increase in targeted tax collection bythe new recruits is associated with a 0.346% increase in the revenue court cases decided by theAC as a percentage of total cases pending in a month. However, the effect drops to 0.167 andis imprecisely estimated when I exploit within civil servant-year variation in Column (4).Table 11 aims to provide further evidence in support of the use of tax collection as a measure ofperformance. In this table I test whether the objective and subjective measures of performanceare positively correlated with ability. As before, I classify ability through the intra-cohortranking of civil servants. Top 10% is a dummy that turns on 1 for those civil servants thatare in top 10% of their cohort in the civil services entrance exam ranking. It remains zerootherwise. Table 11 column (1) suggests that for those civil servants that are in the top 10% ofthe entrance examination the chance that they will be ranked outstanding by their immediatebosses is almost 11%. The effect is precisely measured and is statistically significant at the 1%level. In the case of tax performance the top 10% on average collect 3.148% more taxes in amonth as a percentage of the annual target set by the BOR. The effect is precisely estimatedand statistically significant at the 1% level.Results in column (2) suggests that in a year the top 10% collect approximately 36% moretaxes than the bottom 90%. This is no trivial amount. This suggests two things. First, themethod of selection of the new recruits is not completely useless and the exam rankings are agood predictor of on-the-job performance of civil servants. Those that are ranked higher alsoperform better on the job both in terms of objective and subjective performance evaluation.Second, the performance measures I use in the study carry meaningful information.
11.1.2 Subjective Performance Evaluation and Network Rank: Quantile Regres-sion Estimates
The previous subsection showed that tax collection and other measures of performance arepositively correlated. Here I aim to test whether the results in Section 9 are specific to taxperformance or whether they are robust to using other measures of performance like subjectiveperformance evaluation.It is worth stating that since it can be presumed that a civil servant with a more senior set of linkswill potentially enjoy an overestimated subjective performance evaluation by their immediatebosses, any negative effect I estimate is potentially an underestimate of the true performanceor any positive effect an overestimate. Moreover, for the same reason, negative estimates arepotentially more credible than a positive effect.
Methodology
Using a similar methodology as in Section 9, I estimate the conditional distribution of subjectiveperformance evaluation of new recruit AC i, of cohort c, in month t at different quantiles, α. Itherefore estimate the following specification:
Quantα(PERicrt|.) = µc + µr + µcr + φαJLicrt + βexpicrt + κexp2icrt (31)
Quantα(PERicrt|.) = ξc + ξr + ξcr + ταJLpcrt + χexpicrt + ψexp2icrt (32)
30
where equations 31 and 32 are the structural and reduced form equations. µc, ξc are cohort fixedeffects, µr, ξr are rank fixed effects and µcr, ξcr are cohort-rank fixed effects. φα is the quantilespecific effect of the seniority of job link on the α quantile of the subjective performance evalu-ation distribution. τα is the quantile specific effect of the seniority of the potential job link onthe α quantile of the subjective performance evaluation distribution. JLicrt, JL
pcrtexpicrt, exp
2icrt
are as described earlier.
Results
Table 12 reports the estimates of the seniority of job link on performance evaluation. Asa benchmark, the effect of the seniority of job link on the mean of the subjective evaluationdistribution is presented in the first column of Table 12. Column (2) - (10) of Table 12 report thequantile regression estimates at different quantiles of the performance evaluation distributionconditional on experience, experience2, cohort, rank and cohort*rank fixed effects. Figure 9plots the quantile regression coefficients along with the confidence intervals. I consider alldeciles from 10th to the 90th. Bootstrapped standard errors with 1000 replications are reportedin parenthesis for the quantile regressions. All standard errors are clustered at the cohort level.Results in Table 12 suggest that the effect of the seniority of job link on performance evaluationis not very different from that on tax performance. The effect on the mean of the performanceevaluation distribution is negative but not statistically significant. Seniority of job link appearsto have a scale effect and increase the dispersion of the subjective performance evaluation dis-tribution. Column (2) - (8) shows that a one rank increase in the actual network leads to areduction in the probability of being evaluated outstanding by the immediate boss. In all casesthe effect is precisely measured and highly statistically significant. Column (10) of Table 12suggests that there is a positive effect of network rank on the 90th quantile of the performanceevaluation distribution, however, the effect is imprecisely estimated and not statistically signif-icant. Figure 9 shows that only the confidence intervals of 80th and 90th quantile estimatescontains zero.The reduced form estimates for subjective performance evaluation are presented in Table 13.The results presented in this table further provides support to the use of tax performance as ameasure of performance. A thing that remains unchanged is that the seniority of potential joblink leads to an increase in dispersion of performance, be it measured through tax collected orsubjective performance evaluation. Column (1) shows that the effect of seniority of potentialjob link on the mean of the subjective performance evaluation distribution is negative andstatistically significant. A one rank increase in the seniority of potential job link leads to areduction in the probability of being evaluated as outstanding by the immediate boss of 8percentage points. Column (2) - (8) of Table 13 suggests that the reduced form estimates arelarger in magnitude than the results in Table 12. In column (9), however, we get a differentresult at the 80th quantile. A one rank increase in the seniority of potential job link leads toa reduction in the probability of being ranked outstanding by the immediate boss of 1% at the80th quantile of the performance evaluation distribution. Column (10) Table 13 suggests thatsimilar to Table 12, the magnitude of the reduced form effect is positive at the 90th quantile.However, the effect is more imprecisely estimated in the reduced form. Figure 10 shows theimprecision of the estimates at the 90th percentile. In the reduced form only the confidenceintervals of the 90th quantile contains zero.
11.1.3 Tax targets and network rank
In this subsection I test whether the seniority of the (potential) entry-level job link has anycorrelation with the annual tax targets set by the Board of Revenue. All specifications in
31
Table 14 control for experience and cohort and time fixed effects. Results in Table 14 suggeststhat there is some correlation between the endogenous measure seniority of job link. However,when I control for job location fixed effect that too becomes insignificant. Columns (3) and (4)suggest that there is no correlation between seniority of potential job link and tax target. Thisholds whether or not we control for job location (tehsil) fixed effects. Table 14 provides furthersupport to the validity of the use of the tax performance as a measure of performance.
11.2 Definition of cohorts
I consider each cohort as those new recruits that have completed their UT period together andnot those that took the CSS exam together. The reasons for using such a classification areas follows. First, the set of districts that have AC vacancies (used to categorize the potentialentry-level job links) could be drastically different from month to month. Considering a,b,c andx,y,z as one cohort will create issues of the month (of end of training) to pick to classify the‘potential’ links with the results potentially being sensitive to the choice made. In addition, theset of AC positions with tenure greater than or equal to one year can also potentially changewith the addition of a month or so. Second, for the most part the reason for the staggered endof the training period is administrative and based on coordination between different governmentagencies. Third, another reason for the observational difference in end of on-the-job trainingfor cohorts are those civil servants which the bureaucracy refers to as ‘repeaters’. These civilservants retake the CSS exam to change their group from say Foreign Service of Pakistan toPakistan Administrative Services29. Since these civil servants have already gone through theCommon Training at the Civil Services Academy (CSA), Lahore and just have to complete theSpecialised Training for their newly allocated group, they end up starting and completing theon-the-job training quicker than the rest of their cohort. For instance, consider the 34th cohortin 2006 (see appendix figure A.1). Those that end their on-the-job training at the beginningof 2008 are repeaters followed by the rest of the cohort that end their training near the end of2008. Since I exploit within cohort variation in ‘potential’ networks in my main specification, ifI used CSS exam as a cohort identifier I would be identifying an effect based on a comparisonof repeaters and the others, something that my classification of cohorts avoids altogether.I would, however, still want to flag a few concerns with my classification of cohorts. It isreported that sometimes civil servants delay completing the training reports and that can be afactor leading to a delay of notification of end of training. This, unlike the administrative delay,can be problematic in so far as civil servants can delay the end of the training to ensure that acertain job location becomes part of his/her potential set of jobs he/she can select into. WhileAC vacancies in different districts is more or less centrally determined by senior civil servantsor CM and less easily predicted, the bigger issue can be the tenure of the incumbent AssistantCommissioners. For instance, if a new recruit would really like to be allocated an AC positionin Lahore and he/she knows that the current AC is nearing the 1 year tenure and so there is ahigher chance that the AC can be replaced. By delaying the submission of the training reportshe/she can ensure that Lahore is at least part of the set of potential districts, thereby, increasinghis/her chances of being allocated Lahore.There are a number of reassuring aspects of the civil services that reduce my concerns here.First, though the new recruit can delay their reports, whether it results in an actual delay in
29While retaking the exam gives the impression that these civil servants were systematically of a lower abilitythan the regular cohorts that is not necessarily the case. ‘Repeaters’ are those civil servants that earlier tookthe exam and didnt get the group they wanted owing to a lower merit position. They then retook the exam andqualified for a group of their choice eg. PAS. However, in the regular cohorts there are those who never qualifiedfor the civil services earlier, thereby, potentially being of a lower ability than the ‘repeaters’. In addition, if examranking is any criteria of ability many ‘repeaters’ are ranked higher than others in their cohort.
32
the end of their training is not certain. There have been cases when the new recruits have notcompleted the reports and yet their training have been terminated by the training institute (seeappendix figure A.10). Second, new recruits cannot delay the end of the training forever. Alook at the dates of the end of the training in appendix figure A.1) suggests that most of theend dates are clustered together. It is still in the hands of the Director General of the traininginstitute. Third, neither the vacancy creation process nor the tenure of the incumbent ACs areentirely predictable. Figure A.3 suggests that the Tenure Policy for Assistant Commissioners isnot perfectly enforced. Whether an incumbent AC completes his/her tenure at a post or whetherhe is replaced with another even before that time is decided by S&GAD or the CM. Therefore,a new recruit can delay his report and find that the Lahore AC has already been replaced by anew AC. This discourages gaming the system. Fourth, since in my main specification I exploitwithin cohort variation, conditional on experience, any unobservable cohort characteristics thatdetermines a delay in end of UT period and hence the network inherited will have to vary atthe same frequency as the seniority of the potential entry-level job link. This seems less likely.In the next section I present evidence against any correlation between AC vacancies and end oftraining.
11.3 End of training and vacancy creation
In this subsection I test whether vacancy supply is correlated with the time of the end of on-the-job training of the new recruits. If the supply of vacancies are endogenous to the end oftraining of new recruits then the exogeneity of the potential network is questionable. Table 15and 16 uses the incumbency board data that I describe in Section 5.2. In Table 15 training end(dummy) turns on 1 a day before the end of on-the-job training of newly recruited civil servants.It stays zero otherwise. While in Table 16 training end (dummy) turns on 1 a month before theend of on-the-job training of newly recruited civil servants. It stays zero otherwise. AC vacancyis a dummy that turns on 1 whenever the Assistant Commissioner (AC) position is vacantin a tehsil. It remains zero otherwise. Large districts include Rawalpindi, Lahore, Multan,Gujranwala, Faisalabad, Sargodha, Bahawalpur and Sialkot. Standard errors are clustered atthe tehsil level. In all cases we can see that the supply of vacancies is not correlated with theend of on-the-job training of the new recruits irrespective of whether I include year and tehsilfixed effects or how I classify the end of on-the-job training.
33
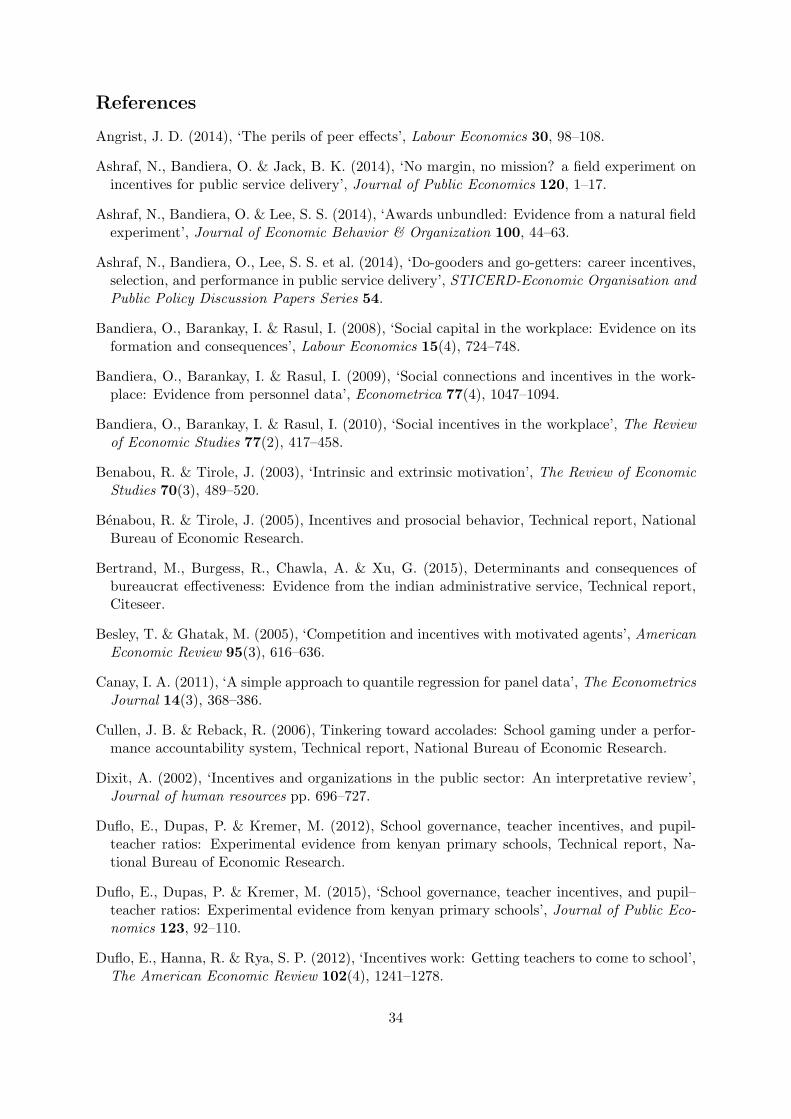
References
Angrist, J. D. (2014), ‘The perils of peer effects’, Labour Economics 30, 98–108.
Ashraf, N., Bandiera, O. & Jack, B. K. (2014), ‘No margin, no mission? a field experiment onincentives for public service delivery’, Journal of Public Economics 120, 1–17.
Ashraf, N., Bandiera, O. & Lee, S. S. (2014), ‘Awards unbundled: Evidence from a natural fieldexperiment’, Journal of Economic Behavior & Organization 100, 44–63.
Ashraf, N., Bandiera, O., Lee, S. S. et al. (2014), ‘Do-gooders and go-getters: career incentives,selection, and performance in public service delivery’, STICERD-Economic Organisation andPublic Policy Discussion Papers Series 54.
Bandiera, O., Barankay, I. & Rasul, I. (2008), ‘Social capital in the workplace: Evidence on itsformation and consequences’, Labour Economics 15(4), 724–748.
Bandiera, O., Barankay, I. & Rasul, I. (2009), ‘Social connections and incentives in the work-place: Evidence from personnel data’, Econometrica 77(4), 1047–1094.
Bandiera, O., Barankay, I. & Rasul, I. (2010), ‘Social incentives in the workplace’, The Reviewof Economic Studies 77(2), 417–458.
Benabou, R. & Tirole, J. (2003), ‘Intrinsic and extrinsic motivation’, The Review of EconomicStudies 70(3), 489–520.
Benabou, R. & Tirole, J. (2005), Incentives and prosocial behavior, Technical report, NationalBureau of Economic Research.
Bertrand, M., Burgess, R., Chawla, A. & Xu, G. (2015), Determinants and consequences ofbureaucrat effectiveness: Evidence from the indian administrative service, Technical report,Citeseer.
Besley, T. & Ghatak, M. (2005), ‘Competition and incentives with motivated agents’, AmericanEconomic Review 95(3), 616–636.
Canay, I. A. (2011), ‘A simple approach to quantile regression for panel data’, The EconometricsJournal 14(3), 368–386.
Cullen, J. B. & Reback, R. (2006), Tinkering toward accolades: School gaming under a perfor-mance accountability system, Technical report, National Bureau of Economic Research.
Dixit, A. (2002), ‘Incentives and organizations in the public sector: An interpretative review’,Journal of human resources pp. 696–727.
Duflo, E., Dupas, P. & Kremer, M. (2012), School governance, teacher incentives, and pupil-teacher ratios: Experimental evidence from kenyan primary schools, Technical report, Na-tional Bureau of Economic Research.
Duflo, E., Dupas, P. & Kremer, M. (2015), ‘School governance, teacher incentives, and pupil–teacher ratios: Experimental evidence from kenyan primary schools’, Journal of Public Eco-nomics 123, 92–110.
Duflo, E., Hanna, R. & Rya, S. P. (2012), ‘Incentives work: Getting teachers to come to school’,The American Economic Review 102(4), 1241–1278.
34
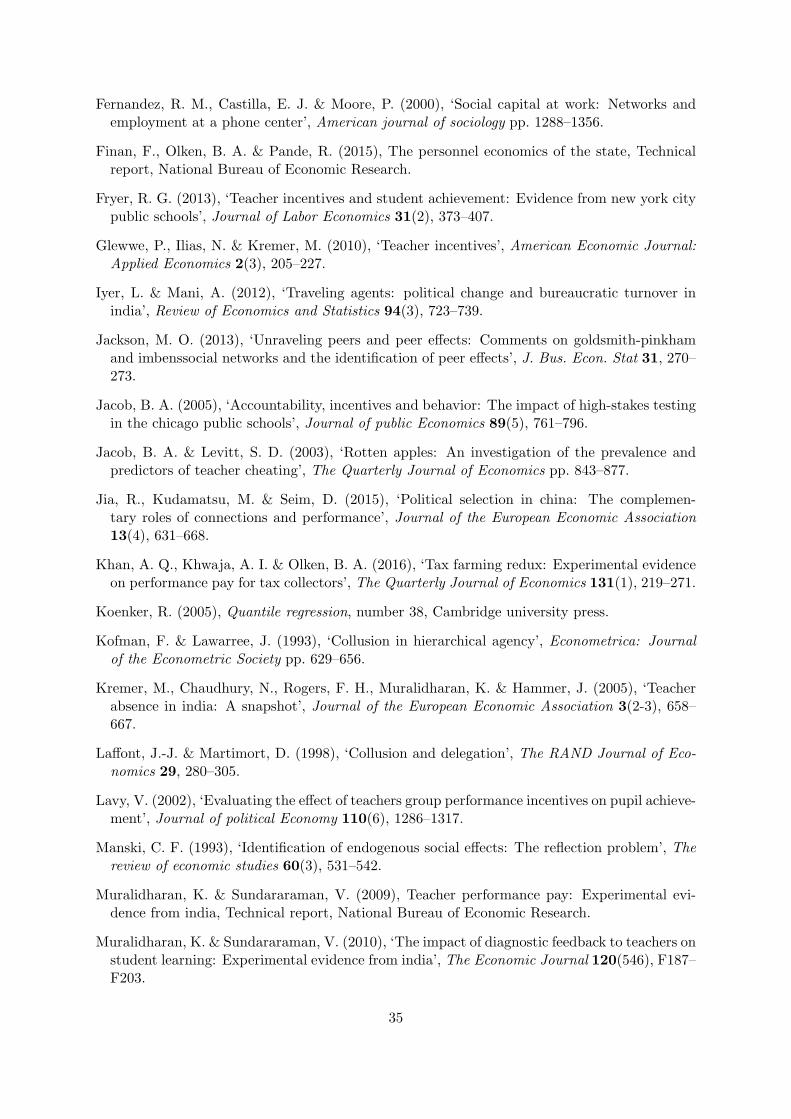
Fernandez, R. M., Castilla, E. J. & Moore, P. (2000), ‘Social capital at work: Networks andemployment at a phone center’, American journal of sociology pp. 1288–1356.
Finan, F., Olken, B. A. & Pande, R. (2015), The personnel economics of the state, Technicalreport, National Bureau of Economic Research.
Fryer, R. G. (2013), ‘Teacher incentives and student achievement: Evidence from new york citypublic schools’, Journal of Labor Economics 31(2), 373–407.
Glewwe, P., Ilias, N. & Kremer, M. (2010), ‘Teacher incentives’, American Economic Journal:Applied Economics 2(3), 205–227.
Iyer, L. & Mani, A. (2012), ‘Traveling agents: political change and bureaucratic turnover inindia’, Review of Economics and Statistics 94(3), 723–739.
Jackson, M. O. (2013), ‘Unraveling peers and peer effects: Comments on goldsmith-pinkhamand imbenssocial networks and the identification of peer effects’, J. Bus. Econ. Stat 31, 270–273.
Jacob, B. A. (2005), ‘Accountability, incentives and behavior: The impact of high-stakes testingin the chicago public schools’, Journal of public Economics 89(5), 761–796.
Jacob, B. A. & Levitt, S. D. (2003), ‘Rotten apples: An investigation of the prevalence andpredictors of teacher cheating’, The Quarterly Journal of Economics pp. 843–877.
Jia, R., Kudamatsu, M. & Seim, D. (2015), ‘Political selection in china: The complemen-tary roles of connections and performance’, Journal of the European Economic Association13(4), 631–668.
Khan, A. Q., Khwaja, A. I. & Olken, B. A. (2016), ‘Tax farming redux: Experimental evidenceon performance pay for tax collectors’, The Quarterly Journal of Economics 131(1), 219–271.
Koenker, R. (2005), Quantile regression, number 38, Cambridge university press.
Kofman, F. & Lawarree, J. (1993), ‘Collusion in hierarchical agency’, Econometrica: Journalof the Econometric Society pp. 629–656.
Kremer, M., Chaudhury, N., Rogers, F. H., Muralidharan, K. & Hammer, J. (2005), ‘Teacherabsence in india: A snapshot’, Journal of the European Economic Association 3(2-3), 658–667.
Laffont, J.-J. & Martimort, D. (1998), ‘Collusion and delegation’, The RAND Journal of Eco-nomics 29, 280–305.
Lavy, V. (2002), ‘Evaluating the effect of teachers group performance incentives on pupil achieve-ment’, Journal of political Economy 110(6), 1286–1317.
Manski, C. F. (1993), ‘Identification of endogenous social effects: The reflection problem’, Thereview of economic studies 60(3), 531–542.
Muralidharan, K. & Sundararaman, V. (2009), Teacher performance pay: Experimental evi-dence from india, Technical report, National Bureau of Economic Research.
Muralidharan, K. & Sundararaman, V. (2010), ‘The impact of diagnostic feedback to teachers onstudent learning: Experimental evidence from india’, The Economic Journal 120(546), F187–F203.
35
Muralidharan, K. & Sundararaman, V. (2013), Contract teachers: experimental evidence fromindia, Technical report, National Bureau of Economic Research.
Nasim, A. (2013), ‘Agricultural income taxation estimation of the revenue potential in punjab’,Institute of Development and Economics Alternatives Working Paper 02 13.
Neal, D. & Schanzenbach, D. W. (2010), ‘Left behind by design: Proficiency counts and test-based accountability’, The Review of Economics and Statistics 92(2), 263–283.
Parente, P. M. & Santos Silva, J. (2016), ‘Quantile regression with clustered data’, Journal ofEconometric Methods 5(1), 1–15.
Perez-Gonzalez, F. (2006), ‘Inherited control and firm performance’, The American economicreview 96(5), 1559–1588.
Scoppa, V. (2009), ‘Intergenerational transfers of public sector jobs: a shred of evidence onnepotism’, Public Choice 141(1-2), 167–188.
Suzuki, E., Takao, S., Subramanian, S., Komatsu, H., Doi, H. & Kawachi, I. (2010), ‘Doeslow workplace social capital have detrimental effect on workers’ health?’, Social science &medicine 70(9), 1367–1372.
Tirole, J. (1986), ‘Hierarchies and bureaucracies: On the role of collusion in organizations’,Journal of Law, Economics, & Organization 2(2), 181–214.
Xu, G. (2016), ‘The costs of patronage: Evidence from the british empire’, Job Market Paper .
36
Figure 1: Illustration of the entry-level job link
Figure 2: Illustration of the potential entry-level job link
37
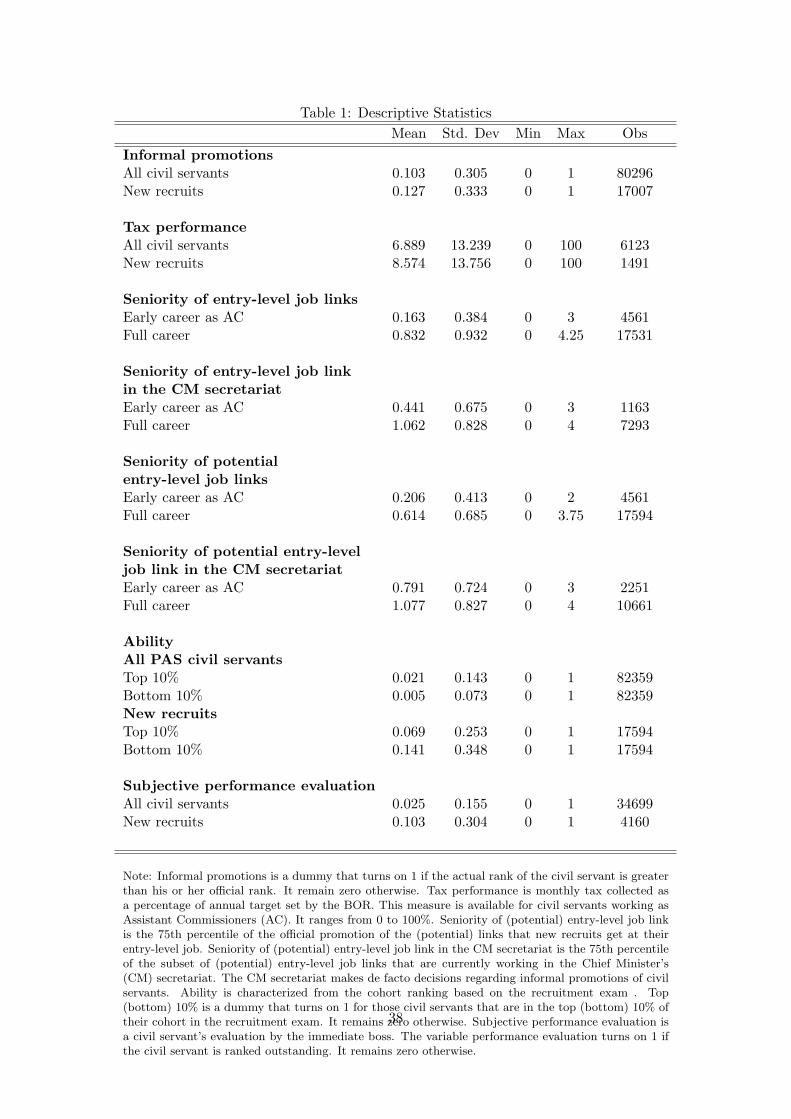
Table 1: Descriptive Statistics
Mean Std. Dev Min Max Obs
Informal promotionsAll civil servants 0.103 0.305 0 1 80296New recruits 0.127 0.333 0 1 17007
Tax performanceAll civil servants 6.889 13.239 0 100 6123New recruits 8.574 13.756 0 100 1491
Seniority of entry-level job linksEarly career as AC 0.163 0.384 0 3 4561Full career 0.832 0.932 0 4.25 17531
Seniority of entry-level job linkin the CM secretariatEarly career as AC 0.441 0.675 0 3 1163Full career 1.062 0.828 0 4 7293
Seniority of potentialentry-level job linksEarly career as AC 0.206 0.413 0 2 4561Full career 0.614 0.685 0 3.75 17594
Seniority of potential entry-leveljob link in the CM secretariatEarly career as AC 0.791 0.724 0 3 2251Full career 1.077 0.827 0 4 10661
AbilityAll PAS civil servantsTop 10% 0.021 0.143 0 1 82359Bottom 10% 0.005 0.073 0 1 82359New recruitsTop 10% 0.069 0.253 0 1 17594Bottom 10% 0.141 0.348 0 1 17594
Subjective performance evaluationAll civil servants 0.025 0.155 0 1 34699New recruits 0.103 0.304 0 1 4160
Note: Informal promotions is a dummy that turns on 1 if the actual rank of the civil servant is greaterthan his or her official rank. It remain zero otherwise. Tax performance is monthly tax collected asa percentage of annual target set by the BOR. This measure is available for civil servants working asAssistant Commissioners (AC). It ranges from 0 to 100%. Seniority of (potential) entry-level job linkis the 75th percentile of the official promotion of the (potential) links that new recruits get at theirentry-level job. Seniority of (potential) entry-level job link in the CM secretariat is the 75th percentileof the subset of (potential) entry-level job links that are currently working in the Chief Minister’s(CM) secretariat. The CM secretariat makes de facto decisions regarding informal promotions of civilservants. Ability is characterized from the cohort ranking based on the recruitment exam . Top(bottom) 10% is a dummy that turns on 1 for those civil servants that are in the top (bottom) 10% oftheir cohort in the recruitment exam. It remains zero otherwise. Subjective performance evaluation isa civil servant’s evaluation by the immediate boss. The variable performance evaluation turns on 1 ifthe civil servant is ranked outstanding. It remains zero otherwise.
38

Table 2: The effect of seniority of job link on career progression of new recruitsInformal promotions
1{(actual ranki - official ranki) > 0}(1) (2) (3) (4)
First Stage OLS IV Reduced Form
Seniority of Potential Job Link 0.29*** 0.18***(0.05) (0.05)
Seniority of Job Link 0.15*** 0.61***(0.03) (0.17)
AP F Statistic-I 37.47AP p-value I 0.00
Observations 16768 16768 16768 16831Cohort FE Yes Yes Yes YesRank FE Yes Yes Yes YesCohort*rank FE Yes Yes Yes YesTime FE Yes Yes Yes Yes
Clustered standard errors in parenthesis
* p<0.10 ** p<0.05 *** p<0.01Note: Informal promotions is a dummy that turns on 1 if the actual rank of the civil servant isgreater than his or her official rank. It remain zero otherwise. Seniority of (potential) entry-leveljob link is the 75th percentile of the official promotion of the (potential) links that new recruits getat their entry-level job.
39
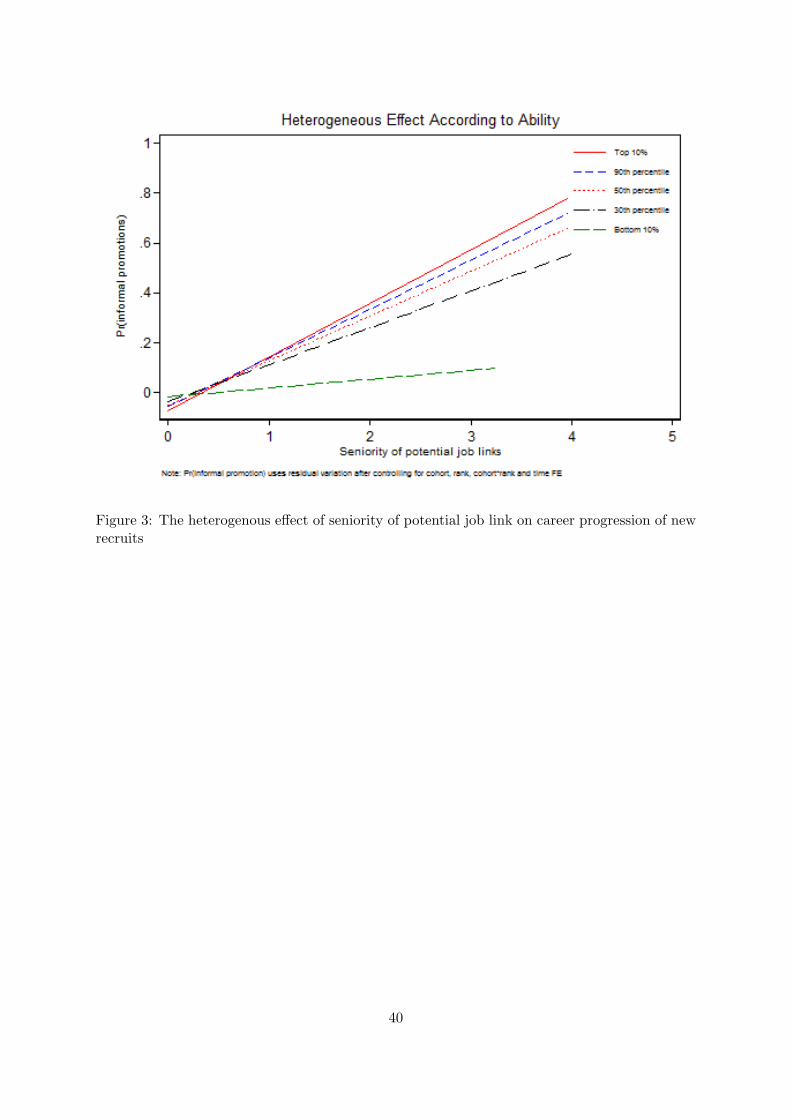
Figure 3: The heterogenous effect of seniority of potential job link on career progression of newrecruits
40
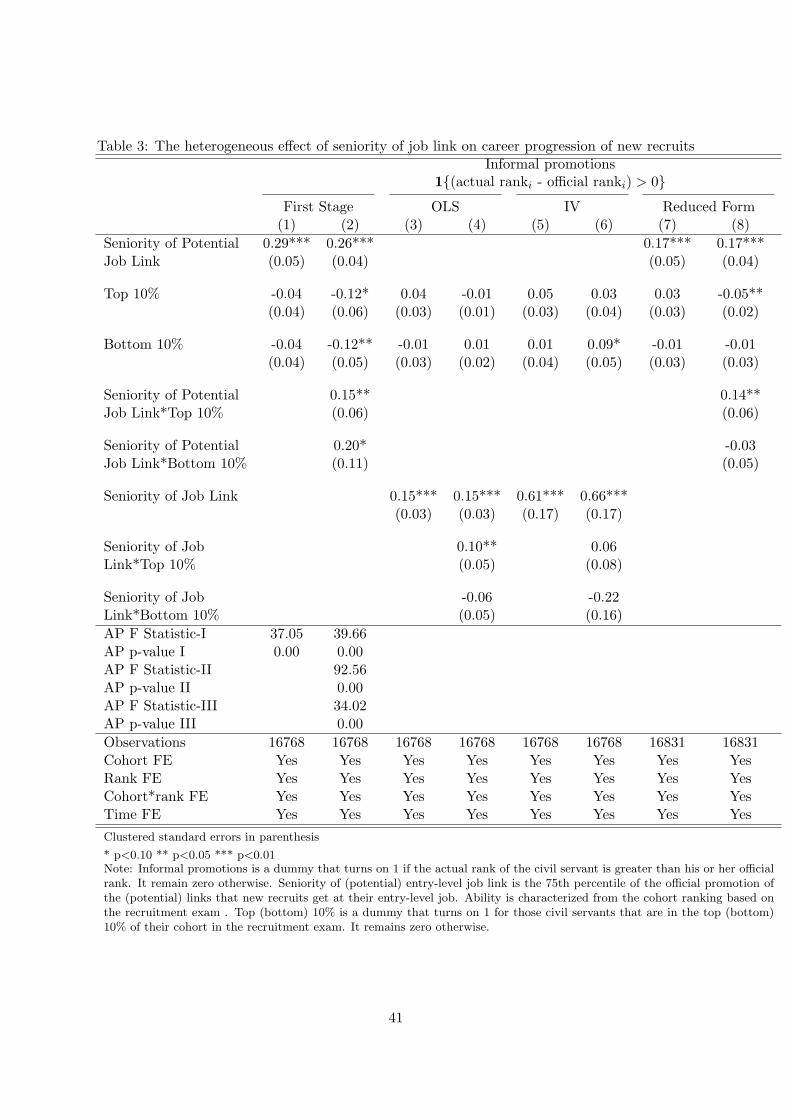
Table 3: The heterogeneous effect of seniority of job link on career progression of new recruitsInformal promotions
1{(actual ranki - official ranki) > 0}
First Stage OLS IV Reduced Form(1) (2) (3) (4) (5) (6) (7) (8)
Seniority of Potential 0.29*** 0.26*** 0.17*** 0.17***Job Link (0.05) (0.04) (0.05) (0.04)
Top 10% -0.04 -0.12* 0.04 -0.01 0.05 0.03 0.03 -0.05**(0.04) (0.06) (0.03) (0.01) (0.03) (0.04) (0.03) (0.02)
Bottom 10% -0.04 -0.12** -0.01 0.01 0.01 0.09* -0.01 -0.01(0.04) (0.05) (0.03) (0.02) (0.04) (0.05) (0.03) (0.03)
Seniority of Potential 0.15** 0.14**Job Link*Top 10% (0.06) (0.06)
Seniority of Potential 0.20* -0.03Job Link*Bottom 10% (0.11) (0.05)
Seniority of Job Link 0.15*** 0.15*** 0.61*** 0.66***(0.03) (0.03) (0.17) (0.17)
Seniority of Job 0.10** 0.06Link*Top 10% (0.05) (0.08)
Seniority of Job -0.06 -0.22Link*Bottom 10% (0.05) (0.16)
AP F Statistic-I 37.05 39.66AP p-value I 0.00 0.00AP F Statistic-II 92.56AP p-value II 0.00AP F Statistic-III 34.02AP p-value III 0.00
Observations 16768 16768 16768 16768 16768 16768 16831 16831Cohort FE Yes Yes Yes Yes Yes Yes Yes YesRank FE Yes Yes Yes Yes Yes Yes Yes YesCohort*rank FE Yes Yes Yes Yes Yes Yes Yes YesTime FE Yes Yes Yes Yes Yes Yes Yes Yes
Clustered standard errors in parenthesis
* p<0.10 ** p<0.05 *** p<0.01Note: Informal promotions is a dummy that turns on 1 if the actual rank of the civil servant is greater than his or her officialrank. It remain zero otherwise. Seniority of (potential) entry-level job link is the 75th percentile of the official promotion ofthe (potential) links that new recruits get at their entry-level job. Ability is characterized from the cohort ranking based onthe recruitment exam . Top (bottom) 10% is a dummy that turns on 1 for those civil servants that are in the top (bottom)10% of their cohort in the recruitment exam. It remains zero otherwise.
41
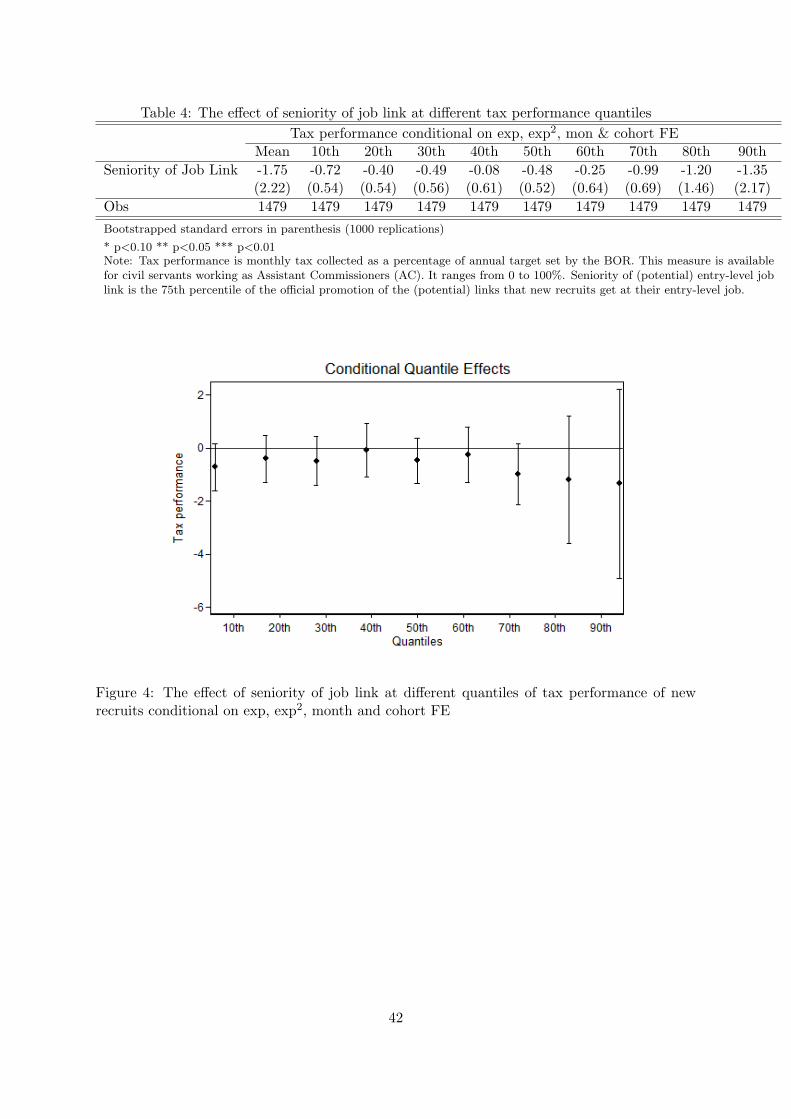
Table 4: The effect of seniority of job link at different tax performance quantiles
Tax performance conditional on exp, exp2, mon & cohort FEMean 10th 20th 30th 40th 50th 60th 70th 80th 90th
Seniority of Job Link -1.75 -0.72 -0.40 -0.49 -0.08 -0.48 -0.25 -0.99 -1.20 -1.35(2.22) (0.54) (0.54) (0.56) (0.61) (0.52) (0.64) (0.69) (1.46) (2.17)
Obs 1479 1479 1479 1479 1479 1479 1479 1479 1479 1479
Bootstrapped standard errors in parenthesis (1000 replications)
* p<0.10 ** p<0.05 *** p<0.01Note: Tax performance is monthly tax collected as a percentage of annual target set by the BOR. This measure is availablefor civil servants working as Assistant Commissioners (AC). It ranges from 0 to 100%. Seniority of (potential) entry-level joblink is the 75th percentile of the official promotion of the (potential) links that new recruits get at their entry-level job.
Figure 4: The effect of seniority of job link at different quantiles of tax performance of newrecruits conditional on exp, exp2, month and cohort FE
42
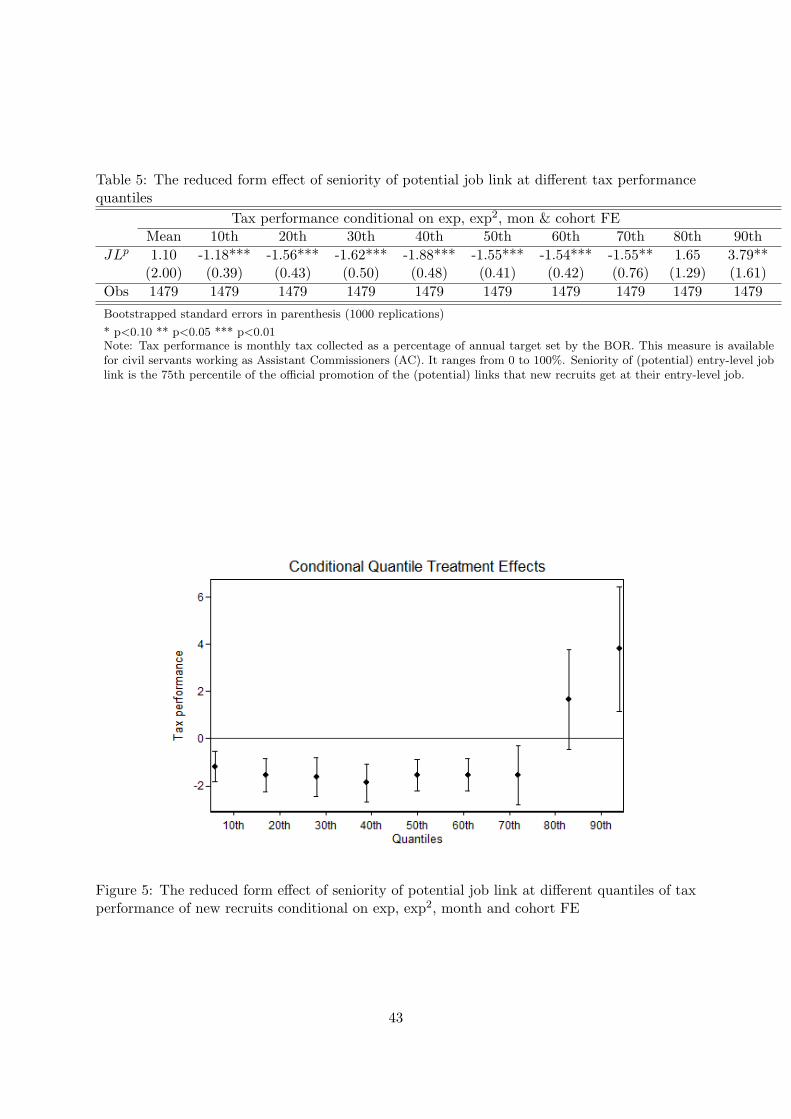
Table 5: The reduced form effect of seniority of potential job link at different tax performancequantiles
Tax performance conditional on exp, exp2, mon & cohort FEMean 10th 20th 30th 40th 50th 60th 70th 80th 90th
JLp 1.10 -1.18*** -1.56*** -1.62*** -1.88*** -1.55*** -1.54*** -1.55** 1.65 3.79**(2.00) (0.39) (0.43) (0.50) (0.48) (0.41) (0.42) (0.76) (1.29) (1.61)
Obs 1479 1479 1479 1479 1479 1479 1479 1479 1479 1479
Bootstrapped standard errors in parenthesis (1000 replications)
* p<0.10 ** p<0.05 *** p<0.01Note: Tax performance is monthly tax collected as a percentage of annual target set by the BOR. This measure is availablefor civil servants working as Assistant Commissioners (AC). It ranges from 0 to 100%. Seniority of (potential) entry-level joblink is the 75th percentile of the official promotion of the (potential) links that new recruits get at their entry-level job.
Figure 5: The reduced form effect of seniority of potential job link at different quantiles of taxperformance of new recruits conditional on exp, exp2, month and cohort FE
43
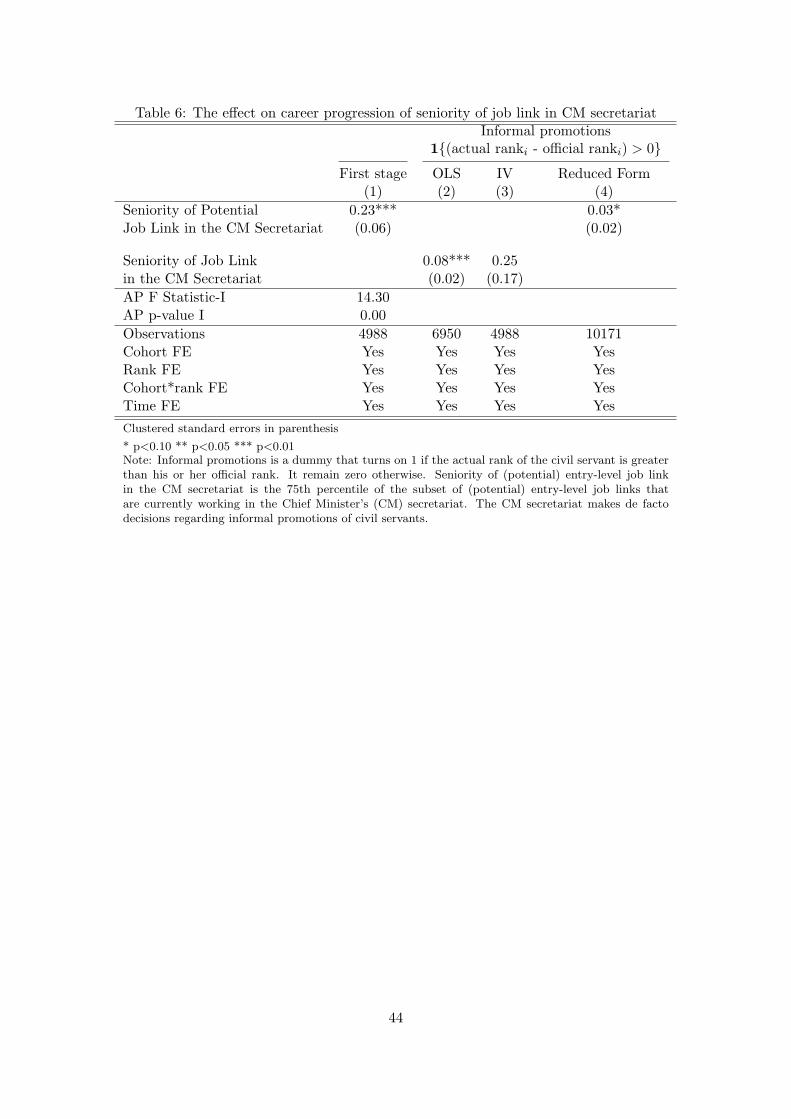
Table 6: The effect on career progression of seniority of job link in CM secretariatInformal promotions
1{(actual ranki - official ranki) > 0}
First stage OLS IV Reduced Form(1) (2) (3) (4)
Seniority of Potential 0.23*** 0.03*Job Link in the CM Secretariat (0.06) (0.02)
Seniority of Job Link 0.08*** 0.25in the CM Secretariat (0.02) (0.17)
AP F Statistic-I 14.30AP p-value I 0.00
Observations 4988 6950 4988 10171Cohort FE Yes Yes Yes YesRank FE Yes Yes Yes YesCohort*rank FE Yes Yes Yes YesTime FE Yes Yes Yes Yes
Clustered standard errors in parenthesis
* p<0.10 ** p<0.05 *** p<0.01Note: Informal promotions is a dummy that turns on 1 if the actual rank of the civil servant is greaterthan his or her official rank. It remain zero otherwise. Seniority of (potential) entry-level job linkin the CM secretariat is the 75th percentile of the subset of (potential) entry-level job links thatare currently working in the Chief Minister’s (CM) secretariat. The CM secretariat makes de factodecisions regarding informal promotions of civil servants.
44

Figure 6: The heterogenous effect of seniority of potential job link in CM secretariat on careerprogression of new recruits
45
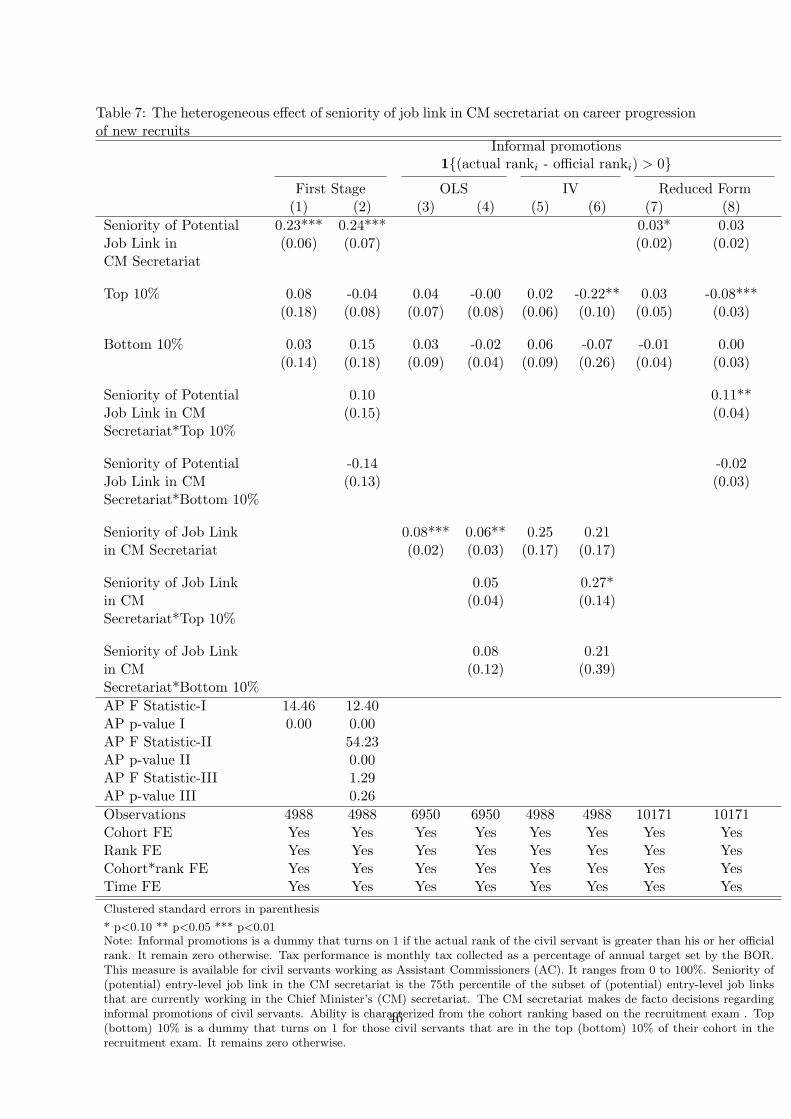
Table 7: The heterogeneous effect of seniority of job link in CM secretariat on career progressionof new recruits
Informal promotions1{(actual ranki - official ranki) > 0}
First Stage OLS IV Reduced Form(1) (2) (3) (4) (5) (6) (7) (8)
Seniority of Potential 0.23*** 0.24*** 0.03* 0.03Job Link in (0.06) (0.07) (0.02) (0.02)CM Secretariat
Top 10% 0.08 -0.04 0.04 -0.00 0.02 -0.22** 0.03 -0.08***(0.18) (0.08) (0.07) (0.08) (0.06) (0.10) (0.05) (0.03)
Bottom 10% 0.03 0.15 0.03 -0.02 0.06 -0.07 -0.01 0.00(0.14) (0.18) (0.09) (0.04) (0.09) (0.26) (0.04) (0.03)
Seniority of Potential 0.10 0.11**Job Link in CM (0.15) (0.04)Secretariat*Top 10%
Seniority of Potential -0.14 -0.02Job Link in CM (0.13) (0.03)Secretariat*Bottom 10%
Seniority of Job Link 0.08*** 0.06** 0.25 0.21in CM Secretariat (0.02) (0.03) (0.17) (0.17)
Seniority of Job Link 0.05 0.27*in CM (0.04) (0.14)Secretariat*Top 10%
Seniority of Job Link 0.08 0.21in CM (0.12) (0.39)Secretariat*Bottom 10%
AP F Statistic-I 14.46 12.40AP p-value I 0.00 0.00AP F Statistic-II 54.23AP p-value II 0.00AP F Statistic-III 1.29AP p-value III 0.26
Observations 4988 4988 6950 6950 4988 4988 10171 10171Cohort FE Yes Yes Yes Yes Yes Yes Yes YesRank FE Yes Yes Yes Yes Yes Yes Yes YesCohort*rank FE Yes Yes Yes Yes Yes Yes Yes YesTime FE Yes Yes Yes Yes Yes Yes Yes Yes
Clustered standard errors in parenthesis
* p<0.10 ** p<0.05 *** p<0.01Note: Informal promotions is a dummy that turns on 1 if the actual rank of the civil servant is greater than his or her officialrank. It remain zero otherwise. Tax performance is monthly tax collected as a percentage of annual target set by the BOR.This measure is available for civil servants working as Assistant Commissioners (AC). It ranges from 0 to 100%. Seniority of(potential) entry-level job link in the CM secretariat is the 75th percentile of the subset of (potential) entry-level job linksthat are currently working in the Chief Minister’s (CM) secretariat. The CM secretariat makes de facto decisions regardinginformal promotions of civil servants. Ability is characterized from the cohort ranking based on the recruitment exam . Top(bottom) 10% is a dummy that turns on 1 for those civil servants that are in the top (bottom) 10% of their cohort in therecruitment exam. It remains zero otherwise.
46
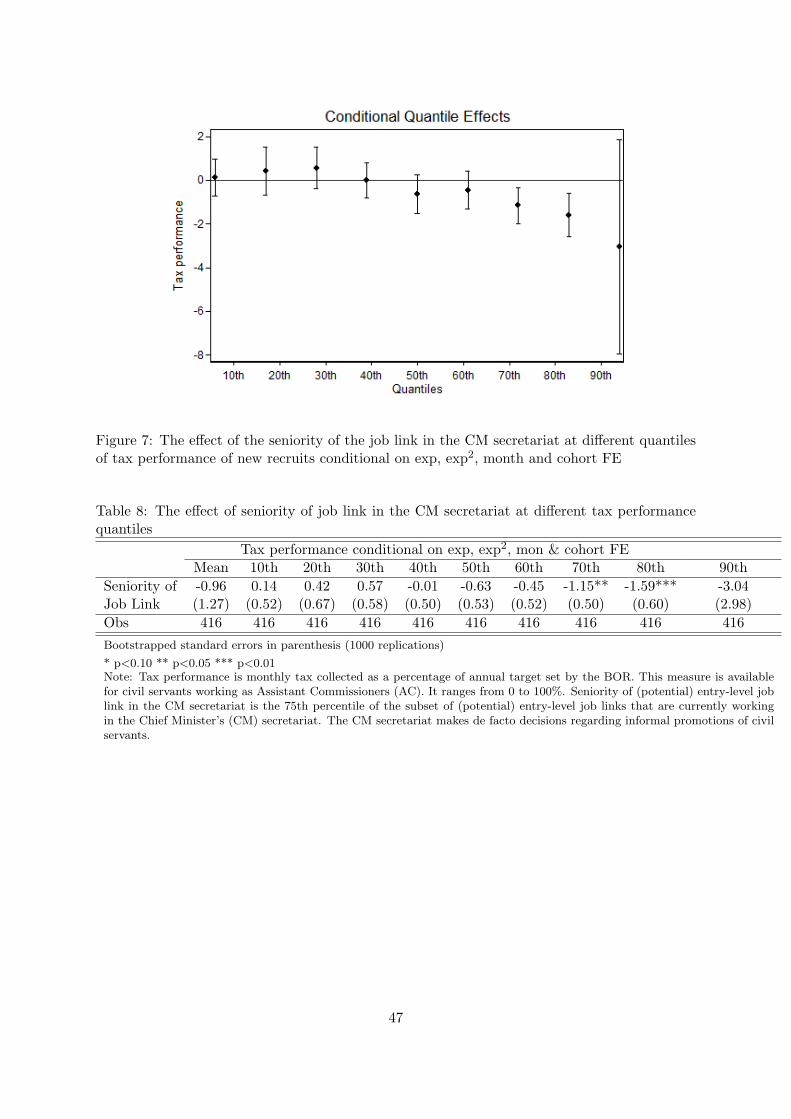
Figure 7: The effect of the seniority of the job link in the CM secretariat at different quantilesof tax performance of new recruits conditional on exp, exp2, month and cohort FE
Table 8: The effect of seniority of job link in the CM secretariat at different tax performancequantiles
Tax performance conditional on exp, exp2, mon & cohort FEMean 10th 20th 30th 40th 50th 60th 70th 80th 90th
Seniority of -0.96 0.14 0.42 0.57 -0.01 -0.63 -0.45 -1.15** -1.59*** -3.04Job Link (1.27) (0.52) (0.67) (0.58) (0.50) (0.53) (0.52) (0.50) (0.60) (2.98)
Obs 416 416 416 416 416 416 416 416 416 416
Bootstrapped standard errors in parenthesis (1000 replications)
* p<0.10 ** p<0.05 *** p<0.01Note: Tax performance is monthly tax collected as a percentage of annual target set by the BOR. This measure is availablefor civil servants working as Assistant Commissioners (AC). It ranges from 0 to 100%. Seniority of (potential) entry-level joblink in the CM secretariat is the 75th percentile of the subset of (potential) entry-level job links that are currently workingin the Chief Minister’s (CM) secretariat. The CM secretariat makes de facto decisions regarding informal promotions of civilservants.
47
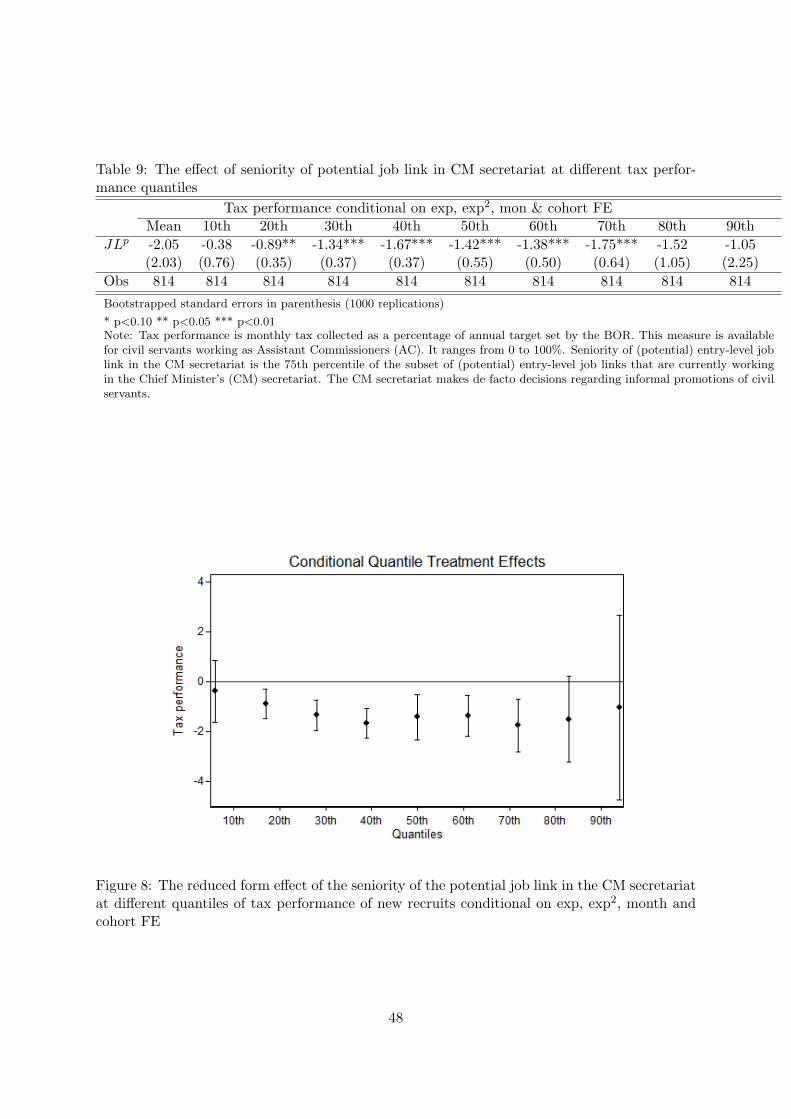
Table 9: The effect of seniority of potential job link in CM secretariat at different tax perfor-mance quantiles
Tax performance conditional on exp, exp2, mon & cohort FEMean 10th 20th 30th 40th 50th 60th 70th 80th 90th
JLp -2.05 -0.38 -0.89** -1.34*** -1.67*** -1.42*** -1.38*** -1.75*** -1.52 -1.05(2.03) (0.76) (0.35) (0.37) (0.37) (0.55) (0.50) (0.64) (1.05) (2.25)
Obs 814 814 814 814 814 814 814 814 814 814
Bootstrapped standard errors in parenthesis (1000 replications)
* p<0.10 ** p<0.05 *** p<0.01Note: Tax performance is monthly tax collected as a percentage of annual target set by the BOR. This measure is availablefor civil servants working as Assistant Commissioners (AC). It ranges from 0 to 100%. Seniority of (potential) entry-level joblink in the CM secretariat is the 75th percentile of the subset of (potential) entry-level job links that are currently workingin the Chief Minister’s (CM) secretariat. The CM secretariat makes de facto decisions regarding informal promotions of civilservants.
Figure 8: The reduced form effect of the seniority of the potential job link in the CM secretariatat different quantiles of tax performance of new recruits conditional on exp, exp2, month andcohort FE
48
Table 10: Relationship between different measures of performance of ACs
Subjective Performance Evaluation Revenue Court Performance
(1) (2) (3) (4)
Tax performance 0.001 0.001** 0.346** 0.167(0.001) (0.000) (0.149) (0.252)
Observations 910 910 123 123Civil servant FE No Yes No YesYear FE No Yes No Yes
Standard errors in parenthesis
* p<0.10 ** p<0.05 *** p<0.01Note: Tax performance is monthly tax collected as a percentage of annual target set by the BOR. Thismeasure is available for civil servants working as Assistant Commissioners (AC). It ranges from 0 to 100%.Subjective performance evaluation is a civil servant’s evaluation by the immediate boss. The variableperformance evaluation turns on 1 if the civil servant is ranked outstanding. It remains zero otherwise.Revenue court performance is the number of court cases decided by the new recruit as a percentage of thetotal pending cases.
Table 11: Relationship between different measures of performance and ability
Subjective Performance Evaluation Tax performance
(1) (2)
Top 10% 0.109*** 3.148***(0.008) (0.921)
Observations 38859 7614
Standard errors in parenthesis
* p<0.10 ** p<0.05 *** p<0.01Note: Tax performance is monthly tax collected as a percentage of annual target set by the BOR. Thismeasure is available for civil servants working as Assistant Commissioners (AC). It ranges from 0 to 100%.Top 10% is a dummy that turns on 1 for those civil servants that are in the top 10% of their cohort inthe recruitment exam. It remains zero otherwise. Subjective performance evaluation is a civil servant’sevaluation by the immediate boss. The variable performance evaluation turns on 1 if the civil servant isranked outstanding. It remains zero otherwise.
49
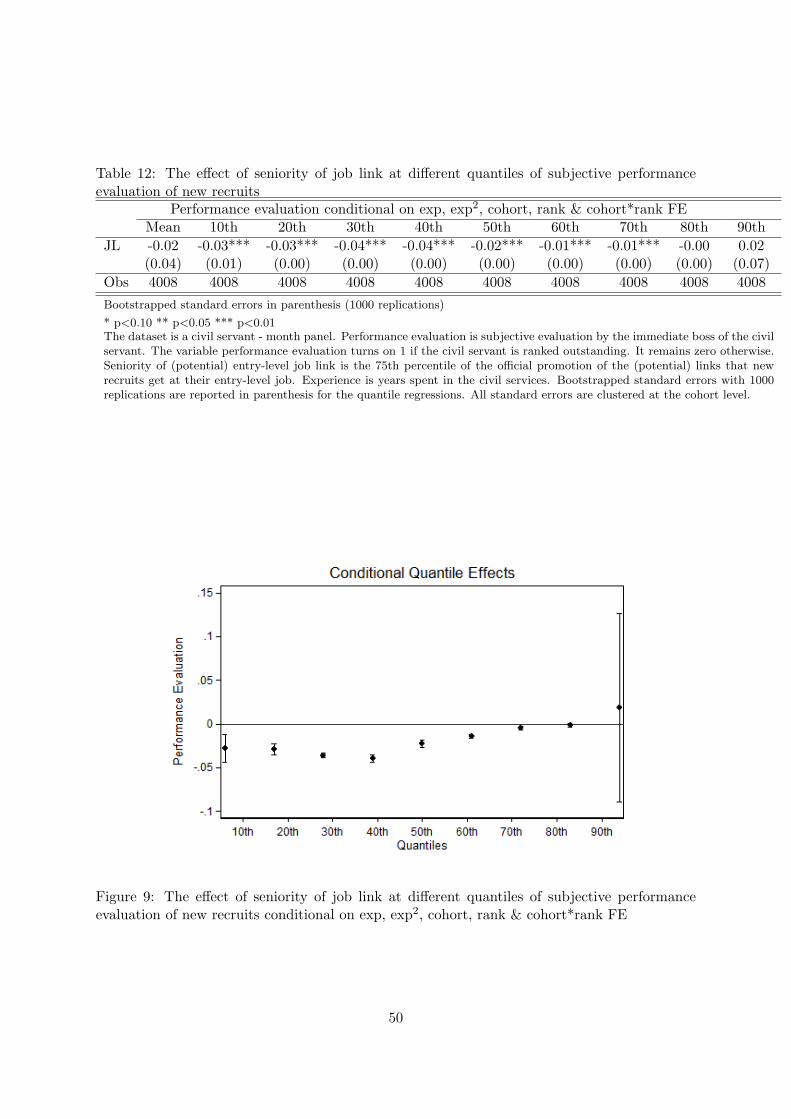
Table 12: The effect of seniority of job link at different quantiles of subjective performanceevaluation of new recruits
Performance evaluation conditional on exp, exp2, cohort, rank & cohort*rank FEMean 10th 20th 30th 40th 50th 60th 70th 80th 90th
JL -0.02 -0.03*** -0.03*** -0.04*** -0.04*** -0.02*** -0.01*** -0.01*** -0.00 0.02(0.04) (0.01) (0.00) (0.00) (0.00) (0.00) (0.00) (0.00) (0.00) (0.07)
Obs 4008 4008 4008 4008 4008 4008 4008 4008 4008 4008
Bootstrapped standard errors in parenthesis (1000 replications)
* p<0.10 ** p<0.05 *** p<0.01The dataset is a civil servant - month panel. Performance evaluation is subjective evaluation by the immediate boss of the civilservant. The variable performance evaluation turns on 1 if the civil servant is ranked outstanding. It remains zero otherwise.Seniority of (potential) entry-level job link is the 75th percentile of the official promotion of the (potential) links that newrecruits get at their entry-level job. Experience is years spent in the civil services. Bootstrapped standard errors with 1000replications are reported in parenthesis for the quantile regressions. All standard errors are clustered at the cohort level.
Figure 9: The effect of seniority of job link at different quantiles of subjective performanceevaluation of new recruits conditional on exp, exp2, cohort, rank & cohort*rank FE
50
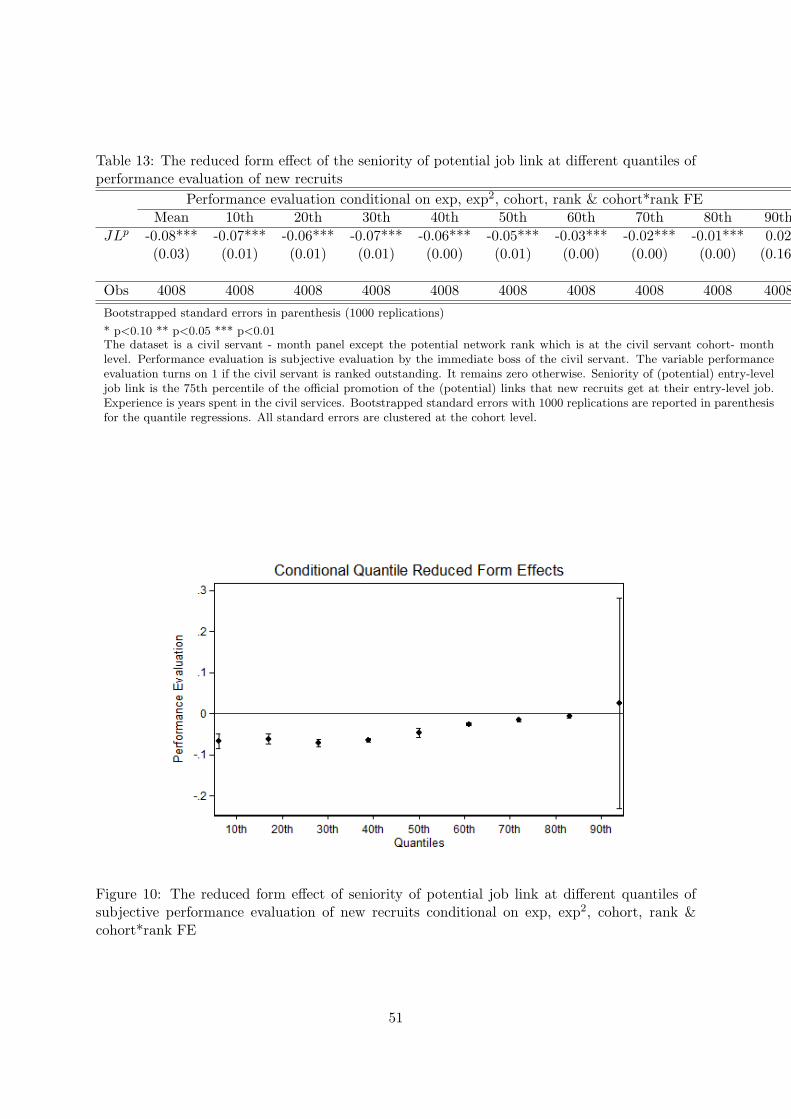
Table 13: The reduced form effect of the seniority of potential job link at different quantiles ofperformance evaluation of new recruits
Performance evaluation conditional on exp, exp2, cohort, rank & cohort*rank FEMean 10th 20th 30th 40th 50th 60th 70th 80th 90th
JLp -0.08*** -0.07*** -0.06*** -0.07*** -0.06*** -0.05*** -0.03*** -0.02*** -0.01*** 0.02(0.03) (0.01) (0.01) (0.01) (0.00) (0.01) (0.00) (0.00) (0.00) (0.16)
Obs 4008 4008 4008 4008 4008 4008 4008 4008 4008 4008
Bootstrapped standard errors in parenthesis (1000 replications)
* p<0.10 ** p<0.05 *** p<0.01The dataset is a civil servant - month panel except the potential network rank which is at the civil servant cohort- monthlevel. Performance evaluation is subjective evaluation by the immediate boss of the civil servant. The variable performanceevaluation turns on 1 if the civil servant is ranked outstanding. It remains zero otherwise. Seniority of (potential) entry-leveljob link is the 75th percentile of the official promotion of the (potential) links that new recruits get at their entry-level job.Experience is years spent in the civil services. Bootstrapped standard errors with 1000 replications are reported in parenthesisfor the quantile regressions. All standard errors are clustered at the cohort level.
Figure 10: The reduced form effect of seniority of potential job link at different quantiles ofsubjective performance evaluation of new recruits conditional on exp, exp2, cohort, rank &cohort*rank FE
51
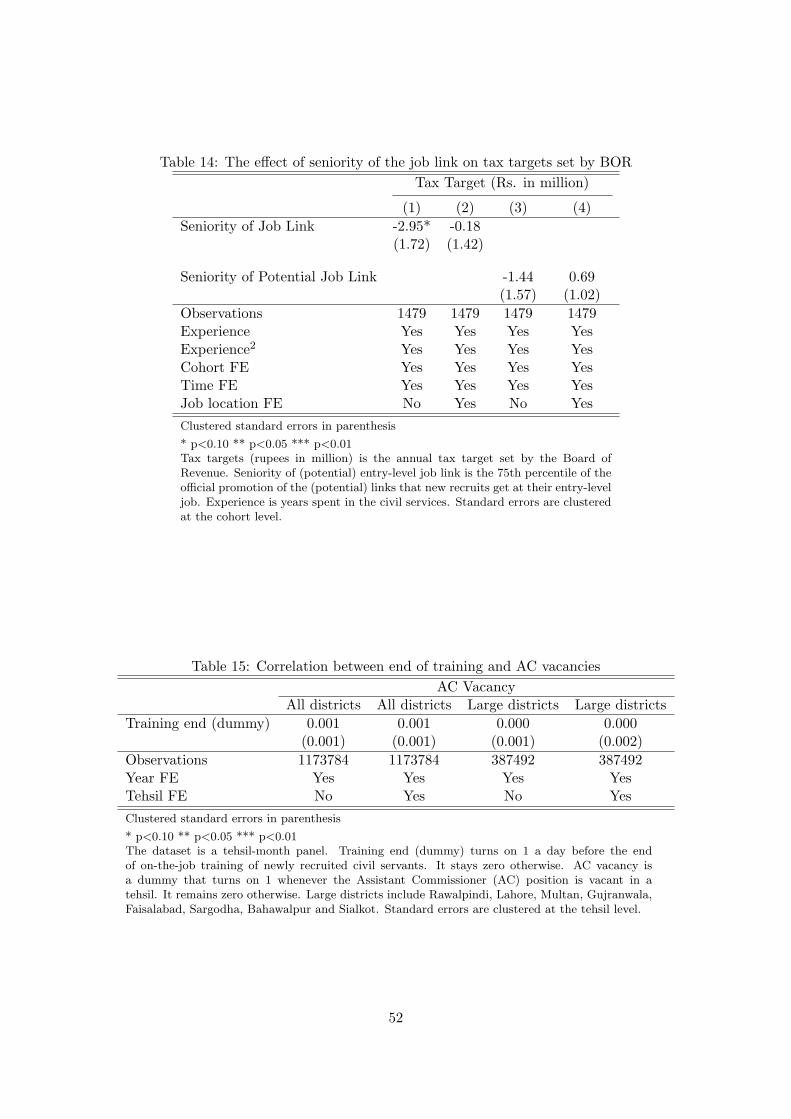
Table 14: The effect of seniority of the job link on tax targets set by BOR
Tax Target (Rs. in million)
(1) (2) (3) (4)
Seniority of Job Link -2.95* -0.18(1.72) (1.42)
Seniority of Potential Job Link -1.44 0.69(1.57) (1.02)
Observations 1479 1479 1479 1479Experience Yes Yes Yes YesExperience2 Yes Yes Yes YesCohort FE Yes Yes Yes YesTime FE Yes Yes Yes YesJob location FE No Yes No Yes
Clustered standard errors in parenthesis
* p<0.10 ** p<0.05 *** p<0.01Tax targets (rupees in million) is the annual tax target set by the Board ofRevenue. Seniority of (potential) entry-level job link is the 75th percentile of theofficial promotion of the (potential) links that new recruits get at their entry-leveljob. Experience is years spent in the civil services. Standard errors are clusteredat the cohort level.
Table 15: Correlation between end of training and AC vacancies
AC VacancyAll districts All districts Large districts Large districts
Training end (dummy) 0.001 0.001 0.000 0.000(0.001) (0.001) (0.001) (0.002)
Observations 1173784 1173784 387492 387492Year FE Yes Yes Yes YesTehsil FE No Yes No Yes
Clustered standard errors in parenthesis
* p<0.10 ** p<0.05 *** p<0.01The dataset is a tehsil-month panel. Training end (dummy) turns on 1 a day before the endof on-the-job training of newly recruited civil servants. It stays zero otherwise. AC vacancy isa dummy that turns on 1 whenever the Assistant Commissioner (AC) position is vacant in atehsil. It remains zero otherwise. Large districts include Rawalpindi, Lahore, Multan, Gujranwala,Faisalabad, Sargodha, Bahawalpur and Sialkot. Standard errors are clustered at the tehsil level.
52
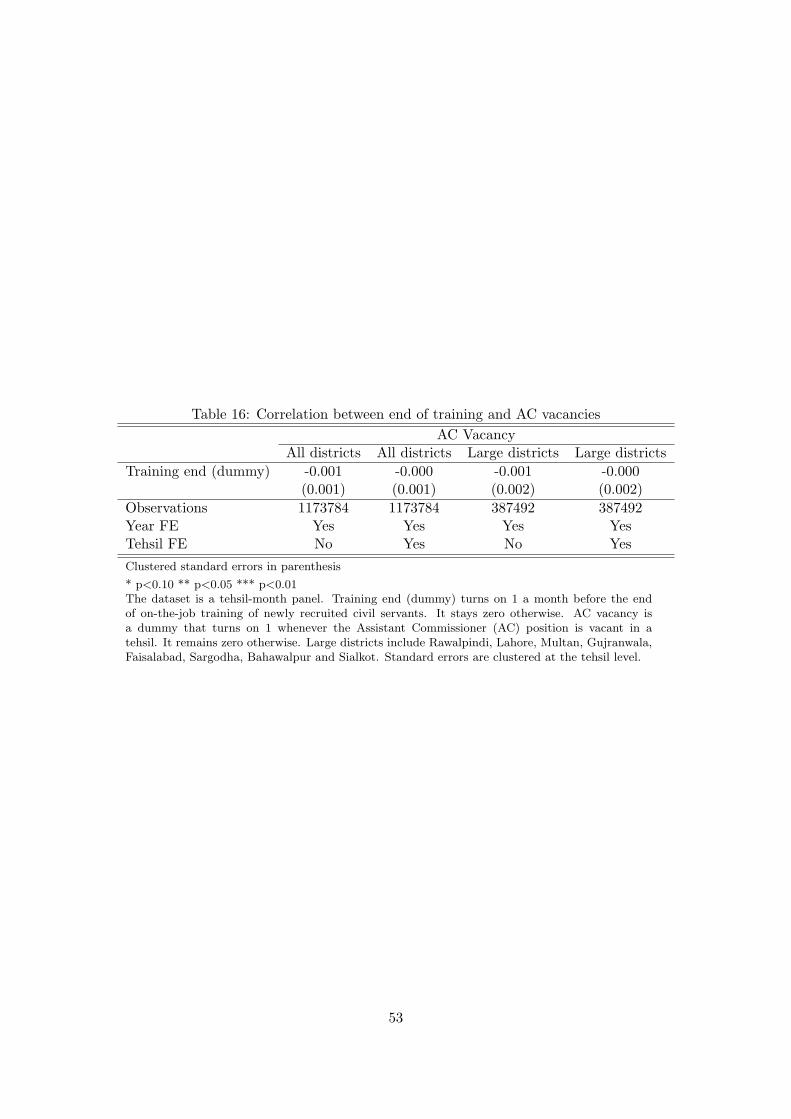
Table 16: Correlation between end of training and AC vacancies
AC VacancyAll districts All districts Large districts Large districts
Training end (dummy) -0.001 -0.000 -0.001 -0.000(0.001) (0.001) (0.002) (0.002)
Observations 1173784 1173784 387492 387492Year FE Yes Yes Yes YesTehsil FE No Yes No Yes
Clustered standard errors in parenthesis
* p<0.10 ** p<0.05 *** p<0.01The dataset is a tehsil-month panel. Training end (dummy) turns on 1 a month before the endof on-the-job training of newly recruited civil servants. It stays zero otherwise. AC vacancy isa dummy that turns on 1 whenever the Assistant Commissioner (AC) position is vacant in atehsil. It remains zero otherwise. Large districts include Rawalpindi, Lahore, Multan, Gujranwala,Faisalabad, Sargodha, Bahawalpur and Sialkot. Standard errors are clustered at the tehsil level.
53

Appendix
A Proof of Lemma 4.2
Proof. Suppose both the PC and the LLC dont bind. Then rewriting the CM’s problem withoutthe non-binding constraints:
maxRh,Rh,Rl,Rl
eh(y −Rh) + (1− eh)(0−Rh) + el(y −Rl) + (1− el)(0−Rl)
subject to
maxeh
√ehRh + (1− eh)Rh −
ehθ
(33)
maxel
√elRl + (1− el)Rl − el (34)
Taking the FOC of equation 33 i.e. the incentive compatibility constraint of H yields
Rh −Rh2√ehRh + (1− eh)Rh
− 1
θ= 0 (35)
=⇒ eh =(Rh −Rh)(θ2)
4− RhRh −Rh
(36)
Taking the FOC of equation 34 i.e. the incentive compatibility constraint of L yields
Rl −Rl2√elRl + (1− el)Rl
− 1 = 0 (37)
=⇒ el =Rl −Rl
4− RlRl −Rl
(38)
Using equations 36 and 38 in the CM’s problem yields:
maxRh,Rh,Rl,Rl
(Rh −Rh)(θ2y)
4− Rhy
Rh −Rh−(
(Rh −Rh)(θ)
2
)2
+(Rl −Rl)y
4− Rly
Rl −Rl−(Rl −Rl
2
)2
Taking FOC with respect to Rh and Rh respectively yields the following:
θ2y
4− Rhy(−1)
(Rh −Rh)2− (Rh −Rh)(θ2)
2= 0 (39)
− θ2y
4− y
Rh −Rh− Rhy
(Rh −Rh)2+
(Rh −Rh)(θ2)
2= 0 (40)
Solving equation 39 and 40 simultaneously gives y=0 which is a contradiction as y ∈ IR+ .A similar argument while taking the FOC for Rl and Rl also yields y=0 which again is acontradiction. Hence, it cant be that both LLC and PC dont bind.Now suppose that both the participation constraint and the limited liability constraint bindand Rh = Rl = 0. Using Rh = Rl = 0 in the CM’s problem I get:
maxRh,Rl
eh(y −Rh) + el(y −Rl)
54
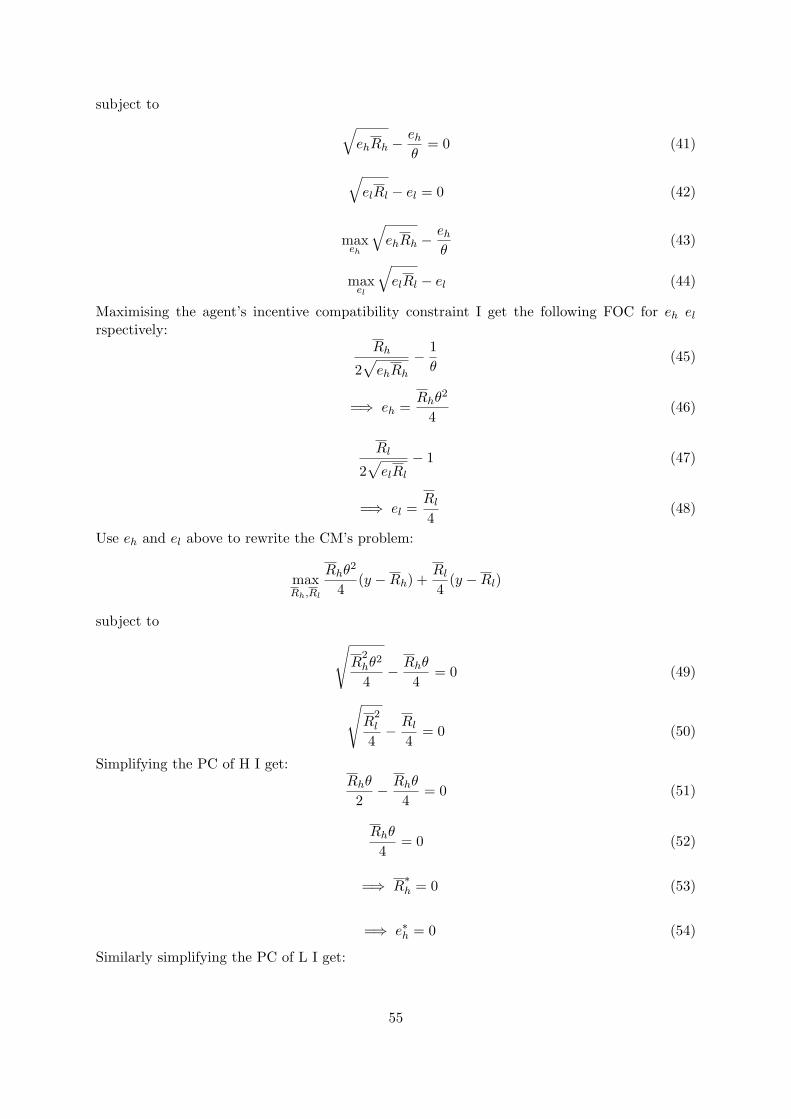
subject to √ehRh −
ehθ
= 0 (41)
√elRl − el = 0 (42)
maxeh
√ehRh −
ehθ
(43)
maxel
√elRl − el (44)
Maximising the agent’s incentive compatibility constraint I get the following FOC for eh elrspectively:
Rh
2√ehRh
− 1
θ(45)
=⇒ eh =Rhθ
2
4(46)
Rl
2√elRl
− 1 (47)
=⇒ el =Rl4
(48)
Use eh and el above to rewrite the CM’s problem:
maxRh,Rl
Rhθ2
4(y −Rh) +
Rl4
(y −Rl)
subject to √R
2hθ
2
4− Rhθ
4= 0 (49)
√R
2l
4− Rl
4= 0 (50)
Simplifying the PC of H I get:Rhθ
2− Rhθ
4= 0 (51)
Rhθ
4= 0 (52)
=⇒ R∗h = 0 (53)
=⇒ e∗h = 0 (54)
Similarly simplifying the PC of L I get:
55
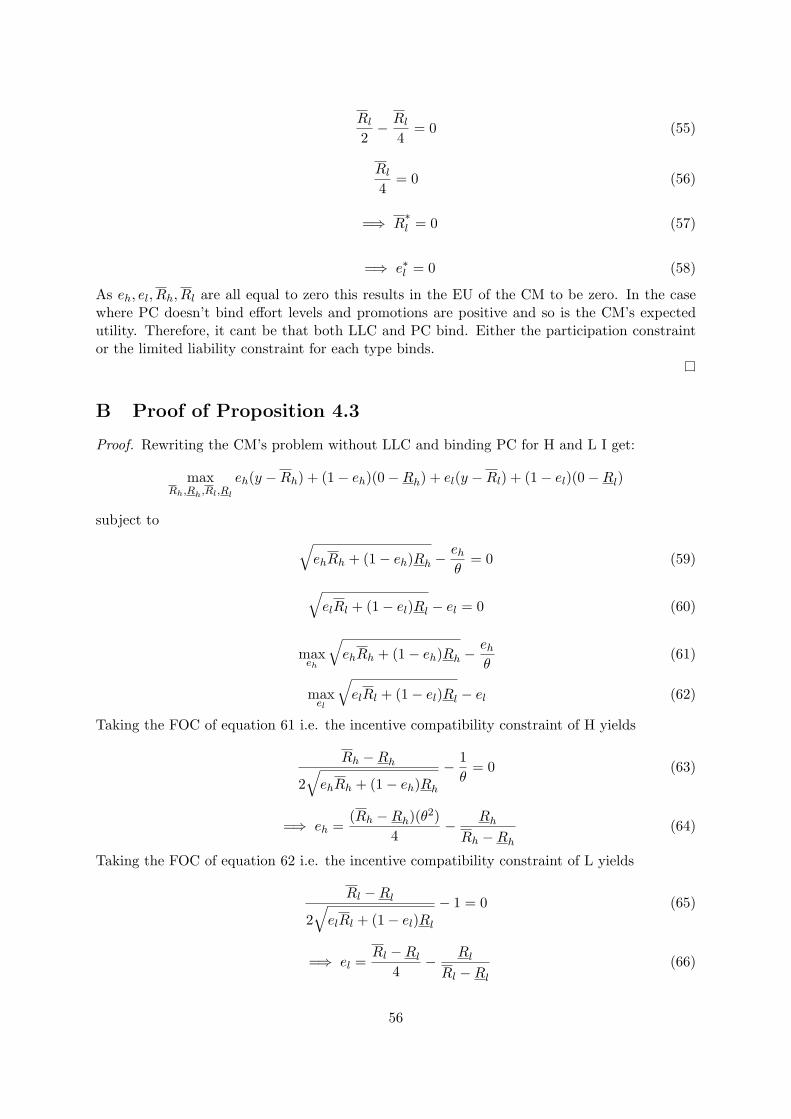
Rl2− Rl
4= 0 (55)
Rl4
= 0 (56)
=⇒ R∗l = 0 (57)
=⇒ e∗l = 0 (58)
As eh, el, Rh, Rl are all equal to zero this results in the EU of the CM to be zero. In the casewhere PC doesn’t bind effort levels and promotions are positive and so is the CM’s expectedutility. Therefore, it cant be that both LLC and PC bind. Either the participation constraintor the limited liability constraint for each type binds.
B Proof of Proposition 4.3
Proof. Rewriting the CM’s problem without LLC and binding PC for H and L I get:
maxRh,Rh,Rl,Rl
eh(y −Rh) + (1− eh)(0−Rh) + el(y −Rl) + (1− el)(0−Rl)
subject to √ehRh + (1− eh)Rh −
ehθ
= 0 (59)
√elRl + (1− el)Rl − el = 0 (60)
maxeh
√ehRh + (1− eh)Rh −
ehθ
(61)
maxel
√elRl + (1− el)Rl − el (62)
Taking the FOC of equation 61 i.e. the incentive compatibility constraint of H yields
Rh −Rh2√ehRh + (1− eh)Rh
− 1
θ= 0 (63)
=⇒ eh =(Rh −Rh)(θ2)
4− RhRh −Rh
(64)
Taking the FOC of equation 62 i.e. the incentive compatibility constraint of L yields
Rl −Rl2√elRl + (1− el)Rl
− 1 = 0 (65)
=⇒ el =Rl −Rl
4− RlRl −Rl
(66)
56
Rearrange PC of H and L respectively:
ehRh + (1− eh)Rh =(ehθ
)2(67)
elRl + (1− el)Rl = e2l (68)
Use equations 64, 66, 67 and 68 to rewrite the maximization problem of the CM for H and Lrespectively I get:
maxRh,Rh
(Rh −Rh)(θ2y)
4− Rhy
Rh −Rh− 1
θ2
((Rh −Rh)(θ2)
4− RhRh −Rh
)2
maxRl,Rl
(Rl −Rl)y4
− Rly
Rl −Rl−(Rl −Rl
4− RlRl −Rl
)2
Taking the FOC for Rh, Rh respectively:
θ2y
4− Rhy(−1)
(Rh −Rh)2− 2
θ2
((Rh −Rh)(θ2)
4− RhRh −Rh
)(θ2
4− Rh(−1)
(Rh −Rh)2
)= 0 (69)
−θ2y
4− y
Rh −Rh− Rhy
(Rh −Rh)2− 2
θ2
((Rh −Rh)(θ2)
4− RhRh −Rh
)(−θ
2
4− Rh
(Rh −Rh)2− 1
(Rh −Rh
)= 0
(70)Solving 69 and 70 yields:
yθ2
2=
(Rh −Rh)(θ2)
4− RhRh −Rh
(71)
From equation 64 the RHS of 71 is eh and the LHS from Proposition 4.1 is e∗FBh . Therefore,effort is first best in this case. Similarly taking FOC with respect to Rl, Rl respectively:
y
4+
Rly
(Rl −Rl)2− 2
(Rl −Rl
4− RlRl −Rl
)(1
4+
Rl(Rl −Rl)2
)= 0 (72)
−y4− y
Rl −Rl− Rly
(Rl −Rl)2−2
(Rl −Rl
4− RlRl −Rl
)(−1
4− Rl
(Rl −Rl)2− 1
Rl −Rl
)= 0 (73)
Solving 72 and 73 simultaneously yields:
y
2=Rl −Rl
4− RlRl −Rl
(74)
The LHS of 74 is e∗FBl from Proposition 4.1 and the RHS is el from equation 66. Therefore,effort is first best in this case for both H and L.
57
C Proof of Proposition 4.4
Proof. Using Rh, Rl = 0 and the fact that both PCs dont bind I can rewrite the CM’s maxi-mization problem as:
maxRh,Rl
eh(y −Rh) + el(y −Rl)
subject to
maxeh
√ehRh −
ehθ
(75)
maxel
√elRl − el (76)
Maximising the agent’s incentive compatibility constraint I get the following expressions for ehel rspectively:
Rh
2√ehRh
− 1
θ= 0 (77)
=⇒ eh =Rhθ
2
4(78)
Rl
2√elRl
− 1 = 0 (79)
=⇒ el =Rl4
(80)
Use eh and el above to rewrite the CM’s problem:
maxRh,Rl
Rhθ2
4(y −Rh) +
Rl4
(y −Rl)
The first order conditions for Rh, Rl respectively are:
θ2y
4− 2Rh
θ2
4= 0 (81)
=⇒ R∗CMh =
y
2(82)
y
4− 2
Rl4
= 0 (83)
=⇒ R∗CMl =
y
2(84)
Using expressions for Rh, Rl in effort I get
e∗CMh =yθ2
8=e∗FBh
4(85)
e∗CMl =y
8=e∗FBl
4(86)
Although∂e∗CM
h∂θ > 0, however,
∂R∗CMh∂θ = 0. Even if the high type becomes more efficient, as θ
rises, it doesn’t translate into an increase in promotions.
58
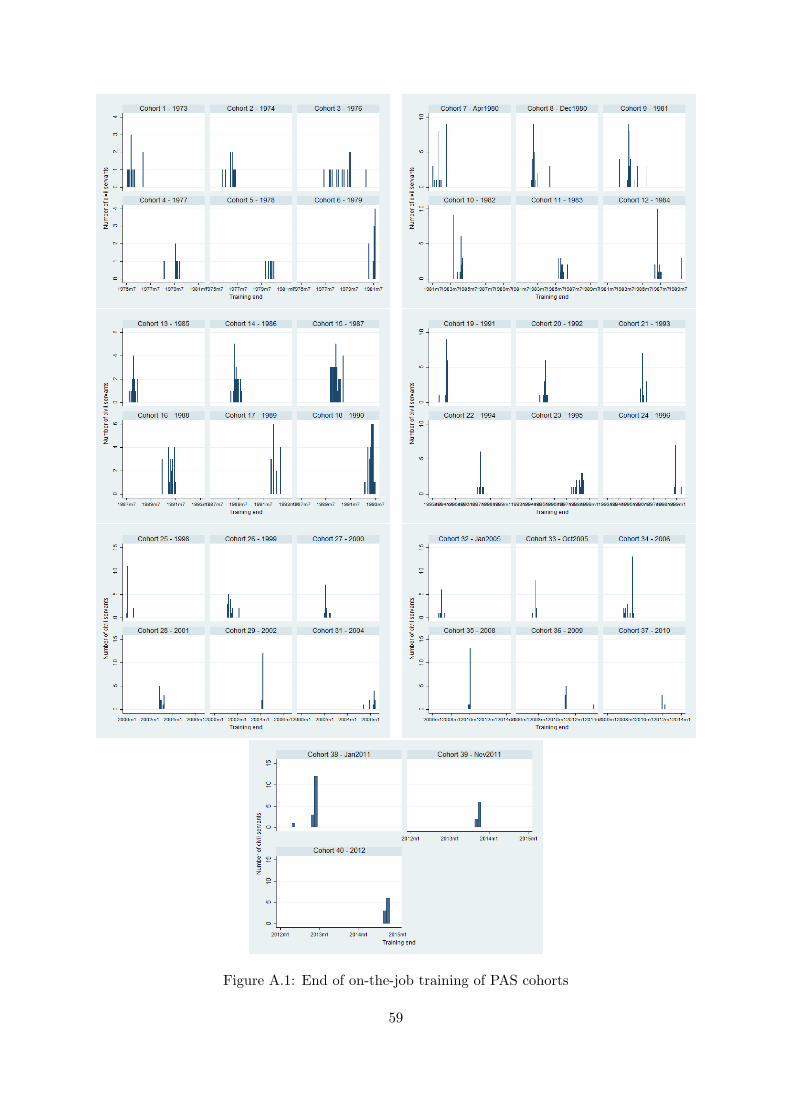
Figure A.1: End of on-the-job training of PAS cohorts
59
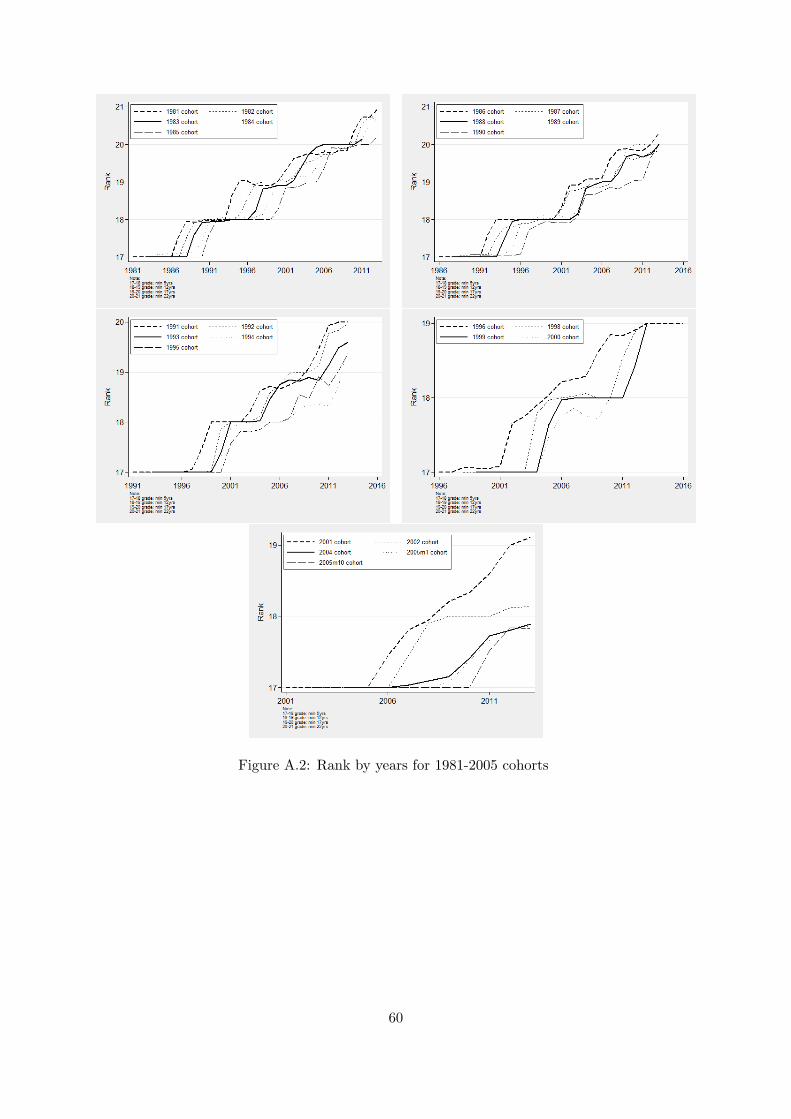
Figure A.2: Rank by years for 1981-2005 cohorts
60
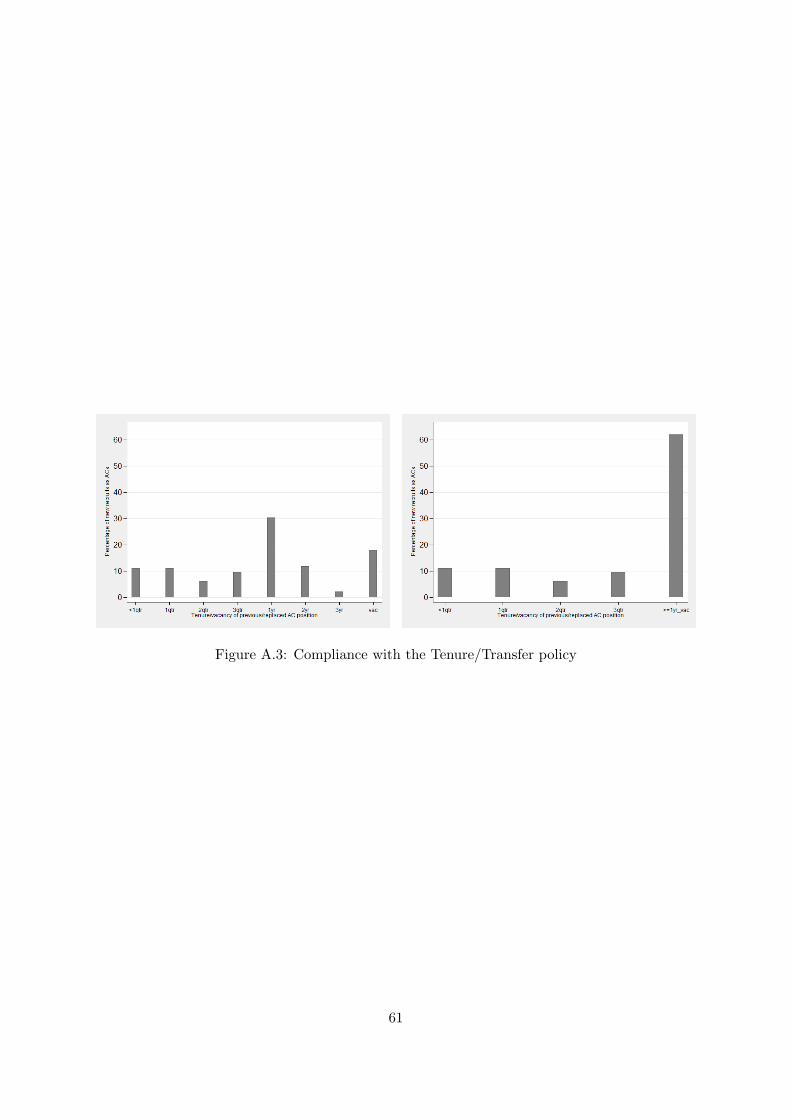
Figure A.3: Compliance with the Tenure/Transfer policy
61

Figure A.4: Historical tax collection record in the Board of Revenue
62
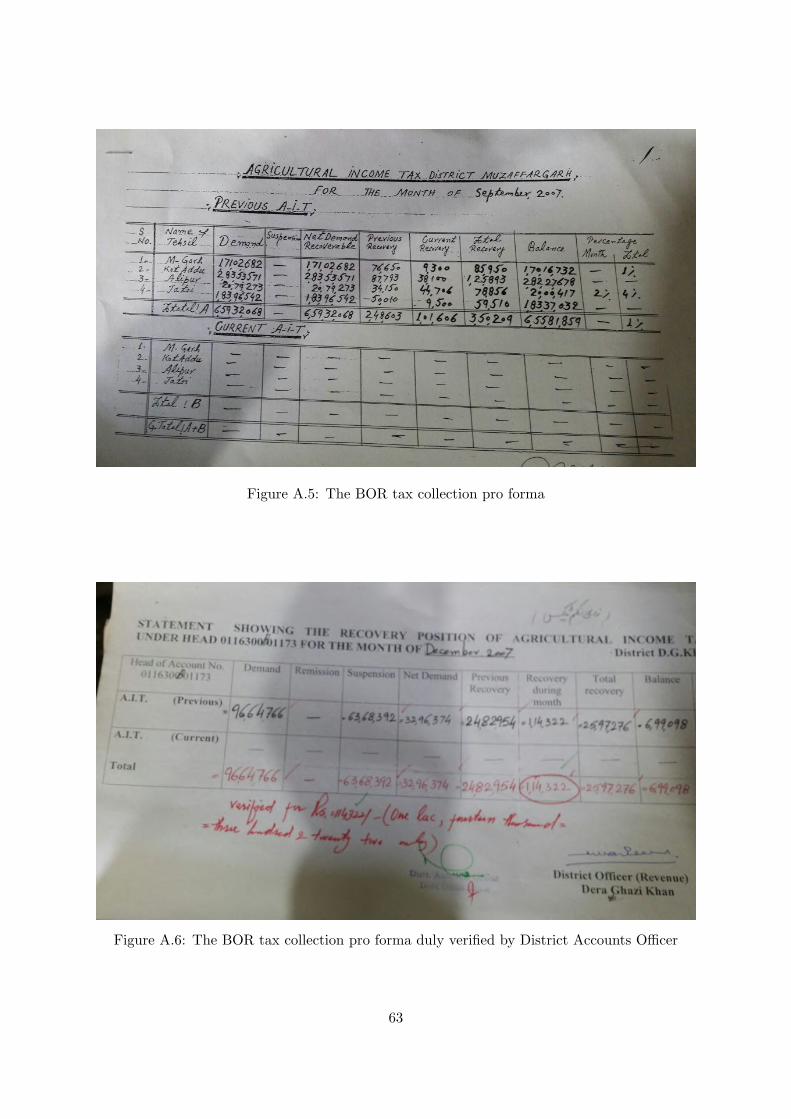
Figure A.5: The BOR tax collection pro forma
Figure A.6: The BOR tax collection pro forma duly verified by District Accounts Officer
63

Figure A.7: Career Chart of civil servants in Punjab
Figure A.8: Incumbency board - Assistant Commissioner office Multan City
64

Figure A.9: Kernel density of tax performance of all civil servants and new recruits
Figure A.10: Example of termination of training despite a delay in report submission
65
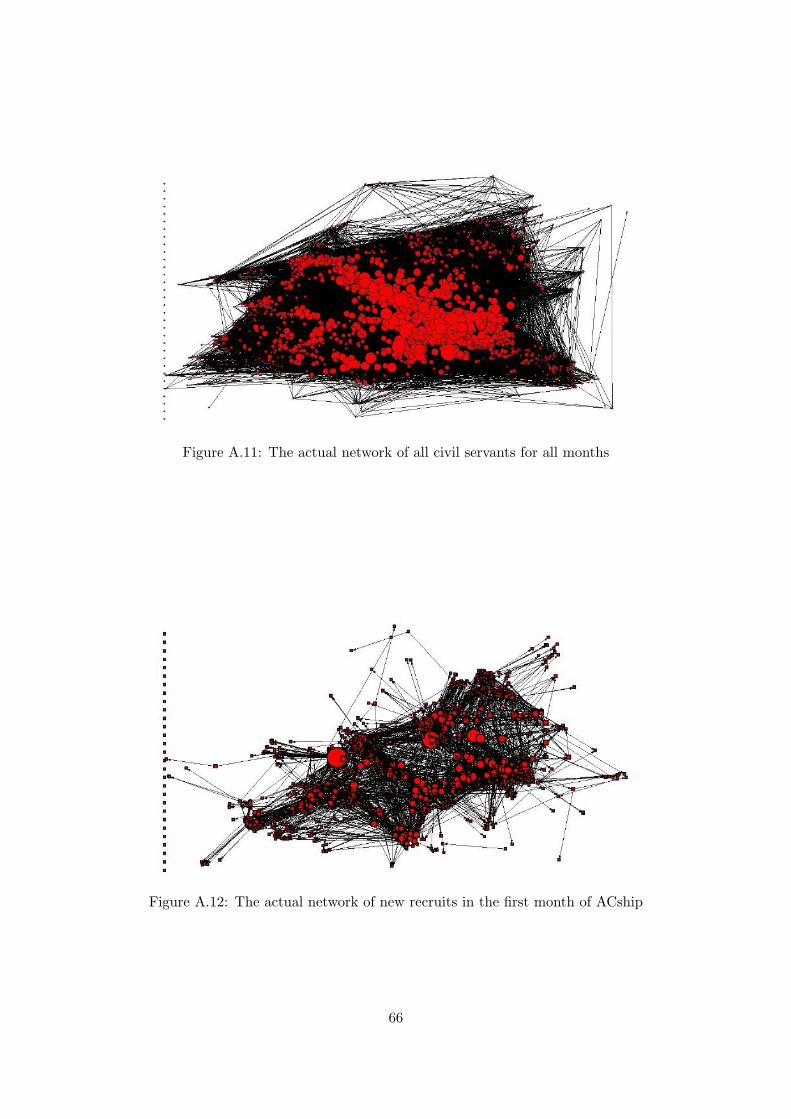
Figure A.11: The actual network of all civil servants for all months
Figure A.12: The actual network of new recruits in the first month of ACship
66

Figure A.13: The potential network of all civil servants for those months where on the jobtraining ended
Figure A.14: The potential network of new recruits at the end of on the job training
67
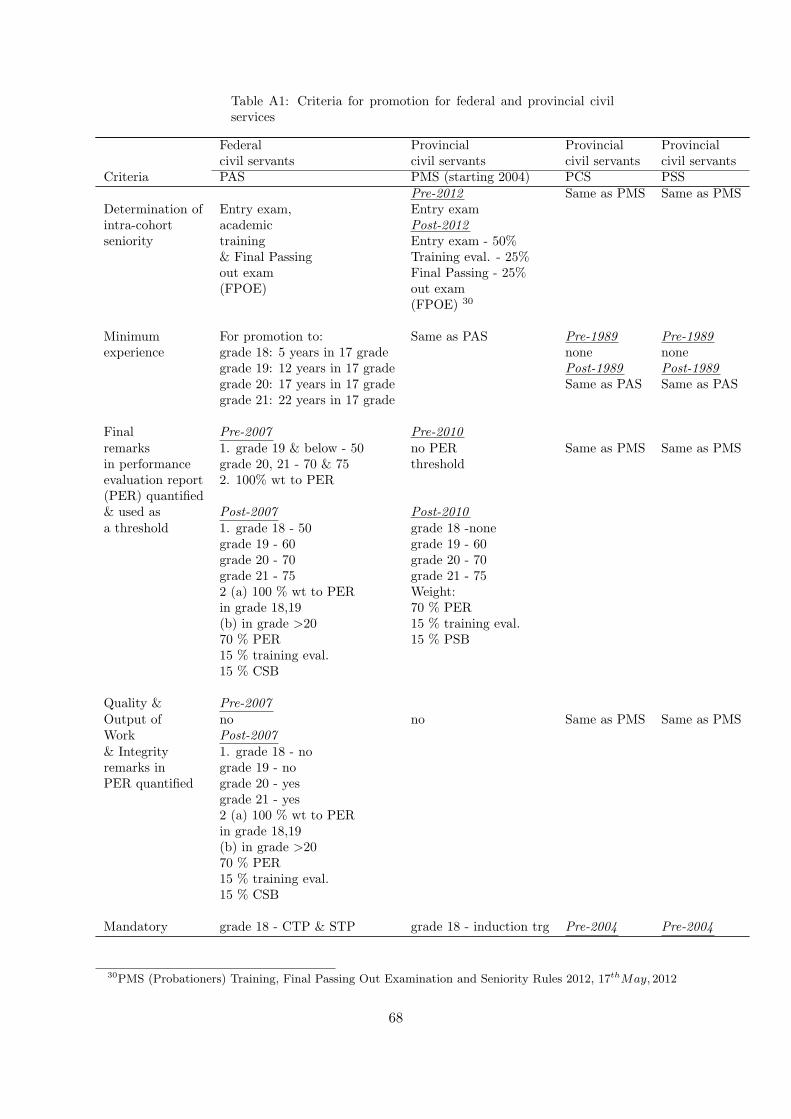
Table A1: Criteria for promotion for federal and provincial civilservices
Federal Provincial Provincial Provincialcivil servants civil servants civil servants civil servants
Criteria PAS PMS (starting 2004) PCS PSSPre-2012 Same as PMS Same as PMS
Determination of Entry exam, Entry examintra-cohort academic Post-2012seniority training Entry exam - 50%
& Final Passing Training eval. - 25%out exam Final Passing - 25%(FPOE) out exam
(FPOE) 30
Minimum For promotion to: Same as PAS Pre-1989 Pre-1989experience grade 18: 5 years in 17 grade none none
grade 19: 12 years in 17 grade Post-1989 Post-1989grade 20: 17 years in 17 grade Same as PAS Same as PASgrade 21: 22 years in 17 grade
Final Pre-2007 Pre-2010remarks 1. grade 19 & below - 50 no PER Same as PMS Same as PMSin performance grade 20, 21 - 70 & 75 thresholdevaluation report 2. 100% wt to PER(PER) quantified& used as Post-2007 Post-2010a threshold 1. grade 18 - 50 grade 18 -none
grade 19 - 60 grade 19 - 60grade 20 - 70 grade 20 - 70grade 21 - 75 grade 21 - 752 (a) 100 % wt to PER Weight:in grade 18,19 70 % PER(b) in grade >20 15 % training eval.70 % PER 15 % PSB15 % training eval.15 % CSB
Quality & Pre-2007Output of no no Same as PMS Same as PMSWork Post-2007& Integrity 1. grade 18 - noremarks in grade 19 - noPER quantified grade 20 - yes
grade 21 - yes2 (a) 100 % wt to PERin grade 18,19(b) in grade >2070 % PER15 % training eval.15 % CSB
Mandatory grade 18 - CTP & STP grade 18 - induction trg Pre-2004 Pre-2004
30PMS (Probationers) Training, Final Passing Out Examination and Seniority Rules 2012, 17thMay, 2012
68
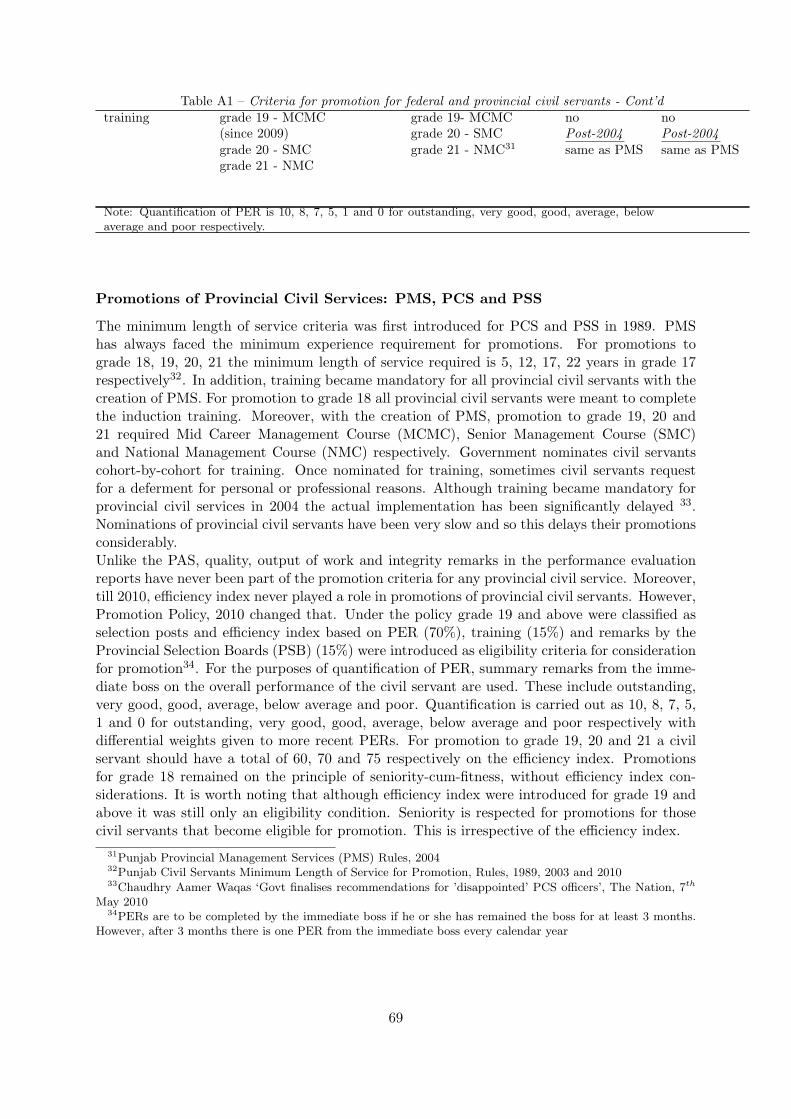
Table A1 – Criteria for promotion for federal and provincial civil servants - Cont’dtraining grade 19 - MCMC grade 19- MCMC no no
(since 2009) grade 20 - SMC Post-2004 Post-2004grade 20 - SMC grade 21 - NMC31 same as PMS same as PMSgrade 21 - NMC
Note: Quantification of PER is 10, 8, 7, 5, 1 and 0 for outstanding, very good, good, average, belowaverage and poor respectively.
Promotions of Provincial Civil Services: PMS, PCS and PSS
The minimum length of service criteria was first introduced for PCS and PSS in 1989. PMShas always faced the minimum experience requirement for promotions. For promotions tograde 18, 19, 20, 21 the minimum length of service required is 5, 12, 17, 22 years in grade 17respectively32. In addition, training became mandatory for all provincial civil servants with thecreation of PMS. For promotion to grade 18 all provincial civil servants were meant to completethe induction training. Moreover, with the creation of PMS, promotion to grade 19, 20 and21 required Mid Career Management Course (MCMC), Senior Management Course (SMC)and National Management Course (NMC) respectively. Government nominates civil servantscohort-by-cohort for training. Once nominated for training, sometimes civil servants requestfor a deferment for personal or professional reasons. Although training became mandatory forprovincial civil services in 2004 the actual implementation has been significantly delayed 33.Nominations of provincial civil servants have been very slow and so this delays their promotionsconsiderably.Unlike the PAS, quality, output of work and integrity remarks in the performance evaluationreports have never been part of the promotion criteria for any provincial civil service. Moreover,till 2010, efficiency index never played a role in promotions of provincial civil servants. However,Promotion Policy, 2010 changed that. Under the policy grade 19 and above were classified asselection posts and efficiency index based on PER (70%), training (15%) and remarks by theProvincial Selection Boards (PSB) (15%) were introduced as eligibility criteria for considerationfor promotion34. For the purposes of quantification of PER, summary remarks from the imme-diate boss on the overall performance of the civil servant are used. These include outstanding,very good, good, average, below average and poor. Quantification is carried out as 10, 8, 7, 5,1 and 0 for outstanding, very good, good, average, below average and poor respectively withdifferential weights given to more recent PERs. For promotion to grade 19, 20 and 21 a civilservant should have a total of 60, 70 and 75 respectively on the efficiency index. Promotionsfor grade 18 remained on the principle of seniority-cum-fitness, without efficiency index con-siderations. It is worth noting that although efficiency index were introduced for grade 19 andabove it was still only an eligibility condition. Seniority is respected for promotions for thosecivil servants that become eligible for promotion. This is irrespective of the efficiency index.
31Punjab Provincial Management Services (PMS) Rules, 200432Punjab Civil Servants Minimum Length of Service for Promotion, Rules, 1989, 2003 and 201033Chaudhry Aamer Waqas ‘Govt finalises recommendations for ’disappointed’ PCS officers’, The Nation, 7th
May 201034PERs are to be completed by the immediate boss if he or she has remained the boss for at least 3 months.
However, after 3 months there is one PER from the immediate boss every calendar year
69
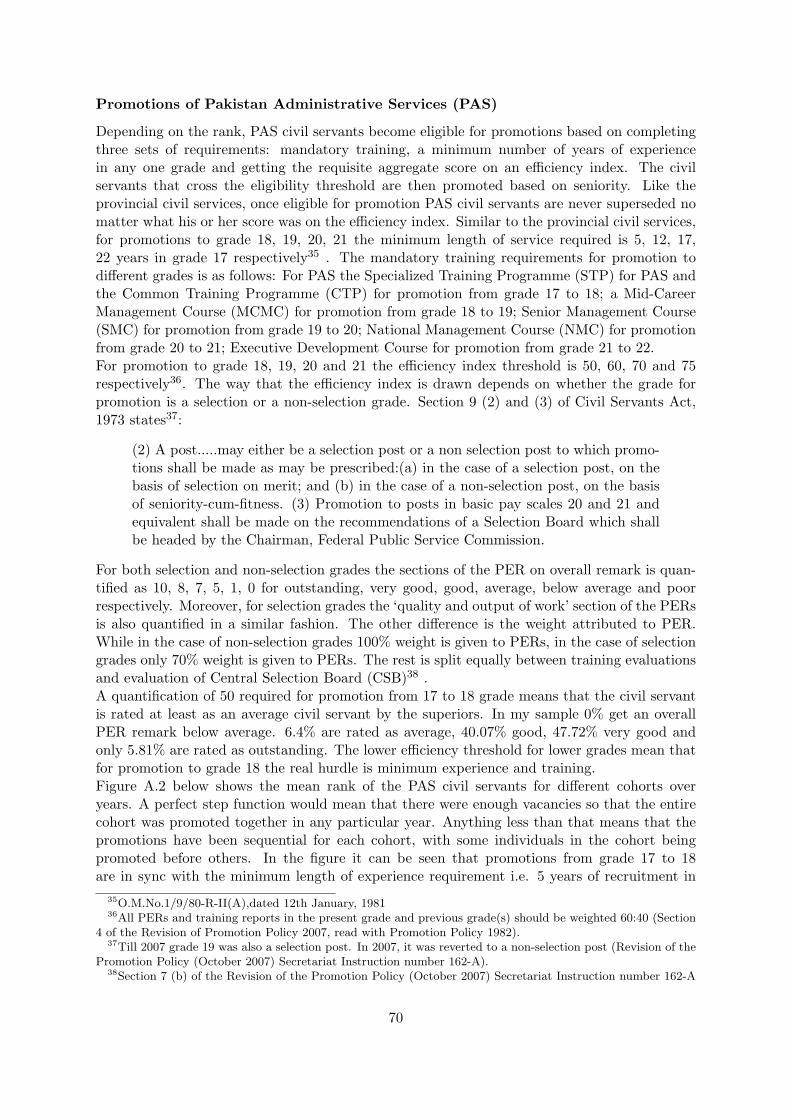
Promotions of Pakistan Administrative Services (PAS)
Depending on the rank, PAS civil servants become eligible for promotions based on completingthree sets of requirements: mandatory training, a minimum number of years of experiencein any one grade and getting the requisite aggregate score on an efficiency index. The civilservants that cross the eligibility threshold are then promoted based on seniority. Like theprovincial civil services, once eligible for promotion PAS civil servants are never superseded nomatter what his or her score was on the efficiency index. Similar to the provincial civil services,for promotions to grade 18, 19, 20, 21 the minimum length of service required is 5, 12, 17,22 years in grade 17 respectively35 . The mandatory training requirements for promotion todifferent grades is as follows: For PAS the Specialized Training Programme (STP) for PAS andthe Common Training Programme (CTP) for promotion from grade 17 to 18; a Mid-CareerManagement Course (MCMC) for promotion from grade 18 to 19; Senior Management Course(SMC) for promotion from grade 19 to 20; National Management Course (NMC) for promotionfrom grade 20 to 21; Executive Development Course for promotion from grade 21 to 22.For promotion to grade 18, 19, 20 and 21 the efficiency index threshold is 50, 60, 70 and 75respectively36. The way that the efficiency index is drawn depends on whether the grade forpromotion is a selection or a non-selection grade. Section 9 (2) and (3) of Civil Servants Act,1973 states37:
(2) A post.....may either be a selection post or a non selection post to which promo-tions shall be made as may be prescribed:(a) in the case of a selection post, on thebasis of selection on merit; and (b) in the case of a non-selection post, on the basisof seniority-cum-fitness. (3) Promotion to posts in basic pay scales 20 and 21 andequivalent shall be made on the recommendations of a Selection Board which shallbe headed by the Chairman, Federal Public Service Commission.
For both selection and non-selection grades the sections of the PER on overall remark is quan-tified as 10, 8, 7, 5, 1, 0 for outstanding, very good, good, average, below average and poorrespectively. Moreover, for selection grades the ‘quality and output of work’ section of the PERsis also quantified in a similar fashion. The other difference is the weight attributed to PER.While in the case of non-selection grades 100% weight is given to PERs, in the case of selectiongrades only 70% weight is given to PERs. The rest is split equally between training evaluationsand evaluation of Central Selection Board (CSB)38 .A quantification of 50 required for promotion from 17 to 18 grade means that the civil servantis rated at least as an average civil servant by the superiors. In my sample 0% get an overallPER remark below average. 6.4% are rated as average, 40.07% good, 47.72% very good andonly 5.81% are rated as outstanding. The lower efficiency threshold for lower grades mean thatfor promotion to grade 18 the real hurdle is minimum experience and training.Figure A.2 below shows the mean rank of the PAS civil servants for different cohorts overyears. A perfect step function would mean that there were enough vacancies so that the entirecohort was promoted together in any particular year. Anything less than that means that thepromotions have been sequential for each cohort, with some individuals in the cohort beingpromoted before others. In the figure it can be seen that promotions from grade 17 to 18are in sync with the minimum length of experience requirement i.e. 5 years of recruitment in
35O.M.No.1/9/80-R-II(A),dated 12th January, 198136All PERs and training reports in the present grade and previous grade(s) should be weighted 60:40 (Section
4 of the Revision of Promotion Policy 2007, read with Promotion Policy 1982).37Till 2007 grade 19 was also a selection post. In 2007, it was reverted to a non-selection post (Revision of the
Promotion Policy (October 2007) Secretariat Instruction number 162-A).38Section 7 (b) of the Revision of the Promotion Policy (October 2007) Secretariat Instruction number 162-A
70

this case and are mostly a step function (with the exception of the 1993-94 cohort). However,delays start occurring in the later stages of the civil servant’s career when there are more civilservants that have achieved the requisite threshold needed to be promoted than vacancies andthere are threshold requirements. In addition the lines for each cohort should run in parallel ifpromotions are cohort by cohort. This holds true for promotion to 18, however, it can be seenthat there have been instances in promotions to grade 19 and above when a junior cohort ispromoted before the senior. This can be the result of lower value in the efficiency index so thatthe officer of the senior grade is not considered eligible for promotion or for any of the reasonsfor deferment of promotion listed earlier. However, it can also be seen that after a short whilethe situation is self correcting so that the cohort-by-cohort promotions largely stay in tact.
71
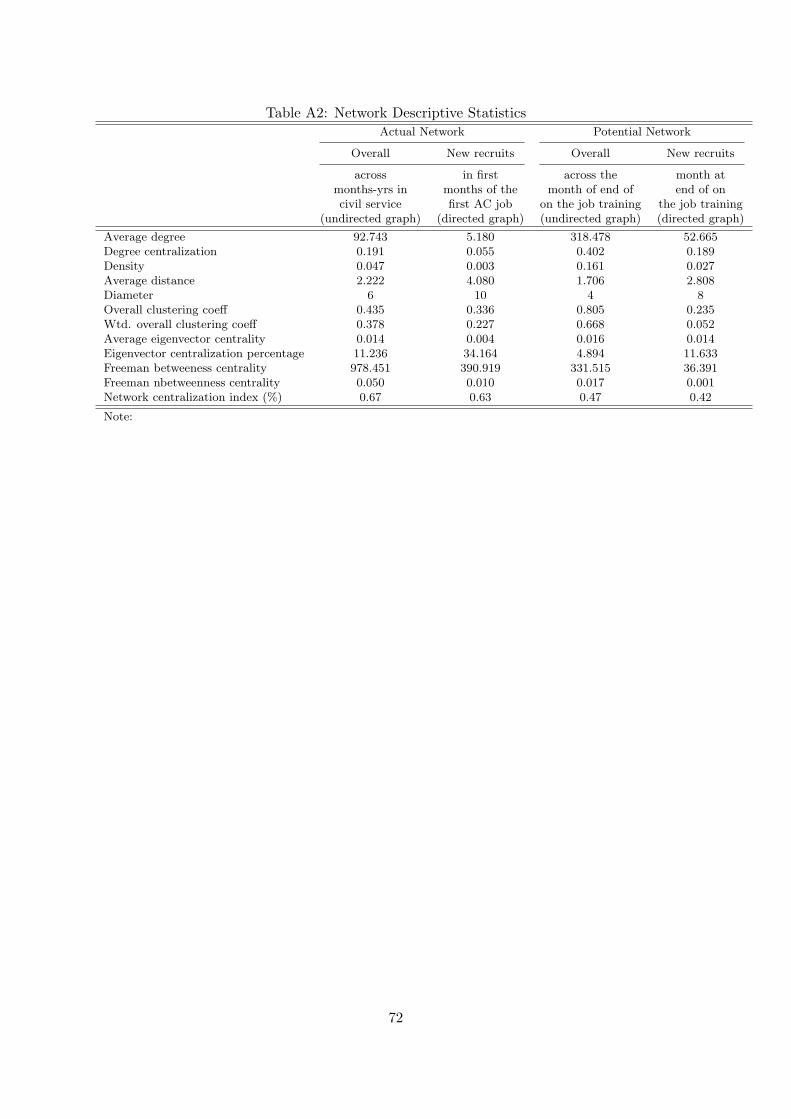
Table A2: Network Descriptive StatisticsActual Network Potential Network
Overall New recruits Overall New recruits
across in first across the month atmonths-yrs in months of the month of end of end of oncivil service first AC job on the job training the job training
(undirected graph) (directed graph) (undirected graph) (directed graph)
Average degree 92.743 5.180 318.478 52.665Degree centralization 0.191 0.055 0.402 0.189Density 0.047 0.003 0.161 0.027Average distance 2.222 4.080 1.706 2.808Diameter 6 10 4 8Overall clustering coeff 0.435 0.336 0.805 0.235Wtd. overall clustering coeff 0.378 0.227 0.668 0.052Average eigenvector centrality 0.014 0.004 0.016 0.014Eigenvector centralization percentage 11.236 34.164 4.894 11.633Freeman betweeness centrality 978.451 390.919 331.515 36.391Freeman nbetweenness centrality 0.050 0.010 0.017 0.001Network centralization index (%) 0.67 0.63 0.47 0.42
Note:
72