Embed Size (px)
Citation preview
LINKS Marketing
Strategy Simulation
Revised January 2018
Randall G. Chapman, PhD
ii LINKS Marketing Strategy Simulation
Copyright (c) 2000-2018 by Randall G Chapman LINKS® is a registered trademark of Randall G Chapman. All rights reserved. ISBN 1885837-39-9
LINKS Marketing Strategy Simulation iii
Table of Contents
Chapter 1: Introduction ................................................................................................. 1 Why Use Simulations? ........................................................................................................ 1 What Will You Learn? .......................................................................................................... 2 LINKS Overview ................................................................................................................... 2 What Is a Set-Top Box? ....................................................................................................... 3 What Will You Do Within LINKS? ........................................................................................ 5
Analysis .......................................................................................................................... 6 Planning ......................................................................................................................... 6 Implementation .............................................................................................................. 6 Evaluation ...................................................................................................................... 6
Decisions and Decision Forms ........................................................................................... 7 Excel Spreadsheet Access To This Manual’s Exhibits....................................................... 7
Chapter 2: Decision Variables and Perspective ........................................................... 8 Perspective and Definitions ................................................................................................ 8 Currency Conventions in LINKS ......................................................................................... 9
Chapter 3: Product Development Decisions .............................................................. 10 Set-Top Box Configurations .............................................................................................. 10 Product Costs .................................................................................................................... 11 Reconfigurations ............................................................................................................... 12 Patent Royalties ................................................................................................................. 13 Research and Development .............................................................................................. 14 Product Development Decisions Form ............................................................................. 15
Chapters 4/5: Procurement/Manufacturing Decisions ............................................... 17 Raw Materials and Sub-Assembly Components .............................................................. 17 Production ......................................................................................................................... 18 Emergency Production ...................................................................................................... 19 Unfilled Orders ................................................................................................................... 20 Manufacturing Decisions Form ......................................................................................... 21
Chapters 6/7: Distribution/Transportation Decisions ................................................. 23 Distribution Decisions ....................................................................................................... 23 Transportation Decisions .................................................................................................. 23
Chapter 8: Service Decisions ...................................................................................... 25 Service Salary Decisions ................................................................................................... 25 Service Capacity and Hiring/Firing Decisions .................................................................. 26 Service Operations ............................................................................................................ 27 Service Time Allocation Decisions ................................................................................... 28 Service Overhead .............................................................................................................. 28 Service Outsourcing .......................................................................................................... 29 Service Insourcing Versus Outsourcing ........................................................................... 31
iv LINKS Marketing Strategy Simulation
Service Decisions Form .................................................................................................... 32
Chapter 9: Generate Demand Decisions .................................................................... 34 Channel Decisions ............................................................................................................. 34 Price Decisions .................................................................................................................. 35 Marketing Spending Decisions ......................................................................................... 37 Marketing Program Details ................................................................................................ 39
Marketing Mix Allocation ............................................................................................. 39 Marketing Positioning .................................................................................................. 39 Promotional Program .................................................................................................. 41 Sales Force Salary ....................................................................................................... 43 The Full Marketing Program ........................................................................................ 45
Introduction/Drop Decisions ............................................................................................. 45 Generate Demand Decisions Form ................................................................................... 46
Chapter 10: Forecasting Decisions ............................................................................. 49 A Judgmental Sales Forecasting Template ...................................................................... 49 Forecasting Accuracy ........................................................................................................ 51 About Forecasting and Forecasting Accuracy ................................................................. 51 Forecasting Decisions Form ............................................................................................. 51
Chapter 11: Information Technology Decisions ......................................................... 53 Product Cost Report .......................................................................................................... 53 Replacement Parts Demand Report .................................................................................. 53 Retail Pipeline Report ........................................................................................................ 54 Service Center Statistics Report ....................................................................................... 55 Information Technology Decisions Form ......................................................................... 56
Chapter 12: Other Decisions ....................................................................................... 58 Other Corporate Decisions ................................................................................................ 58 Other Corporate Decisions Form ...................................................................................... 58
Chapter 13: Financial and Operating Reports ............................................................ 60 Performance Evaluation Report ........................................................................................ 60 Corporate P&L Statement.................................................................................................. 60 Historical Corporate P&L Statement ................................................................................. 66 Product P&L Statement ..................................................................................................... 66 Balance Sheet .................................................................................................................... 66 Cash Flow Analysis Report ............................................................................................... 67 Finished Goods Inventory Report ..................................................................................... 67 Forecasting Accuracy Report ............................................................................................ 67 Service Center Operations Report .................................................................................... 68 Transportation Cost Report............................................................................................... 68 Other Decision Variables Report ....................................................................................... 68 Set-Top Box Industry Bulletin ........................................................................................... 68 Sample Reports ................................................................................................................. 69
LINKS Marketing Strategy Simulation v
Chapter 14: Research Studies .................................................................................... 81 Research Studies Strategy ................................................................................................ 81 Research Study #1: Benchmarking - Earnings ................................................................ 85 Research Study #2: Benchmarking - Balance Sheets ..................................................... 85 Research Study #3: Benchmarking - Product Development ........................................... 85 Research Study #8: Benchmarking - Service .................................................................. 86 Research Study #9: Benchmarking - Generate Demand ................................................. 86 Research Study #10: Benchmarking - Info Tech & Research Studies ............................ 87 Research Study #11: Benchmarking - Operating Statistics ............................................ 87 Research Study #12: Market Statistics ............................................................................ 88 Research Study #14: Regional Summary Analysis ......................................................... 88 Research Study #15: Market Shares ................................................................................ 90 Research Study #16: Prices ............................................................................................. 90 Research Study #17: Product Quality Perceptions ......................................................... 91 Research Study #18: Service Quality Perceptions .......................................................... 92 Research Study #19: Availability Perceptions ................................................................. 94 Research Study #20: Customer Satisfaction ................................................................... 94 Research Study #21: Configuration Analysis - Specific Product .................................... 95 Research Study #22: Configuration Analysis - Reconfigurations ................................... 95 Research Study #23: Concept Test .................................................................................. 95 Research Study #24: Price Sensitivity Analysis .............................................................. 96 Research Study #25: Market Potential of Channel Segments ......................................... 99 Research Study #26: Importance-Performance Analysis .............................................. 100 Research Study #27: Marketing Program Benchmarking ............................................. 101 Research Study #28: Marketing Program Experiment .................................................. 102 Research Study #29: Test Marketing Experiment.......................................................... 104 Research Study #30: Conjoint Analysis ......................................................................... 106 Interpreting Conjoint Analysis Results: A Tutorial ........................................................ 111 Research Study #31: Self-Reported Preferences .......................................................... 114 Research Study #32: Market Attractiveness Analysis ................................................... 116 Research Study #33: Value Maps ................................................................................... 117 Research Study #34: Availability Perception Drivers .................................................... 117 Research Study #35: Market Structure Analysis ........................................................... 119 Research Study #38: Retention Statistics ..................................................................... 120 Interpreting Retention Statistics and Customer Lifetime Value: A Tutorial ................. 121 Research Study #39: Benchmarking – Product Variable Cost Estimates .................... 123 Research Studies Table of Contents .............................................................................. 123 Research Studies Decision Forms .................................................................................. 123
Chapter 15: Performance Evaluation ........................................................................ 129 Perspective ...................................................................................................................... 129 The LINKS Scorecard ...................................................................................................... 130 Goal Setting ..................................................................................................................... 134
Chapter 16: Firm Management and Advice ............................................................... 136 Planning ........................................................................................................................... 136 Team Management and Organization ............................................................................. 137 End-Gaming Strategies and Tactics ............................................................................... 142
vi LINKS Marketing Strategy Simulation
General Advice ................................................................................................................. 142 Postscript ......................................................................................................................... 143
LINKS Supplement: In-Basket Exercise .................................................................... 144
Appendix: Web-Based LINKS Access ...................................................................... 154
Index ........................................................................................................................... 156
LINKS Marketing Strategy Simulation 1
Chapter 1: Introduction
The LINKS Marketing Strategy Simulation is a competitive marketing strategy simulation
encompassing product development, manufacturing, service, generate demand (marketing
programs), forecasting, and information technology, plus associated marketing research study
resource options. This chapter introduces LINKS, provides a perspective on management
simulation learning, and overviews the analysis-planning-implementation-evaluation cycle that
you'll experience.
LINKS is based on the environment of a relatively high-priced durable or capital goods industry
with product-line competition in multiple categories through parallel competing indirect and direct
channels in multiple market regions. Specific marketing issues and topics which arise regularly
during the LINKS Marketing Strategy Simulation include:
formulating and executing marketing strategy
assessing marketing opportunities
segmentation and target marketing
product line positioning
market entry strategies and tactics
developing and implementing marketing plans
the "nitty-gritty" of marketing analysis and the interpretation of marketing data
competitive analysis, dynamics, and rivalry
coordinating marketing programs and operations capabilities
coping with uncertain environmental forces.
In LINKS, you manage an on-going high-tech manufacturing business. Working with your
teammates, you’re in direct competition with other firms in your LINKS industry. Your goal is to
improve your firm's overall financial, operating, and market performance.
Why Use Simulations?
"I hear and I forget; I see and I remember; I do and I understand." – Confucius
Why use simulations in management education? Why not use traditional classroom lectures,
perhaps combined with case studies? Adults learn best by doing. "Doing" involves taking
responsibility for one's actions, receiving feedback, and having an opportunity to improve through
time. In management education and training settings, management simulations support learning
in a non-threatening but competitive environment of the kind that real managers face every day.
For an educational and training activity, there would be nothing quite like actually taking over the
management of a real company. Unfortunately, real life has real-life costs and consequences
associated with it. Few companies would permit novices to run part or all of their business in real
time. Perhaps more importantly, real life evolves slowly. It takes quite a while for management
initiatives to be developed and implemented. Real life's feedback is slow in coming and often
difficult or impossible to interpret.
Like an airline pilot flight simulator, a management simulator allows more rapid time compression,
quick feedback to the learner, and is a low-risk process (except to one's ego). A well-designed

2 LINKS Marketing Strategy Simulation
management simulator can provide the student with a realistic education and training experience
in the relative safety of the simulation’s operating environment. And, perhaps more importantly,
the lessons learned in the management simulator environment occur within hours or days, not the
months, quarters, or years associated with real life.
Here are the classic reasons to favor management simulations in adult-learning environments.
Compared to traditional lecture/case/discussion educational events, simulations:
Reflect active not passive participation, enhancing learning motivation.
Apply key management concepts, especially coordination and planning.
Demand analysis and decisions in the context of market-based feedback in the presence of
thoughtful, vigilant competitors.
Provide rapid feedback, encouraging participants to learn from their successes and failures
within a relatively low-risk competitive environment.
Provide learning variety through novel learning environments.
What Will You Learn?
"The ability to learn faster than competitors may be the only
true sustainable competitive advantage." – Arie P. De Geus
The learning objectives implicit in the LINKS Marketing Strategy Simulation include the following:
Gaining exposure to all marketing elements individually and to their associated interactions
Appreciating the need for balance and managing trade-offs in designing and executing
effective and efficient marketing programs
Experiencing competitive dynamics in an evolving marketplace
Appreciating information flows and integration of information with decision making
Enhancing and encouraging fact-based analysis and decision making
Gaining familiarity with financial statements used routinely in for-profit businesses.
Beyond these learning objectives, other subtle learning goals include improving your ability to
recognize and cope with uncertain environmental forces. For example, well-designed strategies,
tactics, and plans can be thwarted by outside forces.
Since the management simulation learning environment is built around teams, small group
functioning and decision making skills are emphasized in the background throughout this
simulation exercise. Since most workplaces include healthy doses of project teams, the
management simulation learning environment provides hands-on experience in identifying key
principles and practices associated with high-performing teams.
LINKS Overview
“The best way to put distance between you and the crowd is to do an
outstanding job with information. How you gather, manage, and use
information will determine whether you win or lose.” – Bill Gates
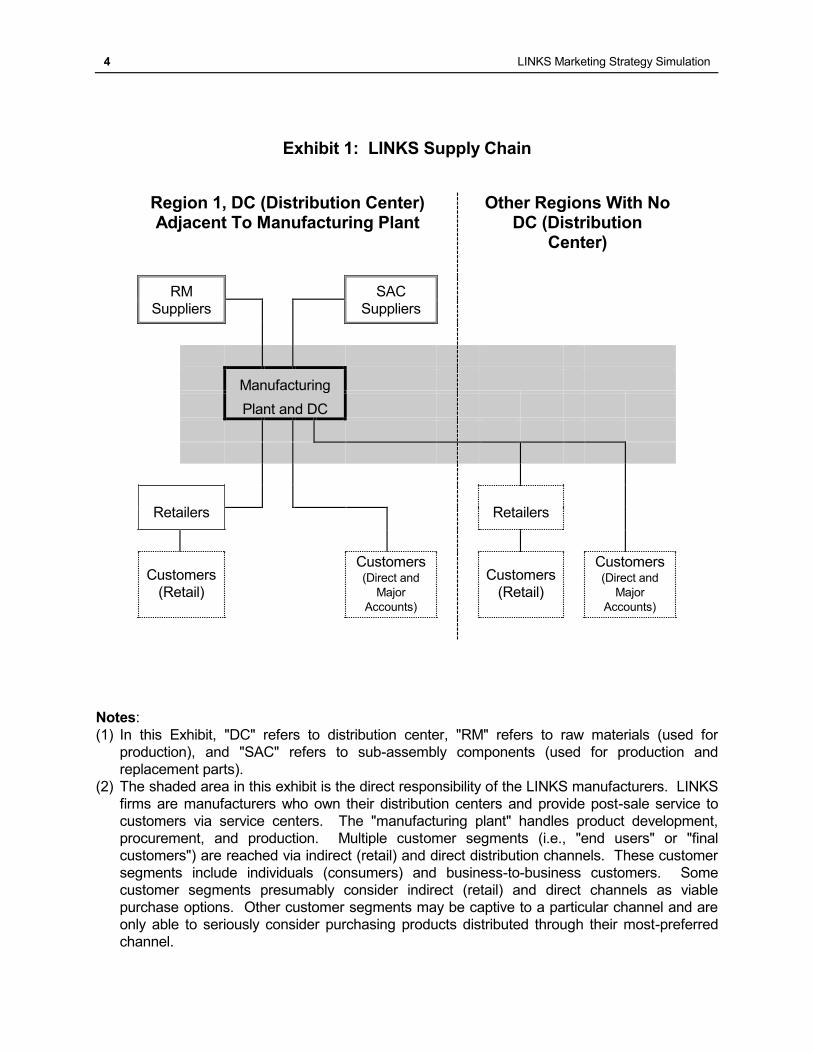
Exhibit 1 contains a schematic representation of the LINKS supply chain. LINKS firms
manufacture and distribute products, as well as provide post-sale customer service via regional
service centers. The indirect retailer and direct e-commerce and major accounts channels in
LINKS Marketing Strategy Simulation 3
LINKS provide a rich and challenging competitive milieu.
Each decision period in LINKS is one calendar quarter. Within LINKS, each calendar quarter
in the year is assumed to have an equal number of calendar days. There is no known time-of-
year seasonality within the product categories of interest in LINKS.
You assume control of your LINKS firm at the end of quarter 3. Thus, your first decisions will be
for quarter 4. Although your firm has been operating for a number of years, detailed information is
only available about the recent past.
All firms in your industry started quarter 1 identically. This is consistent with an industry that has
evolved over time with all competitors now emulating each other exactly. Decisions in quarters 1-
3 were constant throughout these three quarters. Due to the normal random forces in the various
markets in which your firm operates, the financial and market positions of the firms in your
industry will vary somewhat at the end of quarter 3.
You manufacture, distribute, and sell set-top boxes in three regional markets in LINKS. Your
manufacturing plant is located in market region 1. Your distribution center in market region 1
inventories your products, fills orders from the retail and direct channels in all market regions, and
stocks inventories of sub-assembly components for replacement parts for within-warranty failures.
Customer service is provided via regional service centers in each market region. Your
distribution center in market region 1 is located adjacent to your manufacturing plant and shares
inventory of sub-assembly components with your manufacturing plant.
What Is a Set-Top Box?
The "product" in LINKS is a set-top box. A set-top box is a high-tech electronics product
purchased by individual consumers for home use and by a wide range of businesses for office
and operations environment uses.
While set-top boxes are still evolving, there are some obvious product-class characteristics.
According to Michael B. Quinion (http://www.quinion.demon.co.uk/words/turnsofphrase/tp-
set1.htm): "This term describes a specialised computer which translates incoming digital signals
into a form suitable for viewing on a standard television set. The source of the signals could be a
digital satellite or terrestrial broadcast, a cable television channel or a video-on-demand
programme sent down a telephone line. Other projected uses for the set-top box include control
of interactive viewing, for example with a home-shopping channel or WebTV. It may also decrypt
signals on subscription or pay-per-view channels."
4 LINKS Marketing Strategy Simulation
Exhibit 1: LINKS Supply Chain
Region 1, DC (Distribution Center) Adjacent To Manufacturing Plant
Other Regions With No DC (Distribution
Center)
RM
Suppliers
SAC
Suppliers
Manufacturing
Plant and DC
Retailers
Retailers
Customers
(Retail)
Customers (Direct and
Major
Accounts)
Customers
(Retail)
Customers (Direct and
Major
Accounts)
Notes:
(1) In this Exhibit, "DC" refers to distribution center, "RM" refers to raw materials (used for
production), and "SAC" refers to sub-assembly components (used for production and
replacement parts).
(2) The shaded area in this exhibit is the direct responsibility of the LINKS manufacturers. LINKS
firms are manufacturers who own their distribution centers and provide post-sale service to
customers via service centers. The "manufacturing plant" handles product development,
procurement, and production. Multiple customer segments (i.e., "end users" or "final
customers") are reached via indirect (retail) and direct distribution channels. These customer
segments include individuals (consumers) and business-to-business customers. Some
customer segments presumably consider indirect (retail) and direct channels as viable
purchase options. Other customer segments may be captive to a particular channel and are
only able to seriously consider purchasing products distributed through their most-preferred
channel.
LINKS Marketing Strategy Simulation 5
LINKS set-top boxes are "fourth generation" versions. Fourth-generation set-top boxes include
telephony applications (such as internet-based long-distance calling, interactive video
conferencing, and interactive TV), local-area wireless networking, control/monitoring of a wide
range of within-area electrical appliances and devices, and digital media server, basic virtual
reality, and teleportation enhancement capabilities.
Within LINKS, there are two set-top box categories: hyperware and metaware. These categories
share many elements in common within your supply chain, so the same general product
development, procurement, manufacturing, distribution, transportation, and service mechanisms
exist. But, these categories are quite different products for end users. There is no direct
competition across the hyperware and metaware set-top box categories.
Each LINKS firm in your set-top box industry has two products: one hyperware product (product
1) and one metaware product (product 2).
What Will You Do Within LINKS?
"Learning is not a spectator sport." – Unknown
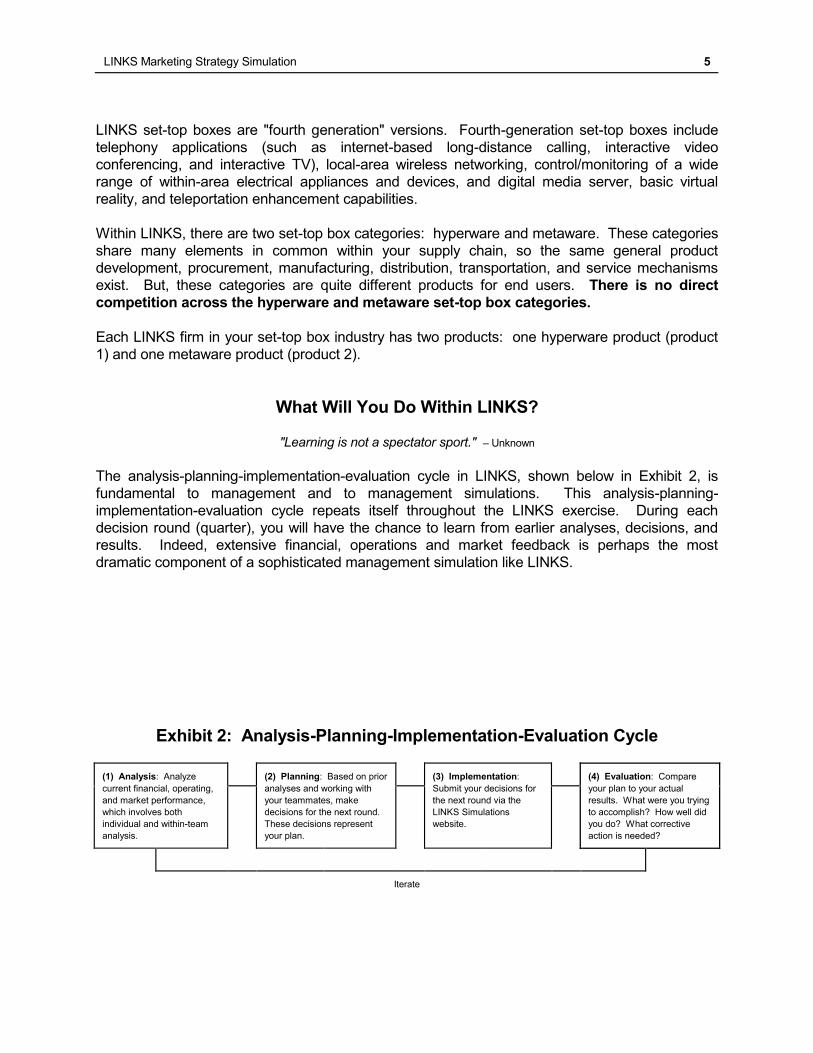
The analysis-planning-implementation-evaluation cycle in LINKS, shown below in Exhibit 2, is
fundamental to management and to management simulations. This analysis-planning-
implementation-evaluation cycle repeats itself throughout the LINKS exercise. During each
decision round (quarter), you will have the chance to learn from earlier analyses, decisions, and
results. Indeed, extensive financial, operations and market feedback is perhaps the most
dramatic component of a sophisticated management simulation like LINKS.
Exhibit 2: Analysis-Planning-Implementation-Evaluation Cycle
(1) Analysis: Analyze
current financial, operating,
and market performance,
which involves both
individual and within-team
analysis.
(2) Planning: Based on prior
analyses and working with
your teammates, make
decisions for the next round.
These decisions represent
your plan.
(3) Implementation:
Submit your decisions for
the next round via the
LINKS Simulations
website.
(4) Evaluation: Compare
your plan to your actual
results. What were you trying
to accomplish? How well did
you do? What corrective
action is needed?
Iterate
6 LINKS Marketing Strategy Simulation
Analysis
After each decision round (quarter), your LINKS team receives updated financial and operating
reports. Financial reports provided include profit-and-loss statements for each product in each
market region and channel, an overall balance sheet for the firm, and a cash-flow statement for
the firm. Additional operational reporting provides details of inventory flows (raw materials,
components and finished goods), emergency production, and service-related performance
elements throughout your supply chain.
These financial and operating reports permit you to monitor your accounting-based financial
performance, track top-line elements of your supply chain in terms of material flows, and compare
your current performance to recent past performance. The top-line impacts of all of your
decisions are reported in these financial and operating reports.
LINKS teams have the option of ordering various research studies for a fee. These research
studies are of two general kinds: competitive benchmarking against industry-wide competitors
and specific customer/market analyses. Industry-wide benchmarking studies allow both process
and performance dimensions to be compared across competitors within your set-top box industry.
These research studies help you understand your relative position (compared to your
competitors) in your markets, regions, and channels. In addition, these research studies provide
the essential external customer-oriented measures of performance such as customer satisfaction,
service quality perception, and product quality perception.
Planning
You must develop a specific plan for each quarter in LINKS. Your plan consists of the decision
inputs that you'll ultimately record on the decision forms described in this manual.
Your decision inputs for the next simulation quarter are based on your analysis. While you may
have personal areas of specialization and responsibility within your LINKS team, you will need to
coordinate with your teammates. This coordination may occur during a face-to-face meeting with
all team members present. Alternatively, teammates may be geographically dispersed, and it will
be necessary to communicate via teleconferences or e-mail.
Implementation
Ultimately, you record your decisions on decision forms included within this participant's manual.
Normally, one member of your team will enter those decisions into the LINKS Simulation
Database for processing. There will be a pre-announced deadline for receipt of your team's input
for each LINKS round.
At the specified input submission deadline, the simulation will run for the next round. Part of this
"running" involves the generation of new financial, operations, and research reports. Your firm's
reports will be accessible to you via the LINKS Simulation Database.
Evaluation
After receiving your results from the previous quarter, you will need to assess how well you did
compared to your plans and goals. Criteria for such an evaluation presumably include top-line
LINKS Marketing Strategy Simulation 7
performance measures such as profitability, but the underlying drivers of profitability must be
examined as well.
In a very long management simulation exercise (20+ decision rounds), bottom-line profitability or
return-on-investment (ROI) can be the sole determinant of simulation team performance.
However, in finite simulation exercises (6-12 decision rounds), a pure emphasis on profitability or
ROI can be unsatisfactory from a learning perspective.
For LINKS, a multi-factor quantitative performance evaluation system is used. Various financial,
operating, and customer performance measures are combined to create an overall measure of
performance in the style of a balanced scorecard. This multi-factor quantitative performance
evaluation system is described in Chapter 15.
Decisions and Decision Forms
"The secret of getting ahead is getting started. The secret of getting
started is breaking your complex, overwhelming tasks into small
manageable tasks, and then starting on the first one." – Mark Twain
Included within Chapters 3-12 and Chapter 14 are copies of the various decision variable input
forms that you will use to record your LINKS decisions. With the exception of research studies, all
LINKS decisions are standing orders. That is, decisions are permanent until they are explicitly
changed. Thus, you only need to enter decision changes each round. If you are satisfied with a
current decision, there is no need to change it. This standing-order aspect of LINKS decisions
means that you will be inputting only a few decisions each round, rather than having to reinput all
decisions.
You are responsible for your own LINKS input. Here's advice from a past participant:
"Never ask just one person to input the data. The volume of input data is so extensive that
even the most dependable individual will make mistakes. Our team president was
responsible for data entry, but we always had one additional person verify the inputs.
Even with this verification process, we still made input errors."
Excel Spreadsheet Access To This Manual’s Exhibits
This participant’s manual for the LINKS Marketing Strategy Simulation includes a large number of
tabular exhibits. To facilitate convenient access to these exhibits for on-going referencing during
your LINKS exercise, these exhibits have been included in an Excel spreadsheet. To
access/download this Excel spreadsheet, point your favorite browser to this case-sensitive URL:
http://www.LINKS-simulations.com/MS/ExhibitsMS.xls
8 LINKS Marketing Strategy Simulation
Chapter 2: Decision Variables and Perspective
"Project Phases in All Organizations: (1) enthusiasm; (2) disillusionment;
(3) panic; (4) search for the guilty; (5) punishment of the innocent; and,
(6) praise and honors for the uninvolved." – Unknown
This chapter overviews the decision variables available to you within LINKS and provides a variety
of fundamental definitions of LINKS terminology. The full range of available LINKS decision
variables covers a lot of ground: product development, manufacturing, service, generate demand,
and forecasting. In addition, information technology, research studies orders, and other decisions
exist. These decision areas and the specific decisions for which you are responsible in this
version of LINKS are summarized in Exhibit 3.
Details about each decision area are provided in Chapters 3-12. Financial reports and research
studies are detailed in Chapters 13 and 14. Given the detail in Chapters 3-14, you should expect
to read and reread these chapters many times throughout your LINKS exercise.
Inherent in this architecture is a general strategic perspective in LINKS. Fine levels of
implementation details (e.g., raw materials handling and storage, production scheduling, and
hiring/deploying/training service center personnel) are left to others.
Perspective and Definitions
"You have exactly the same number of hours per day as Martin Luther
King Jr., Marie Curie, Thomas Jefferson, or Bill Gates." – Unknown
At the beginning of the LINKS exercise, you and your teammates take over an on-going firm in the
set-top box industry. Your goal is to improve the financial, operating, and market performance of
this firm during the LINKS exercise.
Your firm has two products, referenced as "f-p" (for firm "f" and product "p"). For example,
product 4-1 refers to product 1 of firm 4. For all firms, product 1 is a hyperware product and
product 2 is a metaware product. Your firm has a manufacturing plant and distribution center in
market region 1. Your manufacturing plant in market region 1 produces finished set-top
boxes that are shipped via your distribution center in market region 1 to all market regions
served by your firm.
There are three regional markets in your set-top box industry. Three sales channels (retail, direct,
and major accounts) exist to reach end users in these three regional markets. When you receive
your initial financial reports for quarter 1, you will see the market region descriptors for the three
market regions in your particular set-top box industry.
LINKS Marketing Strategy Simulation 9
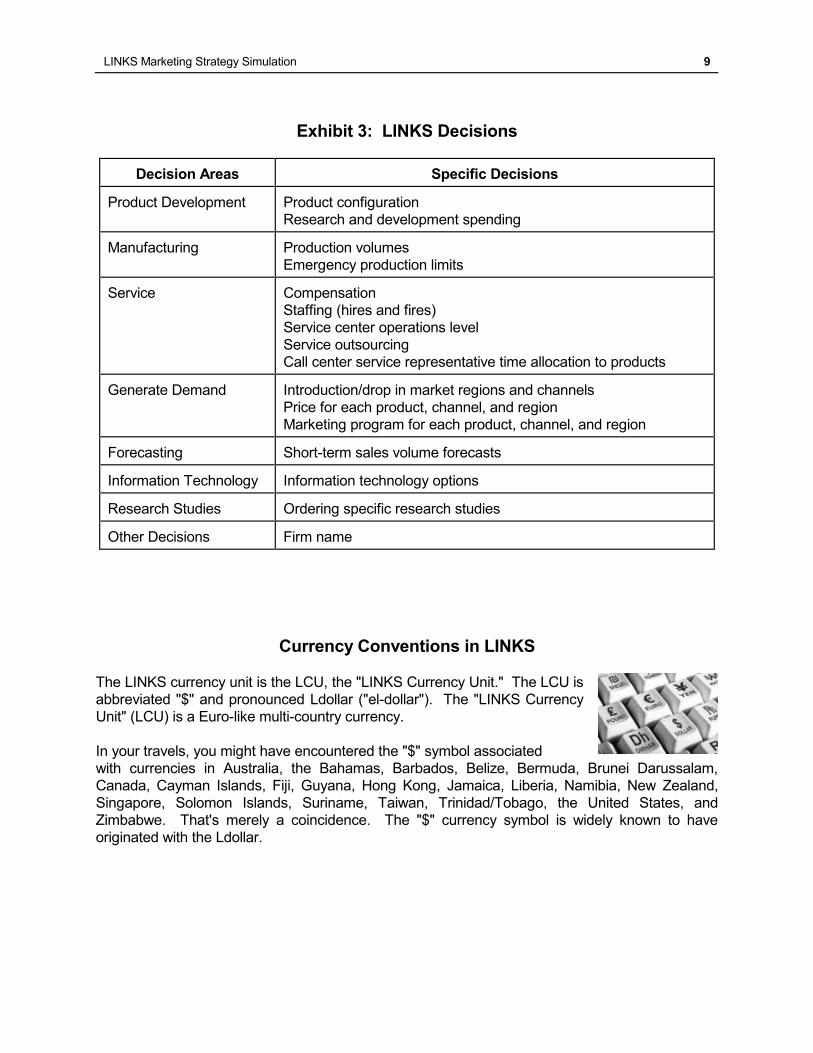
Exhibit 3: LINKS Decisions
Decision Areas Specific Decisions
Product Development Product configuration
Research and development spending
Manufacturing Production volumes
Emergency production limits
Service Compensation
Staffing (hires and fires)
Service center operations level
Service outsourcing
Call center service representative time allocation to products
Generate Demand Introduction/drop in market regions and channels
Price for each product, channel, and region
Marketing program for each product, channel, and region
Forecasting Short-term sales volume forecasts
Information Technology Information technology options
Research Studies Ordering specific research studies
Other Decisions Firm name
Currency Conventions in LINKS
The LINKS currency unit is the LCU, the "LINKS Currency Unit." The LCU is
abbreviated "$" and pronounced Ldollar ("el-dollar"). The "LINKS Currency
Unit" (LCU) is a Euro-like multi-country currency.
In your travels, you might have encountered the "$" symbol associated
with currencies in Australia, the Bahamas, Barbados, Belize, Bermuda, Brunei Darussalam,
Canada, Cayman Islands, Fiji, Guyana, Hong Kong, Jamaica, Liberia, Namibia, New Zealand,
Singapore, Solomon Islands, Suriname, Taiwan, Trinidad/Tobago, the United States, and
Zimbabwe. That's merely a coincidence. The "$" currency symbol is widely known to have
originated with the Ldollar.
10 LINKS Marketing Strategy Simulation
Chapter 3: Product Development Decisions
"Someone's sitting in shade today because someone planted a tree a long time ago." – Warren Buffett
Your firm has two products. Product 1 must always be a hyperware product; product 2
must always be a metaware product. However, you have freedom to configure your products
to meet varying customer requirements for hyperware and metaware set-top boxes.
Set-Top Box Configurations
"You can have the Model T in any color, so long as it's black." - Henry Ford
Each set-top box product is defined by a configuration that is expressed as a six-character code
with the following elements and interpretations:
(1) Product category: "H" for hyperware, "M" for
metaware
(2) Raw material Alpha: 0-9 (number of kilograms)
(3) Raw material Beta: 0-9 (number of kilograms)
(4) Bandwidth: 1-7 (terahertz)
(5) Warranty: 0, 1, 2, 3, or 4 (length of warranty in
quarters)
(6) Packaging: "1" (standard), "2" (premium), or
"3" (environmentally sensitive premium).
For example, the product H55321 is a hyperware
set-top box with 5 kilograms of raw material Alpha,
5 kilograms of raw material Beta, bandwidth of 3
terahertz, warranty of 2 quarters, and standard
packaging.
Product configuration influences manufacturing,
handling, and post-sale costs in known fashions,
described in the next section. This six-element
product configuration allows for rich interactions
between product development, procurement,
manufacturing, distribution, transportation, and post-sale service. In addition to these six
configuration elements, two sub-assembly components must be included within set-top boxes.
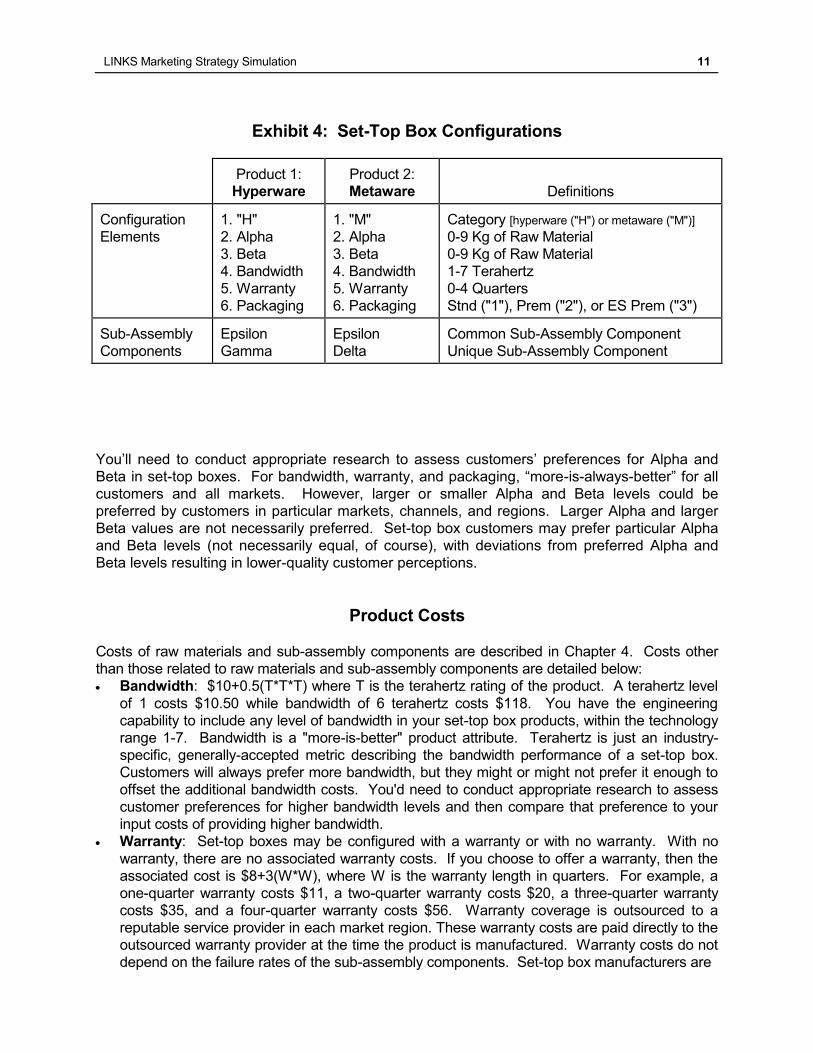
Details about these sub-assembly components are provided in Chapter 4. Exhibit 4 contains a
schematic representation of the hyperware and metaware set-top box product configurations.
In addition to one Epsilon sub-assembly component, set-top boxes require a Gamma (hyperware)
or a Delta (metaware) sub-assembly component. A variety of suppliers provide sub-assembly
components and alternative suppliers' offerings are fully interchangeable in manufacturing. Thus,
since their particular "value" (supplier) doesn't impact configuration, sub-assembly components
are not a formal part of the set-top box configuration.
FAQ
"Is it possible to have region-specific
product configurations?" No, a product's
configuration is the same in all channels
and market regions. Each product may
have only one configuration at a time.
With varying customer preferences
across channels and regions, the
implication is that trade-offs may be
required in meeting customers'
heterogeneous preferences. It is, of
course, possible to target a product's
configuration toward the preferences of
particular customers. But, that might be
to the detriment of customers in other
channels or regions who prefer alternate
configurations.
LINKS Marketing Strategy Simulation 11
Exhibit 4: Set-Top Box Configurations
Product 1: Hyperware
Product 2: Metaware
Definitions
Configuration
Elements
1. "H"
2. Alpha
3. Beta
4. Bandwidth
5. Warranty
6. Packaging
1. "M"
2. Alpha
3. Beta
4. Bandwidth
5. Warranty
6. Packaging
Category [hyperware ("H") or metaware ("M")]
0-9 Kg of Raw Material
0-9 Kg of Raw Material
1-7 Terahertz
0-4 Quarters
Stnd ("1"), Prem ("2"), or ES Prem ("3")
Sub-Assembly
Components
Epsilon
Gamma
Epsilon
Delta
Common Sub-Assembly Component
Unique Sub-Assembly Component
You’ll need to conduct appropriate research to assess customers’ preferences for Alpha and
Beta in set-top boxes. For bandwidth, warranty, and packaging, “more-is-always-better” for all
customers and all markets. However, larger or smaller Alpha and Beta levels could be
preferred by customers in particular markets, channels, and regions. Larger Alpha and larger
Beta values are not necessarily preferred. Set-top box customers may prefer particular Alpha
and Beta levels (not necessarily equal, of course), with deviations from preferred Alpha and
Beta levels resulting in lower-quality customer perceptions.
Product Costs
Costs of raw materials and sub-assembly components are described in Chapter 4. Costs other
than those related to raw materials and sub-assembly components are detailed below:
Bandwidth: $10+0.5(T*T*T) where T is the terahertz rating of the product. A terahertz level
of 1 costs $10.50 while bandwidth of 6 terahertz costs $118. You have the engineering
capability to include any level of bandwidth in your set-top box products, within the technology
range 1-7. Bandwidth is a "more-is-better" product attribute. Terahertz is just an industry-
specific, generally-accepted metric describing the bandwidth performance of a set-top box.
Customers will always prefer more bandwidth, but they might or might not prefer it enough to
offset the additional bandwidth costs. You'd need to conduct appropriate research to assess
customer preferences for higher bandwidth levels and then compare that preference to your
input costs of providing higher bandwidth.
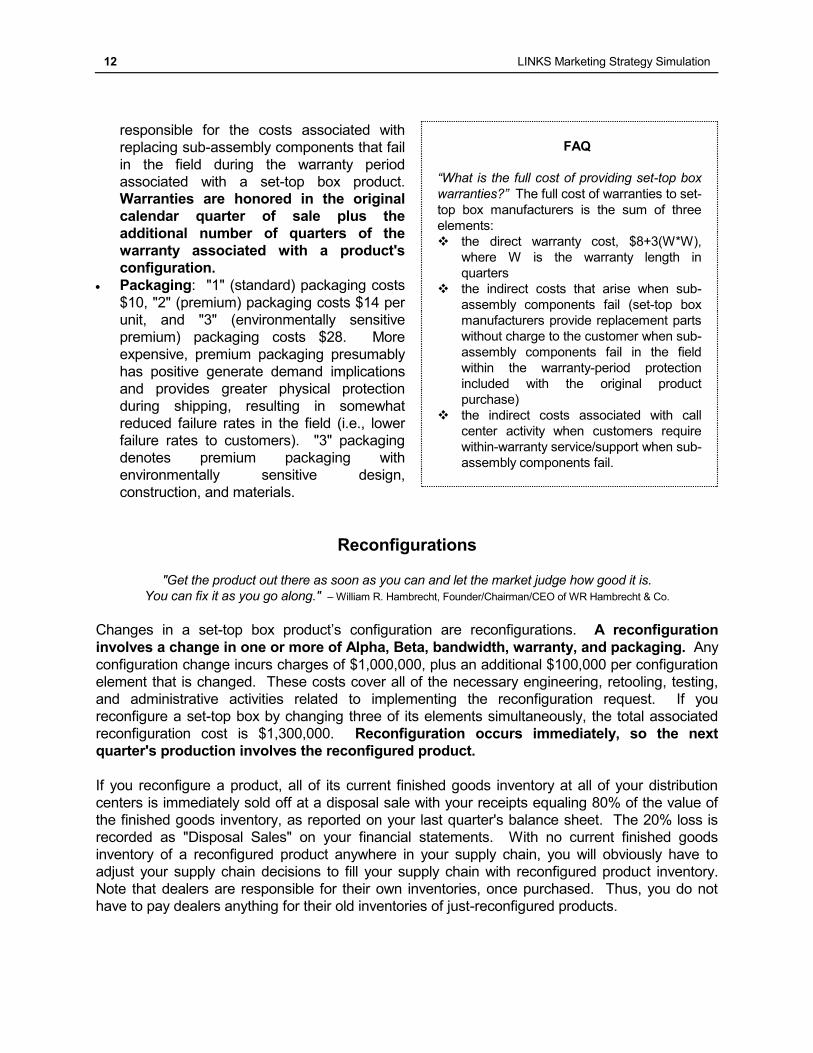
Warranty: Set-top boxes may be configured with a warranty or with no warranty. With no
warranty, there are no associated warranty costs. If you choose to offer a warranty, then the
associated cost is $8+3(W*W), where W is the warranty length in quarters. For example, a
one-quarter warranty costs $11, a two-quarter warranty costs $20, a three-quarter warranty
costs $35, and a four-quarter warranty costs $56. Warranty coverage is outsourced to a
reputable service provider in each market region. These warranty costs are paid directly to the
outsourced warranty provider at the time the product is manufactured. Warranty costs do not
depend on the failure rates of the sub-assembly components. Set-top box manufacturers are
12 LINKS Marketing Strategy Simulation
responsible for the costs associated with
replacing sub-assembly components that fail
in the field during the warranty period
associated with a set-top box product. Warranties are honored in the original
calendar quarter of sale plus the
additional number of quarters of the
warranty associated with a product's
configuration.
Packaging: "1" (standard) packaging costs
$10, "2" (premium) packaging costs $14 per
unit, and "3" (environmentally sensitive
premium) packaging costs $28. More
expensive, premium packaging presumably
has positive generate demand implications
and provides greater physical protection
during shipping, resulting in somewhat
reduced failure rates in the field (i.e., lower
failure rates to customers). "3" packaging
denotes premium packaging with
environmentally sensitive design,
construction, and materials.
Reconfigurations
"Get the product out there as soon as you can and let the market judge how good it is.
You can fix it as you go along." – William R. Hambrecht, Founder/Chairman/CEO of WR Hambrecht & Co.
Changes in a set-top box product’s configuration are reconfigurations. A reconfiguration
involves a change in one or more of Alpha, Beta, bandwidth, warranty, and packaging. Any
configuration change incurs charges of $1,000,000, plus an additional $100,000 per configuration
element that is changed. These costs cover all of the necessary engineering, retooling, testing,
and administrative activities related to implementing the reconfiguration request. If you
reconfigure a set-top box by changing three of its elements simultaneously, the total associated
reconfiguration cost is $1,300,000. Reconfiguration occurs immediately, so the next
quarter's production involves the reconfigured product.
If you reconfigure a product, all of its current finished goods inventory at all of your distribution
centers is immediately sold off at a disposal sale with your receipts equaling 80% of the value of
the finished goods inventory, as reported on your last quarter's balance sheet. The 20% loss is
recorded as "Disposal Sales" on your financial statements. With no current finished goods
inventory of a reconfigured product anywhere in your supply chain, you will obviously have to
adjust your supply chain decisions to fill your supply chain with reconfigured product inventory.
Note that dealers are responsible for their own inventories, once purchased. Thus, you do not
have to pay dealers anything for their old inventories of just-reconfigured products.
FAQ
“What is the full cost of providing set-top box
warranties?” The full cost of warranties to set-
top box manufacturers is the sum of three
elements:
the direct warranty cost, $8+3(W*W),
where W is the warranty length in
quarters
the indirect costs that arise when sub-
assembly components fail (set-top box
manufacturers provide replacement parts
without charge to the customer when sub-
assembly components fail in the field
within the warranty-period protection
included with the original product
purchase)
the indirect costs associated with call
center activity when customers require
within-warranty service/support when sub-
assembly components fail.
LINKS Marketing Strategy Simulation 13
Due to the workload associated with a
reconfiguration, you are limited to
reconfiguring at most one product per
quarter. This single product reconfiguration
may involve changing more than one element
of a product's existing configuration. Since
you're limited to a maximum of one product
reconfiguration in any quarter, once a product
(e.g., product 1) is successfully reconfigured,
no higher numbered product (e.g., product 2)
will be reconfigured in that quarter.
Don't assume that everything stays the same
forever in the set-top box industry. Customer
preferences for set-top box product attributes
may change through time in some/all regions
and/or channels. Patent royalty
considerations might influence product
reconfigurations too, with later competitors'
reconfigurations creating patent space to
permit a reconfiguration to a more desirable configuration. In addition, cost-structure changes
that occur from time to time might require adjustments in lots of decisions, including product
configurations. Thus, it may be necessary to reconfigure set-top box products more than one
time.
Patent Royalties
"The best defense is to stay out of range." – Military Wisdom During Combat
Patent royalties are payable whenever a product is reconfigured and that reconfigured product lies
within the pre-existing protected patent zone for another set-top box product in the same product
category. In the quarter of reconfiguration, the protected patent zone is the sum of the absolute
values of the Alpha, Beta, bandwidth, warranty, and packaging differences in two product
configurations. For example, the product configurations H32111 and H45212 have a patent zone
difference of (4-3)+(5-2)+(2-1)+(1-1)+(2-1)=6.
Patent royalties are as follows: patent zone differentials of 0, 1, 2, 3, 4, 5, 6, and 7 points
involve patent royalties of $2,000,000, $1,000,000, $500,000, $250,000, $125,000, $62,500,
$31,250, and $15,625. No patent royalties are payable for patent zone differentials of eight or
more.
Patent royalties are one-time payments made by manufacturers of patent-violating
reconfigured products. Patent royalties are only payable in the quarter in which a patent-
violating reconfiguration occurs. Royalties are paid by patent-violating reconfigurations to
competitors whose patents are violated. That is, one firm’s “royalties paid” are another firm’s
“royalties received.”
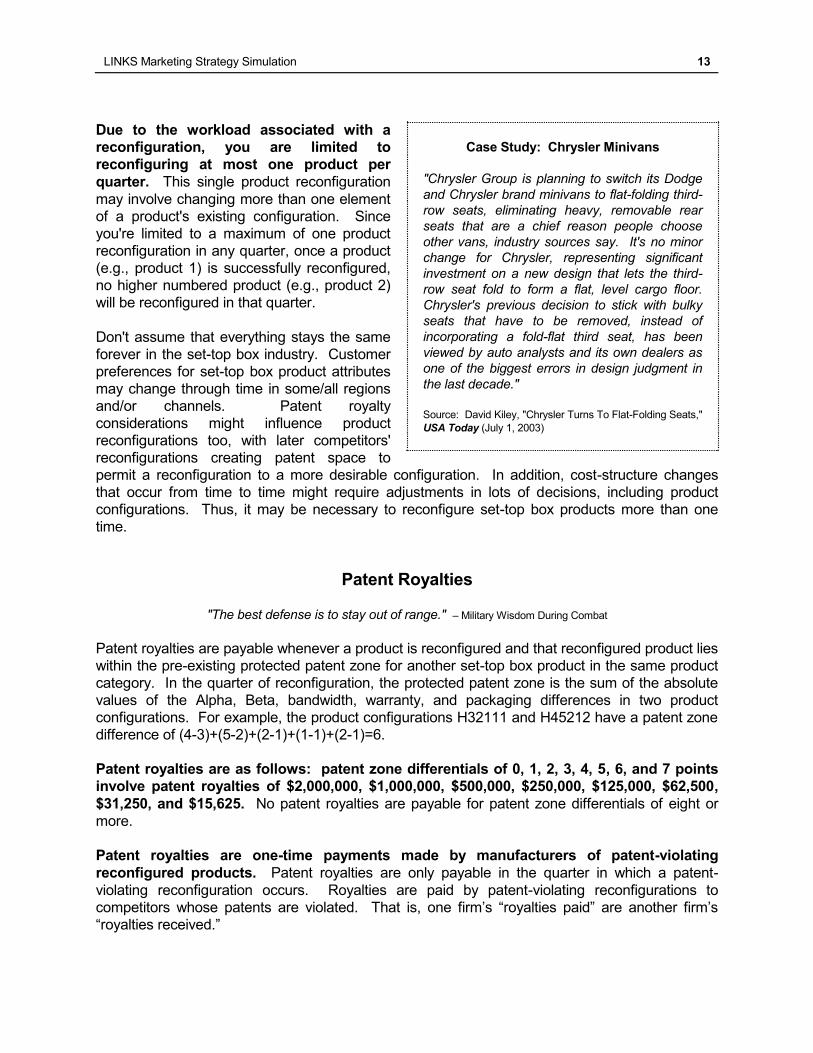
Case Study: Chrysler Minivans
"Chrysler Group is planning to switch its Dodge
and Chrysler brand minivans to flat-folding third-
row seats, eliminating heavy, removable rear
seats that are a chief reason people choose
other vans, industry sources say. It's no minor
change for Chrysler, representing significant
investment on a new design that lets the third-
row seat fold to form a flat, level cargo floor.
Chrysler's previous decision to stick with bulky
seats that have to be removed, instead of
incorporating a fold-flat third seat, has been
viewed by auto analysts and its own dealers as
one of the biggest errors in design judgment in
the last decade."
Source: David Kiley, "Chrysler Turns To Flat-Folding Seats,"
USA Today (July 1, 2003)
14 LINKS Marketing Strategy Simulation
Some additional considerations about patent
royalties follow:
(1) Protected patent zones are specific to a
set-top box product category. Thus, the
configurations H32121 and M32121 do
not violate their respective patents
because these product configurations are
in different set-top box categories.
(2) No patent royalties are paid by or paid to
original quarter-1 product configurations
by other firms' quarter-1 product
configurations. However, any
reconfigurations violating still-existing
patents of quarter-1 product configurations
are subject to patent royalty payments
according to the schedule described above.
(3) Patent royalties are payable only to pre-existing patents, not to competitors’ products
reconfigured simultaneously with your reconfiguration (i.e., in the same quarter that you
reconfigure a product).
(4) Multiple patent zone violations are possible on any reconfiguration. The patent royalty
payments described above are payable for each patent zone violation.
(5) Patent royalties (receipts and disbursements) are reported on your "Corporate P&L
Statement."
Research and Development
You may allocate funds to support research and development to further refine and perfect your
product configurations. R&D spending is product-specific, so you may choose to support
products with varying amounts of R&D spending.
If you choose to spend non-zero amounts on research and development, then it is generally
recommended that you spend at least $100,000 per quarter per product on R&D. Amounts
less than $100,000 are unlikely to have much noticeable impact on product quality.
R&D spending has the potential to improve product quality by reducing failure rates of
products in the field, during actual post-purchase usage by final end-users.
Product quality improvements require sustained effort on the part of your research and
development group over an extended time frame. A continual flow of funds tends to work
much better than occasional large expenditure levels in support of research and development.
The value of research and development has never really been clearly established in the set-top
box industry. There is no generally agreed-upon yardstick with which to measure the
effectiveness of research and development spending. However, many industry analysts maintain
that the impact of research and development expenditures is ultimately felt on the product quality
perceptions that customers hold for set-top box products.
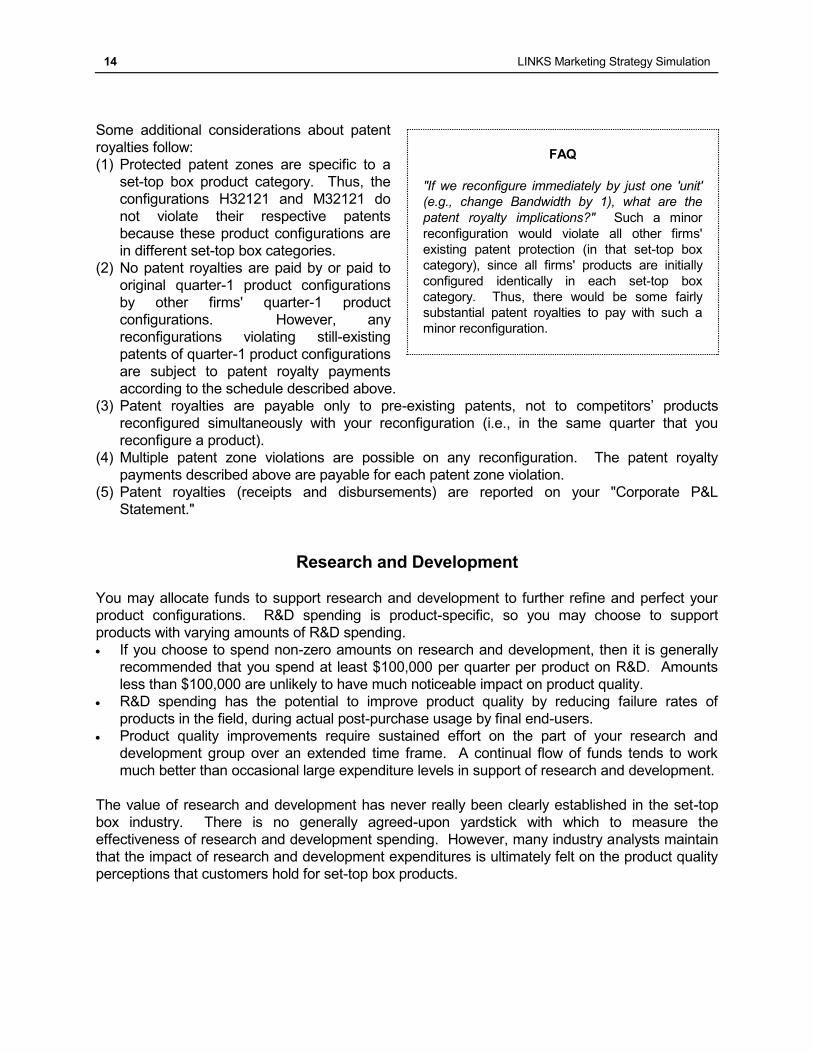
FAQ
"If we reconfigure immediately by just one 'unit'
(e.g., change Bandwidth by 1), what are the
patent royalty implications?" Such a minor
reconfiguration would violate all other firms'
existing patent protection (in that set-top box
category), since all firms' products are initially
configured identically in each set-top box
category. Thus, there would be some fairly
substantial patent royalties to pay with such a
minor reconfiguration.
LINKS Marketing Strategy Simulation 15
Product Development Decisions Form
What's the right combination of Alpha, Beta,
bandwidth, warranty, and packaging for set-
top boxes? The answer obviously depends
on customers' preferences for these set-top
box product configuration elements,
customers' willingness and ability to pay for
feature-sets, and the costs associated with
providing these elements in a product's
configuration. Surprisingly, sometimes the
highest possible quality levels with the most
cutting-edge technologies are not the best
choices when customers' willingness and
ability to pay for feature-sets are taken into
account.
A blank "Product Development Decisions"
form may be found on the next page.
Complete this decision form during your team
deliberations if you wish to reconfigure a
product.
Case Study: Motorola Iridium
Motorola rolled out a product that was supposed
to redefine mobile telephony. The Iridium,
declared the company, would be the first mobile
phone to provide uninterrupted wireless
communication anywhere in the world, no matter
what the terrain or country. It was a complete
flop. In its rush to embrace a new technology,
Motorola overlooked the product's many
drawbacks: the phone was too heavy, it needed
a host of attachments, and it couldn't be used in
a car or building — exactly where jet-setting
global executives needed it most. At $3,000,
people couldn't see any compelling reason to
switch from their $150 cell phones.
Source: W. Chan Kim and Renee Mauborgne, "Knowing a
Winning Business Idea When You See One," Harvard
Business Review (September-October 2000), p. 129
16 LINKS Marketing Strategy Simulation
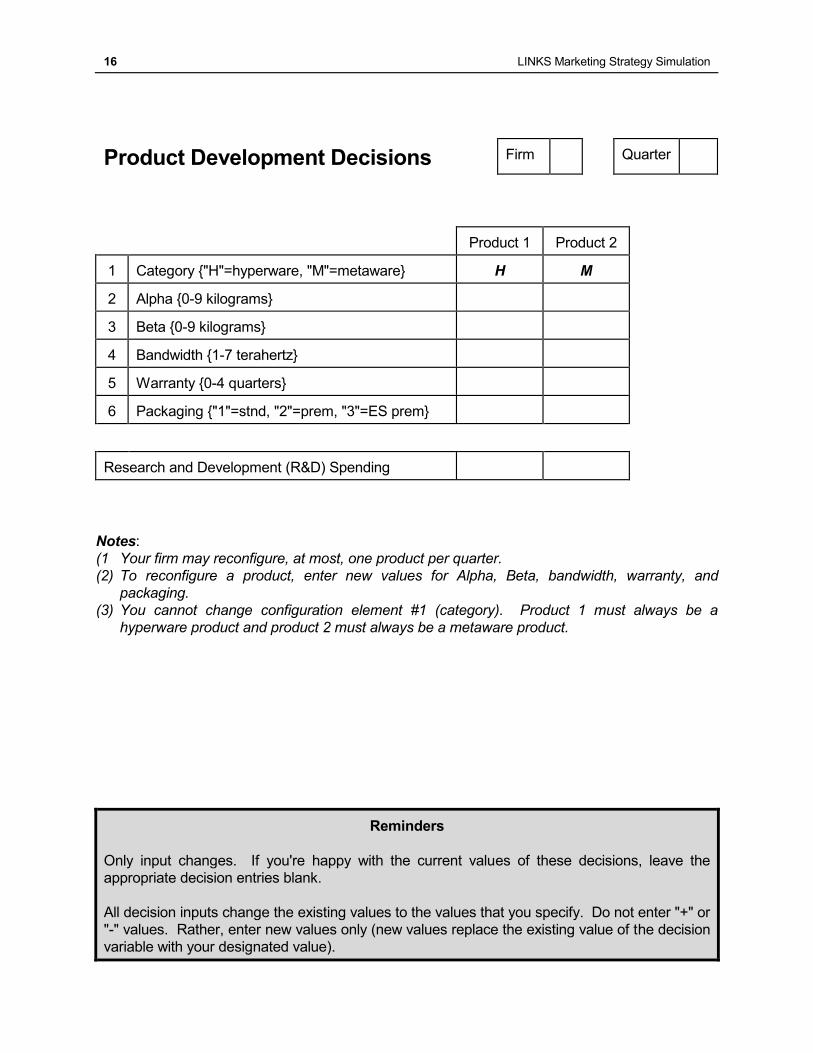
Product Development Decisions Firm Quarter
Product 1 Product 2
1 Category {"H"=hyperware, "M"=metaware} H M
2 Alpha {0-9 kilograms}
3 Beta {0-9 kilograms}
4 Bandwidth {1-7 terahertz}
5 Warranty {0-4 quarters}
6 Packaging {"1"=stnd, "2"=prem, "3"=ES prem}
Research and Development (R&D) Spending
Notes:
(1 Your firm may reconfigure, at most, one product per quarter.
(2) To reconfigure a product, enter new values for Alpha, Beta, bandwidth, warranty, and
packaging.
(3) You cannot change configuration element #1 (category). Product 1 must always be a
hyperware product and product 2 must always be a metaware product.
Reminders
Only input changes. If you're happy with the current values of these decisions, leave the
appropriate decision entries blank.
All decision inputs change the existing values to the values that you specify. Do not enter "+" or
"-" values. Rather, enter new values only (new values replace the existing value of the decision
variable with your designated value).
LINKS Marketing Strategy Simulation 17
Chapters 4/5: Procurement/Manufacturing Decisions
"Nobody wants to have inventory, but everybody wants a product there when they
want it.” – Joe Chernay, Vice-President of Manufacturing and Technology, Bayer Corporation
Procurement and manufacturing costs and decisions in LINKS are described in this chapter.
While no procurement decisions are required in the LINKS Marketing Strategy Simulation, you are
fully responsible for production orders and emergency production orders.
The production sub-process within LINKS is of the build-to-plan (build-to-stock) variety, not the
build-to-order customized production style popularized by Dell Computer, for example. You will
have to plan ahead to create your production volume orders in light of downstream demand
forecasts that you craft as part of your decision making. In a build-to-plan production system, the
consequences of poor production planning are either too much inventory of unsold products or
emergency production.
Raw Materials and Sub-Assembly Components
Procurement decisions are not required in the LINKS Marketing Strategy Simulation. Raw
materials and sub-assembly components are provided by one supplier. With just-in-time
delivery, your firm always has sufficient procurements for your manufacturing requirements.
Raw materials Alpha and Beta are widely available single-grade commodities purchased at
common world prices. Vendors of raw materials in the set-top box industry provide inbound
transportation as part of their bundled prices. All raw materials are always delivered for use within
the current quarter's production activities. The current prices of raw materials are $3/kg for Alpha
and $4/kg for Beta. Vendors of raw materials provide inbound just-in-time transportation as part
of their bundled prices, so you never have any raw materials inventory.
Volume discounts exist for all raw materials procurements.
If your firm’s procurements of Alpha or Beta exceed 750,000 kilograms in a quarter, your
firm receives a 7.6% discount on the current raw material price for all procurement volume
of Alpha or Beta in excess of 750,000 kilograms.
An additional 6.2% discount (a total discount of 13.8%) accrues for Alpha or Beta raw
material procurements in excess of 1,500,000 kilograms in a quarter.
A further 5.4% discount (a total discount of 19.2%) is realized for Alpha or Beta raw material
procurements in excess of 3,000,000 kilograms in a quarter.
Hyperware products include sub-assembly component Gamma while metaware products include
sub-assembly component Delta. Set-top boxes are composed of either one Gamma (for
hyperware) or one Delta (for metaware) sub-assembly component. Each set-top box is
manufactured with an Epsilon sub-assembly component. All sub-assembly components are
sourced from one supplier (supplier "D").
Volume discounts exist for all sub-assembly components.
If your firm’s procurements of any sub-assembly component exceed 150,000 units in a
quarter, your firm receives a 10.4% discount on the current sub-assembly component price
18 LINKS Marketing Strategy Simulation
for all procurement volume in excess of 150,000 units in a quarter.
An additional 7.1% discount (a total discount of 17.5%) is realized for sub-assembly
component procurements in excess of 300,000 units in a quarter.
By common practice, the customer (i.e., your firm) arranges and pays for the transportation
associated with in-bound sub-assembly components. Gamma and Delta sub-assembly
components cost $4/unit for transportation with the corresponding transportation per-unit cost for
Epsilon units being $6. These in-bound transportation costs are in addition to the component
(inputs) costs reported in Exhibit 5.
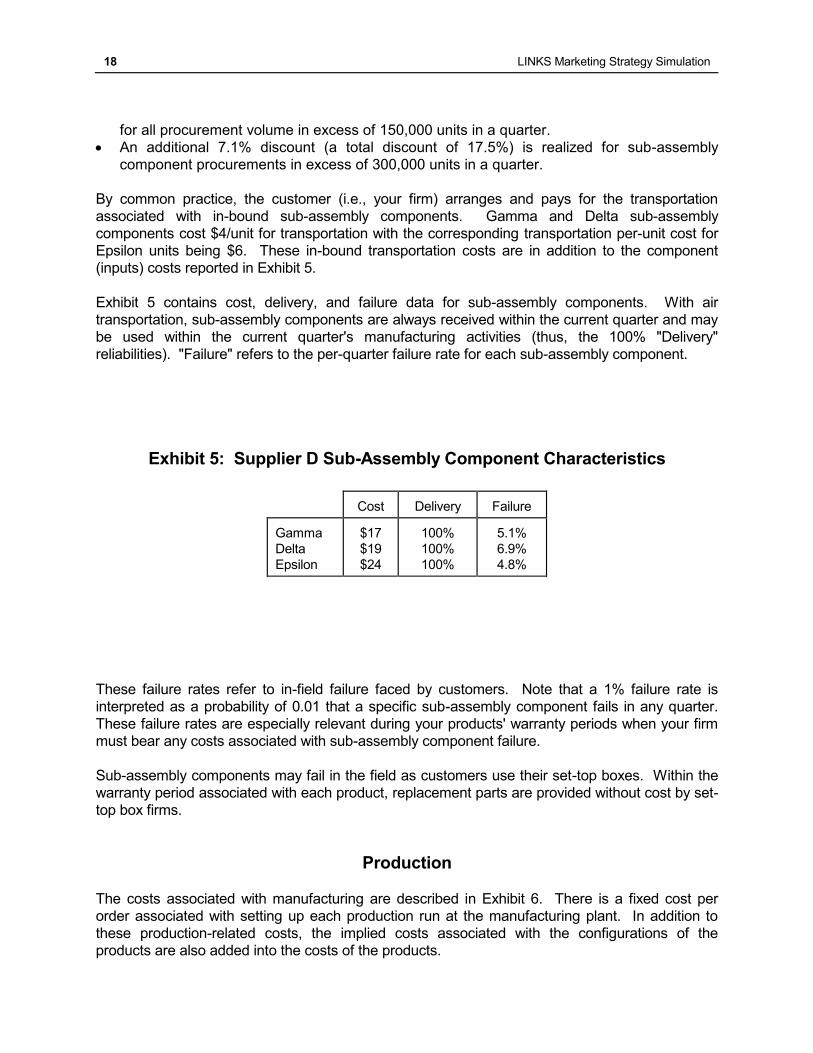
Exhibit 5 contains cost, delivery, and failure data for sub-assembly components. With air
transportation, sub-assembly components are always received within the current quarter and may
be used within the current quarter's manufacturing activities (thus, the 100% "Delivery"
reliabilities). "Failure" refers to the per-quarter failure rate for each sub-assembly component.
Exhibit 5: Supplier D Sub-Assembly Component Characteristics
Cost Delivery Failure
Gamma
Delta
Epsilon
$17
$19
$24
100%
100%
100%
5.1%
6.9%
4.8%
These failure rates refer to in-field failure faced by customers. Note that a 1% failure rate is
interpreted as a probability of 0.01 that a specific sub-assembly component fails in any quarter.
These failure rates are especially relevant during your products' warranty periods when your firm
must bear any costs associated with sub-assembly component failure.
Sub-assembly components may fail in the field as customers use their set-top boxes. Within the
warranty period associated with each product, replacement parts are provided without cost by set-
top box firms.
Production
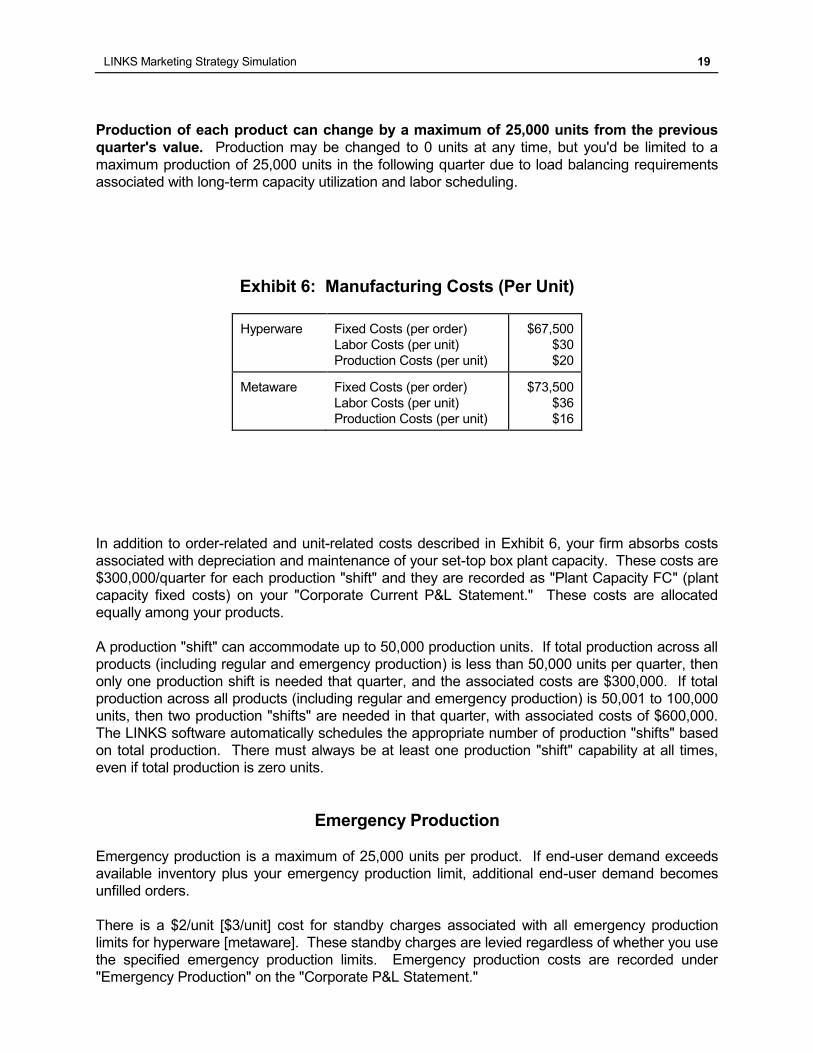
The costs associated with manufacturing are described in Exhibit 6. There is a fixed cost per
order associated with setting up each production run at the manufacturing plant. In addition to
these production-related costs, the implied costs associated with the configurations of the
products are also added into the costs of the products.
LINKS Marketing Strategy Simulation 19
Production of each product can change by a maximum of 25,000 units from the previous
quarter's value. Production may be changed to 0 units at any time, but you'd be limited to a
maximum production of 25,000 units in the following quarter due to load balancing requirements
associated with long-term capacity utilization and labor scheduling.
Exhibit 6: Manufacturing Costs (Per Unit)
Hyperware Fixed Costs (per order)
Labor Costs (per unit)
Production Costs (per unit)
$67,500
$30
$20
Metaware Fixed Costs (per order)
Labor Costs (per unit)
Production Costs (per unit)
$73,500
$36
$16
In addition to order-related and unit-related costs described in Exhibit 6, your firm absorbs costs
associated with depreciation and maintenance of your set-top box plant capacity. These costs are
$300,000/quarter for each production "shift" and they are recorded as "Plant Capacity FC" (plant
capacity fixed costs) on your "Corporate Current P&L Statement." These costs are allocated
equally among your products.
A production "shift" can accommodate up to 50,000 production units. If total production across all
products (including regular and emergency production) is less than 50,000 units per quarter, then
only one production shift is needed that quarter, and the associated costs are $300,000. If total
production across all products (including regular and emergency production) is 50,001 to 100,000
units, then two production "shifts" are needed in that quarter, with associated costs of $600,000.
The LINKS software automatically schedules the appropriate number of production "shifts" based
on total production. There must always be at least one production "shift" capability at all times,
even if total production is zero units.
Emergency Production
Emergency production is a maximum of 25,000 units per product. If end-user demand exceeds
available inventory plus your emergency production limit, additional end-user demand becomes
unfilled orders.
There is a $2/unit [$3/unit] cost for standby charges associated with all emergency production
limits for hyperware [metaware]. These standby charges are levied regardless of whether you use
the specified emergency production limits. Emergency production costs are recorded under
"Emergency Production" on the "Corporate P&L Statement."
20 LINKS Marketing Strategy Simulation
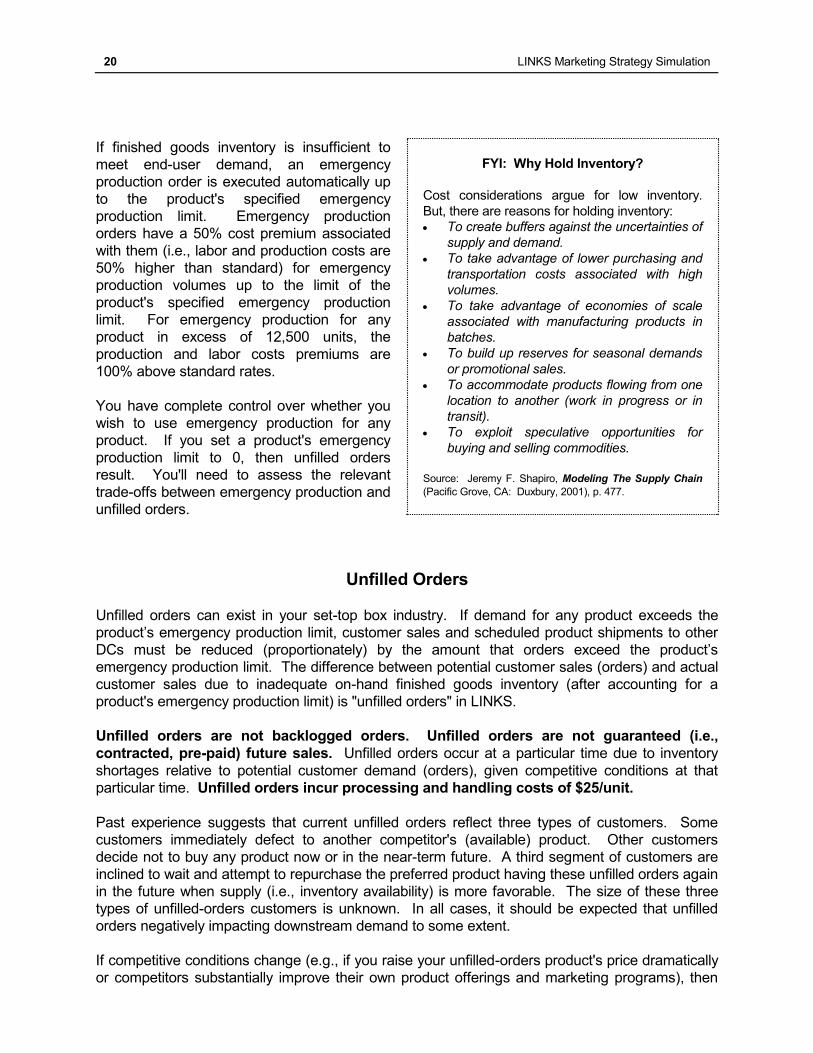
If finished goods inventory is insufficient to
meet end-user demand, an emergency
production order is executed automatically up
to the product's specified emergency
production limit. Emergency production
orders have a 50% cost premium associated
with them (i.e., labor and production costs are
50% higher than standard) for emergency
production volumes up to the limit of the
product's specified emergency production
limit. For emergency production for any
product in excess of 12,500 units, the
production and labor costs premiums are
100% above standard rates.
You have complete control over whether you
wish to use emergency production for any
product. If you set a product's emergency
production limit to 0, then unfilled orders
result. You'll need to assess the relevant
trade-offs between emergency production and
unfilled orders.
Unfilled Orders
Unfilled orders can exist in your set-top box industry. If demand for any product exceeds the
product’s emergency production limit, customer sales and scheduled product shipments to other
DCs must be reduced (proportionately) by the amount that orders exceed the product’s
emergency production limit. The difference between potential customer sales (orders) and actual
customer sales due to inadequate on-hand finished goods inventory (after accounting for a
product's emergency production limit) is "unfilled orders" in LINKS.
Unfilled orders are not backlogged orders. Unfilled orders are not guaranteed (i.e.,
contracted, pre-paid) future sales. Unfilled orders occur at a particular time due to inventory
shortages relative to potential customer demand (orders), given competitive conditions at that
particular time. Unfilled orders incur processing and handling costs of $25/unit.
Past experience suggests that current unfilled orders reflect three types of customers. Some
customers immediately defect to another competitor's (available) product. Other customers
decide not to buy any product now or in the near-term future. A third segment of customers are
inclined to wait and attempt to repurchase the preferred product having these unfilled orders again
in the future when supply (i.e., inventory availability) is more favorable. The size of these three
types of unfilled-orders customers is unknown. In all cases, it should be expected that unfilled
orders negatively impacting downstream demand to some extent.
If competitive conditions change (e.g., if you raise your unfilled-orders product's price dramatically
or competitors substantially improve their own product offerings and marketing programs), then
FYI: Why Hold Inventory?
Cost considerations argue for low inventory.
But, there are reasons for holding inventory:
To create buffers against the uncertainties of
supply and demand.
To take advantage of lower purchasing and
transportation costs associated with high
volumes.
To take advantage of economies of scale
associated with manufacturing products in
batches.
To build up reserves for seasonal demands
or promotional sales.
To accommodate products flowing from one
location to another (work in progress or in
transit).
To exploit speculative opportunities for
buying and selling commodities.
Source: Jeremy F. Shapiro, Modeling The Supply Chain
(Pacific Grove, CA: Duxbury, 2001), p. 477.
LINKS Marketing Strategy Simulation 21
the share of customers with unfilled orders who would have been inclined to attempt to
repurchase your unfilled-orders product in the future can decrease. Additionally:
If you drop a product with unfilled orders from active distribution in a particular channel and
region, the unfilled orders associated with that product in that particular channel and region
are completely lost. They will not shift to another product, even your own dropped product still
actively distributed in another channel in that region.
If you reconfigure a product with outstanding unfilled orders, those unfilled orders are lost.
Unfilled orders represent additional potential demand that might have been realized beyond "filled
orders" (i.e., sales) if sufficient product supply had been available to meet all customer purchase
requests. A high level of unfilled orders could also reflect industry-wide double-counting if multiple
firms' products simultaneously have unfilled orders. If two products simultaneously have unfilled
orders, then some customers might have wished to purchase first one of the products and then
the other product when the stockout situation for the first product was encountered. In such a
situation, a single customer would have been counted as an unfilled order by both stocked-out
products.
The definition of unfilled orders varies by channel. For a direct channel (like channel #2), an
unfilled order to an end-user customer is the same as an unfilled order to the manufacturer.
However, for an indirect channel (like channel #1), inventory buffer stock routinely maintained by
retailers complicates the interpretation of unfilled orders. If retailers order 1,000 units from a
manufacturer but that manufacturer is only able to fill 600 units of that order, this represents 400
units of unfilled orders to the manufacturer. However, this doesn't necessarily mean that retailers
have unfilled orders from end-user customers. If the 600 units of the retailers' manufacturer-order
yield sufficient on-hand retailer inventory to permit all end-user customer orders to be filled, then
there are no unfilled orders as far as retailers are concerned. (In this case, retailers' ending
inventory level would be below the desired level, which presumably would lead to increased orders
in the following quarter to meet expected end-user customer demand plus inventory restocking
targets.) With the buffering nature of retailer inventory, there could be no industry-wide unfilled
orders but individual manufacturers could still have unfilled orders in channel #1.
Dealers with stockouts will reorder in anticipation of future (continuing) rising demand above
current sales levels, as well accounting for their (i.e., dealers') future desired inventory levels.
These are the total unfilled orders that manufacturers see arising from channel #1. Industry-wide
unfilled orders, as reported in Research Study #12, reference actual final end-user customer
current stockouts. Since industry-wide unfilled orders are customer-based, industry-wide unfilled
order estimates presumably are based on customer surveys. Such survey-based estimates
contain statistical noise as well as reflecting the potential for biases in customer surveys,
especially if there are lots of customers who encountered stockouts. Thus, even a thoughtful
survey respondent might claim to have wanted to buy and encountered a stockout situation, to
encourage manufacturers to have more plentiful inventory, especially when no contractual
purchase commitment is required within the survey.
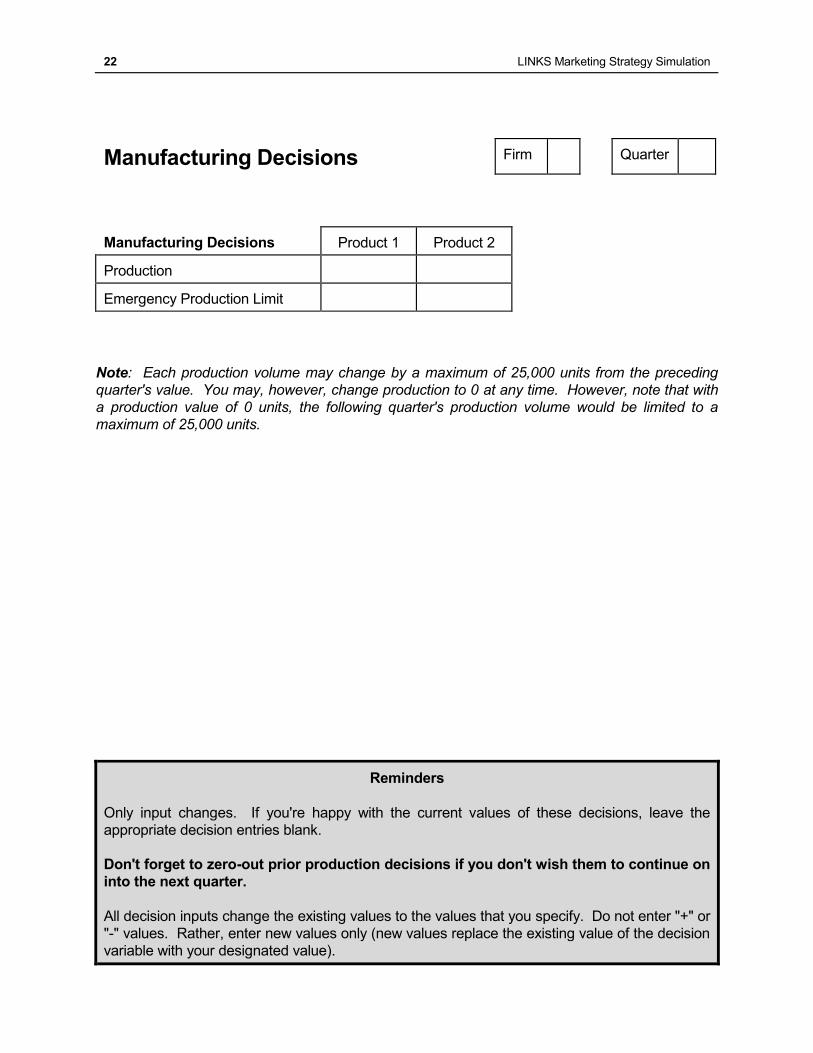
Manufacturing Decisions Form
A blank "Manufacturing Decisions" form may be found on the next page. Complete this decision
form during your team deliberations.
22 LINKS Marketing Strategy Simulation
Manufacturing Decisions Firm Quarter
Manufacturing Decisions Product 1 Product 2
Production
Emergency Production Limit
Note: Each production volume may change by a maximum of 25,000 units from the preceding
quarter's value. You may, however, change production to 0 at any time. However, note that with
a production value of 0 units, the following quarter's production volume would be limited to a
maximum of 25,000 units.
Reminders
Only input changes. If you're happy with the current values of these decisions, leave the
appropriate decision entries blank.
Don't forget to zero-out prior production decisions if you don't wish them to continue on
into the next quarter.
All decision inputs change the existing values to the values that you specify. Do not enter "+" or
"-" values. Rather, enter new values only (new values replace the existing value of the decision
variable with your designated value).
LINKS Marketing Strategy Simulation 23
Chapters 6/7: Distribution/Transportation Decisions
Distribution Decisions
"The journey of a thousand miles begins with one step." – Lao-Tse
Your firm owns a distribution center in market region 1, adjacent to your manufacturing plant. In
the LINKS Marketing Strategy Simulation, no other distribution centers are possible. Thus,
all finished goods and replacement parts are sourced from your distribution center in market
region 1.
Since there are no distribution decisions for you to make in the LINKS Marketing Strategy
Simulation, there is no "Distribution Decisions" form.
Transportation Decisions
"The whole industry recognizes that to be successful, delivering the product on time and
accurately, is absolutely essential. If it's not right the first time, the customer doesn't come
back." – Jonathon Morris, Executive Vice-President of online outlet store Bluefly Inc.
Different institutional and customary arrangements exist throughout the set-top box industry
regarding transportation decisions and practices.
Inbound Raw Materials: Vendors of raw materials in the set-top box industry provide
inbound transportation as part of their bundled prices. Thus, there are no transportation
decisions for set-top box manufacturers to make with regard to raw materials.
Inbound Sub-Assembly Components: In the LINKS Marketing Strategy Simulation,, sub-
assembly components are transported by air to your manufacturing plant in market region 1.
Costs are detailed in Chapter 4.
Plant-To-DC Shipments: In the LINKS Marketing Strategy Simulation, there are no plant-to-
DC shipments since your only DC is in market region 1.
DC Shipments To Customers: Set-top box manufacturers ship by surface from within-region
DCs and ship by air for customer shipments where a local DC doesn't exist (and direct
shipment from DC1 is required). Since corporate policy and set-top box industry custom
dictates the transportation modes and the carriers used for these transportation requirements,
there are no active decisions required within LINKS at this supply chain linkage. Since the
standard costs associated with DC shipments to customers are borne by manufacturers,
these transportation activities impact the financial performance of manufacturers. If
customers prefer expedited transportation above and beyond the standard transportation
modes used, customers absorb any incremental costs associated with expedited
transportation.
Your firm is responsible for covering all costs associated with shipping your products from your
distribution center in market region 1 to your customers, to retailers in the retail channel and to
end-users in the direct and major accounts channels. Transportation mode choice depends on
whether your firm has a distribution center in a region.
If your firm has a distribution center in a market region, then that distribution center is used to
24 LINKS Marketing Strategy Simulation
service all orders for set-top boxes. Your firm's policy is to ship by surface transportation
when you have a within-region distribution center. Occasionally, customers may request
expedited shipment but the custom in the set-top box industry is for the customer to pay any
incremental shipping charges above surface transportation rates.
If your firm does not have a distribution center in a market region, then the distribution center
in market region 1 (i.e., the distribution center associated with your manufacturing plant) must
service such an order. Your firm's transportation policy is to ship via air in such situations, to
ensure prompt delivery to customers within the current quarter.
The transportation costs associated with various customer shipments are shown in Exhibit 7.
Note that the costs associated with shipping to customers in direct channels (channel 2 [“Direct”]
and channel 3 [“Major Accounts”]) are higher than the retail channel (channel 1), since direct-
channel customers normally are ordering in much smaller quantities than the bulk shipments to
retailers.
The cost of shipping replacement parts to end-users is 50% of the cost associated with shipping
finished products to customers.
Exhibit 7: Customer Shipment Transportation Costs (Per Unit)
Within-Region Surface
Transportation Costs
Sourcing From Plant/DC1 When
No Within-Region Distribution
Center Exists
Channel 1 Channel 2 Channel 3 Channel 1 Channel 2 Channel 3
Market Region 1 $4 $8 $6
Market Region 2 $18 $28 $22
Market Region 3 $26 $36 $30
There is no "Transportation Decisions" form in the LINKS Marketing Strategy Simulation.
LINKS Marketing Strategy Simulation 25
Chapter 8: Service Decisions
"It matters not whether a company creates ... a computer, a toaster, or a machine tool, or
something you can only experience, such as insurance coverage, an airplane ride, or a
telephone call. What counts most is the service built into that something - the way the
product is designed and delivered, billed and handled, explained and installed, repaired and
received." – Ronald Henkoff, "Service Is Everybody's Business," Fortune (June 27, 1994), p. 48
Your firm has a service (call) center in each
market region in which you sell set-top boxes.
Inbound call centers are staffed by customer
service representatives (CSRs) who interact
with existing and potential customers.
Language, cultural, and time zone differences
are such that local (region-specific and region-
dedicated) call centers are required in the set-
top box business.
Your LINKS service decisions include CSR
staffing (hiring and firing), CSR experienced
hiring, CSR compensation, service operations
level, service outsourcing, and CSR time
allocation decisions. These service decisions
are required in each market region in which
you have a service (call) center.
Service quality derives from call center
performance. Call center usage is the largest
service quality driver. Higher call center usage levels are associated with lower perceived service
quality due to service queuing, lack of time for CSRs to provide high-quality service, and related
issues associated with high usage levels (including CSR turnover). There is a natural lag between
perceived service quality and call center usage. Perceived service quality is a survey-based
measure. Customers are surveyed about their service quality perceptions of all set-top boxes for
which they have personal recent experience. Thus, the current quarter's perceived service
quality is based on actual call center usage from the previous quarter.
Service Salary Decisions
You may establish different service force salary levels in each region, if you choose. While cost-
of-living considerations and competitive market forces might lead you to have a service salary with
some variations across regions, cross-regional service salaries which vary widely are likely to lead
to morale problems not just in the regions where salary levels are particularly low.
Service salaries are expressed in terms of dollars per month. Thus, a $24,000 per year salary
would be specified as a $2,000 salary per month. Service Overhead is based on total service
force compensation. Service force salary (CSR base monthly salary) may not be changed by
more than $500 in any quarter from its previous value.
FYI: Customer Interaction Costs
Estimates of representative customer interaction
costs (in $US) are listed below:
Self-Service (Voice Recognition, Web
Interaction): $0.1-$0.4
Direct-Mail Contact: $0.25-$5
Telephone Interaction: $2-$5
Fax/Mail Interaction: $3-$6
Telemarketing Interaction: $8-$24
Telephone Product Support Interaction: $4-
$75
Field Sales Interaction: $40-$400
Source: Adapted from Figure 2 in Jonathan Wright and
Jerry Quinn, "Enterprise Service Management: The Key To
Service Excellence," Achieving Supply Chain Excellence
Through Technology, Volume 4 (San Francisco:
Montgomery Research, Inc., 2002), p. 190.
26 LINKS Marketing Strategy Simulation
Service Capacity and Hiring/Firing Decisions
"We used to measure how many calls we could take per hour. Now we focus on
first-time resolves — solving the problem once and for all — even if that means
talking longer with a customer." – Manish Mehta, Senior Manager of Service-and-Support
Online, Dell Computer, Quoted in net.company (Fall 99), p. 21.
Call center activity is driven by predictable elements of the set-top box buying and consumption
processes related to pre-sale (potential customers) and post-sale (purchasers) forces:
Pre-Sale (Potential Customers): General Inquiries and product information requests.
Post-Sale (Purchasers): Installation inquiries, usage questions, quality/performance
problems, and warranty claims.
Based on past experience, each CSR can
handle an average of 1,000 calls per month
(3,000 calls per quarter).
You manage the size of your CSR complements
in each region via hiring and firing decisions.
Hiring costs are equal to two month's salary,
representing the costs associated with
recruiting, screening, and training.
Firing costs incur a charge equal to three
month's salary.
Hiring and firing costs are recorded as
"Service Hire&Fire" on your financial reports.
Service personnel are hired immediately
(i.e., at the start of the next quarter).
However, they train in the first month (at full
salary and benefits) so they don't begin to
service calls until the following month. Thus, CSR hires in a quarter will only be two-thirds as
productive as experienced CSRs.
There is a single hiring and firing decision in LINKS. Positive values of this decision variable in a
region reflect hiring decisions while negative values reflect firing decisions. Obviously, you would
never hire and fire CSRs in a region in the same quarter, so a single decision variable is all that's
necessary to permit you to make region-specific CSR hiring and firing decisions.
There will be CSR turnover (resignations) on a regular basis. Thus, to maintain your existing CSR
staffing levels, it may be necessary to hire personnel regularly. Recent experience in the set-top
box industry is that CSRs resign at the rate of 9%-12% per quarter. Workload and compensation
are thought to influence resignation rates, in positive and negative fashions respectively. If you
work your CSRs at high levels of usage, resignations may result. As might be expected, higher-
paid personnel resign with less frequency than lower-paid personnel.
When you hire service personnel, a month's training is required prior to those "new" personnel
being fully functional in their new positions. New hires are paid their normal salaries in this
training month, but they are not able to provide any service to customers during the first month.
FAQ
"Is a service usage level of 100% ideal?" With
100% service usage, your service personnel
have no time for training, vacation,
administrative matters, or other non-customer
facing activity. This workload level may lead
to higher personnel turnover. In addition,
100% service usage means that lots of
customers have to wait for service, with
associated degradation of perceived service
quality. While less-than-100% service usage
has higher associated costs per contact, the
key issue is the trade-off between cost per
contact and perceived service quality.
LINKS Marketing Strategy Simulation 27
The maximum number of new CSRs that may be hired in any quarter in any market region is 50.
Any level of CSR service force size reduction may be implemented at any time via a firing
decision. In particular, CSR size may be reduced to zero at any time.
Experienced CSR hiring is possible to a
maximum of 9 experienced CSRs per quarter
in any market region. Experienced CSRs
require minimal training so they are fully
productive immediately (i.e., in the initial
month after hiring). Hiring experienced CSRs
has no impact on your regular CSR hiring
decisions. Experienced CSRs incur one-time
charges equal to twice that of the hiring of
non-experienced CSRs.
Transferring service representatives from one
market region to another is equivalent to firing
the representatives in the originating market
region and then hiring them in the destination
market region. Thus, there are no cost
savings associated with transferring service
representatives from one market region to
another market region.
If you decide to drop all active products from
distribution in a market region, you may also
wish to close your service center in that
market region. You may close your service
center in a market region by firing all of your
remaining CSRs. There are no special costs
associated with closing service centers in
market regions, beyond the costs associated
with firing CSRs.
Service Operations
Four options exist for service operations levels at each of your regional call centers. These cost
impact figures reflect all of the incremental costs (CSR recruiting costs, CSR shift differentials for
second- and third-shifts, and increased administrative costs associated with a higher mix of part-
time CSRs within the service center staff) associated with call center operating hours outside of a
traditional weekday 900a-500p schedule.
FYI: About The Customer Service Challenge
Because of what customers are forced to
endure, many call-center staff regularly have to
serve unpleasant, upset customers whom they
personally did nothing to create. Yet to be good
service providers, they must be able to calm
these customers down and deal with them in a
way that makes them want to return to do
business again at some time in the future.
Unfortunately, many staff take customer bad
behavior just as personally as customers take
the bad service they have been offered, and staff
defensive reactions leak out onto customers.
Is it any wonder that most call centers have such
a difficult time holding on to staff unless they
offer the best-paying jobs in the area? This
rapid and regular loss of staff requires constant
hiring of new, untrained staff. As a result, many
call centers do not have staff who know how to
effectively handle complains, let alone
understand that a complaint is being delivered
unless it is spelled out with the precise words “I
have a complaint.”
Source: Janelle Barlow and Claus Möller, A Complaint Is a
Gift, Second Edition (San Francisco: Berrett-Koehler
Publishers, Inc., 2008), p. 3.
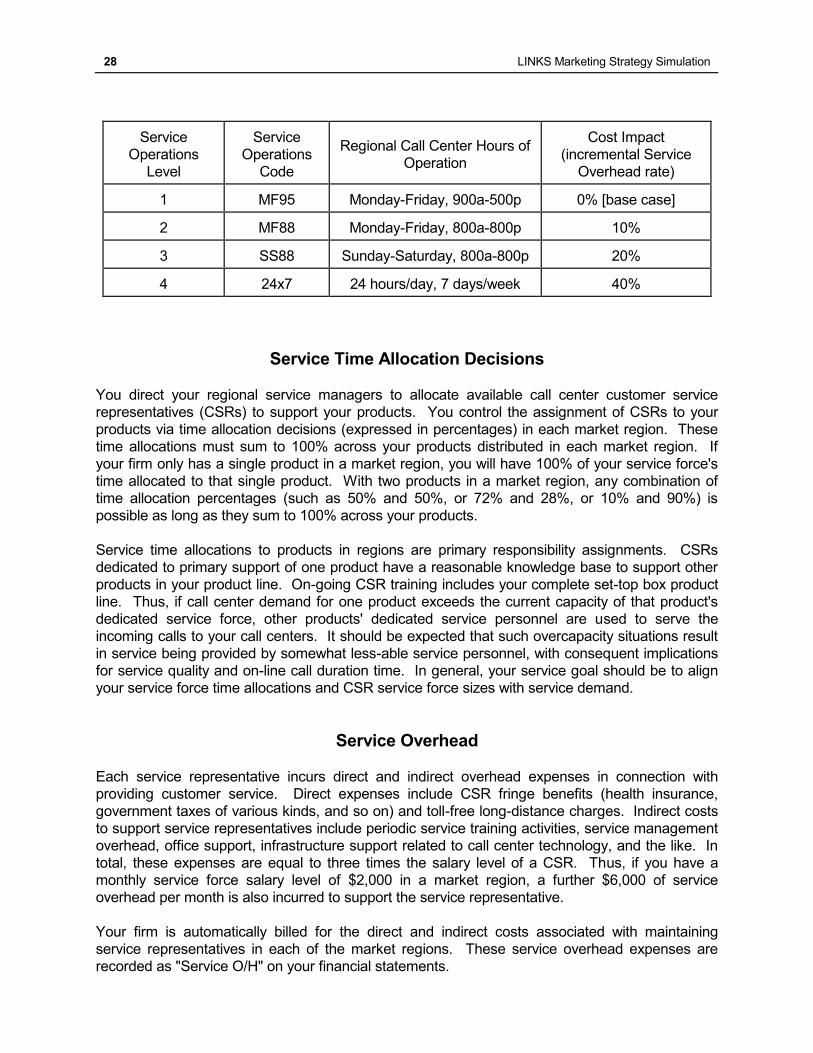
28 LINKS Marketing Strategy Simulation
Service
Operations
Level
Service
Operations
Code
Regional Call Center Hours of
Operation
Cost Impact
(incremental Service
Overhead rate)
1 MF95 Monday-Friday, 900a-500p 0% [base case]
2 MF88 Monday-Friday, 800a-800p 10%
3 SS88 Sunday-Saturday, 800a-800p 20%
4 24x7 24 hours/day, 7 days/week 40%
Service Time Allocation Decisions
You direct your regional service managers to allocate available call center customer service
representatives (CSRs) to support your products. You control the assignment of CSRs to your
products via time allocation decisions (expressed in percentages) in each market region. These
time allocations must sum to 100% across your products distributed in each market region. If
your firm only has a single product in a market region, you will have 100% of your service force's
time allocated to that single product. With two products in a market region, any combination of
time allocation percentages (such as 50% and 50%, or 72% and 28%, or 10% and 90%) is
possible as long as they sum to 100% across your products.
Service time allocations to products in regions are primary responsibility assignments. CSRs
dedicated to primary support of one product have a reasonable knowledge base to support other
products in your product line. On-going CSR training includes your complete set-top box product
line. Thus, if call center demand for one product exceeds the current capacity of that product's
dedicated service force, other products' dedicated service personnel are used to serve the
incoming calls to your call centers. It should be expected that such overcapacity situations result
in service being provided by somewhat less-able service personnel, with consequent implications
for service quality and on-line call duration time. In general, your service goal should be to align
your service force time allocations and CSR service force sizes with service demand.
Service Overhead
Each service representative incurs direct and indirect overhead expenses in connection with
providing customer service. Direct expenses include CSR fringe benefits (health insurance,
government taxes of various kinds, and so on) and toll-free long-distance charges. Indirect costs
to support service representatives include periodic service training activities, service management
overhead, office support, infrastructure support related to call center technology, and the like. In
total, these expenses are equal to three times the salary level of a CSR. Thus, if you have a
monthly service force salary level of $2,000 in a market region, a further $6,000 of service
overhead per month is also incurred to support the service representative.
Your firm is automatically billed for the direct and indirect costs associated with maintaining
service representatives in each of the market regions. These service overhead expenses are
recorded as "Service O/H" on your financial statements.
LINKS Marketing Strategy Simulation 29
Service Outsourcing
Rather than actively managing service centers, you may choose to outsource service. Service
outsourcing is provided by reputable call-center service providers in each region. Service
outsourcing is region-specific so you may freely choose to actively manage your own service
center in some regions while outsourcing service in other regions.
In each region, you either actively manage your own region-specific service center or you use
service outsourcing. You never simultaneously use a combination of active service-center
management and service outsourcing in a region.
If you have zero CSRs in any region, no service will be provided unless you specify a service
outsourcing level of "Minimum," "Standard," "Enhanced," or "Premium" in that region.
If you have some CSRs in any region, then you are assumed to be actively managing service
in that region and service outsourcing does not occur. In this case, all in-bound calls to your
regional service center must be handled by your own CSRs.
If you have some CSRs in a region and you change service outsourcing from 0 ("None") to 1,
2, 3, or 4, then all CSRs in that region will be fired immediately since it is presumed that you
are switching from insourced to outsourced service in that market region.
There are no transition-specific costs associated with switching service between insourcing and
outsourcing other than the costs associated with hiring/firing CSRs.
Service outsourcing levels and their per-call costs and associated guaranteed service quality
performance levels ("SQ Guarantee") are detailed below:
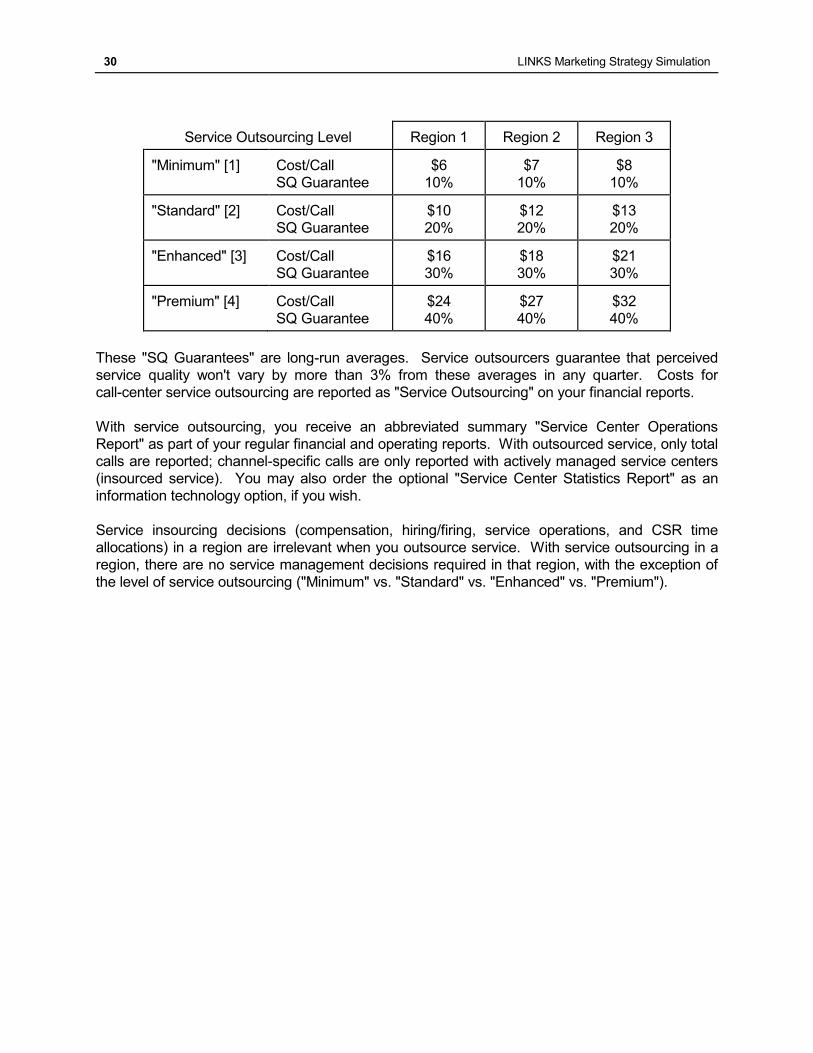
30 LINKS Marketing Strategy Simulation
Service Outsourcing Level Region 1 Region 2 Region 3
"Minimum" [1] Cost/Call
SQ Guarantee
$6
10%
$7
10%
$8
10%
"Standard" [2] Cost/Call
SQ Guarantee
$10
20%
$12
20%
$13
20%
"Enhanced" [3] Cost/Call
SQ Guarantee
$16
30%
$18
30%
$21
30%
"Premium" [4] Cost/Call
SQ Guarantee
$24
40%
$27
40%
$32
40%
These "SQ Guarantees" are long-run averages. Service outsourcers guarantee that perceived
service quality won't vary by more than 3% from these averages in any quarter. Costs for
call-center service outsourcing are reported as "Service Outsourcing" on your financial reports.
With service outsourcing, you receive an abbreviated summary "Service Center Operations
Report" as part of your regular financial and operating reports. With outsourced service, only total
calls are reported; channel-specific calls are only reported with actively managed service centers
(insourced service). You may also order the optional "Service Center Statistics Report" as an
information technology option, if you wish.
Service insourcing decisions (compensation, hiring/firing, service operations, and CSR time
allocations) in a region are irrelevant when you outsource service. With service outsourcing in a
region, there are no service management decisions required in that region, with the exception of
the level of service outsourcing ("Minimum" vs. "Standard" vs. "Enhanced" vs. "Premium").
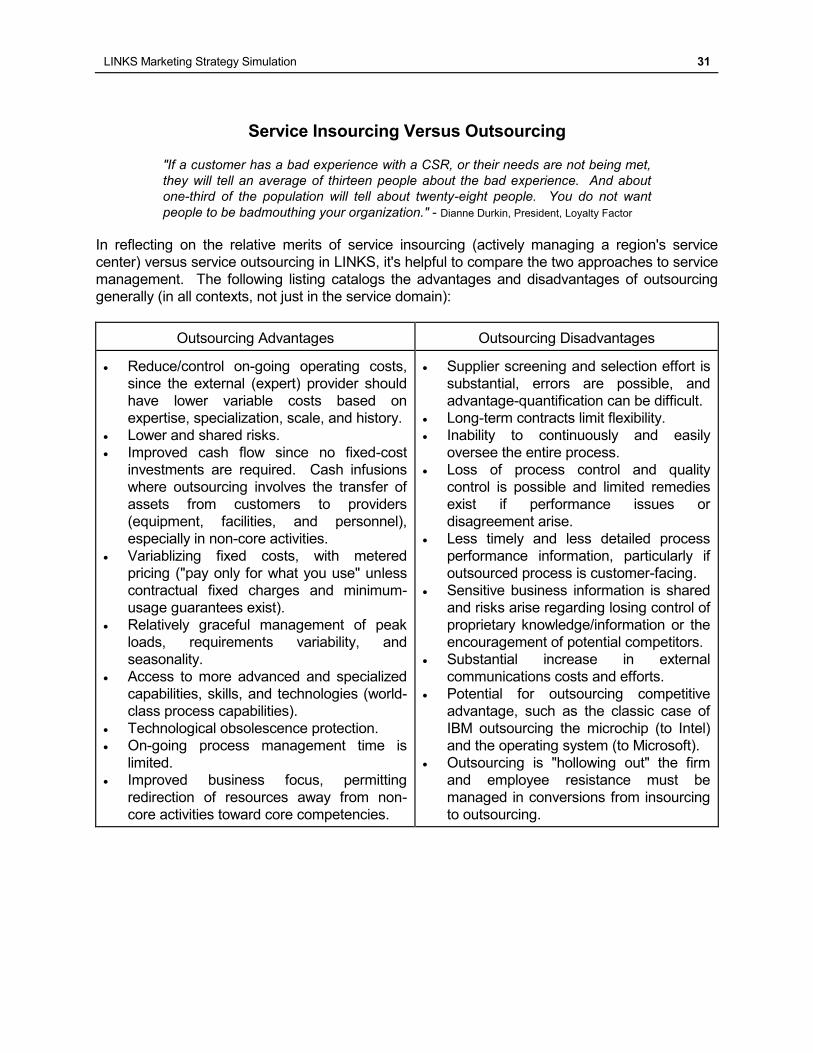
LINKS Marketing Strategy Simulation 31
Service Insourcing Versus Outsourcing
"If a customer has a bad experience with a CSR, or their needs are not being met,
they will tell an average of thirteen people about the bad experience. And about
one-third of the population will tell about twenty-eight people. You do not want
people to be badmouthing your organization." - Dianne Durkin, President, Loyalty Factor
In reflecting on the relative merits of service insourcing (actively managing a region's service
center) versus service outsourcing in LINKS, it's helpful to compare the two approaches to service
management. The following listing catalogs the advantages and disadvantages of outsourcing
generally (in all contexts, not just in the service domain):
Outsourcing Advantages Outsourcing Disadvantages
Reduce/control on-going operating costs,
since the external (expert) provider should
have lower variable costs based on
expertise, specialization, scale, and history.
Lower and shared risks.
Improved cash flow since no fixed-cost
investments are required. Cash infusions
where outsourcing involves the transfer of
assets from customers to providers
(equipment, facilities, and personnel),
especially in non-core activities.
Variablizing fixed costs, with metered
pricing ("pay only for what you use" unless
contractual fixed charges and minimum-
usage guarantees exist).
Relatively graceful management of peak
loads, requirements variability, and
seasonality.
Access to more advanced and specialized
capabilities, skills, and technologies (world-
class process capabilities).
Technological obsolescence protection.
On-going process management time is
limited.
Improved business focus, permitting
redirection of resources away from non-
core activities toward core competencies.
Supplier screening and selection effort is
substantial, errors are possible, and
advantage-quantification can be difficult.
Long-term contracts limit flexibility.
Inability to continuously and easily
oversee the entire process.
Loss of process control and quality
control is possible and limited remedies
exist if performance issues or
disagreement arise.
Less timely and less detailed process
performance information, particularly if
outsourced process is customer-facing.
Sensitive business information is shared
and risks arise regarding losing control of
proprietary knowledge/information or the
encouragement of potential competitors.
Substantial increase in external
communications costs and efforts.
Potential for outsourcing competitive
advantage, such as the classic case of
IBM outsourcing the microchip (to Intel)
and the operating system (to Microsoft).
Outsourcing is "hollowing out" the firm
and employee resistance must be
managed in conversions from insourcing
to outsourcing.
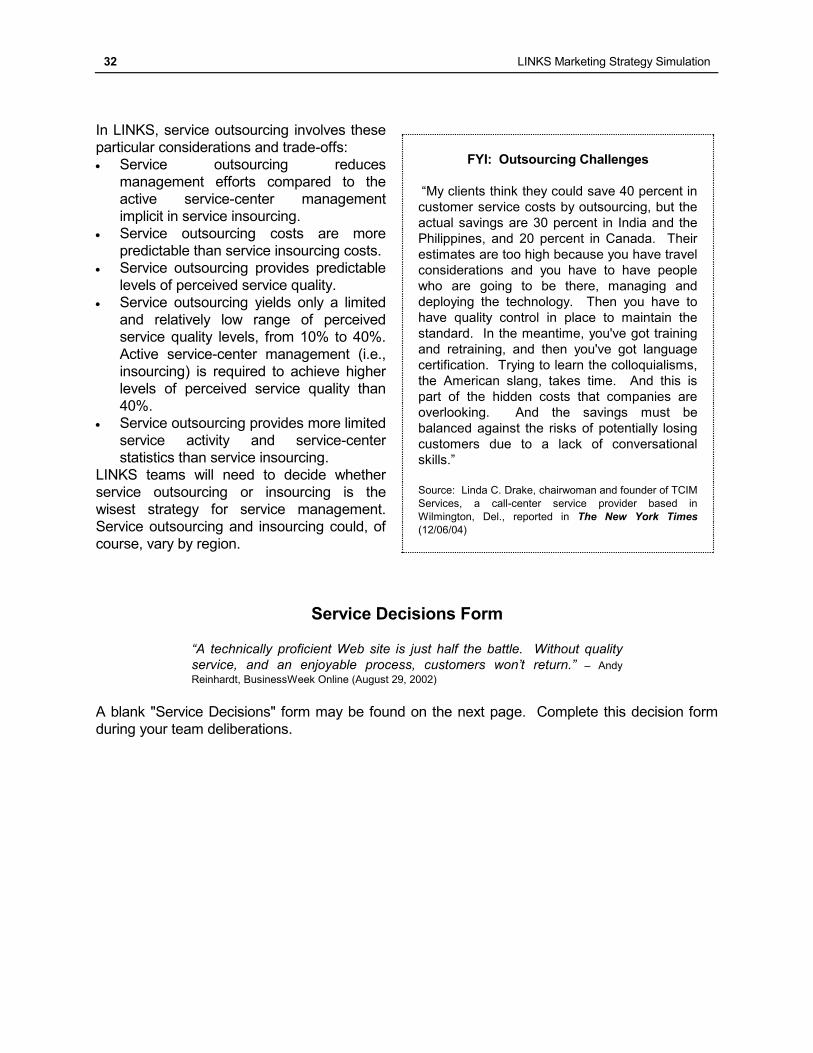
32 LINKS Marketing Strategy Simulation
In LINKS, service outsourcing involves these
particular considerations and trade-offs:
Service outsourcing reduces
management efforts compared to the
active service-center management
implicit in service insourcing.
Service outsourcing costs are more
predictable than service insourcing costs.
Service outsourcing provides predictable
levels of perceived service quality.
Service outsourcing yields only a limited
and relatively low range of perceived
service quality levels, from 10% to 40%.
Active service-center management (i.e.,
insourcing) is required to achieve higher
levels of perceived service quality than
40%.
Service outsourcing provides more limited
service activity and service-center
statistics than service insourcing.
LINKS teams will need to decide whether
service outsourcing or insourcing is the
wisest strategy for service management.
Service outsourcing and insourcing could, of
course, vary by region.
Service Decisions Form
“A technically proficient Web site is just half the battle. Without quality
service, and an enjoyable process, customers won’t return.” – Andy
Reinhardt, BusinessWeek Online (August 29, 2002)
A blank "Service Decisions" form may be found on the next page. Complete this decision form
during your team deliberations.
FYI: Outsourcing Challenges
“My clients think they could save 40 percent in
customer service costs by outsourcing, but the
actual savings are 30 percent in India and the
Philippines, and 20 percent in Canada. Their
estimates are too high because you have travel
considerations and you have to have people
who are going to be there, managing and
deploying the technology. Then you have to
have quality control in place to maintain the
standard. In the meantime, you've got training
and retraining, and then you've got language
certification. Trying to learn the colloquialisms,
the American slang, takes time. And this is
part of the hidden costs that companies are
overlooking. And the savings must be
balanced against the risks of potentially losing
customers due to a lack of conversational
skills.”
Source: Linda C. Drake, chairwoman and founder of TCIM
Services, a call-center service provider based in
Wilmington, Del., reported in The New York Times
(12/06/04)
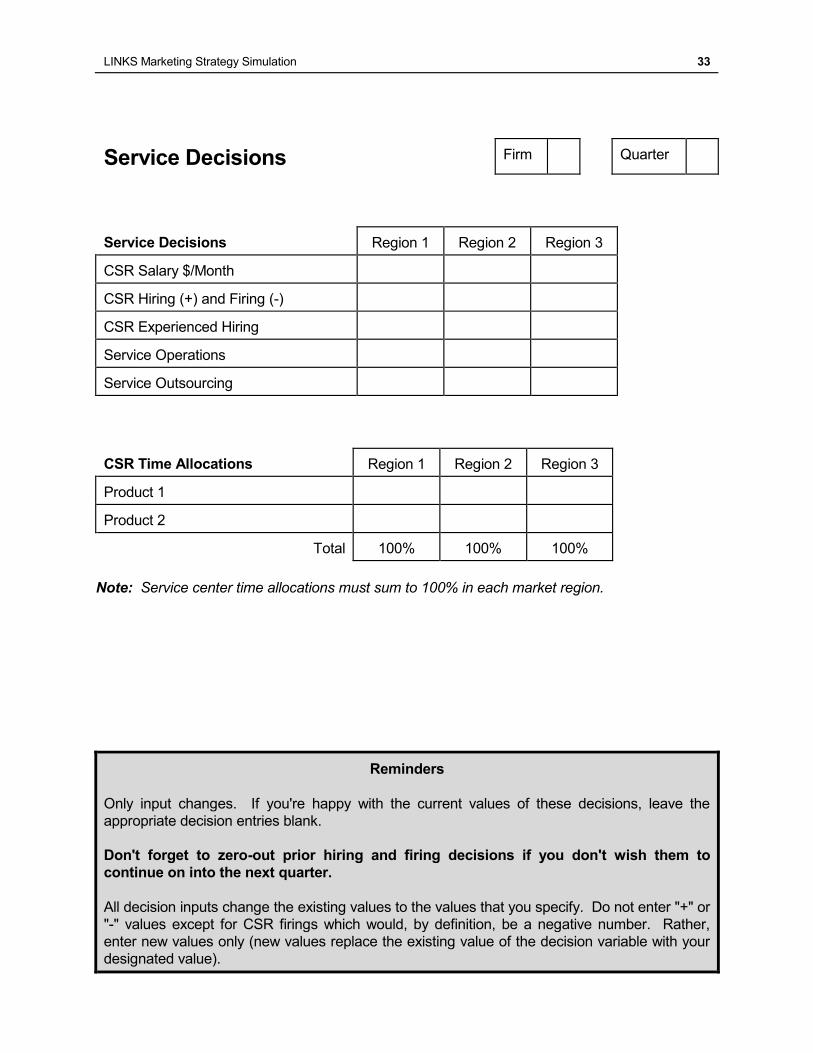
LINKS Marketing Strategy Simulation 33
Service Decisions Firm Quarter
Service Decisions Region 1 Region 2 Region 3
CSR Salary $/Month
CSR Hiring (+) and Firing (-)
CSR Experienced Hiring
Service Operations
Service Outsourcing
CSR Time Allocations Region 1 Region 2 Region 3
Product 1
Product 2
Total 100% 100% 100%
Note: Service center time allocations must sum to 100% in each market region.
Reminders
Only input changes. If you're happy with the current values of these decisions, leave the
appropriate decision entries blank.
Don't forget to zero-out prior hiring and firing decisions if you don't wish them to
continue on into the next quarter.
All decision inputs change the existing values to the values that you specify. Do not enter "+" or
"-" values except for CSR firings which would, by definition, be a negative number. Rather,
enter new values only (new values replace the existing value of the decision variable with your
designated value).
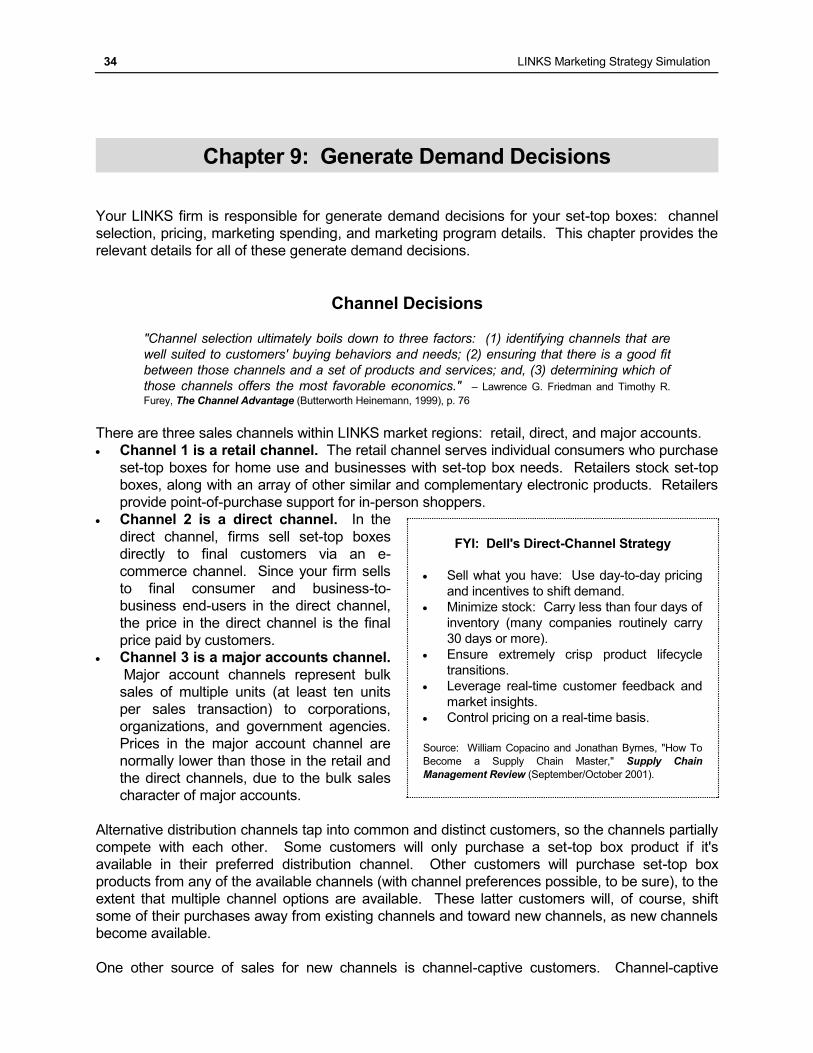
34 LINKS Marketing Strategy Simulation
Chapter 9: Generate Demand Decisions
Your LINKS firm is responsible for generate demand decisions for your set-top boxes: channel
selection, pricing, marketing spending, and marketing program details. This chapter provides the
relevant details for all of these generate demand decisions.
Channel Decisions
"Channel selection ultimately boils down to three factors: (1) identifying channels that are
well suited to customers' buying behaviors and needs; (2) ensuring that there is a good fit
between those channels and a set of products and services; and, (3) determining which of
those channels offers the most favorable economics." – Lawrence G. Friedman and Timothy R.
Furey, The Channel Advantage (Butterworth Heinemann, 1999), p. 76
There are three sales channels within LINKS market regions: retail, direct, and major accounts.
Channel 1 is a retail channel. The retail channel serves individual consumers who purchase
set-top boxes for home use and businesses with set-top box needs. Retailers stock set-top
boxes, along with an array of other similar and complementary electronic products. Retailers
provide point-of-purchase support for in-person shoppers.
Channel 2 is a direct channel. In the
direct channel, firms sell set-top boxes
directly to final customers via an e-
commerce channel. Since your firm sells
to final consumer and business-to-
business end-users in the direct channel,
the price in the direct channel is the final
price paid by customers. Channel 3 is a major accounts channel.
Major account channels represent bulk
sales of multiple units (at least ten units
per sales transaction) to corporations,
organizations, and government agencies.
Prices in the major account channel are
normally lower than those in the retail and
the direct channels, due to the bulk sales
character of major accounts.
Alternative distribution channels tap into common and distinct customers, so the channels partially
compete with each other. Some customers will only purchase a set-top box product if it's
available in their preferred distribution channel. Other customers will purchase set-top box
products from any of the available channels (with channel preferences possible, to be sure), to the
extent that multiple channel options are available. These latter customers will, of course, shift
some of their purchases away from existing channels and toward new channels, as new channels
become available.
One other source of sales for new channels is channel-captive customers. Channel-captive
FYI: Dell's Direct-Channel Strategy
Sell what you have: Use day-to-day pricing
and incentives to shift demand.
Minimize stock: Carry less than four days of
inventory (many companies routinely carry
30 days or more).
Ensure extremely crisp product lifecycle
transitions.
Leverage real-time customer feedback and
market insights.
Control pricing on a real-time basis.
Source: William Copacino and Jonathan Byrnes, "How To
Become a Supply Chain Master," Supply Chain
Management Review (September/October 2001).
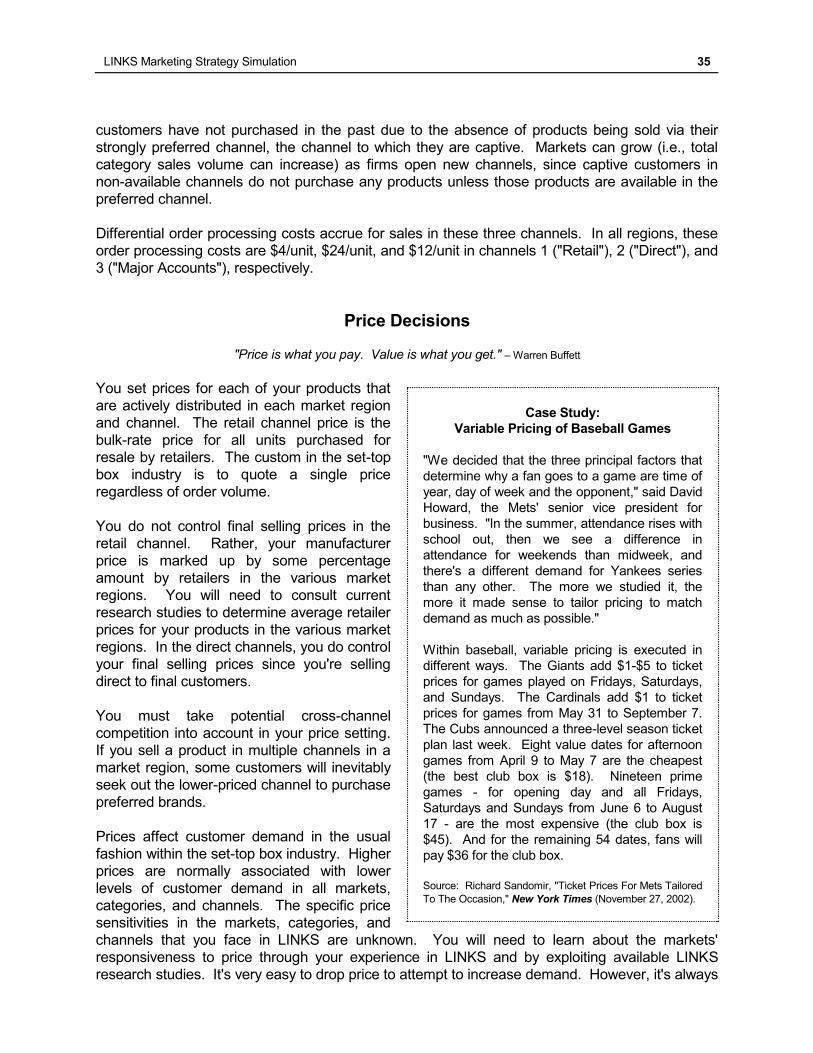
LINKS Marketing Strategy Simulation 35
customers have not purchased in the past due to the absence of products being sold via their
strongly preferred channel, the channel to which they are captive. Markets can grow (i.e., total
category sales volume can increase) as firms open new channels, since captive customers in
non-available channels do not purchase any products unless those products are available in the
preferred channel.
Differential order processing costs accrue for sales in these three channels. In all regions, these
order processing costs are $4/unit, $24/unit, and $12/unit in channels 1 ("Retail"), 2 ("Direct"), and
3 ("Major Accounts"), respectively.
Price Decisions
"Price is what you pay. Value is what you get." – Warren Buffett
You set prices for each of your products that
are actively distributed in each market region
and channel. The retail channel price is the
bulk-rate price for all units purchased for
resale by retailers. The custom in the set-top
box industry is to quote a single price
regardless of order volume.
You do not control final selling prices in the
retail channel. Rather, your manufacturer
price is marked up by some percentage
amount by retailers in the various market
regions. You will need to consult current
research studies to determine average retailer
prices for your products in the various market
regions. In the direct channels, you do control
your final selling prices since you're selling
direct to final customers.
You must take potential cross-channel
competition into account in your price setting.
If you sell a product in multiple channels in a
market region, some customers will inevitably
seek out the lower-priced channel to purchase
preferred brands.
Prices affect customer demand in the usual
fashion within the set-top box industry. Higher
prices are normally associated with lower
levels of customer demand in all markets,
categories, and channels. The specific price
sensitivities in the markets, categories, and
channels that you face in LINKS are unknown. You will need to learn about the markets'
responsiveness to price through your experience in LINKS and by exploiting available LINKS
research studies. It's very easy to drop price to attempt to increase demand. However, it's always
Case Study:
Variable Pricing of Baseball Games
"We decided that the three principal factors that
determine why a fan goes to a game are time of
year, day of week and the opponent," said David
Howard, the Mets' senior vice president for
business. "In the summer, attendance rises with
school out, then we see a difference in
attendance for weekends than midweek, and
there's a different demand for Yankees series
than any other. The more we studied it, the
more it made sense to tailor pricing to match
demand as much as possible."
Within baseball, variable pricing is executed in
different ways. The Giants add $1-$5 to ticket
prices for games played on Fridays, Saturdays,
and Sundays. The Cardinals add $1 to ticket
prices for games from May 31 to September 7.
The Cubs announced a three-level season ticket
plan last week. Eight value dates for afternoon
games from April 9 to May 7 are the cheapest
(the best club box is $18). Nineteen prime
games - for opening day and all Fridays,
Saturdays and Sundays from June 6 to August
17 - are the most expensive (the club box is
$45). And for the remaining 54 dates, fans will
pay $36 for the club box.
Source: Richard Sandomir, "Ticket Prices For Mets Tailored
To The Occasion," New York Times (November 27, 2002).
36 LINKS Marketing Strategy Simulation
an interesting question whether that increased demand actually increases profits. Remember, the
price drop that generates increased demand also reduces your margin on each unit sold. More
importantly, it's easy for competitors to see and feel threatened by a price change.
In addition to the physical costs of producing and distributing updated price sheets, lists, and
databases that accrue when a manufacturer changes price (so-called “menu costs”), a range of
indirect and non-obvious costs arise with
price adjustments.1
Managerial Costs: A manufacturer must
gather information, analyze, assess, and
ultimately communicate the logic
associated with price changes throughout
their firm. Managerial costs presumably
increase with larger price changes, since
there is more to assess/analyze and
more organizational members become
involved with larger price changes.
Customer-Facing Costs: When
implementing price changes, a
communications program must be
created and executed to portray a price
change in the most favorable light to
customers. In a B2B environment, price
adjustments potentially involve
(re)negotiation with those customers who are resistant to new (higher) prices.
In LINKS, each price change by your manufacturing firm for a product in a channel in a market
region results in $10,000 in costs plus $200 in costs per-dollar change in price (increase or
decrease in price) plus costs of 0.25% of current-quarter revenues.2 For example, a $75
change in price on a product with revenues of $4,500,000 in a particular channel and region
incurs price change costs of $10,000 + ($200)(75) + (0.0025)($4,500,000) = $10,000 + $15,000
+ $11,250 = $36,250. These price change costs are recorded as “Price Changes” in the “Fixed
and Other Costs” section of your firm’s profit-and-loss statements in the quarter in which the
price change occurs.
Price wars are often initiated by thoughtless price manipulations by naive managers who assume
that competitors won't notice, won't respond, or respond ineptly. To provide a fact-based
1 Recent published research documents the range of direct and indirect costs associated with price
adjustments for a large U.S. industrial manufacturer (more than one billion USD$ revenues selling 8,000
products [used to maintain machinery] through OEMs and distributors). The authors found that
managerial costs are more than 6 times, and customer-facing costs are more than 20 times, the so-called
“menu costs” (physical costs) associated with price adjustments. In total, price adjustment costs comprise
1.22% of the company’s revenue and 20.03% of the company’s net margin. {Source: Mark J. Zbaracki,
Mark Ritson, Daniel Levy, Shantanu Dutta, and Mark Bergen, “Managerial and Customer Costs of Price
Adjustment: Direct Evidence From Industrial Markets,” The Review of Economics and Statistics,
Volume 86, Number 2 (May 2004), pp. 514-533.}
2 Price change costs only accrue for products that are already actively being sold in a channel and region.
No price change costs accrue for price changes for a product as it is being introduced into a channel and
region (i.e., it was inactive in that channel and region in the last quarter).
FYI: Price Cuts and Profits
Here are some estimates of the impact on
operating profit of a 1% reduction in price,
assuming no change in volume or costs:
Food and drug stores: -23.7%
Airlines: -12.9%
Computers, office equipment: -11.0%
Tobacco: -4.9%
Semiconductors: -3.0%
Across all industries, the average decrease in
operating profit from a 1% price decrease was
8.0%, assuming no change in volume or costs.
Source: McKinsey & Co., cited in Janice Revell, "The Price
Is Not Always Right," Fortune (May 14, 2001), p. 110.
LINKS Marketing Strategy Simulation 37
approach for making pricing decisions, please refer to the "Pricing Worksheet" on the following
page. Complete this "Pricing Worksheet" anytime you're planning to reduce prices. Review the
worksheet details with your teammates. After this review, go ahead with the price decrease if you
really think that it's appropriate. Review this "Pricing Worksheet" again after you receive next
quarter's financial results to verify whether your assumptions and predictions were reasonable.
Marketing Spending Decisions
A marketing spending budget is required for each set-top box product in each market region and
channel. This budget is managed by the relevant region and channel managers in your firm and
is used for advertising, promotion, and sales force efforts associated with your products. You are
free to allocate funds to marketing spending as you see fit. Spending does not have to be equal
in all regions and channels.
Marketing spending is thought to increase
customer demand for set-top box products in
all market regions and channels. Past
industry practice has been to budget at least
$50,000 per quarter in marketing spending in
all market regions and channels in which a
set-top box product is actively distributed. It is
thought that marketing spending's impact on
customer demand declines somewhat at
higher expenditure levels, but the precise form
of the relationship between marketing
spending and sales is unknown. You will have
to learn about marketing spending's influence
on sales through your experience within the
set-top box industry.
Since the channels overlap to an extent,
marketing spending in one channel of a
market region will have some spillover in
influencing customers in the other channel.
Advertising, for example, targeted at individual
consumers will have some spillover to
businesses that normally purchase in the direct channel. Marketing efforts are not normally
targeted to reach only those customers in a particular channel.
If you drop a product from active distribution in a region or channel, you must also reduce the
marketing spending to $0. Otherwise, marketing spending will continue to occur, perhaps in
anticipation of a future relaunch.
FYI: Marketing/Sales Ratios
Marketing expenditures typically range between
10% and 20% of sales revenues. The ratios are
highest for businesses with high gross profit
margins. Sales force/sales ratios average three
times advertising/sales ratios. Business-to-
business (B-to-B) typically spend five to six times
as much on sales force budgets as advertising,
while spending only about half as much on total
marketing as a percentage of sales as do
business-to-consumer (B-to-C) businesses.
Both B-to-B and B-to-C spend more on
marketing/sales when selling new products,
products purchased in low dollar amounts, and
more frequently purchased products.
Source: Paul Farris and Gary L. Lilien, “Marketing/Sales
Ratios,” in Dominique M. Hanssens (Editor), Empirical
Generalizations About Marketing Impact: What We Have
Learned From Academic Research (Cambridge, MA:
Marketing Science Institute, 2009), p. 94.
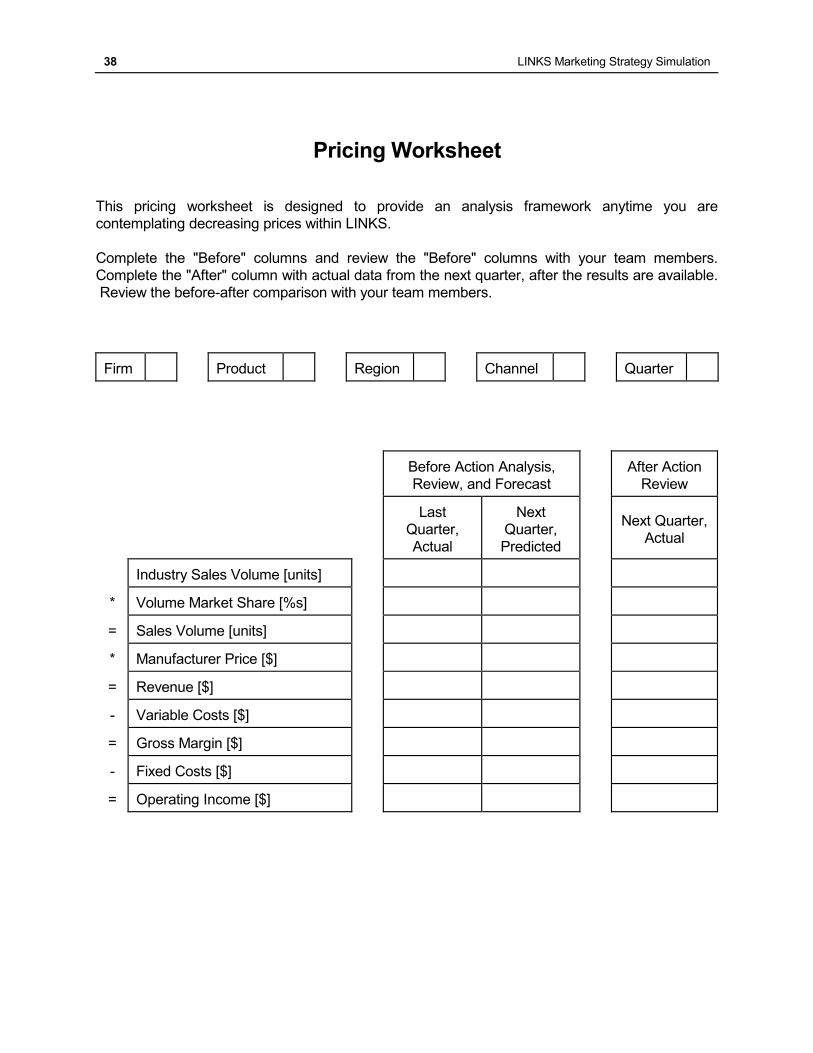
38 LINKS Marketing Strategy Simulation
Pricing Worksheet
This pricing worksheet is designed to provide an analysis framework anytime you are
contemplating decreasing prices within LINKS.
Complete the "Before" columns and review the "Before" columns with your team members.
Complete the "After" column with actual data from the next quarter, after the results are available.
Review the before-after comparison with your team members.
Firm Product Region Channel Quarter
Before Action Analysis,
Review, and Forecast
After Action
Review
Last
Quarter,
Actual
Next
Quarter,
Predicted
Next Quarter,
Actual
Industry Sales Volume [units]
* Volume Market Share [%s]
= Sales Volume [units]
* Manufacturer Price [$]
= Revenue [$]
- Variable Costs [$]
= Gross Margin [$]
- Fixed Costs [$]
= Operating Income [$]
LINKS Marketing Strategy Simulation 39
Marketing Program Details
"Marketing is not the art of finding clever ways to dispose of what you make. It is the art
of creating genuine customer value. It is the art of helping your customers become
better off. The marketer's watchwords are quality, service, and value." – Philip Kotler
In addition to choosing a marketing spending budget (total marketing spending) to support each
product in each channel in each region, you must also provide four marketing program details:
marketing mix allocation, marketing positioning, promotional program, and sales force salary.
Marketing Mix Allocation
Marketing mix allocation refers to the distribution of your specified marketing spending budget
across advertising, promotion, and sales force programs in support of each product in each
channel in each market region. Obviously, these three percentages must sum to 100% for each
product in each channel and each market region.
Advertising programs are implemented by your firm's advertising agency in each market region in
which your firm operates. Your regional sales managers implement promotional and sales force
programs in your market regions. Sales force programs can include both internal sales
representatives (company employees) and external sales representatives (independent sales
representatives who work for several non-competing companies simultaneously).
Your 6-digit marketing mix allocation (excluding "%" symbols) specifies the 2-digit percentage
allocations of your total marketing spending budget to advertising, promotion, and sales force
programs, respectively. You must allocate at least 10% of your marketing spending budget
to each of advertising, promotion, and sales force. For example, the 6-digit marketing mix
allocation 113653 specifies that 11%, 36%, and 53% of the total marketing spending budget is to
be allocated to advertising, promotion, and sales force programs, respectively.
You are, of course, free to vary your marketing mix allocations across your products, channels,
and regions, as you see fit.
Marketing Positioning
Each set-top box product in each market (channel and region) has a marketing positioning to
guide advertising, promotion, and sales force efforts. Marketing positioning communicates the
value proposition that a product offers to customers in a market.
Marketing positioning includes both “how to say it” (competitive positioning) and "what to say"
(benefit proposition). LINKS firms select a two-digit marketing positioning code for each product
in each market (channel and region).
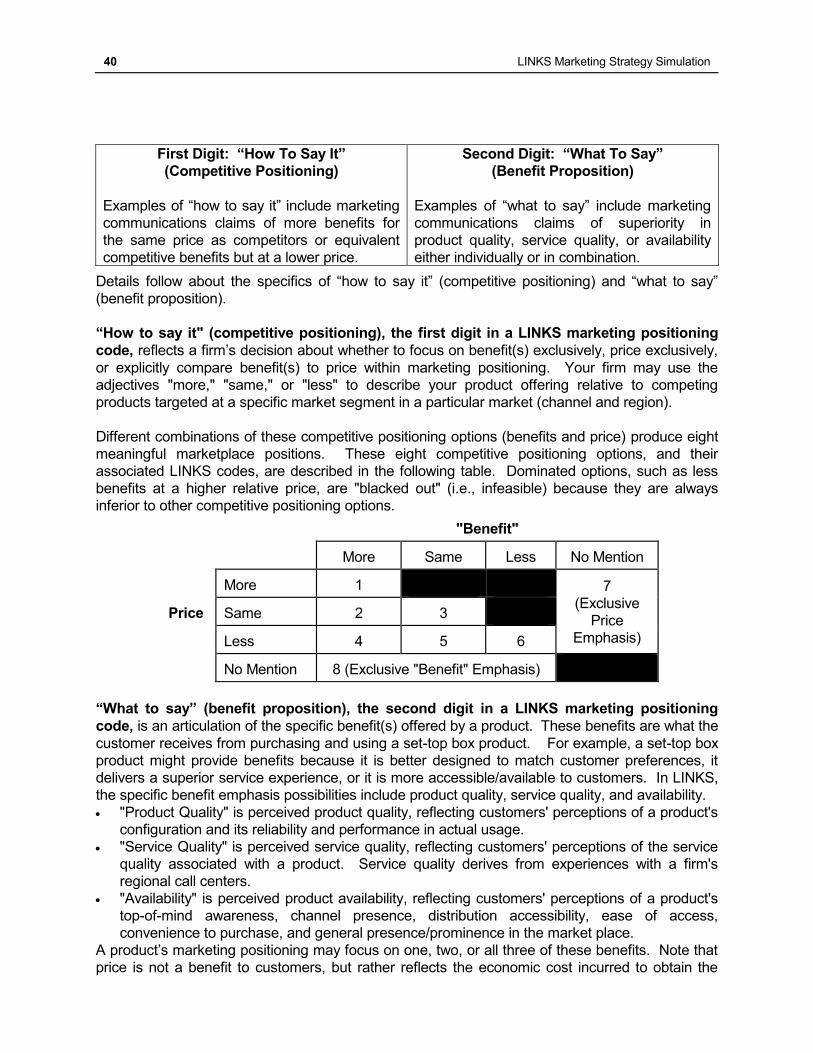
40 LINKS Marketing Strategy Simulation
First Digit: “How To Say It”
(Competitive Positioning)
Examples of “how to say it” include marketing
communications claims of more benefits for
the same price as competitors or equivalent
competitive benefits but at a lower price.
Second Digit: “What To Say”
(Benefit Proposition)
Examples of “what to say” include marketing
communications claims of superiority in
product quality, service quality, or availability
either individually or in combination.
Details follow about the specifics of “how to say it” (competitive positioning) and “what to say”
(benefit proposition).
“How to say it" (competitive positioning), the first digit in a LINKS marketing positioning
code, reflects a firm’s decision about whether to focus on benefit(s) exclusively, price exclusively,
or explicitly compare benefit(s) to price within marketing positioning. Your firm may use the
adjectives "more," "same," or "less" to describe your product offering relative to competing
products targeted at a specific market segment in a particular market (channel and region).
Different combinations of these competitive positioning options (benefits and price) produce eight
meaningful marketplace positions. These eight competitive positioning options, and their
associated LINKS codes, are described in the following table. Dominated options, such as less
benefits at a higher relative price, are "blacked out" (i.e., infeasible) because they are always
inferior to other competitive positioning options.
"Benefit"
More Same Less No Mention
More 1 7
(Exclusive
Price
Emphasis)
Price Same 2 3
Less 4 5 6
No Mention 8 (Exclusive "Benefit" Emphasis)
“What to say” (benefit proposition), the second digit in a LINKS marketing positioning
code, is an articulation of the specific benefit(s) offered by a product. These benefits are what the
customer receives from purchasing and using a set-top box product. For example, a set-top box
product might provide benefits because it is better designed to match customer preferences, it
delivers a superior service experience, or it is more accessible/available to customers. In LINKS,
the specific benefit emphasis possibilities include product quality, service quality, and availability.
"Product Quality" is perceived product quality, reflecting customers' perceptions of a product's
configuration and its reliability and performance in actual usage.
"Service Quality" is perceived service quality, reflecting customers' perceptions of the service
quality associated with a product. Service quality derives from experiences with a firm's
regional call centers.
"Availability" is perceived product availability, reflecting customers' perceptions of a product's
top-of-mind awareness, channel presence, distribution accessibility, ease of access,
convenience to purchase, and general presence/prominence in the market place.
A product’s marketing positioning may focus on one, two, or all three of these benefits. Note that
price is not a benefit to customers, but rather reflects the economic cost incurred to obtain the
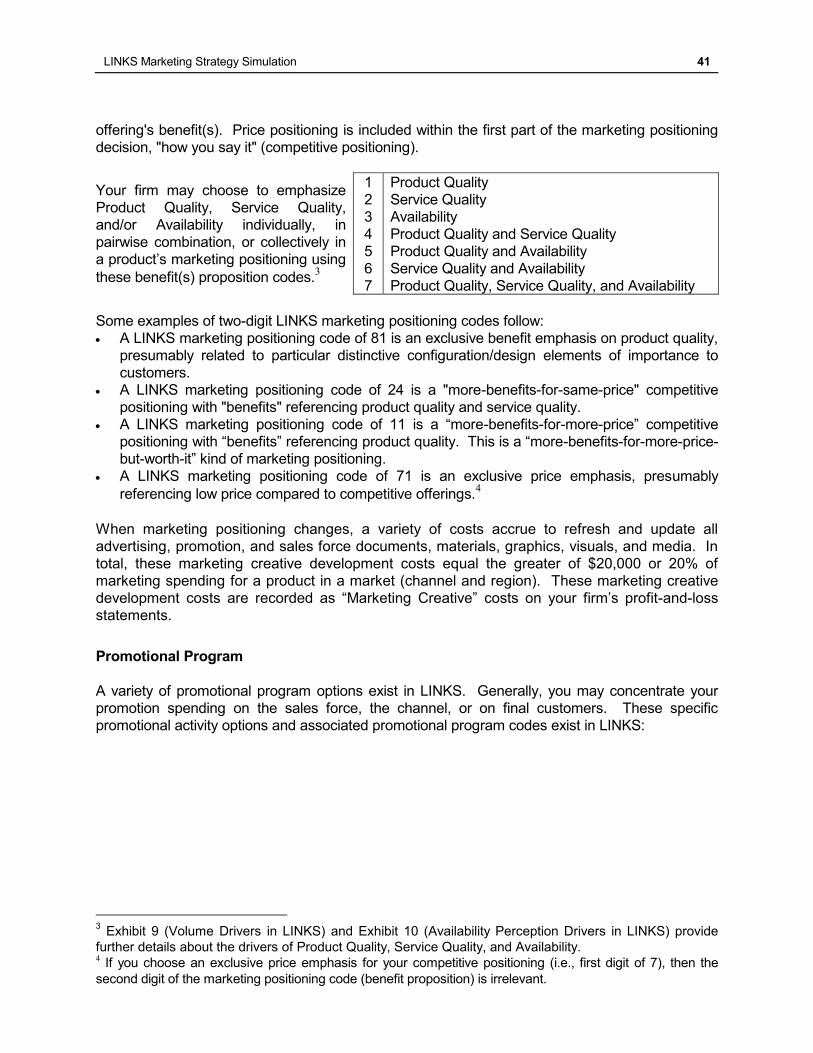
LINKS Marketing Strategy Simulation 41
offering's benefit(s). Price positioning is included within the first part of the marketing positioning
decision, "how you say it" (competitive positioning).
Your firm may choose to emphasize
Product Quality, Service Quality,
and/or Availability individually, in
pairwise combination, or collectively in
a product’s marketing positioning using
these benefit(s) proposition codes.3
1
2
3
4
5
6
7
Product Quality
Service Quality
Availability
Product Quality and Service Quality
Product Quality and Availability
Service Quality and Availability
Product Quality, Service Quality, and Availability
Some examples of two-digit LINKS marketing positioning codes follow:
A LINKS marketing positioning code of 81 is an exclusive benefit emphasis on product quality,
presumably related to particular distinctive configuration/design elements of importance to
customers.
A LINKS marketing positioning code of 24 is a "more-benefits-for-same-price" competitive
positioning with "benefits" referencing product quality and service quality.
A LINKS marketing positioning code of 11 is a “more-benefits-for-more-price” competitive
positioning with “benefits” referencing product quality. This is a “more-benefits-for-more-price-
but-worth-it” kind of marketing positioning.
A LINKS marketing positioning code of 71 is an exclusive price emphasis, presumably
referencing low price compared to competitive offerings.4
When marketing positioning changes, a variety of costs accrue to refresh and update all
advertising, promotion, and sales force documents, materials, graphics, visuals, and media. In
total, these marketing creative development costs equal the greater of $20,000 or 20% of
marketing spending for a product in a market (channel and region). These marketing creative
development costs are recorded as “Marketing Creative” costs on your firm’s profit-and-loss
statements.
Promotional Program
A variety of promotional program options exist in LINKS. Generally, you may concentrate your
promotion spending on the sales force, the channel, or on final customers. These specific
promotional activity options and associated promotional program codes exist in LINKS:
3 Exhibit 9 (Volume Drivers in LINKS) and Exhibit 10 (Availability Perception Drivers in LINKS) provide
further details about the drivers of Product Quality, Service Quality, and Availability. 4 If you choose an exclusive price emphasis for your competitive positioning (i.e., first digit of 7), then the
second digit of the marketing positioning code (benefit proposition) is irrelevant.
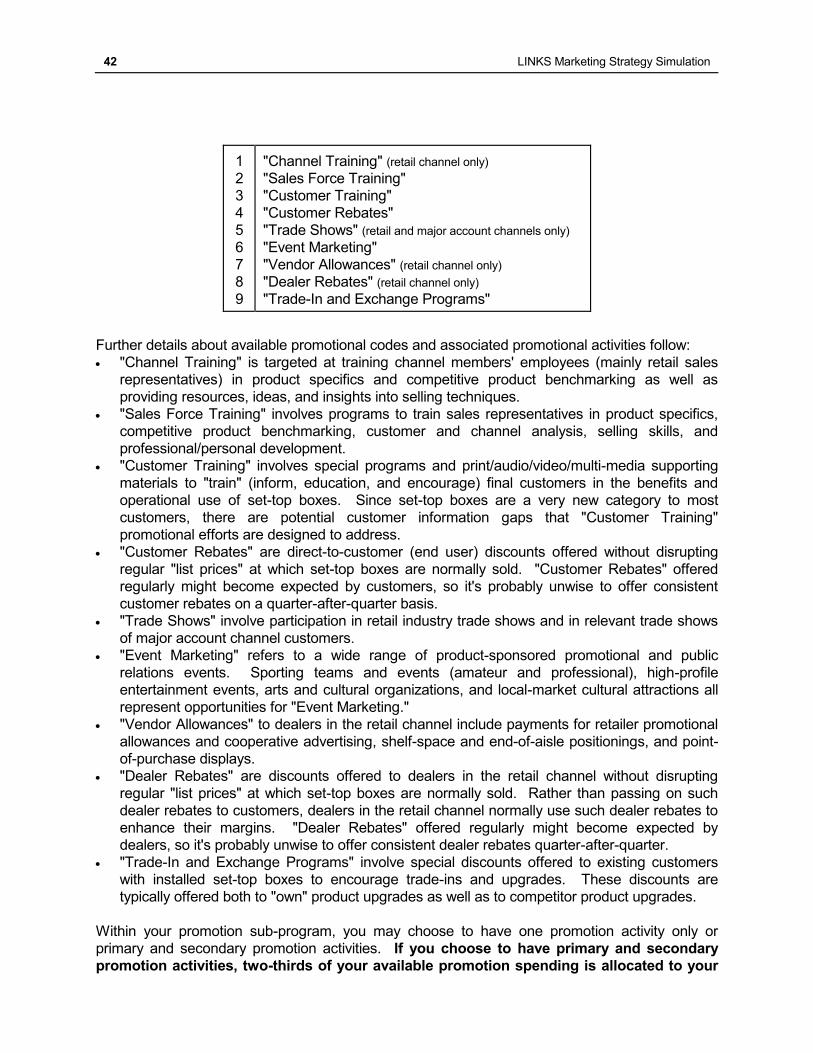
42 LINKS Marketing Strategy Simulation
1
2
3
4
5
6
7
8
9
"Channel Training" (retail channel only)
"Sales Force Training"
"Customer Training"
"Customer Rebates"
"Trade Shows" (retail and major account channels only)
"Event Marketing"
"Vendor Allowances" (retail channel only)
"Dealer Rebates" (retail channel only)
"Trade-In and Exchange Programs"
Further details about available promotional codes and associated promotional activities follow:
"Channel Training" is targeted at training channel members' employees (mainly retail sales
representatives) in product specifics and competitive product benchmarking as well as
providing resources, ideas, and insights into selling techniques.
"Sales Force Training" involves programs to train sales representatives in product specifics,
competitive product benchmarking, customer and channel analysis, selling skills, and
professional/personal development.
"Customer Training" involves special programs and print/audio/video/multi-media supporting
materials to "train" (inform, education, and encourage) final customers in the benefits and
operational use of set-top boxes. Since set-top boxes are a very new category to most
customers, there are potential customer information gaps that "Customer Training"
promotional efforts are designed to address.
"Customer Rebates" are direct-to-customer (end user) discounts offered without disrupting
regular "list prices" at which set-top boxes are normally sold. "Customer Rebates" offered
regularly might become expected by customers, so it's probably unwise to offer consistent
customer rebates on a quarter-after-quarter basis.
"Trade Shows" involve participation in retail industry trade shows and in relevant trade shows
of major account channel customers.
"Event Marketing" refers to a wide range of product-sponsored promotional and public
relations events. Sporting teams and events (amateur and professional), high-profile
entertainment events, arts and cultural organizations, and local-market cultural attractions all
represent opportunities for "Event Marketing."
"Vendor Allowances" to dealers in the retail channel include payments for retailer promotional
allowances and cooperative advertising, shelf-space and end-of-aisle positionings, and point-
of-purchase displays.
"Dealer Rebates" are discounts offered to dealers in the retail channel without disrupting
regular "list prices" at which set-top boxes are normally sold. Rather than passing on such
dealer rebates to customers, dealers in the retail channel normally use such dealer rebates to
enhance their margins. "Dealer Rebates" offered regularly might become expected by
dealers, so it's probably unwise to offer consistent dealer rebates quarter-after-quarter.
"Trade-In and Exchange Programs" involve special discounts offered to existing customers
with installed set-top boxes to encourage trade-ins and upgrades. These discounts are
typically offered both to "own" product upgrades as well as to competitor product upgrades.
Within your promotion sub-program, you may choose to have one promotion activity only or
primary and secondary promotion activities. If you choose to have primary and secondary
promotion activities, two-thirds of your available promotion spending is allocated to your
LINKS Marketing Strategy Simulation 43
primary promotion activity with the residual one-third being allocated to your secondary
promotion activity.
Your 2-digit promotional activity code specifies your primary and secondary promotional activities.
A second digit of zero ("0") is interpreted as your promotion program having no secondary
promotional activity (i.e., your promotional efforts are directed at only one promotional activity).
For example, the promotional code 36 specifies a primary promotion emphasis of customer
training and a secondary promotion emphasis of event marketing.
Sales Force Salary
In each channel and region, the combination of your marketing spending and your marketing
mix decisions for each product implies a total sales force spending level for that product,
channel, and region. For example, marketing spending of $200,000 and a marketing mix of
223840 for a product/channel/region results in quarterly sales force spending of $80,000 (since
sales force spending with a marketing mix of 223840 is 40% of the total marketing spending of
$200,000).
You don’t control the size of your sales force for a product/channel/region directly. In setting
sales force salaries for each product/channel/region, you determine the sales force size for a
product/channel/region. Sales force size equals the implied product/channel/region sales force
spending divided by 3.5 times your quarterly sales force salary. The “3.5” reflects the
administrative overhead associated with sales force personnel (i.e., total sales representative
costs equal 3.5 times sales force salary).
Total sales force spending includes direct and indirect sales force costs. Sales representatives
incur direct and indirect expenses in connection with the sales task. Direct expenses generated
are in terms of fringe benefits (health insurance, government taxes of various kinds, and so on)
and travel costs (automobile costs and per diem expenses while away from home). Indirect costs
to support the sales representative include periodic sales training activities, sales management
overhead, office support, and the like. In total, these expenses are equal to 2.5 times the sales
force salary level of a sales representative.
Sales force salaries are expressed in $/month terms (e.g., $2,239/month). Sales force salaries
are specific to a product/channel/region, since your firm has a general policy of favoring
dedicated sales representatives for each product, channel, and region. For example, with a
sales force salary of $3,500/month ($10,500/quarter), an implied quarterly total sales force
spending of $147,000 equates to a sales force size of 4.00 sales representatives.
The full details for your sales force program are reported in your financial/operating statements,
as part of each product’s “Marketing Program Details” report. A sample excerpt from a
“Marketing Program Details” report follows:
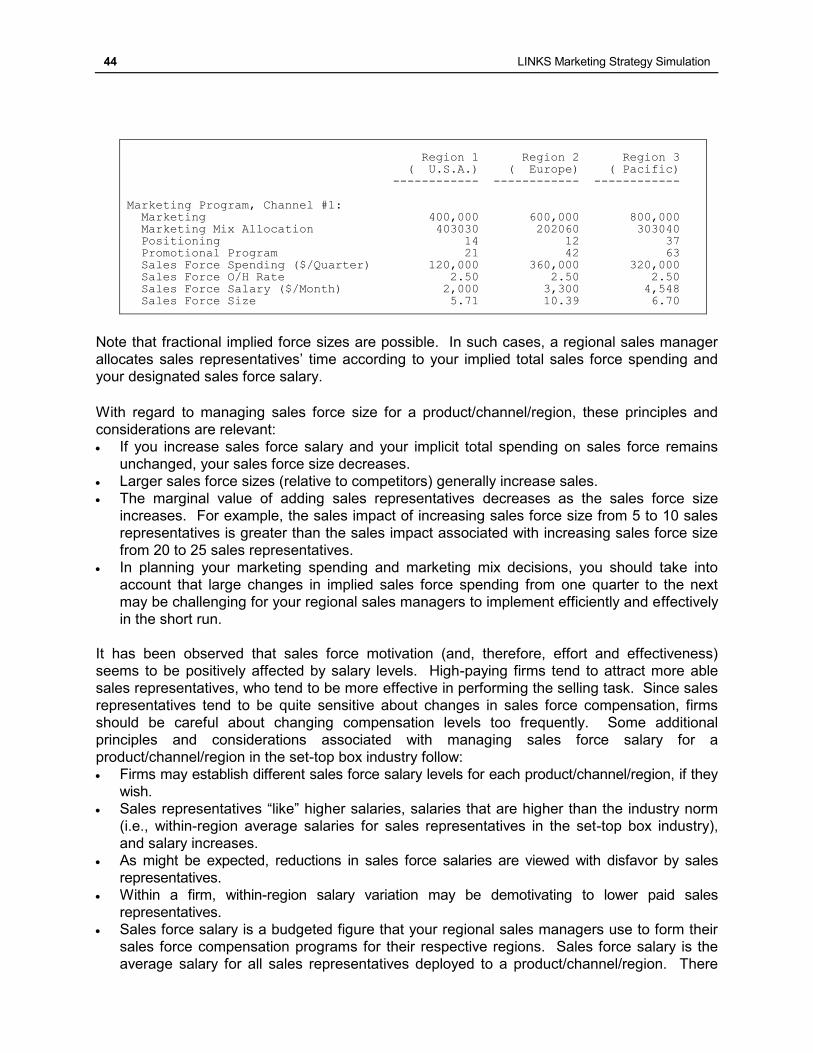
44 LINKS Marketing Strategy Simulation
Region 1 Region 2 Region 3 ( U.S.A.) ( Europe) ( Pacific) ------------ ------------ ------------ Marketing Program, Channel #1: Marketing 400,000 600,000 800,000 Marketing Mix Allocation 403030 202060 303040 Positioning 14 12 37 Promotional Program 21 42 63 Sales Force Spending ($/Quarter) 120,000 360,000 320,000 Sales Force O/H Rate 2.50 2.50 2.50 Sales Force Salary ($/Month) 2,000 3,300 4,548 Sales Force Size 5.71 10.39 6.70
Note that fractional implied force sizes are possible. In such cases, a regional sales manager
allocates sales representatives’ time according to your implied total sales force spending and
your designated sales force salary.
With regard to managing sales force size for a product/channel/region, these principles and
considerations are relevant:
If you increase sales force salary and your implicit total spending on sales force remains
unchanged, your sales force size decreases.
Larger sales force sizes (relative to competitors) generally increase sales.
The marginal value of adding sales representatives decreases as the sales force size
increases. For example, the sales impact of increasing sales force size from 5 to 10 sales
representatives is greater than the sales impact associated with increasing sales force size
from 20 to 25 sales representatives.
In planning your marketing spending and marketing mix decisions, you should take into
account that large changes in implied sales force spending from one quarter to the next
may be challenging for your regional sales managers to implement efficiently and effectively
in the short run.
It has been observed that sales force motivation (and, therefore, effort and effectiveness)
seems to be positively affected by salary levels. High-paying firms tend to attract more able
sales representatives, who tend to be more effective in performing the selling task. Since sales
representatives tend to be quite sensitive about changes in sales force compensation, firms
should be careful about changing compensation levels too frequently. Some additional
principles and considerations associated with managing sales force salary for a
product/channel/region in the set-top box industry follow:
Firms may establish different sales force salary levels for each product/channel/region, if they
wish.
Sales representatives “like” higher salaries, salaries that are higher than the industry norm
(i.e., within-region average salaries for sales representatives in the set-top box industry),
and salary increases.
As might be expected, reductions in sales force salaries are viewed with disfavor by sales
representatives. Within a firm, within-region salary variation may be demotivating to lower paid sales
representatives. Sales force salary is a budgeted figure that your regional sales managers use to form their
sales force compensation programs for their respective regions. Sales force salary is the
average salary for all sales representatives deployed to a product/channel/region. There
LINKS Marketing Strategy Simulation 45
will, of course, be some variation across individual sales representatives due to the usual
factors of tenure, performance, and the like. However, the average sales compensation will
always equal your designated sales force salary for a product/channel/region.
The Full Marketing Program
For each product/channel/region, a complete marketing program consists of five components:
(1) Marketing spending budget (the Ldollars allocated to marketing support of a product in a
channel in a region).
(2) Marketing mix allocation, a 6-digit code corresponding to the 2-digit percentages (excluding
"%" symbols) of the respective allocations of the total marketing spending budget to
advertising, promotion, and sales force sub-programs.
(3) Marketing positioning, a 2-digit code corresponding to competitive positioning ("how-you-say-
it") and benefit proposition ("what-you-say").
(4) Promotional program, a 2-digit code representing primary and secondary promotional
programs (the second digit of "0" signifies that no secondary promotion activity exists).
(5) Sales force salary (the monthly salary level per sales representative).
Obviously, these marketing program elements must be chosen with a sense of a product's natural
relative standing in the competitive set-top box industry.
You are, of course, free to vary your marketing spending budgets, marketing mix allocations,
marketing positionings, promotional programs, and sales force salaries across your products,
channels, and regions as you see fit. However, be mindful of cross-channel (across the various
channels in a specific market region) overlaps and potentially within-region conflicting messages
in your marketing communications efforts. For example, it seems unwise to focus your marketing
communications positioning for a product in a region on price in channel #1 and on benefits in
channel #2 when many customers will be exposed to both messages simultaneously. The
inconsistencies that customers perceive in these conflicting positionings for the same product in
different channels may impact customers' perceptions of your product negatively.
If you make any inadvertent input error in marketing mix allocation, marketing positioning, or
promotional program inputs, the previous quarter's values will continue to be in effect in the
current quarter. Examples of input errors include marketing mix allocations which don't sum to
100%, marketing mix allocations of less than 10%, and invalid marketing positioning, promotional
program codes, or sales force salary levels.
Introduction/Drop Decisions
You may introduce products into regions or channels not currently active or drop products from
regions or channels as you see fit. Introduction incurs a one-time cost of $750,000 in channel #1
in any region and $250,000 in any other channel in any region.5 Dropping a product from active
distribution in a region or channel incurs no special costs. Introduction costs are recorded under
5 The higher per-channel introduction costs in channel #1 reflect slotting fees and allowances in the retail
channel. Slotting fees and allowances are the up-front, one-time, lump-sum payments from set-top box
manufacturers to retailers to obtain new product distribution in the retail channel. For a discussion and
analysis of retail-channel slotting fees, see Paula Fitzgerald Bond, Karen Russo France, and Richard
Riley, “A Multi-Firm Analysis of Slotting fees,” Journal of Public Policy & Marketing, Volume 25,
Number 2 (Fall 2006), pp. 224-237.
46 LINKS Marketing Strategy Simulation
"Introductions" on your financial statements.
If you wish to "activate" a product in a channel/region, you must issue a specific introduction
decision. Change the "Active Product?" status to "Yes" to introduce a product into a specific
channel and/or region. To drop a product from active status in a channel or region, change its
"Active Product?" status to "No." You only have to introduce a product into a channel/region
once. Once a product is active in a channel/region, it will continue to be active until you
make an explicit drop ("No") decision.
You must explicitly introduce or drop a product from a channel and/or region, regardless of your
marketing spending and your sales volume forecasts. Setting marketing spending to zero does
not result in the associated product being dropped from that market region and channel.
If you drop a product from a channel/region, you must change marketing spending to $0.
Otherwise, marketing spending continues to occur, in anticipation of a future relaunch.
Your firm has a policy of limiting simultaneous new product-region-channel launches to a
maximum of three in any quarter. For example, if you choose to launch a product in all three
channels of a region, that action represents a total of three new launches and no other launches
would be possible in that quarter in that region, or in any other combinations of channels and
regions. A reconfiguration isn't a launch if that product is already actively distributed in a channel
or a region. However, if you reconfigure a product and launch (introduce) it into two channels in
one region and one channel in another region, that represents three new launches and no other
launches would be possible in that quarter.
Generate Demand Decisions Form
Blank "Generate Demand Decisions" forms may be found on the next two pages. Complete
these decision forms during your team deliberations.
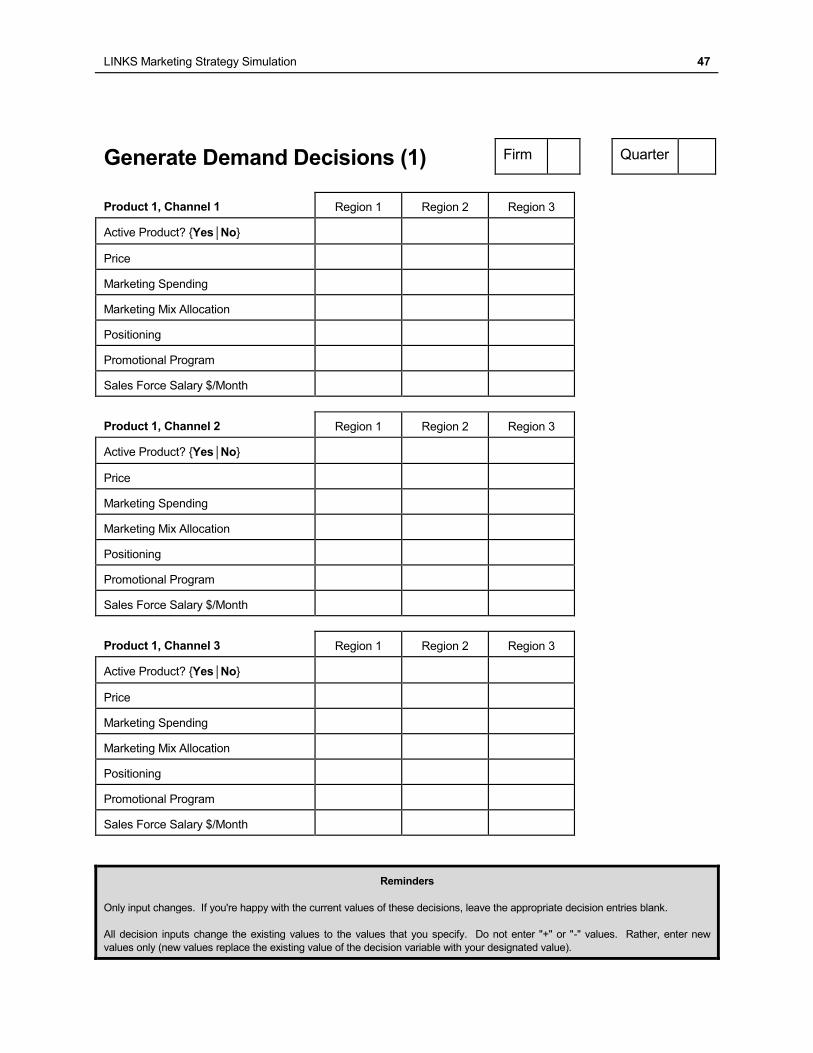
LINKS Marketing Strategy Simulation 47
Generate Demand Decisions (1) Firm Quarter
Product 1, Channel 1 Region 1 Region 2 Region 3
Active Product? {Yes│No}
Price
Marketing Spending
Marketing Mix Allocation
Positioning
Promotional Program
Sales Force Salary $/Month
Product 1, Channel 2 Region 1 Region 2 Region 3
Active Product? {Yes│No}
Price
Marketing Spending
Marketing Mix Allocation
Positioning
Promotional Program
Sales Force Salary $/Month
Product 1, Channel 3 Region 1 Region 2 Region 3
Active Product? {Yes│No}
Price
Marketing Spending
Marketing Mix Allocation
Positioning
Promotional Program
Sales Force Salary $/Month
Reminders
Only input changes. If you're happy with the current values of these decisions, leave the appropriate decision entries blank.
All decision inputs change the existing values to the values that you specify. Do not enter "+" or "-" values. Rather, enter new
values only (new values replace the existing value of the decision variable with your designated value).
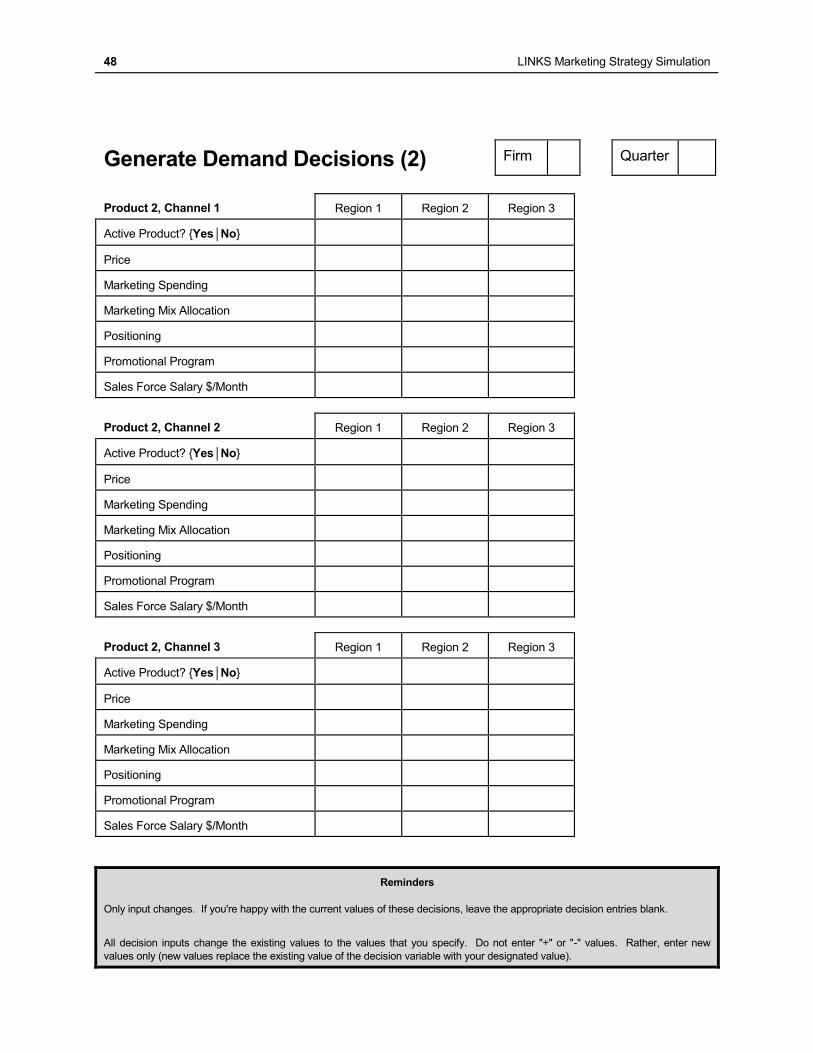
48 LINKS Marketing Strategy Simulation
Generate Demand Decisions (2) Firm Quarter
Product 2, Channel 1 Region 1 Region 2 Region 3
Active Product? {Yes│No}
Price
Marketing Spending
Marketing Mix Allocation
Positioning
Promotional Program
Sales Force Salary $/Month
Product 2, Channel 2 Region 1 Region 2 Region 3
Active Product? {Yes│No}
Price
Marketing Spending
Marketing Mix Allocation
Positioning
Promotional Program
Sales Force Salary $/Month
Product 2, Channel 3 Region 1 Region 2 Region 3
Active Product? {Yes│No}
Price
Marketing Spending
Marketing Mix Allocation
Positioning
Promotional Program
Sales Force Salary $/Month
Reminders
Only input changes. If you're happy with the current values of these decisions, leave the appropriate decision entries blank.
All decision inputs change the existing values to the values that you specify. Do not enter "+" or "-" values. Rather, enter new
values only (new values replace the existing value of the decision variable with your designated value).
LINKS Marketing Strategy Simulation 49
Chapter 10: Forecasting Decisions "Prediction is very difficult, especially about the future." – Niels Bohr
This chapter provides details about the forecasting decisions for which you are responsible in
LINKS: next-quarter, short-term sales volume forecasts for all products/channels/regions.
Sales Volume Forecasting Decisions
"Forecasting is like looking into a Kaleidoscope. The patterns are beautiful, but with a wrist
flick, they change dramatically. The patterns all look clear today, but just a flick of fate, a
competitor's action, or a shift in customer preferences and everything changes." – Claire
Verweij, University of Michigan MBA (1995)
Forecasting prowess reflects understanding of the generate demand drivers of any business. In
LINKS, quarterly sales volume forecasts are required for each channel's sales of each of your
products in every market region.
Administrative overhead costs increase by 1% for every 1% inaccuracy in your sales volume
forecasts. For example, a forecast error of 10% (whether positive or negative) for a product in a
region increases the administrative overhead costs for that product in that region by 10%.
The maximum administrative overhead penalty associated with sales forecasting inaccuracy
for each product in each region is a doubling of administrative overhead.
Forecast error costs are recorded as “Forecast Inaccuracy” costs on your firm’s profit-and-loss
statements, so the reported base administrative overhead costs are always $240,000/quarter,
$360,000/quarter, and $300,000/quarter per product in channels 1, 2, and 3, respectively, in
all market regions.
Sales volume forecasting decisions are independent of your procurement and production
decisions. Sales volume forecasting decisions are your best estimates of customer demand. Of
course, your actual procurement and production decisions will be based on additional factors,
such as fixed order costs and target inventory levels.
Within LINKS, short-term sales volume forecasts are required for the next quarter. These
forecasts are for each product in each channel in each region.
Sales forecasting is only a part of the process of launching a product. You must also explicitly
activate that product. See the discussion in the Generate Demand Decisions chapter regarding
launching products into channels and regions in which they aren't currently active.
A Judgmental Sales Forecasting Template
The following page contains a judgmental sales forecasting worksheet that provides a template
for systematically approaching the sales forecasting process. Judgmental adjustments are
challenging, but at least you're explicitly taking into account that your and their (competitors')
generate demand program changes influence your sales.
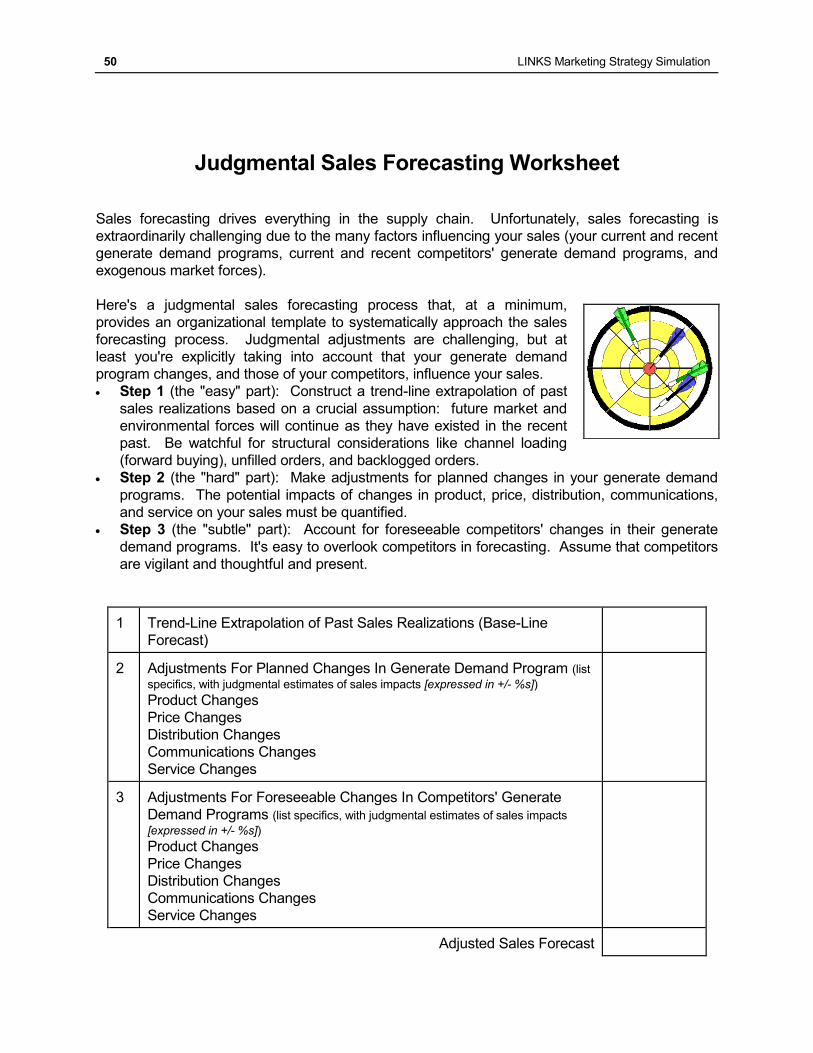
50 LINKS Marketing Strategy Simulation
Judgmental Sales Forecasting Worksheet
Sales forecasting drives everything in the supply chain. Unfortunately, sales forecasting is
extraordinarily challenging due to the many factors influencing your sales (your current and recent
generate demand programs, current and recent competitors' generate demand programs, and
exogenous market forces).
Here's a judgmental sales forecasting process that, at a minimum,
provides an organizational template to systematically approach the sales
forecasting process. Judgmental adjustments are challenging, but at
least you're explicitly taking into account that your generate demand
program changes, and those of your competitors, influence your sales.
Step 1 (the "easy" part): Construct a trend-line extrapolation of past
sales realizations based on a crucial assumption: future market and
environmental forces will continue as they have existed in the recent
past. Be watchful for structural considerations like channel loading
(forward buying), unfilled orders, and backlogged orders.
Step 2 (the "hard" part): Make adjustments for planned changes in your generate demand
programs. The potential impacts of changes in product, price, distribution, communications,
and service on your sales must be quantified.
Step 3 (the "subtle" part): Account for foreseeable competitors' changes in their generate
demand programs. It's easy to overlook competitors in forecasting. Assume that competitors
are vigilant and thoughtful and present.
1 Trend-Line Extrapolation of Past Sales Realizations (Base-Line
Forecast)
2 Adjustments For Planned Changes In Generate Demand Program (list
specifics, with judgmental estimates of sales impacts [expressed in +/- %s]) Product Changes
Price Changes
Distribution Changes
Communications Changes
Service Changes
3 Adjustments For Foreseeable Changes In Competitors' Generate
Demand Programs (list specifics, with judgmental estimates of sales impacts
[expressed in +/- %s]) Product Changes
Price Changes
Distribution Changes
Communications Changes
Service Changes
Adjusted Sales Forecast

LINKS Marketing Strategy Simulation 51
Forecasting Accuracy
"Life can only be understood backwards, but it must be lived forwards." – Soren Kierkegaard
Forecasting accuracy is one of the components of the multi-factor performance evaluation
scorecard described in Chapter 15. Forecasting accuracy influences operation performance both
directly (via adjustments in base administrative overhead for forecasting inaccuracies) and
indirectly (via inventory pipeline inefficiencies in the form of too much or too little inventory).
Forecasting accuracy is equal to 100*(1-(abs(Forecast-Actual)/Actual)) expressed in percentage
terms, where "abs" is the absolute value function. Thus, a forecast value of 11,000 and an actual
value of 8,000 result in a forecast accuracy of 100*(1-abs(11,000-8,000)/8,000) = 100*(1-
(3,000/8,000)) = 100*(1-0.375) = 62.5%. The minimum possible value of forecasting accuracy is
0.0%. For example, with an Actual sales volume of 8,000, a Forecast above 16,000 results in a
forecasting accuracy score of 0.0%.
About Forecasting and Forecasting Accuracy
Given the importance of forecasting in running your LINKS business, you might find that reading
the following article has a positive return on your reading-time investment:
J. Scott Armstrong, "The Forecasting Canon: Generalizations To Improve Forecast
Accuracy," FORESIGHT: The International Journal of Applied Forecasting, Volume 1,
Issue 1 (June 2005), pp. 29-35.
http://www.forecastingprinciples.com/paperpdf/The_Forecasting_Canon.pdf
Forecasting Decisions Form
"Predicting rain doesn't count; building arks does." – Warren Buffett
A blank "Forecasting Decisions" form may be found on the next page. Complete this decision
form during your team deliberations.
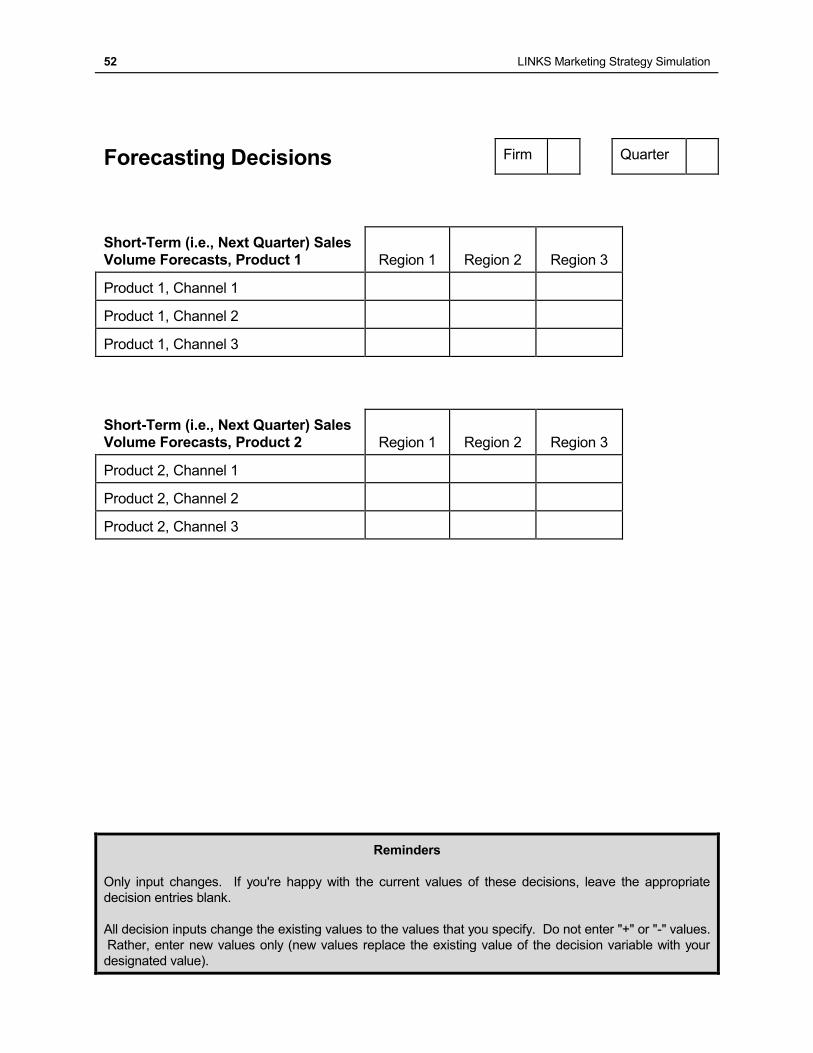
52 LINKS Marketing Strategy Simulation
Forecasting Decisions Firm Quarter
Short-Term (i.e., Next Quarter) Sales
Volume Forecasts, Product 1
Region 1
Region 2
Region 3
Product 1, Channel 1
Product 1, Channel 2
Product 1, Channel 3
Short-Term (i.e., Next Quarter) Sales
Volume Forecasts, Product 2
Region 1
Region 2
Region 3
Product 2, Channel 1
Product 2, Channel 2
Product 2, Channel 3
Reminders
Only input changes. If you're happy with the current values of these decisions, leave the appropriate
decision entries blank.
All decision inputs change the existing values to the values that you specify. Do not enter "+" or "-" values.
Rather, enter new values only (new values replace the existing value of the decision variable with your
designated value).
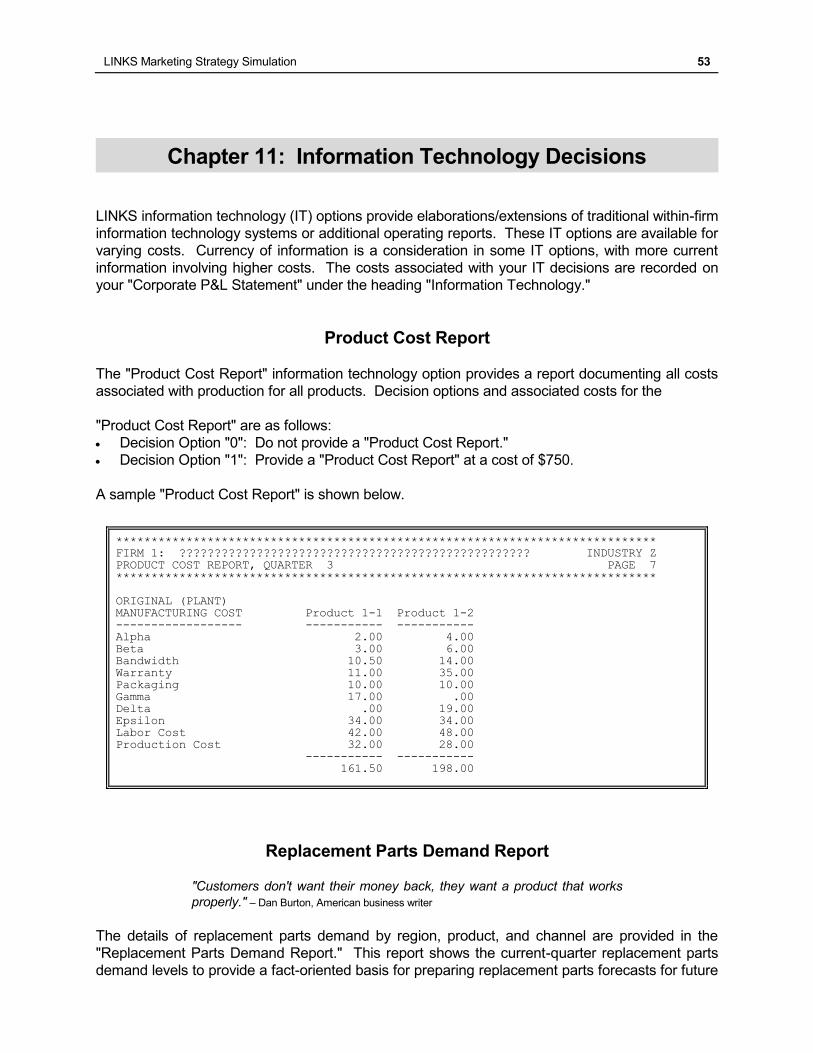
LINKS Marketing Strategy Simulation 53
Chapter 11: Information Technology Decisions
LINKS information technology (IT) options provide elaborations/extensions of traditional within-firm
information technology systems or additional operating reports. These IT options are available for
varying costs. Currency of information is a consideration in some IT options, with more current
information involving higher costs. The costs associated with your IT decisions are recorded on
your "Corporate P&L Statement" under the heading "Information Technology."
Product Cost Report
The "Product Cost Report" information technology option provides a report documenting all costs
associated with production for all products. Decision options and associated costs for the
"Product Cost Report" are as follows:
Decision Option "0": Do not provide a "Product Cost Report."
Decision Option "1": Provide a "Product Cost Report" at a cost of $750.
A sample "Product Cost Report" is shown below.
***************************************************************************** FIRM 1: ?????????????????????????????????????????????????? INDUSTRY Z PRODUCT COST REPORT, QUARTER 3 PAGE 7
***************************************************************************** ORIGINAL (PLANT) MANUFACTURING COST Product 1-1 Product 1-2 ------------------ ----------- ----------- Alpha 2.00 4.00 Beta 3.00 6.00 Bandwidth 10.50 14.00 Warranty 11.00 35.00 Packaging 10.00 10.00 Gamma 17.00 .00 Delta .00 19.00 Epsilon 34.00 34.00 Labor Cost 42.00 48.00 Production Cost 32.00 28.00 ----------- ----------- 161.50 198.00
Replacement Parts Demand Report "Customers don't want their money back, they want a product that works
properly." – Dan Burton, American business writer
The details of replacement parts demand by region, product, and channel are provided in the
"Replacement Parts Demand Report." This report shows the current-quarter replacement parts
demand levels to provide a fact-oriented basis for preparing replacement parts forecasts for future

54 LINKS Marketing Strategy Simulation
quarters. Of course, you may wish to reference past quarters' replacement parts demand to
establish a longer-term view of trend lines for replacement parts demand.
Decision options and associated costs for the "Replacement Parts Demand Report" are as
follows:
Decision Option "0": Do not provide a "Replacement Parts Demand Cost Report."
Decision Option "1": Provide a "Replacement Parts Demand Cost Report" at a cost of $1,250.
Retail Pipeline Report
Your routine financial and operations reports provide details about orders received from all
channels in all market regions. However, for the retail channel (channel 1), orders do not
correspond to actual sales to final customers. Rather, retail channel orders reflect both final
customer orders and inventory holding decisions of retailers. Retailers must hold some inventory,
to provide a buffer between customer purchases and receipts of orders from manufacturers.
You may wish to receive more detailed retail pipeline data about the inventory holdings of the
retail channel, as well as actual customers’ purchases from retailers. A "Retail Pipeline Report"
provides information on the inventories and sales of retailers in channel 1. There is no
corresponding inventory report for the direct channels, since direct-channel customers don't stock
their own inventories.
Decision options and associated costs for the "Retail Pipeline Report" are as follows:
Decision Option "0": Do not provide a "Retail Pipeline Report."
Decision Option "1": Provide a "Retail Pipeline Report" for the previous quarter with
associated costs of $10,000 per quarter plus a one-time initiation charge of $15,000 in the first
quarter in which this option is selected.
Decision Option "2": Provide a "Retail Pipeline Report" for the current quarter with associated
costs of $20,000 per quarter plus a one-time initiation charge of $30,000 in the first quarter in
which this option is selected.
The higher costs for current-quarter data are based on development and maintenance costs
associated with a much more elaborate and time-sensitive EDI system. There are no charges
associated with terminating the ordering of a "Retail Pipeline Report." To terminate ordering the
"Retail Pipeline Report," you would change your decision variable to 0 (zero). If you choose to
order a "Retail Pipeline Report," it will be included among your financial and operations reports.
A sample "Retail Pipeline Report" is shown below.
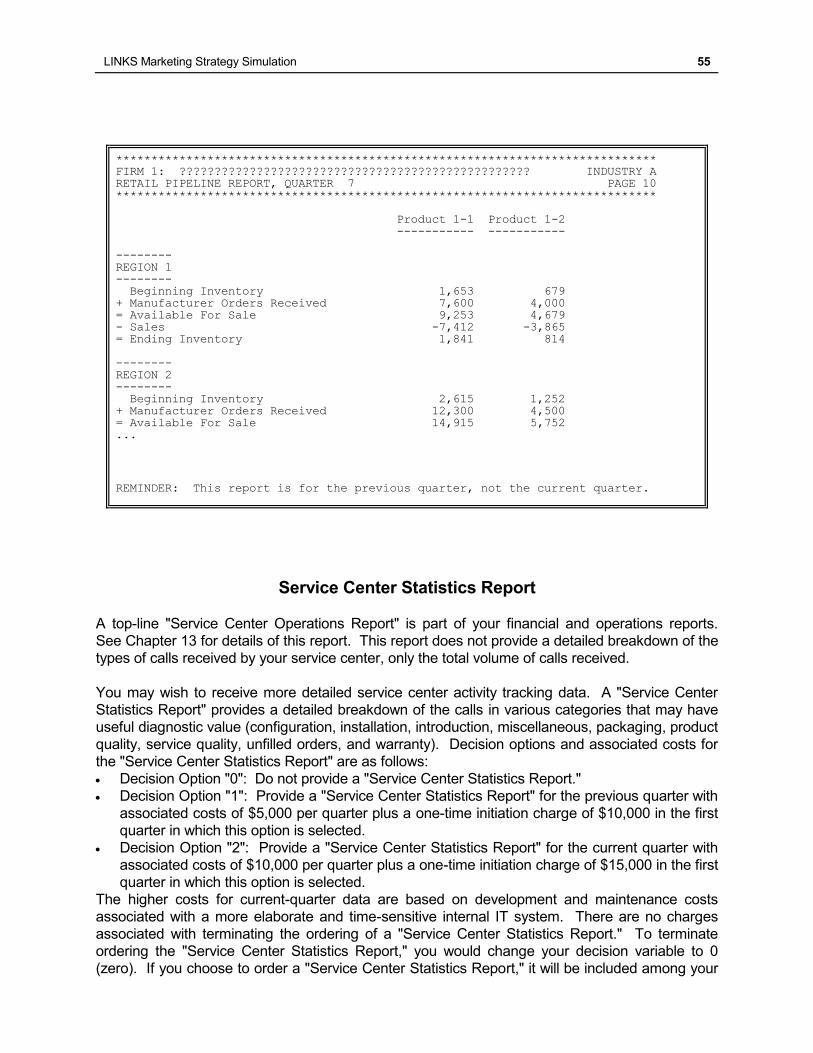
LINKS Marketing Strategy Simulation 55
***************************************************************************** FIRM 1: ?????????????????????????????????????????????????? INDUSTRY A RETAIL PIPELINE REPORT, QUARTER 7 PAGE 10 ***************************************************************************** Product 1-1 Product 1-2 ----------- ----------- -------- REGION 1 -------- Beginning Inventory 1,653 679 + Manufacturer Orders Received 7,600 4,000 = Available For Sale 9,253 4,679 - Sales -7,412 -3,865 = Ending Inventory 1,841 814
-------- REGION 2 -------- Beginning Inventory 2,615 1,252 + Manufacturer Orders Received 12,300 4,500 = Available For Sale 14,915 5,752 ...
REMINDER: This report is for the previous quarter, not the current quarter.
Service Center Statistics Report
A top-line "Service Center Operations Report" is part of your financial and operations reports.
See Chapter 13 for details of this report. This report does not provide a detailed breakdown of the
types of calls received by your service center, only the total volume of calls received.
You may wish to receive more detailed service center activity tracking data. A "Service Center
Statistics Report" provides a detailed breakdown of the calls in various categories that may have
useful diagnostic value (configuration, installation, introduction, miscellaneous, packaging, product
quality, service quality, unfilled orders, and warranty). Decision options and associated costs for
the "Service Center Statistics Report" are as follows:
Decision Option "0": Do not provide a "Service Center Statistics Report."
Decision Option "1": Provide a "Service Center Statistics Report" for the previous quarter with
associated costs of $5,000 per quarter plus a one-time initiation charge of $10,000 in the first
quarter in which this option is selected.
Decision Option "2": Provide a "Service Center Statistics Report" for the current quarter with
associated costs of $10,000 per quarter plus a one-time initiation charge of $15,000 in the first
quarter in which this option is selected.
The higher costs for current-quarter data are based on development and maintenance costs
associated with a more elaborate and time-sensitive internal IT system. There are no charges
associated with terminating the ordering of a "Service Center Statistics Report." To terminate
ordering the "Service Center Statistics Report," you would change your decision variable to 0
(zero). If you choose to order a "Service Center Statistics Report," it will be included among your
56 LINKS Marketing Strategy Simulation
financial and operations reports immediately after your "Service Center Operations Report."
Information Technology Decisions Form
"Debugging is twice as hard as writing the code in the first place.
Therefore, if you write the code as cleverly as possible, you are, by
definition, not smart enough to debug it." - Brian W. Kernighan
A blank "Information Technology Decisions" form may be found on the next page. Complete this
decision form during your team deliberations.
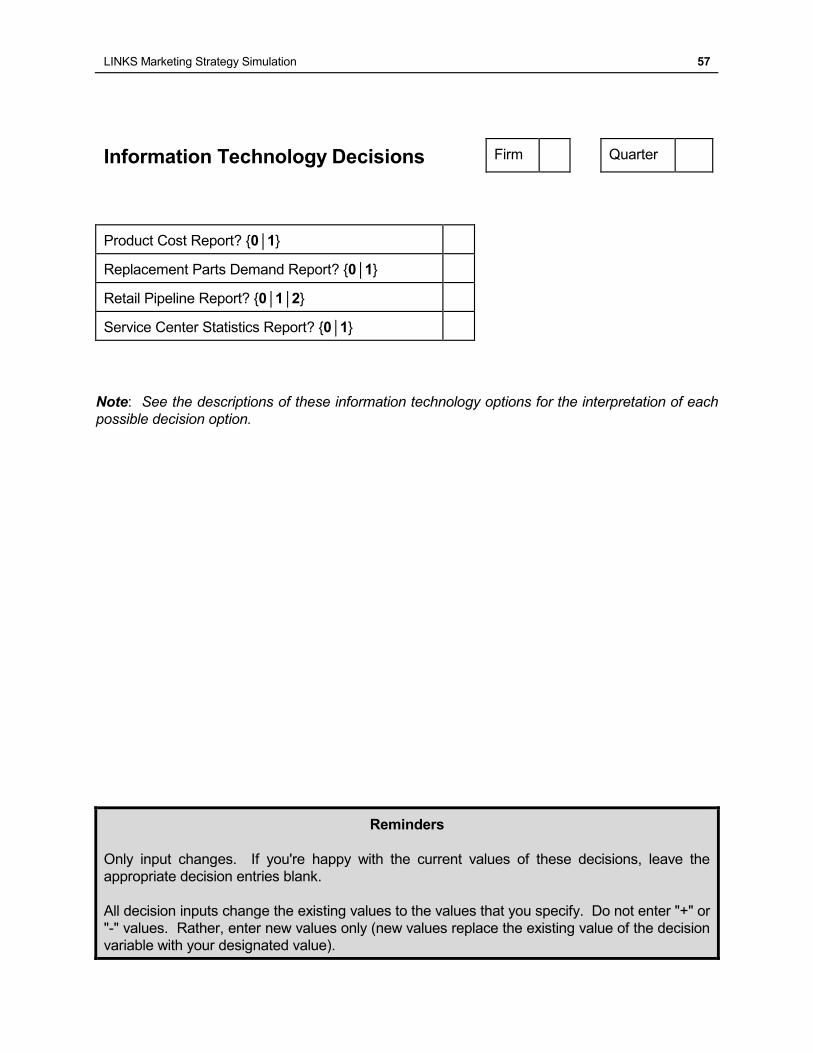
LINKS Marketing Strategy Simulation 57
Information Technology Decisions Firm Quarter
Product Cost Report? {0│1}
Replacement Parts Demand Report? {0│1}
Retail Pipeline Report? {0│1│2}
Service Center Statistics Report? {0│1}
Note: See the descriptions of these information technology options for the interpretation of each
possible decision option.
Reminders
Only input changes. If you're happy with the current values of these decisions, leave the
appropriate decision entries blank.
All decision inputs change the existing values to the values that you specify. Do not enter "+" or
"-" values. Rather, enter new values only (new values replace the existing value of the decision
variable with your designated value).
58 LINKS Marketing Strategy Simulation
Chapter 12: Other Decisions
This chapter details other decisions not described elsewhere in Chapters 3-11 of the LINKS
participant's manual. "Other decisions" include establishing a firm name and research ordering
decisions.
Firm Name
"A rose by any other name would smell as sweet." – William Shakespeare
Your firm may choose a firm name. Any firm name with up to 40 characters is acceptable. This
firm name is printed on the top of all financial, operating, and research reports. Firm names have
no cost or known demand-side implications, so you are free to choose (or change) your firm's
name as you wish.
Other Corporate Decisions
Chapter 14 describes the available research studies within LINKS. Research studies decisions
must be made every quarter, like all other LINKS decisions. Your research studies requests will
be executed and the associated results will be reported to you with your regular financial and
operating reports after each LINKS quarter.
Other Corporate Decisions Form
"Do or do not. There is no 'try'." – "Yoda" (The Empire Strikes Back)
A blank "Other Corporate Decisions" form may be found on the next page. Complete this
decision form during your team deliberations.
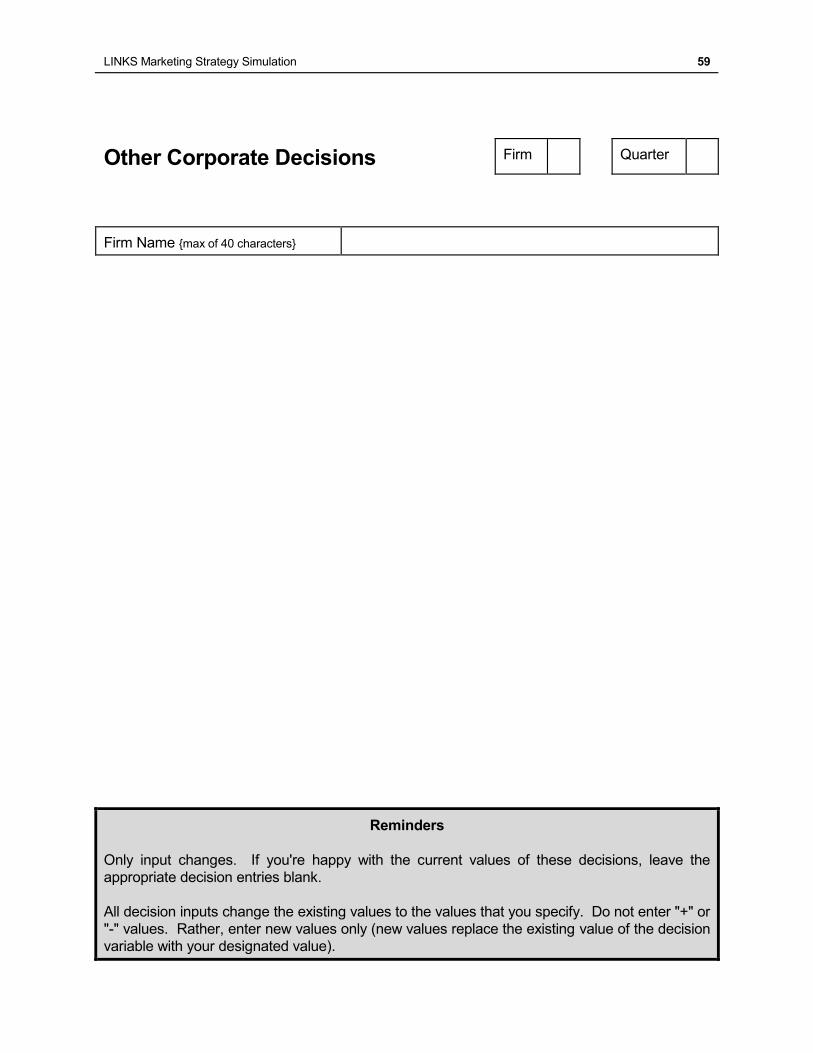
LINKS Marketing Strategy Simulation 59
Other Corporate Decisions Firm Quarter
Firm Name {max of 40 characters}
Reminders
Only input changes. If you're happy with the current values of these decisions, leave the
appropriate decision entries blank.
All decision inputs change the existing values to the values that you specify. Do not enter "+" or
"-" values. Rather, enter new values only (new values replace the existing value of the decision
variable with your designated value).
60 LINKS Marketing Strategy Simulation
Chapter 13: Financial and Operating Reports
The LINKS financial and operating reports are described in this chapter. These are the standard
reports that you receive after each quarter of the LINKS exercise. Recall, too, that several of the
information technology options described in Chapter 11 yield additional financial and operating
reports.
Profitability Drivers
"A company can outperform rivals only if it can establish a difference that it can
preserve. Competitive strategy is about being different, deliberately choosing a
different set of activities to deliver a unique value mix." – Michael Porter
The financial and operating reports described in this chapter are lengthy and detailed. To provide
an overall roadmap for thinking about the drivers of profitability, the three charts in Exhibits 8-11
decompose net income into its underlying components.
In Exhibit 8, the principal drivers of net income are revenues and costs. Taxes and non-operating
income play lesser roles. Exhibit 9 provides a breakdown of the drivers of volume, one of the two
key drivers of revenues. Exhibit 10 provides further details about the drivers of availability
perceptions. Exhibit 11 provides a roadmap to the drivers of variable costs. Collectively, these
exhibits provide a sense of the DNA of net income in LINKS.
Performance Evaluation Report "If you're riding ahead of the herd, take a look back every now
and then to make sure it's still there." – Cowboy philosophy
Please consult Chapter 15 for a detailed discussion of the "Performance Evaluation Report" that
forms the first page of your financial and operating reports.
Corporate P&L Statement
The "Corporate P&L Statement" aggregates all of the product-specific profit-and-loss statements
into an overall corporate profit-and-loss statement. A variety of line items appear on the
"Corporate P&L Statement" only, because it is not possible to unambiguously allocate those costs
to specific products in specific regions for specific channels.
Definitions of non-obvious line items on the "Corporate Current P&L Statement" follow:
Administrative overhead ("Administrative O/H") is $240,000/quarter, $360,000/quarter, and
$300,000/quarter per product in channels 1, 2, and 3, respectively, in all market regions.
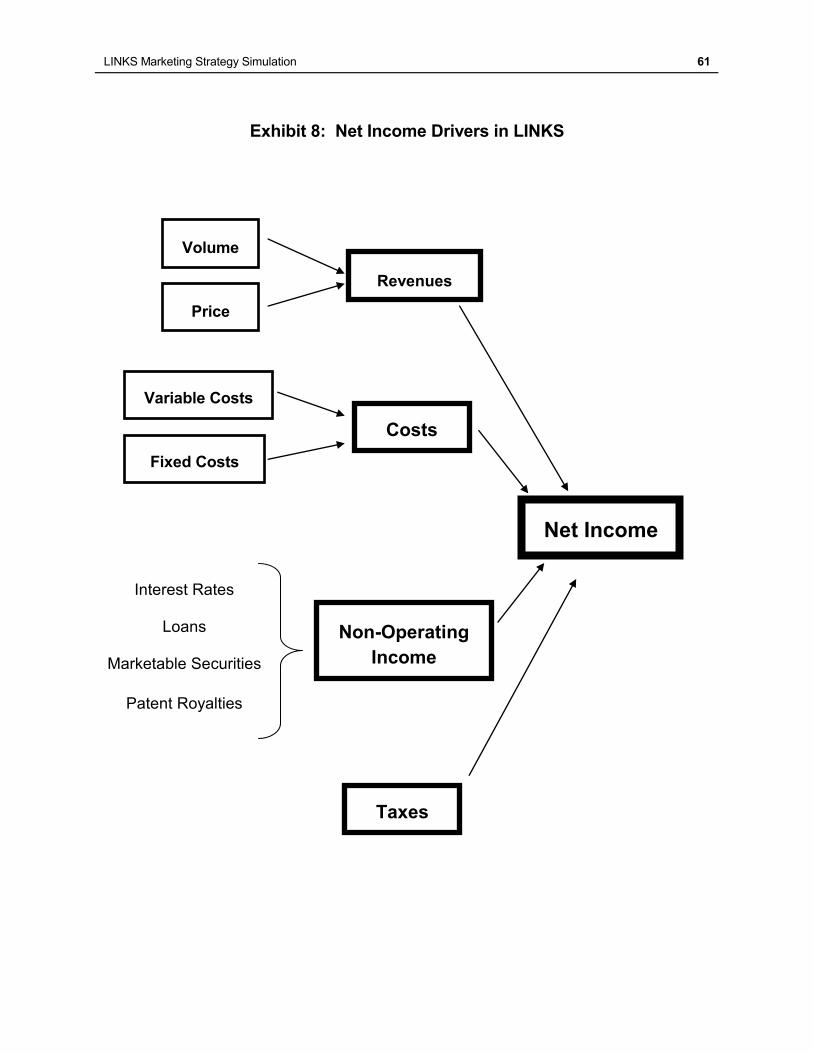
LINKS Marketing Strategy Simulation 61
Exhibit 8: Net Income Drivers in LINKS
Net Income
Revenues
Costs
Non-Operating
Income
Taxes
Volume
Price
Fixed Costs
Variable Costs
Interest Rates
Loans
Marketable Securities
Patent Royalties
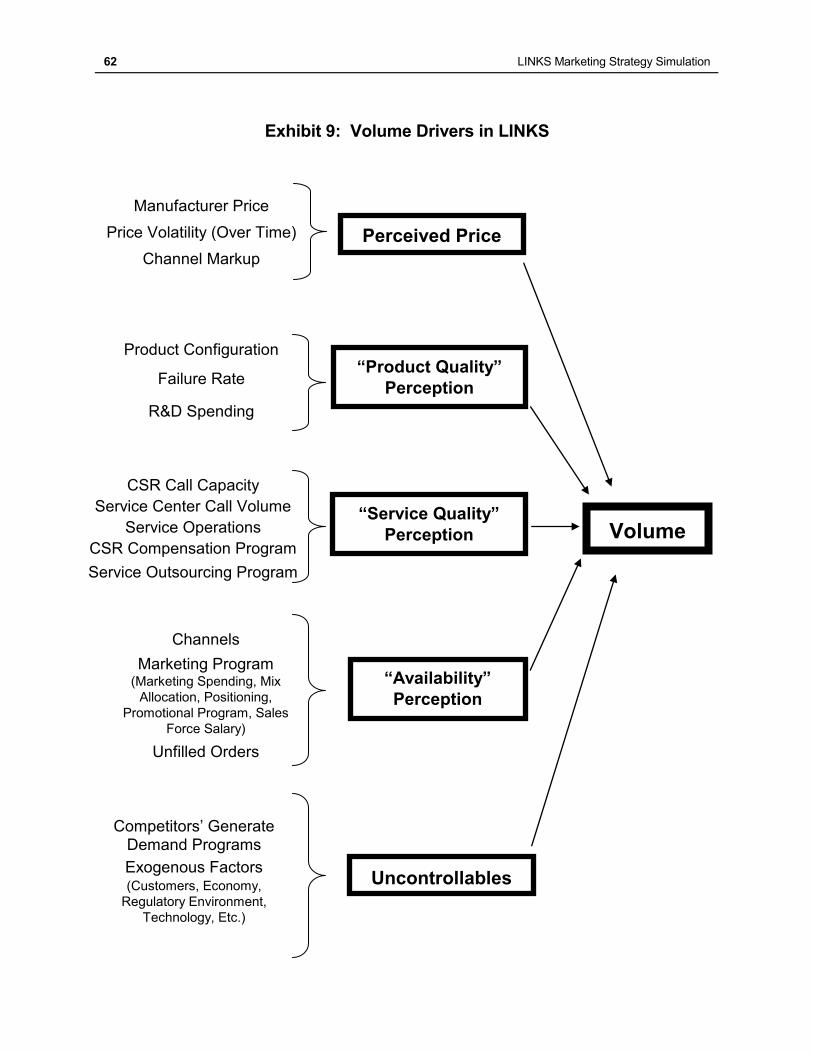
62 LINKS Marketing Strategy Simulation
Exhibit 9: Volume Drivers in LINKS
Competitors’ Generate
Demand Programs
Exogenous Factors (Customers, Economy,
Regulatory Environment,
Technology, Etc.)
Volume
Perceived Price
“Availability”
Perception
Uncontrollables
“Service Quality”
Perception
“Product Quality”
Perception
Product Configuration
Failure Rate
R&D Spending
Channels
Marketing Program (Marketing Spending, Mix
Allocation, Positioning,
Promotional Program, Sales
Force Salary)
Unfilled Orders
CSR Call Capacity
Service Center Call Volume
Service Operations
CSR Compensation Program
Service Outsourcing Program
Manufacturer Price
Price Volatility (Over Time)
Channel Markup
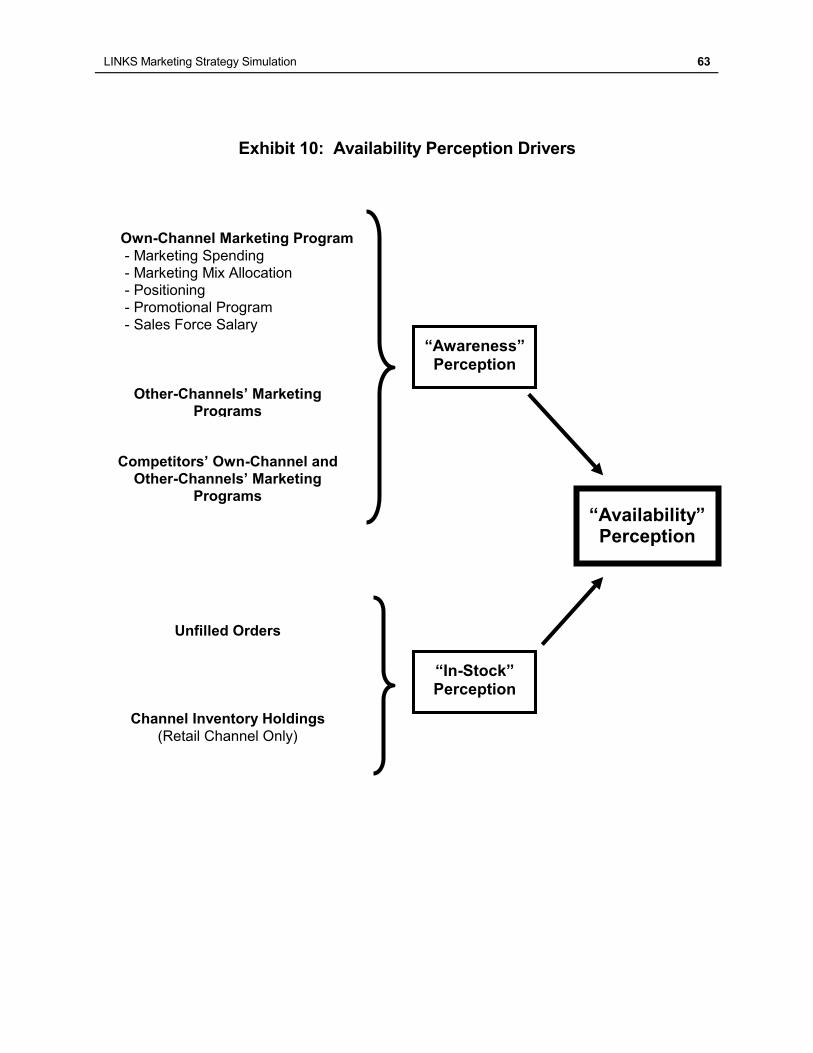
LINKS Marketing Strategy Simulation 63
Exhibit 10: Availability Perception Drivers
“Availability” Perception
“Awareness” Perception
“In-Stock” Perception
Own-Channel Marketing Program
- Marketing Spending
- Marketing Mix Allocation
- Positioning
- Promotional Program
- Sales Force Salary
Other-Channels’ Marketing
Programs
Competitors’ Own-Channel and
Other-Channels’ Marketing
Programs
Unfilled Orders
Channel Inventory Holdings
(Retail Channel Only)
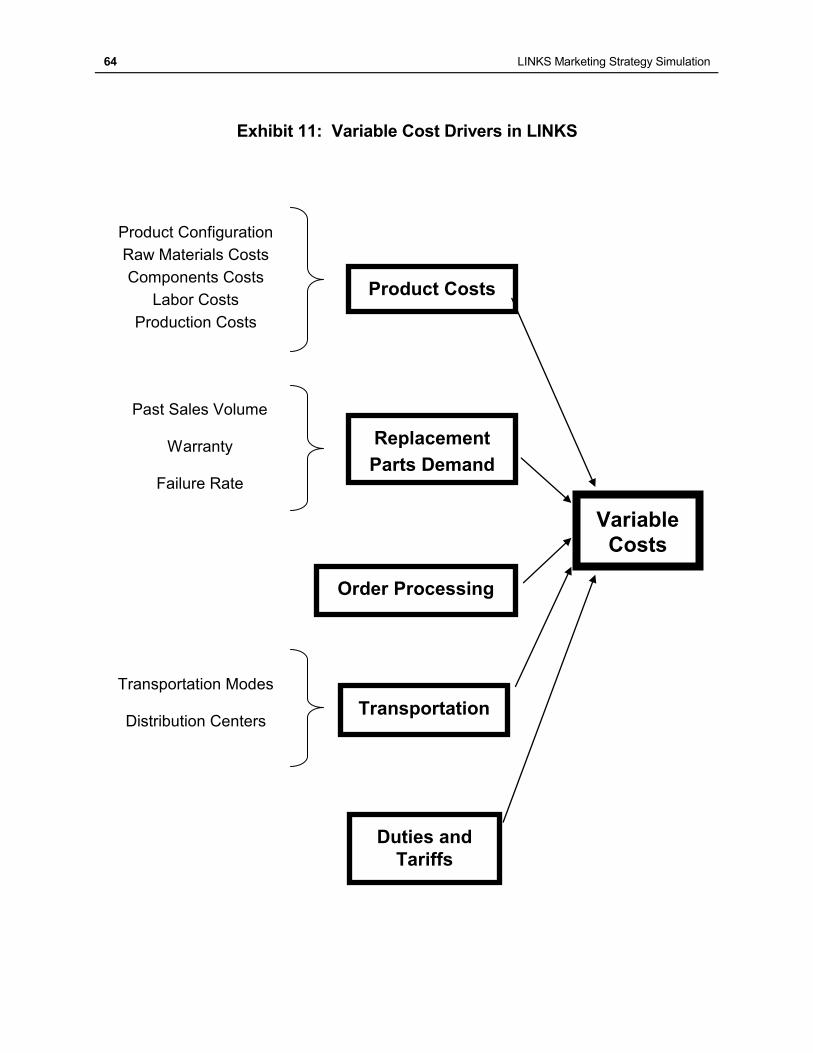
64 LINKS Marketing Strategy Simulation
Exhibit 11: Variable Cost Drivers in LINKS
Product Configuration
Raw Materials Costs
Components Costs
Labor Costs
Production Costs
Transportation Modes
Distribution Centers
Variable
Costs
Transportation
Duties and
Tariffs
Replacement
Parts Demand
Product Costs
Past Sales Volume
Warranty
Failure Rate
Order Processing
LINKS Marketing Strategy Simulation 65
"Consulting Fees" may be positive or negative. "Consulting Fees" are adjustments to income
or expenses. Conversations with your coach/instructor are normally without charge, so don't
worry about "Consulting Fees" associated with these consultations. In LINKS, the "Consulting
Fees" line item represents a convenient mechanism for making adjustments to income or
expenses. For example, a research billing problem can be corrected via an appropriate
negative "Consulting Fee."
Corporate overhead ("Corporate O/H") is $750,000 per product per quarter. This per-product
charge is incurred if a product is actively distributed in one or more market regions.
"Disposal Sales" reflect costs associated with finished goods inventory disposal sales
associated with reconfigurations. Note that disposal sales due to reconfigurations do not
generate sales revenues. Rather, disposal sales are asset-side transactions on your firm's
balance sheet, with finished goods inventory being exchanged for cash. The loss associated
with such disposal sales is recorded as an expense on your "Corporate P&L Statement" under
"Disposal Sales."
"Distribution FC" reflects the fixed costs associated with operating distribution centers.
"Duties & Tariffs" are a percentage of the average selling price for finished goods (across all
channels) that are imported into any market region. If a firm is based in a market region (i.e.,
if a firm has a manufacturing plant in a region), there are no duties and tariffs payable. The
current duties and tariffs rates are 0% for market region 1, 8% for market region 2, and 12%
for market region 3. By definition, all finished goods sold in market region 1 are "local," since
your firm's manufacturing plant is located in market region 1. "Duties & Tariffs" are levied on
sales in a market region (orders from customers).
"Emergency Production" reflects all emergency production costs, including standby
emergency production charges plus any actual emergency-related excess costs (above
regular production) associated with actual realized emergency production.
“Forecast Inaccuracy” records the costs associated with forecasting errors.
"Information Technology" records all IT charges. Your IT charges include a $1,000/page
charge for all financial and operating reports. This charge is per-firm and is not related to the
number of members of your firm's management team. Each quarter's charge is based on the
previous quarter's actual page counts (e.g., the quarter-32 charge is based on the quarter-31
page count).
"Introductions" reflects costs when products are introduced into market regions or channels.
Inventory charges arise for finished goods. These costs are recorded under the heading
"Inventory Charges" on the "Corporate P&L Statement." This inventory charge is equal to 3%
per quarter for owned distribution centers (such as your distribution center in market region 1,
adjacent to your firm's manufacturing plant) based on the value of inventory as recorded on
your firm's balance sheet. Inventory charges are levied on the average of beginning-of-
quarter and end-of-quarter inventory values, and include all costs related to storage, handling,
waste, and insurance.
"Marketing" equals total marketing spending.
"Non-Operating Income" derives either from interest earned on "Marketable Securities" (from
the previous quarter's "Balance Sheet") or from interest paid on "Loans" (from the previous
quarter's "Balance Sheet").
"Operating Income" equals "Gross Margin" minus "Total Fixed Costs."
"Order Processing" records the channel-specific order processing cost. In all regions, these
order processing costs are $4/unit, $24/unit, and $12/unit in channels 1 ("Retail"), 2 ("Direct"),
and 3 ("Major Accounts"), respectively.
"Patent Royalties" include patent royalties that your firm pays to other firms, as well as patent
royalties received from other firms.
"Plant Capacity FC" represents the costs associated with production "shifts" in your
66 LINKS Marketing Strategy Simulation
manufacturing plant. These costs cover all depreciation and maintenance associated with
your plant capacity. These costs are allocated equally among your products.
"Production FC" includes the fixed costs associated with production orders. Fixed costs for
production are included in the "Production FC" line item.
"Reconfiguration" equals the total costs associated with product reconfigurations.
"Research Studies" reflects the total costs associated with last quarter's research study
requests. Note that the current quarter's research studies are executed after the current
quarter's financial reports are prepared. Thus, research study billings are lagged a quarter.
"Service Salaries" is the total salary cost associated with service centers.
"Service O/H" is the service center overhead cost levied on service center compensation.
"Service Hire&Fire" costs are the service center hiring and firing costs.
"Taxes" represents the corporate taxes payable in the market region in which your firm has its
manufacturing plant. Your manufacturing plant is located in market region 1, which has a
corporate tax rate of 50%.
"Total Fixed Costs" is the sum of all fixed costs. Note that "Total Fixed Costs" does not sum
correctly down and across since some fixed costs are not allocated to specific products.
"Unfilled Handling" costs are the unfilled orders handling costs.
Historical Corporate P&L Statement
"The hardest thing to learn in life is which bridge to cross
and which to burn." – David L. Russell, American educator
The "Historical Corporate P&L Statement" reports the previous and current quarter's corporate-
level profit-and-loss data. In addition, all elements in the "Historical Corporate P&L Statement"
are expressed in percentage-of-revenue terms.
Product P&L Statement
Each product has a current profit-and-loss statement each quarter. The product "P&L Statement"
includes the relevant data for all channels.
Balance Sheet
Your balance sheet records the usual assets and liabilities associated with your firm at the end of
each quarter. Among other things, current levels of procurement and finished goods inventories
are reported on the balance sheet.
On the "Balance Sheet":
"Cash" represents your cash balance. Cash in excess of 10% of revenues is automatically
invested in short-term "Marketable Securities" which earn 1.5% per quarter in "Non-Operating
Income" on the "Corporate P&L Statement" in the following quarter. If cash falls below 5% of
revenues, a loan is automatically arranged to increase cash to 5% of revenues. You pay
interest of 3% per quarter on "Loans" and this interest payment is recorded as "Non-Operating
Income" (a negative value of "Non-Operating Income") in the following quarter's "Corporate
P&L Statement."
LINKS Marketing Strategy Simulation 67
"Corporate Capitalization" is the Ldollar-value of the original capital invested by your
shareholders to start your firm.
"Dividends" are cash payments to shareholders. In any quarter in which "Net Income" is
positive, 30% of the "Net Income" is allocated to "Dividends."
"Plant Investment" represents the Ldollar-value of your firm's investment in a manufacturing
plant to produce set-top box products. The normal per-unit production charges that you pay
for producing set-top boxes includes a component to cover the maintenance and depreciation
of your plant. Thus, your "Plant Investment" value will also be the same through time.
Cash Flow Analysis Report
Sources and uses of cash are reported in your
firm's "Cash Flow Analysis Report." The most
important source of cash within any on-going
business is revenues derived from sales, but
you have lots of costs to pay to earn those
revenues. Recent experience with "dot.com"
businesses notwithstanding, margin
management (revenues less costs) is still the
fundamental management challenge for all
for-profit businesses.
Cash sources include profits from operations
and reductions in inventory holdings. Uses of
cash include funding operating losses,
increases in inventory holdings, and payment
of dividends. Obviously, you require cash to
run your set-top box business. You can't run
out of cash within LINKS. As necessary,
loans are automatically issued to bring your
cash requirement up to minimum acceptable.
Of course, you do have to pay interest on loans. Each quarter in which your firm is profitable,
corporate policy is to allocate 30% of net income to dividends.
Finished Goods Inventory Report
The details of your finished goods inventories are reported on the "Finished Goods Inventory
Report." Recall that your manufacturing plant and the distribution center in market region 1 hold
common finished goods inventory.
Forecasting Accuracy Report
The "Forecasting Accuracy Report" provides details of the forecasting accuracy associated with
your short-term (next-quarter) sales volume forecasts.
In addition, the sales history for all of your firm's products (product-unit sales by product, channel,
FAQ
"Are costs expensed at the beginning of the
quarter or the end of the quarter? The answer
influences our spending decisions, since we
obviously don't want to spend money before we
have it." Assume that all revenues and costs
happen uniformly throughout the quarter. That
is, with a 90-day quarter, about 1/90 of the
quarter's revenues and costs are attributable to
each day's operations. Thus, you do have
revenue coming in regularly throughout the
quarter to pay for your various within-quarter
operating costs. There's no need to worry about
within-quarter cash flow issues with regard to
covering your operating costs and within-quarter
spending. Also, note that you do have access to
loans, as necessary, to cover shortages in cash.
68 LINKS Marketing Strategy Simulation
and region) for the last six quarters is displayed at the end of this report.
Forecasting accuracy is equal to 100*(1-(abs(Forecast-Actual)/Actual))
expressed in percentage terms, where "abs" is the absolute value
function. Thus, a forecast value of 11,000 and an actual value of 8,000
results in a forecast accuracy of 100*(1-abs(11,000-8,000)/8,000) =
100*(1-(3,000/8,000)) = 100*(1-0.375) = 62.5%. The minimum possible
value of forecasting accuracy is 0.0%. For example, with an Actual sales
volume of 8,000, a Forecast above 16,000 results in a forecasting
accuracy score of 0.0%.
Service Center Operations Report
The "Service Center Operations Report" details staffing levels at your regional service centers
(including resignations) as well as documenting service demand and related statistics.
Transportation Cost Report
The "Transportation Cost Report" provides a break-down of the transportation cost elements
which cumulate to yield total transportation costs for your firm.
Other Decision Variables Report
The "Product P&L Statement" provides an easy-to-read listing of the current values of the product
development, distribution, service, generate demand, and forecasting decision variables.
However, manufacturing and information technology decision variables are either sprinkled
around in the financial and operating reports or not directly reported. To provide an easy-to-
access listing of the current values of these decision variables, an "Other Decision Variables
Report" is provided as part of your financial and operating reports.
Set-Top Box Industry Bulletin
The "Set-Top Box Industry Bulletin" provides current-quarter industry-related information.
Information reported in the "Bulletin" includes things that an actual manager in the set-top box
industry could easily observe without additional cost or with nominal effort during the course of
events that comprise a normal quarter's work. To drill down below these headlines, you will need
appropriate research studies.
LINKS Marketing Strategy Simulation 69
Sample Reports
"The meaning of life is to do the best you can with what you've got." – Anonymous
The following pages provide samples of the standard LINKS financial
and operating reports. In addition to these reports, you'll receive the
results of any research studies that you order on additional pages after
the last page of your financial and operating reports.
These samples are provided to familiarize you with the style and format of the reports that are
provided to your firm after each LINKS round. The data reported in these sample reports are only
illustrative of reports formatting. These data aren’t specific to your particular LINKS industry.
Please do not interpret these samples as suggested guidelines or benchmarks for good decisions
and performance within LINKS.
If you’d like some further background on interpreting LINKS financial statements, please access
Tutorial #1 (“P&L Statements”) on the LINKS website and spend 45 minutes or so working
through it prior to (or close to) the beginning of your LINKS event.
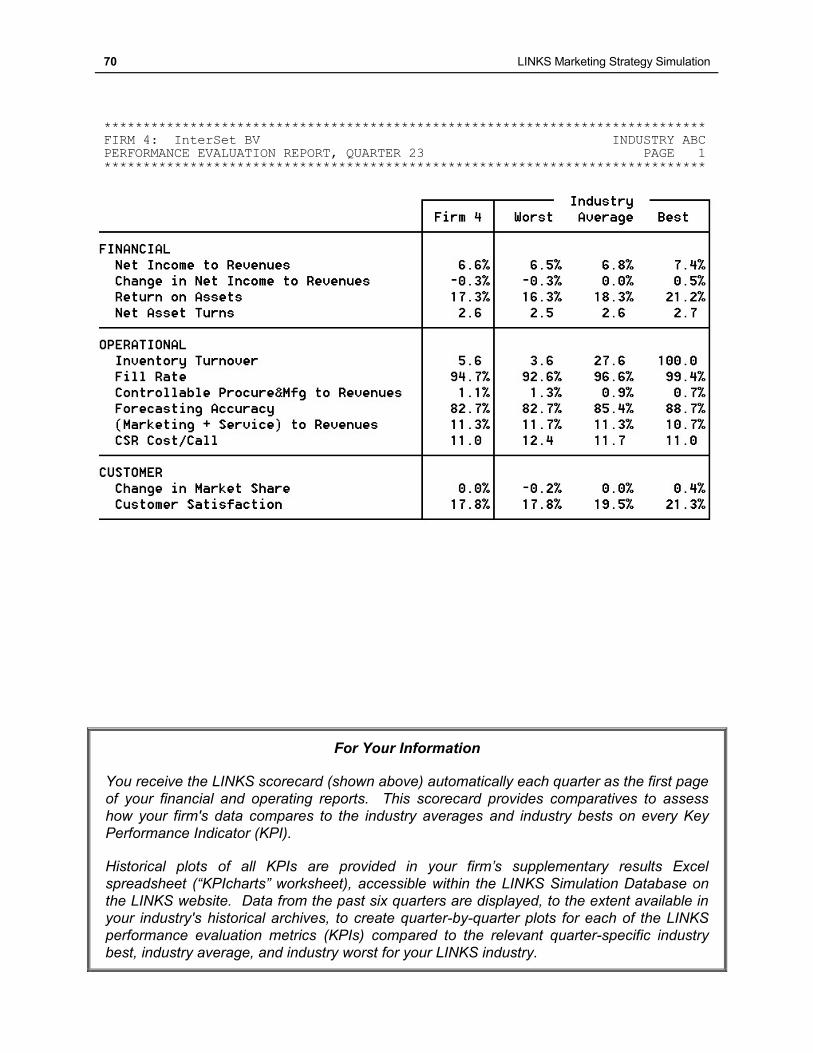
70 LINKS Marketing Strategy Simulation
***************************************************************************** FIRM 4: InterSet BV INDUSTRY ABC PERFORMANCE EVALUATION REPORT, QUARTER 23 PAGE 1 *****************************************************************************
For Your Information
You receive the LINKS scorecard (shown above) automatically each quarter as the first page
of your financial and operating reports. This scorecard provides comparatives to assess
how your firm's data compares to the industry averages and industry bests on every Key
Performance Indicator (KPI).
Historical plots of all KPIs are provided in your firm’s supplementary results Excel
spreadsheet (“KPIcharts” worksheet), accessible within the LINKS Simulation Database on
the LINKS website. Data from the past six quarters are displayed, to the extent available in
your industry's historical archives, to create quarter-by-quarter plots for each of the LINKS
performance evaluation metrics (KPIs) compared to the relevant quarter-specific industry
best, industry average, and industry worst for your LINKS industry.
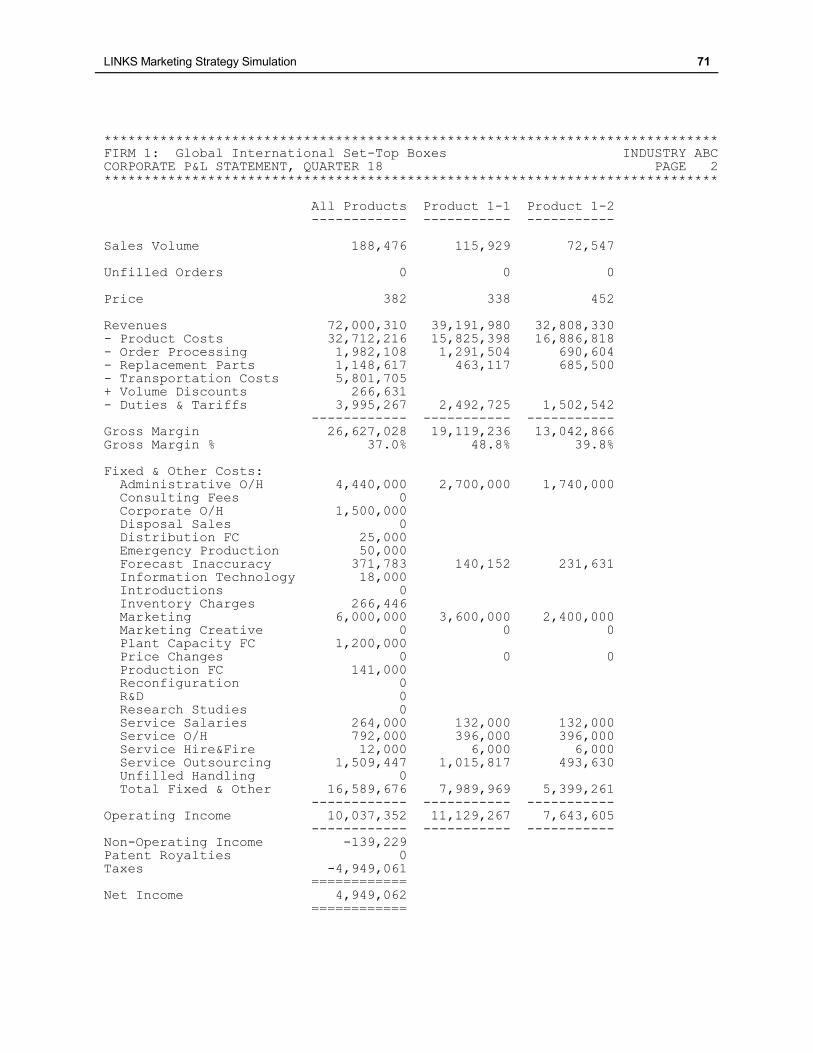
LINKS Marketing Strategy Simulation 71
***************************************************************************** FIRM 1: Global International Set-Top Boxes INDUSTRY ABC CORPORATE P&L STATEMENT, QUARTER 18 PAGE 2 ***************************************************************************** All Products Product 1-1 Product 1-2 ------------ ----------- ----------- Sales Volume 188,476 115,929 72,547 Unfilled Orders 0 0 0 Price 382 338 452 Revenues 72,000,310 39,191,980 32,808,330 - Product Costs 32,712,216 15,825,398 16,886,818
- Order Processing 1,982,108 1,291,504 690,604 - Replacement Parts 1,148,617 463,117 685,500 - Transportation Costs 5,801,705 + Volume Discounts 266,631 - Duties & Tariffs 3,995,267 2,492,725 1,502,542 ------------ ----------- ----------- Gross Margin 26,627,028 19,119,236 13,042,866 Gross Margin % 37.0% 48.8% 39.8% Fixed & Other Costs: Administrative O/H 4,440,000 2,700,000 1,740,000 Consulting Fees 0 Corporate O/H 1,500,000 Disposal Sales 0 Distribution FC 25,000 Emergency Production 50,000 Forecast Inaccuracy 371,783 140,152 231,631
Information Technology 18,000 Introductions 0 Inventory Charges 266,446 Marketing 6,000,000 3,600,000 2,400,000 Marketing Creative 0 0 0 Plant Capacity FC 1,200,000 Price Changes 0 0 0 Production FC 141,000 Reconfiguration 0 R&D 0 Research Studies 0 Service Salaries 264,000 132,000 132,000 Service O/H 792,000 396,000 396,000 Service Hire&Fire 12,000 6,000 6,000 Service Outsourcing 1,509,447 1,015,817 493,630 Unfilled Handling 0 Total Fixed & Other 16,589,676 7,989,969 5,399,261
------------ ----------- ----------- Operating Income 10,037,352 11,129,267 7,643,605 ------------ ----------- ----------- Non-Operating Income -139,229 Patent Royalties 0 Taxes -4,949,061 ============ Net Income 4,949,062 ============
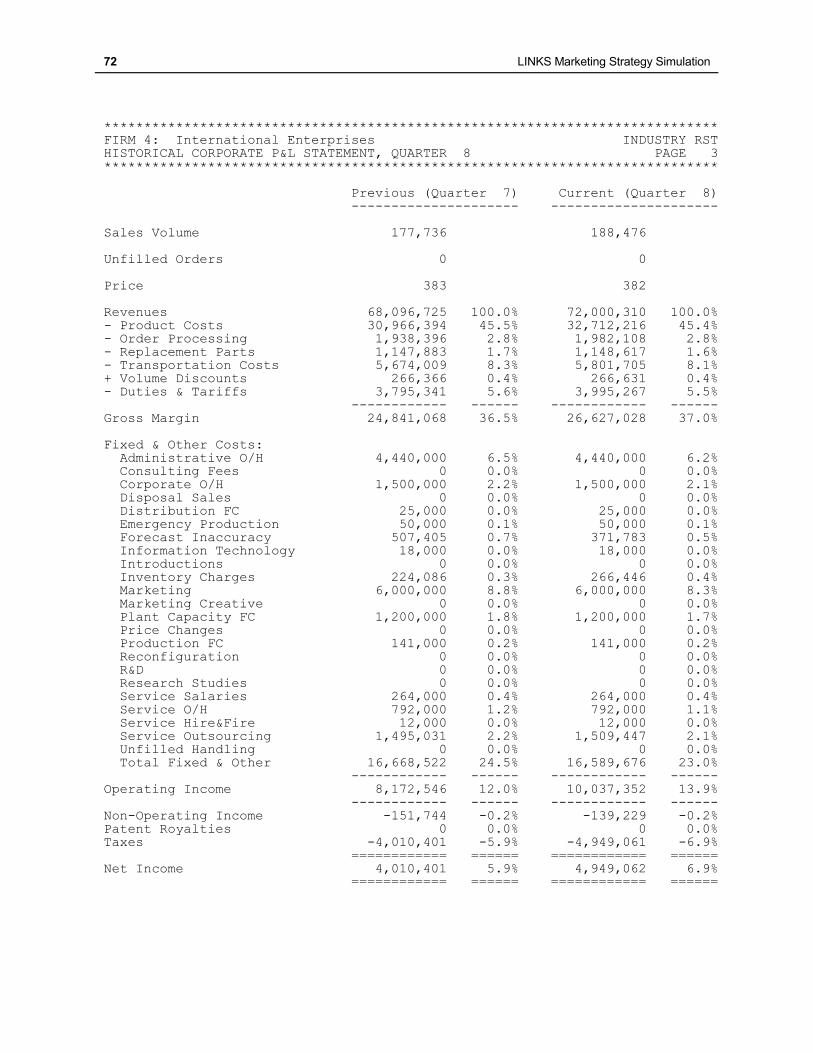
72 LINKS Marketing Strategy Simulation
***************************************************************************** FIRM 4: International Enterprises INDUSTRY RST HISTORICAL CORPORATE P&L STATEMENT, QUARTER 8 PAGE 3 ***************************************************************************** Previous (Quarter 7) Current (Quarter 8) --------------------- --------------------- Sales Volume 177,736 188,476 Unfilled Orders 0 0 Price 383 382 Revenues 68,096,725 100.0% 72,000,310 100.0% - Product Costs 30,966,394 45.5% 32,712,216 45.4% - Order Processing 1,938,396 2.8% 1,982,108 2.8%
- Replacement Parts 1,147,883 1.7% 1,148,617 1.6% - Transportation Costs 5,674,009 8.3% 5,801,705 8.1% + Volume Discounts 266,366 0.4% 266,631 0.4% - Duties & Tariffs 3,795,341 5.6% 3,995,267 5.5% ------------ ------ ------------ ------ Gross Margin 24,841,068 36.5% 26,627,028 37.0% Fixed & Other Costs: Administrative O/H 4,440,000 6.5% 4,440,000 6.2% Consulting Fees 0 0.0% 0 0.0% Corporate O/H 1,500,000 2.2% 1,500,000 2.1% Disposal Sales 0 0.0% 0 0.0% Distribution FC 25,000 0.0% 25,000 0.0% Emergency Production 50,000 0.1% 50,000 0.1% Forecast Inaccuracy 507,405 0.7% 371,783 0.5% Information Technology 18,000 0.0% 18,000 0.0% Introductions 0 0.0% 0 0.0%
Inventory Charges 224,086 0.3% 266,446 0.4% Marketing 6,000,000 8.8% 6,000,000 8.3% Marketing Creative 0 0.0% 0 0.0% Plant Capacity FC 1,200,000 1.8% 1,200,000 1.7% Price Changes 0 0.0% 0 0.0% Production FC 141,000 0.2% 141,000 0.2% Reconfiguration 0 0.0% 0 0.0% R&D 0 0.0% 0 0.0% Research Studies 0 0.0% 0 0.0% Service Salaries 264,000 0.4% 264,000 0.4% Service O/H 792,000 1.2% 792,000 1.1% Service Hire&Fire 12,000 0.0% 12,000 0.0% Service Outsourcing 1,495,031 2.2% 1,509,447 2.1% Unfilled Handling 0 0.0% 0 0.0% Total Fixed & Other 16,668,522 24.5% 16,589,676 23.0% ------------ ------ ------------ ------ Operating Income 8,172,546 12.0% 10,037,352 13.9%
------------ ------ ------------ ------ Non-Operating Income -151,744 -0.2% -139,229 -0.2% Patent Royalties 0 0.0% 0 0.0% Taxes -4,010,401 -5.9% -4,949,061 -6.9% ============ ====== ============ ====== Net Income 4,010,401 5.9% 4,949,062 6.9% ============ ====== ============ ======
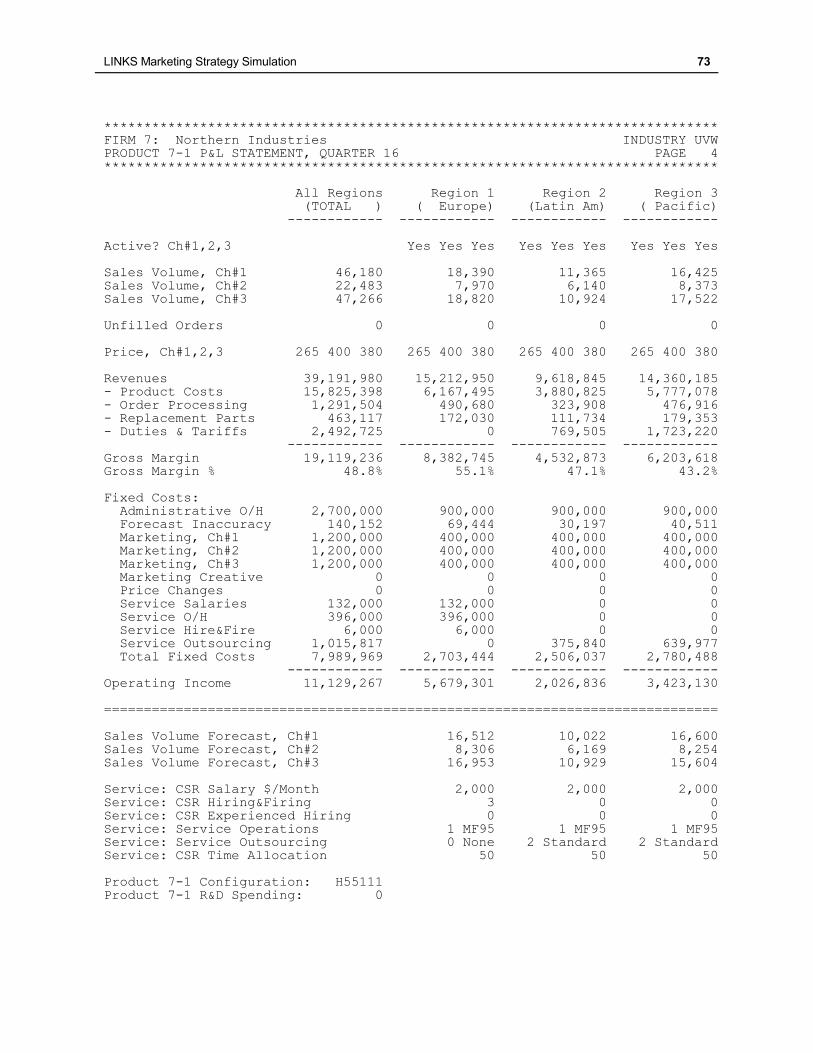
LINKS Marketing Strategy Simulation 73
***************************************************************************** FIRM 7: Northern Industries INDUSTRY UVW PRODUCT 7-1 P&L STATEMENT, QUARTER 16 PAGE 4 ***************************************************************************** All Regions Region 1 Region 2 Region 3 (TOTAL ) ( Europe) (Latin Am) ( Pacific) ------------ ------------ ------------ ------------ Active? Ch#1,2,3 Yes Yes Yes Yes Yes Yes Yes Yes Yes Sales Volume, Ch#1 46,180 18,390 11,365 16,425 Sales Volume, Ch#2 22,483 7,970 6,140 8,373 Sales Volume, Ch#3 47,266 18,820 10,924 17,522 Unfilled Orders 0 0 0 0
Price, Ch#1,2,3 265 400 380 265 400 380 265 400 380 265 400 380 Revenues 39,191,980 15,212,950 9,618,845 14,360,185 - Product Costs 15,825,398 6,167,495 3,880,825 5,777,078 - Order Processing 1,291,504 490,680 323,908 476,916 - Replacement Parts 463,117 172,030 111,734 179,353 - Duties & Tariffs 2,492,725 0 769,505 1,723,220 ------------ ------------ ------------ ------------ Gross Margin 19,119,236 8,382,745 4,532,873 6,203,618 Gross Margin % 48.8% 55.1% 47.1% 43.2% Fixed Costs: Administrative O/H 2,700,000 900,000 900,000 900,000 Forecast Inaccuracy 140,152 69,444 30,197 40,511 Marketing, Ch#1 1,200,000 400,000 400,000 400,000 Marketing, Ch#2 1,200,000 400,000 400,000 400,000 Marketing, Ch#3 1,200,000 400,000 400,000 400,000
Marketing Creative 0 0 0 0 Price Changes 0 0 0 0 Service Salaries 132,000 132,000 0 0 Service O/H 396,000 396,000 0 0 Service Hire&Fire 6,000 6,000 0 0 Service Outsourcing 1,015,817 0 375,840 639,977 Total Fixed Costs 7,989,969 2,703,444 2,506,037 2,780,488 ------------ ------------ ------------ ------------ Operating Income 11,129,267 5,679,301 2,026,836 3,423,130 ============================================================================= Sales Volume Forecast, Ch#1 16,512 10,022 16,600 Sales Volume Forecast, Ch#2 8,306 6,169 8,254 Sales Volume Forecast, Ch#3 16,953 10,929 15,604 Service: CSR Salary $/Month 2,000 2,000 2,000
Service: CSR Hiring&Firing 3 0 0 Service: CSR Experienced Hiring 0 0 0 Service: Service Operations 1 MF95 1 MF95 1 MF95 Service: Service Outsourcing 0 None 2 Standard 2 Standard Service: CSR Time Allocation 50 50 50 Product 7-1 Configuration: H55111 Product 7-1 R&D Spending: 0
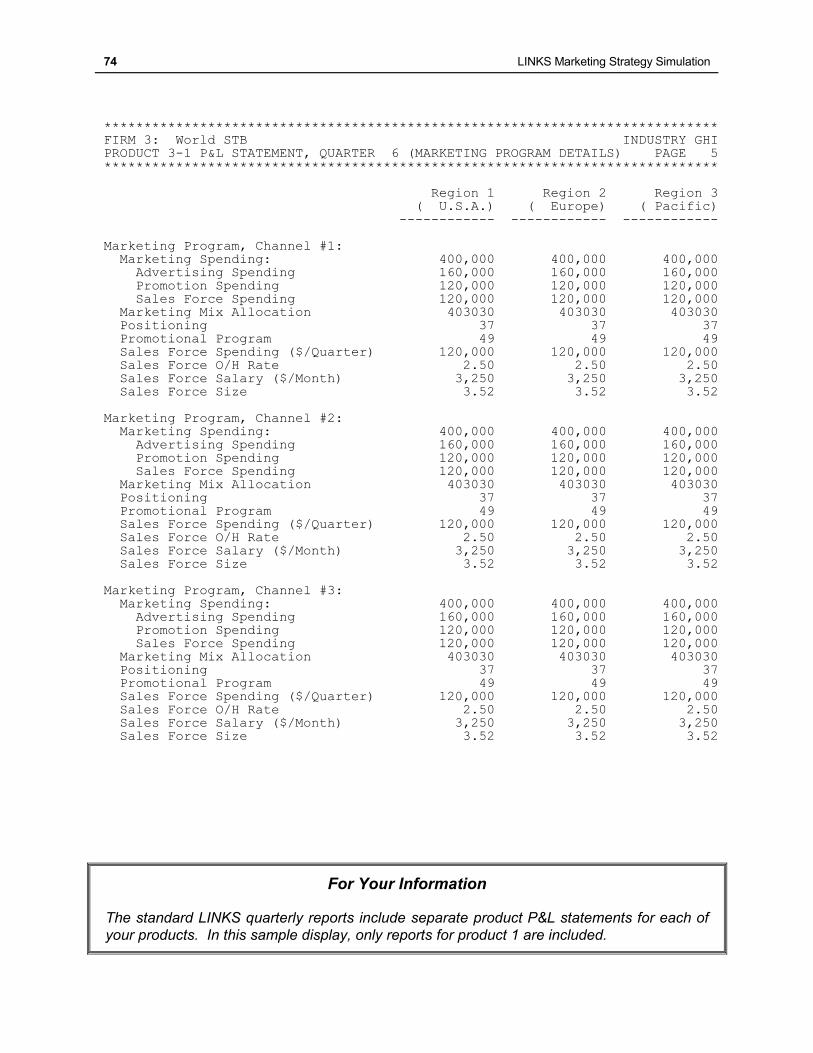
74 LINKS Marketing Strategy Simulation
***************************************************************************** FIRM 3: World STB INDUSTRY GHI PRODUCT 3-1 P&L STATEMENT, QUARTER 6 (MARKETING PROGRAM DETAILS) PAGE 5 ***************************************************************************** Region 1 Region 2 Region 3 ( U.S.A.) ( Europe) ( Pacific) ------------ ------------ ------------ Marketing Program, Channel #1: Marketing Spending: 400,000 400,000 400,000 Advertising Spending 160,000 160,000 160,000 Promotion Spending 120,000 120,000 120,000 Sales Force Spending 120,000 120,000 120,000 Marketing Mix Allocation 403030 403030 403030 Positioning 37 37 37 Promotional Program 49 49 49
Sales Force Spending ($/Quarter) 120,000 120,000 120,000 Sales Force O/H Rate 2.50 2.50 2.50 Sales Force Salary ($/Month) 3,250 3,250 3,250 Sales Force Size 3.52 3.52 3.52 Marketing Program, Channel #2: Marketing Spending: 400,000 400,000 400,000 Advertising Spending 160,000 160,000 160,000 Promotion Spending 120,000 120,000 120,000 Sales Force Spending 120,000 120,000 120,000 Marketing Mix Allocation 403030 403030 403030 Positioning 37 37 37 Promotional Program 49 49 49 Sales Force Spending ($/Quarter) 120,000 120,000 120,000 Sales Force O/H Rate 2.50 2.50 2.50 Sales Force Salary ($/Month) 3,250 3,250 3,250 Sales Force Size 3.52 3.52 3.52
Marketing Program, Channel #3: Marketing Spending: 400,000 400,000 400,000 Advertising Spending 160,000 160,000 160,000 Promotion Spending 120,000 120,000 120,000 Sales Force Spending 120,000 120,000 120,000 Marketing Mix Allocation 403030 403030 403030 Positioning 37 37 37 Promotional Program 49 49 49 Sales Force Spending ($/Quarter) 120,000 120,000 120,000 Sales Force O/H Rate 2.50 2.50 2.50 Sales Force Salary ($/Month) 3,250 3,250 3,250 Sales Force Size 3.52 3.52 3.52
For Your Information
The standard LINKS quarterly reports include separate product P&L statements for each of
your products. In this sample display, only reports for product 1 are included.
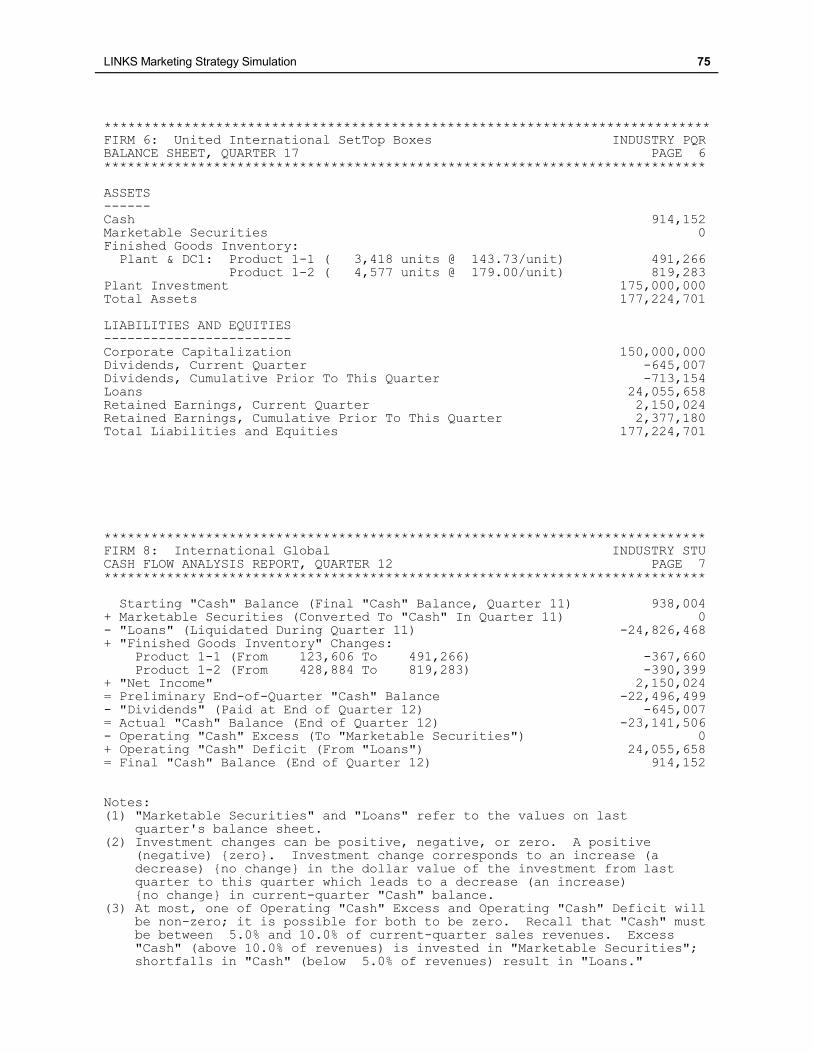
LINKS Marketing Strategy Simulation 75
**************************************************************************** FIRM 6: United International SetTop Boxes INDUSTRY PQR BALANCE SHEET, QUARTER 17 PAGE 6 ***************************************************************************** ASSETS ------ Cash 914,152 Marketable Securities 0 Finished Goods Inventory: Plant & DC1: Product 1-1 ( 3,418 units @ 143.73/unit) 491,266 Product 1-2 ( 4,577 units @ 179.00/unit) 819,283 Plant Investment 175,000,000 Total Assets 177,224,701 LIABILITIES AND EQUITIES ------------------------
Corporate Capitalization 150,000,000 Dividends, Current Quarter -645,007 Dividends, Cumulative Prior To This Quarter -713,154 Loans 24,055,658 Retained Earnings, Current Quarter 2,150,024 Retained Earnings, Cumulative Prior To This Quarter 2,377,180 Total Liabilities and Equities 177,224,701 ***************************************************************************** FIRM 8: International Global INDUSTRY STU CASH FLOW ANALYSIS REPORT, QUARTER 12 PAGE 7
***************************************************************************** Starting "Cash" Balance (Final "Cash" Balance, Quarter 11) 938,004 + Marketable Securities (Converted To "Cash" In Quarter 11) 0 - "Loans" (Liquidated During Quarter 11) -24,826,468 + "Finished Goods Inventory" Changes: Product 1-1 (From 123,606 To 491,266) -367,660 Product 1-2 (From 428,884 To 819,283) -390,399 + "Net Income" 2,150,024 = Preliminary End-of-Quarter "Cash" Balance -22,496,499 - "Dividends" (Paid at End of Quarter 12) -645,007 = Actual "Cash" Balance (End of Quarter 12) -23,141,506 - Operating "Cash" Excess (To "Marketable Securities") 0 + Operating "Cash" Deficit (From "Loans") 24,055,658 = Final "Cash" Balance (End of Quarter 12) 914,152
Notes: (1) "Marketable Securities" and "Loans" refer to the values on last quarter's balance sheet. (2) Investment changes can be positive, negative, or zero. A positive (negative) {zero}. Investment change corresponds to an increase (a decrease) {no change} in the dollar value of the investment from last quarter to this quarter which leads to a decrease (an increase) {no change} in current-quarter "Cash" balance. (3) At most, one of Operating "Cash" Excess and Operating "Cash" Deficit will be non-zero; it is possible for both to be zero. Recall that "Cash" must be between 5.0% and 10.0% of current-quarter sales revenues. Excess "Cash" (above 10.0% of revenues) is invested in "Marketable Securities"; shortfalls in "Cash" (below 5.0% of revenues) result in "Loans."
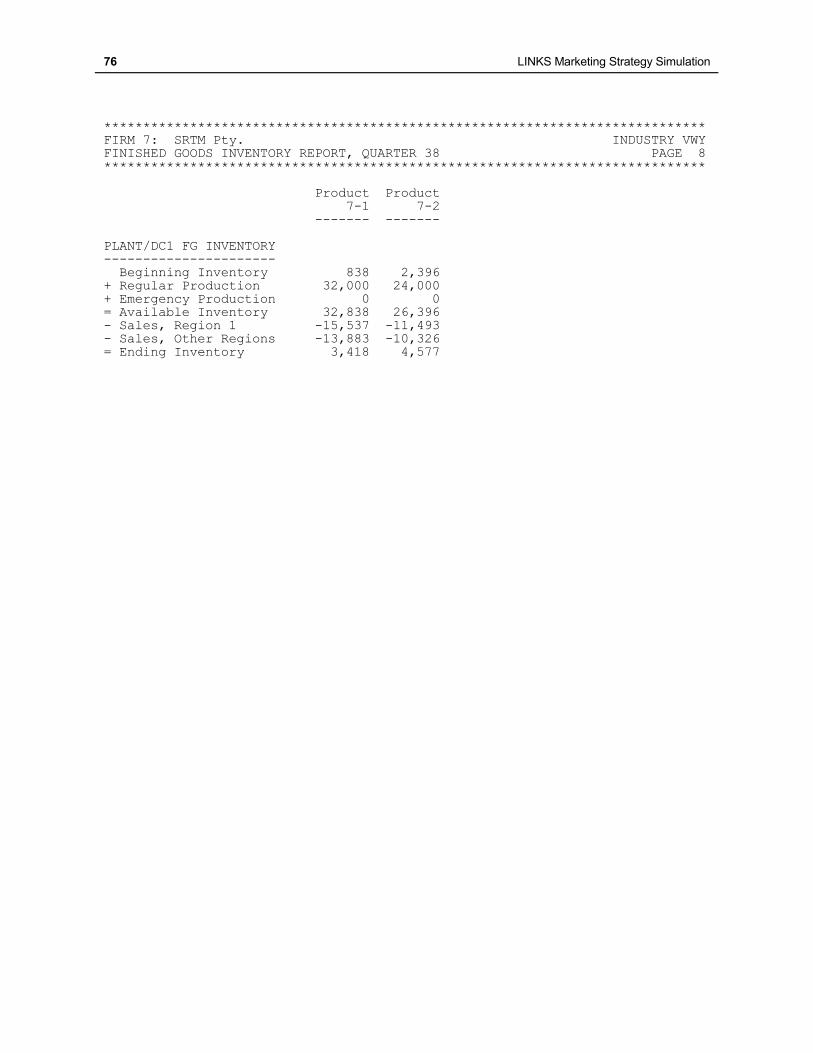
76 LINKS Marketing Strategy Simulation
***************************************************************************** FIRM 7: SRTM Pty. INDUSTRY VWY FINISHED GOODS INVENTORY REPORT, QUARTER 38 PAGE 8 ***************************************************************************** Product Product 7-1 7-2 ------- ------- PLANT/DC1 FG INVENTORY ---------------------- Beginning Inventory 838 2,396 + Regular Production 32,000 24,000 + Emergency Production 0 0 = Available Inventory 32,838 26,396 - Sales, Region 1 -15,537 -11,493 - Sales, Other Regions -13,883 -10,326
= Ending Inventory 3,418 4,577
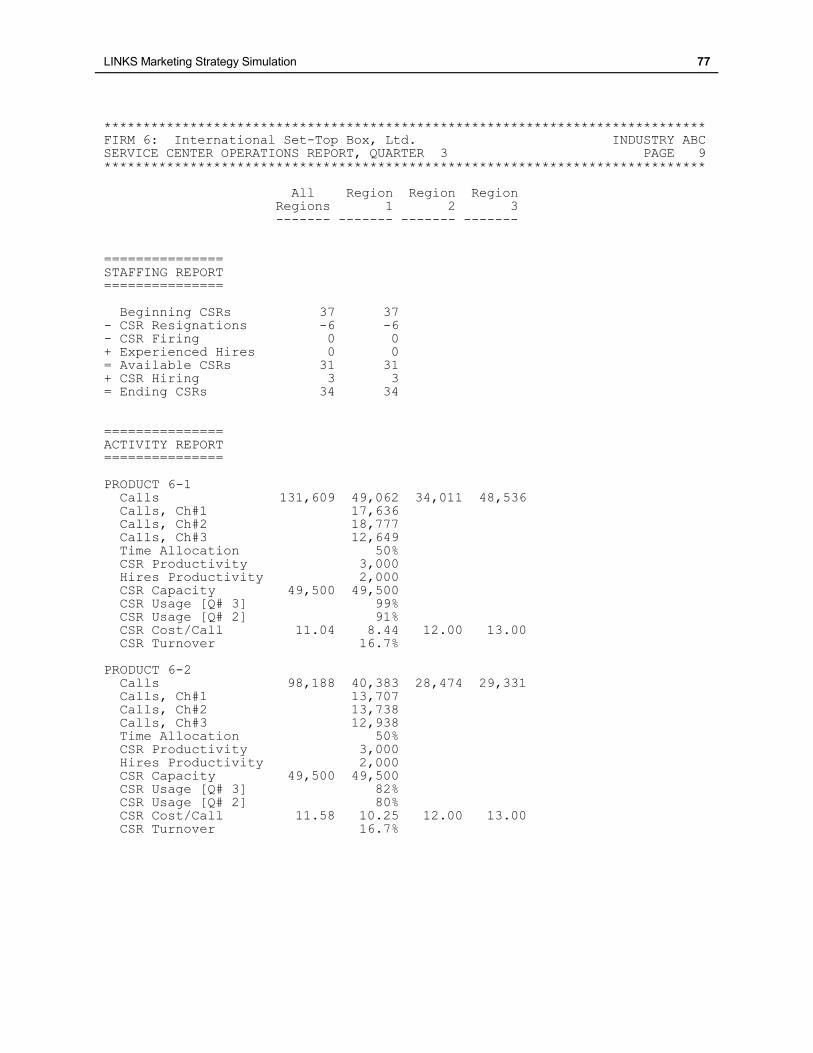
LINKS Marketing Strategy Simulation 77
***************************************************************************** FIRM 6: International Set-Top Box, Ltd. INDUSTRY ABC SERVICE CENTER OPERATIONS REPORT, QUARTER 3 PAGE 9 ***************************************************************************** All Region Region Region Regions 1 2 3 ------- ------- ------- ------- =============== STAFFING REPORT =============== Beginning CSRs 37 37 - CSR Resignations -6 -6 - CSR Firing 0 0
+ Experienced Hires 0 0 = Available CSRs 31 31 + CSR Hiring 3 3 = Ending CSRs 34 34 =============== ACTIVITY REPORT =============== PRODUCT 6-1 Calls 131,609 49,062 34,011 48,536 Calls, Ch#1 17,636 Calls, Ch#2 18,777 Calls, Ch#3 12,649 Time Allocation 50% CSR Productivity 3,000
Hires Productivity 2,000 CSR Capacity 49,500 49,500 CSR Usage [Q# 3] 99% CSR Usage [Q# 2] 91% CSR Cost/Call 11.04 8.44 12.00 13.00 CSR Turnover 16.7% PRODUCT 6-2 Calls 98,188 40,383 28,474 29,331 Calls, Ch#1 13,707 Calls, Ch#2 13,738 Calls, Ch#3 12,938 Time Allocation 50% CSR Productivity 3,000 Hires Productivity 2,000 CSR Capacity 49,500 49,500 CSR Usage [Q# 3] 82%
CSR Usage [Q# 2] 80% CSR Cost/Call 11.58 10.25 12.00 13.00 CSR Turnover 16.7%
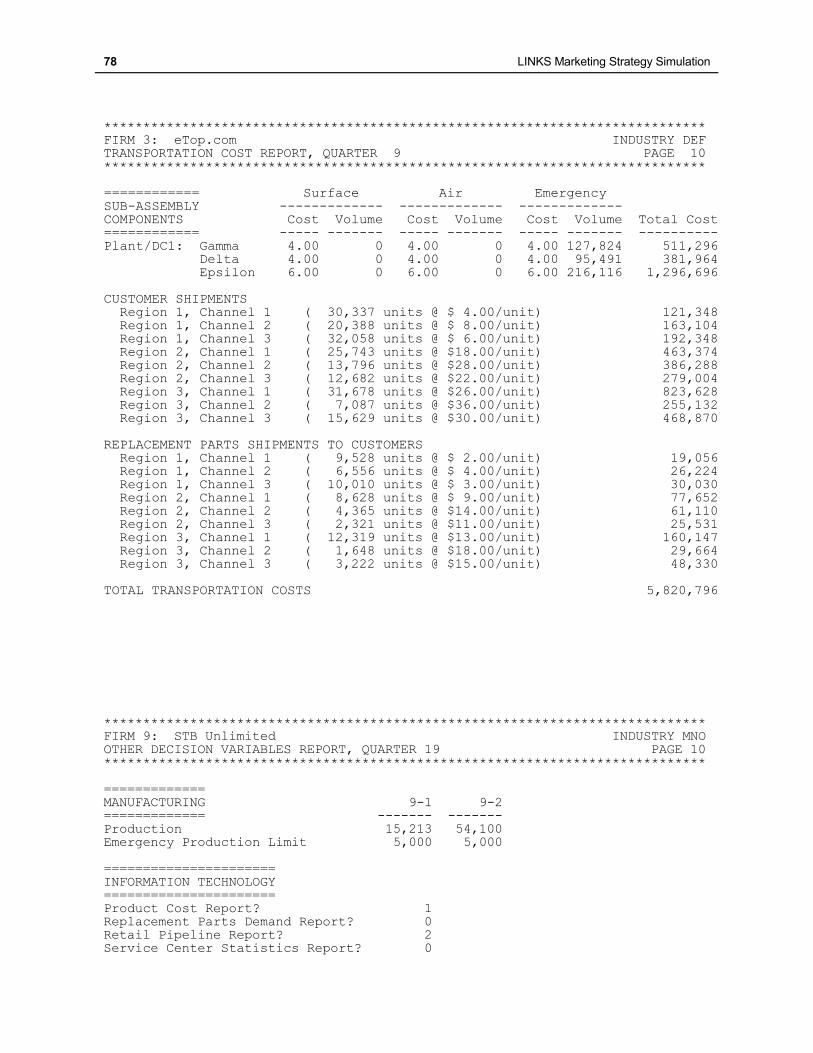
78 LINKS Marketing Strategy Simulation
***************************************************************************** FIRM 3: eTop.com INDUSTRY DEF TRANSPORTATION COST REPORT, QUARTER 9 PAGE 10 ***************************************************************************** ============ Surface Air Emergency SUB-ASSEMBLY ------------- ------------- ------------- COMPONENTS Cost Volume Cost Volume Cost Volume Total Cost ============ ----- ------- ----- ------- ----- ------- ---------- Plant/DC1: Gamma 4.00 0 4.00 0 4.00 127,824 511,296 Delta 4.00 0 4.00 0 4.00 95,491 381,964 Epsilon 6.00 0 6.00 0 6.00 216,116 1,296,696 CUSTOMER SHIPMENTS Region 1, Channel 1 ( 30,337 units @ $ 4.00/unit) 121,348 Region 1, Channel 2 ( 20,388 units @ $ 8.00/unit) 163,104 Region 1, Channel 3 ( 32,058 units @ $ 6.00/unit) 192,348
Region 2, Channel 1 ( 25,743 units @ $18.00/unit) 463,374 Region 2, Channel 2 ( 13,796 units @ $28.00/unit) 386,288 Region 2, Channel 3 ( 12,682 units @ $22.00/unit) 279,004 Region 3, Channel 1 ( 31,678 units @ $26.00/unit) 823,628 Region 3, Channel 2 ( 7,087 units @ $36.00/unit) 255,132 Region 3, Channel 3 ( 15,629 units @ $30.00/unit) 468,870 REPLACEMENT PARTS SHIPMENTS TO CUSTOMERS Region 1, Channel 1 ( 9,528 units @ $ 2.00/unit) 19,056 Region 1, Channel 2 ( 6,556 units @ $ 4.00/unit) 26,224 Region 1, Channel 3 ( 10,010 units @ $ 3.00/unit) 30,030 Region 2, Channel 1 ( 8,628 units @ $ 9.00/unit) 77,652 Region 2, Channel 2 ( 4,365 units @ $14.00/unit) 61,110 Region 2, Channel 3 ( 2,321 units @ $11.00/unit) 25,531 Region 3, Channel 1 ( 12,319 units @ $13.00/unit) 160,147 Region 3, Channel 2 ( 1,648 units @ $18.00/unit) 29,664 Region 3, Channel 3 ( 3,222 units @ $15.00/unit) 48,330
TOTAL TRANSPORTATION COSTS 5,820,796 ***************************************************************************** FIRM 9: STB Unlimited INDUSTRY MNO OTHER DECISION VARIABLES REPORT, QUARTER 19 PAGE 10 ***************************************************************************** =============
MANUFACTURING 9-1 9-2 ============= ------- ------- Production 15,213 54,100 Emergency Production Limit 5,000 5,000 ====================== INFORMATION TECHNOLOGY ====================== Product Cost Report? 1 Replacement Parts Demand Report? 0 Retail Pipeline Report? 2 Service Center Statistics Report? 0
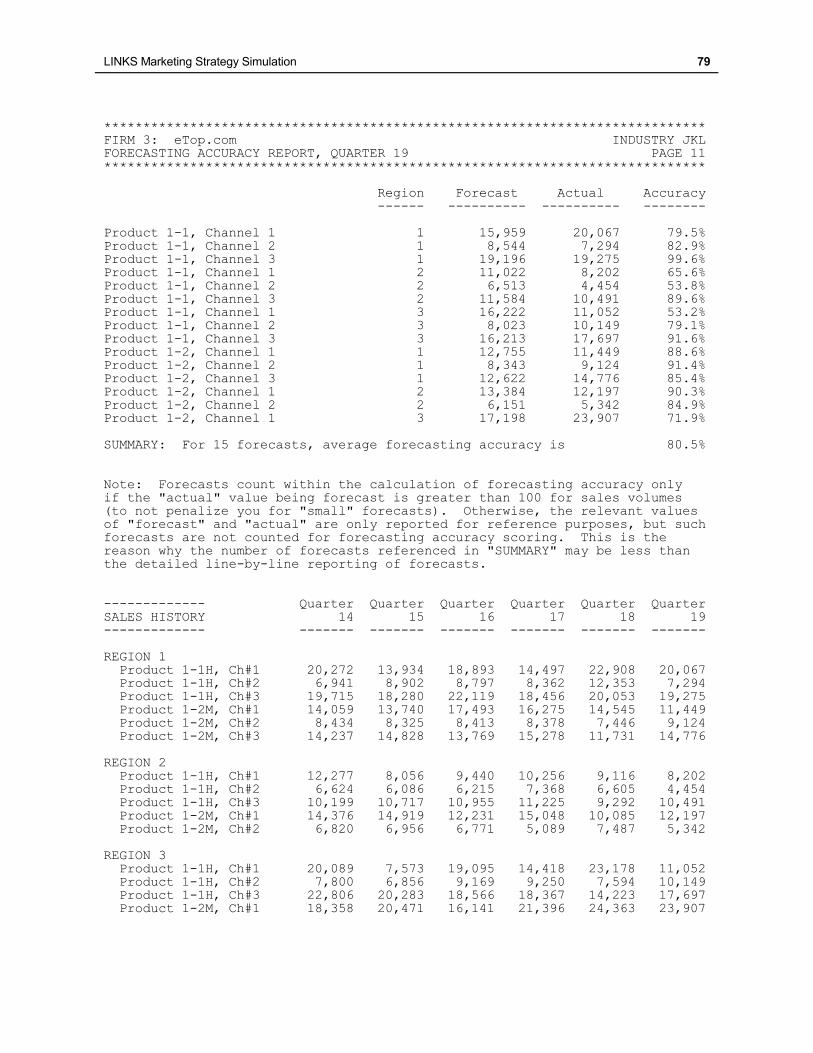
LINKS Marketing Strategy Simulation 79
***************************************************************************** FIRM 3: eTop.com INDUSTRY JKL FORECASTING ACCURACY REPORT, QUARTER 19 PAGE 11 ***************************************************************************** Region Forecast Actual Accuracy ------ ---------- ---------- -------- Product 1-1, Channel 1 1 15,959 20,067 79.5% Product 1-1, Channel 2 1 8,544 7,294 82.9% Product 1-1, Channel 3 1 19,196 19,275 99.6% Product 1-1, Channel 1 2 11,022 8,202 65.6% Product 1-1, Channel 2 2 6,513 4,454 53.8% Product 1-1, Channel 3 2 11,584 10,491 89.6% Product 1-1, Channel 1 3 16,222 11,052 53.2% Product 1-1, Channel 2 3 8,023 10,149 79.1% Product 1-1, Channel 3 3 16,213 17,697 91.6%
Product 1-2, Channel 1 1 12,755 11,449 88.6% Product 1-2, Channel 2 1 8,343 9,124 91.4% Product 1-2, Channel 3 1 12,622 14,776 85.4% Product 1-2, Channel 1 2 13,384 12,197 90.3% Product 1-2, Channel 2 2 6,151 5,342 84.9% Product 1-2, Channel 1 3 17,198 23,907 71.9% SUMMARY: For 15 forecasts, average forecasting accuracy is 80.5% Note: Forecasts count within the calculation of forecasting accuracy only if the "actual" value being forecast is greater than 100 for sales volumes (to not penalize you for "small" forecasts). Otherwise, the relevant values of "forecast" and "actual" are only reported for reference purposes, but such forecasts are not counted for forecasting accuracy scoring. This is the reason why the number of forecasts referenced in "SUMMARY" may be less than the detailed line-by-line reporting of forecasts.
------------- Quarter Quarter Quarter Quarter Quarter Quarter SALES HISTORY 14 15 16 17 18 19 ------------- ------- ------- ------- ------- ------- ------- REGION 1 Product 1-1H, Ch#1 20,272 13,934 18,893 14,497 22,908 20,067 Product 1-1H, Ch#2 6,941 8,902 8,797 8,362 12,353 7,294 Product 1-1H, Ch#3 19,715 18,280 22,119 18,456 20,053 19,275 Product 1-2M, Ch#1 14,059 13,740 17,493 16,275 14,545 11,449 Product 1-2M, Ch#2 8,434 8,325 8,413 8,378 7,446 9,124 Product 1-2M, Ch#3 14,237 14,828 13,769 15,278 11,731 14,776 REGION 2 Product 1-1H, Ch#1 12,277 8,056 9,440 10,256 9,116 8,202 Product 1-1H, Ch#2 6,624 6,086 6,215 7,368 6,605 4,454
Product 1-1H, Ch#3 10,199 10,717 10,955 11,225 9,292 10,491 Product 1-2M, Ch#1 14,376 14,919 12,231 15,048 10,085 12,197 Product 1-2M, Ch#2 6,820 6,956 6,771 5,089 7,487 5,342 REGION 3 Product 1-1H, Ch#1 20,089 7,573 19,095 14,418 23,178 11,052 Product 1-1H, Ch#2 7,800 6,856 9,169 9,250 7,594 10,149 Product 1-1H, Ch#3 22,806 20,283 18,566 18,367 14,223 17,697 Product 1-2M, Ch#1 18,358 20,471 16,141 21,396 24,363 23,907
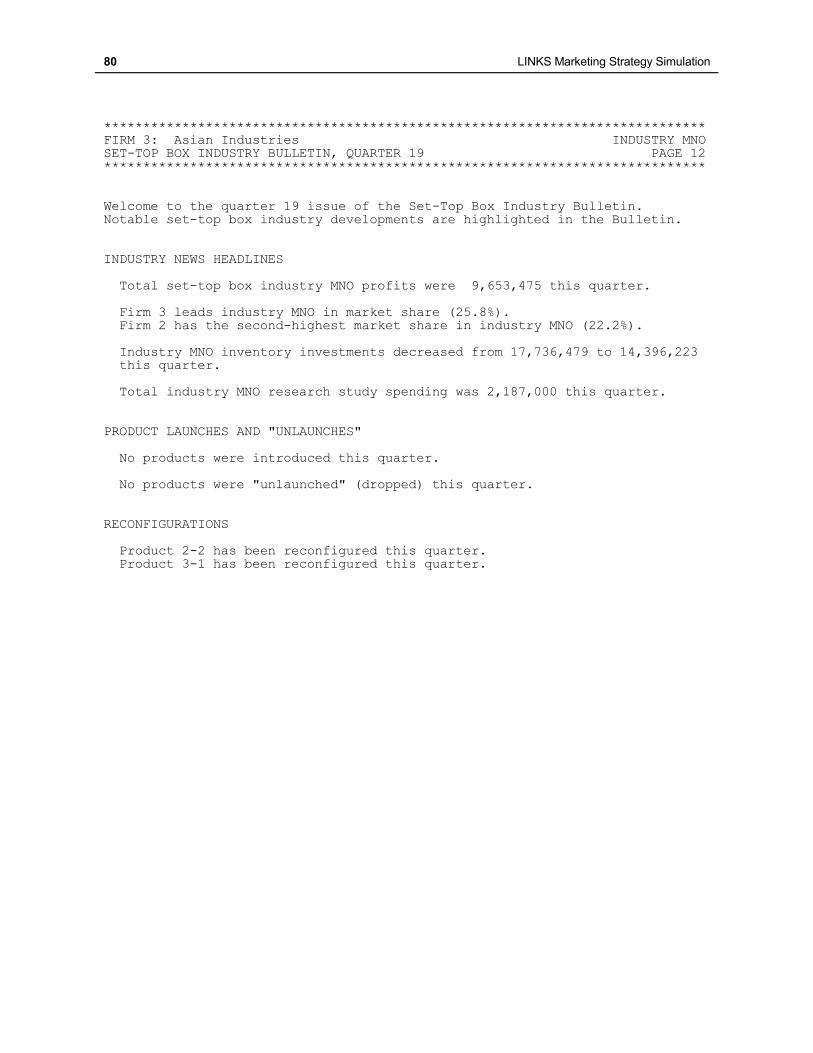
80 LINKS Marketing Strategy Simulation
***************************************************************************** FIRM 3: Asian Industries INDUSTRY MNO SET-TOP BOX INDUSTRY BULLETIN, QUARTER 19 PAGE 12 ***************************************************************************** Welcome to the quarter 19 issue of the Set-Top Box Industry Bulletin. Notable set-top box industry developments are highlighted in the Bulletin. INDUSTRY NEWS HEADLINES Total set-top box industry MNO profits were 9,653,475 this quarter. Firm 3 leads industry MNO in market share (25.8%). Firm 2 has the second-highest market share in industry MNO (22.2%).
Industry MNO inventory investments decreased from 17,736,479 to 14,396,223 this quarter. Total industry MNO research study spending was 2,187,000 this quarter. PRODUCT LAUNCHES AND "UNLAUNCHES" No products were introduced this quarter. No products were "unlaunched" (dropped) this quarter. RECONFIGURATIONS Product 2-2 has been reconfigured this quarter. Product 3-1 has been reconfigured this quarter.
LINKS Marketing Strategy Simulation 81
Chapter 14: Research Studies "Research is the process of going up alleys to see if they are blind." - Marston Bates
This chapter describes the available research studies the LINKS Marketing Strategy Simulation,.
These research studies provide further information about competitors and about the set-top box
markets. These studies are typical of the kinds of research resources that exist in manufacturing-
based industries, and the associated costs are typical of the approximate magnitude of the costs
associated with such research studies in real industries. However, there's no reason to believe
that every one of these research studies is appropriate and useful at all times or worth the
associated costs. You'll have to decide whether these research studies are worth their stated
costs.
Research studies requests are submitted along with your other decision variable changes.
Although LINKS research studies are ordered prior to the beginning of the next quarter,
research studies are executed during and after the next quarter, as appropriate. Thus,
research studies reports always reflect the just-completed quarter's experience.
An overview of the available LINKS research study resources is provided in Exhibit 12. Exhibit 13
provides a catalog of these research studies organized by application area.
In the following research study descriptions, sample output illustrates the style and formatting of
research study output. These samples are only for illustrative purposes. The output should
not be viewed as providing any specific insight into your particular set-top box industry.
Research Studies Strategy
"Time spent in reconnaissance is seldom wasted." – Sun Tzu, 4BC
Which research studies should you purchase? When should you purchase these research
studies? Two snappy but uninformative responses would be "purchase exactly the research
studies that you need and no others" and "it depends." Unfortunately, these responses are not
very constructive counsel. Heavy-duty anticipatory thinking is needed before deciding on
research study purchases.
Bruce Henderson, noted strategist, author, and management consultant, offers the following
insightful process-based suggestion for conducting research: "Define the problem and
hypothesize the approach to a solution intuitively before wasting time on data collection and
analysis. Do the first analysis lightly. Then, and only then, redefine the problem more rigorously
and reanalyze in depth. Don't go to the library and read all the books before you know what you
want to learn." The problem "reanalysis" stage is particularly relevant since that is where research
studies may play a role, once you have determined that the information provided in the research
may provide useful insight into the problem.
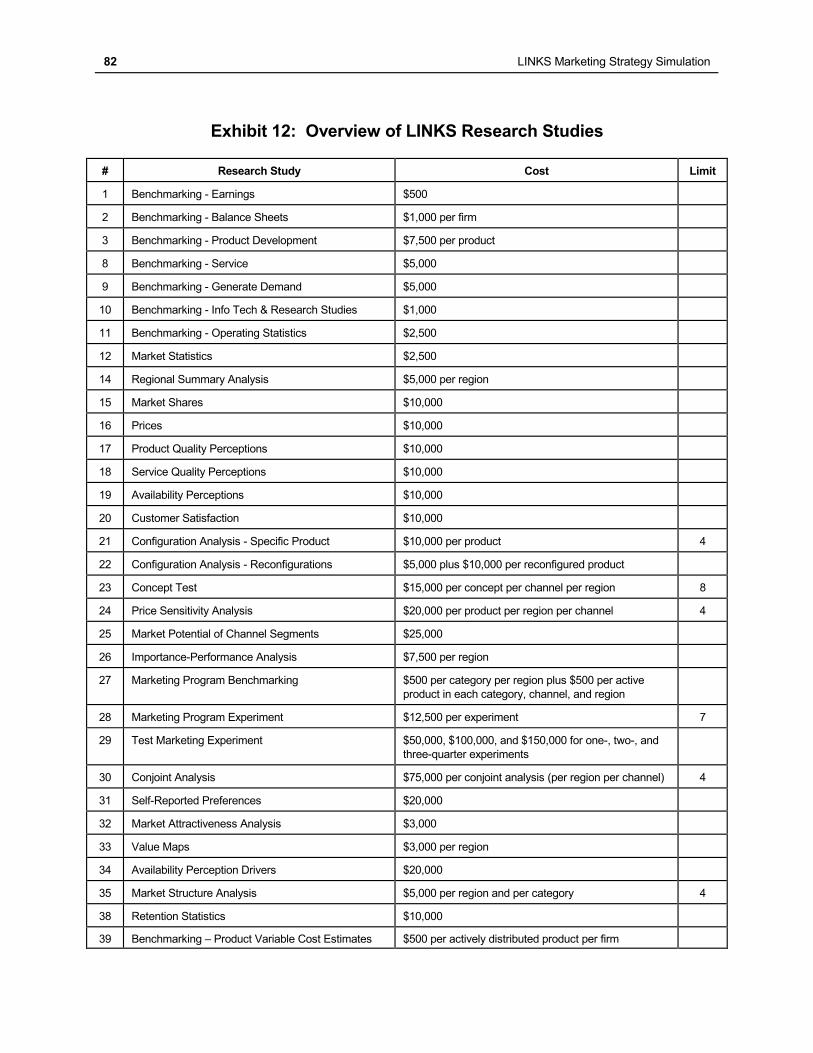
82 LINKS Marketing Strategy Simulation
Exhibit 12: Overview of LINKS Research Studies
# Research Study Cost Limit
1 Benchmarking - Earnings $500
2 Benchmarking - Balance Sheets $1,000 per firm
3 Benchmarking - Product Development $7,500 per product
8 Benchmarking - Service $5,000
9 Benchmarking - Generate Demand $5,000
10 Benchmarking - Info Tech & Research Studies $1,000
11 Benchmarking - Operating Statistics $2,500
12 Market Statistics $2,500
14 Regional Summary Analysis $5,000 per region
15 Market Shares $10,000
16 Prices $10,000
17 Product Quality Perceptions $10,000
18 Service Quality Perceptions $10,000
19 Availability Perceptions $10,000
20 Customer Satisfaction $10,000
21 Configuration Analysis - Specific Product $10,000 per product 4
22 Configuration Analysis - Reconfigurations $5,000 plus $10,000 per reconfigured product
23 Concept Test $15,000 per concept per channel per region 8
24 Price Sensitivity Analysis $20,000 per product per region per channel 4
25 Market Potential of Channel Segments $25,000
26 Importance-Performance Analysis $7,500 per region
27 Marketing Program Benchmarking $500 per category per region plus $500 per active
product in each category, channel, and region
28 Marketing Program Experiment $12,500 per experiment 7
29 Test Marketing Experiment $50,000, $100,000, and $150,000 for one-, two-, and
three-quarter experiments
30 Conjoint Analysis $75,000 per conjoint analysis (per region per channel) 4
31 Self-Reported Preferences $20,000
32 Market Attractiveness Analysis $3,000
33 Value Maps $3,000 per region
34 Availability Perception Drivers $20,000
35 Market Structure Analysis $5,000 per region and per category 4
38 Retention Statistics $10,000
39 Benchmarking – Product Variable Cost Estimates $500 per actively distributed product per firm
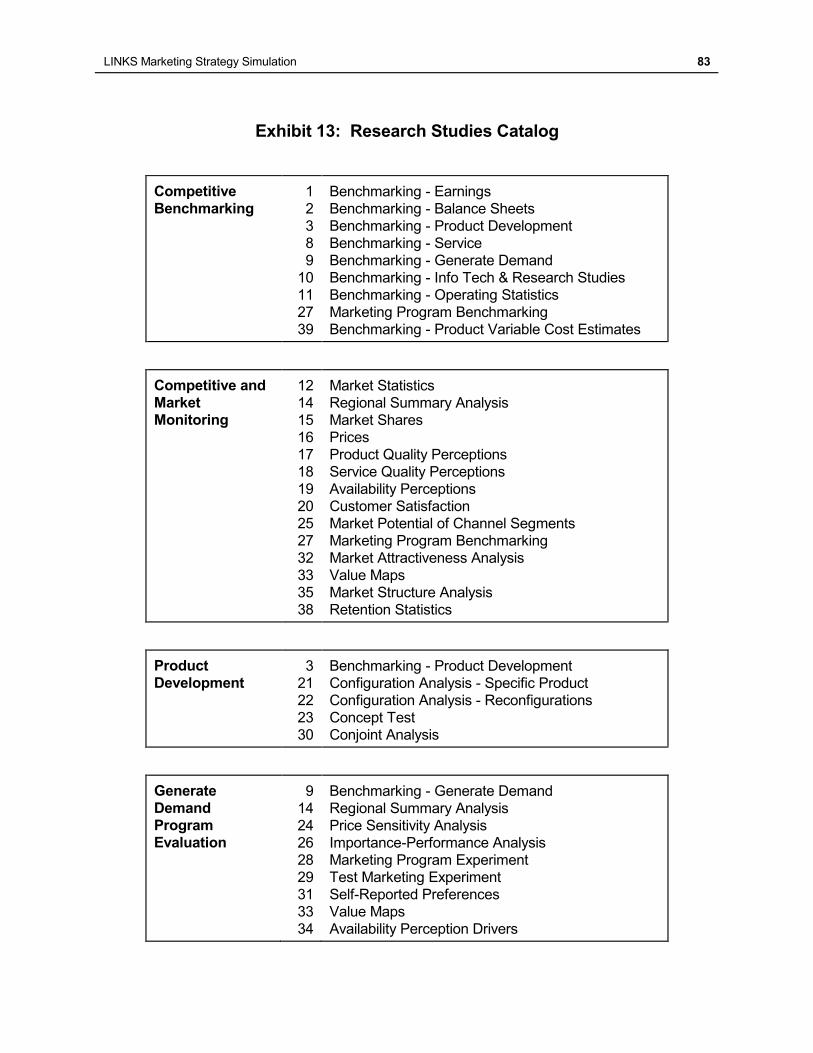
LINKS Marketing Strategy Simulation 83
Exhibit 13: Research Studies Catalog
Competitive
Benchmarking 1
2
3
8
9
10
11
27
39
Benchmarking - Earnings
Benchmarking - Balance Sheets
Benchmarking - Product Development
Benchmarking - Service
Benchmarking - Generate Demand
Benchmarking - Info Tech & Research Studies
Benchmarking - Operating Statistics
Marketing Program Benchmarking
Benchmarking - Product Variable Cost Estimates
Competitive and
Market
Monitoring
12
14
15
16
17
18
19
20
25
27
32
33
35
38
Market Statistics
Regional Summary Analysis
Market Shares
Prices
Product Quality Perceptions
Service Quality Perceptions
Availability Perceptions
Customer Satisfaction
Market Potential of Channel Segments
Marketing Program Benchmarking
Market Attractiveness Analysis
Value Maps
Market Structure Analysis
Retention Statistics
Product
Development 3
21
22
23
30
Benchmarking - Product Development
Configuration Analysis - Specific Product
Configuration Analysis - Reconfigurations
Concept Test
Conjoint Analysis
Generate
Demand
Program
Evaluation
9
14
24
26
28
29
31
33
34
Benchmarking - Generate Demand
Regional Summary Analysis
Price Sensitivity Analysis
Importance-Performance Analysis
Marketing Program Experiment
Test Marketing Experiment
Self-Reported Preferences
Value Maps
Availability Perception Drivers
84 LINKS Marketing Strategy Simulation
In thinking about research studies strategy
and tactics, some generalizations are
possible:
Excellent strategy can only be developed
based on excellent analysis. Since
research provides the raw data for
excellent analysis, research should be an
important component of your LINKS
decision-making process. Do not relegate
your research studies pre-ordering
decisions to the last five minutes of team
meetings. Rather, treat research studies
ordering decisions as a fundamental part
of your whole LINKS decision-making
process.
Plan ahead. To identify patterns and
trends, you will probably need to order
some research studies on a more-or-less
regular basis. A formal research studies
plan should be a part of your management
planning process.
Systematize the post-analysis of research
studies. This might involve, for example,
the continual updating of databases,
charts, or graphs to reformat the raw
LINKS research studies results into more
meaningful and useful forms.
Share insights derived from particular
research studies with all of your team
members. These may require research
studies' "experts" to assume coaching
roles with research studies "novices." This
is a natural state of affairs. Given the
complexity of LINKS, it is not possible to
be an "expert" on everything.
FYI: The Cost of Marketing Research
Marketing research is more often than not
underfunded. I continue to be amazed by
companies that are extremely averse to spending
$200K on researching a new product that will cost
$40 million to launch — that's 1/2 of 1% of the
money at risk. Or why is it so difficult to justify
even 1% of the cost of an advertising or
promotional campaign on conducting pre-launch
evaluations of that campaign at the critical stages
of development? There are several credible
explanations.
One reason is that marketing campaigns too
often take on a life of their own, with
marketers' egos and reputations perceived to
be on the line. To advocates, research is seen
as a constraint on their personal prerogatives
and creativity. Gunslinger marketers and well-
trained, methodical researchers do not mix
well.
Researchers often aren't involved in the early
planning process for new products or
campaigns. Consequently, at the time of
budget development, there's no input from the
professional researcher as to what should be
researched, how it should be researched, and
how much it will cost.
In most companies, spending on marketing
research is considered an expense, not an
investment in risk reduction. Until we develop
and can agree on measures of return on
marketing research investment, the marketing
research function will continue to suffer the
fate of short budgets and yo-yo staffing.
Source: William D. Neal, "Getting Serious About Marketing
Research," Marketing Research: A Magazine of
Management and Applications (Summer 2002), p. 26.
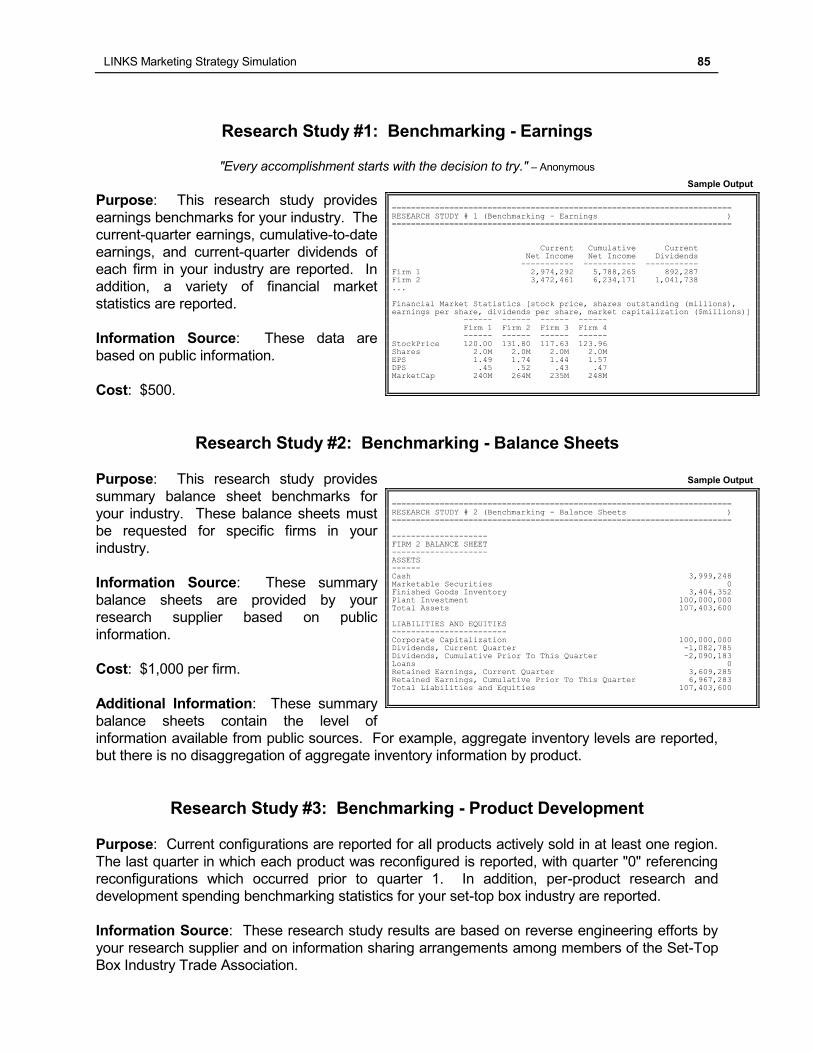
LINKS Marketing Strategy Simulation 85
Research Study #1: Benchmarking - Earnings
"Every accomplishment starts with the decision to try." – Anonymous
Purpose: This research study provides
earnings benchmarks for your industry. The
current-quarter earnings, cumulative-to-date
earnings, and current-quarter dividends of
each firm in your industry are reported. In
addition, a variety of financial market
statistics are reported.
Information Source: These data are
based on public information.
Cost: $500.
Research Study #2: Benchmarking - Balance Sheets
Purpose: This research study provides
summary balance sheet benchmarks for
your industry. These balance sheets must
be requested for specific firms in your
industry.
Information Source: These summary
balance sheets are provided by your
research supplier based on public
information.
Cost: $1,000 per firm.
Additional Information: These summary
balance sheets contain the level of
information available from public sources. For example, aggregate inventory levels are reported,
but there is no disaggregation of aggregate inventory information by product.
Research Study #3: Benchmarking - Product Development
Purpose: Current configurations are reported for all products actively sold in at least one region.
The last quarter in which each product was reconfigured is reported, with quarter "0" referencing
reconfigurations which occurred prior to quarter 1. In addition, per-product research and
development spending benchmarking statistics for your set-top box industry are reported.
Information Source: These research study results are based on reverse engineering efforts by
your research supplier and on information sharing arrangements among members of the Set-Top
Box Industry Trade Association.
Sample Output
======================================================================= RESEARCH STUDY # 1 (Benchmarking - Earnings ) ======================================================================= Current Cumulative Current Net Income Net Income Dividends ----------- ----------- ----------- Firm 1 2,974,292 5,788,265 892,287 Firm 2 3,472,461 6,234,171 1,041,738 ... Financial Market Statistics [stock price, shares outstanding (millions), earnings per share, dividends per share, market capitalization ($millions)] ------ ------ ------ ------ Firm 1 Firm 2 Firm 3 Firm 4 ------ ------ ------ ------
StockPrice 120.00 131.80 117.63 123.96 Shares 2.0M 2.0M 2.0M 2.0M EPS 1.49 1.74 1.44 1.57 DPS .45 .52 .43 .47 MarketCap 240M 264M 235M 248M
Sample Output
======================================================================= RESEARCH STUDY # 2 (Benchmarking - Balance Sheets ) ======================================================================= -------------------- FIRM 2 BALANCE SHEET -------------------- ASSETS ------
Cash 3,999,248 Marketable Securities 0 Finished Goods Inventory 3,404,352 Plant Investment 100,000,000 Total Assets 107,403,600 LIABILITIES AND EQUITIES ------------------------ Corporate Capitalization 100,000,000 Dividends, Current Quarter -1,082,785 Dividends, Cumulative Prior To This Quarter -2,090,183 Loans 0 Retained Earnings, Current Quarter 3,609,285 Retained Earnings, Cumulative Prior To This Quarter 6,967,283 Total Liabilities and Equities 107,403,600
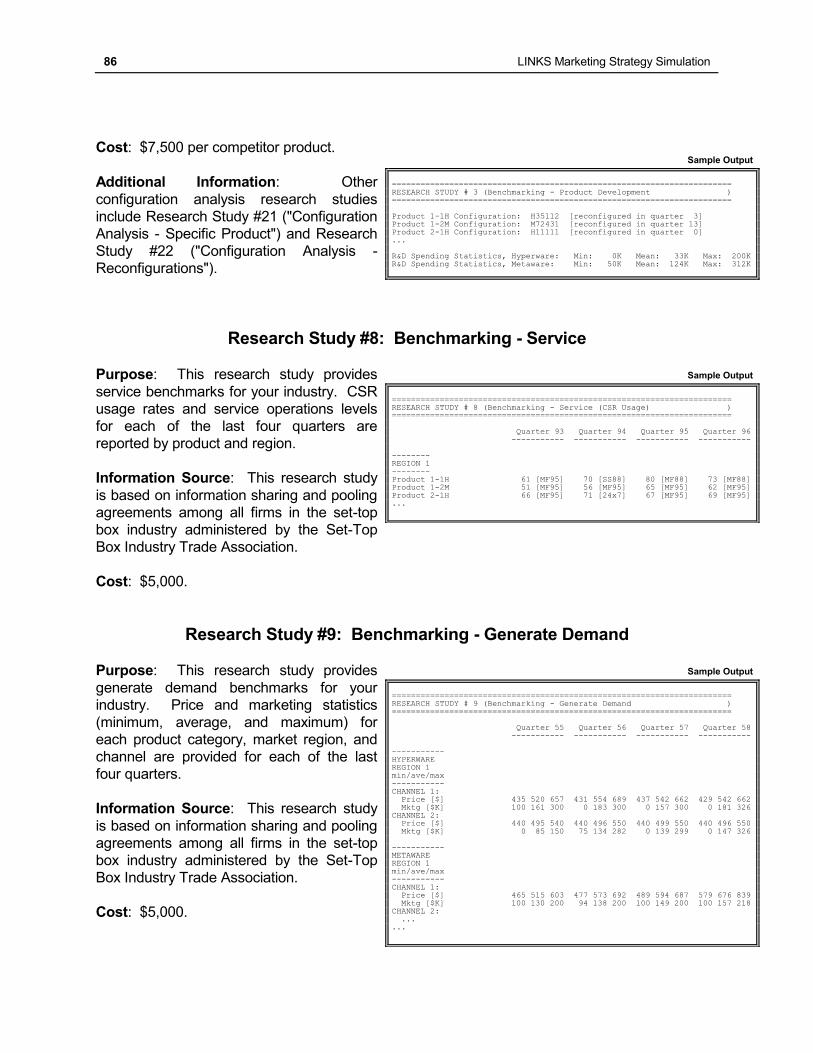
86 LINKS Marketing Strategy Simulation
Cost: $7,500 per competitor product.
Additional Information: Other
configuration analysis research studies
include Research Study #21 ("Configuration
Analysis - Specific Product") and Research
Study #22 ("Configuration Analysis -
Reconfigurations").
Research Study #8: Benchmarking - Service
Purpose: This research study provides
service benchmarks for your industry. CSR
usage rates and service operations levels
for each of the last four quarters are
reported by product and region.
Information Source: This research study
is based on information sharing and pooling
agreements among all firms in the set-top
box industry administered by the Set-Top
Box Industry Trade Association.
Cost: $5,000.
Research Study #9: Benchmarking - Generate Demand
Purpose: This research study provides
generate demand benchmarks for your
industry. Price and marketing statistics
(minimum, average, and maximum) for
each product category, market region, and
channel are provided for each of the last
four quarters.
Information Source: This research study
is based on information sharing and pooling
agreements among all firms in the set-top
box industry administered by the Set-Top
Box Industry Trade Association.
Cost: $5,000.
Sample Output
======================================================================= RESEARCH STUDY # 3 (Benchmarking - Product Development ) ======================================================================= Product 1-1H Configuration: H35112 [reconfigured in quarter 3] Product 1-2M Configuration: M72431 [reconfigured in quarter 13] Product 2-1H Configuration: H11111 [reconfigured in quarter 0] ... R&D Spending Statistics, Hyperware: Min: 0K Mean: 33K Max: 200K R&D Spending Statistics, Metaware: Min: 50K Mean: 124K Max: 312K
Sample Output
======================================================================= RESEARCH STUDY # 8 (Benchmarking - Service (CSR Usage) ) ======================================================================= Quarter 93 Quarter 94 Quarter 95 Quarter 96 ----------- ----------- ----------- ----------- -------- REGION 1 -------- Product 1-1H 61 [MF95] 70 [SS88] 80 [MF88] 73 [MF88] Product 1-2M 51 [MF95] 56 [MF95] 65 [MF95] 62 [MF95] Product 2-1H 66 [MF95] 71 [24x7] 67 [MF95] 69 [MF95] ...
Sample Output
======================================================================= RESEARCH STUDY # 9 (Benchmarking - Generate Demand ) ======================================================================= Quarter 55 Quarter 56 Quarter 57 Quarter 58 ----------- ----------- ----------- ----------- ----------- HYPERWARE REGION 1 min/ave/max ----------- CHANNEL 1: Price [$] 435 520 657 431 554 689 437 542 662 429 542 662
Mktg [$K] 100 161 300 0 183 300 0 157 300 0 181 326 CHANNEL 2: Price [$] 440 495 540 440 496 550 440 499 550 440 496 550 Mktg [$K] 0 85 150 75 134 282 0 139 299 0 147 326 ----------- METAWARE REGION 1 min/ave/max ----------- CHANNEL 1: Price [$] 465 515 603 477 573 692 489 594 687 579 676 839 Mktg [$K] 100 130 200 94 138 200 100 149 200 100 157 218 CHANNEL 2: ... ...
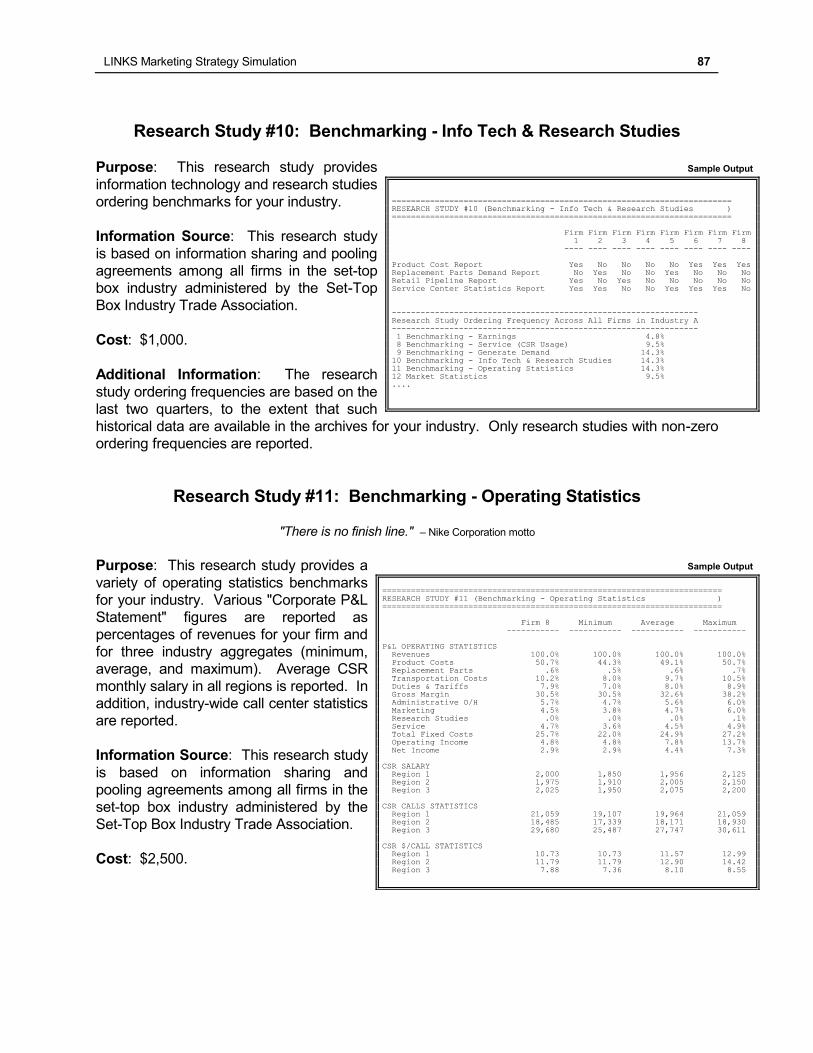
LINKS Marketing Strategy Simulation 87
Research Study #10: Benchmarking - Info Tech & Research Studies
Purpose: This research study provides
information technology and research studies
ordering benchmarks for your industry.
Information Source: This research study
is based on information sharing and pooling
agreements among all firms in the set-top
box industry administered by the Set-Top
Box Industry Trade Association.
Cost: $1,000.
Additional Information: The research
study ordering frequencies are based on the
last two quarters, to the extent that such
historical data are available in the archives for your industry. Only research studies with non-zero
ordering frequencies are reported.
Research Study #11: Benchmarking - Operating Statistics
"There is no finish line." – Nike Corporation motto
Purpose: This research study provides a
variety of operating statistics benchmarks
for your industry. Various "Corporate P&L
Statement" figures are reported as
percentages of revenues for your firm and
for three industry aggregates (minimum,
average, and maximum). Average CSR
monthly salary in all regions is reported. In
addition, industry-wide call center statistics
are reported.
Information Source: This research study
is based on information sharing and
pooling agreements among all firms in the
set-top box industry administered by the
Set-Top Box Industry Trade Association.
Cost: $2,500.
Sample Output
======================================================================= RESEARCH STUDY #10 (Benchmarking - Info Tech & Research Studies ) ======================================================================= Firm Firm Firm Firm Firm Firm Firm Firm 1 2 3 4 5 6 7 8 ---- ---- ---- ---- ---- ---- ---- ---- Product Cost Report Yes No No No No Yes Yes Yes Replacement Parts Demand Report No Yes No No Yes No No No Retail Pipeline Report Yes No Yes No No No No No Service Center Statistics Report Yes Yes No No Yes Yes Yes No ---------------------------------------------------------------- Research Study Ordering Frequency Across All Firms in Industry A ---------------------------------------------------------------- 1 Benchmarking - Earnings 4.8%
8 Benchmarking - Service (CSR Usage) 9.5% 9 Benchmarking - Generate Demand 14.3% 10 Benchmarking - Info Tech & Research Studies 14.3% 11 Benchmarking - Operating Statistics 14.3% 12 Market Statistics 9.5% ....
Sample Output
======================================================================= RESEARCH STUDY #11 (Benchmarking - Operating Statistics ) ======================================================================= Firm 8 Minimum Average Maximum ----------- ----------- ----------- ----------- P&L OPERATING STATISTICS Revenues 100.0% 100.0% 100.0% 100.0% Product Costs 50.7% 44.3% 49.1% 50.7% Replacement Parts .6% .5% .6% .7% Transportation Costs 10.2% 8.0% 9.7% 10.5% Duties & Tariffs 7.9% 7.0% 8.0% 8.9% Gross Margin 30.5% 30.5% 32.6% 38.2% Administrative O/H 5.7% 4.7% 5.6% 6.0% Marketing 4.5% 3.8% 4.7% 6.0% Research Studies .0% .0% .0% .1% Service 4.7% 3.6% 4.5% 4.9% Total Fixed Costs 25.7% 22.0% 24.9% 27.2% Operating Income 4.8% 4.8% 7.8% 13.7% Net Income 2.9% 2.9% 4.4% 7.3% CSR SALARY Region 1 2,000 1,850 1,956 2,125 Region 2 1,975 1,910 2,005 2,150 Region 3 2,025 1,950 2,075 2,200
CSR CALLS STATISTICS Region 1 21,059 19,107 19,964 21,059 Region 2 18,485 17,339 18,171 18,930 Region 3 29,680 25,487 27,747 30,611 CSR $/CALL STATISTICS Region 1 10.73 10.73 11.57 12.99 Region 2 11.79 11.79 12.90 14.42 Region 3 7.88 7.36 8.10 8.55
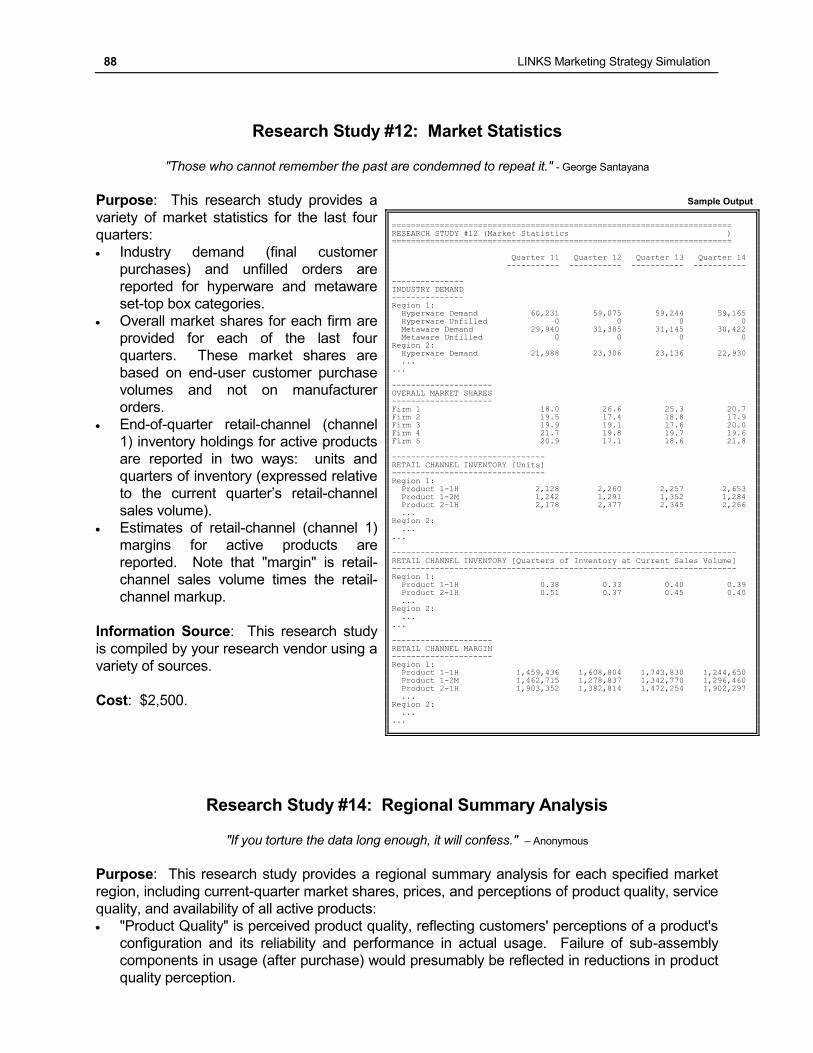
88 LINKS Marketing Strategy Simulation
Research Study #12: Market Statistics
"Those who cannot remember the past are condemned to repeat it." - George Santayana
Purpose: This research study provides a
variety of market statistics for the last four
quarters:
Industry demand (final customer
purchases) and unfilled orders are
reported for hyperware and metaware
set-top box categories.
Overall market shares for each firm are
provided for each of the last four
quarters. These market shares are
based on end-user customer purchase
volumes and not on manufacturer
orders.
End-of-quarter retail-channel (channel
1) inventory holdings for active products
are reported in two ways: units and
quarters of inventory (expressed relative
to the current quarter’s retail-channel
sales volume).
Estimates of retail-channel (channel 1)
margins for active products are
reported. Note that "margin" is retail-
channel sales volume times the retail-
channel markup.
Information Source: This research study
is compiled by your research vendor using a
variety of sources.
Cost: $2,500.
Research Study #14: Regional Summary Analysis
"If you torture the data long enough, it will confess." – Anonymous
Purpose: This research study provides a regional summary analysis for each specified market
region, including current-quarter market shares, prices, and perceptions of product quality, service
quality, and availability of all active products:
"Product Quality" is perceived product quality, reflecting customers' perceptions of a product's
configuration and its reliability and performance in actual usage. Failure of sub-assembly
components in usage (after purchase) would presumably be reflected in reductions in product
quality perception.
Sample Output
======================================================================= RESEARCH STUDY #12 (Market Statistics ) ======================================================================= Quarter 11 Quarter 12 Quarter 13 Quarter 14 ----------- ----------- ----------- ----------- --------------- INDUSTRY DEMAND --------------- Region 1: Hyperware Demand 60,231 59,075 59,244 59,165 Hyperware Unfilled 0 0 0 0 Metaware Demand 29,940 31,385 31,145 30,422 Metaware Unfilled 0 0 0 0
Region 2: Hyperware Demand 21,988 23,306 23,136 22,930 ... ... --------------------- OVERALL MARKET SHARES --------------------- Firm 1 18.0 26.6 25.3 20.7 Firm 2 19.5 17.4 18.8 17.9 Firm 3 19.9 19.1 17.6 20.0 Firm 4 21.7 19.8 19.7 19.6 Firm 5 20.9 17.1 18.6 21.8 -------------------------------- RETAIL CHANNEL INVENTORY [Units] -------------------------------- Region 1: Product 1-1H 2,128 2,260 2,257 2,653 Product 1-2M 1,242 1,291 1,352 1,284 Product 2-1H 2,178 2,377 2,345 2,266 ... Region 2: ... ... ------------------------------------------------------------------------ RETAIL CHANNEL INVENTORY [Quarters of Inventory at Current Sales Volume] ------------------------------------------------------------------------
Region 1: Product 1-1H 0.38 0.33 0.40 0.39 Product 2-1H 0.51 0.37 0.45 0.40 ... Region 2: ... ... --------------------- RETAIL CHANNEL MARGIN --------------------- Region 1: Product 1-1H 1,459,436 1,608,804 1,743,830 1,244,650 Product 1-2M 1,462,715 1,278,837 1,342,770 1,296,460 Product 2-1H 1,903,352 1,382,814 1,472,254 1,902,297 ... Region 2: ... ...
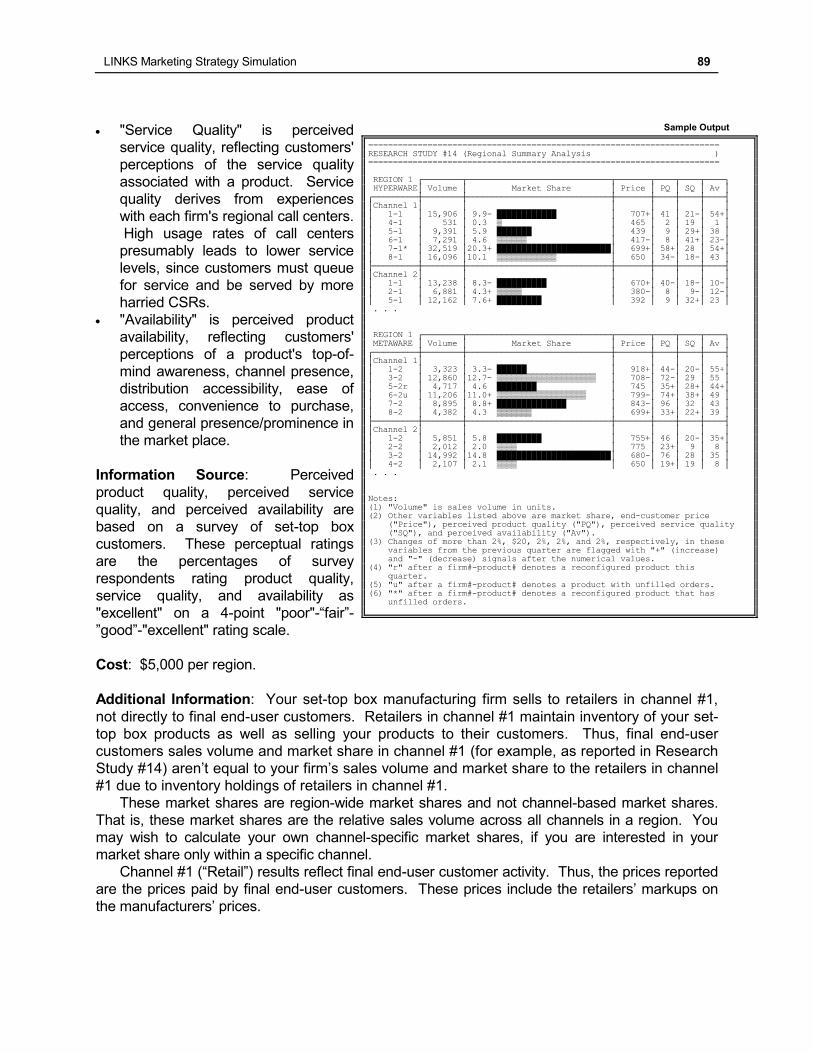
LINKS Marketing Strategy Simulation 89
"Service Quality" is perceived
service quality, reflecting customers'
perceptions of the service quality
associated with a product. Service
quality derives from experiences
with each firm's regional call centers.
High usage rates of call centers
presumably leads to lower service
levels, since customers must queue
for service and be served by more
harried CSRs.
"Availability" is perceived product
availability, reflecting customers'
perceptions of a product's top-of-
mind awareness, channel presence,
distribution accessibility, ease of
access, convenience to purchase,
and general presence/prominence in
the market place.
Information Source: Perceived
product quality, perceived service
quality, and perceived availability are
based on a survey of set-top box
customers. These perceptual ratings
are the percentages of survey
respondents rating product quality,
service quality, and availability as
"excellent" on a 4-point "poor"-“fair”-
”good”-"excellent" rating scale.
Cost: $5,000 per region.
Additional Information: Your set-top box manufacturing firm sells to retailers in channel #1,
not directly to final end-user customers. Retailers in channel #1 maintain inventory of your set-
top box products as well as selling your products to their customers. Thus, final end-user
customers sales volume and market share in channel #1 (for example, as reported in Research
Study #14) aren’t equal to your firm’s sales volume and market share to the retailers in channel
#1 due to inventory holdings of retailers in channel #1.
These market shares are region-wide market shares and not channel-based market shares.
That is, these market shares are the relative sales volume across all channels in a region. You
may wish to calculate your own channel-specific market shares, if you are interested in your
market share only within a specific channel.
Channel #1 (“Retail”) results reflect final end-user customer activity. Thus, the prices reported
are the prices paid by final end-user customers. These prices include the retailers’ markups on
the manufacturers’ prices.
Sample Output
======================================================================= RESEARCH STUDY #14 (Regional Summary Analysis ) ======================================================================= REGION 1 ┌────────┬─────────────────────────────┬───────┬────┬────┬────┐ HYPERWARE│ Volume │ Market Share │ Price │ PQ │ SQ │ Av │ ┌─────────┼────────┼─────────────────────────────┼───────┼────┼────┼────┤ │Channel 1│ │ │ │ │ │ │ │ 1-1 │ 15,906 │ 9.9- ████████████ │ 707+│ 41 │ 21-│ 54+│ │ 4-1 │ 531 │ 0.3 ▒ │ 465 │ 2 │ 19 │ 1 │ │ 5-1 │ 9,391 │ 5.9 ███████ │ 439 │ 9 │ 29+│ 38 │ │ 6-1 │ 7,291 │ 4.6 ▒▒▒▒▒▒ │ 417-│ 8 │ 41+│ 23-│ │ 7-1* │ 32,519 │20.3+ ███████████████████████│ 699+│ 58+│ 28 │ 54+│ │ 8-1 │ 16,096 │10.1 ▒▒▒▒▒▒▒▒▒▒▒▒ │ 650 │ 34-│ 18-│ 43 │ ├─────────┼────────┼─────────────────────────────┼───────┼────┼────┼────┤ │Channel 2│ │ │ │ │ │ │ │ 1-1 │ 13,238 │ 8.3- ██████████ │ 670+│ 40-│ 18-│ 10-│ │ 2-1 │ 6,881 │ 4.3+ ▒▒▒▒▒ │ 380-│ 8 │ 9-│ 12-│ │ 5-1 │ 12,162 │ 7.6+ █████████ │ 392 │ 9 │ 32+│ 23 │ . . . REGION 1 ┌────────┬─────────────────────────────┬───────┬────┬────┬────┐
METAWARE │ Volume │ Market Share │ Price │ PQ │ SQ │ Av │ ┌─────────┼────────┼─────────────────────────────┼───────┼────┼────┼────┤ │Channel 1│ │ │ │ │ │ │ │ 1-2 │ 3,323 │ 3.3- ██████ │ 918+│ 44-│ 20-│ 55+│ │ 3-2 │ 12,860 │12.7- ▒▒▒▒▒▒▒▒▒▒▒▒▒▒▒▒▒▒▒▒ │ 708-│ 72-│ 29 │ 55 │ │ 5-2r │ 4,717 │ 4.6 ████████ │ 745 │ 35+│ 28+│ 44+│ │ 6-2u │ 11,206 │11.0+ ▒▒▒▒▒▒▒▒▒▒▒▒▒▒▒▒▒▒ │ 799-│ 74+│ 38+│ 49 │ │ 7-2 │ 8,895 │ 8.8+ ██████████████ │ 843-│ 96 │ 32 │ 43 │ │ 8-2 │ 4,382 │ 4.3 ▒▒▒▒▒▒▒ │ 699+│ 33+│ 22+│ 39 │ ├─────────┼────────┼─────────────────────────────┼───────┼────┼────┼────┤ │Channel 2│ │ │ │ │ │ │ │ 1-2 │ 5,851 │ 5.8 █████████ │ 755+│ 46 │ 20-│ 35+│ │ 2-2 │ 2,012 │ 2.0 ▒▒▒▒ │ 775 │ 23+│ 9 │ 8 │ │ 3-2 │ 14,992 │14.8 ███████████████████████│ 680-│ 76 │ 28 │ 35 │ │ 4-2 │ 2,107 │ 2.1 ▒▒▒▒ │ 650 │ 19+│ 19 │ 8 │ . . . Notes: (1) "Volume" is sales volume in units. (2) Other variables listed above are market share, end-customer price ("Price"), perceived product quality ("PQ"), perceived service quality ("SQ"), and perceived availability ("Av"). (3) Changes of more than 2%, $20, 2%, 2%, and 2%, respectively, in these variables from the previous quarter are flagged with "+" (increase) and "-" (decrease) signals after the numerical values. (4) "r" after a firm#-product# denotes a reconfigured product this
quarter. (5) "u" after a firm#-product# denotes a product with unfilled orders. (6) "*" after a firm#-product# denotes a reconfigured product that has unfilled orders.
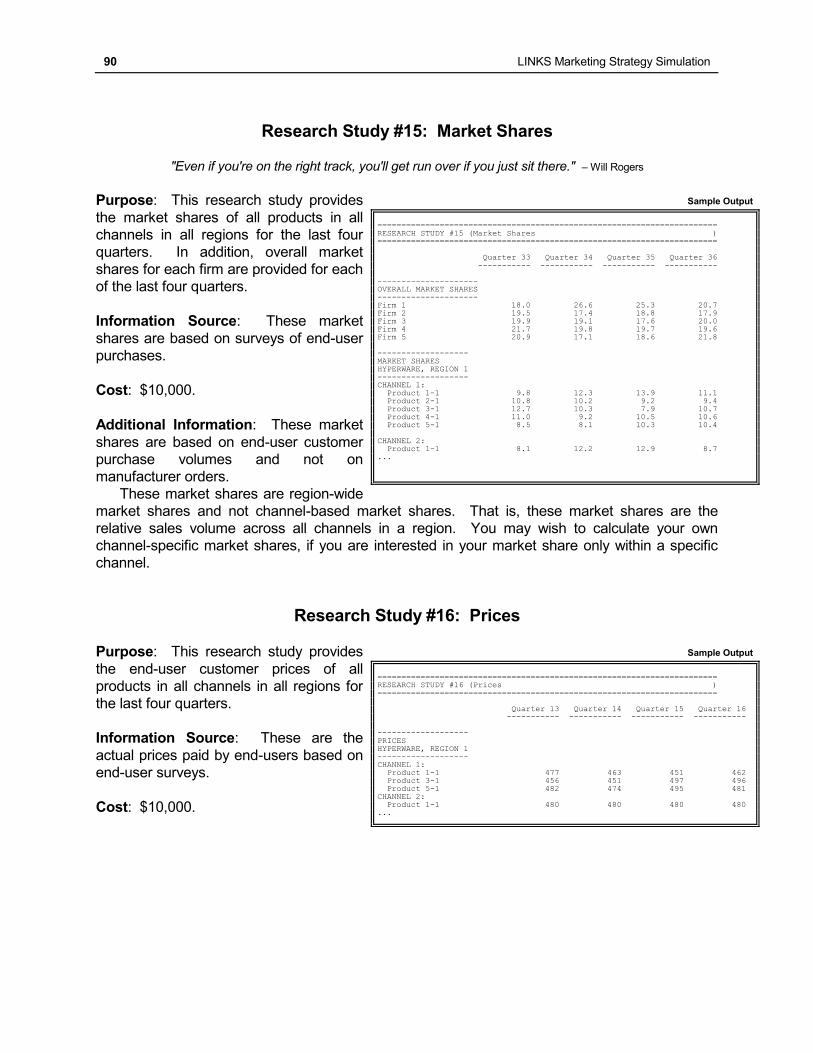
90 LINKS Marketing Strategy Simulation
Research Study #15: Market Shares
"Even if you're on the right track, you'll get run over if you just sit there." – Will Rogers
Purpose: This research study provides
the market shares of all products in all
channels in all regions for the last four
quarters. In addition, overall market
shares for each firm are provided for each
of the last four quarters.
Information Source: These market
shares are based on surveys of end-user
purchases.
Cost: $10,000.
Additional Information: These market
shares are based on end-user customer
purchase volumes and not on
manufacturer orders.
These market shares are region-wide
market shares and not channel-based market shares. That is, these market shares are the
relative sales volume across all channels in a region. You may wish to calculate your own
channel-specific market shares, if you are interested in your market share only within a specific
channel.
Research Study #16: Prices
Purpose: This research study provides
the end-user customer prices of all
products in all channels in all regions for
the last four quarters.
Information Source: These are the
actual prices paid by end-users based on
end-user surveys.
Cost: $10,000.
Sample Output
======================================================================= RESEARCH STUDY #15 (Market Shares ) ======================================================================= Quarter 33 Quarter 34 Quarter 35 Quarter 36 ----------- ----------- ----------- ----------- --------------------- OVERALL MARKET SHARES --------------------- Firm 1 18.0 26.6 25.3 20.7 Firm 2 19.5 17.4 18.8 17.9 Firm 3 19.9 19.1 17.6 20.0 Firm 4 21.7 19.8 19.7 19.6 Firm 5 20.9 17.1 18.6 21.8
------------------- MARKET SHARES HYPERWARE, REGION 1 ------------------- CHANNEL 1: Product 1-1 9.8 12.3 13.9 11.1 Product 2-1 10.8 10.2 9.2 9.4 Product 3-1 12.7 10.3 7.9 10.7 Product 4-1 11.0 9.2 10.5 10.6 Product 5-1 8.5 8.1 10.3 10.4 CHANNEL 2: Product 1-1 8.1 12.2 12.9 8.7 ...
Sample Output
======================================================================= RESEARCH STUDY #16 (Prices ) ======================================================================= Quarter 13 Quarter 14 Quarter 15 Quarter 16 ----------- ----------- ----------- ----------- ------------------- PRICES HYPERWARE, REGION 1 ------------------- CHANNEL 1: Product 1-1 477 463 451 462 Product 3-1 456 451 497 496 Product 5-1 482 474 495 481 CHANNEL 2:
Product 1-1 480 480 480 480 ...
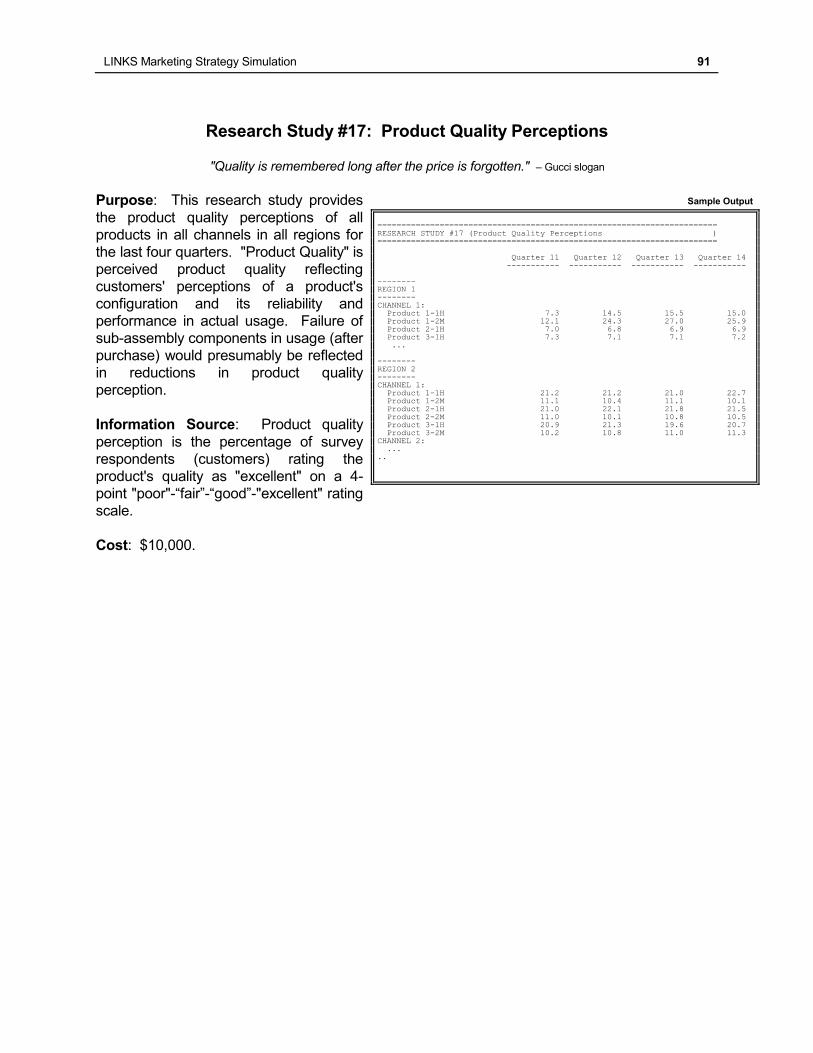
LINKS Marketing Strategy Simulation 91
Research Study #17: Product Quality Perceptions
"Quality is remembered long after the price is forgotten." – Gucci slogan
Purpose: This research study provides
the product quality perceptions of all
products in all channels in all regions for
the last four quarters. "Product Quality" is
perceived product quality reflecting
customers' perceptions of a product's
configuration and its reliability and
performance in actual usage. Failure of
sub-assembly components in usage (after
purchase) would presumably be reflected
in reductions in product quality
perception.
Information Source: Product quality
perception is the percentage of survey
respondents (customers) rating the
product's quality as "excellent" on a 4-
point "poor"-“fair”-“good”-"excellent" rating
scale.
Cost: $10,000.
Sample Output
======================================================================= RESEARCH STUDY #17 (Product Quality Perceptions ) ======================================================================= Quarter 11 Quarter 12 Quarter 13 Quarter 14 ----------- ----------- ----------- ----------- -------- REGION 1 -------- CHANNEL 1: Product 1-1H 7.3 14.5 15.5 15.0 Product 1-2M 12.1 24.3 27.0 25.9 Product 2-1H 7.0 6.8 6.9 6.9 Product 3-1H 7.3 7.1 7.1 7.2
... -------- REGION 2 -------- CHANNEL 1: Product 1-1H 21.2 21.2 21.0 22.7 Product 1-2M 11.1 10.4 11.1 10.1 Product 2-1H 21.0 22.1 21.8 21.5 Product 2-2M 11.0 10.1 10.8 10.5 Product 3-1H 20.9 21.3 19.6 20.7 Product 3-2M 10.2 10.8 11.0 11.3 CHANNEL 2: ... ..
92 LINKS Marketing Strategy Simulation
Research Study #18: Service Quality Perceptions
Purpose: This research study provides the service quality perceptions of all products in all
channels in all regions for the last three quarters. This research study plots current-quarter
service quality perception against last-quarter's call center usage rates using data from the last
three quarters for all products in your industry.6 Separate charts are provided for each set-top box
category in each region.
"Service Quality" is perceived service quality reflecting customers' perceptions of the service
quality associated with a product. Service quality derives from customers’ experiences with each
firm's regional call centers. High usage rates of call centers presumably leads to lower service
levels, since customers must queue for service and be served by more harried CSRs. Call center
usage rate (lower is better from the customer's viewpoint), service center salary (higher salary
attracts, retains, and motivates more-able service center personnel), and turnover (training of new
CSRs takes time and energy away from providing customer service) all influence service quality
perception.
Information Source: Service quality perception is based on a customer survey of current users.
Service quality perception is the percentage of survey respondents rating the service's quality as
"excellent" on a 4-point "poor"-“fair”-“good”-"excellent" rating scale. CSR usage rates are based
on information sharing and pooling agreements among all firms in the set-top box industry. This
information sharing and pooling agreement is administered by the Set-Top Box Industry Trade
Association.
Cost: $10,000.
Additional Information: The charts in this research study report results only for insourced call
centers. Outsourced call center data are excluded from this report since "CSR usage rate" for
outsourcing is not directly comparable to insourcing.
6 The historical time span for Research Study #18 is the current and preceding three quarters. But, only
three quarters of historical data pairs are available for analysis since current-quarter service quality
perception is plotted against last-quarter call center usage rate. For example, in Quarter #10:
The first of the three quarter’s of available historical data are Q#10 service quality perceptions vs. Q#9
call center usage rates.
The second of the three quarter’s of available historical data are Q#9 service quality perceptions vs.
Q#8 call center usage rates.
The third of the three quarter’s of available historical data are Q#8 service quality perceptions vs. Q#7
call center usage rates.
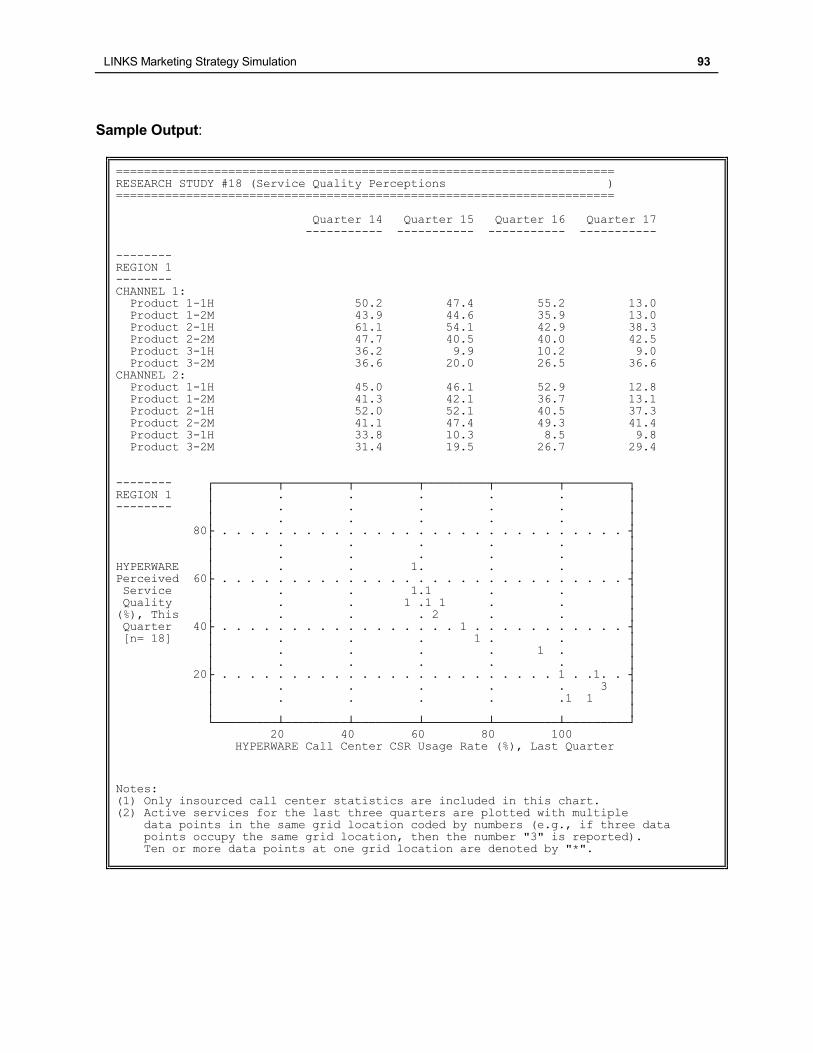
LINKS Marketing Strategy Simulation 93
Sample Output:
======================================================================= RESEARCH STUDY #18 (Service Quality Perceptions ) ======================================================================= Quarter 14 Quarter 15 Quarter 16 Quarter 17 ----------- ----------- ----------- ----------- -------- REGION 1 -------- CHANNEL 1: Product 1-1H 50.2 47.4 55.2 13.0 Product 1-2M 43.9 44.6 35.9 13.0 Product 2-1H 61.1 54.1 42.9 38.3 Product 2-2M 47.7 40.5 40.0 42.5
Product 3-1H 36.2 9.9 10.2 9.0 Product 3-2M 36.6 20.0 26.5 36.6 CHANNEL 2: Product 1-1H 45.0 46.1 52.9 12.8 Product 1-2M 41.3 42.1 36.7 13.1 Product 2-1H 52.0 52.1 40.5 37.3 Product 2-2M 41.1 47.4 49.3 41.4 Product 3-1H 33.8 10.3 8.5 9.8 Product 3-2M 31.4 19.5 26.7 29.4 -------- ┌─────────┬─────────┬─────────┬─────────┬─────────┬─────────┐ REGION 1 │ . . . . . │ -------- │ . . . . . │ │ . . . . . │ 80├ . . . . . . . . . . . . . . . . . . . . . . . . . . . . . ┤ │ . . . . . │ │ . . . . . │ HYPERWARE │ . . 1. . . │
Perceived 60├ . . . . . . . . . . . . . . . . . . . . . . . . . . . . . ┤ Service │ . . 1.1 . . │ Quality │ . . 1 .1 1 . . │ (%), This │ . . . 2 . . │ Quarter 40├ . . . . . . . . . . . . . . . . . 1 . . . . . . . . . . . ┤ [n= 18] │ . . . 1 . . │ │ . . . . 1 . │ │ . . . . . │ 20├ . . . . . . . . . . . . . . . . . . . . . . . . 1 . .1. . ┤ │ . . . . . 3 │ │ . . . . .1 1 │ │ │ └─────────┴─────────┴─────────┴─────────┴─────────┴─────────┘ 20 40 60 80 100 HYPERWARE Call Center CSR Usage Rate (%), Last Quarter
Notes:
(1) Only insourced call center statistics are included in this chart. (2) Active services for the last three quarters are plotted with multiple data points in the same grid location coded by numbers (e.g., if three data points occupy the same grid location, then the number "3" is reported). Ten or more data points at one grid location are denoted by "*".
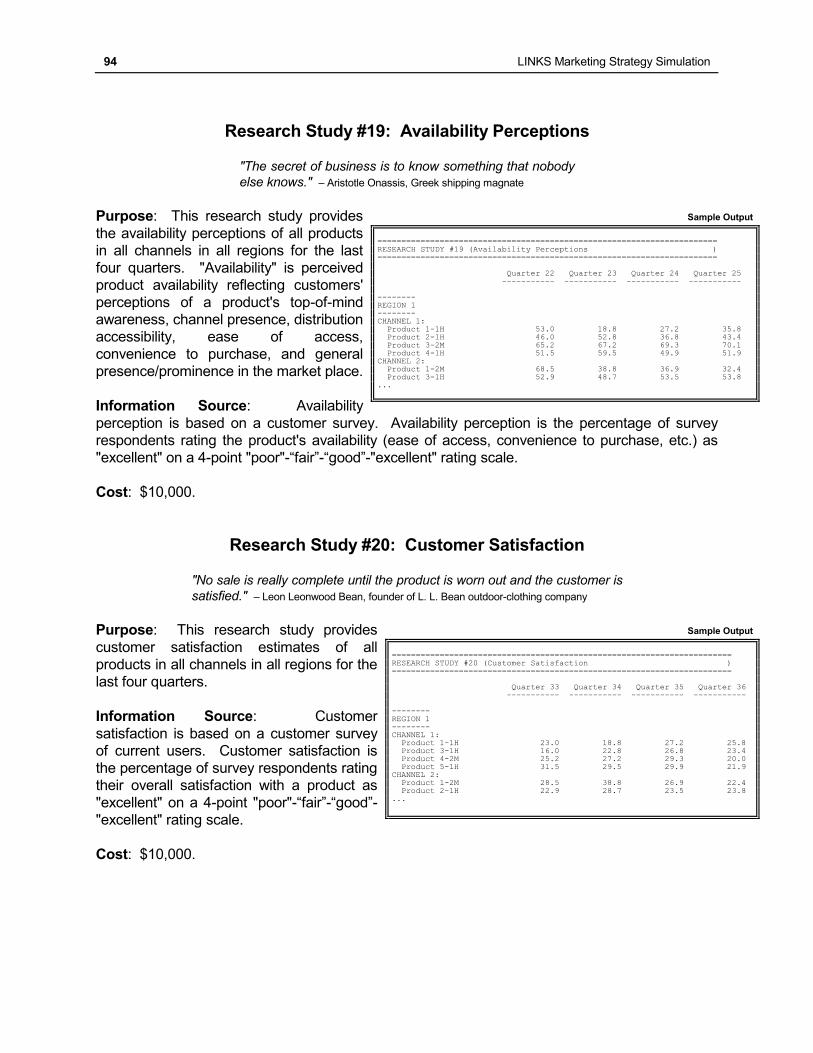
94 LINKS Marketing Strategy Simulation
Research Study #19: Availability Perceptions
"The secret of business is to know something that nobody
else knows." – Aristotle Onassis, Greek shipping magnate
Purpose: This research study provides
the availability perceptions of all products
in all channels in all regions for the last
four quarters. "Availability" is perceived
product availability reflecting customers'
perceptions of a product's top-of-mind
awareness, channel presence, distribution
accessibility, ease of access,
convenience to purchase, and general
presence/prominence in the market place.
Information Source: Availability
perception is based on a customer survey. Availability perception is the percentage of survey
respondents rating the product's availability (ease of access, convenience to purchase, etc.) as
"excellent" on a 4-point "poor"-“fair”-“good”-"excellent" rating scale.
Cost: $10,000.
Research Study #20: Customer Satisfaction
"No sale is really complete until the product is worn out and the customer is
satisfied." – Leon Leonwood Bean, founder of L. L. Bean outdoor-clothing company
Purpose: This research study provides
customer satisfaction estimates of all
products in all channels in all regions for the
last four quarters.
Information Source: Customer
satisfaction is based on a customer survey
of current users. Customer satisfaction is
the percentage of survey respondents rating
their overall satisfaction with a product as
"excellent" on a 4-point "poor"-“fair”-“good”-
"excellent" rating scale.
Cost: $10,000.
Sample Output
======================================================================= RESEARCH STUDY #19 (Availability Perceptions ) ======================================================================= Quarter 22 Quarter 23 Quarter 24 Quarter 25 ----------- ----------- ----------- ----------- -------- REGION 1 -------- CHANNEL 1: Product 1-1H 53.0 18.8 27.2 35.8 Product 2-1H 46.0 52.8 36.8 43.4
Product 3-2M 65.2 67.2 69.3 70.1 Product 4-1H 51.5 59.5 49.9 51.9 CHANNEL 2: Product 1-2M 68.5 38.8 36.9 32.4 Product 3-1H 52.9 48.7 53.5 53.8 ...
Sample Output
======================================================================= RESEARCH STUDY #20 (Customer Satisfaction ) ======================================================================= Quarter 33 Quarter 34 Quarter 35 Quarter 36 ----------- ----------- ----------- ----------- -------- REGION 1 -------- CHANNEL 1: Product 1-1H 23.0 18.8 27.2 25.8 Product 3-1H 16.0 22.8 26.8 23.4 Product 4-2M 25.2 27.2 29.3 20.0 Product 5-1H 31.5 29.5 29.9 21.9 CHANNEL 2: Product 1-2M 28.5 38.8 26.9 22.4 Product 2-1H 22.9 28.7 23.5 23.8 ...
LINKS Marketing Strategy Simulation 95
Research Study #21: Configuration Analysis - Specific Product
Purpose: This research study provides the current configuration of a specific set-top box product.
Information Source: These research study results are based on reverse engineering efforts by
your research supplier.
Cost: $10,000 per configuration analysis.
Limitations: This research study may only be executed for products that are actively sold in at
least one region.
Additional Information: Research Study #21 reports the current configuration of a specific set-
top box product for competitors' products only. You already know your own products'
configurations (they're reported at the bottom of the Product P&L Statements). If you erroneously
request a configuration analysis of your own product, no results are reported.
Other configuration analysis research studies include Research Study #3 ("Benchmarking -
Product Development") and Research Study #22 ("Configuration Analysis - Reconfigurations").
Research Study #22: Configuration Analysis - Reconfigurations
"Always find ways to improve. Keep raising the bar, for
the industry and for yourself." – Michael Dell
Purpose: This research study provides the configurations of all set-top box products that have
been reconfigured this quarter.
Information Source: These research study results are based on reverse engineering efforts by
your research supplier.
Cost: $5,000 plus $10,000 per product that is reconfigured this quarter.
Additional Information: This research study does not provide any information about products
that were reconfigured prior to this quarter. See Research Study #3 ("Benchmarking - Product
Development") or Research Study #21 ("Configuration Analysis - Specific Product") for research
studies that provide configuration information about all or specific products, regardless of when
they were reconfigured.
Research Study #23: Concept Test
Purpose: This research study provides concept test scores for a range of set-top box
configurations "around" a designated configuration in a specified channel and region combination.
This research study may be useful after other research studies have been conducted (such as
Conjoint Analysis) to search for preferred concepts "around" a specified configuration.
Information Source: This research study is based on end-user customer surveys.
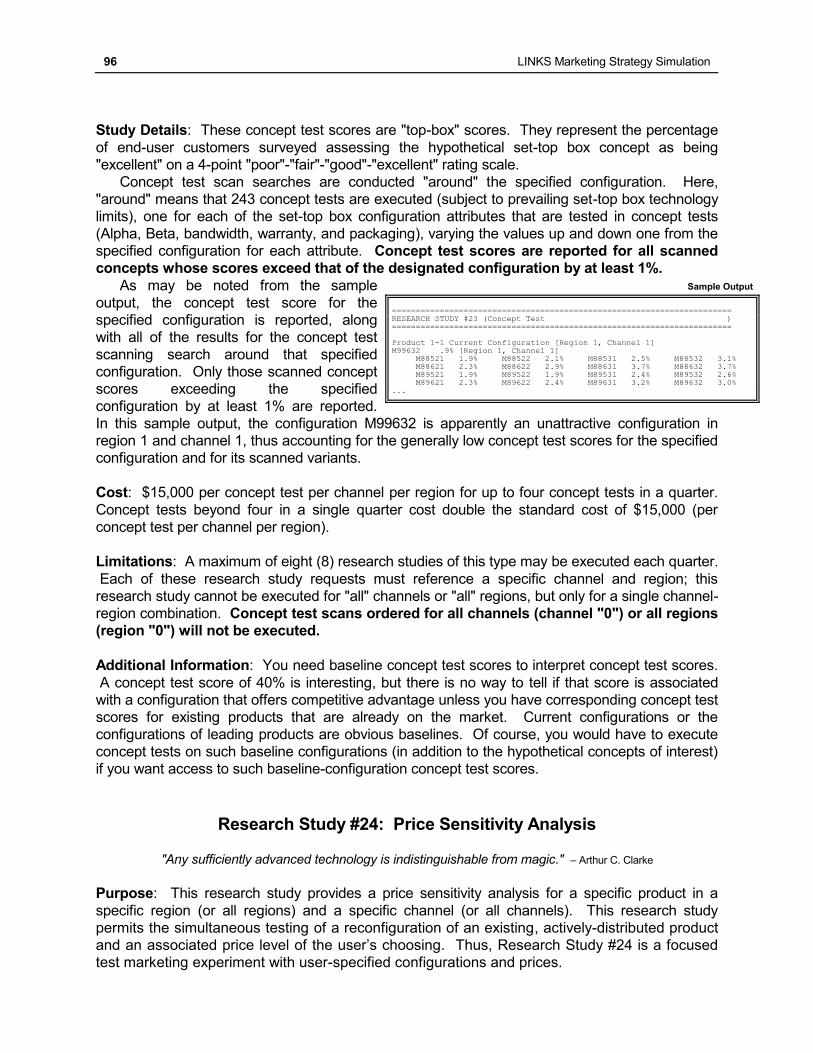
96 LINKS Marketing Strategy Simulation
Study Details: These concept test scores are "top-box" scores. They represent the percentage
of end-user customers surveyed assessing the hypothetical set-top box concept as being
"excellent" on a 4-point "poor"-"fair"-"good"-"excellent" rating scale.
Concept test scan searches are conducted "around" the specified configuration. Here,
"around" means that 243 concept tests are executed (subject to prevailing set-top box technology
limits), one for each of the set-top box configuration attributes that are tested in concept tests
(Alpha, Beta, bandwidth, warranty, and packaging), varying the values up and down one from the
specified configuration for each attribute. Concept test scores are reported for all scanned
concepts whose scores exceed that of the designated configuration by at least 1%.
As may be noted from the sample
output, the concept test score for the
specified configuration is reported, along
with all of the results for the concept test
scanning search around that specified
configuration. Only those scanned concept
scores exceeding the specified
configuration by at least 1% are reported.
In this sample output, the configuration M99632 is apparently an unattractive configuration in
region 1 and channel 1, thus accounting for the generally low concept test scores for the specified
configuration and for its scanned variants.
Cost: $15,000 per concept test per channel per region for up to four concept tests in a quarter.
Concept tests beyond four in a single quarter cost double the standard cost of $15,000 (per
concept test per channel per region).
Limitations: A maximum of eight (8) research studies of this type may be executed each quarter.
Each of these research study requests must reference a specific channel and region; this
research study cannot be executed for "all" channels or "all" regions, but only for a single channel-
region combination. Concept test scans ordered for all channels (channel "0") or all regions
(region "0") will not be executed.
Additional Information: You need baseline concept test scores to interpret concept test scores.
A concept test score of 40% is interesting, but there is no way to tell if that score is associated
with a configuration that offers competitive advantage unless you have corresponding concept test
scores for existing products that are already on the market. Current configurations or the
configurations of leading products are obvious baselines. Of course, you would have to execute
concept tests on such baseline configurations (in addition to the hypothetical concepts of interest)
if you want access to such baseline-configuration concept test scores.
Research Study #24: Price Sensitivity Analysis
"Any sufficiently advanced technology is indistinguishable from magic." – Arthur C. Clarke
Purpose: This research study provides a price sensitivity analysis for a specific product in a
specific region (or all regions) and a specific channel (or all channels). This research study
permits the simultaneous testing of a reconfiguration of an existing, actively-distributed product
and an associated price level of the user’s choosing. Thus, Research Study #24 is a focused
test marketing experiment with user-specified configurations and prices.
Sample Output
======================================================================= RESEARCH STUDY #23 (Concept Test ) =======================================================================
Product 1-1 Current Configuration [Region 1, Channel 1] M99632 .9% [Region 1, Channel 1] M88521 1.9% M88522 2.1% M88531 2.5% M88532 3.1% M88621 2.3% M88622 2.9% M88631 3.7% M88632 3.7% M89521 1.9% M89522 1.9% M89531 2.4% M89532 2.6% M89621 2.3% M89622 2.4% M89631 3.2% M89632 3.0% ...
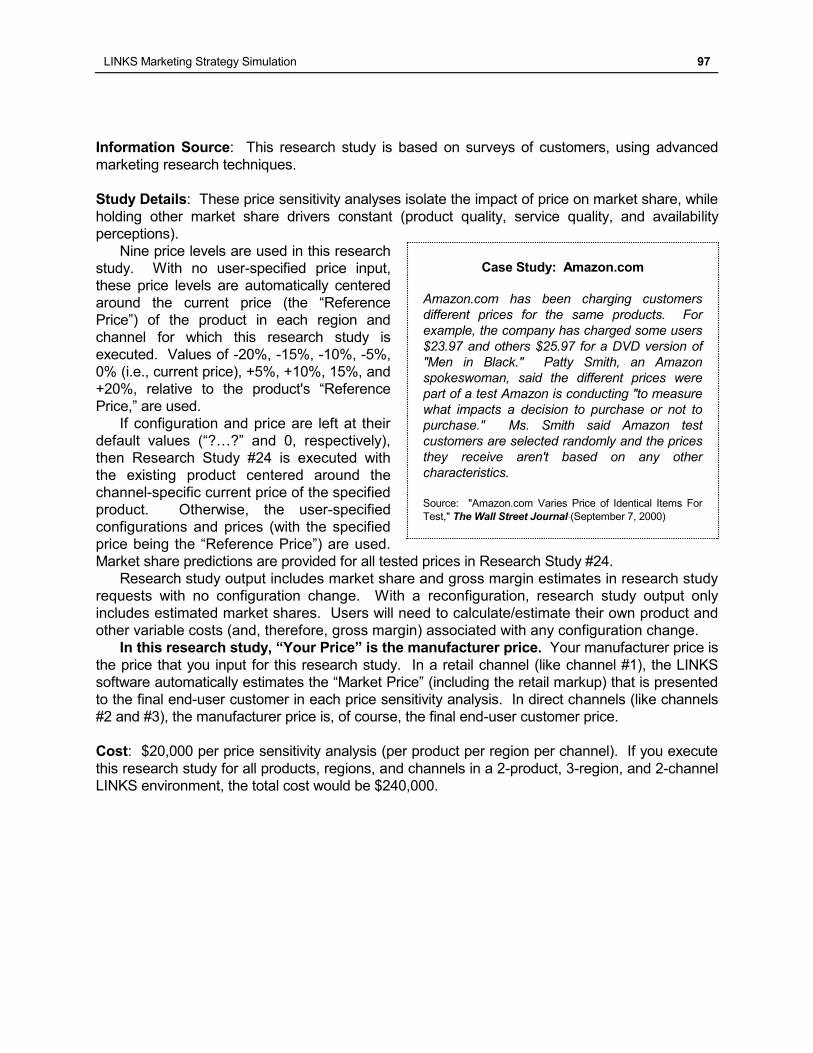
LINKS Marketing Strategy Simulation 97
Information Source: This research study is based on surveys of customers, using advanced
marketing research techniques.
Study Details: These price sensitivity analyses isolate the impact of price on market share, while
holding other market share drivers constant (product quality, service quality, and availability
perceptions).
Nine price levels are used in this research
study. With no user-specified price input,
these price levels are automatically centered
around the current price (the “Reference
Price”) of the product in each region and
channel for which this research study is
executed. Values of -20%, -15%, -10%, -5%,
0% (i.e., current price), +5%, +10%, 15%, and
+20%, relative to the product's “Reference
Price,” are used.
If configuration and price are left at their
default values (“?…?” and 0, respectively),
then Research Study #24 is executed with
the existing product centered around the
channel-specific current price of the specified
product. Otherwise, the user-specified
configurations and prices (with the specified
price being the “Reference Price”) are used.
Market share predictions are provided for all tested prices in Research Study #24.
Research study output includes market share and gross margin estimates in research study
requests with no configuration change. With a reconfiguration, research study output only
includes estimated market shares. Users will need to calculate/estimate their own product and
other variable costs (and, therefore, gross margin) associated with any configuration change.
In this research study, “Your Price” is the manufacturer price. Your manufacturer price is
the price that you input for this research study. In a retail channel (like channel #1), the LINKS
software automatically estimates the “Market Price” (including the retail markup) that is presented
to the final end-user customer in each price sensitivity analysis. In direct channels (like channels
#2 and #3), the manufacturer price is, of course, the final end-user customer price.
Cost: $20,000 per price sensitivity analysis (per product per region per channel). If you execute
this research study for all products, regions, and channels in a 2-product, 3-region, and 2-channel
LINKS environment, the total cost would be $240,000.
Case Study: Amazon.com
Amazon.com has been charging customers
different prices for the same products. For
example, the company has charged some users
$23.97 and others $25.97 for a DVD version of
"Men in Black." Patty Smith, an Amazon
spokeswoman, said the different prices were
part of a test Amazon is conducting "to measure
what impacts a decision to purchase or not to
purchase." Ms. Smith said Amazon test
customers are selected randomly and the prices
they receive aren't based on any other
characteristics.
Source: "Amazon.com Varies Price of Identical Items For
Test," The Wall Street Journal (September 7, 2000)
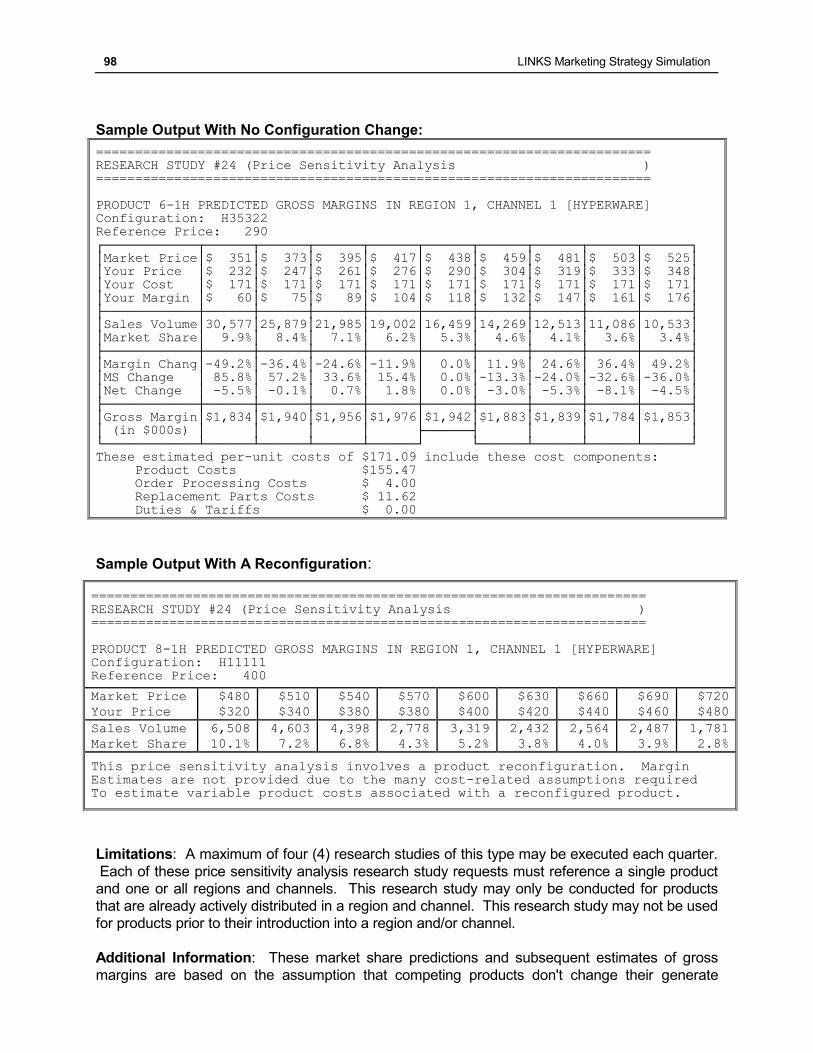
98 LINKS Marketing Strategy Simulation
Sample Output With No Configuration Change:
======================================================================= RESEARCH STUDY #24 (Price Sensitivity Analysis ) ======================================================================= PRODUCT 6-1H PREDICTED GROSS MARGINS IN REGION 1, CHANNEL 1 [HYPERWARE] Configuration: H35322 Reference Price: 290 ┌────────────┬──────┬──────┬──────┬──────┬──────┬──────┬──────┬──────┬──────┐ │Market Price│$ 351│$ 373│$ 395│$ 417│$ 438│$ 459│$ 481│$ 503│$ 525│ │Your Price │$ 232│$ 247│$ 261│$ 276│$ 290│$ 304│$ 319│$ 333│$ 348│ │Your Cost │$ 171│$ 171│$ 171│$ 171│$ 171│$ 171│$ 171│$ 171│$ 171│ │Your Margin │$ 60│$ 75│$ 89│$ 104│$ 118│$ 132│$ 147│$ 161│$ 176│ ├────────────┼──────┼──────┼──────┼──────┼──────┼──────┼──────┼──────┼──────┤ │Sales Volume│30,577│25,879│21,985│19,002│16,459│14,269│12,513│11,086│10,533│ │Market Share│ 9.9%│ 8.4%│ 7.1%│ 6.2%│ 5.3%│ 4.6%│ 4.1%│ 3.6%│ 3.4%│
├────────────┼──────┼──────┼──────┼──────┼──────┼──────┼──────┼──────┼──────┤ │Margin Chang│-49.2%│-36.4%│-24.6%│-11.9%│ 0.0%│ 11.9%│ 24.6%│ 36.4%│ 49.2%│ │MS Change │ 85.8%│ 57.2%│ 33.6%│ 15.4%│ 0.0%│-13.3%│-24.0%│-32.6%│-36.0%│ │Net Change │ -5.5%│ -0.1%│ 0.7%│ 1.8%│ 0.0%│ -3.0%│ -5.3%│ -8.1%│ -4.5%│ ├────────────┼──────┼──────┼──────┼──────┼──────┼──────┼──────┼──────┼──────┤ │Gross Margin│$1,834│$1,940│$1,956│$1,976│$1,942│$1,883│$1,839│$1,784│$1,853│ │ (in $000s) │ │ │ │ ├──────┤ │ │ │ │ └────────────┴──────┴──────┴──────┴──────┘ └──────┴──────┴──────┴──────┘ These estimated per-unit costs of $171.09 include these cost components: Product Costs $155.47 Order Processing Costs $ 4.00 Replacement Parts Costs $ 11.62 Duties & Tariffs $ 0.00
Sample Output With A Reconfiguration:
======================================================================= RESEARCH STUDY #24 (Price Sensitivity Analysis ) ======================================================================= PRODUCT 8-1H PREDICTED GROSS MARGINS IN REGION 1, CHANNEL 1 [HYPERWARE] Configuration: H11111 Reference Price: 400
Market Price
Your Price
$480
$320
$510
$340
$540
$380
$570
$380
$600
$400
$630
$420
$660
$440
$690
$460
$720
$480
Sales Volume
Market Share
6,508
10.1%
4,603
7.2%
4,398
6.8%
2,778
4.3%
3,319
5.2%
2,432
3.8%
2,564
4.0%
2,487
3.9%
1,781
2.8%
This price sensitivity analysis involves a product reconfiguration. Margin Estimates are not provided due to the many cost-related assumptions required To estimate variable product costs associated with a reconfigured product.
Limitations: A maximum of four (4) research studies of this type may be executed each quarter.
Each of these price sensitivity analysis research study requests must reference a single product
and one or all regions and channels. This research study may only be conducted for products
that are already actively distributed in a region and channel. This research study may not be used
for products prior to their introduction into a region and/or channel.
Additional Information: These market share predictions and subsequent estimates of gross
margins are based on the assumption that competing products don't change their generate
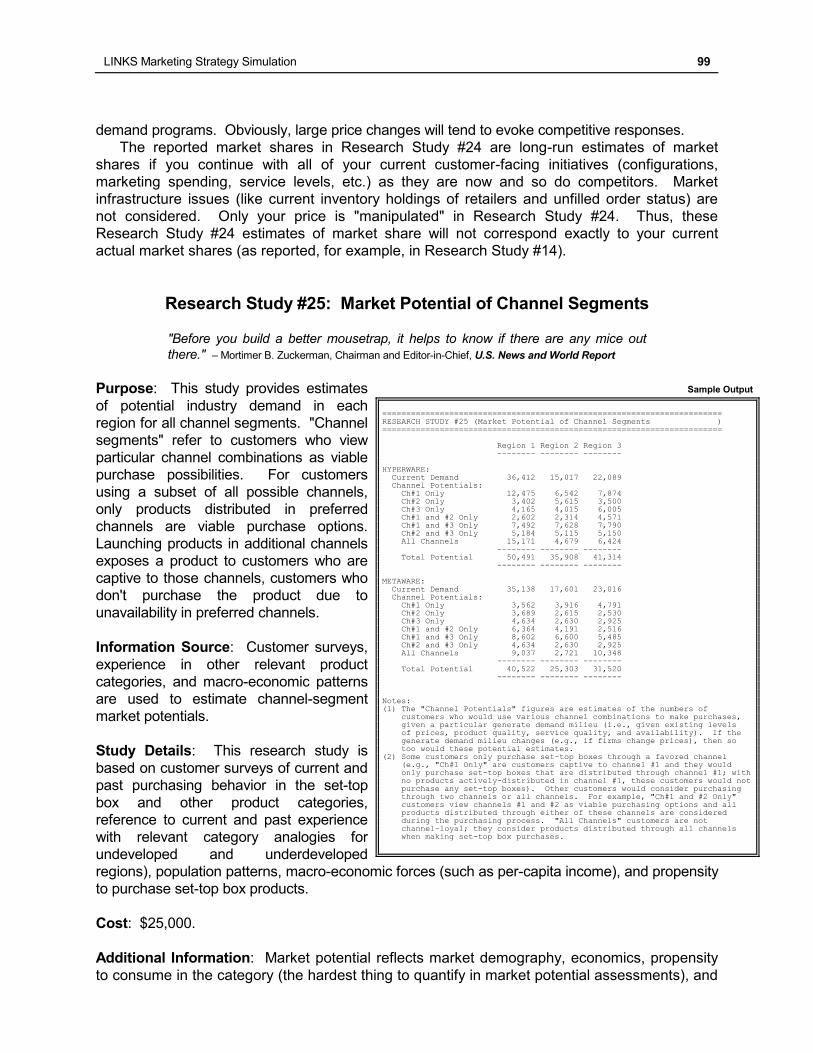
LINKS Marketing Strategy Simulation 99
demand programs. Obviously, large price changes will tend to evoke competitive responses.
The reported market shares in Research Study #24 are long-run estimates of market
shares if you continue with all of your current customer-facing initiatives (configurations,
marketing spending, service levels, etc.) as they are now and so do competitors. Market
infrastructure issues (like current inventory holdings of retailers and unfilled order status) are
not considered. Only your price is "manipulated" in Research Study #24. Thus, these
Research Study #24 estimates of market share will not correspond exactly to your current
actual market shares (as reported, for example, in Research Study #14).
Research Study #25: Market Potential of Channel Segments
"Before you build a better mousetrap, it helps to know if there are any mice out
there." – Mortimer B. Zuckerman, Chairman and Editor-in-Chief, U.S. News and World Report
Purpose: This study provides estimates
of potential industry demand in each
region for all channel segments. "Channel
segments" refer to customers who view
particular channel combinations as viable
purchase possibilities. For customers
using a subset of all possible channels,
only products distributed in preferred
channels are viable purchase options.
Launching products in additional channels
exposes a product to customers who are
captive to those channels, customers who
don't purchase the product due to
unavailability in preferred channels.
Information Source: Customer surveys,
experience in other relevant product
categories, and macro-economic patterns
are used to estimate channel-segment
market potentials.
Study Details: This research study is
based on customer surveys of current and
past purchasing behavior in the set-top
box and other product categories,
reference to current and past experience
with relevant category analogies for
undeveloped and underdeveloped
regions), population patterns, macro-economic forces (such as per-capita income), and propensity
to purchase set-top box products.
Cost: $25,000.
Additional Information: Market potential reflects market demography, economics, propensity
to consume in the category (the hardest thing to quantify in market potential assessments), and
Sample Output
======================================================================= RESEARCH STUDY #25 (Market Potential of Channel Segments ) ======================================================================= Region 1 Region 2 Region 3 -------- -------- -------- HYPERWARE: Current Demand 36,412 15,017 22,089 Channel Potentials: Ch#1 Only 12,475 6,542 7,874 Ch#2 Only 3,402 5,615 3,500 Ch#3 Only 4,165 4,015 6,005 Ch#1 and #2 Only 2,602 2,314 4,571 Ch#1 and #3 Only 7,492 7,628 7,790 Ch#2 and #3 Only 5,184 5,115 5,150 All Channels 15,171 4,679 6,424 -------- -------- -------- Total Potential 50,491 35,908 41,314 -------- -------- --------
METAWARE: Current Demand 35,138 17,601 23,016 Channel Potentials: Ch#1 Only 3,562 3,916 4,791 Ch#2 Only 3,689 2,615 2,530 Ch#3 Only 4,634 2,630 2,925 Ch#1 and #2 Only 6,364 4,191 2,516 Ch#1 and #3 Only 8,602 6,600 5,485 Ch#2 and #3 Only 4,634 2,630 2,925 All Channels 9,037 2,721 10,348 -------- -------- -------- Total Potential 40,522 25,303 31,520 -------- -------- -------- Notes: (1) The "Channel Potentials" figures are estimates of the numbers of customers who would use various channel combinations to make purchases, given a particular generate demand milieu (i.e., given existing levels of prices, product quality, service quality, and availability). If the generate demand milieu changes (e.g., if firms change prices), then so too would these potential estimates. (2) Some customers only purchase set-top boxes through a favored channel (e.g., "Ch#1 Only" are customers captive to channel #1 and they would only purchase set-top boxes that are distributed through channel #1; with no products actively-distributed in channel #1, these customers would not purchase any set-top boxes). Other customers would consider purchasing through two channels or all channels. For example, "Ch#1 and #2 Only"
customers view channels #1 and #2 as viable purchasing options and all products distributed through either of these channels are considered during the purchasing process. "All Channels" customers are not channel-loyal; they consider products distributed through all channels when making set-top box purchases.
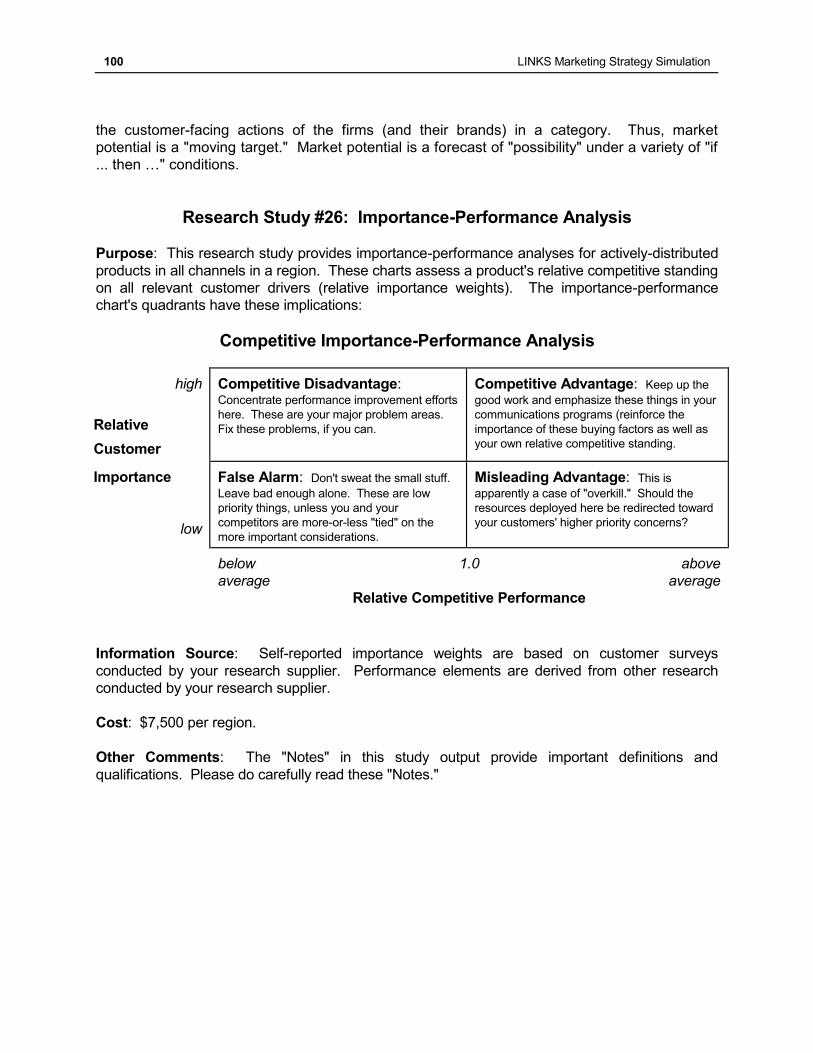
100 LINKS Marketing Strategy Simulation
the customer-facing actions of the firms (and their brands) in a category. Thus, market
potential is a "moving target." Market potential is a forecast of "possibility" under a variety of "if
... then …" conditions.
Research Study #26: Importance-Performance Analysis
Purpose: This research study provides importance-performance analyses for actively-distributed
products in all channels in a region. These charts assess a product's relative competitive standing
on all relevant customer drivers (relative importance weights). The importance-performance
chart's quadrants have these implications:
Competitive Importance-Performance Analysis
high
Relative
Customer
Competitive Disadvantage: Concentrate performance improvement efforts
here. These are your major problem areas.
Fix these problems, if you can.
Competitive Advantage: Keep up the
good work and emphasize these things in your
communications programs (reinforce the
importance of these buying factors as well as
your own relative competitive standing.
Importance
low
False Alarm: Don't sweat the small stuff.
Leave bad enough alone. These are low
priority things, unless you and your
competitors are more-or-less "tied" on the
more important considerations.
Misleading Advantage: This is
apparently a case of "overkill." Should the
resources deployed here be redirected toward
your customers' higher priority concerns?
below 1.0 above
average average Relative Competitive Performance
Information Source: Self-reported importance weights are based on customer surveys
conducted by your research supplier. Performance elements are derived from other research
conducted by your research supplier.
Cost: $7,500 per region.
Other Comments: The "Notes" in this study output provide important definitions and
qualifications. Please do carefully read these "Notes."
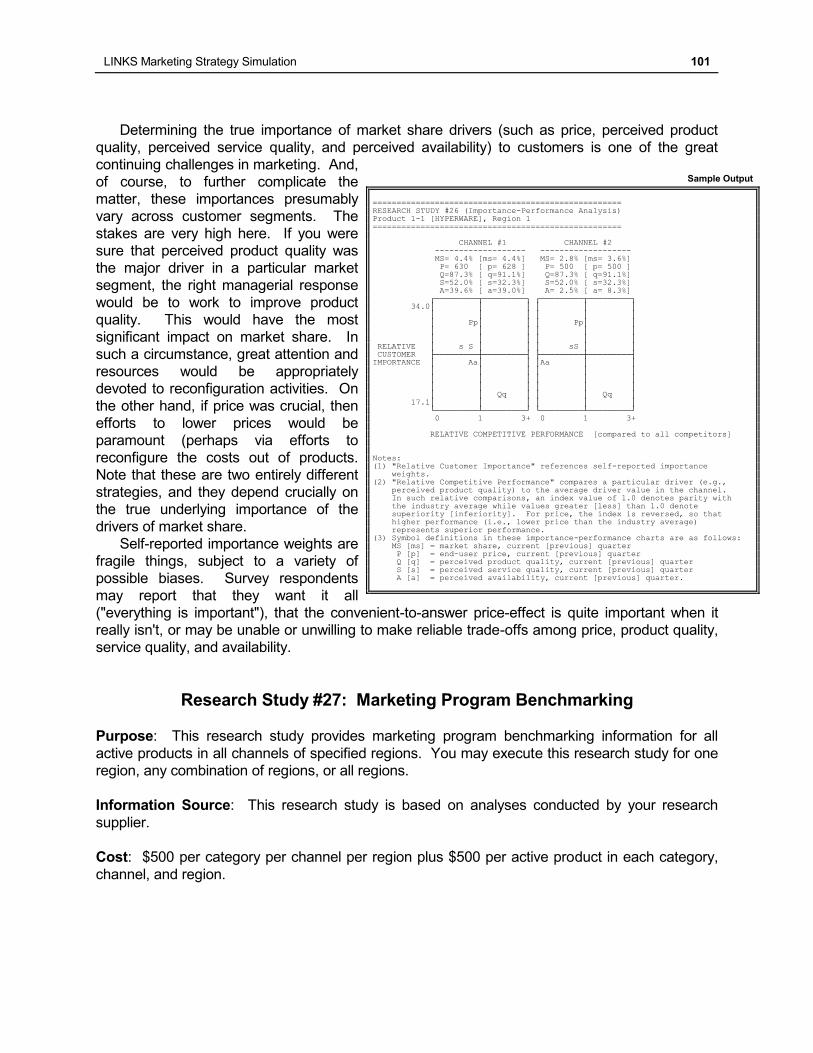
LINKS Marketing Strategy Simulation 101
Determining the true importance of market share drivers (such as price, perceived product
quality, perceived service quality, and perceived availability) to customers is one of the great
continuing challenges in marketing. And,
of course, to further complicate the
matter, these importances presumably
vary across customer segments. The
stakes are very high here. If you were
sure that perceived product quality was
the major driver in a particular market
segment, the right managerial response
would be to work to improve product
quality. This would have the most
significant impact on market share. In
such a circumstance, great attention and
resources would be appropriately
devoted to reconfiguration activities. On
the other hand, if price was crucial, then
efforts to lower prices would be
paramount (perhaps via efforts to
reconfigure the costs out of products.
Note that these are two entirely different
strategies, and they depend crucially on
the true underlying importance of the
drivers of market share.
Self-reported importance weights are
fragile things, subject to a variety of
possible biases. Survey respondents
may report that they want it all
("everything is important"), that the convenient-to-answer price-effect is quite important when it
really isn't, or may be unable or unwilling to make reliable trade-offs among price, product quality,
service quality, and availability.
Research Study #27: Marketing Program Benchmarking
Purpose: This research study provides marketing program benchmarking information for all
active products in all channels of specified regions. You may execute this research study for one
region, any combination of regions, or all regions.
Information Source: This research study is based on analyses conducted by your research
supplier.
Cost: $500 per category per channel per region plus $500 per active product in each category,
channel, and region.
Sample Output
==================================================== RESEARCH STUDY #26 (Importance-Performance Analysis) Product 1-1 [HYPERWARE], Region 1 ==================================================== CHANNEL #1 CHANNEL #2 ------------------- ------------------- MS= 4.4% [ms= 4.4%] MS= 2.8% [ms= 3.6%] P= 630 [ p= 628 ] P= 500 [ p= 500 ] Q=87.3% [ q=91.1%] Q=87.3% [ q=91.1%] S=52.0% [ s=32.3%] S=52.0% [ s=32.3%] A=39.6% [ a=39.0%] A= 2.5% [ a= 8.3%] ┌─────────┬─────────┐ ┌─────────┬─────────┐ 34.0│ │ │ │ │ │ │ │ │ │ │ │ │ Pp│ │ │ Pp│ │ │ │ │ │ │ │ │ │ │ │ │ │
RELATIVE │ s S │ │ │ sS │ │ CUSTOMER ├─────────┼─────────┤ ├─────────┼─────────┤ IMPORTANCE │ Aa│ │ │Aa │ │ │ │ │ │ │ │ │ │ │ │ │ │ │ │ │ │ │ │ │ │ Qq │ │ │ Qq │ 17.1│ │ │ │ │ │ └─────────┴─────────┘ └─────────┴─────────┘ 0 1 3+ 0 1 3+ RELATIVE COMPETITIVE PERFORMANCE [compared to all competitors] Notes: (1) "Relative Customer Importance" references self-reported importance weights. (2) "Relative Competitive Performance" compares a particular driver (e.g., perceived product quality) to the average driver value in the channel. In such relative comparisons, an index value of 1.0 denotes parity with the industry average while values greater [less] than 1.0 denote superiority [inferiority]. For price, the index is reversed, so that higher performance (i.e., lower price than the industry average) represents superior performance. (3) Symbol definitions in these importance-performance charts are as follows: MS [ms] = market share, current [previous] quarter P [p] = end-user price, current [previous] quarter Q [q] = perceived product quality, current [previous] quarter S [s] = perceived service quality, current [previous] quarter
A [a] = perceived availability, current [previous] quarter.
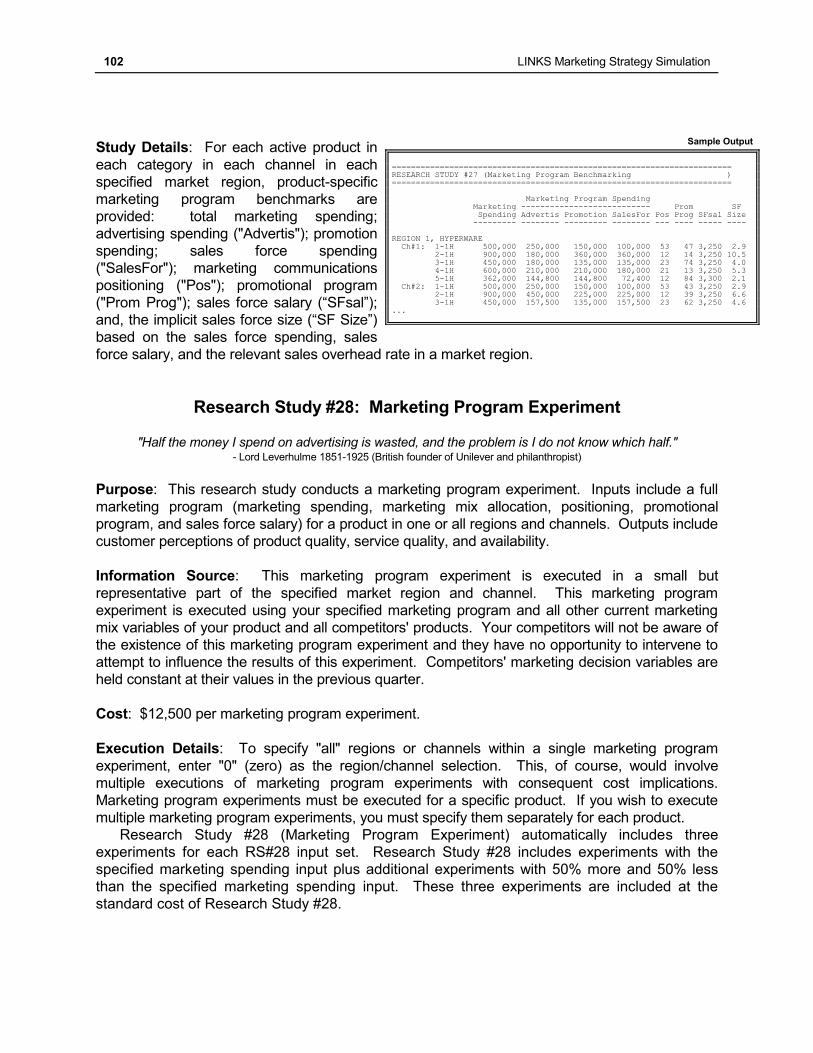
102 LINKS Marketing Strategy Simulation
Study Details: For each active product in
each category in each channel in each
specified market region, product-specific
marketing program benchmarks are
provided: total marketing spending;
advertising spending ("Advertis"); promotion
spending; sales force spending
("SalesFor"); marketing communications
positioning ("Pos"); promotional program
("Prom Prog"); sales force salary (“SFsal”);
and, the implicit sales force size (“SF Size”)
based on the sales force spending, sales
force salary, and the relevant sales overhead rate in a market region.
Research Study #28: Marketing Program Experiment "Half the money I spend on advertising is wasted, and the problem is I do not know which half."
- Lord Leverhulme 1851-1925 (British founder of Unilever and philanthropist)
Purpose: This research study conducts a marketing program experiment. Inputs include a full
marketing program (marketing spending, marketing mix allocation, positioning, promotional
program, and sales force salary) for a product in one or all regions and channels. Outputs include
customer perceptions of product quality, service quality, and availability.
Information Source: This marketing program experiment is executed in a small but
representative part of the specified market region and channel. This marketing program
experiment is executed using your specified marketing program and all other current marketing
mix variables of your product and all competitors' products. Your competitors will not be aware of
the existence of this marketing program experiment and they have no opportunity to intervene to
attempt to influence the results of this experiment. Competitors' marketing decision variables are
held constant at their values in the previous quarter.
Cost: $12,500 per marketing program experiment.
Execution Details: To specify "all" regions or channels within a single marketing program
experiment, enter "0" (zero) as the region/channel selection. This, of course, would involve
multiple executions of marketing program experiments with consequent cost implications.
Marketing program experiments must be executed for a specific product. If you wish to execute
multiple marketing program experiments, you must specify them separately for each product.
Research Study #28 (Marketing Program Experiment) automatically includes three
experiments for each RS#28 input set. Research Study #28 includes experiments with the
specified marketing spending input plus additional experiments with 50% more and 50% less
than the specified marketing spending input. These three experiments are included at the
standard cost of Research Study #28.
Sample Output
======================================================================= RESEARCH STUDY #27 (Marketing Program Benchmarking ) ======================================================================= Marketing Program Spending Marketing --------------------------- Prom SF Spending Advertis Promotion SalesFor Pos Prog SFsal Size --------- -------- --------- -------- --- ---- ----- ---- REGION 1, HYPERWARE Ch#1: 1-1H 500,000 250,000 150,000 100,000 53 47 3,250 2.9 2-1H 900,000 180,000 360,000 360,000 12 14 3,250 10.5 3-1H 450,000 180,000 135,000 135,000 23 74 3,250 4.0 4-1H 600,000 210,000 210,000 180,000 21 13 3,250 5.3 5-1H 362,000 144,800 144,800 72,400 12 84 3,300 2.1 Ch#2: 1-1H 500,000 250,000 150,000 100,000 53 43 3,250 2.9 2-1H 900,000 450,000 225,000 225,000 12 39 3,250 6.6 3-1H 450,000 157,500 135,000 157,500 23 62 3,250 4.6 ...
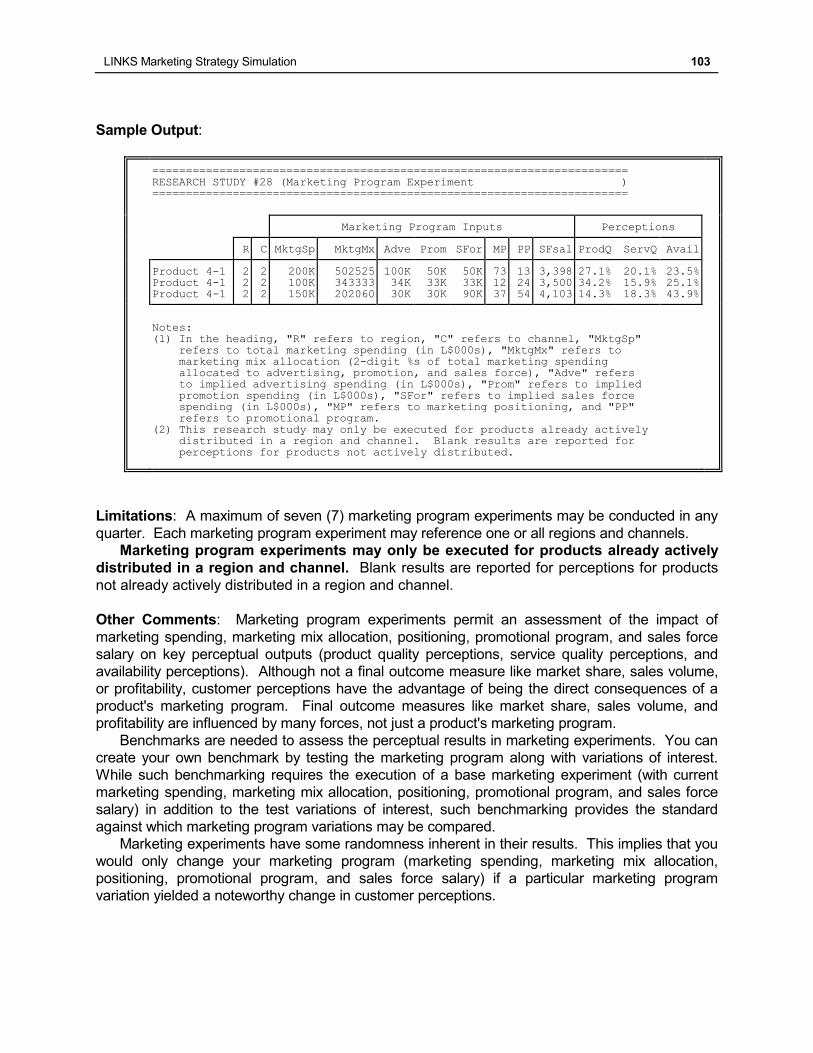
LINKS Marketing Strategy Simulation 103
Sample Output:
======================================================================= RESEARCH STUDY #28 (Marketing Program Experiment ) =======================================================================
Marketing Program Inputs Perceptions
R C MktgSp MktgMx Adve Prom SFor MP PP SFsal ProdQ ServQ Avail
Product 4-1 Product 4-1 Product 4-1
2 2 2
2 2 2
200K 100K 150K
502525 343333 202060
100K 34K 30K
50K 33K 30K
50K 33K 90K
73 12 37
13 24 54
3,398 3,500 4,103
27.1% 34.2% 14.3%
20.1% 15.9% 18.3%
23.5% 25.1% 43.9%
Notes: (1) In the heading, "R" refers to region, "C" refers to channel, "MktgSp"
refers to total marketing spending (in L$000s), "MktgMx" refers to marketing mix allocation (2-digit %s of total marketing spending allocated to advertising, promotion, and sales force), "Adve" refers to implied advertising spending (in L$000s), "Prom" refers to implied promotion spending (in L$000s), "SFor" refers to implied sales force spending (in L$000s), "MP" refers to marketing positioning, and "PP" refers to promotional program. (2) This research study may only be executed for products already actively distributed in a region and channel. Blank results are reported for perceptions for products not actively distributed.
Limitations: A maximum of seven (7) marketing program experiments may be conducted in any
quarter. Each marketing program experiment may reference one or all regions and channels. Marketing program experiments may only be executed for products already actively
distributed in a region and channel. Blank results are reported for perceptions for products
not already actively distributed in a region and channel.
Other Comments: Marketing program experiments permit an assessment of the impact of
marketing spending, marketing mix allocation, positioning, promotional program, and sales force
salary on key perceptual outputs (product quality perceptions, service quality perceptions, and
availability perceptions). Although not a final outcome measure like market share, sales volume,
or profitability, customer perceptions have the advantage of being the direct consequences of a
product's marketing program. Final outcome measures like market share, sales volume, and
profitability are influenced by many forces, not just a product's marketing program.
Benchmarks are needed to assess the perceptual results in marketing experiments. You can
create your own benchmark by testing the marketing program along with variations of interest.
While such benchmarking requires the execution of a base marketing experiment (with current
marketing spending, marketing mix allocation, positioning, promotional program, and sales force
salary) in addition to the test variations of interest, such benchmarking provides the standard
against which marketing program variations may be compared.
Marketing experiments have some randomness inherent in their results. This implies that you
would only change your marketing program (marketing spending, marketing mix allocation,
positioning, promotional program, and sales force salary) if a particular marketing program
variation yielded a noteworthy change in customer perceptions.
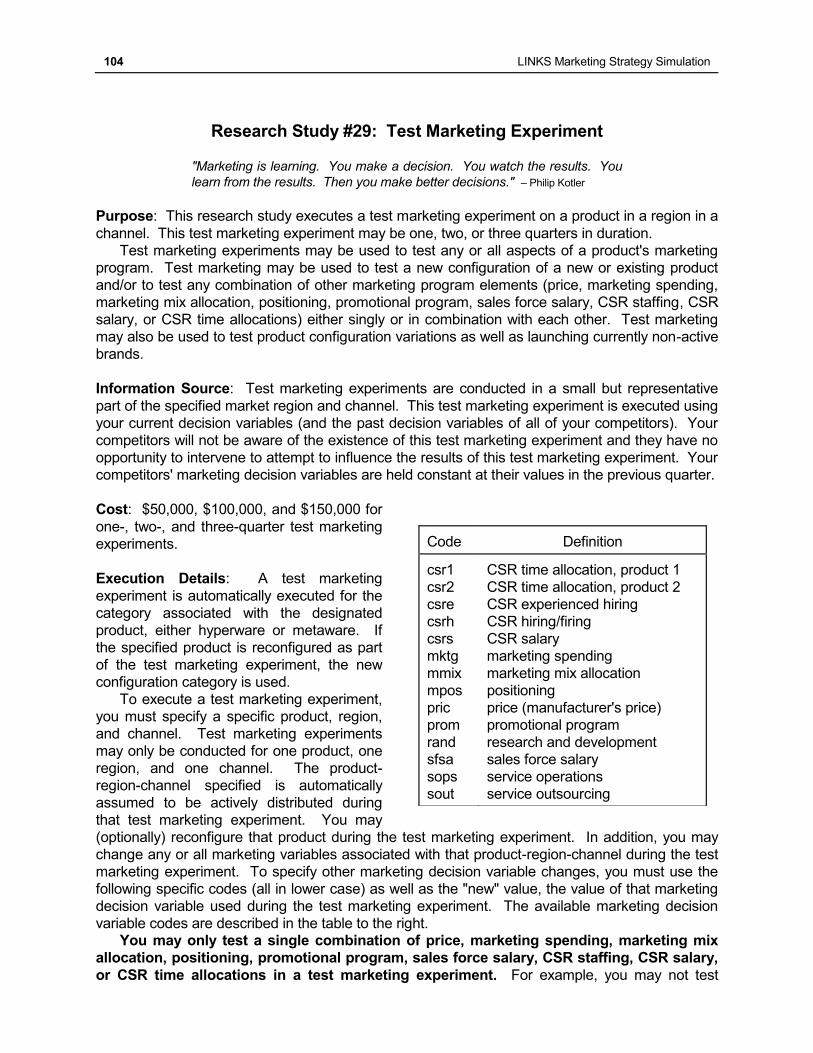
104 LINKS Marketing Strategy Simulation
Research Study #29: Test Marketing Experiment "Marketing is learning. You make a decision. You watch the results. You
learn from the results. Then you make better decisions." – Philip Kotler
Purpose: This research study executes a test marketing experiment on a product in a region in a
channel. This test marketing experiment may be one, two, or three quarters in duration.
Test marketing experiments may be used to test any or all aspects of a product's marketing
program. Test marketing may be used to test a new configuration of a new or existing product
and/or to test any combination of other marketing program elements (price, marketing spending,
marketing mix allocation, positioning, promotional program, sales force salary, CSR staffing, CSR
salary, or CSR time allocations) either singly or in combination with each other. Test marketing
may also be used to test product configuration variations as well as launching currently non-active
brands.
Information Source: Test marketing experiments are conducted in a small but representative
part of the specified market region and channel. This test marketing experiment is executed using
your current decision variables (and the past decision variables of all of your competitors). Your
competitors will not be aware of the existence of this test marketing experiment and they have no
opportunity to intervene to attempt to influence the results of this test marketing experiment. Your
competitors' marketing decision variables are held constant at their values in the previous quarter.
Cost: $50,000, $100,000, and $150,000 for
one-, two-, and three-quarter test marketing
experiments.
Execution Details: A test marketing
experiment is automatically executed for the
category associated with the designated
product, either hyperware or metaware. If
the specified product is reconfigured as part
of the test marketing experiment, the new
configuration category is used.
To execute a test marketing experiment,
you must specify a specific product, region,
and channel. Test marketing experiments
may only be conducted for one product, one
region, and one channel. The product-
region-channel specified is automatically
assumed to be actively distributed during
that test marketing experiment. You may
(optionally) reconfigure that product during the test marketing experiment. In addition, you may
change any or all marketing variables associated with that product-region-channel during the test
marketing experiment. To specify other marketing decision variable changes, you must use the
following specific codes (all in lower case) as well as the "new" value, the value of that marketing
decision variable used during the test marketing experiment. The available marketing decision
variable codes are described in the table to the right. You may only test a single combination of price, marketing spending, marketing mix
allocation, positioning, promotional program, sales force salary, CSR staffing, CSR salary,
or CSR time allocations in a test marketing experiment. For example, you may not test
Code Definition
csr1
csr2
csre
csrh
csrs
mktg
mmix
mpos
pric
prom
rand
sfsa
sops
sout
CSR time allocation, product 1
CSR time allocation, product 2
CSR experienced hiring
CSR hiring/firing
CSR salary
marketing spending
marketing mix allocation
positioning
price (manufacturer's price)
promotional program
research and development
sales force salary
service operations
service outsourcing
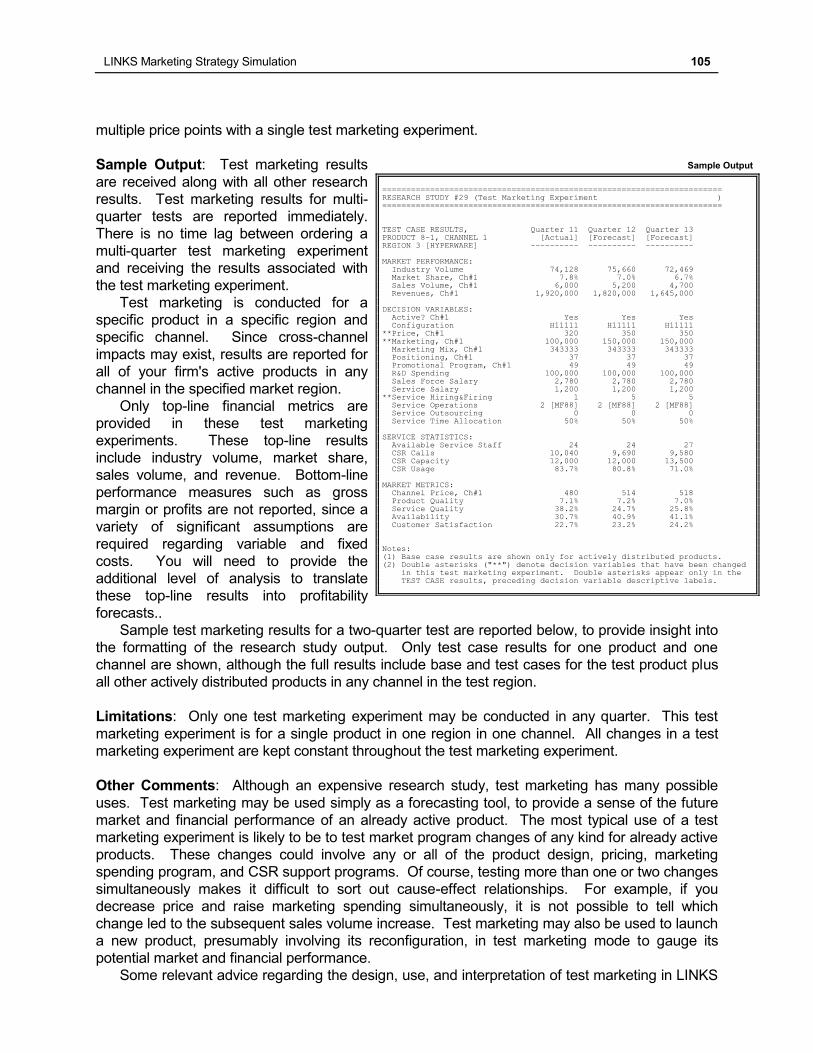
LINKS Marketing Strategy Simulation 105
multiple price points with a single test marketing experiment.
Sample Output: Test marketing results
are received along with all other research
results. Test marketing results for multi-
quarter tests are reported immediately.
There is no time lag between ordering a
multi-quarter test marketing experiment
and receiving the results associated with
the test marketing experiment.
Test marketing is conducted for a
specific product in a specific region and
specific channel. Since cross-channel
impacts may exist, results are reported for
all of your firm's active products in any
channel in the specified market region.
Only top-line financial metrics are
provided in these test marketing
experiments. These top-line results
include industry volume, market share,
sales volume, and revenue. Bottom-line
performance measures such as gross
margin or profits are not reported, since a
variety of significant assumptions are
required regarding variable and fixed
costs. You will need to provide the
additional level of analysis to translate
these top-line results into profitability
forecasts..
Sample test marketing results for a two-quarter test are reported below, to provide insight into
the formatting of the research study output. Only test case results for one product and one
channel are shown, although the full results include base and test cases for the test product plus
all other actively distributed products in any channel in the test region.
Limitations: Only one test marketing experiment may be conducted in any quarter. This test
marketing experiment is for a single product in one region in one channel. All changes in a test
marketing experiment are kept constant throughout the test marketing experiment.
Other Comments: Although an expensive research study, test marketing has many possible
uses. Test marketing may be used simply as a forecasting tool, to provide a sense of the future
market and financial performance of an already active product. The most typical use of a test
marketing experiment is likely to be to test market program changes of any kind for already active
products. These changes could involve any or all of the product design, pricing, marketing
spending program, and CSR support programs. Of course, testing more than one or two changes
simultaneously makes it difficult to sort out cause-effect relationships. For example, if you
decrease price and raise marketing spending simultaneously, it is not possible to tell which
change led to the subsequent sales volume increase. Test marketing may also be used to launch
a new product, presumably involving its reconfiguration, in test marketing mode to gauge its
potential market and financial performance.
Some relevant advice regarding the design, use, and interpretation of test marketing in LINKS
Sample Output
======================================================================= RESEARCH STUDY #29 (Test Marketing Experiment ) ======================================================================= TEST CASE RESULTS, Quarter 11 Quarter 12 Quarter 13 PRODUCT 8-1, CHANNEL 1 [Actual] [Forecast] [Forecast] REGION 3 [HYPERWARE] ---------- ---------- ---------- MARKET PERFORMANCE: Industry Volume 74,128 75,660 72,469 Market Share, Ch#1 7.8% 7.0% 6.7% Sales Volume, Ch#1 6,000 5,200 4,700 Revenues, Ch#1 1,920,000 1,820,000 1,645,000 DECISION VARIABLES: Active? Ch#1 Yes Yes Yes Configuration H11111 H11111 H11111 **Price, Ch#1 320 350 350
**Marketing, Ch#1 100,000 150,000 150,000 Marketing Mix, Ch#1 343333 343333 343333 Positioning, Ch#1 37 37 37 Promotional Program, Ch#1 49 49 49 R&D Spending 100,000 100,000 100,000 Sales Force Salary 2,780 2,780 2,780 Service Salary 1,200 1,200 1,200 **Service Hiring&Firing 1 5 5 Service Operations 2 [MF88] 2 [MF88] 2 [MF88] Service Outsourcing 0 0 0 Service Time Allocation 50% 50% 50% SERVICE STATISTICS: Available Service Staff 24 24 27 CSR Calls 10,040 9,690 9,580 CSR Capacity 12,000 12,000 13,500 CSR Usage 83.7% 80.8% 71.0% MARKET METRICS: Channel Price, Ch#1 480 514 518 Product Quality 7.1% 7.2% 7.0% Service Quality 38.2% 24.7% 25.8% Availability 30.7% 40.9% 41.1% Customer Satisfaction 22.7% 23.2% 24.2% Notes: (1) Base case results are shown only for actively distributed products. (2) Double asterisks ("**") denote decision variables that have been changed
in this test marketing experiment. Double asterisks appear only in the TEST CASE results, preceding decision variable descriptive labels.
106 LINKS Marketing Strategy Simulation
follows:
Test only "large" changes. Testing marketing spending of $100,000 versus $110,000 is likely
to tell you very little. The random noise inherent in test marketing experiments may be as
large or larger than the differential impact of $10,000 in marketing spending.
Marketing program changes whose effects and associated market and financial results may
be felt over several quarters (e.g., new product launches) require multi-quarter tests.
To gauge the effectiveness of the test marketing program, compare the "Test Case" results to
the "Base Case" results. Make multiple comparisons (for example, market share, sales
volume, product quality perception, service quality perception, and availability perception).
Remember that there is a degree of randomness in test marketing. Unless the test marketing
program leads to demonstrably superior results (at least a 10% improvement in sales volume,
for example) than the base case, you should probably call it a draw with regard to the base
and test cases.
If you are test marketing the launch of a new product, remember that you must provide a
complete marketing program for the launch (including a reconfiguration, if desired).
Within the test marketing experiment, it is assumed that there is sufficient finished goods
inventory to meet all sales orders. Therefore, there is no unfilled demand within a test
marketing experiment. There are no inventory implications associated with test marketing
experiments. You do not have to have any specific inventory of finished goods available
for use in a test marketing experiment.
Research Study #30: Conjoint Analysis
"No one tests the depth of the river with both feet." – Ashanti proverb
Purpose: This research study provides a conjoint analysis for either hyperware or metaware for
one or all regions and for one or all channels in the specified region(s). Conjoint analysis reverse
engineers customers' implicit values (tradeoffs) for underlying product "attributes" (including
price). Conjoint analysis is a form of simultaneous concept testing that presents a wide range of
statistically designed/determined product/service concepts to customers in customized surveys.
Results are reported separately for each region and channel specified.
Information Source: This research study is based on customized customer surveys using
advanced marketing research and analysis techniques.
Additional Conjoint Analysis Resources: If you’re unfamiliar with conjoint analysis, you might
access and view this web-based video introduction to conjoint analysis:
“What Can Conjoint Analysis Do For You?”
https://www.youtube.com/watch?v=Su2qIrTmv1c
And, then please read the three-page tutorial that follows this Research Study #30 description.
Study Details: Conjoint analysis represents the equivalent of executing hundreds or thousands
of individual concept tests simultaneously. As a natural extension of concept testing, conjoint
analysis has all of the general strengths and limitations associated with concept testing. For
example, conjoint analysis (like concept testing) is about customers’ stated preferences for
hypothetical descriptions of products or services. No real buying occurs in conjoint analysis (and
concept testing) research studies. Nevertheless, conjoint analysis has an excellent track record.
Many published research studies assess how well conjoint analysis studies predict buying
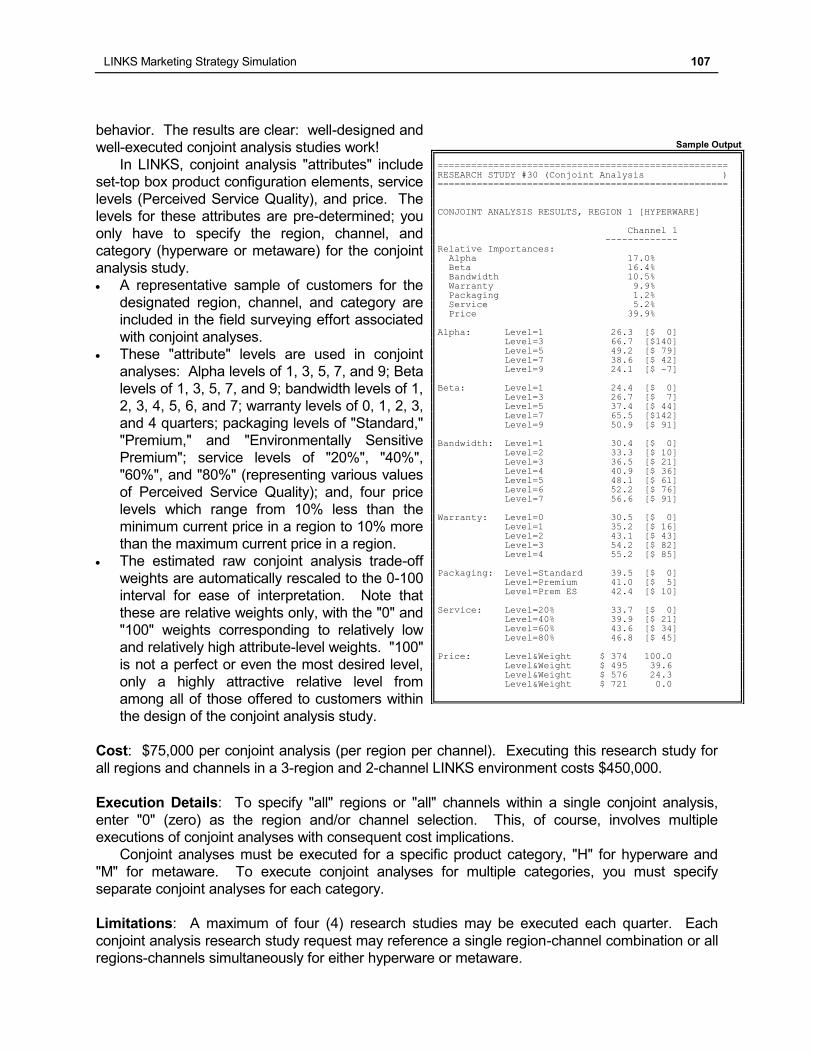
LINKS Marketing Strategy Simulation 107
behavior. The results are clear: well-designed and
well-executed conjoint analysis studies work!
In LINKS, conjoint analysis "attributes" include
set-top box product configuration elements, service
levels (Perceived Service Quality), and price. The
levels for these attributes are pre-determined; you
only have to specify the region, channel, and
category (hyperware or metaware) for the conjoint
analysis study.
A representative sample of customers for the
designated region, channel, and category are
included in the field surveying effort associated
with conjoint analyses.
These "attribute" levels are used in conjoint
analyses: Alpha levels of 1, 3, 5, 7, and 9; Beta
levels of 1, 3, 5, 7, and 9; bandwidth levels of 1,
2, 3, 4, 5, 6, and 7; warranty levels of 0, 1, 2, 3,
and 4 quarters; packaging levels of "Standard,"
"Premium," and "Environmentally Sensitive
Premium"; service levels of "20%", "40%",
"60%", and "80%" (representing various values
of Perceived Service Quality); and, four price
levels which range from 10% less than the
minimum current price in a region to 10% more
than the maximum current price in a region.
The estimated raw conjoint analysis trade-off
weights are automatically rescaled to the 0-100
interval for ease of interpretation. Note that
these are relative weights only, with the "0" and
"100" weights corresponding to relatively low
and relatively high attribute-level weights. "100"
is not a perfect or even the most desired level,
only a highly attractive relative level from
among all of those offered to customers within
the design of the conjoint analysis study.
Cost: $75,000 per conjoint analysis (per region per channel). Executing this research study for
all regions and channels in a 3-region and 2-channel LINKS environment costs $450,000.
Execution Details: To specify "all" regions or "all" channels within a single conjoint analysis,
enter "0" (zero) as the region and/or channel selection. This, of course, involves multiple
executions of conjoint analyses with consequent cost implications.
Conjoint analyses must be executed for a specific product category, "H" for hyperware and
"M" for metaware. To execute conjoint analyses for multiple categories, you must specify
separate conjoint analyses for each category.
Limitations: A maximum of four (4) research studies may be executed each quarter. Each
conjoint analysis research study request may reference a single region-channel combination or all
regions-channels simultaneously for either hyperware or metaware.
Sample Output
==================================================== RESEARCH STUDY #30 (Conjoint Analysis ) ==================================================== CONJOINT ANALYSIS RESULTS, REGION 1 [HYPERWARE] Channel 1 ------------- Relative Importances: Alpha 17.0% Beta 16.4% Bandwidth 10.5% Warranty 9.9% Packaging 1.2% Service 5.2% Price 39.9% Alpha: Level=1 26.3 [$ 0]
Level=3 66.7 [$140] Level=5 49.2 [$ 79] Level=7 38.6 [$ 42] Level=9 24.1 [$ -7] Beta: Level=1 24.4 [$ 0] Level=3 26.7 [$ 7] Level=5 37.4 [$ 44] Level=7 65.5 [$142] Level=9 50.9 [$ 91] Bandwidth: Level=1 30.4 [$ 0] Level=2 33.3 [$ 10] Level=3 36.5 [$ 21] Level=4 40.9 [$ 36] Level=5 48.1 [$ 61] Level=6 52.2 [$ 76] Level=7 56.6 [$ 91] Warranty: Level=0 30.5 [$ 0] Level=1 35.2 [$ 16] Level=2 43.1 [$ 43] Level=3 54.2 [$ 82] Level=4 55.2 [$ 85]
Packaging: Level=Standard 39.5 [$ 0] Level=Premium 41.0 [$ 5] Level=Prem ES 42.4 [$ 10] Service: Level=20% 33.7 [$ 0] Level=40% 39.9 [$ 21] Level=60% 43.6 [$ 34] Level=80% 46.8 [$ 45] Price: Level&Weight $ 374 100.0 Level&Weight $ 495 39.6 Level&Weight $ 576 24.3 Level&Weight $ 721 0.0
108 LINKS Marketing Strategy Simulation
Additional Information – Estimated Relative Importances: “Relative Importances" (the
normalized ranges of the attribute-level weights) are only summaries of the relative variations of
the attribute-level weights across each attribute. "Relative Importances" are never multiplied by
conjoint weights. In essence, the "weights are the weights" and you are never misled by looking
at the conjoint analysis trade-off weights. "Relative Importances," on the other hand, can easily
be misleading, since they depend on the attribute-level ranges used in the conjoint study design.
Be wary of the "Relative Importances." They can easily be misleading. Always look to the
weights. They never lie or mislead providing, of course, that you don't extrapolate too much
outside the range of the attribute-levels in the design of the conjoint analysis study.
Additional Information – Estimated Conjoint Utility Weights: Estimated conjoint utilities are
only relative in nature. The overall utility for a particular product (configuration, service quality,
and price) can be estimated by summing the relevant part-worth utilities. In such calculations, it
may be necessary to interpolate or extrapolate depending on the attribute values for the product.
With an existing product, it is then possible to compare total utility to other possible product
configurations, service quality levels, and prices. In that way, it is possible to establish the price
premium that other products might command compared to the base product. Do this by choosing
prices that equate two products in overall conjoint utility terms. With equal overall utilities, equal
market shares might be expected in the long run. It follows that margins could be compared and
a search for more profitable configurations could follow.
Specifically, suppose that you estimate an existing product with a known 5.0% market share in
a particular channel and region has an overall utility of 350 conjoint utility points. Then, another
product configuration, service quality, and price with the same 350 conjoint utility points might be
expected to have the same market share in the long run. The estimated margins for the base and
comparison products may be compared to determine the most profitable offering. Note that the
volumes are identical, so the margins are the key comparison.
Conjoint analysis assesses underlying customer values for products and services
(product/service positioning and pricing, in particular). As such, it doesn't explicitly reference
already existing products/services. Conjoint analysis is a concept testing style of marketing
research, involving the elicitation of customer reactions to hypothetical products/services. Thus,
conjoint analysis should work fine in a new market even though the customers have not yet
personally experienced a product/service category. There may be a little more random noise in
the conjoint analysis results (reflecting customer inexperience with the category), but the basic
pattern of the findings should not be affected materially whether markets are "new" or "old."
Additional Information - $-Values of Estimated Conjoint Analysis Utility Weights: The $-
values reported in the LINKS conjoint analysis results are a reinterpretation of the estimated
conjoint utility weights. These $-values are calculated from the implicit dollar value of a utility point
derived from the estimated price weights, using only the end-points of the price weights from the
conjoint results. (This, of course, invokes a linearity assumption, which could be inappropriate
especially if there's a wide range of prices included in the conjoint design.) For example, in the
Sample Output shown above, the price weights indicate that 100.0 utility points (100.0 - 0.0)
corresponds to $347 ($721 - $374), so each utility point equals about $3.47 in value to customers
in channel 1 in region 1 in the hyperware sub-category in this Sample Output.
With the $-value per utility point estimated, the implied dollar value of various levels of the
other attributes in the conjoint design are estimated using a base point of $0 for one of the levels
for each conjoint attribute. The $-values show the implicit price differential associated with the
utility point differential compared to the base case.
For more details about such equivalent-value pricing, you may wish to access the following
short article by pointing your web browser at this case-sensitive URL:
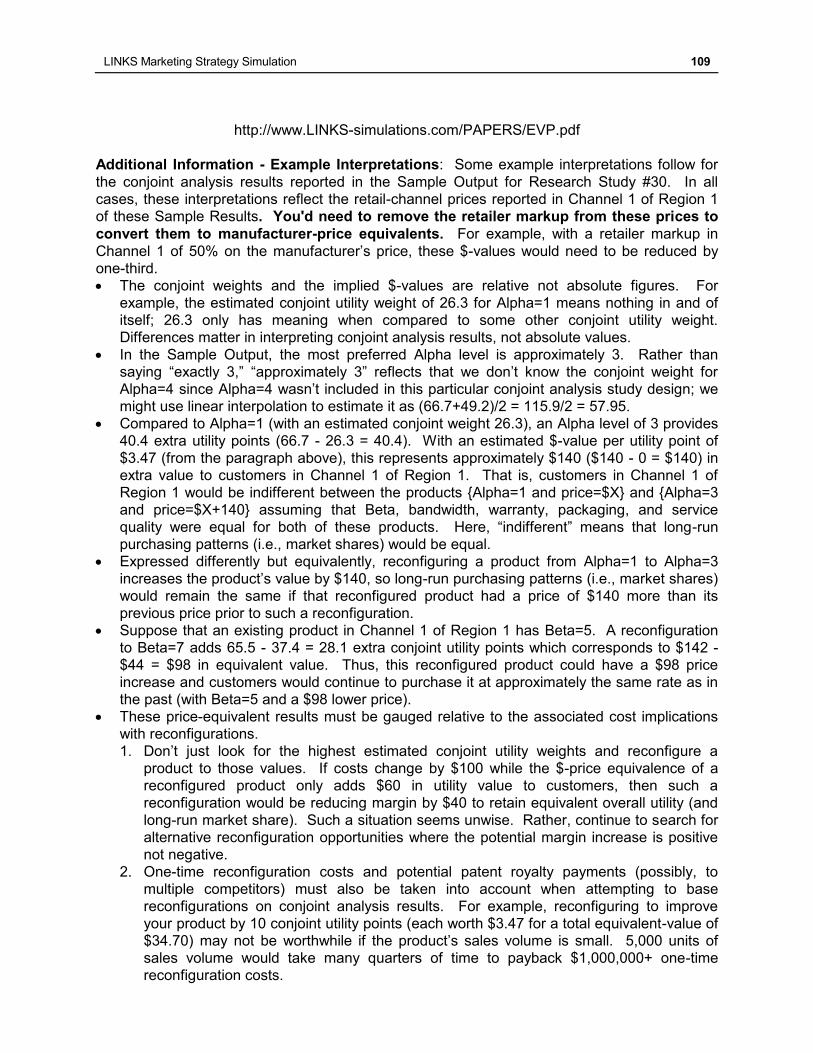
LINKS Marketing Strategy Simulation 109
http://www.LINKS-simulations.com/PAPERS/EVP.pdf
Additional Information - Example Interpretations: Some example interpretations follow for
the conjoint analysis results reported in the Sample Output for Research Study #30. In all
cases, these interpretations reflect the retail-channel prices reported in Channel 1 of Region 1
of these Sample Results. You'd need to remove the retailer markup from these prices to
convert them to manufacturer-price equivalents. For example, with a retailer markup in
Channel 1 of 50% on the manufacturer’s price, these $-values would need to be reduced by
one-third.
The conjoint weights and the implied $-values are relative not absolute figures. For
example, the estimated conjoint utility weight of 26.3 for Alpha=1 means nothing in and of
itself; 26.3 only has meaning when compared to some other conjoint utility weight.
Differences matter in interpreting conjoint analysis results, not absolute values.
In the Sample Output, the most preferred Alpha level is approximately 3. Rather than
saying “exactly 3,” “approximately 3” reflects that we don’t know the conjoint weight for
Alpha=4 since Alpha=4 wasn’t included in this particular conjoint analysis study design; we
might use linear interpolation to estimate it as (66.7+49.2)/2 = 115.9/2 = 57.95.
Compared to Alpha=1 (with an estimated conjoint weight 26.3), an Alpha level of 3 provides
40.4 extra utility points (66.7 - 26.3 = 40.4). With an estimated $-value per utility point of
$3.47 (from the paragraph above), this represents approximately $140 ($140 - 0 = $140) in
extra value to customers in Channel 1 of Region 1. That is, customers in Channel 1 of
Region 1 would be indifferent between the products {Alpha=1 and price=$X} and {Alpha=3
and price=$X+140} assuming that Beta, bandwidth, warranty, packaging, and service
quality were equal for both of these products. Here, “indifferent” means that long-run
purchasing patterns (i.e., market shares) would be equal.
Expressed differently but equivalently, reconfiguring a product from Alpha=1 to Alpha=3
increases the product’s value by $140, so long-run purchasing patterns (i.e., market shares)
would remain the same if that reconfigured product had a price of $140 more than its
previous price prior to such a reconfiguration.
Suppose that an existing product in Channel 1 of Region 1 has Beta=5. A reconfiguration
to Beta=7 adds 65.5 - 37.4 = 28.1 extra conjoint utility points which corresponds to $142 -
$44 = $98 in equivalent value. Thus, this reconfigured product could have a $98 price
increase and customers would continue to purchase it at approximately the same rate as in
the past (with Beta=5 and a $98 lower price).
These price-equivalent results must be gauged relative to the associated cost implications
with reconfigurations.
1. Don’t just look for the highest estimated conjoint utility weights and reconfigure a
product to those values. If costs change by $100 while the $-price equivalence of a
reconfigured product only adds $60 in utility value to customers, then such a
reconfiguration would be reducing margin by $40 to retain equivalent overall utility (and
long-run market share). Such a situation seems unwise. Rather, continue to search for
alternative reconfiguration opportunities where the potential margin increase is positive
not negative.
2. One-time reconfiguration costs and potential patent royalty payments (possibly, to
multiple competitors) must also be taken into account when attempting to base
reconfigurations on conjoint analysis results. For example, reconfiguring to improve
your product by 10 conjoint utility points (each worth $3.47 for a total equivalent-value of
$34.70) may not be worthwhile if the product’s sales volume is small. 5,000 units of
sales volume would take many quarters of time to payback $1,000,000+ one-time
reconfiguration costs.
110 LINKS Marketing Strategy Simulation
3. Note that margin increases if product costs decrease. So, a reconfiguration to reduce
product costs while retaining the existing overall conjoint utility value is another viable
reconfiguration target.
The conjoint analysis results provided in the Sample Output don’t provide the answer to the
question “What price should you charge?” That would require “absolute” not merely “relative”
customer preference/utility information (and competitive choice simulators, which are not part of
the LINKS research study resources). See Research Study #24 (“Price Sensitivity Analysis”)
and Research Study #29 (“Test Marketing”) for LINKS research study resources that provide
market share estimates for existing product and for possible new products, respectively.
LINKS Marketing Strategy Simulation 111
Interpreting Conjoint Analysis Results: A Tutorial
Conjoint analysis seeks to measure and quantify customers' values for underlying buying
factors, offering attributes, characteristics, and features (performance, quality, and service, for
example) and price. In effect, conjoint analysis reverse engineers customers' buying decisions.
With knowledge of customers' buying values, important product positioning and pricing
questions such as the following may be addressed:
(1) What buying factors are most important to customers? For example, how important is
"service" to customers?
(2) What buying factor levels are most valued by customers? For example, how important is
"service responsiveness - within one hour" to customers?
(3) How much will customers pay for particular buying factor levels? For example, what is the
implicit dollar premium that customers will pay for "service responsiveness - within one hour"
compared to "service responsiveness - within one day"?
There's even more to conjoint analysis than addressing just these questions (market share
prediction and simulations under various competitive "what-if" scenarios as well as customer
segmentation, for example) but a detailed discussion of these advanced issues is beyond the
scope of this brief tutorial.
Conjoint Analysis: The Underlying Premise
The fundamental premise in conjoint analysis is that buyers think about and make purchasing
decisions based on a brand’s underlying attributes or feature-sets. This premise will be more
reasonable as the "size" (economic commitment) of the product/service increases. Thus, this is
likely to be most reasonable for larger consumer durables and industrial products, or for
services involving relatively high prices. Consumer non-durables (low-priced, low-risk products)
cause problems for conjoint analysis because buyers may purchase with little thought about
underlying attributes, using "buy-it-and-try-it-before-deciding" buying. Of course, laboratory
tests, field tests, and test marketing experiments are feasible with consumer non-durables.
An Example
To provide an overview of conjoint analysis, we'll use a simplified version a hotel advance
reservation program example. Our focus is on interpreting the results of conjoint analysis
studies, not on their design or fielding.
In pricing service variations, it's natural to analyze customers' preparedness to pay premiums
for upgraded offerings. For example, in the hotel market place, we might be concerned with
pricing basic rooms compared to upgraded rooms with various special features and enhanced
services. Of course, there might be many more than just the two buying factors, room price
and room type, within a full-scale hotel market conjoint analysis study.7
7 An early major published conjoint analysis application in marketing involved 50 different hotel buying
factors (and a total of 167 levels of these buying factors) associated with business travel and business
travelers. This conjoint analysis application was a significant part of the background marketing research
and analysis that ultimately led to the launch of the Courtyard By Marriott hotel chain.
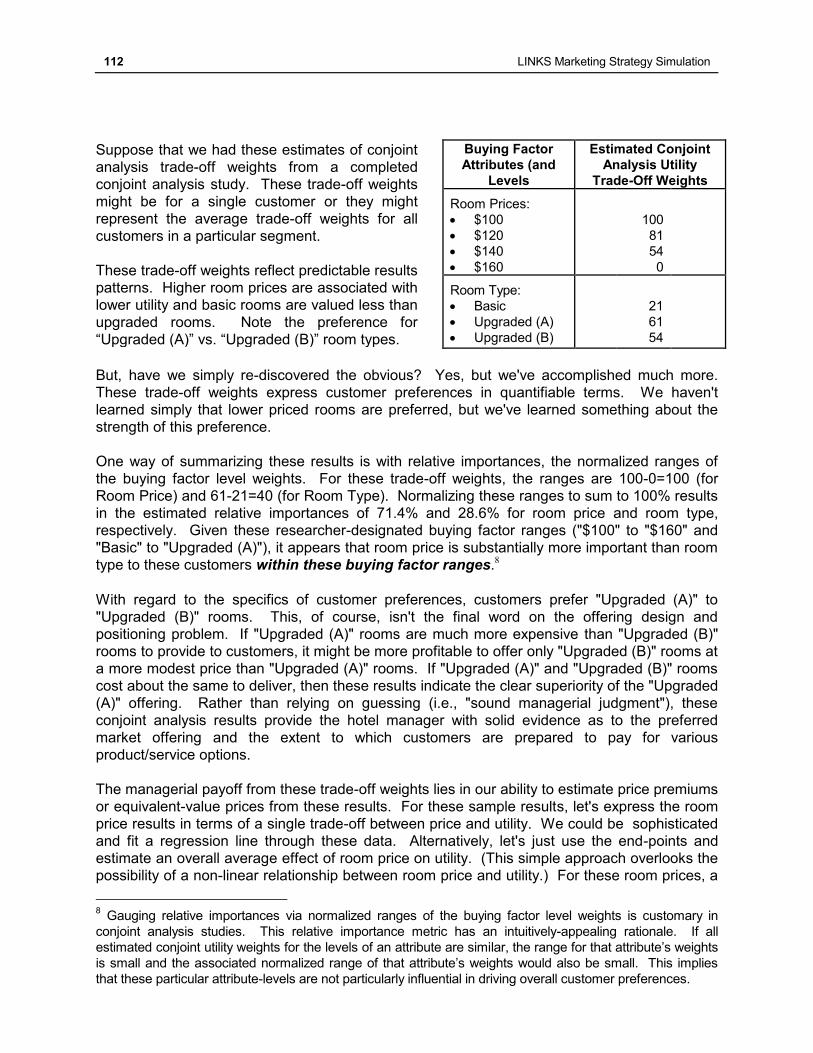
112 LINKS Marketing Strategy Simulation
Suppose that we had these estimates of conjoint
analysis trade-off weights from a completed
conjoint analysis study. These trade-off weights
might be for a single customer or they might
represent the average trade-off weights for all
customers in a particular segment.
These trade-off weights reflect predictable results
patterns. Higher room prices are associated with
lower utility and basic rooms are valued less than
upgraded rooms. Note the preference for
“Upgraded (A)” vs. “Upgraded (B)” room types.
Buying Factor
Attributes (and
Levels
Estimated Conjoint
Analysis Utility
Trade-Off Weights
Room Prices:
$100
$120
$140
$160
100
81
54
0
Room Type:
Basic
Upgraded (A)
Upgraded (B)
21
61
54
But, have we simply re-discovered the obvious? Yes, but we've accomplished much more.
These trade-off weights express customer preferences in quantifiable terms. We haven't
learned simply that lower priced rooms are preferred, but we've learned something about the
strength of this preference.
One way of summarizing these results is with relative importances, the normalized ranges of
the buying factor level weights. For these trade-off weights, the ranges are 100-0=100 (for
Room Price) and 61-21=40 (for Room Type). Normalizing these ranges to sum to 100% results
in the estimated relative importances of 71.4% and 28.6% for room price and room type,
respectively. Given these researcher-designated buying factor ranges ("$100" to "$160" and
"Basic" to "Upgraded (A)"), it appears that room price is substantially more important than room
type to these customers within these buying factor ranges.8
With regard to the specifics of customer preferences, customers prefer "Upgraded (A)" to
"Upgraded (B)" rooms. This, of course, isn't the final word on the offering design and
positioning problem. If "Upgraded (A)" rooms are much more expensive than "Upgraded (B)"
rooms to provide to customers, it might be more profitable to offer only "Upgraded (B)" rooms at
a more modest price than "Upgraded (A)" rooms. If "Upgraded (A)" and "Upgraded (B)" rooms
cost about the same to deliver, then these results indicate the clear superiority of the "Upgraded
(A)" offering. Rather than relying on guessing (i.e., "sound managerial judgment"), these
conjoint analysis results provide the hotel manager with solid evidence as to the preferred
market offering and the extent to which customers are prepared to pay for various
product/service options.
The managerial payoff from these trade-off weights lies in our ability to estimate price premiums
or equivalent-value prices from these results. For these sample results, let's express the room
price results in terms of a single trade-off between price and utility. We could be sophisticated
and fit a regression line through these data. Alternatively, let's just use the end-points and
estimate an overall average effect of room price on utility. (This simple approach overlooks the
possibility of a non-linear relationship between room price and utility.) For these room prices, a
8 Gauging relative importances via normalized ranges of the buying factor level weights is customary in
conjoint analysis studies. This relative importance metric has an intuitively-appealing rationale. If all
estimated conjoint utility weights for the levels of an attribute are similar, the range for that attribute’s weights
is small and the associated normalized range of that attribute’s weights would also be small. This implies
that these particular attribute-levels are not particularly influential in driving overall customer preferences.
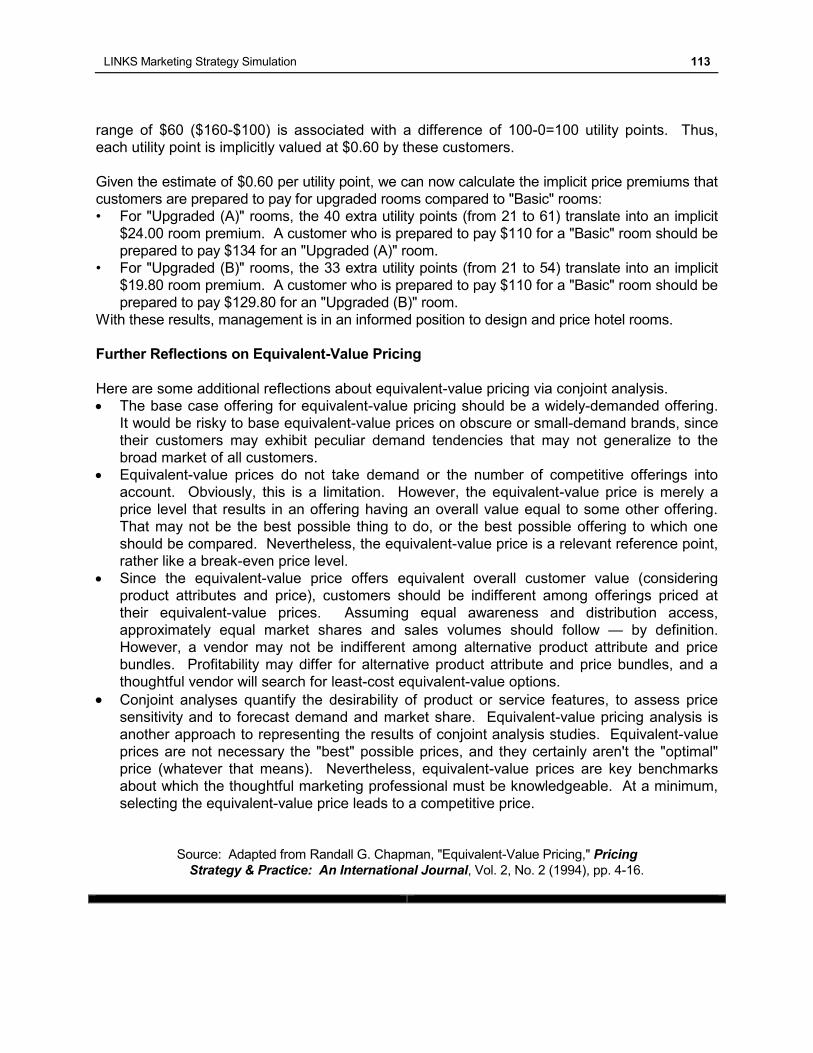
LINKS Marketing Strategy Simulation 113
range of $60 ($160-$100) is associated with a difference of 100-0=100 utility points. Thus,
each utility point is implicitly valued at $0.60 by these customers.
Given the estimate of $0.60 per utility point, we can now calculate the implicit price premiums that
customers are prepared to pay for upgraded rooms compared to "Basic" rooms:
• For "Upgraded (A)" rooms, the 40 extra utility points (from 21 to 61) translate into an implicit
$24.00 room premium. A customer who is prepared to pay $110 for a "Basic" room should be
prepared to pay $134 for an "Upgraded (A)" room.
• For "Upgraded (B)" rooms, the 33 extra utility points (from 21 to 54) translate into an implicit
$19.80 room premium. A customer who is prepared to pay $110 for a "Basic" room should be
prepared to pay $129.80 for an "Upgraded (B)" room.
With these results, management is in an informed position to design and price hotel rooms.
Further Reflections on Equivalent-Value Pricing
Here are some additional reflections about equivalent-value pricing via conjoint analysis.
The base case offering for equivalent-value pricing should be a widely-demanded offering.
It would be risky to base equivalent-value prices on obscure or small-demand brands, since
their customers may exhibit peculiar demand tendencies that may not generalize to the
broad market of all customers.
Equivalent-value prices do not take demand or the number of competitive offerings into
account. Obviously, this is a limitation. However, the equivalent-value price is merely a
price level that results in an offering having an overall value equal to some other offering.
That may not be the best possible thing to do, or the best possible offering to which one
should be compared. Nevertheless, the equivalent-value price is a relevant reference point,
rather like a break-even price level.
Since the equivalent-value price offers equivalent overall customer value (considering
product attributes and price), customers should be indifferent among offerings priced at
their equivalent-value prices. Assuming equal awareness and distribution access,
approximately equal market shares and sales volumes should follow — by definition.
However, a vendor may not be indifferent among alternative product attribute and price
bundles. Profitability may differ for alternative product attribute and price bundles, and a
thoughtful vendor will search for least-cost equivalent-value options.
Conjoint analyses quantify the desirability of product or service features, to assess price
sensitivity and to forecast demand and market share. Equivalent-value pricing analysis is
another approach to representing the results of conjoint analysis studies. Equivalent-value
prices are not necessary the "best" possible prices, and they certainly aren't the "optimal"
price (whatever that means). Nevertheless, equivalent-value prices are key benchmarks
about which the thoughtful marketing professional must be knowledgeable. At a minimum,
selecting the equivalent-value price leads to a competitive price.
Source: Adapted from Randall G. Chapman, "Equivalent-Value Pricing," Pricing
Strategy & Practice: An International Journal, Vol. 2, No. 2 (1994), pp. 4-16.
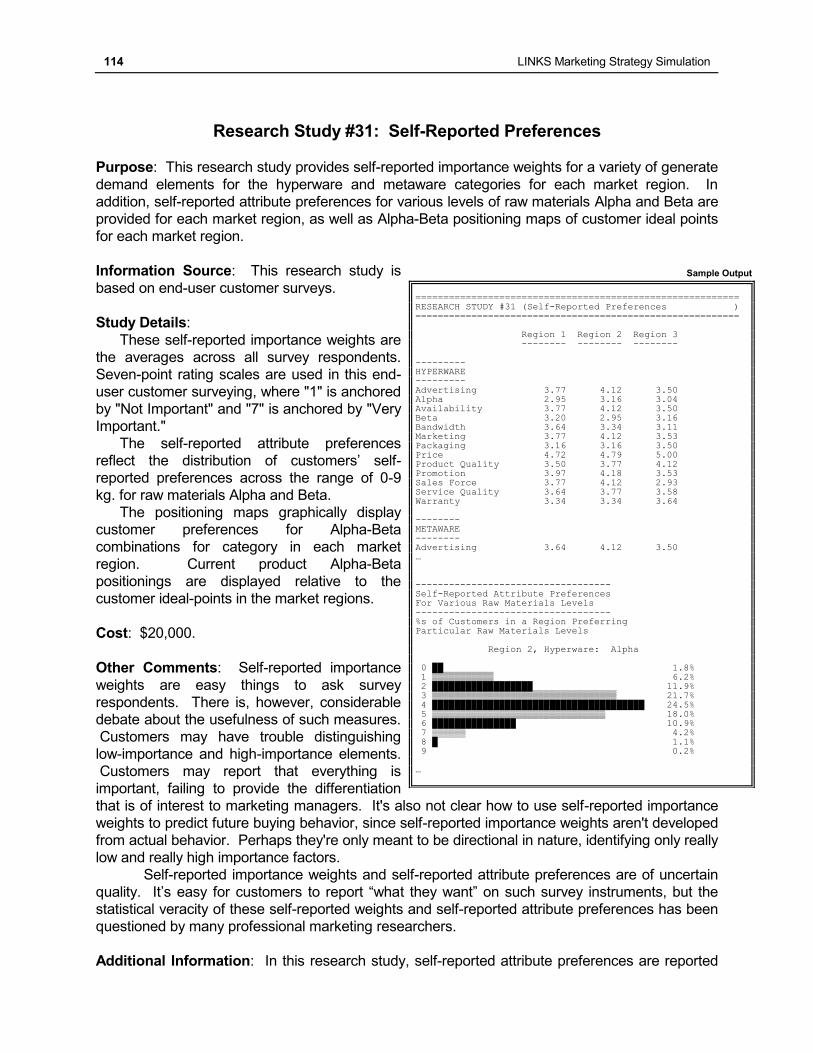
114 LINKS Marketing Strategy Simulation
Research Study #31: Self-Reported Preferences
Purpose: This research study provides self-reported importance weights for a variety of generate
demand elements for the hyperware and metaware categories for each market region. In
addition, self-reported attribute preferences for various levels of raw materials Alpha and Beta are
provided for each market region, as well as Alpha-Beta positioning maps of customer ideal points
for each market region.
Information Source: This research study is
based on end-user customer surveys.
Study Details:
These self-reported importance weights are
the averages across all survey respondents.
Seven-point rating scales are used in this end-
user customer surveying, where "1" is anchored
by "Not Important" and "7" is anchored by "Very
Important."
The self-reported attribute preferences
reflect the distribution of customers’ self-
reported preferences across the range of 0-9
kg. for raw materials Alpha and Beta.
The positioning maps graphically display
customer preferences for Alpha-Beta
combinations for category in each market
region. Current product Alpha-Beta
positionings are displayed relative to the
customer ideal-points in the market regions.
Cost: $20,000.
Other Comments: Self-reported importance
weights are easy things to ask survey
respondents. There is, however, considerable
debate about the usefulness of such measures.
Customers may have trouble distinguishing
low-importance and high-importance elements.
Customers may report that everything is
important, failing to provide the differentiation
that is of interest to marketing managers. It's also not clear how to use self-reported importance
weights to predict future buying behavior, since self-reported importance weights aren't developed
from actual behavior. Perhaps they're only meant to be directional in nature, identifying only really
low and really high importance factors.
Self-reported importance weights and self-reported attribute preferences are of uncertain
quality. It’s easy for customers to report “what they want” on such survey instruments, but the
statistical veracity of these self-reported weights and self-reported attribute preferences has been
questioned by many professional marketing researchers.
Additional Information: In this research study, self-reported attribute preferences are reported
Sample Output
========================================================== RESEARCH STUDY #31 (Self-Reported Preferences ) ========================================================== Region 1 Region 2 Region 3
-------- -------- -------- --------- HYPERWARE --------- Advertising 3.77 4.12 3.50 Alpha 2.95 3.16 3.04 Availability 3.77 4.12 3.50 Beta 3.20 2.95 3.16 Bandwidth 3.64 3.34 3.11 Marketing 3.77 4.12 3.53 Packaging 3.16 3.16 3.50 Price 4.72 4.79 5.00 Product Quality 3.50 3.77 4.12 Promotion 3.97 4.18 3.53 Sales Force 3.77 4.12 2.93 Service Quality 3.64 3.77 3.58 Warranty 3.34 3.34 3.64 -------- METAWARE -------- Advertising 3.64 4.12 3.50 …
----------------------------------- Self-Reported Attribute Preferences For Various Raw Materials Levels ----------------------------------- %s of Customers in a Region Preferring Particular Raw Materials Levels Region 2, Hyperware: Alpha 0 ██ 1.8% 1 ▒▒▒▒▒▒▒▒▒▒▒ 6.2% 2 ██████████████████ 11.9% 3 ▒▒▒▒▒▒▒▒▒▒▒▒▒▒▒▒▒▒▒▒▒▒▒▒▒▒▒▒▒▒▒▒▒ 21.7% 4 ██████████████████████████████████████ 24.5% 5 ▒▒▒▒▒▒▒▒▒▒▒▒▒▒▒▒▒▒▒▒▒▒▒▒▒▒▒▒▒▒▒ 18.0% 6 ███████████████ 10.9% 7 ▒▒▒▒▒▒ 4.2% 8 █ 1.1% 9 0.2% …
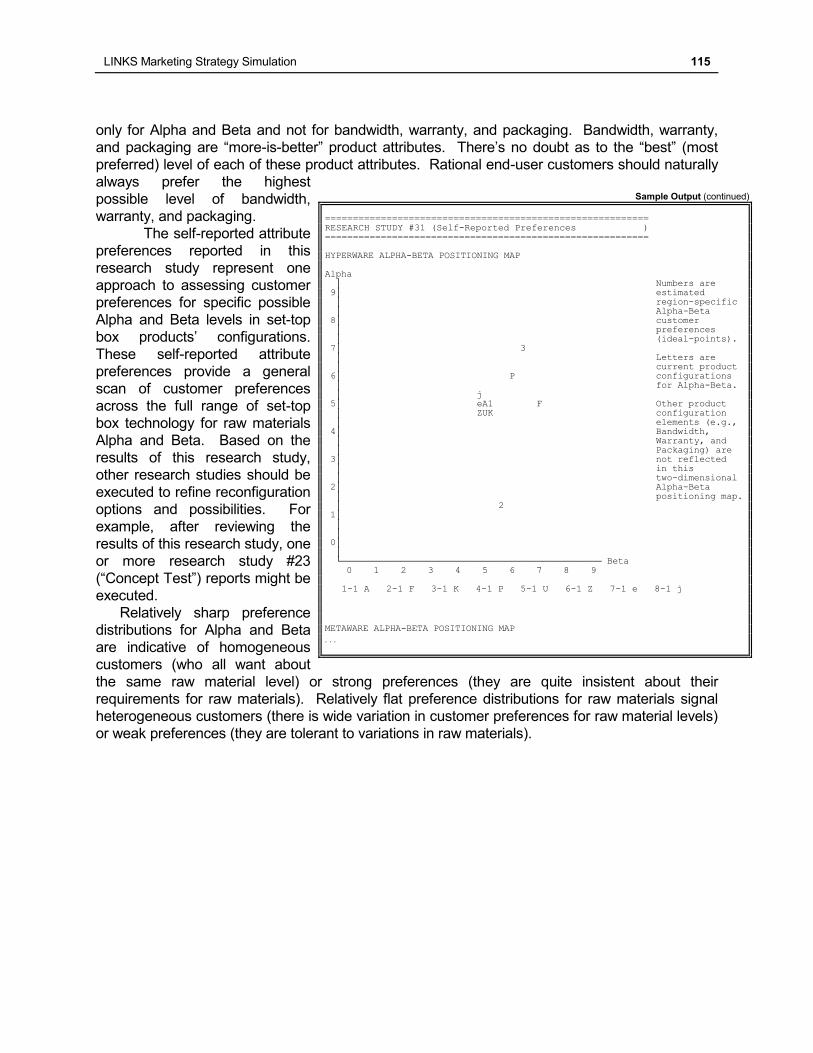
LINKS Marketing Strategy Simulation 115
only for Alpha and Beta and not for bandwidth, warranty, and packaging. Bandwidth, warranty,
and packaging are “more-is-better” product attributes. There’s no doubt as to the “best” (most
preferred) level of each of these product attributes. Rational end-user customers should naturally
always prefer the highest
possible level of bandwidth,
warranty, and packaging.
The self-reported attribute
preferences reported in this
research study represent one
approach to assessing customer
preferences for specific possible
Alpha and Beta levels in set-top
box products’ configurations.
These self-reported attribute
preferences provide a general
scan of customer preferences
across the full range of set-top
box technology for raw materials
Alpha and Beta. Based on the
results of this research study,
other research studies should be
executed to refine reconfiguration
options and possibilities. For
example, after reviewing the
results of this research study, one
or more research study #23
(“Concept Test”) reports might be
executed.
Relatively sharp preference
distributions for Alpha and Beta
are indicative of homogeneous
customers (who all want about
the same raw material level) or strong preferences (they are quite insistent about their
requirements for raw materials). Relatively flat preference distributions for raw materials signal
heterogeneous customers (there is wide variation in customer preferences for raw material levels)
or weak preferences (they are tolerant to variations in raw materials).
Sample Output (continued)
========================================================== RESEARCH STUDY #31 (Self-Reported Preferences ) ========================================================== HYPERWARE ALPHA-BETA POSITIONING MAP Alpha │ Numbers are 9│ estimated │ region-specific │ Alpha-Beta 8│ customer │ preferences │ (ideal-points).
7│ 3 │ Letters are │ current product 6│ P configurations │ for Alpha-Beta. │ j 5│ eA1 F Other product │ ZUK configuration │ elements (e.g., 4│ Bandwidth, │ Warranty, and │ Packaging) are 3│ not reflected │ in this │ two-dimensional 2│ Alpha-Beta │ positioning map. │ 2 1│ │ │ 0│ │ └──────────────────────────────────────────────── Beta
0 1 2 3 4 5 6 7 8 9 1-1 A 2-1 F 3-1 K 4-1 P 5-1 U 6-1 Z 7-1 e 8-1 j
METAWARE ALPHA-BETA POSITIONING MAP
. . .
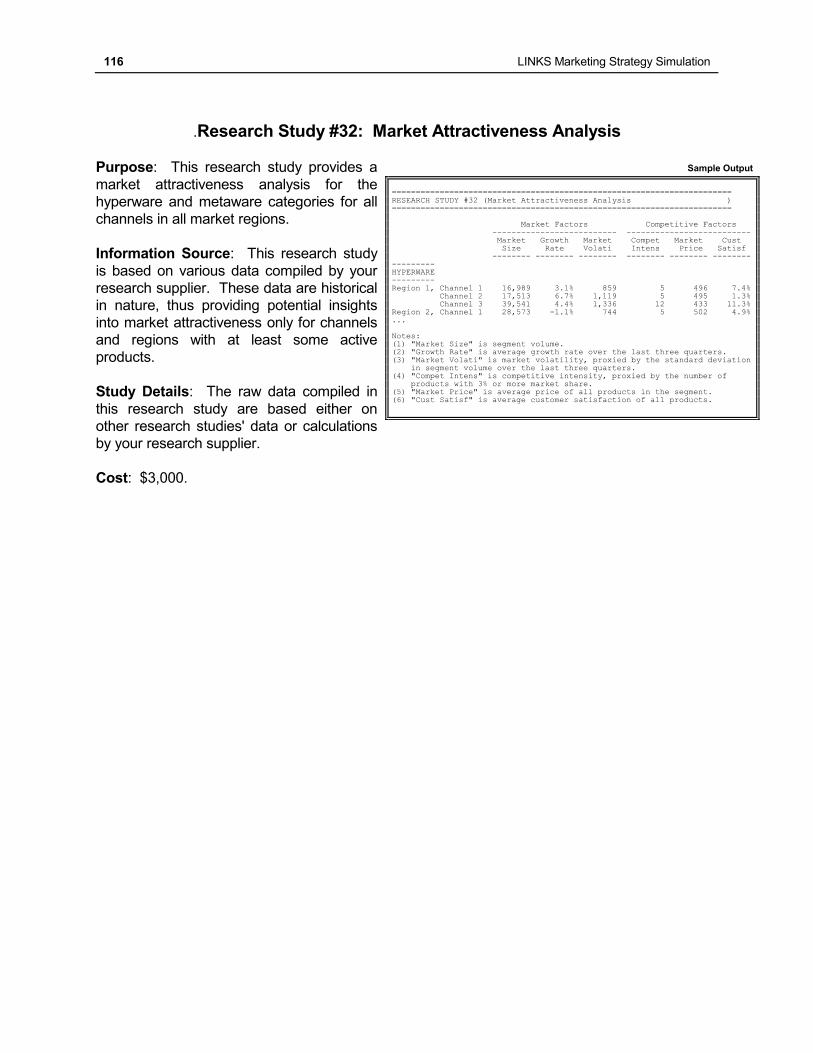
116 LINKS Marketing Strategy Simulation
.Research Study #32: Market Attractiveness Analysis
Purpose: This research study provides a
market attractiveness analysis for the
hyperware and metaware categories for all
channels in all market regions.
Information Source: This research study
is based on various data compiled by your
research supplier. These data are historical
in nature, thus providing potential insights
into market attractiveness only for channels
and regions with at least some active
products.
Study Details: The raw data compiled in
this research study are based either on
other research studies' data or calculations
by your research supplier.
Cost: $3,000.
Sample Output
======================================================================= RESEARCH STUDY #32 (Market Attractiveness Analysis ) ======================================================================= Market Factors Competitive Factors -------------------------- -------------------------- Market Growth Market Compet Market Cust Size Rate Volati Intens Price Satisf -------- -------- -------- -------- -------- -------- --------- HYPERWARE --------- Region 1, Channel 1 16,989 3.1% 859 5 496 7.4% Channel 2 17,513 6.7% 1,119 5 495 1.3% Channel 3 39,541 4.4% 1,336 12 433 11.3% Region 2, Channel 1 28,573 -1.1% 744 5 502 4.9% ... Notes:
(1) "Market Size" is segment volume. (2) "Growth Rate" is average growth rate over the last three quarters. (3) "Market Volati" is market volatility, proxied by the standard deviation in segment volume over the last three quarters. (4) "Compet Intens" is competitive intensity, proxied by the number of products with 3% or more market share. (5) "Market Price" is average price of all products in the segment. (6) "Cust Satisf" is average customer satisfaction of all products.
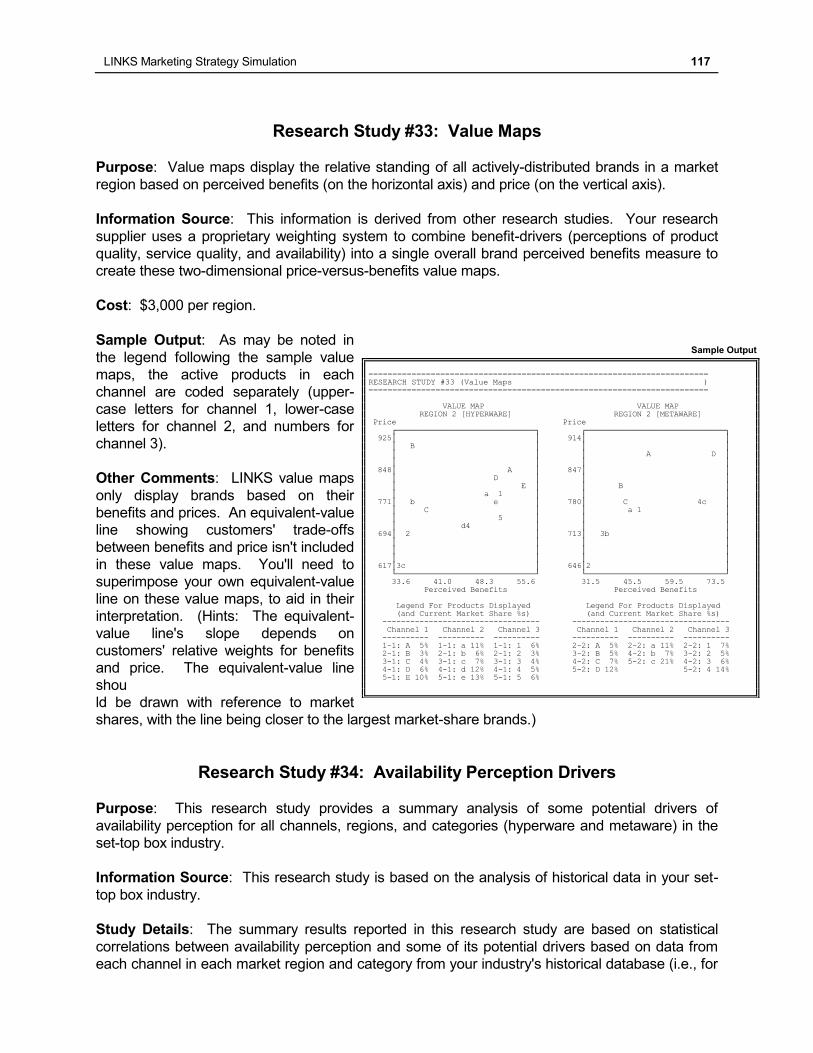
LINKS Marketing Strategy Simulation 117
Research Study #33: Value Maps
Purpose: Value maps display the relative standing of all actively-distributed brands in a market
region based on perceived benefits (on the horizontal axis) and price (on the vertical axis).
Information Source: This information is derived from other research studies. Your research
supplier uses a proprietary weighting system to combine benefit-drivers (perceptions of product
quality, service quality, and availability) into a single overall brand perceived benefits measure to
create these two-dimensional price-versus-benefits value maps.
Cost: $3,000 per region.
Sample Output: As may be noted in
the legend following the sample value
maps, the active products in each
channel are coded separately (upper-
case letters for channel 1, lower-case
letters for channel 2, and numbers for
channel 3).
Other Comments: LINKS value maps
only display brands based on their
benefits and prices. An equivalent-value
line showing customers' trade-offs
between benefits and price isn't included
in these value maps. You'll need to
superimpose your own equivalent-value
line on these value maps, to aid in their
interpretation. (Hints: The equivalent-
value line's slope depends on
customers' relative weights for benefits
and price. The equivalent-value line
shou
ld be drawn with reference to market
shares, with the line being closer to the largest market-share brands.)
Research Study #34: Availability Perception Drivers
Purpose: This research study provides a summary analysis of some potential drivers of
availability perception for all channels, regions, and categories (hyperware and metaware) in the
set-top box industry.
Information Source: This research study is based on the analysis of historical data in your set-
top box industry.
Study Details: The summary results reported in this research study are based on statistical
correlations between availability perception and some of its potential drivers based on data from
each channel in each market region and category from your industry's historical database (i.e., for
Sample Output
======================================================================= RESEARCH STUDY #33 (Value Maps ) ======================================================================= VALUE MAP VALUE MAP REGION 2 [HYPERWARE] REGION 2 [METAWARE] Price Price ┌──────────────────────────────┐ ┌──────────────────────────────┐ 925│ │ 914│ │ │ B │ │ │ │ │ │ A D │ │ │ │ │ 848│ A │ 847│ │ │ D │ │ │ │ E │ │ B │ │ a 1 │ │ │ 771│ b e │ 780│ C 4c │ │ C │ │ a 1 │ │ 5 │ │ │ │ d4 │ │ │ 694│ 2 │ 713│ 3b │ │ │ │ │ │ │ │ │ │ │ │ │ 617│3c │ 646│2 │
└──────────────────────────────┘ └──────────────────────────────┘ 33.6 41.0 48.3 55.6 31.5 45.5 59.5 73.5 Perceived Benefits Perceived Benefits Legend For Products Displayed Legend For Products Displayed (and Current Market Share %s) (and Current Market Share %s) ---------------------------------- ---------------------------------- Channel 1 Channel 2 Channel 3 Channel 1 Channel 2 Channel 3 ---------- ---------- ---------- ---------- ---------- ---------- 1-1: A 5% 1-1: a 11% 1-1: 1 6% 2-2: A 5% 2-2: a 11% 2-2: 1 7% 2-1: B 3% 2-1: b 6% 2-1: 2 3% 3-2: B 5% 4-2: b 7% 3-2: 2 5% 3-1: C 4% 3-1: c 7% 3-1: 3 4% 4-2: C 7% 5-2: c 21% 4-2: 3 6% 4-1: D 6% 4-1: d 12% 4-1: 4 5% 5-2: D 12% 5-2: 4 14% 5-1: E 10% 5-1: e 13% 5-1: 5 6%
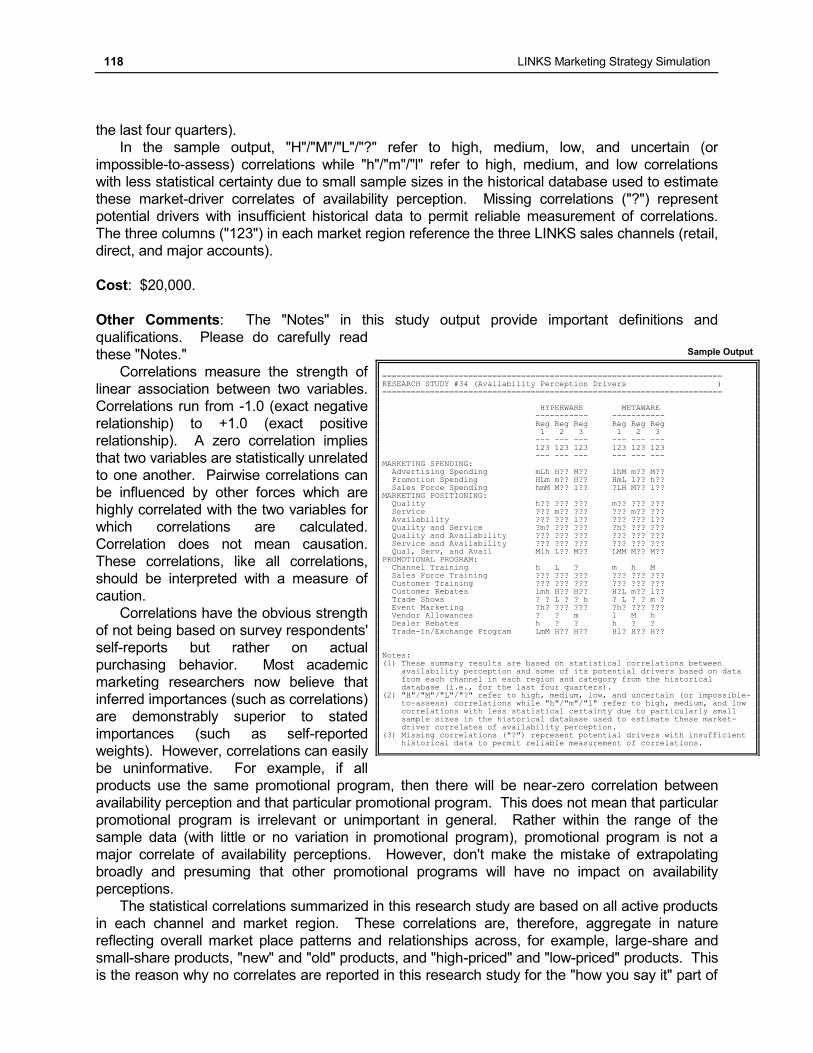
118 LINKS Marketing Strategy Simulation
the last four quarters).
In the sample output, "H"/"M"/"L"/"?" refer to high, medium, low, and uncertain (or
impossible-to-assess) correlations while "h"/"m"/"l" refer to high, medium, and low correlations
with less statistical certainty due to small sample sizes in the historical database used to estimate
these market-driver correlates of availability perception. Missing correlations ("?") represent
potential drivers with insufficient historical data to permit reliable measurement of correlations.
The three columns ("123") in each market region reference the three LINKS sales channels (retail,
direct, and major accounts).
Cost: $20,000.
Other Comments: The "Notes" in this study output provide important definitions and
qualifications. Please do carefully read
these "Notes."
Correlations measure the strength of
linear association between two variables.
Correlations run from -1.0 (exact negative
relationship) to +1.0 (exact positive
relationship). A zero correlation implies
that two variables are statistically unrelated
to one another. Pairwise correlations can
be influenced by other forces which are
highly correlated with the two variables for
which correlations are calculated.
Correlation does not mean causation.
These correlations, like all correlations,
should be interpreted with a measure of
caution.
Correlations have the obvious strength
of not being based on survey respondents'
self-reports but rather on actual
purchasing behavior. Most academic
marketing researchers now believe that
inferred importances (such as correlations)
are demonstrably superior to stated
importances (such as self-reported
weights). However, correlations can easily
be uninformative. For example, if all
products use the same promotional program, then there will be near-zero correlation between
availability perception and that particular promotional program. This does not mean that particular
promotional program is irrelevant or unimportant in general. Rather within the range of the
sample data (with little or no variation in promotional program), promotional program is not a
major correlate of availability perceptions. However, don't make the mistake of extrapolating
broadly and presuming that other promotional programs will have no impact on availability
perceptions.
The statistical correlations summarized in this research study are based on all active products
in each channel and market region. These correlations are, therefore, aggregate in nature
reflecting overall market place patterns and relationships across, for example, large-share and
small-share products, "new" and "old" products, and "high-priced" and "low-priced" products. This
is the reason why no correlates are reported in this research study for the "how you say it" part of
Sample Output
======================================================================= RESEARCH STUDY #34 (Availability Perception Drivers ) ======================================================================= HYPERWARE METAWARE ----------- ----------- Reg Reg Reg Reg Reg Reg 1 2 3 1 2 3 --- --- --- --- --- --- 123 123 123 123 123 123 --- --- --- --- --- --- MARKETING SPENDING: Advertising Spending mLh H?? M?? lhM m?? M?? Promotion Spending HLm m?? H?? HmL l?? h?? Sales Force Spending hmM M?? l?? ?LH M?? l?? MARKETING POSITIONING: Quality h?? ??? ??? m?? ??? ??? Service ??? m?? ??? ??? m?? ??? Availability ??? ??? l?? ??? ??? l?? Quality and Service ?m? ??? ??? ?h? ??? ??? Quality and Availability ??? ??? ??? ??? ??? ??? Service and Availability ??? ??? ??? ??? ??? ??? Qual, Serv, and Avail Mlh L?? M?? LMM M?? M?? PROMOTIONAL PROGRAM: Channel Training h L ? m h M
Sales Force Training ??? ??? ??? ??? ??? ??? Customer Training ??? ??? ??? ??? ??? ??? Customer Rebates lmh H?? H?? H?L m?? l?? Trade Shows ? ? L ? ? h ? L ? ? m ? Event Marketing ?h? ??? ??? ?h? ??? ??? Vendor Allowances ? ? m l M h Dealer Rebates h ? ? h ? ? Trade-In/Exchange Program LmM H?? H?? Hl? H?? H?? Notes: (1) These summary results are based on statistical correlations between availability perception and some of its potential drivers based on data from each channel in each region and category from the historical database (i.e., for the last four quarters). (2) "H"/"M"/"L"/"?" refer to high, medium, low, and uncertain (or impossible- to-assess) correlations while "h"/"m"/"l" refer to high, medium, and low correlations with less statistical certainty due to particularly small sample sizes in the historical database used to estimate these market- driver correlates of availability perception. (3) Missing correlations ("?") represent potential drivers with insufficient historical data to permit reliable measurement of correlations.
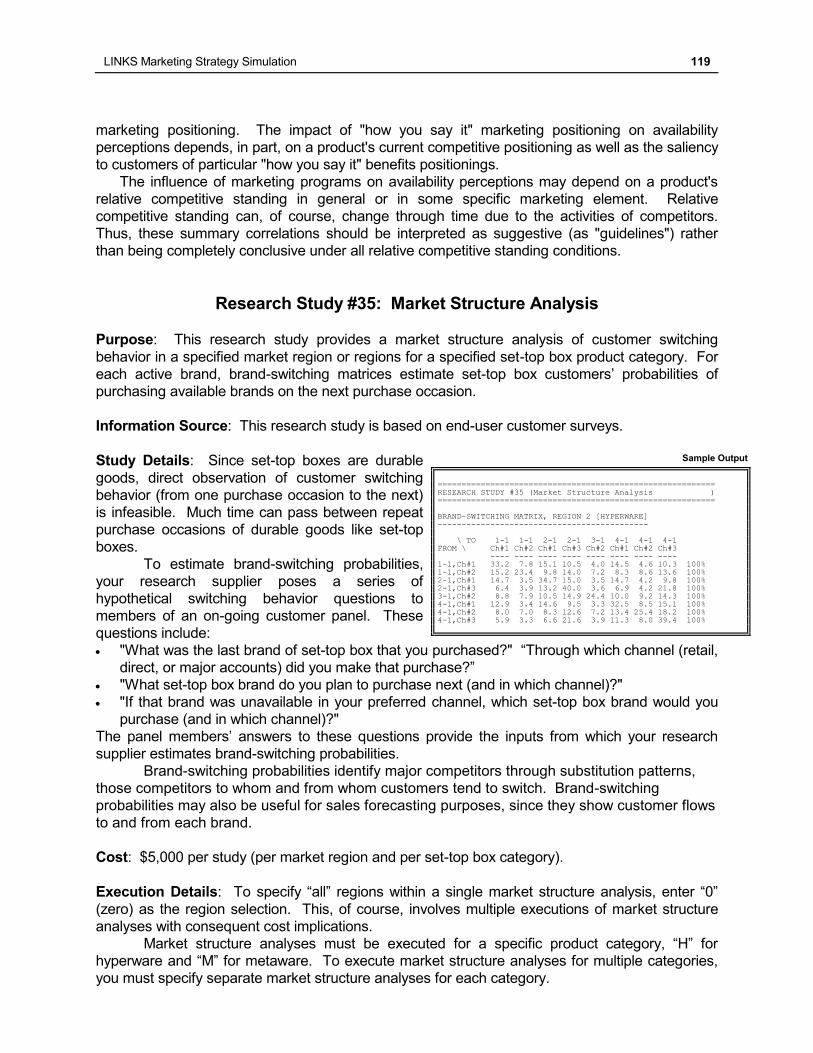
LINKS Marketing Strategy Simulation 119
marketing positioning. The impact of "how you say it" marketing positioning on availability
perceptions depends, in part, on a product's current competitive positioning as well as the saliency
to customers of particular "how you say it" benefits positionings.
The influence of marketing programs on availability perceptions may depend on a product's
relative competitive standing in general or in some specific marketing element. Relative
competitive standing can, of course, change through time due to the activities of competitors.
Thus, these summary correlations should be interpreted as suggestive (as "guidelines") rather
than being completely conclusive under all relative competitive standing conditions.
Research Study #35: Market Structure Analysis
Purpose: This research study provides a market structure analysis of customer switching
behavior in a specified market region or regions for a specified set-top box product category. For
each active brand, brand-switching matrices estimate set-top box customers’ probabilities of
purchasing available brands on the next purchase occasion.
Information Source: This research study is based on end-user customer surveys.
Study Details: Since set-top boxes are durable
goods, direct observation of customer switching
behavior (from one purchase occasion to the next)
is infeasible. Much time can pass between repeat
purchase occasions of durable goods like set-top
boxes.
To estimate brand-switching probabilities,
your research supplier poses a series of
hypothetical switching behavior questions to
members of an on-going customer panel. These
questions include:
"What was the last brand of set-top box that you purchased?" “Through which channel (retail,
direct, or major accounts) did you make that purchase?”
"What set-top box brand do you plan to purchase next (and in which channel)?"
"If that brand was unavailable in your preferred channel, which set-top box brand would you
purchase (and in which channel)?"
The panel members’ answers to these questions provide the inputs from which your research
supplier estimates brand-switching probabilities.
Brand-switching probabilities identify major competitors through substitution patterns,
those competitors to whom and from whom customers tend to switch. Brand-switching
probabilities may also be useful for sales forecasting purposes, since they show customer flows
to and from each brand.
Cost: $5,000 per study (per market region and per set-top box category).
Execution Details: To specify “all” regions within a single market structure analysis, enter “0”
(zero) as the region selection. This, of course, involves multiple executions of market structure
analyses with consequent cost implications.
Market structure analyses must be executed for a specific product category, “H” for
hyperware and “M” for metaware. To execute market structure analyses for multiple categories,
you must specify separate market structure analyses for each category.
Sample Output
========================================================== RESEARCH STUDY #35 (Market Structure Analysis ) ========================================================== BRAND-SWITCHING MATRIX, REGION 2 [HYPERWARE] -------------------------------------------- \ TO 1-1 1-1 2-1 2-1 3-1 4-1 4-1 4-1 FROM \ Ch#1 Ch#2 Ch#1 Ch#3 Ch#2 Ch#1 Ch#2 Ch#3 ---- ---- ---- ---- ---- ---- ---- ---- 1-1,Ch#1 33.2 7.8 15.1 10.5 4.0 14.5 4.6 10.3 100%
1-1,Ch#2 15.2 23.4 9.8 14.0 7.2 8.3 8.6 13.6 100% 2-1,Ch#1 14.7 3.5 34.7 15.0 3.5 14.7 4.2 9.8 100% 2-1,Ch#3 6.4 3.9 13.2 40.0 3.6 6.9 4.2 21.8 100% 3-1,Ch#2 8.8 7.9 10.5 14.9 24.4 10.0 9.2 14.3 100% 4-1,Ch#1 12.9 3.4 14.6 9.5 3.3 32.5 8.5 15.1 100% 4-1,Ch#2 8.0 7.0 8.3 12.6 7.2 13.4 25.4 18.2 100% 4-1,Ch#3 5.9 3.3 6.6 21.6 3.9 11.3 8.0 39.4 100%
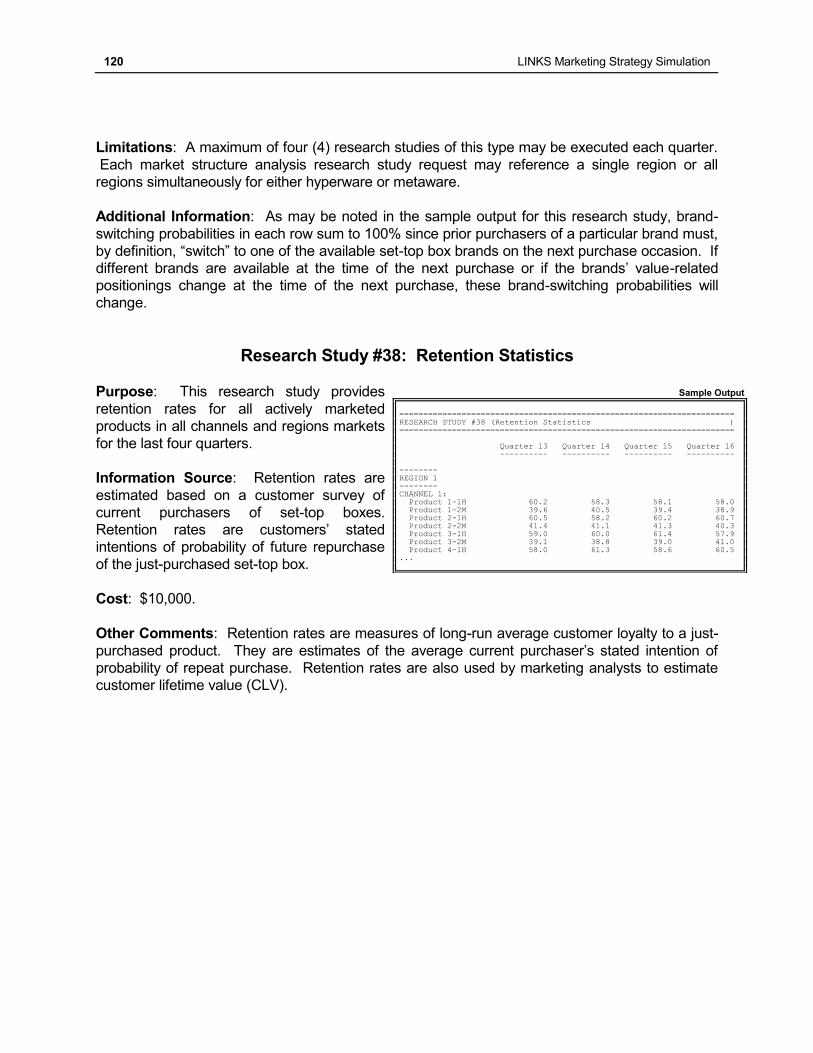
120 LINKS Marketing Strategy Simulation
Limitations: A maximum of four (4) research studies of this type may be executed each quarter.
Each market structure analysis research study request may reference a single region or all
regions simultaneously for either hyperware or metaware.
Additional Information: As may be noted in the sample output for this research study, brand-
switching probabilities in each row sum to 100% since prior purchasers of a particular brand must,
by definition, “switch” to one of the available set-top box brands on the next purchase occasion. If
different brands are available at the time of the next purchase or if the brands’ value-related
positionings change at the time of the next purchase, these brand-switching probabilities will
change.
Research Study #38: Retention Statistics
Purpose: This research study provides
retention rates for all actively marketed
products in all channels and regions markets
for the last four quarters.
Information Source: Retention rates are
estimated based on a customer survey of
current purchasers of set-top boxes.
Retention rates are customers’ stated
intentions of probability of future repurchase
of the just-purchased set-top box.
Cost: $10,000.
Other Comments: Retention rates are measures of long-run average customer loyalty to a just-
purchased product. They are estimates of the average current purchaser’s stated intention of
probability of repeat purchase. Retention rates are also used by marketing analysts to estimate
customer lifetime value (CLV).
Sample Output
====================================================================== RESEARCH STUDY #38 (Retention Statistics ) ====================================================================== Quarter 13 Quarter 14 Quarter 15 Quarter 16 ---------- ---------- ---------- ---------- -------- REGION 1 -------- CHANNEL 1: Product 1-1H 60.2 58.3 58.1 58.0 Product 1-2M 39.6 40.5 39.4 38.9 Product 2-1H 60.5 58.2 60.2 60.7 Product 2-2M 41.4 41.1 41.3 40.3 Product 3-1H 59.0 60.0 61.4 57.9 Product 3-2M 39.1 38.8 39.0 41.0 Product 4-1H 58.0 61.3 58.6 60.5 ...
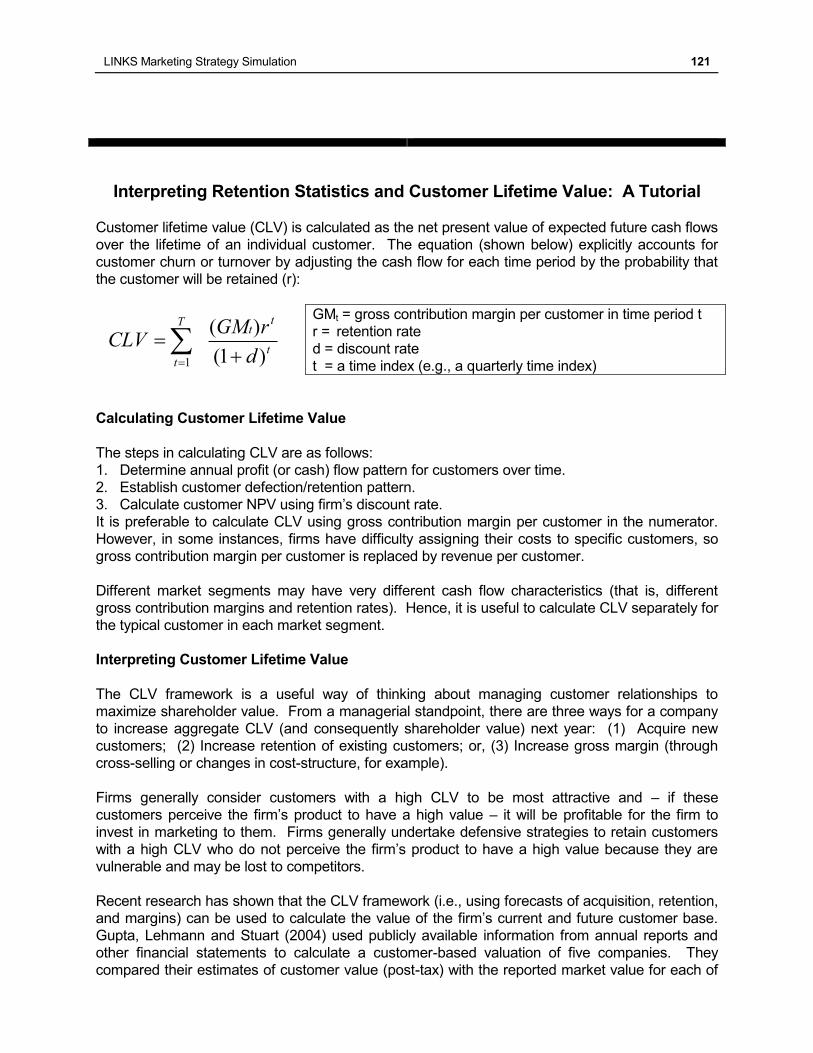
LINKS Marketing Strategy Simulation 121
Interpreting Retention Statistics and Customer Lifetime Value: A Tutorial
Customer lifetime value (CLV) is calculated as the net present value of expected future cash flows
over the lifetime of an individual customer. The equation (shown below) explicitly accounts for
customer churn or turnover by adjusting the cash flow for each time period by the probability that
the customer will be retained (r):
GMt = gross contribution margin per customer in time period t
r = retention rate
d = discount rate
t = a time index (e.g., a quarterly time index)
Calculating Customer Lifetime Value
The steps in calculating CLV are as follows:
1. Determine annual profit (or cash) flow pattern for customers over time.
2. Establish customer defection/retention pattern.
3. Calculate customer NPV using firm’s discount rate.
It is preferable to calculate CLV using gross contribution margin per customer in the numerator.
However, in some instances, firms have difficulty assigning their costs to specific customers, so
gross contribution margin per customer is replaced by revenue per customer.
Different market segments may have very different cash flow characteristics (that is, different
gross contribution margins and retention rates). Hence, it is useful to calculate CLV separately for
the typical customer in each market segment.
Interpreting Customer Lifetime Value
The CLV framework is a useful way of thinking about managing customer relationships to
maximize shareholder value. From a managerial standpoint, there are three ways for a company
to increase aggregate CLV (and consequently shareholder value) next year: (1) Acquire new
customers; (2) Increase retention of existing customers; or, (3) Increase gross margin (through
cross-selling or changes in cost-structure, for example).
Firms generally consider customers with a high CLV to be most attractive and – if these
customers perceive the firm’s product to have a high value – it will be profitable for the firm to
invest in marketing to them. Firms generally undertake defensive strategies to retain customers
with a high CLV who do not perceive the firm’s product to have a high value because they are
vulnerable and may be lost to competitors.
Recent research has shown that the CLV framework (i.e., using forecasts of acquisition, retention,
and margins) can be used to calculate the value of the firm’s current and future customer base.
Gupta, Lehmann and Stuart (2004) used publicly available information from annual reports and
other financial statements to calculate a customer-based valuation of five companies. They
compared their estimates of customer value (post-tax) with the reported market value for each of
t
tt
T
t d
rGMCLV
)1(
)(
1
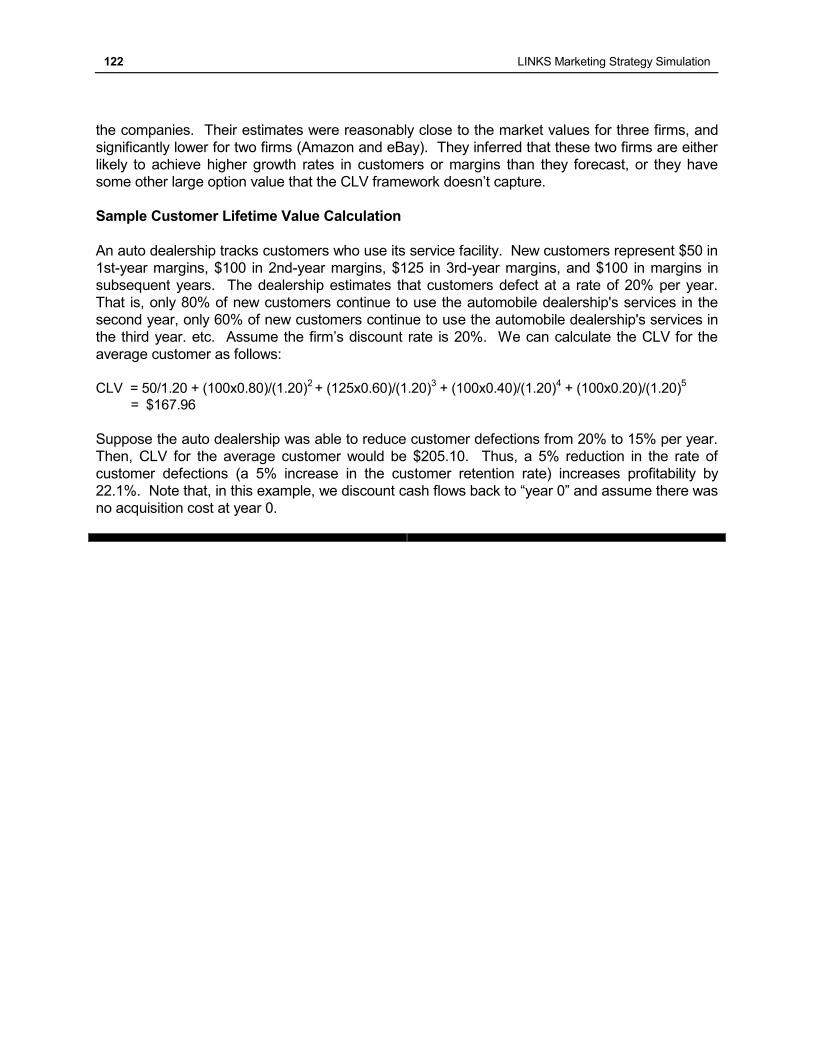
122 LINKS Marketing Strategy Simulation
the companies. Their estimates were reasonably close to the market values for three firms, and
significantly lower for two firms (Amazon and eBay). They inferred that these two firms are either
likely to achieve higher growth rates in customers or margins than they forecast, or they have
some other large option value that the CLV framework doesn’t capture.
Sample Customer Lifetime Value Calculation
An auto dealership tracks customers who use its service facility. New customers represent $50 in
1st-year margins, $100 in 2nd-year margins, $125 in 3rd-year margins, and $100 in margins in
subsequent years. The dealership estimates that customers defect at a rate of 20% per year.
That is, only 80% of new customers continue to use the automobile dealership's services in the
second year, only 60% of new customers continue to use the automobile dealership's services in
the third year. etc. Assume the firm’s discount rate is 20%. We can calculate the CLV for the
average customer as follows:
CLV = 50/1.20 + (100x0.80)/(1.20)
2 + (125x0.60)/(1.20)
3 + (100x0.40)/(1.20)
4 + (100x0.20)/(1.20)
5
= $167.96
Suppose the auto dealership was able to reduce customer defections from 20% to 15% per year.
Then, CLV for the average customer would be $205.10. Thus, a 5% reduction in the rate of
customer defections (a 5% increase in the customer retention rate) increases profitability by
22.1%. Note that, in this example, we discount cash flows back to “year 0” and assume there was
no acquisition cost at year 0.
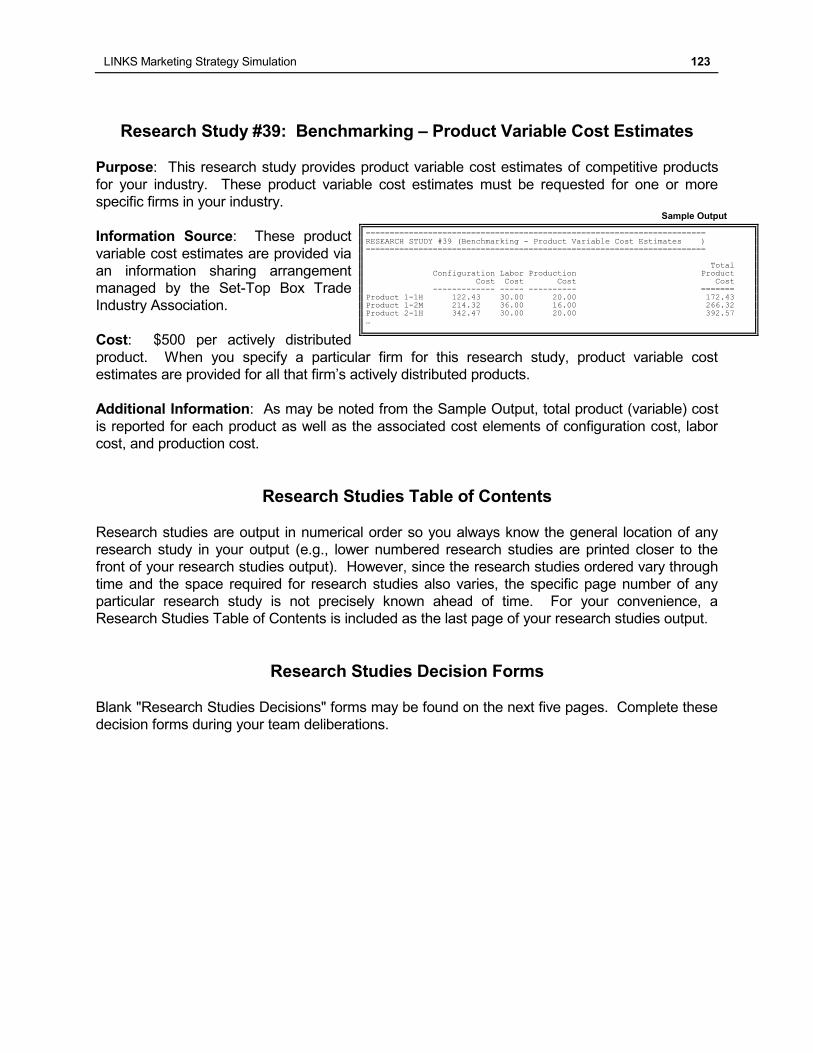
LINKS Marketing Strategy Simulation 123
Research Study #39: Benchmarking – Product Variable Cost Estimates
Purpose: This research study provides product variable cost estimates of competitive products
for your industry. These product variable cost estimates must be requested for one or more
specific firms in your industry.
Information Source: These product
variable cost estimates are provided via
an information sharing arrangement
managed by the Set-Top Box Trade
Industry Association.
Cost: $500 per actively distributed
product. When you specify a particular firm for this research study, product variable cost
estimates are provided for all that firm’s actively distributed products.
Additional Information: As may be noted from the Sample Output, total product (variable) cost
is reported for each product as well as the associated cost elements of configuration cost, labor
cost, and production cost.
Research Studies Table of Contents
Research studies are output in numerical order so you always know the general location of any
research study in your output (e.g., lower numbered research studies are printed closer to the
front of your research studies output). However, since the research studies ordered vary through
time and the space required for research studies also varies, the specific page number of any
particular research study is not precisely known ahead of time. For your convenience, a
Research Studies Table of Contents is included as the last page of your research studies output.
Research Studies Decision Forms
Blank "Research Studies Decisions" forms may be found on the next five pages. Complete these
decision forms during your team deliberations.
Sample Output
======================================================================= RESEARCH STUDY #39 (Benchmarking - Product Variable Cost Estimates ) ======================================================================= Total Configuration Labor Production Product Cost Cost Cost Cost ------------- ----- ---------- ======= Product 1-1H 122.43 30.00 20.00 172.43 Product 1-2M 214.32 36.00 16.00 266.32 Product 2-1H 342.47 30.00 20.00 392.57 …
124 LINKS Marketing Strategy Simulation
Research Studies Decisions (1) Firm Quarter
1 Benchmarking - Earnings
2 Benchmarking - Balance Sheets Firm(s)?
3 Benchmarking - Product Development
8 Benchmarking - Service
9 Benchmarking - Generate Demand
10 Benchmarking - Info Tech & Research Studies
11 Benchmarking - Operating Statistics
12 Market Statistics
14 Regional Summary Analysis Region(s)?
15 Market Shares
16 Prices
17 Product Quality Perceptions
18 Service Quality Perceptions
19 Availability Perceptions
20 Customer Satisfaction
21 Configuration Analysis - Specific Product Product(s)? [firm#-product#]
22 Configuration Analysis - Reconfigurations
Notes:
(1) Circle the number of each research study that you wish to order. If additional information is
required for a research study, provide that information in the designated space(s).
(2) When region and/or channel numbers are required, enter a single region number and/or a
single channel number. Use region "0" and channel "0" as designations to run a research
study for all regions and/or all channels, respectively. See the research study descriptions for
details about the associated multi-region and multi-channel costs.
Reminders
Research study requests are for one quarter only. If you wish to reorder a research study in a
subsequent quarter, you must reenter that research study request.
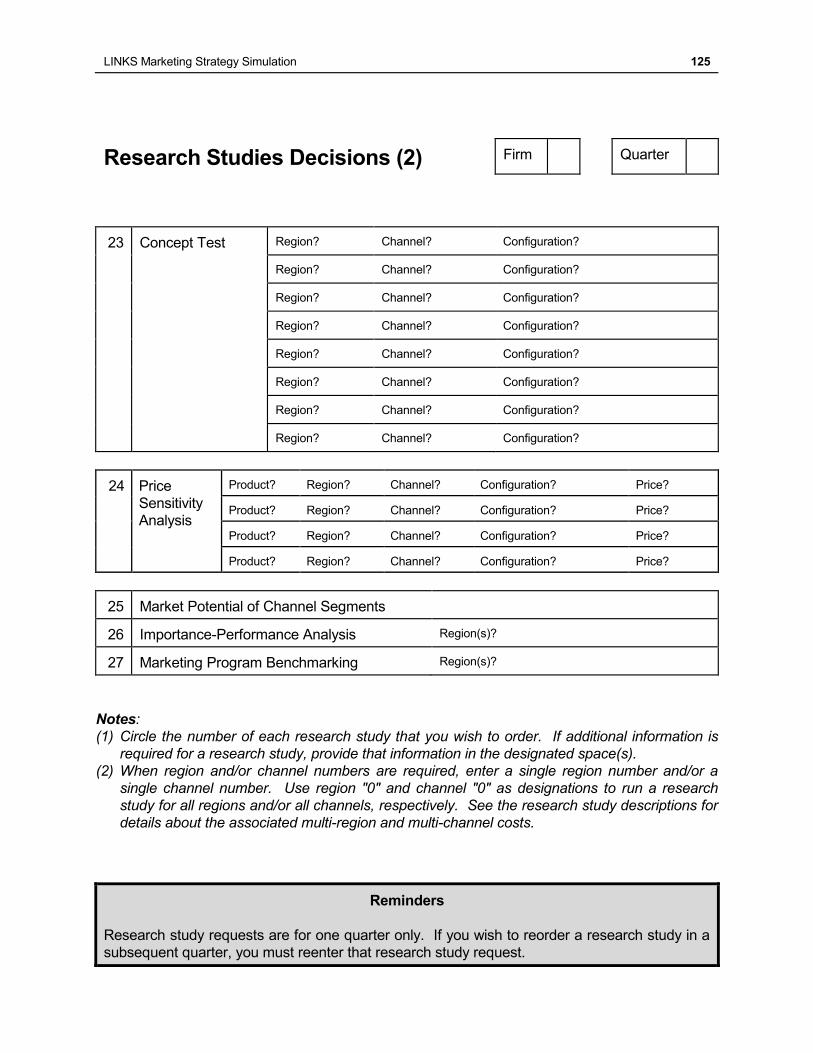
LINKS Marketing Strategy Simulation 125
Research Studies Decisions (2) Firm Quarter
23 Concept Test Region? Channel? Configuration?
Region? Channel? Configuration?
Region? Channel? Configuration?
Region? Channel? Configuration?
Region? Channel? Configuration?
Region? Channel? Configuration?
Region? Channel? Configuration?
Region? Channel? Configuration?
24 Price
Sensitivity
Analysis
Product? Region? Channel? Configuration? Price?
Product? Region? Channel? Configuration? Price?
Product? Region? Channel? Configuration? Price?
Product? Region? Channel? Configuration? Price?
25 Market Potential of Channel Segments
26 Importance-Performance Analysis Region(s)?
27 Marketing Program Benchmarking Region(s)?
Notes:
(1) Circle the number of each research study that you wish to order. If additional information is
required for a research study, provide that information in the designated space(s).
(2) When region and/or channel numbers are required, enter a single region number and/or a
single channel number. Use region "0" and channel "0" as designations to run a research
study for all regions and/or all channels, respectively. See the research study descriptions for
details about the associated multi-region and multi-channel costs.
Reminders
Research study requests are for one quarter only. If you wish to reorder a research study in a
subsequent quarter, you must reenter that research study request.
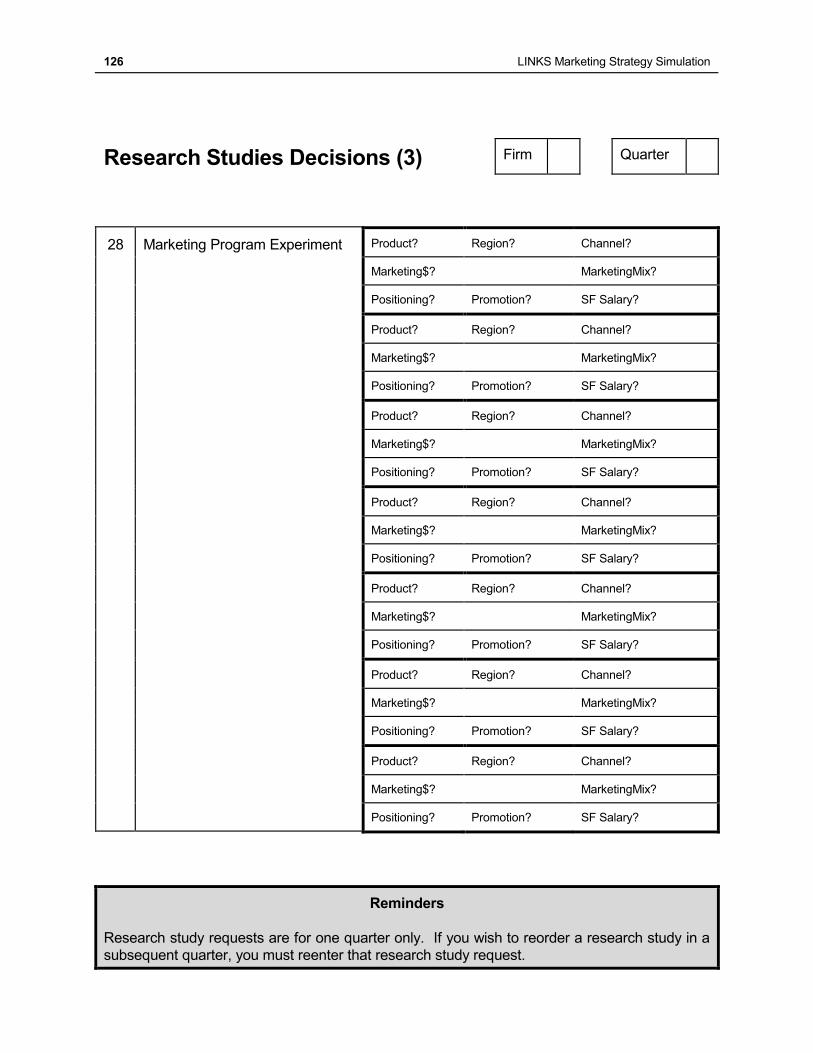
126 LINKS Marketing Strategy Simulation
Research Studies Decisions (3) Firm Quarter
28 Marketing Program Experiment Product? Region? Channel?
Marketing$? MarketingMix?
Positioning? Promotion? SF Salary?
Product? Region? Channel?
Marketing$? MarketingMix?
Positioning? Promotion? SF Salary?
Product? Region? Channel?
Marketing$? MarketingMix?
Positioning? Promotion? SF Salary?
Product? Region? Channel?
Marketing$? MarketingMix?
Positioning? Promotion? SF Salary?
Product? Region? Channel?
Marketing$? MarketingMix?
Positioning? Promotion? SF Salary?
Product? Region? Channel?
Marketing$? MarketingMix?
Positioning? Promotion? SF Salary?
Product? Region? Channel?
Marketing$? MarketingMix?
Positioning? Promotion? SF Salary?
Reminders
Research study requests are for one quarter only. If you wish to reorder a research study in a
subsequent quarter, you must reenter that research study request.
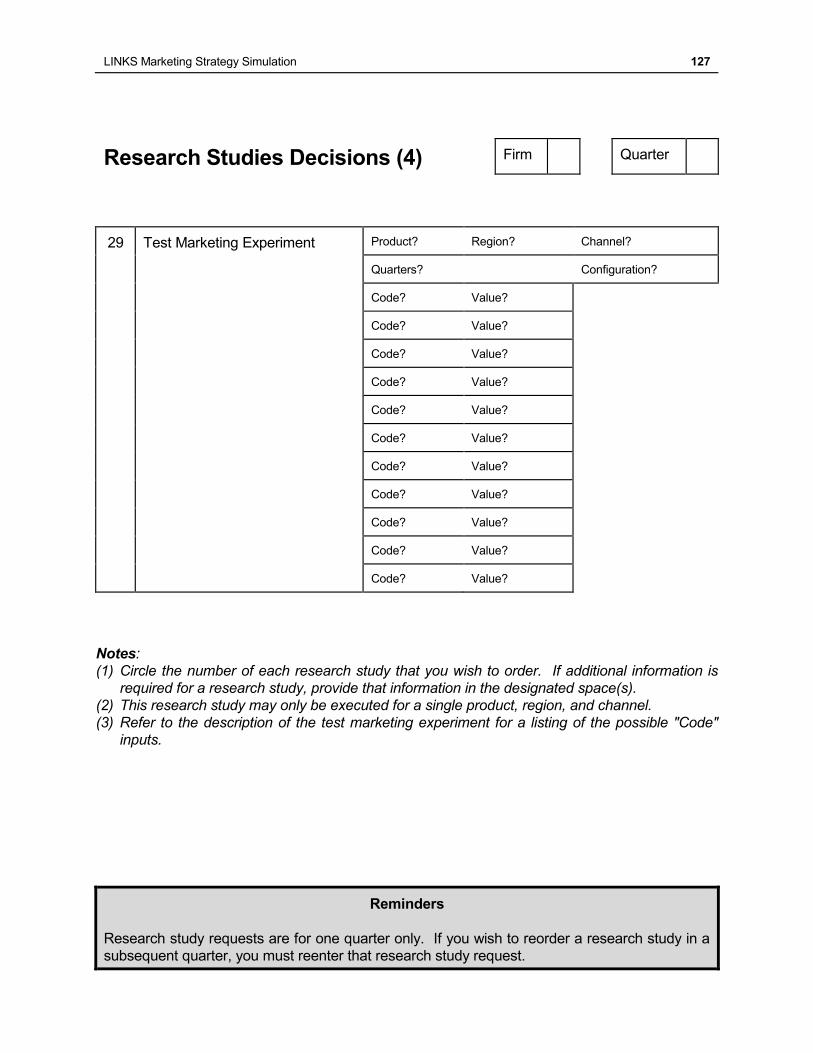
LINKS Marketing Strategy Simulation 127
Research Studies Decisions (4) Firm Quarter
29 Test Marketing Experiment Product? Region? Channel?
Quarters? Configuration?
Code? Value?
Code? Value?
Code? Value?
Code? Value?
Code? Value?
Code? Value?
Code? Value?
Code? Value?
Code? Value?
Code? Value?
Code? Value?
Notes:
(1) Circle the number of each research study that you wish to order. If additional information is
required for a research study, provide that information in the designated space(s).
(2) This research study may only be executed for a single product, region, and channel.
(3) Refer to the description of the test marketing experiment for a listing of the possible "Code"
inputs.
Reminders
Research study requests are for one quarter only. If you wish to reorder a research study in a
subsequent quarter, you must reenter that research study request.
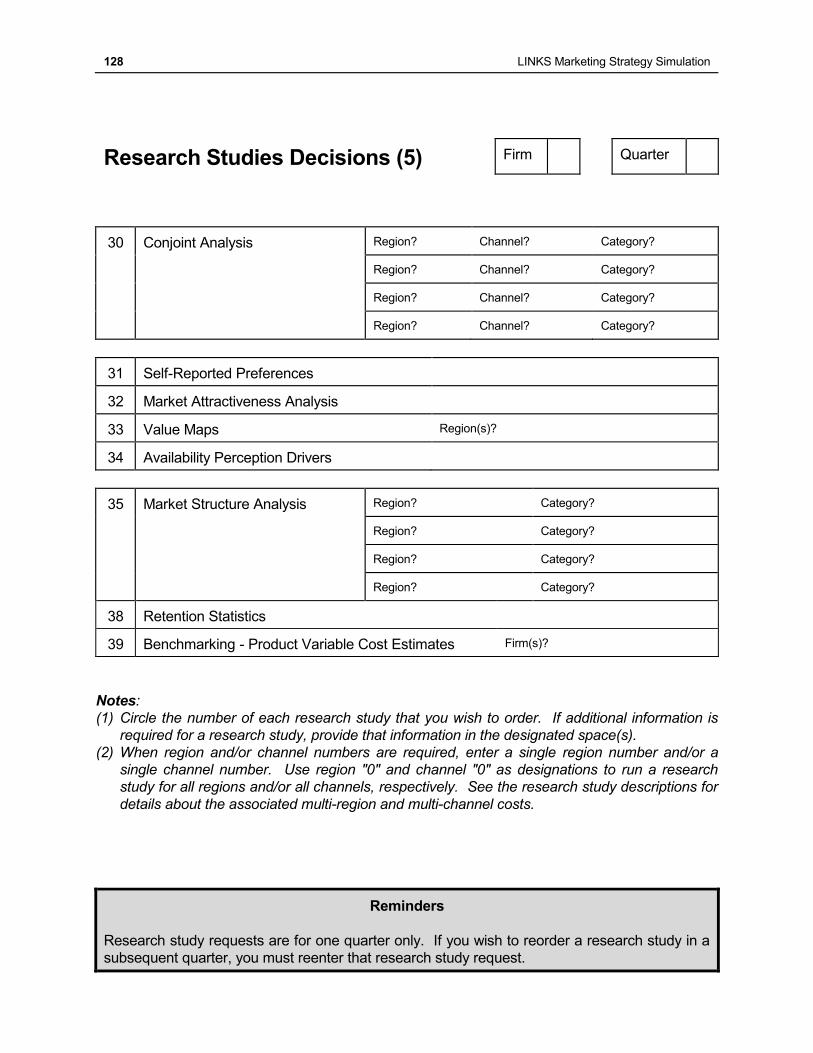
128 LINKS Marketing Strategy Simulation
Research Studies Decisions (5) Firm Quarter
30 Conjoint Analysis Region? Channel? Category?
Region? Channel? Category?
Region? Channel? Category?
Region? Channel? Category?
31 Self-Reported Preferences
32 Market Attractiveness Analysis
33 Value Maps Region(s)?
34 Availability Perception Drivers
35 Market Structure Analysis Region? Category?
Region? Category?
Region? Category?
Region? Category?
38 Retention Statistics
39 Benchmarking - Product Variable Cost Estimates Firm(s)?
Notes:
(1) Circle the number of each research study that you wish to order. If additional information is
required for a research study, provide that information in the designated space(s).
(2) When region and/or channel numbers are required, enter a single region number and/or a
single channel number. Use region "0" and channel "0" as designations to run a research
study for all regions and/or all channels, respectively. See the research study descriptions for
details about the associated multi-region and multi-channel costs.
Reminders
Research study requests are for one quarter only. If you wish to reorder a research study in a
subsequent quarter, you must reenter that research study request.
LINKS Marketing Strategy Simulation 129
Chapter 15: Performance Evaluation
"In a good wind, even turkeys can fly." – Chinese saying
This chapter provides a detailed description of the quantitative performance evaluation
mechanism used within LINKS. Since there are many facets of evaluation to consider in a
business, a multi-dimensional scorecard is used. As you will note, both current performance and
change in performance (hopefully, improvement!) are considered in this multi-dimensional
quantitative performance evaluation scorecard.
Perspective
"At Federal Express, we realized pretty early on that we had too small a scoreboard
to know what was happening. We could measure revenue, of course, and whether
we were adding or losing customers. But if you depend exclusively on final
outcomes like revenues and lost customers to track quality, you'll learn about your
quality problems by going out of business." – Tom Oliver, Senior Vice President -
International, Federal Express (1990 Malcolm Baldridge Winner)
Many things matter in evaluating the
performance of a business. Obvious
financial performance measures include
absolute profitability, relative profitability (e.g.,
the ratio of profits to revenues or the ratio of
profits to investments), change in profitability,
or stock prices for public companies. Stock
prices are, of course, related to expectations
of future profitability and such expectations
are based on current and recent profitability
patterns.
It's hard to argue with profitability-like
measures as the correct things to examine to
assess the long-run performance of a
business. However, in a shorter-run
perspective, other things matter too. These
"other things" are leading indicators of future
profitability and root causes of profitability.
Multiple measures of performance evaluation
obviously lead to conflicts. Short-run and
long-run trade-offs are obvious. For
example, by reducing inventories and product
support spending (marketing and service
spending), current costs will decrease and
profits will tend to increase. However, in the
long-run, these might be exactly the wrong
FYI: When Good Customers Are Bad: Cost-
To-Serve Analytics
Companies don’t just sell product; they sell
“delivered product.” In virtually every industry,
they coddle customers with supply chain
services such as next-day delivery, customized
handling, and specialized labeling. But few
companies track the real costs of the myriad
services they offer – and most have no idea
how much they’re losing.
Because conventional accounting methods and
average-cost assumptions obscure the true
effect of these services on the bottom line, sales
executives often view them as minor
concessions needed to close the deal. As a
result, the high-volume customers who receive
the lion’s share of these services may be far
less profitable than companies think. Even
worse, in their zeal to push sales volume, firms
may be implicitly driving their sales forces to
extend unprofitable services to the entire
customer base.
Source: Remko Van Hoek and David Evans, “When Good
Customers Are Bad,” Harvard Business Review
(September 2005), p. 19.
130 LINKS Marketing Strategy Simulation
things to do to maximize long-run profitability. Subtler trade-offs arise in potentially conflicting
performance measures that move in opposite directions. For example, inventory reductions save
costs on the inventory and manufacturing fronts but may lead to shortages to meet the levels of
customer demand in the distribution centers. Balancing all of these conflicting trade-offs is the
challenge for management.
The various performance measures within LINKS are designed to monitor all key elements of
performance assessment:
efficiency (input usage)
effectiveness (output quality)
productivity (conversion of inputs into output)
firm-wide profitability
external performance (e.g., change in market share and customer satisfaction perceptions).
The LINKS Scorecard
"A balanced scorecard approach relies on key performance indicators
(KPIs), and the great value of KPIs is that if you can measure something,
you can improve it." – Jeff Henley, CFO, Oracle Corporation
The LINKS scorecard is perhaps described more aptly as a boardroom-level scorecard. It
focuses on top-line boardroom kinds of financial, operational, and customer performance
measures and sub-measures. The LINKS scorecard includes the measures and weights
described in Exhibits 14-16. Each firm in your set-top box industry submits their raw data to the
Set-Top Box Trade Association, which provides your firm's personal scorecard every quarter.
The LINKS scorecard is based on a ranking of performance on each sub-measure. These rank-
order comparisons across all competing firms within your industry avoid the undue influence of
particularly extreme values of individual sub-measures. This LINKS scorecard is a within-industry
performance evaluation system. Comparisons across industries are problematic due to variations
in environmental and competitive milieu.
Your firm receives weighted points for each competitor for whom your performance on a sub-
measure is better. For some of the sub-measures, "better" means a lower sub-measure value
(e.g., the "Ratio of Controllable Procurement and Manufacturing Costs To Revenues" is a lower-
is-better sub-measure). For example, if your firm's ratio of "Net Profits" to "Revenues" is better
than three other firms' ratios, your firm receives 9 points. (Of course, the top-performing firm on
"Net Income" to "Revenues" ratio in a 6-firm industry would receive 15 points.) In general, the
maximum available points on any sub-measure are W*(N-1) where "W" is the sub-measure's
weight and "N" is the number of firms in the industry. Points accumulate each quarter throughout
the LINKS exercise.
LINKS Marketing Strategy Simulation 131
To avoid an overemphasis on minor quarter-
to-quarter variations in the calculation of the
ranking of firms on the performance sub-
measures in the LINKS scorecard, minor
differences in the sub-measures are treated
as ties in the calculation of ranking points.
The thresholds for differences to be treated as
meaningful are listed in Exhibits 14-16 for
each sub-measure. For example, differences
of 0.2% or less for "Ratio of Net Income to
Revenues" are considered to be statistically
insignificant, and firms within 0.2% of each
other would be treated as being tied. Thus,
two firms with ratios of Net Income to
Revenues of 4.5% and 4.6% would be treated
as being tied in the calculation of ranking
position and associated points received in any
quarter.
A sample LINKS scorecard is shown in Exhibit
17. You receive this scorecard automatically
each quarter as the first page of your financial
and operating reports. This scorecard
provides comparatives to assess how your
firm's data compares to the industry averages
and industry bests for every KPI. You can
assess where your firm stands compared to
competitors with this scorecard.
FYI: Supply Chain KPIs
Delivery Performance: % of orders fulfilled
on or before customer request date or
original scheduled date.
Fill Rate: % of shipments from stock
shipped within one day of order receipt.
Lead Time: average actual lead times
consistently achieved from customer
authorization to order receipt.
Perfect Order Fulfillment: % of orders
meeting delivery performance with complete
and accurate documentation and
undamaged
Supply Chain Response Time: time for the
integrated supply chain to respond to
abnormal (significant) demand change.
Total Logistics Cost: sum of supply chain-
related cost for MIS, finance, planning,
inventory, material acquisition, and order
management.
Value-Added Productivity: total product
revenue minus total material purchases
divided by total employees.
Warranty Costs: sum of costs of materials,
labor, and problem diagnosis for product
defects.
Inventory Days of Supply: total gross value
of inventory at standard cost before reserves
for excess and obsolescence.
Cash-To-Cash Cycle Time: inventory days
of supply plus days sales outstanding minus
days of payables.
Asset Turns: turns of capital employed.
Source: Adapted from Steve Banker and Sid Snitkin,
"Continuous Improvement: A Foundation For Operational
Excellence," Supply Chain Management Review
(March/April 2003), p. 46 {Exhibit 4: Supply Chain
Operational Excellence (Adapted from SCOR Model)}.

132 LINKS Marketing Strategy Simulation
Exhibit 14: Scorecard Financial Measures
Sub-Measures Weight Sub-Measure Details
Ratio of Net Income to
Revenues
3 Current profitability is the best overall signal of business
performance, hence its high weight. Firms are "tied" if
their scores are within 0.2% of each other.
Change in Ratio of Net
Income to Revenues
1 Improvement in profitability is important but less important
than current profitability. Firms are "tied" if their scores
are within 0.2% of each other.
Return on Assets 2 Return means "Net Income" (from the "Corporate P&L
Statement") and investment equals "Total Assets" (from
the "Balance Sheet"). This ratio is expressed in
annualized terms. Firms are "tied" if their scores are
within 0.5% of each other.
Net Asset Turns 1 Ratio of revenues to net assets. Net assets are assets
minus loans. This measure reflects the desirability of
higher revenues relative to the assets deployed to yield
these revenues. This ratio is expressed in annualized
terms. Firms are "tied" if their scores are within 0.2 of
each other.
Notes: Positive "weights" are associated with sub-measures where "more is better" and negative "weights" are
associated with sub-measures where "less is better." "Change" measures are based on quarter-to-quarter changes.
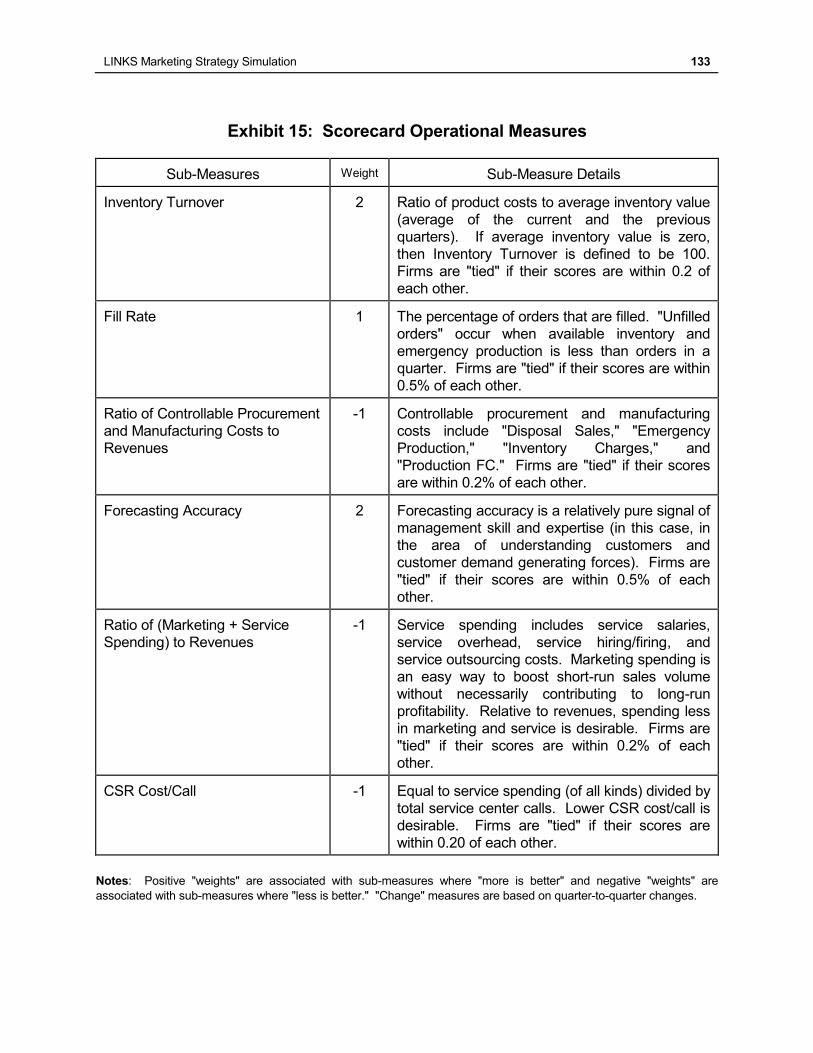
LINKS Marketing Strategy Simulation 133
Exhibit 15: Scorecard Operational Measures
Sub-Measures Weight Sub-Measure Details
Inventory Turnover 2 Ratio of product costs to average inventory value
(average of the current and the previous
quarters). If average inventory value is zero,
then Inventory Turnover is defined to be 100.
Firms are "tied" if their scores are within 0.2 of
each other.
Fill Rate 1 The percentage of orders that are filled. "Unfilled
orders" occur when available inventory and
emergency production is less than orders in a
quarter. Firms are "tied" if their scores are within
0.5% of each other.
Ratio of Controllable Procurement
and Manufacturing Costs to
Revenues
-1 Controllable procurement and manufacturing
costs include "Disposal Sales," "Emergency
Production," "Inventory Charges," and
"Production FC." Firms are "tied" if their scores
are within 0.2% of each other.
Forecasting Accuracy 2 Forecasting accuracy is a relatively pure signal of
management skill and expertise (in this case, in
the area of understanding customers and
customer demand generating forces). Firms are
"tied" if their scores are within 0.5% of each
other.
Ratio of (Marketing + Service
Spending) to Revenues
-1 Service spending includes service salaries,
service overhead, service hiring/firing, and
service outsourcing costs. Marketing spending is
an easy way to boost short-run sales volume
without necessarily contributing to long-run
profitability. Relative to revenues, spending less
in marketing and service is desirable. Firms are
"tied" if their scores are within 0.2% of each
other.
CSR Cost/Call -1 Equal to service spending (of all kinds) divided by
total service center calls. Lower CSR cost/call is
desirable. Firms are "tied" if their scores are
within 0.20 of each other.
Notes: Positive "weights" are associated with sub-measures where "more is better" and negative "weights" are
associated with sub-measures where "less is better." "Change" measures are based on quarter-to-quarter changes.
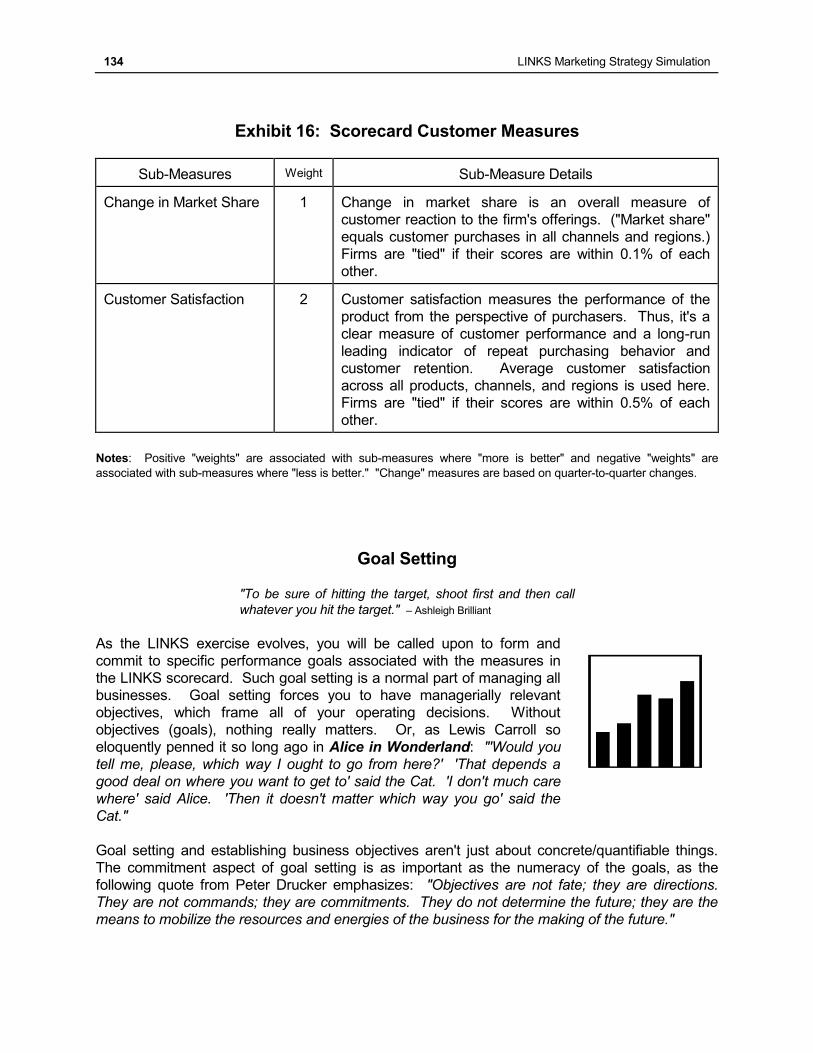
134 LINKS Marketing Strategy Simulation
Exhibit 16: Scorecard Customer Measures
Sub-Measures Weight Sub-Measure Details
Change in Market Share 1 Change in market share is an overall measure of
customer reaction to the firm's offerings. ("Market share"
equals customer purchases in all channels and regions.)
Firms are "tied" if their scores are within 0.1% of each
other.
Customer Satisfaction 2 Customer satisfaction measures the performance of the
product from the perspective of purchasers. Thus, it's a
clear measure of customer performance and a long-run
leading indicator of repeat purchasing behavior and
customer retention. Average customer satisfaction
across all products, channels, and regions is used here.
Firms are "tied" if their scores are within 0.5% of each
other.
Notes: Positive "weights" are associated with sub-measures where "more is better" and negative "weights" are
associated with sub-measures where "less is better." "Change" measures are based on quarter-to-quarter changes.
Goal Setting
"To be sure of hitting the target, shoot first and then call
whatever you hit the target." – Ashleigh Brilliant
As the LINKS exercise evolves, you will be called upon to form and
commit to specific performance goals associated with the measures in
the LINKS scorecard. Such goal setting is a normal part of managing all
businesses. Goal setting forces you to have managerially relevant
objectives, which frame all of your operating decisions. Without
objectives (goals), nothing really matters. Or, as Lewis Carroll so
eloquently penned it so long ago in Alice in Wonderland: "'Would you
tell me, please, which way I ought to go from here?' 'That depends a
good deal on where you want to get to' said the Cat. 'I don't much care
where' said Alice. 'Then it doesn't matter which way you go' said the
Cat."
Goal setting and establishing business objectives aren't just about concrete/quantifiable things.
The commitment aspect of goal setting is as important as the numeracy of the goals, as the
following quote from Peter Drucker emphasizes: "Objectives are not fate; they are directions.
They are not commands; they are commitments. They do not determine the future; they are the
means to mobilize the resources and energies of the business for the making of the future."
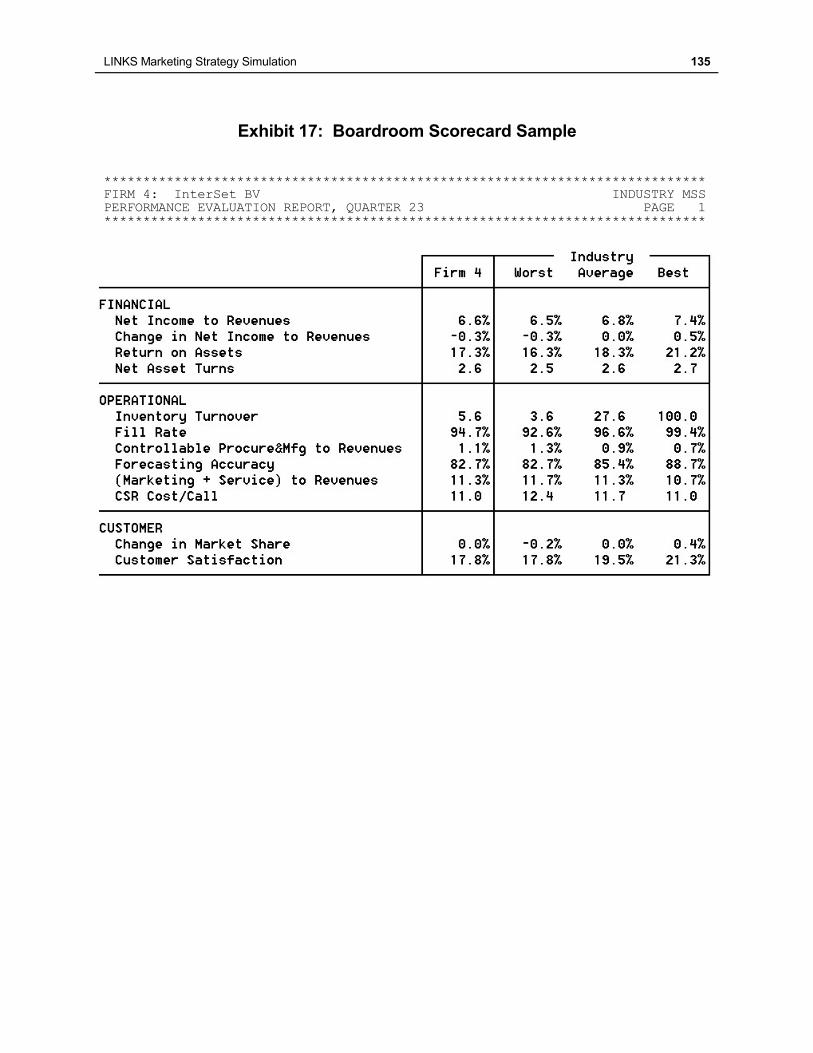
LINKS Marketing Strategy Simulation 135
Exhibit 17: Boardroom Scorecard Sample
***************************************************************************** FIRM 4: InterSet BV INDUSTRY MSS PERFORMANCE EVALUATION REPORT, QUARTER 23 PAGE 1 *****************************************************************************
136 LINKS Marketing Strategy Simulation
Chapter 16: Firm Management and Advice
"Success doesn't come to you. You go to it." – Marva Collins
This chapter reviews a variety of relevant topics related to managing your LINKS firm. Issues
related to planning are discussed. Several worksheets are provided to assist you in your
planning-related tasks within LINKS. In addition, some suggestions regarding your decision
making near the end of the LINKS exercise are offered. Specific and general advice is offered
regarding your participation in LINKS.
Planning
"Direct, simple plans, and clear concise orders are essential to reduce the
chances of misunderstanding and confusion. Other factors being equal,
the simplest plan executed promptly is to be preferred over the complex
plan executed later." – U.S. Army Field Manual 100-5
Planning occurs throughout the LINKS exercise. Your decisions are your plans. But that's not the
whole story. How are plans developed? And, much more importantly, how are good plans
developed?
Planning and plans are the consequence of careful analysis and formulation of appropriate
strategies and tactics. Your plan is, therefore, the natural consequence of considerable prior
analysis and thinking. This analysis-planning-implementation-evaluation sequence iterates
through time as the results of your plans are revealed in the market place (and in your financial
and operating statements).
The essence of planning involves answering these questions (and in this order):
(1) What is happening?
(2) How are we doing?
(3) How and what are "they" (our major competitors) doing?
(4) What factors are important for success?
(5) What are we going to do? Why? With what effect? At what cost?
(6) Who - specifically - is to do what to make the plan work?
Four worksheets help you in LINKS planning.
The SWOT Analysis Worksheet is the classic strengths-weaknesses-opportunities-threats
template for organizing your thoughts under the "What is happening?" and "How are we
doing?" questions.
The Market Attractiveness Analysis Worksheet provides a template for rating and assessing
the relative attractiveness of the various markets (categories, regions, and channels) in the
set-top box industry.
The KPI Worksheet is a template to structure your thinking and analysis related to specific
KPIs that you might wish to improve as a result of your planning efforts. Use the KPI
Worksheet frequently to organize your thoughts on performance drivers.
The Competitive Advantage Audit Worksheet provides a market-based tool for assessing the
current relative standing (relative to competitors) of each of your products in each channel and
LINKS Marketing Strategy Simulation 137
regional market, relative to the major customer drivers (price, product quality, service quality,
and availability). Goals, strategies and tactics, and execution details are all identified as to-be-
completed items, based on the competitive advantage audit template in the top-half of this
worksheet.
These worksheets may be found on the following four pages.
Team Management and Organization
"Great leaders are almost always great simplifiers, who can cut through argument, debate
and doubt, to offer a solution everybody can understand." – General Colin Powell
You are a member of a team in LINKS. Managing your team to obtain the best efforts of all team
members is a continuing management challenge.
Your most limited resource within LINKS is your team's available time. Well-performing teams
inevitably manage their management time carefully and thoughtfully. You will need to think
carefully about how to allocate your management time to necessary tasks that exist within
LINKS.
As you gain experience with LINKS, it may well appear that a review is needed of an earlier
group decision about how to allocate tasks, responsibilities, and available management time.
Don't be shy within your LINKS team about asking the question: "Are we organized in the
best way for the tasks ahead?" This is always a good question.
There are predictable signals of well-performing teams in simulations (and in real life!). Pamela
Van Rees (Boston University MBA student), provided the following list of characteristics of well-
functioning simulation teams:
The firm's long-term well-being is the top priority of all members.
Relevant issues are fully and adequately explored.
Proposals and objectives are clearly explained.
Members feel comfortable and spontaneous.
Feedback is given freely and directly.
Members feel respected, supported, and listened to.
Disagreements are tactfully stated without being offensive.
Differences and misunderstandings are resolved in such a way as to strengthen and deepen
rather than weaken relationships (by exploring the origins and implication of ideas).
Everyone's judgment is acknowledged and explored.
Interruptions are minimal.
Everyone's schedule is accommodated as fully as possible.
At any given time in a group meeting, each firm member is either engaged in holding the
focus (proposing an idea or decision), listening to another's focus, giving feedback about the
focus, or facilitating (creating the structure or leading) the discussion.
The principal causes of poor team performance in the simulation are a combination of the
following factors:
(1) uncoordinated supply chain management;
(2) not really meeting customer requirements for set-top boxes (i.e., failure to establish any
meaningful differential advantage, particularly regarding product configuration);
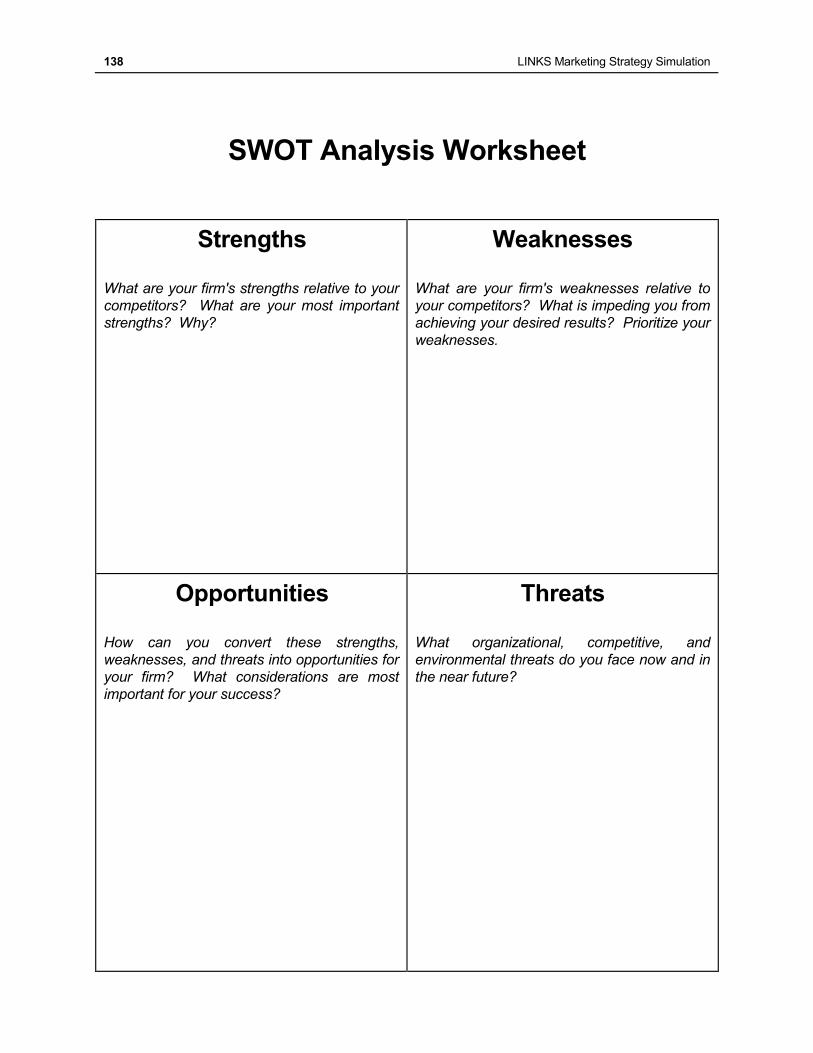
138 LINKS Marketing Strategy Simulation
SWOT Analysis Worksheet
Strengths What are your firm's strengths relative to your
competitors? What are your most important
strengths? Why?
Weaknesses What are your firm's weaknesses relative to
your competitors? What is impeding you from
achieving your desired results? Prioritize your
weaknesses.
Opportunities How can you convert these strengths,
weaknesses, and threats into opportunities for
your firm? What considerations are most
important for your success?
Threats What organizational, competitive, and
environmental threats do you face now and in
the near future?
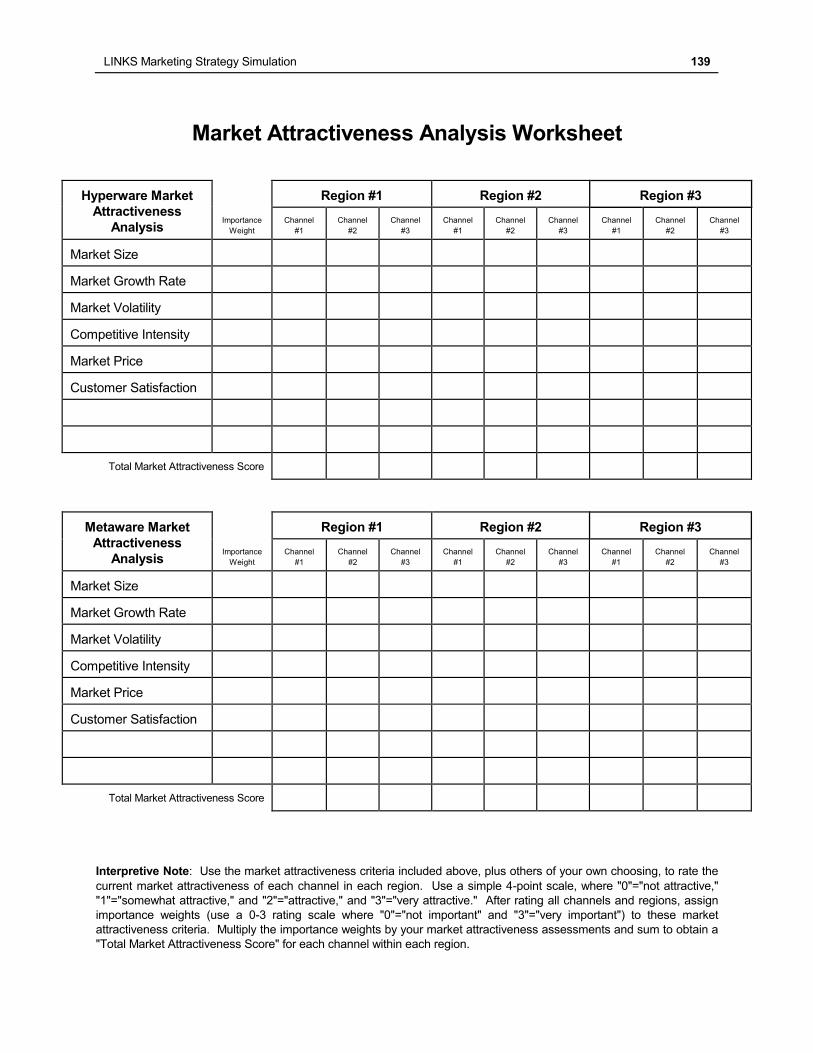
LINKS Marketing Strategy Simulation 139
Market Attractiveness Analysis Worksheet
Hyperware Market
Attractiveness
Analysis
Region #1 Region #2 Region #3
Importance
Weight
Channel
#1
Channel
#2
Channel
#3
Channel
#1
Channel
#2
Channel
#3
Channel
#1
Channel
#2
Channel
#3
Market Size
Market Growth Rate
Market Volatility
Competitive Intensity
Market Price
Customer Satisfaction
Total Market Attractiveness Score
Metaware Market
Attractiveness
Analysis
Region #1 Region #2 Region #3
Importance
Weight
Channel
#1
Channel
#2
Channel
#3
Channel
#1
Channel
#2
Channel
#3
Channel
#1
Channel
#2
Channel
#3
Market Size
Market Growth Rate
Market Volatility
Competitive Intensity
Market Price
Customer Satisfaction
Total Market Attractiveness Score
Interpretive Note: Use the market attractiveness criteria included above, plus others of your own choosing, to rate the
current market attractiveness of each channel in each region. Use a simple 4-point scale, where "0"="not attractive,"
"1"="somewhat attractive," and "2"="attractive," and "3"="very attractive." After rating all channels and regions, assign
importance weights (use a 0-3 rating scale where "0"="not important" and "3"="very important") to these market
attractiveness criteria. Multiply the importance weights by your market attractiveness assessments and sum to obtain a
"Total Market Attractiveness Score" for each channel within each region.
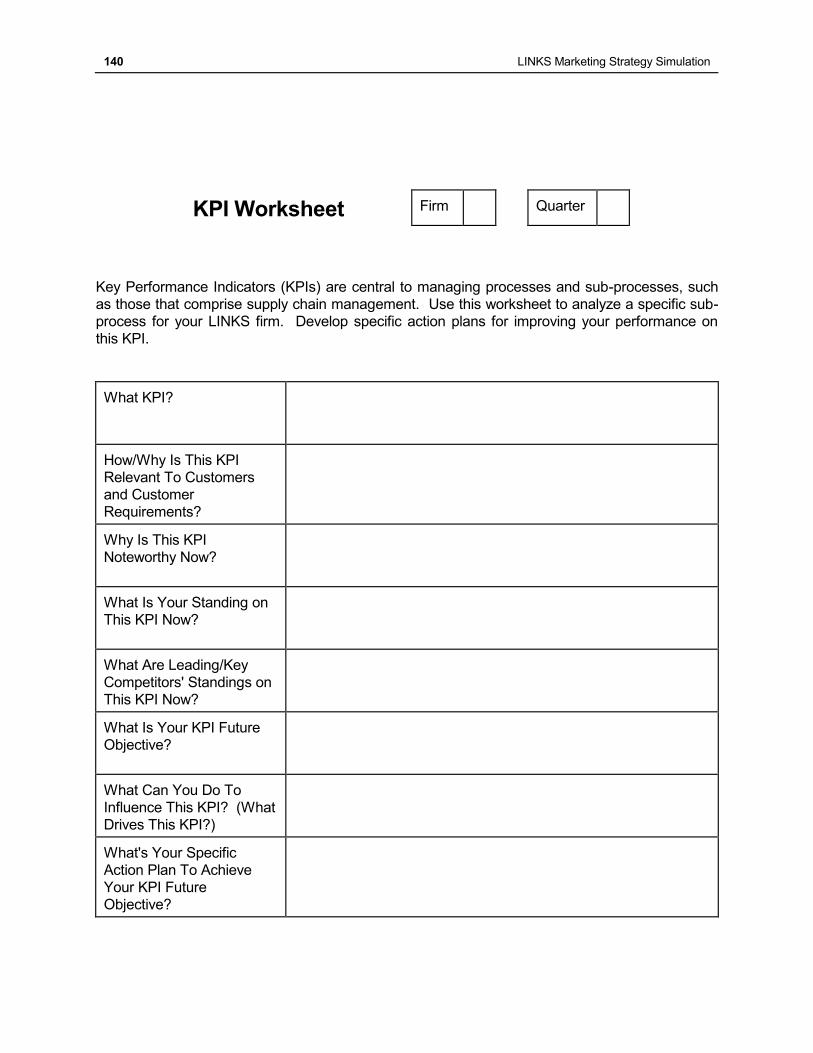
140 LINKS Marketing Strategy Simulation
KPI Worksheet Firm Quarter
Key Performance Indicators (KPIs) are central to managing processes and sub-processes, such
as those that comprise supply chain management. Use this worksheet to analyze a specific sub-
process for your LINKS firm. Develop specific action plans for improving your performance on
this KPI.
What KPI?
How/Why Is This KPI
Relevant To Customers
and Customer
Requirements?
Why Is This KPI
Noteworthy Now?
What Is Your Standing on
This KPI Now?
What Are Leading/Key
Competitors' Standings on
This KPI Now?
What Is Your KPI Future
Objective?
What Can You Do To
Influence This KPI? (What
Drives This KPI?)
What's Your Specific
Action Plan To Achieve
Your KPI Future
Objective?
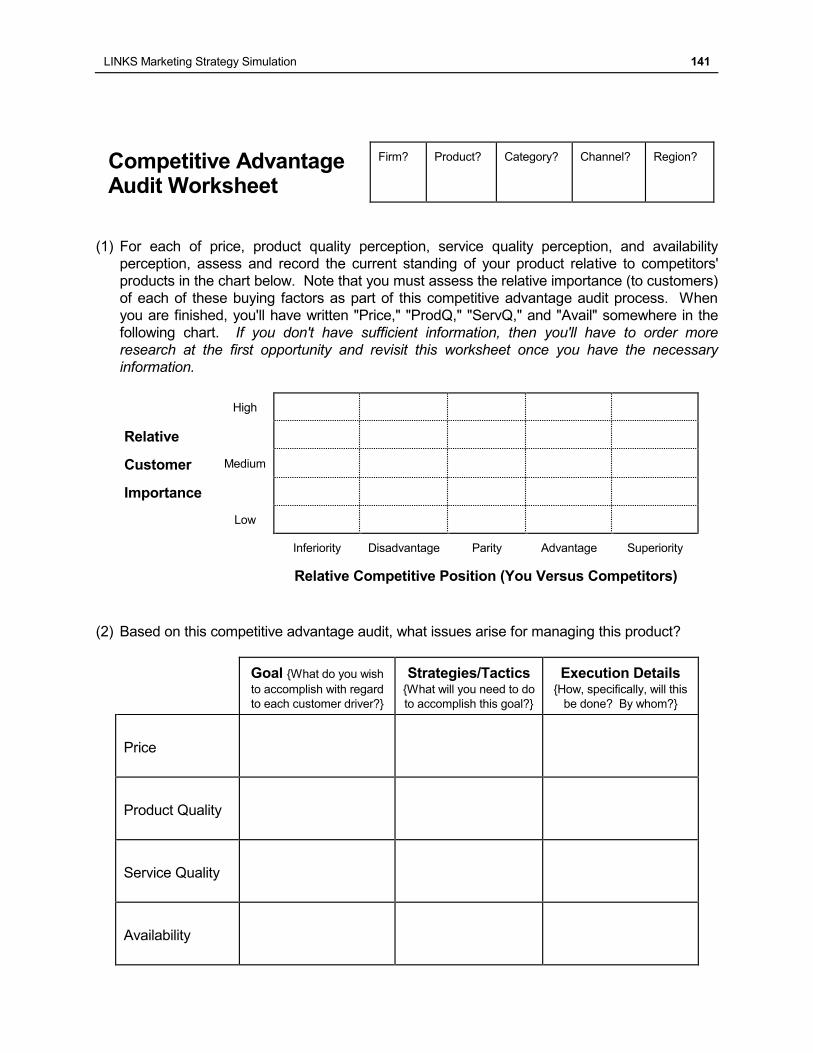
LINKS Marketing Strategy Simulation 141
Competitive Advantage Audit Worksheet
Firm? Product? Category? Channel? Region?
(1) For each of price, product quality perception, service quality perception, and availability
perception, assess and record the current standing of your product relative to competitors'
products in the chart below. Note that you must assess the relative importance (to customers)
of each of these buying factors as part of this competitive advantage audit process. When
you are finished, you'll have written "Price," "ProdQ," "ServQ," and "Avail" somewhere in the
following chart. If you don't have sufficient information, then you'll have to order more
research at the first opportunity and revisit this worksheet once you have the necessary
information.
High
Relative
Customer Medium
Importance
Low
Inferiority Disadvantage Parity Advantage Superiority
Relative Competitive Position (You Versus Competitors)
(2) Based on this competitive advantage audit, what issues arise for managing this product?
Goal {What do you wish
to accomplish with regard
to each customer driver?}
Strategies/Tactics {What will you need to do
to accomplish this goal?}
Execution Details {How, specifically, will this
be done? By whom?}
Price
Product Quality
Service Quality
Availability
142 LINKS Marketing Strategy Simulation
(3) lack of focus (capacity, reconfiguration, time, and human resource constraints combine to
favor concentrated effort in fewer than "all" market regions);
(4) limited research and/or limited efforts to interpret the research studies that are available;
(5) limited attention to competitive developments (i.e., lack of in-depth competitor analysis to
discover the underlying drivers of market behavior);
(6) financial mismanagement related to cost structure management (variable and fixed costs
management, covering corporate-wide overheads, etc.), production and inventory levels, and
capacity management;
(7) not understanding the simulation's structure/environment (i.e., treating the participant's manual
in a cursory, fashion rather than something to be studied and referenced regularly);
(8) poor work ethic (not spending enough time on the simulation); and,
(9) team mismanagement (not spending enough time thinking about and discussing team
management issues and related human resource deployment strategies and tactics).
End-Gaming Strategies and Tactics
"It's time to break camp." – Dwight Dowdell, Accenture
Should you do anything special or unusual at or near the end of your LINKS exercise? Behave as
if the simulation will not end at any specific pre-announced quarter. Keep a long-run view and
continuously try to improve your firm's performance. Attempts to end-game the simulation can
easily be counter-productive, resulting in substantial last-minute deteriorations in hard-earned
market share, margins, and profits. Also, how do you know for sure that the simulation will really
end after a particular quarter? Perhaps there will be an unexpected and unannounced change at
the last minute, resulting in a longer or shorter simulation exercise. All in all, taking a long-run
view seems like the only sensible and prudent thing to do.
The best counsel about end-gaming is simply to manage your firm to improve its profitability
through time. You don't have to get it perfect (i.e., achieve "optimal" profits, whatever that is), but
you must improve through time. You take over a LINKS firm that is profitable as of quarter 1.
Seek to improve your firm's profitability through time ... and that time extends to and beyond the
actual end of your particular LINKS exercise.
General Advice
"The fight is won or lost far away from witnesses, behind the lines in the gym and
out on the road, long before I dance under those lights." – Muhammad Ali
Based on extensive observations of the performance of thousands of past LINKS participants,
these general suggestions and summary-advice nuggets are of well-proven value:
Read and re-read this LINKS participant's manual (there's lots of good stuff in it).
Regularly think about general business and management principles and how they might relate
to and work within LINKS.
You don't have to know everything about the LINKS set-top box industry at the beginning of
the exercise, but you must consistently increase your knowledge-base through time.
"Share toys" (i.e., work hard at sharing your useful fact-based analyses and important insights
with all members of your LINKS team). "Knowing" something important personally is only a
part of the LINKS management challenge. Exploiting that knowledge effectively throughout all
LINKS Marketing Strategy Simulation 143
of your LINKS team's deliberations, with and through your whole LINKS team, is the key to
harvesting the maximum ROI from your data, facts, analysis methodologies, insights, and
knowledge.
Get the facts and base your decisions on the facts, not on wishes, hopes, and dreams.
Coordinate demand and supply by continually striving to see the whole demand-chain and
supply-chain within the LINKS set-top box industry. Don't focus myopically on a single part of
the LINKS demand-chain without regard for how it relates to, and is influenced by, other
LINKS parts and to the "whole" of LINKS. The source of the "LINKS" name is the simulation's
focus on managing the interrelationships, the linkages, among all supply-chain elements.
Remember the Ferengi proverb (for Star Trek fans): "There is no honor in volume without
profit." Volume, sales, and market share is easy to obtain, if there are no constraints on
profitability. Profitable volume is the "holy grail" in business and in LINKS.
Postscript "The journey is the reward." – Steve Jobs, Apple Computer Founder
Good luck and try to have fun in LINKS. It's all about learning and, in a "learning marathon" like
LINKS, everyone can cross the finish line in a personal-best time.
144 LINKS Marketing Strategy Simulation
LINKS Supplement: In-Basket Exercise
Your LINKS instructor will advise you if and how this optional LINKS
supplemental material will be used as part of your LINKS exercise.
Introduction
This exercise is designed to allow you to demonstrate some of the skills required of marketing
managers. This marketing management in-basket exercise supplements the LINKS Marketing
Strategy Simulation experience in a number of important ways. The public debriefing at the
conclusion of this in-basket exercise will be particularly valuable.
Read the enclosed materials and take whatever actions you believe are appropriate
in the circumstances. Please behave as if you are actually on the job described in
the following pages. You must work alone. You only have the information attached
to this instruction sheet. You must let others know exactly what you plan to do
with each item in your in-basket, so be sure to put everything in writing. You may
jot notes on this following pages, as you see fit.
In handling the items in your in-basket, you will have to set priorities, analyze available
information, make decisions, and communicate with others (via written memos only). Of course,
these are the things that marketing managers do routinely.
The recommended time to complete this in-basket exercise is one hour. Your
course instructor might modify this time limit or choose to use this in-basket
exercise in another way than described here. Please follow the specific
instructions of your course instructor in completing this marketing management in-
basket exercise. After completing this marketing management in-basket exercise,
you should be prepared to participate in any post-exercise debriefing.
Background Information
You are I. M. Debest, newly appointed Product Manager for VAPORIZE, a leading vaporware
brand. You have just completed your first full week as VAPORIZE Product Manager. You have
been appointed to your position to help VAPORIZE become the recognized market leader in the
vaporware category. VAPORIZE was just reconfigured last quarter (quarter #26).
You replaced Chandy Rapman, former VAPORIZE Product Manager. You work for Vapor
Unlimited Corporation, which manufactures, distributes, and markets a wide range of products
and services in an ever-expanding array of product/service categories. You report to Sandy Feat,
Divisional Marketing Manager. Pat is your administrative assistant. You share Pat with two other
Product Managers. You don’t have an Associate or Assistant Product Manager, although that is a
subject that you hope to raise in the near future with Sandy Feat, your boss (and Divisional
LINKS Marketing Strategy Simulation 145
Marketing Manager).
It is now 6:00pm Sunday evening and you are in your office. You'll be leaving in one hour for a
four-day out-of-town industry convention. You'll return from the convention late Thursday evening.
Since your planned convention activities are extensive during the next four days, it will be
inconvenient to communicate with your office except in the most dire of circumstances. Indeed,
your plan is to take no additional regular work with you to this industry convention since your at-
convention commitments and activities are so extensive.
Since your office works a regular Monday-Friday weekday schedule, it is closed on weekends.
Thus, you are alone in your office now. Although the telephone system is in good working order,
assume for the purposes of this in-basket exercise that you don't have access to anyone's home
phone number so it is not possible to contact anyone this evening. Also, due to a major IT system
upgrade scheduled for this weekend, you do not have access to e-mail either.
On Friday, you are scheduled to be in an all-day staff meeting presenting your ideas and plans for
VAPORIZE for the first time. Before you leave, you must go through the items in your in-basket
and handle each in-basket item as you feel appropriate.
Be sure to write down everything you plan to do by constructing written memos/notes to
yourself or to others as you see fit.
Key Points Summary
You are I.M. Debest, newly-appointed VAPORIZE Product Manager.
It's now 600pm Sunday evening.
You must leave for the airport in one hour to attend a four-day industry convention. You'll be
so busy at the industry convention with pre-scheduled appointments and convention-related
activities that it will be impossible to perform any regular work during the convention. Anything
not accomplished in the next hour will have to await your return.
You'll return from the industry convention on Thursday evening.
You're scheduled to participate in an all-day staff meeting on Friday.
The next opportunity to perform regular day-to-day work will be Monday, eight days hence.
Read these materials and take whatever actions you believe are appropriate in the
circumstances. Behave as if you are actually on the job described in this in-basket exercise.
You must work alone on this in-basket exercise.
You only have the information attached to this instruction sheet.
You need to let others know what you plan to do with each item in your in-basket, so be sure
to put everything in writing. You may jot notes on the following pages, as you see fit.
In-Basket Materials
Your administrative assistant, Pat, has assembled some background information on the following
two pages. This is the only historical information available about your brand. In addition, you
have six pages of material in your in-basket.
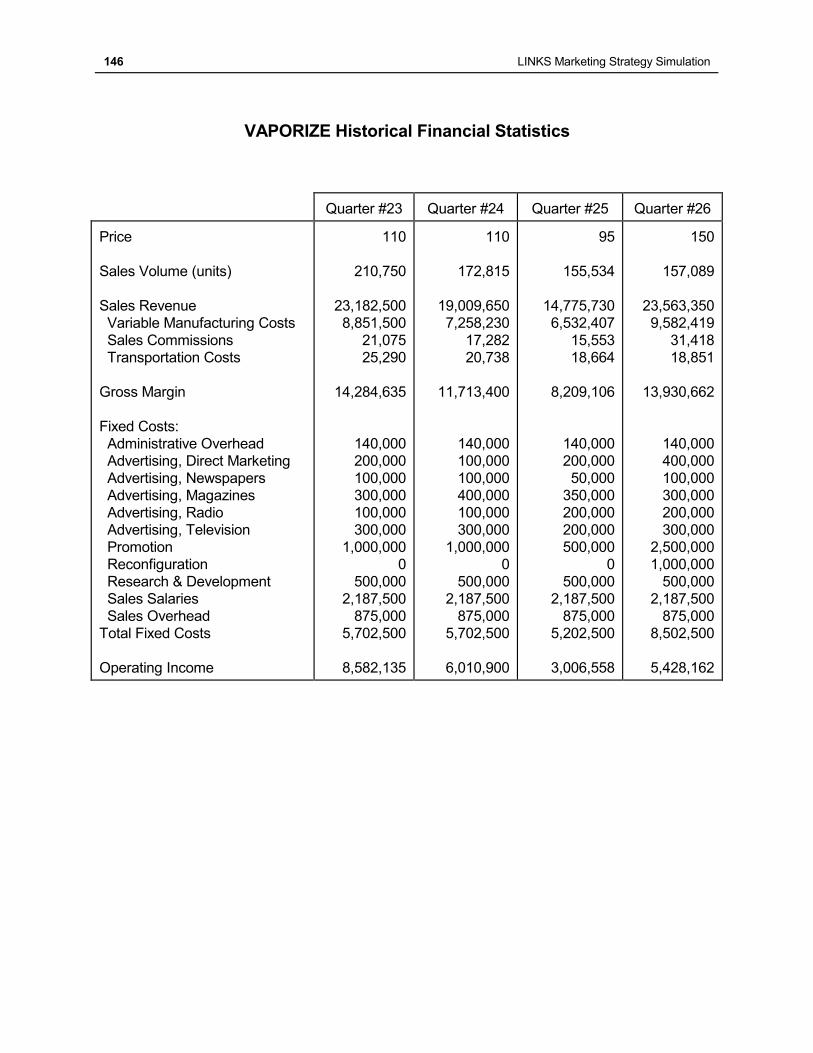
146 LINKS Marketing Strategy Simulation
VAPORIZE Historical Financial Statistics
Quarter #23 Quarter #24 Quarter #25 Quarter #26
Price
Sales Volume (units)
Sales Revenue
Variable Manufacturing Costs
Sales Commissions
Transportation Costs
Gross Margin
Fixed Costs:
Administrative Overhead
Advertising, Direct Marketing
Advertising, Newspapers
Advertising, Magazines
Advertising, Radio
Advertising, Television
Promotion
Reconfiguration
Research & Development
Sales Salaries
Sales Overhead
Total Fixed Costs
Operating Income
110
210,750
23,182,500
8,851,500
21,075
25,290
14,284,635
140,000
200,000
100,000
300,000
100,000
300,000
1,000,000
0
500,000
2,187,500
875,000
5,702,500
8,582,135
110
172,815
19,009,650
7,258,230
17,282
20,738
11,713,400
140,000
100,000
100,000
400,000
100,000
300,000
1,000,000
0
500,000
2,187,500
875,000
5,702,500
6,010,900
95
155,534
14,775,730
6,532,407
15,553
18,664
8,209,106
140,000
200,000
50,000
350,000
200,000
200,000
500,000
0
500,000
2,187,500
875,000
5,202,500
3,006,558
150
157,089
23,563,350
9,582,419
31,418
18,851
13,930,662
140,000
400,000
100,000
300,000
200,000
300,000
2,500,000
1,000,000
500,000
2,187,500
875,000
8,502,500
5,428,162
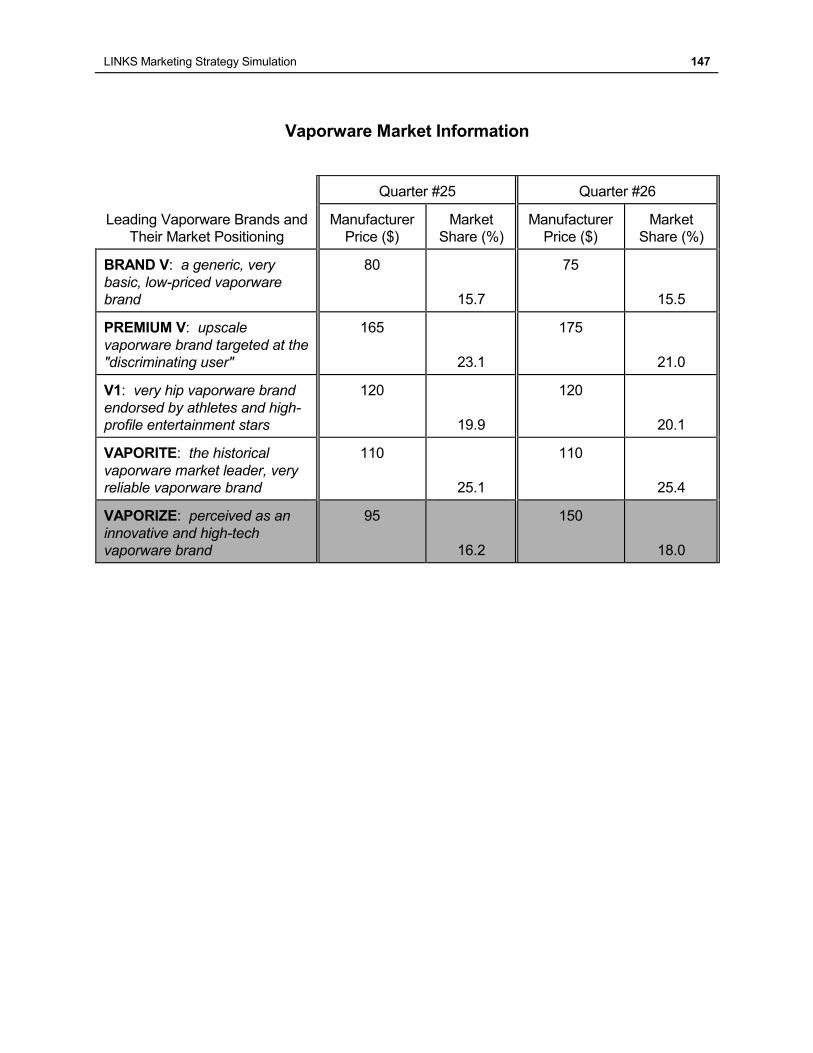
LINKS Marketing Strategy Simulation 147
Vaporware Market Information
Quarter #25 Quarter #26
Leading Vaporware Brands and
Their Market Positioning
Manufacturer
Price ($)
Market
Share (%)
Manufacturer
Price ($)
Market
Share (%)
BRAND V: a generic, very
basic, low-priced vaporware
brand
80
15.7
75
15.5
PREMIUM V: upscale
vaporware brand targeted at the
"discriminating user"
165
23.1
175
21.0
V1: very hip vaporware brand
endorsed by athletes and high-
profile entertainment stars
120
19.9
120
20.1
VAPORITE: the historical
vaporware market leader, very
reliable vaporware brand
110
25.1
110
25.4
VAPORIZE: perceived as an
innovative and high-tech
vaporware brand
95
16.2
150
18.0
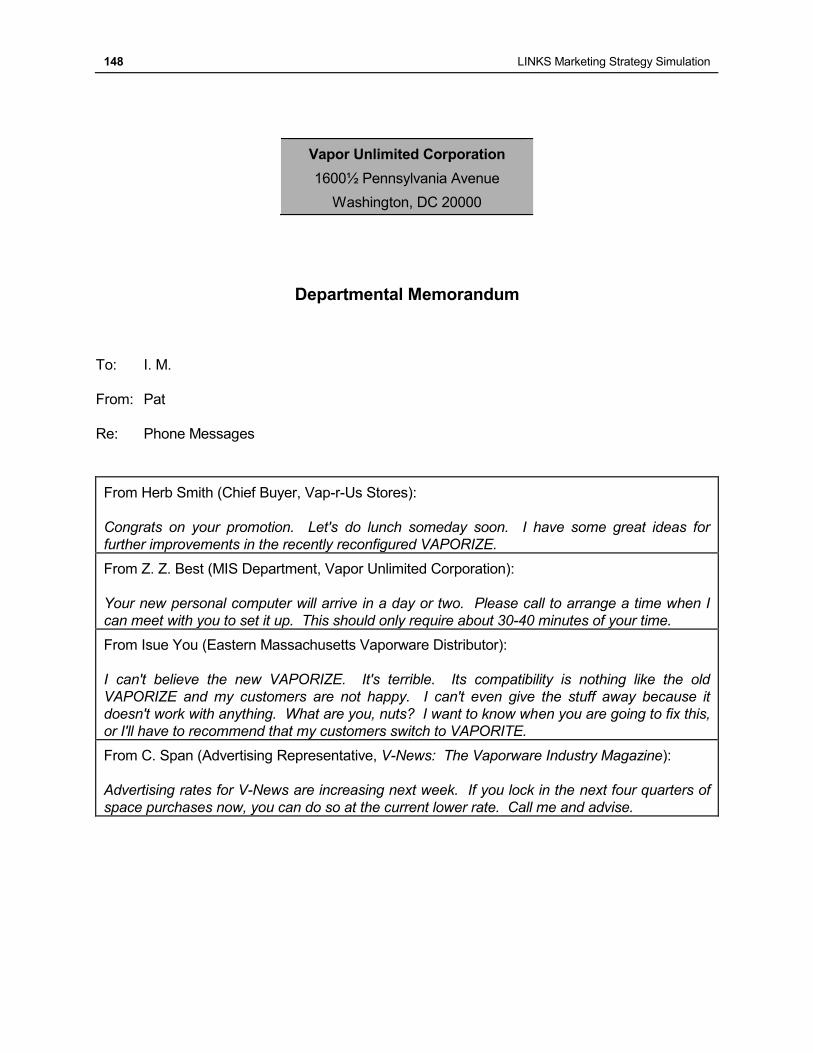
148 LINKS Marketing Strategy Simulation
Vapor Unlimited Corporation
1600½ Pennsylvania Avenue
Washington, DC 20000
Departmental Memorandum
To: I. M.
From: Pat
Re: Phone Messages
From Herb Smith (Chief Buyer, Vap-r-Us Stores):
Congrats on your promotion. Let's do lunch someday soon. I have some great ideas for
further improvements in the recently reconfigured VAPORIZE.
From Z. Z. Best (MIS Department, Vapor Unlimited Corporation):
Your new personal computer will arrive in a day or two. Please call to arrange a time when I
can meet with you to set it up. This should only require about 30-40 minutes of your time.
From Isue You (Eastern Massachusetts Vaporware Distributor):
I can't believe the new VAPORIZE. It's terrible. Its compatibility is nothing like the old
VAPORIZE and my customers are not happy. I can't even give the stuff away because it
doesn't work with anything. What are you, nuts? I want to know when you are going to fix this,
or I'll have to recommend that my customers switch to VAPORITE.
From C. Span (Advertising Representative, V-News: The Vaporware Industry Magazine):
Advertising rates for V-News are increasing next week. If you lock in the next four quarters of
space purchases now, you can do so at the current lower rate. Call me and advise.
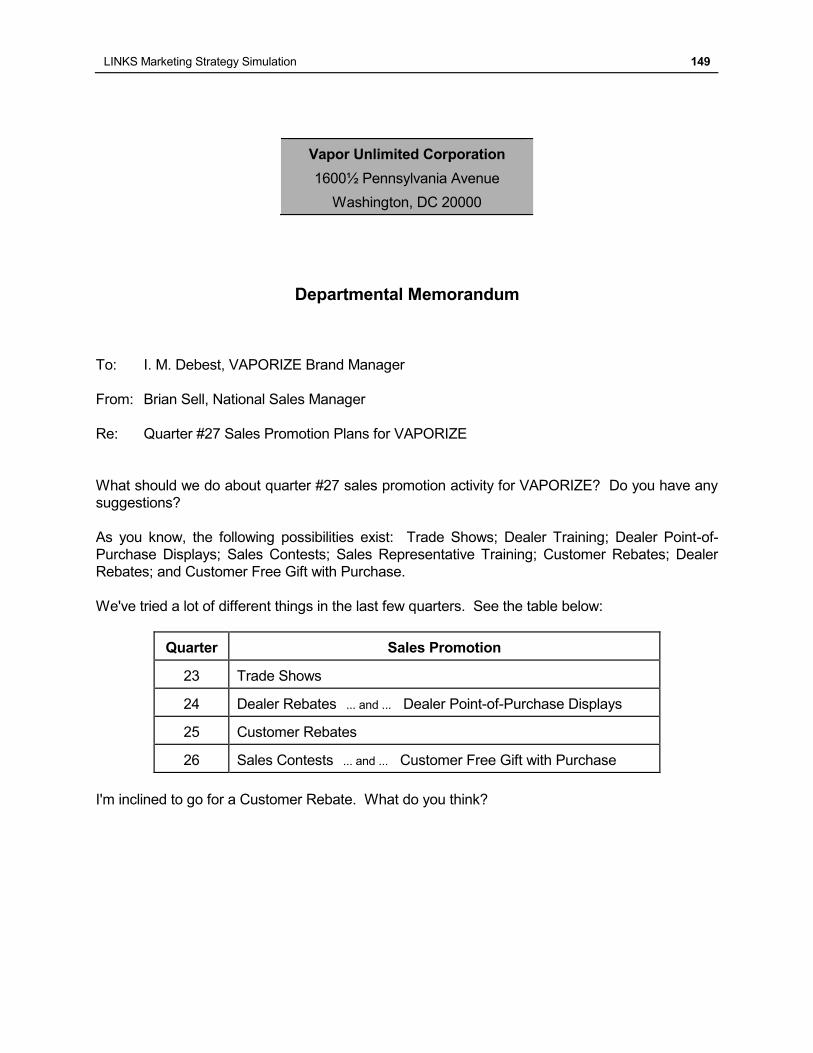
LINKS Marketing Strategy Simulation 149
Vapor Unlimited Corporation
1600½ Pennsylvania Avenue
Washington, DC 20000
Departmental Memorandum
To: I. M. Debest, VAPORIZE Brand Manager
From: Brian Sell, National Sales Manager
Re: Quarter #27 Sales Promotion Plans for VAPORIZE
What should we do about quarter #27 sales promotion activity for VAPORIZE? Do you have any
suggestions?
As you know, the following possibilities exist: Trade Shows; Dealer Training; Dealer Point-of-
Purchase Displays; Sales Contests; Sales Representative Training; Customer Rebates; Dealer
Rebates; and Customer Free Gift with Purchase.
We've tried a lot of different things in the last few quarters. See the table below:
Quarter Sales Promotion
23 Trade Shows
24 Dealer Rebates ... and ... Dealer Point-of-Purchase Displays
25 Customer Rebates
26 Sales Contests ... and ... Customer Free Gift with Purchase
I'm inclined to go for a Customer Rebate. What do you think?
150 LINKS Marketing Strategy Simulation
Vapor Unlimited Corporation
1600½ Pennsylvania Avenue
Washington, DC 20000
Departmental Memorandum
To: C. Rapman, VAPORIZE Brand Manager
From: A. B. Cee, Advertising Manager
Re: VAPORIZE Advertising Program
As you know, the current advertising theme for VAPORIZE is "VAPORIZE - the latest innovation
from the vaporware market leader." The following new possible advertising campaign themes for
VAPORIZE have been prepared by Big Bucks Advertising Agency:
"Performance where it counts."
"VAPORIZE your life."
"Quality is job 1."
"Easy to use and fun too!"
We need to decide if we should change our VAPORIZE slogan to one of these or keep it the
same. I need an answer as soon as possible so that we can get the artwork completed.
Any other thoughts on how to position VAPORIZE would also be appreciated.
LINKS Marketing Strategy Simulation 151
Vapor Unlimited Corporation
1600½ Pennsylvania Avenue
Washington, DC 20000
Interdepartmental Memorandum
To: C. Rapman, VAPORIZE Brand Manager
From: I. Ownitall, President and CEO
Re: Launch of Reconfigured VAPORIZE Brand
At next Friday's staff meeting , I would like a brief summary of VAPORIZE's current status. The
reconfiguration process was long, arduous, and costly. I hope that it has assured VAPORIZE's
continued success in the market. We are counting on VAPORIZE to make Vapor Unlimited
Corporation's profitability goals for the year.
Please be prepared to provide a four-quarter profitability projection at next Friday's staff meeting.
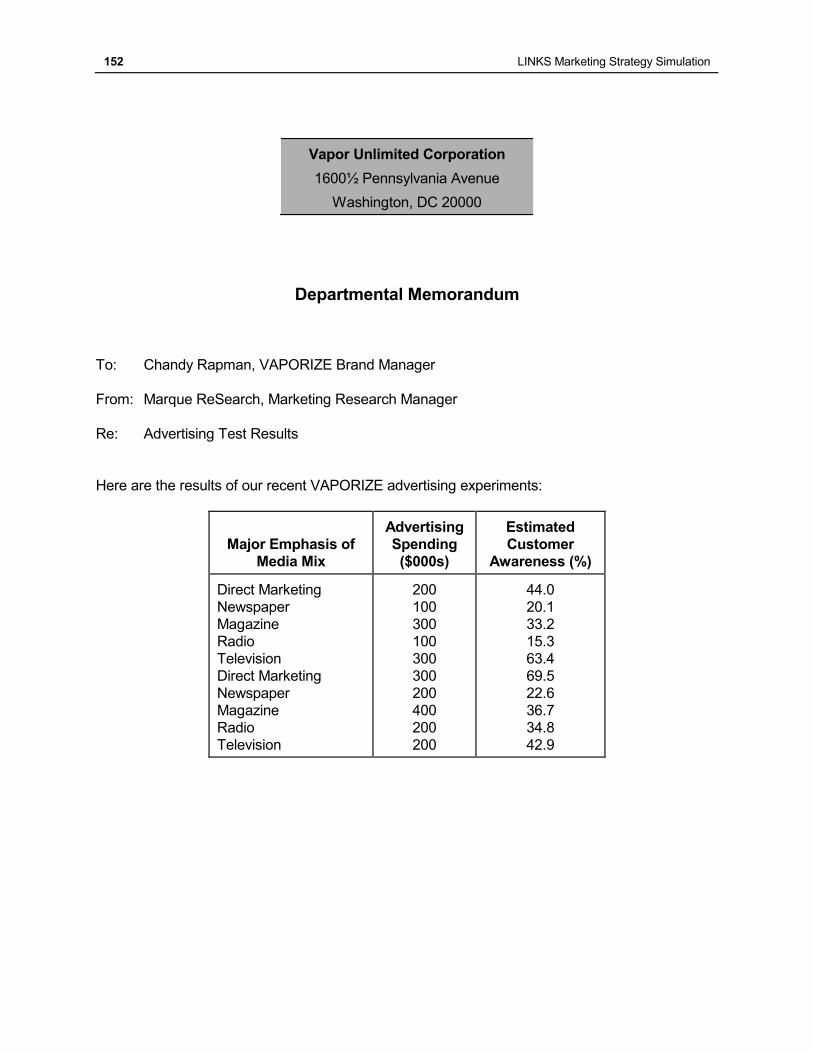
152 LINKS Marketing Strategy Simulation
Vapor Unlimited Corporation
1600½ Pennsylvania Avenue
Washington, DC 20000
Departmental Memorandum
To: Chandy Rapman, VAPORIZE Brand Manager
From: Marque ReSearch, Marketing Research Manager
Re: Advertising Test Results
Here are the results of our recent VAPORIZE advertising experiments:
Major Emphasis of
Media Mix
Advertising
Spending
($000s)
Estimated
Customer
Awareness (%)
Direct Marketing
Newspaper
Magazine
Radio
Television
Direct Marketing
Newspaper
Magazine
Radio
Television
200
100
300
100
300
300
200
400
200
200
44.0
20.1
33.2
15.3
63.4
69.5
22.6
36.7
34.8
42.9
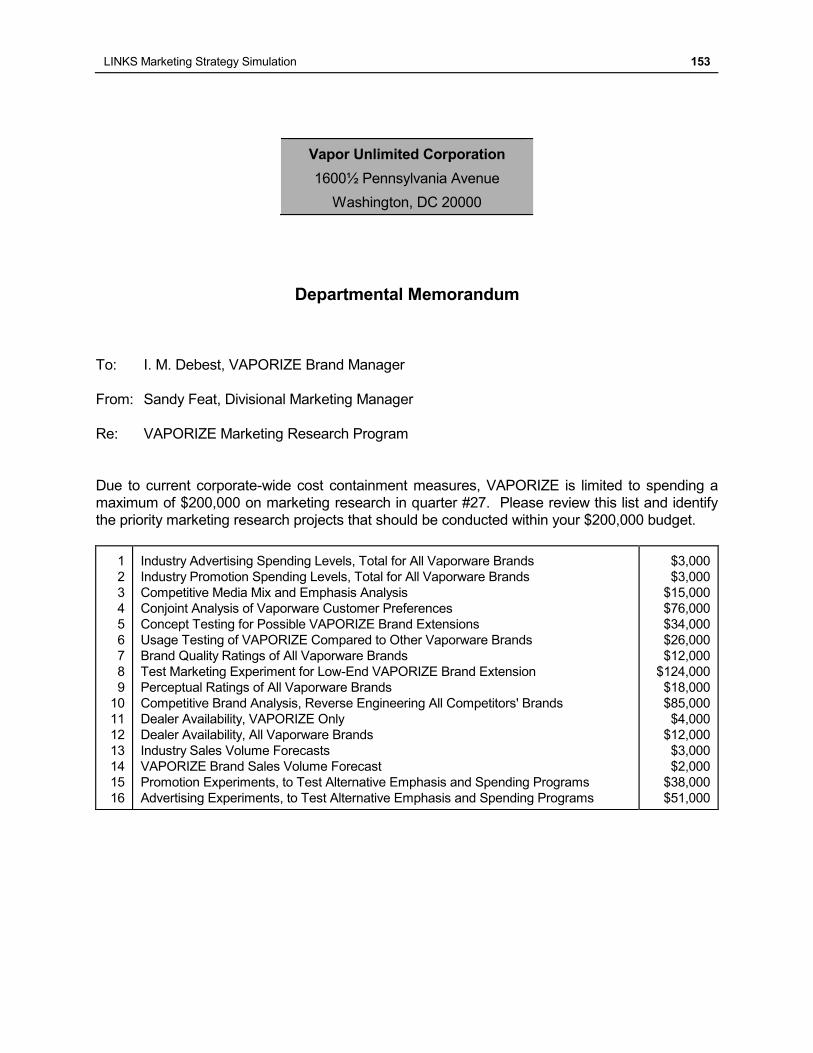
LINKS Marketing Strategy Simulation 153
Vapor Unlimited Corporation
1600½ Pennsylvania Avenue
Washington, DC 20000
Departmental Memorandum
To: I. M. Debest, VAPORIZE Brand Manager
From: Sandy Feat, Divisional Marketing Manager
Re: VAPORIZE Marketing Research Program
Due to current corporate-wide cost containment measures, VAPORIZE is limited to spending a
maximum of $200,000 on marketing research in quarter #27. Please review this list and identify
the priority marketing research projects that should be conducted within your $200,000 budget.
1
2
3
4
5
6
7
8
9
10
11
12
13
14
15
16
Industry Advertising Spending Levels, Total for All Vaporware Brands
Industry Promotion Spending Levels, Total for All Vaporware Brands
Competitive Media Mix and Emphasis Analysis
Conjoint Analysis of Vaporware Customer Preferences
Concept Testing for Possible VAPORIZE Brand Extensions
Usage Testing of VAPORIZE Compared to Other Vaporware Brands
Brand Quality Ratings of All Vaporware Brands
Test Marketing Experiment for Low-End VAPORIZE Brand Extension
Perceptual Ratings of All Vaporware Brands
Competitive Brand Analysis, Reverse Engineering All Competitors' Brands
Dealer Availability, VAPORIZE Only
Dealer Availability, All Vaporware Brands
Industry Sales Volume Forecasts
VAPORIZE Brand Sales Volume Forecast
Promotion Experiments, to Test Alternative Emphasis and Spending Programs
Advertising Experiments, to Test Alternative Emphasis and Spending Programs
$3,000
$3,000
$15,000
$76,000
$34,000
$26,000
$12,000
$124,000
$18,000
$85,000
$4,000
$12,000
$3,000
$2,000
$38,000
$51,000
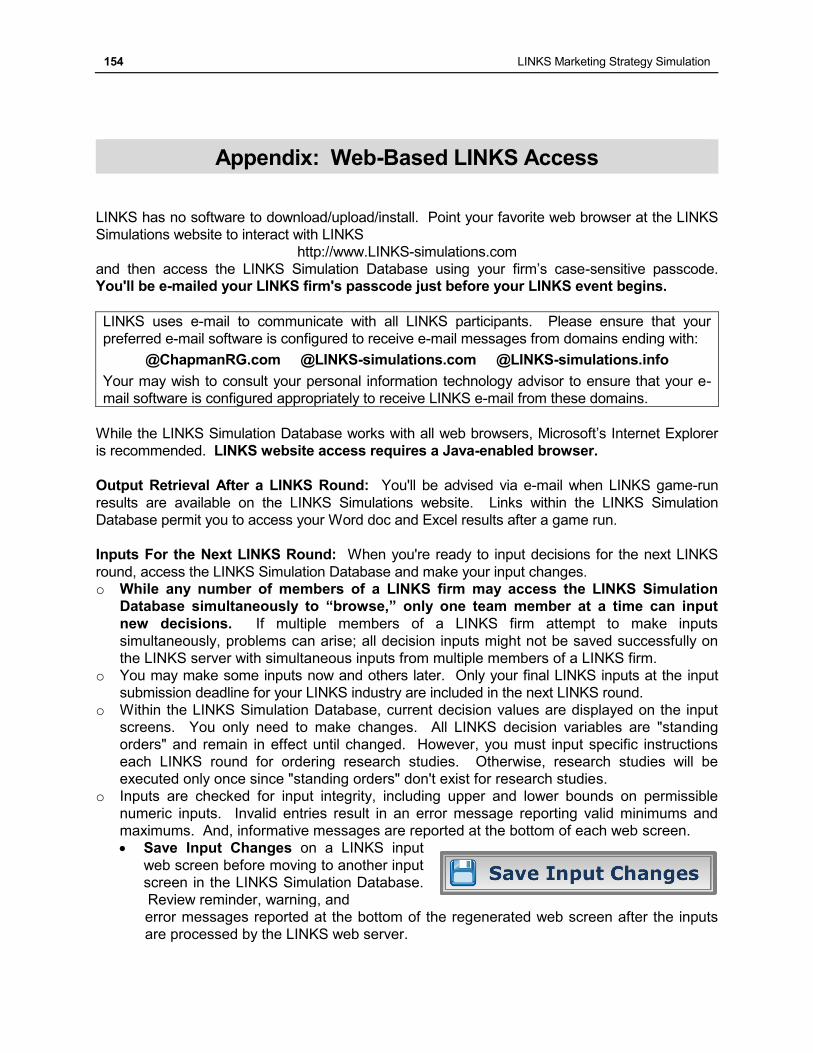
154 LINKS Marketing Strategy Simulation
Appendix: Web-Based LINKS Access
LINKS has no software to download/upload/install. Point your favorite web browser at the LINKS
Simulations website to interact with LINKS
http://www.LINKS-simulations.com
and then access the LINKS Simulation Database using your firm’s case-sensitive passcode. You'll be e-mailed your LINKS firm's passcode just before your LINKS event begins.
LINKS uses e-mail to communicate with all LINKS participants. Please ensure that your
preferred e-mail software is configured to receive e-mail messages from domains ending with:
@ChapmanRG.com @LINKS-simulations.com @LINKS-simulations.info
Your may wish to consult your personal information technology advisor to ensure that your e-
mail software is configured appropriately to receive LINKS e-mail from these domains.
While the LINKS Simulation Database works with all web browsers, Microsoft’s Internet Explorer
is recommended. LINKS website access requires a Java-enabled browser.
Output Retrieval After a LINKS Round: You'll be advised via e-mail when LINKS game-run
results are available on the LINKS Simulations website. Links within the LINKS Simulation
Database permit you to access your Word doc and Excel results after a game run.
Inputs For the Next LINKS Round: When you're ready to input decisions for the next LINKS
round, access the LINKS Simulation Database and make your input changes. o While any number of members of a LINKS firm may access the LINKS Simulation
Database simultaneously to “browse,” only one team member at a time can input
new decisions. If multiple members of a LINKS firm attempt to make inputs
simultaneously, problems can arise; all decision inputs might not be saved successfully on
the LINKS server with simultaneous inputs from multiple members of a LINKS firm.
o You may make some inputs now and others later. Only your final LINKS inputs at the input
submission deadline for your LINKS industry are included in the next LINKS round.
o Within the LINKS Simulation Database, current decision values are displayed on the input
screens. You only need to make changes. All LINKS decision variables are "standing
orders" and remain in effect until changed. However, you must input specific instructions
each LINKS round for ordering research studies. Otherwise, research studies will be
executed only once since "standing orders" don't exist for research studies.
o Inputs are checked for input integrity, including upper and lower bounds on permissible
numeric inputs. Invalid entries result in an error message reporting valid minimums and
maximums. And, informative messages are reported at the bottom of each web screen.
Save Input Changes on a LINKS input
web screen before moving to another input
screen in the LINKS Simulation Database.
Review reminder, warning, and
error messages reported at the bottom of the regenerated web screen after the inputs
are processed by the LINKS web server.
LINKS Marketing Strategy Simulation 155
Decision Inputs Audit: To provide
decision inputs auditing support, the
LINKS Simulation Database includes
a Decision Input Audit.
Accessible on the initial login and Exit web screens in the LINKS Simulation Database,
the Decision Inputs Audit checks a firm’s current decision inputs for potential problems
and inconsistencies. This LINKS Simulation Database audit function is not an audit of
the individual quality of each decision input (e.g., there’s no attempt to assess whether a
price of $345 is good or bad). But, possible problems are flagged for attention. For
example, forecasts that haven’t been changed since the last decision round are noted in
the audit display because forecasts are normally updated every decision round.
Accessing LINKS Results Files Via a Browser on a Public Computer: Web browsers leave
“tracks” to previously accessed web-pages in browser history files. If you access LINKS results
files on a public computer (e.g., in a public PC lab), others could access your results too via the
browser history.
Instructions for cleaning the cache in Internet Explorer follow. Other web browsers have
similar browser-cache cleaning protocols.
If you access LINKS results files on a public computer, follow these steps to clear
Internet Explorer’s browser history (cache):
1. Exit/close Internet Explorer after accessing your LINKS results file.
2. Re-start Internet Explorer.
a. Click on “Tools” and then “Internet Options.”
b. On the “Internet Options” screen, look for the “Browsing History” sub-section. Check
“Delete browsing history on exit” (it may already be checked).
c. Click the “Delete” button in the “Browsing History” sub-section.
d. Check the “History” box on the “Delete Browsing History” screen (it may already be
check).
e. Click the “Delete” button at the bottom of the “Delete Browsing History” screen.
f. Wait until the “Internet Options” screen re-appears.
g. Click the “OK” button.
3. Exit/close Internet Explorer.
These steps clear the browsing history from Internet Explorer on any computer and preserve
the security and privacy of your LINKS results files.
156 LINKS Marketing Strategy Simulation
Index
Active Product?, 46
administrative overhead, 49, 60
advertising, 39
advice, 142
general, 142
team management and organization, 137
alpha, 10, 17
analysis, 6
availability perception, 89, 94
Balance Sheet, 66
bandwidth, 10, 11
bandwidth cost, 11
beta, 10, 17
calendar, 3
case studies
Amazon.com, 97
Chrysler Minivans, 13
Motorola Iridium, 15
Variable Pricing of Baseball Games, 35
Cash Flow Analysis Report, 67
Change in Market Share, 134
Change in Ratio of Net Income to Revenues,
132
channel decisions, 34
channels
direct, 34
major accounts, 34
retail, 34
Competitive Advantage Audit Worksheet, 141
configuration, 10
conjoint analysis, 111
consulting fees, 65
Corporate Capitalization, 67
corporate overhead, 65
Corporate P&L Statement, 60
corporate tax rate, 66
CSR Cost/Call, 133
currency, 9
customer lifetime value (CLV), 120, 121
Customer Satisfaction, 134
decision form
generate demand (1), 47
generate demand (2), 48
information technology, 57
manufacturing, 22
other corporate decisions, 59
product development, 16
research studies (1), 124
research studies (2), 125
research studies (3), 126
research studies (4), 127
research studies (5), 128
service, 33
delta, 10, 17
direct channel, 34
disposal sales, 12, 65
distribution, 23
distribution center, 23
distribution center, 8
Dividends, 67
drop a product, 46
duties and tariffs, 65
emergency production, 19
end-gaming, 142
epsilon, 17
evaluation, 6, 129
goal setting, 134
scorecard, 130, 132, 133, 134, 135
Fill Rate, 133
financial and operating statements, 60
Finished Goods Inventory Report, 67
firm management, 136
firm name, 58
Forecast Inaccuracy, 49, 65
forecasting, 49
forecasting accuracy, 51, 68
sales volume, 49
Forecasting Accuracy, 133
Forecasting Accuracy Report, 67
FYI
LINKS Marketing Strategy Simulation 157
About The Customer Service Challenge,
27
Customer Interaction Costs, 25
Dell's Direct-Channel Strategy, 34
Marketing/Sales Ratios, 37
Outsourcing Challenges, 32
Price Cuts and Profits, 36
Supply Chain KPIs, 131
The Cost of Marketing Research, 84
When Good Customers Are Bad
Cost-To-Serve Analytics, 129
Why Hold Inventory?, 20
gamma, 10, 17
generate demand, 34
generate demand decisions form (1), 47
generate demand decisions form (2), 48
goal setting, 134
Historical Corporate P&L Statement, 66
hyperware, 5, 10
implementation, 6
In-Basket Exercise, 144
information technology, 53
costs, 65
Product Cost Report, 53
Retail Pipeline Report, 54
Service Center Statistics Report, 55
information technology decision form, 57
introduce a product, 46
inventory charges, 65
Inventory Turnover, 133
Judgmental Sales Forecasting Worksheet, 50
KPI Worksheet, 136, 140
Ldollar, 9
learning objectives, 2
Loans, 66
major accounts channel, 34
management, 136
manufacturing decision form, 22
manufacturing plant, 8
Market Attractiveness Analysis Worksheet,
136, 139
market shares, 88
Marketable Securities, 66
marketing creative, 41
marketing mix allocation, 39
marketing positioning, 39
benefit positioning, 40
marketing creative, 41
marketing spending decisions, 37
markup, 35
metaware, 5, 10
Net Asset Turns, 132
non-operating income, 65
Non-Operating Income, 66
order processing costs, 35, 65
other corporate decisions form, 59
other costs and decisions, 58
Other Decision Variables Report, 68
packaging, 10, 12
patent royalties, 13
performance evaluation, 129
goal setting, 134
perspective, 129
scorecard, 130, 132, 133, 134, 135
Performance Evaluation Report, 60
planning, 6, 136
Plant Investment, 67
price decisions, 35
Pricing Worksheet, 38
procurement, 17
supplier selection, 18
product 1, 10
product 2, 10
Product Cost Report, 53
product development, 10
product development decision form, 16
Product P&L Statement, 66
product quality perception, 88, 91
production cost, 18, 19
production shift, 19
158 LINKS Marketing Strategy Simulation
profitability drivers, 60
promotion, 39
promotional program, 41, 42
channel training, 42
customer rebates, 42
customer training, 42
dealer rebates, 42
event marketing, 42
promotional activity code, 43
sales force training, 42
trade shows, 42
trade-in and exchange programs, 42
vendor allowances, 42
Ratio of (Marketing + Service Spending) to
Revenues, 133
Ratio of Controllable Procure & Manufact
Costs to Revenues, 133
Ratio of Net Income to Revenues, 132
raw material, 17
raw materials
costs, 17
volume discounts, 17
reconfiguration, 12
cost, 12
disposal sales, 12
limit of one per quarter, 13
replacement parts, 18
Replacement Parts Demand Report, 53
research and development, 14
research studies, 81
research studies decisions form (1), 124
research studies decisions form (2), 125
research studies decisions form (3), 126
research studies decisions form (4), 127
research studies decisions form (5), 128
research studies strategy, 81
research studies table of contents, 123
Research Study # 1: Benchmarking -
Earnings, 85
Research Study # 2: Benchmarking -
Balance Sheets, 85
Research Study # 3: Benchmarking -
Product Development, 85
Research Study # 8: Benchmarking -
Service, 86
Research Study # 9: Benchmarking -
Generate Demand, 86
Research Study #10: Benchmarking - Info
Tech & Research, 87
Research Study #11: Benchmarking -
Operating Statistics, 87
Research Study #12: Market Statistics, 88
Research Study #14: Regional Summary
Analysis, 88
Research Study #15: Market Shares, 90
Research Study #16: Prices, 90
Research Study #17: Product Quality
Perceptions, 91
Research Study #18: Service Quality
Perceptions, 92
Research Study #19: Availability
Perceptions, 94
Research Study #20: Customer Satisfaction,
94
Research Study #21: Configuration Analysis
- Specific Product, 95
Research Study #22: Configuration Analysis
- Reconfigurations, 95
Research Study #23: Concept Test, 95
Research Study #24: Price Sensitivity
Analysis, 96
Research Study #25: Market Potential of
Channel Segments, 99
Research Study #26: Importance-
Performance Analysis, 100
Research Study #27: Marketing Program
Benchmarking, 101
Research Study #28: Marketing Program
Experiment, 102
Research Study #29: Test Marketing
Experiment, 104
Research Study #30: Conjoint Analysis, 106
Research Study #31: Self-Reported
Preferencess, 114
Research Study #32: Market Attractiveness
Analysis, 116
Research Study #33: Value Maps, 117
Research Study #34: Availability Perception
Drivers, 117
Research Study #35: Market Structure
Analysis, 119
Research Study #38: Retention Statistics,
120
Research Study #39: Benchmarking –
Product Variable Cost Estimates, 123
retail channel, 34
Retail Pipeline Report, 54
retention statistics, 120, 121
LINKS Marketing Strategy Simulation 159
Return on Assets, 132
sales force, 39
sales force salary, 43
sales volume forecasting, 49
scorecard, 130, 132, 133, 134, 135
seasonality, 3
service, 25
average CSR monthly salary, 87
capacity, 26
firing, 27
firing cost, 26
hiring cost, 26
hiring limit, 27
overhead, 28
resignations, 26
salary, 25
time allocation, 28
training, 26
Service Center Operations Report, 68
Service Center Statistics Report, 55
service decision form, 33
service operations, 27
service outsourcing, 29
service quality perception, 25, 89, 92
set-top box, 3, 10
Set-Top Box Industry Bulletin, 68
simulation
end-gaming, 142
why use?, 1
sub-assembly component, 17
cost, 18
delivery, 18
failure rate, 18
supplier selection, 18
transportation cost, 17
sub-assembly components
volume discounts, 17
supply chain management, 3, 8
SWOT Analysis Worksheet, 136, 138
tax rate, 66
team goal, 8
team management and organization, 137
transportation, 23
customer shipment transportation cost,
24
customer shipments, 23
sub-assembly component cost, 18
Transportation Cost Report, 68
unfilled orders, 20, 21
volume discounts
raw materials, 17
sub-assembly components, 17
warranty, 10
cost, 11
website, 1
worksheets
Competitive Advantage Audit Worksheet,
141
Judgmental Sales Forecasting
Worksheet, 50
KPI Worksheet, 140
Market Attractiveness Analysis
Worksheet, 139
Pricing Worksheet, 38
SWOT Analysis Worksheet, 138

160 LINKS Marketing Strategy Simulation


![LINKS Enterprise Management Simulation … Chapman PhD, “LINKS Enterprise Management Simulation [Enriched Edition]” Page 3 Table of Contents Chapter 1: Introduction ..... 5 …](https://img.pdfslide.us/doc/110x75/5ad5c6cb7f8b9a571e8df0b2/links-enterprise-management-simulation-chapman-phd-links-enterprise-management.jpg)