Embed Size (px)
Citation preview

NET0183 Networks and Communications by Dr Andy Brooks
1
NET0183 Networks and Communications
Lectures 7 and 8Measured performance of an Ethernet
8/25/2009
Ethernet is a CSMA/CD network.Carrier Sense Multiple Access with Collision Detection

NET0183 Networks and Communications by Dr Andy Brooks
28/25/2009
Historical Case Studyhttp://portal.acm.org/beta/citation.cfm?id=359044
1980

NET0183 Networks and Communications by Dr Andy Brooks
3
1980
• By 1980, a number of interconnected Ethernets had been in operation for several years. These networks had functioned very well.– The Ethernets were tied together with the Pup internetwork
architecture.• “The intent of the present study was to further our
understanding of this system by characterizing the actual behavior of one of these installations in normal use: traffic volume, packet sizes, error rates, efficiency, and more.”
8/25/2009

NET0183 Networks and Communications by Dr Andy Brooks
4
The need for measurements
8/25/2009
"When you can measure what you are speaking about, and express it in numbers, you know something about it; but when you cannot measure it, when you cannot express it in numbers, your knowledge is of a meagre and unsatisfactory kind. It may be the beginning of knowledge, but you have scarcely, in your thoughts, advanced to the stage of science." Lord Kelvin (Physicist)
"You cannot control what you cannot measure." Tom DeMarco (Software Engineer)
Andy comments: Saying “the network was busy” tells us very little. Saying “downloading the pdf of the article, about 10 MB, took well over an hour” tells us a lot.

NET0183 Networks and Communications by Dr Andy Brooks
5
Fig. 1. An Overview of the Ethernet Communications Network
8/25/2009
Coaxial cableControllerInterfaceStationTapTerminatorTransceiver

NET0183 Networks and Communications by Dr Andy Brooks
6
3. Experimental Environment• Measurements were made of one of the oldest Ethernets
in existence.– Span of 550 metres.– 120 connected machines.
• “These machines include large numbers of single-user stand-alone computers (mainly the Alto computer [20]), two time-sharing servers running the Tenex operating system, numerous shared printers and file servers, as well as several internetwork gateways.”
• Applications included sending files to printers, transferring files to storage systems, accessing shared databases, terminals accessing the time-sharing machines, etc.
8/25/2009
1980

NET0183 Networks and Communications by Dr Andy Brooks
78/25/2009
Xerox Alto (1973 prototype workstation, the world's first personal computer)http://www.xerox.com/images/usa/en/p/pa_alto.jpg

NET0183 Networks and Communications by Dr Andy Brooks
8
3. Experimental Environment
• A series of test and monitoring programs were created to perform the measurements.
• “The broadcast nature of an Ethernet system makes it particularly well-suited for the passive collection of measurements: an individual station can sense the state of the cable and, by operating its interface in a promiscuous mode, can receive all of the packets passing by.” – No processing is done at the source and destination and no
communication bandwidth is used to collect measurements.• There is no Heisenberg Uncertainty problem.
• Measurements were mainly carried out in 1979.8/25/2009
1980promiscuous/lauslátur

NET0183 Networks and Communications by Dr Andy Brooks
9
4. Reliability and Packet Error Rates
• The shared component in the system is the passive coaxial cable which has “no active components, no switches, no power being supplied through the line, and no power supplies”.
• As a result of the shared component being passive, there were very few systemwide failures.
• Most systemwide failures were caused by human error:– e.g. removing a terminator at the end of a cable
• A lighting strike disabled a number of improperly installed transceivers.– “Modified installation procedures and a minor circuit change have
now significantly improved lightning resistance.”
8/25/2009

NET0183 Networks and Communications by Dr Andy Brooks
10
4. Reliability and Packet Error Rates• Interfaces check that an integral number 16-bit words have been
received and that the 16-bit cyclic redundancy checksum (CRC) done in hardware is correct.– “If either of these conditions is not met, the packet is considered
damaged and is normally discarded.”• An initial experiment with a passive listener set to receive every
packet on the network found one damaged packet about every 6,000 packets.– 1:6000 is too high an error rate.
• A problem was traced to the receiver section of the interface. A followup experiment with a revised interface found about 1 packet in 2,000,000 packets to be damaged.– “Since these error rates are so low, packets received in error have
been excluded from all of the results reported below. “8/25/2009
damaged packets

NET0183 Networks and Communications by Dr Andy Brooks
11
5.1 Overall traffic characteristics• In normal use it was found the network carried about
2.2 million packets in a 24-hour period – almost 300 million bytes.
• “According to the Arpanet traffic graphs produced by BBN during this same period, the Ethernet traffic roughly corresponds to about half of the volume carried through the Arpanet on an average day.”
• It was found that network load is very light at night and heaviest during the day. – See Figure 2
8/25/2009
Andy comments: For some years I felt the Internet slowed after lunchtime, about the time the east coast of the USA had woken up and gone to work. Was it all just my imagination?

NET0183 Networks and Communications by Dr Andy Brooks
12
Fig. 2 Ethernet load on a typical day ©ACM - sampled over 6-minute intervals -
8/25/2009

NET0183 Networks and Communications by Dr Andy Brooks
13
Fig. 3 Ethernet load on a typical day ©ACM - sampled over 1-second intervals -
8/25/2009
4 minutes
“bursty” traffictraffic comes in bursts

NET0183 Networks and Communications by Dr Andy Brooks
14
5.2 Utilization
• Average load over a 24-hour day was quite low, around 0.6% to 0.84%.
• In shorter periods, however, the load was much greater.– around 3.6% for the busiest hour– around 17% for the busiest minute– around 37% for the busiest second
8/25/2009
“bursty” traffictraffic comes in bursts

NET0183 Networks and Communications by Dr Andy Brooks
15
5.3 Packet Length
• The distribution of packet lengths is bimodal.• Most of the packets are short, dealing with terminal traffic,
acknowledgements, etc.• Most of the volume is carried by large packets related to file
transfers.• The smallest packet with no data has 26 bytes (Ethernet and
Pup headers).– Packets with one or two characters are a little larger.
• An acknowledgement packet has 32 bytes.• The largest packets depend on the particular system and range
from 226 bytes (200 data + 26) to 558 bytes (532 data + 26).
8/25/2009

NET0183 Networks and Communications by Dr Andy Brooks
16
Fig. 4. Distribution of Packet Lengths ©ACM
8/25/2009

NET0183 Networks and Communications by Dr Andy Brooks
17
Fig. 4. Distribution of Packet Lengths ©ACM
8/25/2009

NET0183 Networks and Communications by Dr Andy Brooks
18
Fig. 5. Source-Destination Traffic Matrix ©ACM
8/25/2009
Destination host number (octal)
Source host number (octal)

NET0183 Networks and Communications by Dr Andy Brooks
19
5.4 Source-Destination Traffic Patterns
• On a typical day, nearly 1,300 different source-destination pairs communicate.– 120 machines x 120 machines = 14,400
• “...on the average, each host sends packets to more than 10 other hosts…”– but average behaviour disguises the role of servers.
• Servers send and recieve packets from many other hosts. A server is identifiable in Figure 5 as a pair of broken lines which intersect on the diagonal.
• Note: some of the servers are gateways to other networks and these connections are not shown in Figure 5.
8/25/2009

NET0183 Networks and Communications by Dr Andy Brooks
20
5.6 Inter-Packet Arrival Times
• In designing networks and network servers, a major consideration is the rate at which packets arrive at their destination.
• What is the time between packet arrivals?• Over a 24-hour period, the mean inter-packet
arrival time is 39.5 ms with a standard deviation of 55.0 ms. – Note: when a standard deviation is greater than the
mean, the distribution must be skewed.– The median inter-packet arrival time is 8.5 ms.
8/25/2009
ms millisecond
NET0183 Networks and Communications by Dr Andy Brooks
21
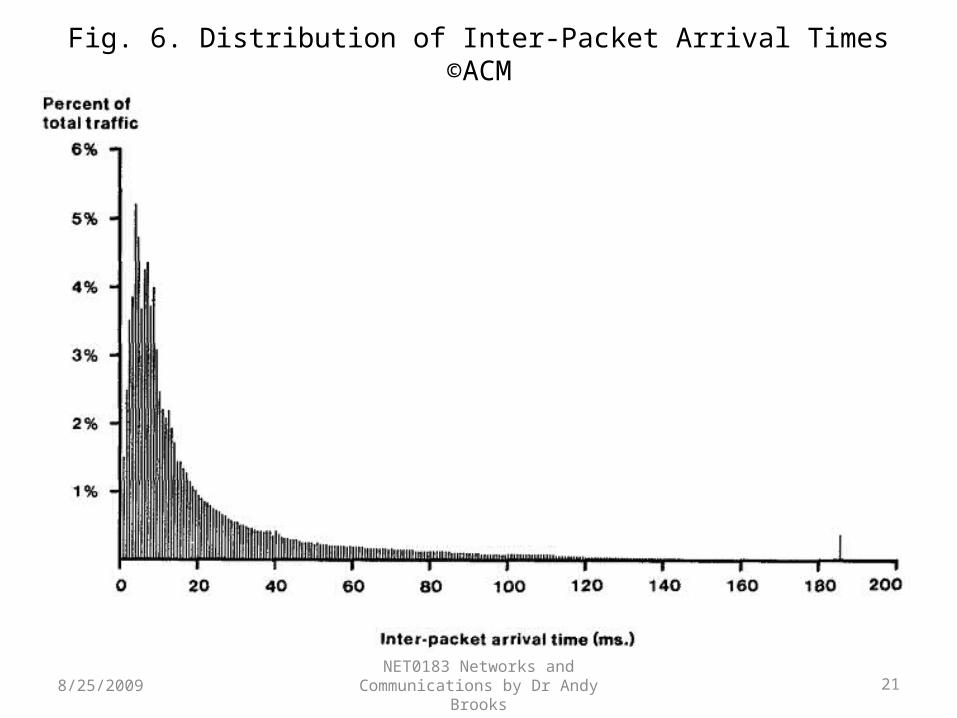
Fig. 6. Distribution of Inter-Packet Arrival Times ©ACM
8/25/2009

NET0183 Networks and Communications by Dr Andy Brooks
22
Fig. 6• A lot of traffic is concerned with request and response
transactions with servers.– With low utilization, these transactions can occur without
any intervening packets being present.– Some of the spikes in Fig. 6 represent the turnaround times
of these servers.• The spike at 183 ms is due to a game program that
regularly transmits a multidestination packet indicating the state of the game.
8/25/2009
Andy comments: Note that no attempt was made to determine how well the distribution shown in Fig. 6 fits a negative exponential. If inter-arrival times follow a negative exponential, this can greatly simplify a network analysis.Note that today researchers study traffic patterns for multi-player games played over the internet.

NET0183 Networks and Communications by Dr Andy Brooks
23
5.7 Latency and Collisions Detected by a Sender
• A test program was written that periodically tried to transmit a packet.– (The actual rate at which these transmissions were attempted is
not stated.)• Under normal load conditions, it was found that 99.18% of
the packets were transmitted with zero latency (no delay), 0.79% were delayed due to deference, and less than 0.03% of the packets were involved in a collision.– Recall that if a station senses a carrier, it will defer transmission of
its own packet until the network is quiet.
8/25/2009
less than 0.03% in collisions
NET0183 Networks and Communications by Dr Andy Brooks
24
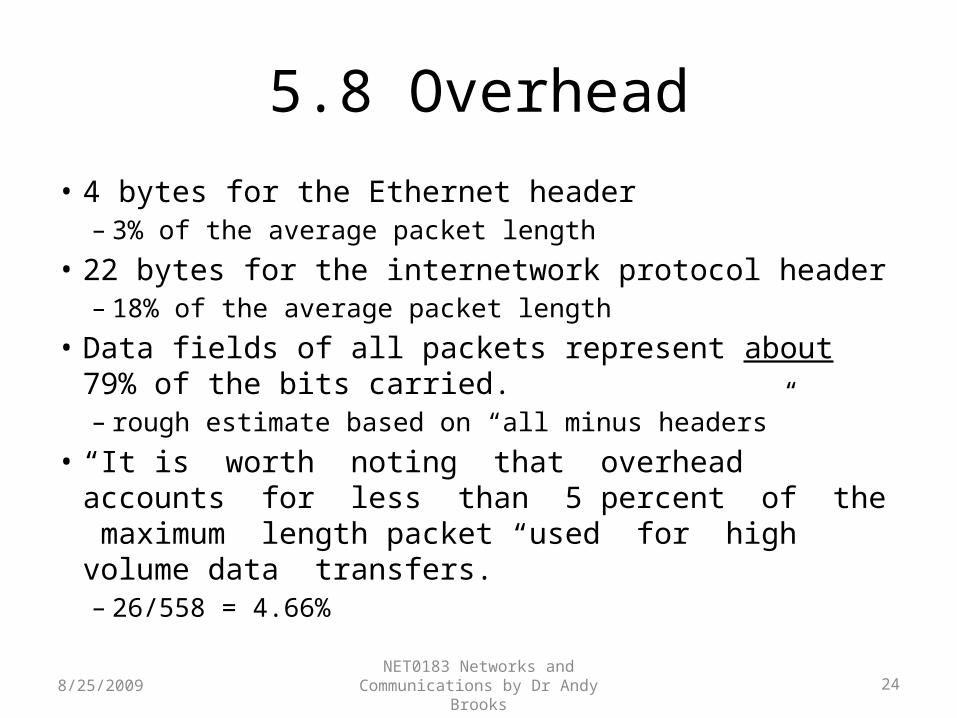
5.8 Overhead
• 4 bytes for the Ethernet header– 3% of the average packet length
• 22 bytes for the internetwork protocol header– 18% of the average packet length
• Data fields of all packets represent about 79% of the bits carried.– rough estimate based on “all minus headers”
• “It is worth noting that overhead accounts for less than 5 percent of the maximum length packet used for high volume data transfers.”– 26/558 = 4.66%
8/25/2009

NET0183 Networks and Communications by Dr Andy Brooks
25
5.8 Overhead
• Obtaining an exact measure of the actual data bits sent would require identifying and excluding acknowledgement packets and studying traffic separately in both directions.
• A better estimate based on packet types used in the most common protocols found that 69% of all the bits carried by the Ethernet could be classified as user data, leaving 31% for all forms of overhead.– Ethernet headers, internetwork headers, packets used
to establish a connection, etc.
8/25/2009
overhead about 1/3

NET0183 Networks and Communications by Dr Andy Brooks
26
5.9 Intranet vs. Internet Trafficintra:within inter:between
• The local network was part of a larger internetwork community.
• 72% of all packets had both their source and destination on the local network.
• 28% of all packets were internet traffic, coming from or going to another network via an internetwork gateway.
• Few “transit packets” were detected.– It was possible for the Ethernet to serve as a transit
network. Transit packets are those passing from one network through the local network to another network.
8/25/2009
intranet/heimanetinternet/tenginet

NET0183 Networks and Communications by Dr Andy Brooks
27
6. Performance Characteristics Under High Load Conditions
• In the experimental setting, machines could be set to generate packets at a specified rate.– For example, a 90% load on the network could be generated
with 9 machines each requesting 10% or with 18 machines each requesting 5%.• Experiments indicated that overall system performance was not
sensitive to the way in which overall loading was distributed.
• The measure of interest was channel utilization or throughput defined as the percentage of time when good packets are being carried on the channel.– “The maximum feasible utilization is sometimes referred to
as the effective capacity of the channel.”
8/25/2009
NET0183 Networks and Communications by Dr Andy Brooks
28
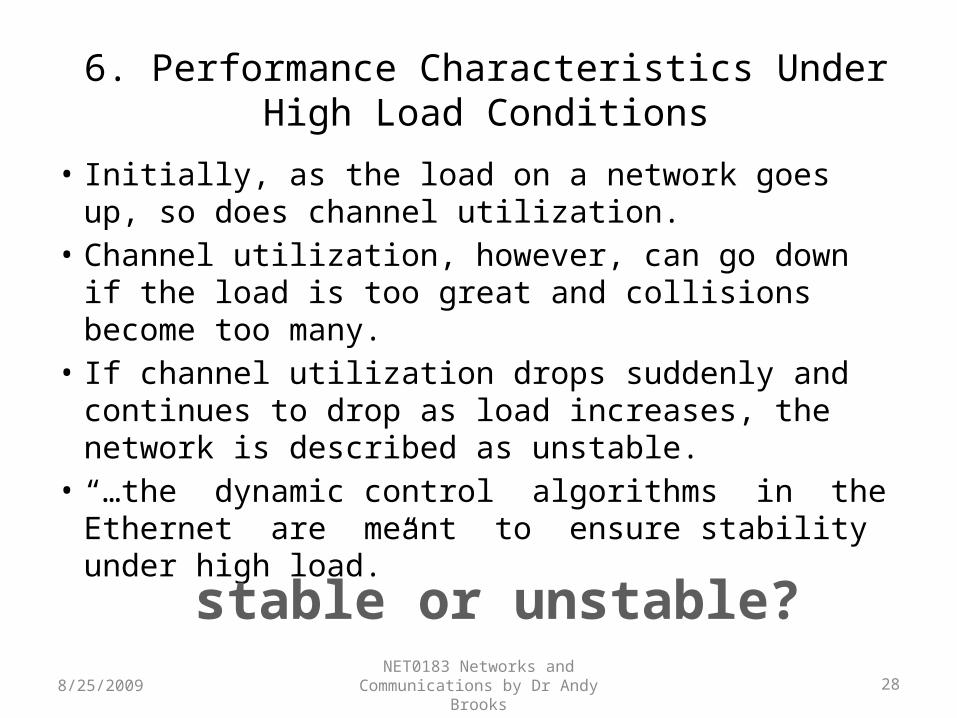
6. Performance Characteristics Under High Load Conditions
• Initially, as the load on a network goes up, so does channel utilization.
• Channel utilization, however, can go down if the load is too great and collisions become too many.
• If channel utilization drops suddenly and continues to drop as load increases, the network is described as unstable.
• “…the dynamic control algorithms in the Ethernet are meant to ensure stability under high load.”
8/25/2009
stable or unstable?

NET0183 Networks and Communications by Dr Andy Brooks
29
Fig. 8. Approximate Utilization for Several Aloha Schemes ©ACM
• Both Aloha schemes become unstable.• Slotted Aloha restricted transmissions from outstations to
commence at the beginning of timeslots.8/25/2009

NET0183 Networks and Communications by Dr Andy Brooks
30
6. Performance Characteristics Under High Load Conditions
• Another measure is fairness. Does each machine have a fair share of channel traffic?
• “In general, we want the distributed Ethernet access schemes to provide equal service to all hosts trying to use the channel.”
8/25/2009
fair or unfair?

NET0183 Networks and Communications by Dr Andy Brooks
31
6. Performance Characteristics Under High Load Conditions
• A special control program was used to run test programs on machines.
• A test program generated packets for transmission and placed them on an output queue.
• “The presence of the queue allows the sender to tolerate short-term variations in the availability of the channel.”
• If an offered load exceeds 100%, then some traffic never gets sent – “it merely gets dumped off of the output queue”.
• “Actual test runs were made on the regular Ethernet system described above, usually at night, when there was very little other traffic.”
8/25/2009

NET0183 Networks and Communications by Dr Andy Brooks
32
Fig. 9. Measured Utilization of the Ethernet Network ©ACM
8/25/2009
• Channel utilization matches load between 0%-90%.• With 512 byte data packets, channel utilization flattens out at
a level above 96%.

NET0183 Networks and Communications by Dr Andy Brooks
33
6.2 Stability
• As Figure 9 shows, the Ethernet system demonstrated no instability.– Throughput does not decline, it flattens out.
8/25/2009

NET0183 Networks and Communications by Dr Andy Brooks
34
6.3 Fairness
• The Ethernet system was found to be fair.• With 10 hosts at 10% per host, a channel utilization
of 94% was observed with individual throughputs varying between 9.3%-9.6%.– 94/10 = 9.4
8/25/2009

NET0183 Networks and Communications by Dr Andy Brooks
358/25/2009
“We should reiterate that these high load tests were conducted using artificial traffic generators. Performance under such high load is an interesting and important technical question, but we would never expect that a well-engineered Ethernet installation would run with this kind of sustained load.”

NET0183 Networks and Communications by Dr Andy Brooks
36
9. Concluding Remarks
8/25/2009