Embed Size (px)
Citation preview
NEPALearthquake 2015
4 MAY 2015 | RELEASE 2
INTRODUCTION
1
This report describes the impact of the 2015 earthquake
throughout Central and Western Nepal (excluding the three
districts of Kathmandu Valley) and provides an analysis to
guide initial relief efforts.
.
The report also provides maps and brief thematic analyses on:
1) Food stocks
2) Market functionality
3) Water sources
4) Sanitation
5) Health access
The report is designed to serve as a tool to enable
stakeholder/expert discussion and derive a common
understanding on the current situation.
This report will also inform the second-phase in-depth
assessment, expected to occur in mid-May 2015.
PURPOSE OF THIS REPORT
Initial field verification to derive priority areas for
humanitarian response was conducted using the NeKSAP
field capacity.
NeKSAP is the Nepal Government’s food security monitoring
system supported by WFP and funded by the European Union.
ACKNOWLEDGEMENTS
The Nepal Food Security Monitoring System
(NeKSAP) is funded by the European Union. The
views expressed in this publication do not
necessarily reflect the views of the European
Commission.
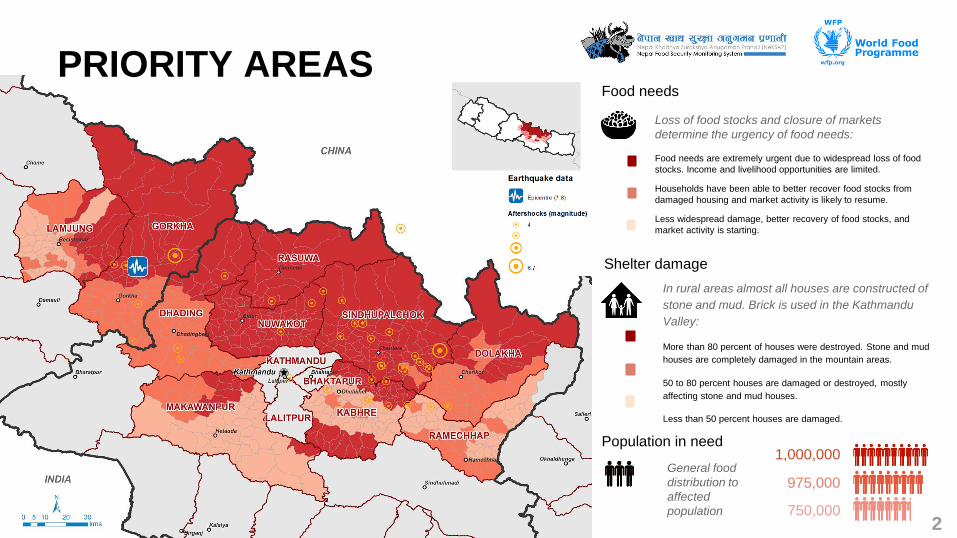
PRIORITY AREASFood needs
Shelter damage
Loss of food stocks and closure of markets
determine the urgency of food needs:
Food needs are extremely urgent due to widespread loss of food
stocks. Income and livelihood opportunities are limited.
Households have been able to better recover food stocks from
damaged housing and market activity is likely to resume.
Less widespread damage, better recovery of food stocks, and
market activity is starting.
In rural areas almost all houses are constructed of
stone and mud. Brick is used in the Kathmandu
Valley:
More than 80 percent of houses were destroyed. Stone and mud
houses are completely damaged in the mountain areas.
50 to 80 percent houses are damaged or destroyed, mostly
affecting stone and mud houses.
Less than 50 percent houses are damaged.
1,000,000
975,000
750,000
Population in need
General food
distribution to
affected
population
2
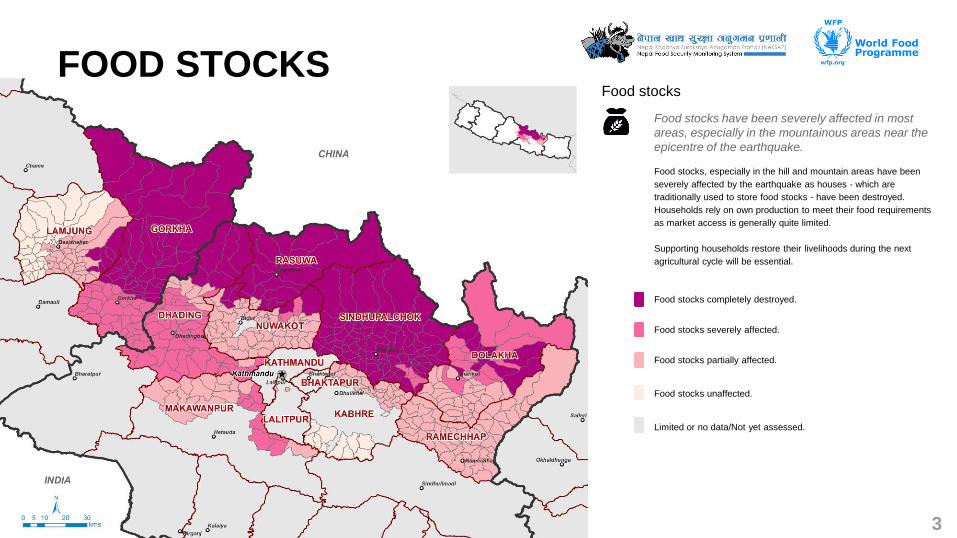
FOOD STOCKSFood stocks
Food stocks have been severely affected in most
areas, especially in the mountainous areas near the
epicentre of the earthquake.
Food stocks, especially in the hill and mountain areas have been
severely affected by the earthquake as houses - which are
traditionally used to store food stocks - have been destroyed.
Households rely on own production to meet their food requirements
as market access is generally quite limited.
Supporting households restore their livelihoods during the next
agricultural cycle will be essential.
Food stocks completely destroyed.
Food stocks severely affected.
Food stocks partially affected.
Food stocks unaffected.
Limited or no data/Not yet assessed.
3
MARKET FUNCTIONALITY
Road access
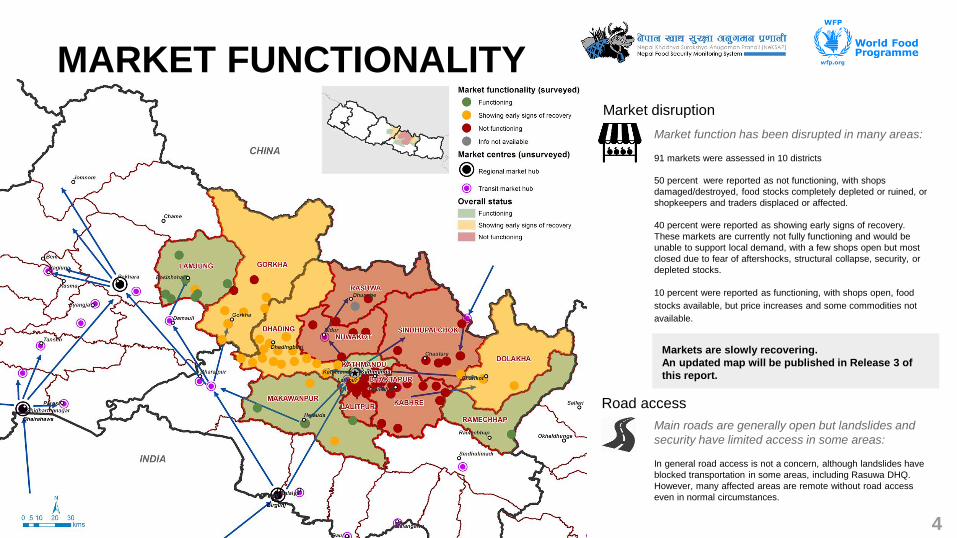
Market disruption
Market function has been disrupted in many areas:
91 markets were assessed in 10 districts
50 percent were reported as not functioning, with shops
damaged/destroyed, food stocks completely depleted or ruined, or
shopkeepers and traders displaced or affected.
40 percent were reported as showing early signs of recovery.
These markets are currently not fully functioning and would be
unable to support local demand, with a few shops open but most
closed due to fear of aftershocks, structural collapse, security, or
depleted stocks.
10 percent were reported as functioning, with shops open, food
stocks available, but price increases and some commodities not
available.
Main roads are generally open but landslides and
security have limited access in some areas:
In general road access is not a concern, although landslides have
blocked transportation in some areas, including Rasuwa DHQ.
However, many affected areas are remote without road access
even in normal circumstances.
4
Markets are slowly recovering.
An updated map will be published in Release 3 of
this report.
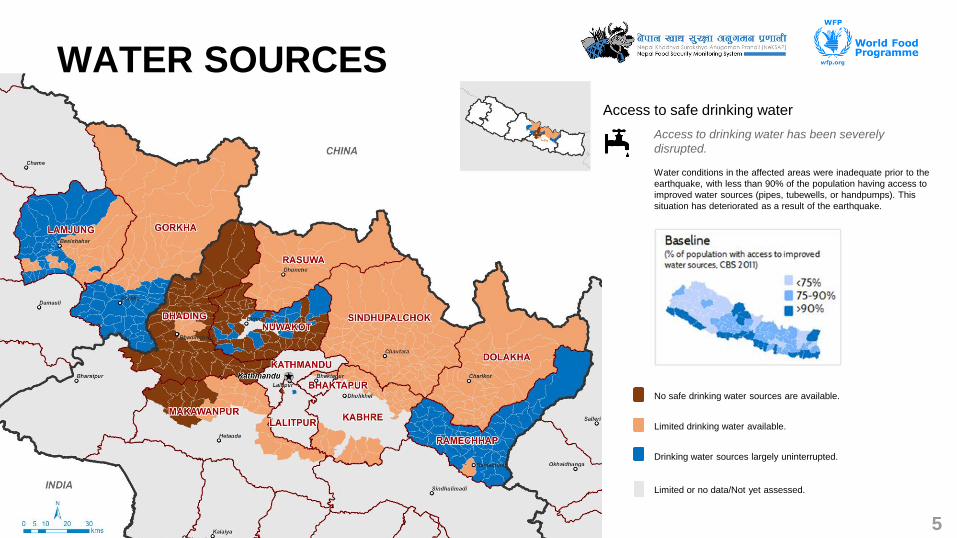
WATER SOURCESAccess to safe drinking water
Access to drinking water has been severely
disrupted.
Water conditions in the affected areas were inadequate prior to the
earthquake, with less than 90% of the population having access to
improved water sources (pipes, tubewells, or handpumps). This
situation has deteriorated as a result of the earthquake.
No safe drinking water sources are available.
Limited drinking water available.
Drinking water sources largely uninterrupted.
Limited or no data/Not yet assessed.
5
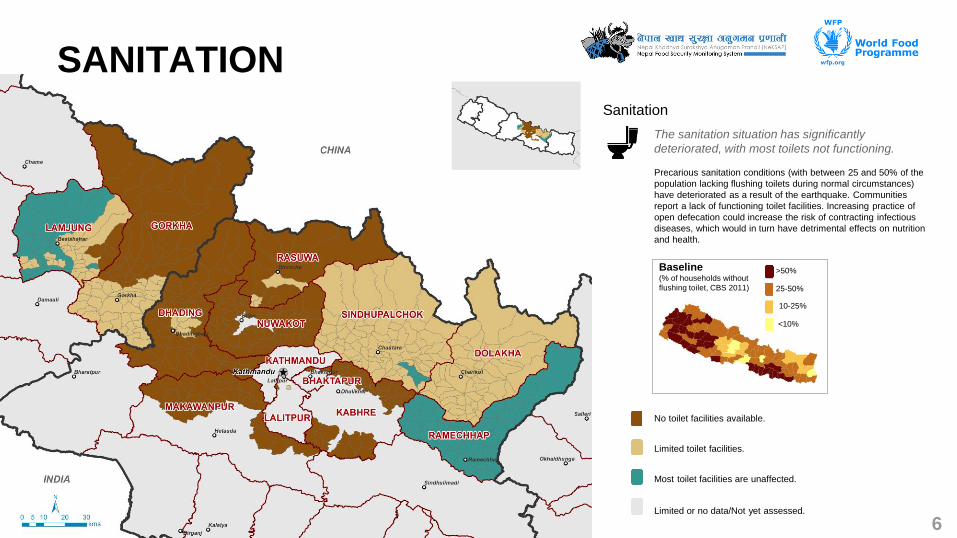
SANITATIONSanitation
The sanitation situation has significantly
deteriorated, with most toilets not functioning.
Precarious sanitation conditions (with between 25 and 50% of the
population lacking flushing toilets during normal circumstances)
have deteriorated as a result of the earthquake. Communities
report a lack of functioning toilet facilities. Increasing practice of
open defecation could increase the risk of contracting infectious
diseases, which would in turn have detrimental effects on nutrition
and health.
No toilet facilities available.
Limited toilet facilities.
Most toilet facilities are unaffected.
Limited or no data/Not yet assessed.
6
Baseline(% of households without
flushing toilet, CBS 2011)
>50%
25-50%
10-25%
<10%
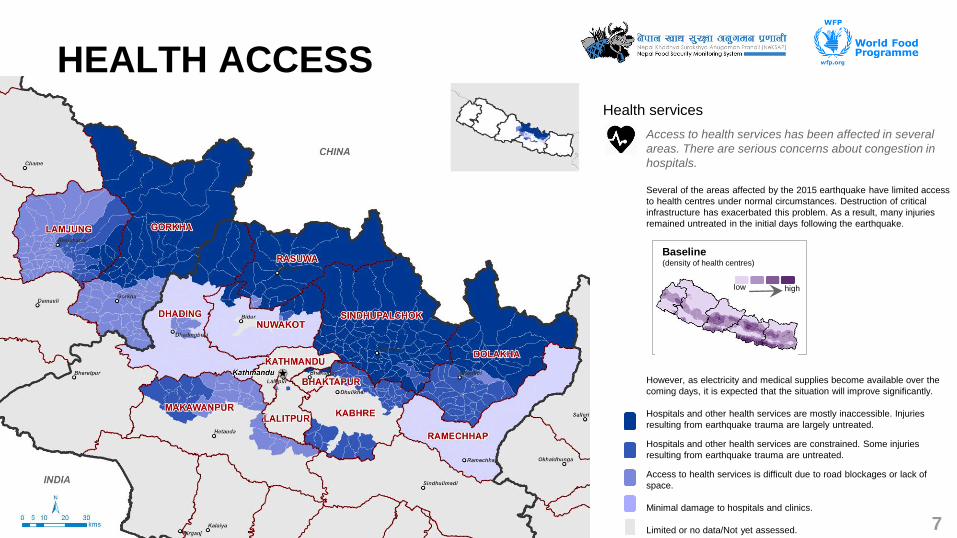
HEALTH ACCESSHealth services
Access to health services has been affected in several
areas. There are serious concerns about congestion in
hospitals.
Several of the areas affected by the 2015 earthquake have limited access
to health centres under normal circumstances. Destruction of critical
infrastructure has exacerbated this problem. As a result, many injuries
remained untreated in the initial days following the earthquake.
However, as electricity and medical supplies become available over the
coming days, it is expected that the situation will improve significantly.
Hospitals and other health services are mostly inaccessible. Injuries
resulting from earthquake trauma are largely untreated.
Hospitals and other health services are constrained. Some injuries
resulting from earthquake trauma are untreated.
Access to health services is difficult due to road blockages or lack of
space.
Minimal damage to hospitals and clinics.
Limited or no data/Not yet assessed. 7
Baseline(density of health centres)
low high

METHOD
8
An initial remote 72 hour assessment was conducted by WFP on 25/26 April
2015. The assessment provided first estimates of the affected population
requiring assistance based on published USGS shakemaps, population density
and housing quality.
Capitalizing on the NeKSAP field capacity, 6 field teams were deployed from 27
to 30 April visiting 10 of the most affected districts outside of the Kathmandu
Valley. Bhaktapur and Lalitpur were also assessed but results are not shown in
this report as the focus of this assessment is on districts outside the Kathmandu
Valley, as instructed by the Government of Nepal and the Food Security
Cluster. Updates received until 2 May have been incorporated in the report .
The aim was to verify and update the findings from the 72 hour assessment
through direct observation (where possible) and district-level stakeholder
consultation, and categorize the severity of the earthquake’s impact across
Nepal at the VDC level. The assessment captured key information covering the
following sectors: displacement and housing; infrastructure and services;
WASH; health; and food security, using a short and simple observation
checklist. Population in need is calculated by taking the entire population (2015
projected estimates from 2011 Census) living in the priority areas.
In addition to the observation checklist, information obtained via members of the
Nepali population submitting via the BBC media was used (see Annex 1).
Updates will be released over the next days based on availability of new data....
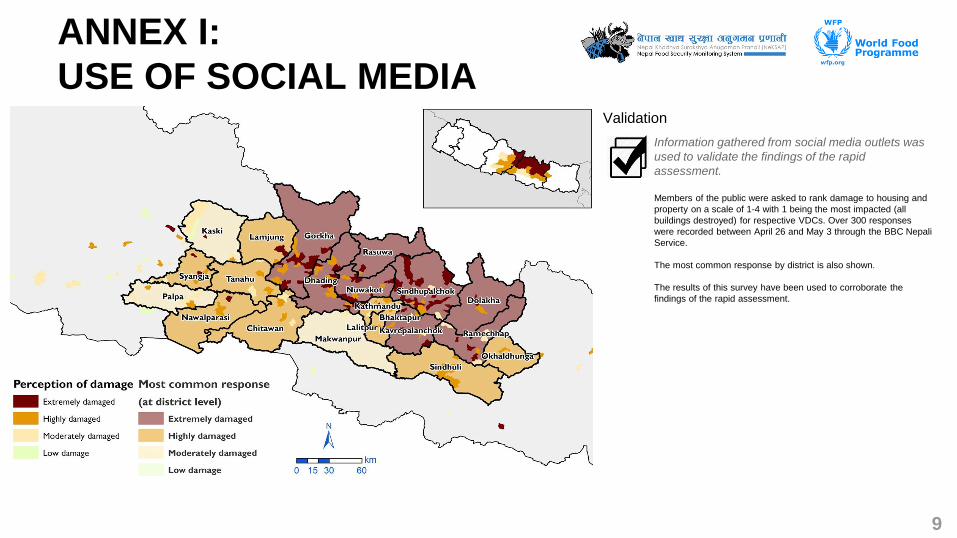
ANNEX I:
USE OF SOCIAL MEDIA
9
Validation
Information gathered from social media outlets was
used to validate the findings of the rapid
assessment.
Members of the public were asked to rank damage to housing and
property on a scale of 1-4 with 1 being the most impacted (all
buildings destroyed) for respective VDCs. Over 300 responses
were recorded between April 26 and May 3 through the BBC Nepali
Service.
The most common response by district is also shown.
The results of this survey have been used to corroborate the
findings of the rapid assessment.