Embed Size (px)
Citation preview
A1602240 1
Nelson’s Ageing Population A background paper on Nelson’s demographic trends and on
characteristics of the population aged 65 years and over, to
better understand the implications for Nelson of an ageing
population.
February 2017
Nelson’s population is now over 50,000 and there are estimated to be more people aged
over 65 than there are children aged under 15. Nelson’s population is ageing and the
median age is projected to increase from 42 years in 2013 to 51 in 2043.
Between 2013 and 2043, the number of Nelson residents aged 65 and over is projected to
more than double and will make up a third of the total Nelson population by 2043, compared
with 17 percent in 2013.
The purpose of this research is to gain a better understanding of the components and
characteristics of Nelson’s older population. This can be used to assist with Council
planning, policy making and as background information for Asset and Activity Management
Plans.
The report looks at demographic trends to understand the drivers of an ageing population.
The report provides information on the current state and trends for the older population in
Nelson in terms of housing, employment, income, health, transport and social connection.
Throughout the report, ‘older people’ and ‘older residents’ refers to residents aged 65 years
and older.
It is important to remember that “older people are not homogenous in expectations, needs
and behaviours” and “there is a need to avoid generalisation about what can be determined
from demography about older people’s needs solely on the basis on the present
generation”1.
1 Organisation for Economic Co-operation and Development (2002) Ageing, Housing and Urban Development
A1602240 2
Contents Key Findings ......................................................................................................................................... 3
Population Overview ............................................................................................................................ 4
Components of Population Change .............................................................................................. 6
Natural increase/decline .............................................................................................................. 6
Net migration ................................................................................................................................. 7
High growth scenario ....................................................................................................................... 9
Labour market demographics ....................................................................................................... 10
Housing ................................................................................................................................................ 12
Current housing .............................................................................................................................. 12
Residential care .............................................................................................................................. 13
Future Housing Demand ............................................................................................................... 14
Financial wellbeing ............................................................................................................................. 15
Income levels .................................................................................................................................. 15
Sources of income ......................................................................................................................... 16
Material and Financial Wellbeing ................................................................................................. 17
Health ................................................................................................................................................... 18
Disability Levels .............................................................................................................................. 19
Dementia ......................................................................................................................................... 20
Nutrition ............................................................................................................................................ 21
Physical Activity .............................................................................................................................. 21
Social Connection .............................................................................................................................. 23
Volunteering .................................................................................................................................... 24
Education ............................................................................................................................................. 24
Transport ............................................................................................................................................. 24
Private Transport ........................................................................................................................ 25
Public Transport ......................................................................................................................... 25
Appendix 1: Demographic indicators, territorial authority ranking .............................................. 26
References .......................................................................................................................................... 28
A1602240 3
Key Findings
The number of Nelson residents aged 65 and over is projected to more than
double between 2013 and 2043 and will then make up a third of the total
Nelson population, compared with 17 percent in 2013.
Over that time, most of Nelson’s population growth will be in residents aged
65 years or older, while the number of children is projected to decline.
Despite the likelihood of more deaths than births by 2033, positive net
migration (more people moving here than leaving) should mean that Nelson’s
population continues to experience positive growth, albeit at a slower rate.
Even under a high growth scenario, most of the Nelson’s population growth
would still be in the number of older people, and growth would still slow down
over time.
Although older people are becoming more active in the labour market,
Nelson’s workforce is ageing and is expected to face sustained labour
shortages.
The majority of Nelson’s older people live in one- or two-person households
and own their homes, although home ownership rates are expected to be
lower for older people in the future.
Older people generally prefer to age in place and prefer smaller properties
than younger age groups.
Despite lower incomes than younger age groups, older people generally
report higher net worth and higher material and financial wellbeing.
Despite trends for disability rates to increase with age and physical activity
rates to decline, older people in the upper South Island generally report good
health and good nutrition.
The majority of older people report rarely feeling lonely and are satisfied with
the amount of contact with family and friends.
Nelson’s older residents have relatively high education levels
Despite an increasing majority of older people with access to a motor vehicle,
there is an increasing trend in public transport use.

A1602240 4
Population Overview2
By 2028, over a quarter of Nelson’s population will be 65 years or older.
By 2043, older people will contribute a third of the population.
Under Statistics New Zealand’s medium series assumptions, Nelson’s total population is expected to
grow by 6,600 residents between 2013 and 2028 and by 2,700 between 2028 and 2043. Population
growth is expected to slow down over time, largely due to the ageing of the population.
The number of older people in Nelson is projected to increase from 8,400 in 2013 (17% of the
population), to 14,700 in 2028 (27%), and will account for a third of the population by 2043.
Increasing life expectancy and the ageing of the baby boomer cohort are driving a numerical increase
in the number of older people.
Between 2013 and 2028, most of Nelson’s population growth is in the 65-84 years age groups.
Between 2028 and 2043, the greatest growth is projected to be in the 75 years and over age groups.
The number of people aged 75 years and over will triple over the next three decades.
Table 1: Population projections by age groups (medium series), Nelson, 2013-2043
Measure 2013 Change 2013-2028
2028 Change 2028-2043
2043
Median age (years) 42.2 46.9 50.5
Total population 48,700 +6,600 55,300 +2,700 58,000
Under 15 years 9,200 -400 8,800 -400 8,400
15-39 years 13,600 +800 14,400 -300 14,100
40-64 years 17,500 -100 17,400 -900 16,500
65 years and over 8,400 +6,300 14,700 +4,300 19,000
65-74 years 4,600 +2,900 7,500 +100 7,600
75-84 years 2,600 +2,600 5,200 +2,100 7,300
85 years and over 1,200 +800 2,000 +2,100 4,100
The proportion of the population aged under 15 years will decrease from 19% in 2013 to 14% in 2043.
An increase in the proportion of the population that is older, and a decrease in the proportion who are
younger, known as ‘structural ageing’, is partly due to decreasing fertility rates, the average number of
births per woman, and partly due to increasing life expectancy. Structural ageing is also contributed to
by ageing-in-place of older cohorts, net migration gains of older people, and net migration loss of
younger people.
2 Unless otherwise specified, population data is sourced from Statistics New Zealand. Population projections are
based on the medium series, published by Statistics New Zealand on 22 February 2017, which use Census
demographics and historic trends as a base (2013-based). Statistics New Zealand advised at the time that the
medium projection is considered suitable for assessing future population change. Projections are not predictions
and should be used as an indication of the overall trend, rather than as exact forecasts.
A1602240 5
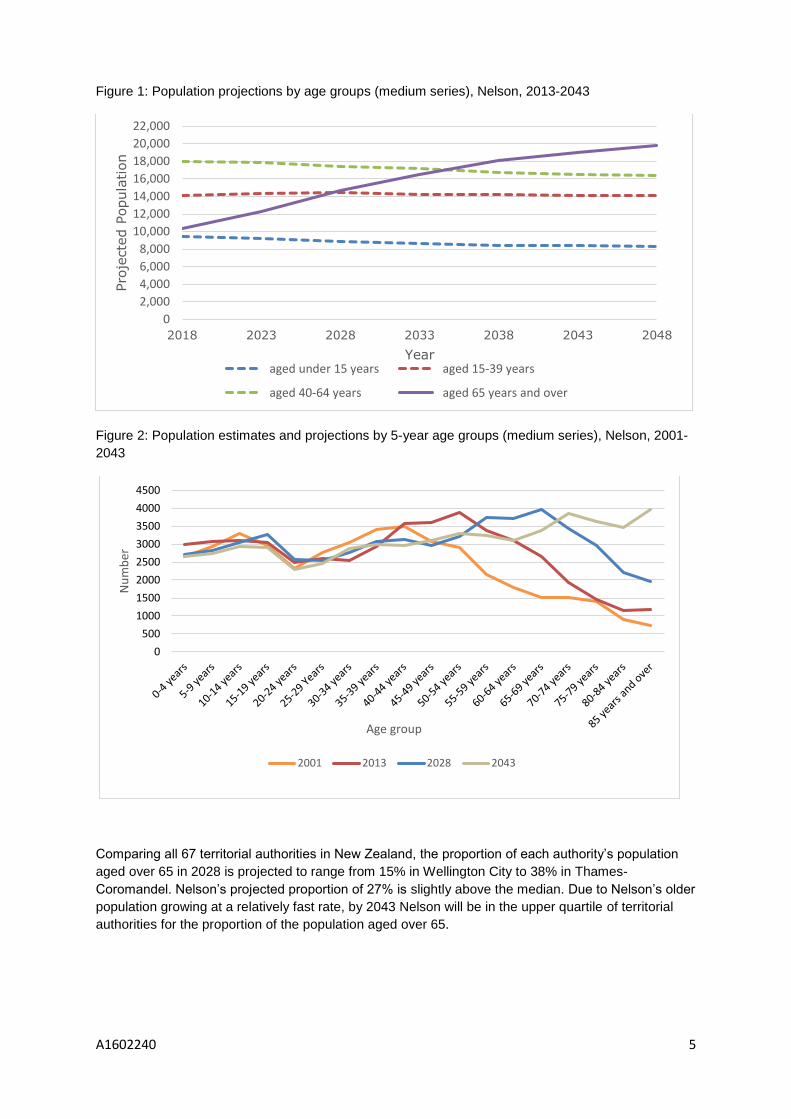
Figure 1: Population projections by age groups (medium series), Nelson, 2013-2043
Figure 2: Population estimates and projections by 5-year age groups (medium series), Nelson, 2001-
2043
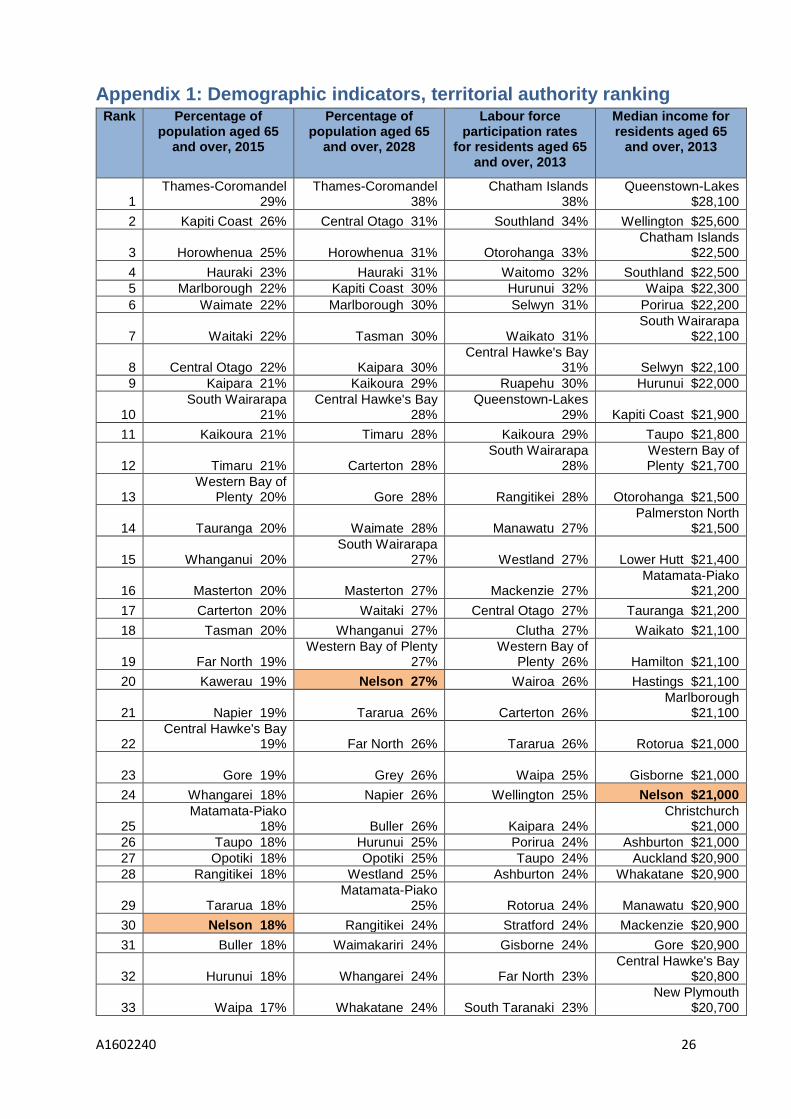
Comparing all 67 territorial authorities in New Zealand, the proportion of each authority’s population
aged over 65 in 2028 is projected to range from 15% in Wellington City to 38% in Thames-
Coromandel. Nelson’s projected proportion of 27% is slightly above the median. Due to Nelson’s older
population growing at a relatively fast rate, by 2043 Nelson will be in the upper quartile of territorial
authorities for the proportion of the population aged over 65.
0
2,000
4,000
6,000
8,000
10,000
12,000
14,000
16,000
18,000
20,000
22,000
2018 2023 2028 2033 2038 2043 2048
Pro
jecte
d P
opula
tion
Year aged under 15 years aged 15-39 years
aged 40-64 years aged 65 years and over
0
500
1000
1500
2000
2500
3000
3500
4000
4500
Nu
mb
er
Age group
2001 2013 2028 2043
A1602240 6
Components of Population Change
The ageing of Nelson’s population, and the slowing population growth, is driven by:
increasing life expectancy
ageing of the baby boomer cohort
decreasing fertility rates
net migration loss of younger age groups, particularly 20-24 year
olds (leaving for study, travel or work)
increasing net migration gains of people in older age groups
(moving or returning to Nelson)
In general, population change is based on two main components:
Natural increase/decline: the number of births minus the number of deaths
Net migration: the number of people moving to Nelson (from overseas or from other
parts of New Zealand) minus the number of people moving out of Nelson (overseas
or to other parts of New Zealand)
Natural increase/decline
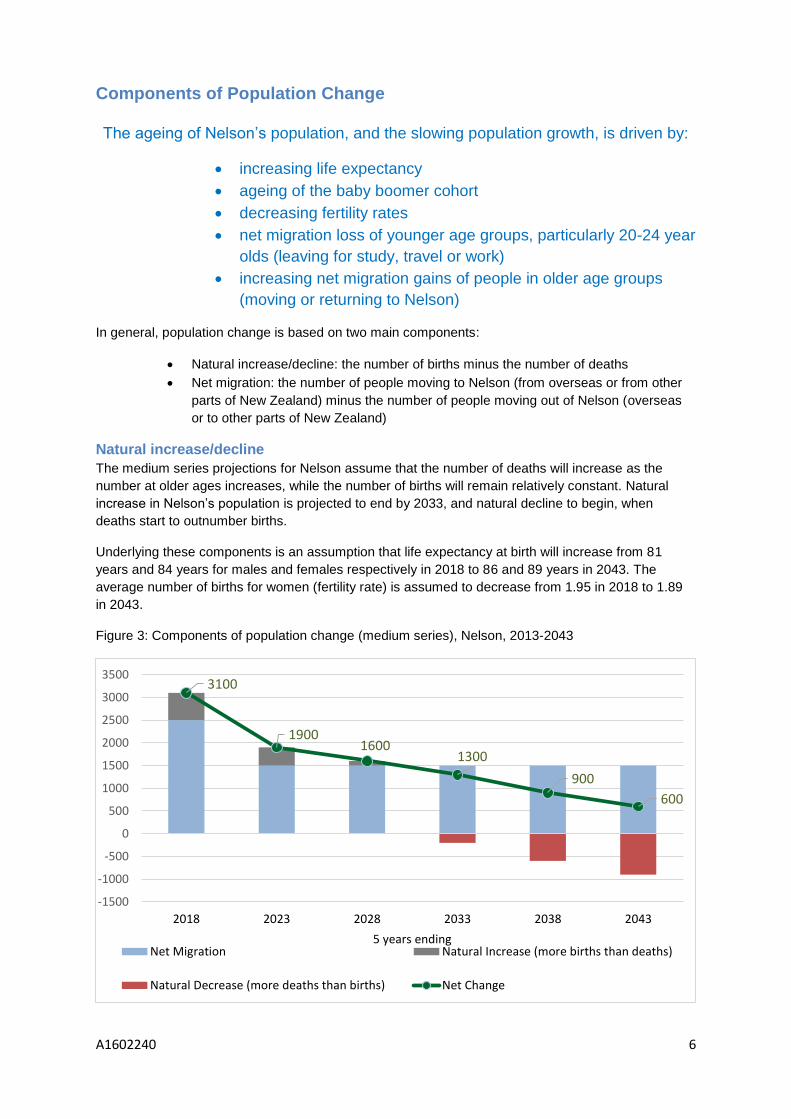
The medium series projections for Nelson assume that the number of deaths will increase as the
number at older ages increases, while the number of births will remain relatively constant. Natural
increase in Nelson’s population is projected to end by 2033, and natural decline to begin, when
deaths start to outnumber births.
Underlying these components is an assumption that life expectancy at birth will increase from 81
years and 84 years for males and females respectively in 2018 to 86 and 89 years in 2043. The
average number of births for women (fertility rate) is assumed to decrease from 1.95 in 2018 to 1.89
in 2043.
Figure 3: Components of population change (medium series), Nelson, 2013-2043
3100
19001600
1300
900
600
-1500
-1000
-500
0
500
1000
1500
2000
2500
3000
3500
2018 2023 2028 2033 2038 2043
5 years endingNet Migration Natural Increase (more births than deaths)
Natural Decrease (more deaths than births) Net Change
A1602240 7
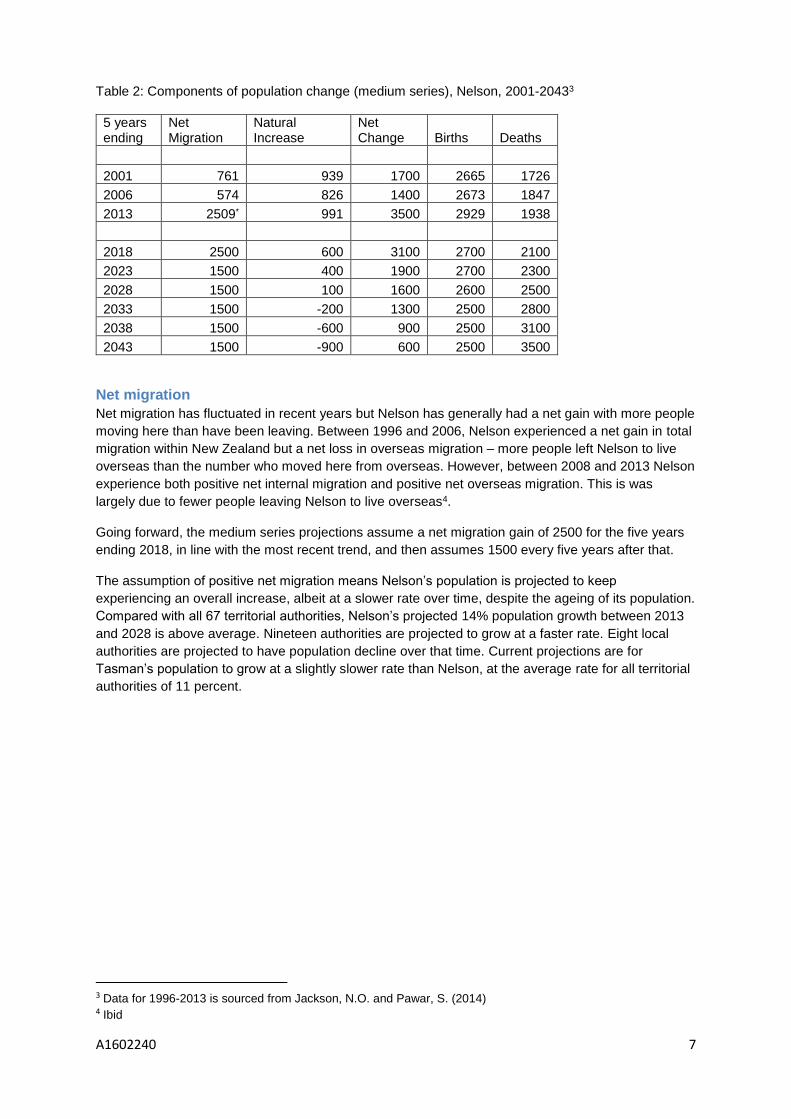
Table 2: Components of population change (medium series), Nelson, 2001-20433
5 years ending
Net Migration
Natural Increase
Net Change Births Deaths
2001 761 939 1700 2665 1726
2006 574 826 1400 2673 1847
2013 2509* 991 3500 2929 1938
2018 2500 600 3100 2700 2100
2023 1500 400 1900 2700 2300
2028 1500 100 1600 2600 2500
2033 1500 -200 1300 2500 2800
2038 1500 -600 900 2500 3100
2043 1500 -900 600 2500 3500
Net migration
Net migration has fluctuated in recent years but Nelson has generally had a net gain with more people
moving here than have been leaving. Between 1996 and 2006, Nelson experienced a net gain in total
migration within New Zealand but a net loss in overseas migration – more people left Nelson to live
overseas than the number who moved here from overseas. However, between 2008 and 2013 Nelson
experience both positive net internal migration and positive net overseas migration. This is was
largely due to fewer people leaving Nelson to live overseas4.
Going forward, the medium series projections assume a net migration gain of 2500 for the five years
ending 2018, in line with the most recent trend, and then assumes 1500 every five years after that.
The assumption of positive net migration means Nelson’s population is projected to keep
experiencing an overall increase, albeit at a slower rate over time, despite the ageing of its population.
Compared with all 67 territorial authorities, Nelson’s projected 14% population growth between 2013
and 2028 is above average. Nineteen authorities are projected to grow at a faster rate. Eight local
authorities are projected to have population decline over that time. Current projections are for
Tasman’s population to grow at a slightly slower rate than Nelson, at the average rate for all territorial
authorities of 11 percent.
3 Data for 1996-2013 is sourced from Jackson, N.O. and Pawar, S. (2014) 4 Ibid
A1602240 8
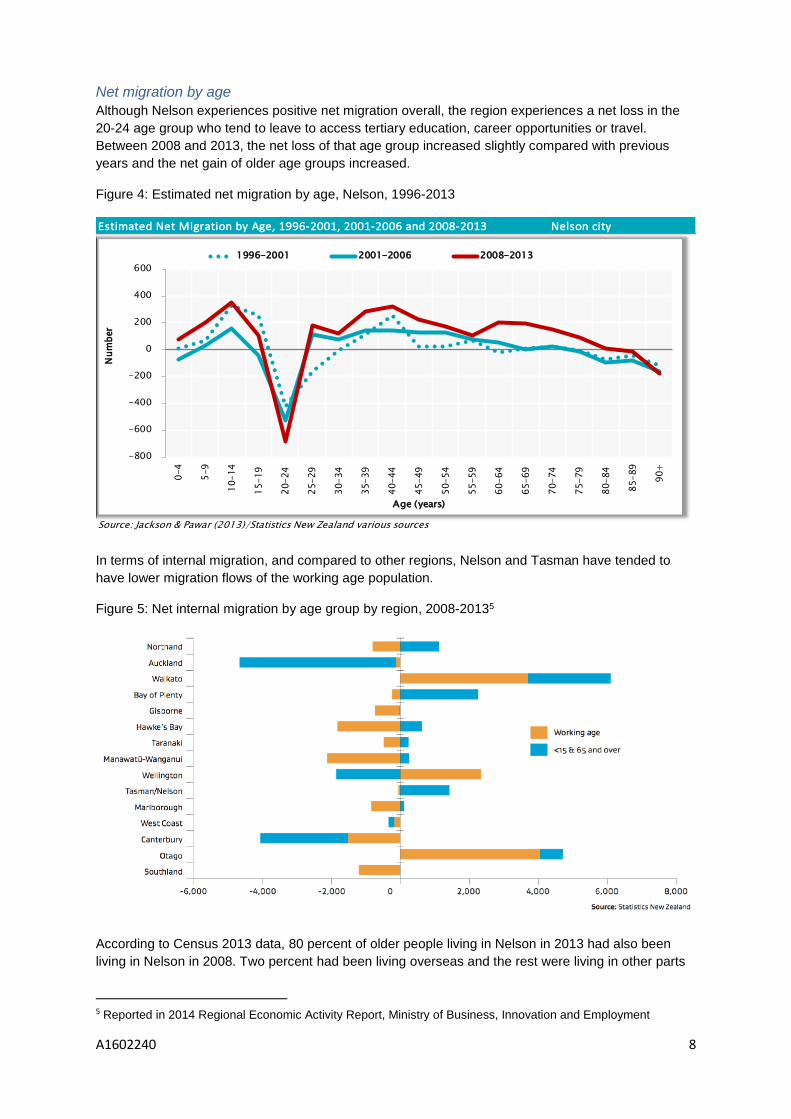
Net migration by age
Although Nelson experiences positive net migration overall, the region experiences a net loss in the
20-24 age group who tend to leave to access tertiary education, career opportunities or travel.
Between 2008 and 2013, the net loss of that age group increased slightly compared with previous
years and the net gain of older age groups increased.
Figure 4: Estimated net migration by age, Nelson, 1996-2013
In terms of internal migration, and compared to other regions, Nelson and Tasman have tended to
have lower migration flows of the working age population.
Figure 5: Net internal migration by age group by region, 2008-20135
According to Census 2013 data, 80 percent of older people living in Nelson in 2013 had also been
living in Nelson in 2008. Two percent had been living overseas and the rest were living in other parts
5 Reported in 2014 Regional Economic Activity Report, Ministry of Business, Innovation and Employment
Estimated Net Migration by Age, 1996-2001, 2001-2006 and 2008-2013 Nelson city
Source: Jackson & Pawar (2013)/Statistics New Zealand various sources
-800
-600
-400
-200
0
200
400
600
0-4
5-9
10-14
15-19
20-24
25-29
30-34
35-39
40-44
45-49
50-54
55-59
60-64
65-69
70-74
75-79
80-84
85-89
90+
Nu
mb
er
Age (years)
1996-2001 2001-2006 2008-2013
A1602240 9
of New Zealand. Four percent had moved from Tasman and three percent had moved from
Canterbury.
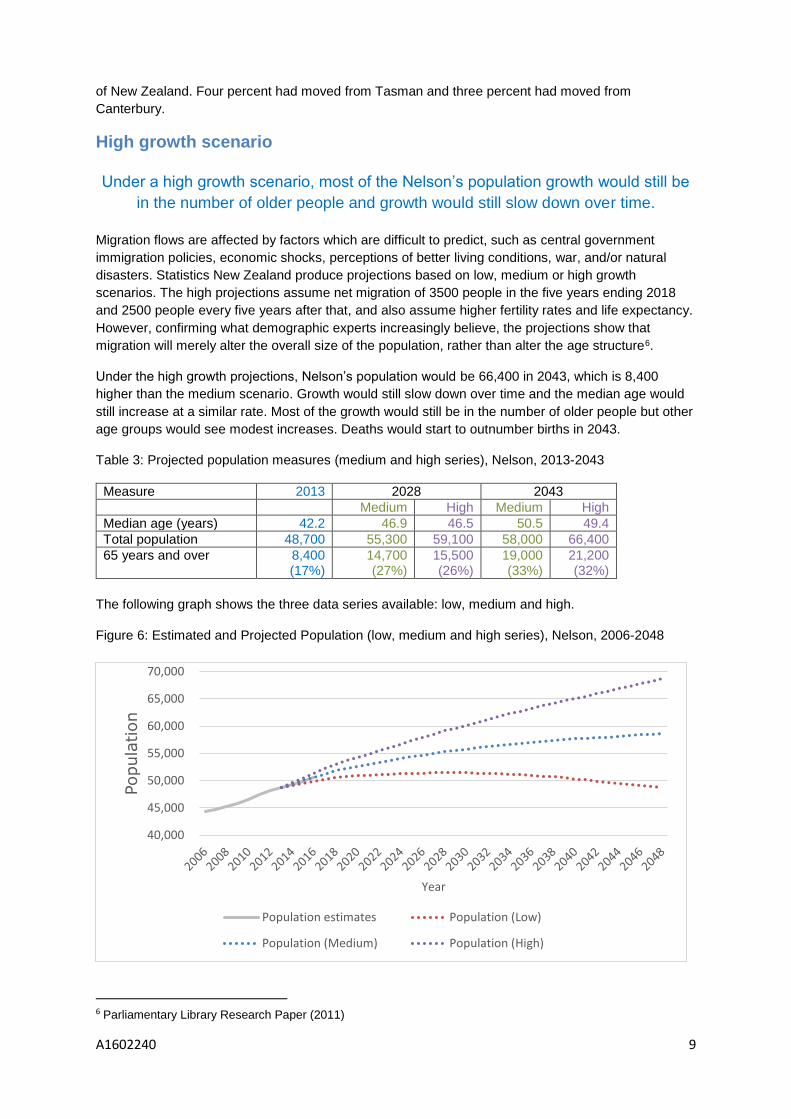
High growth scenario
Under a high growth scenario, most of the Nelson’s population growth would still be
in the number of older people and growth would still slow down over time.
Migration flows are affected by factors which are difficult to predict, such as central government
immigration policies, economic shocks, perceptions of better living conditions, war, and/or natural
disasters. Statistics New Zealand produce projections based on low, medium or high growth
scenarios. The high projections assume net migration of 3500 people in the five years ending 2018
and 2500 people every five years after that, and also assume higher fertility rates and life expectancy.
However, confirming what demographic experts increasingly believe, the projections show that
migration will merely alter the overall size of the population, rather than alter the age structure6.
Under the high growth projections, Nelson’s population would be 66,400 in 2043, which is 8,400
higher than the medium scenario. Growth would still slow down over time and the median age would
still increase at a similar rate. Most of the growth would still be in the number of older people but other
age groups would see modest increases. Deaths would start to outnumber births in 2043.
Table 3: Projected population measures (medium and high series), Nelson, 2013-2043
Measure 2013 2028 2043
Medium High Medium High
Median age (years) 42.2 46.9 46.5 50.5 49.4
Total population 48,700 55,300 59,100 58,000 66,400
65 years and over 8,400 (17%)
14,700 (27%)
15,500 (26%)
19,000 (33%)
21,200 (32%)
The following graph shows the three data series available: low, medium and high.
Figure 6: Estimated and Projected Population (low, medium and high series), Nelson, 2006-2048
6 Parliamentary Library Research Paper (2011)
40,000
45,000
50,000
55,000
60,000
65,000
70,000
Popula
tion
Year
Population estimates Population (Low)
Population (Medium) Population (High)
A1602240 10
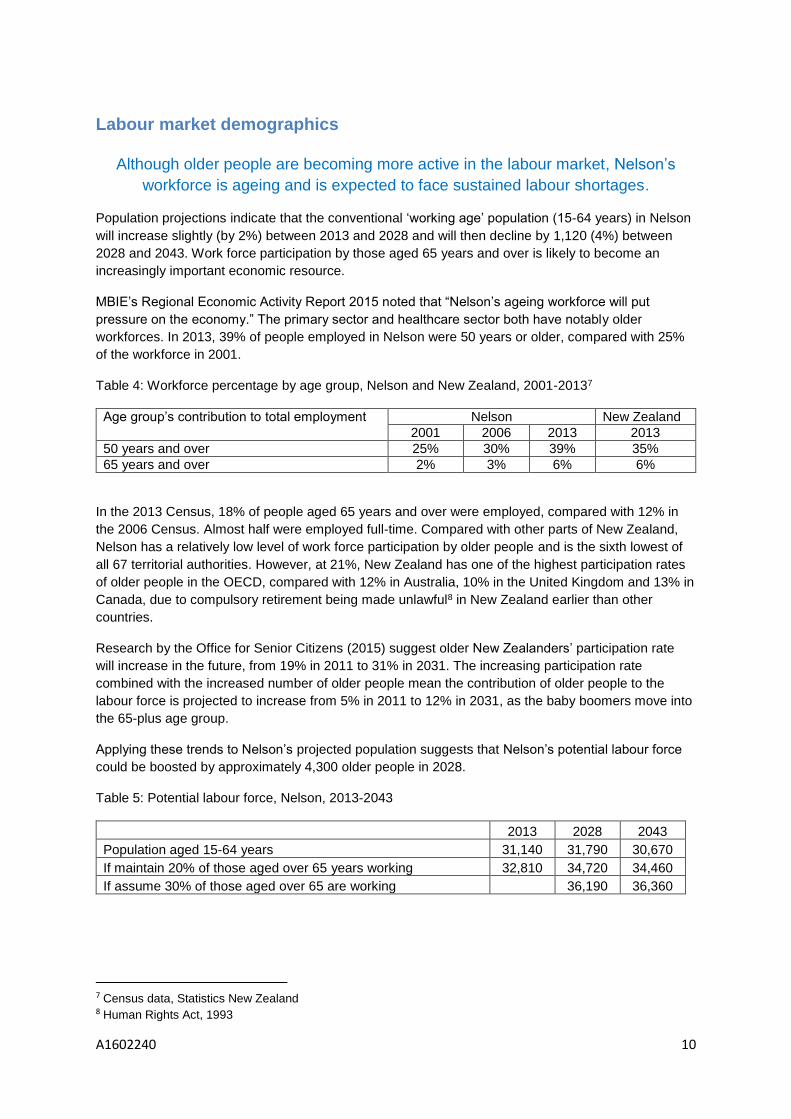
Labour market demographics
Although older people are becoming more active in the labour market, Nelson’s
workforce is ageing and is expected to face sustained labour shortages.
Population projections indicate that the conventional ‘working age’ population (15-64 years) in Nelson
will increase slightly (by 2%) between 2013 and 2028 and will then decline by 1,120 (4%) between
2028 and 2043. Work force participation by those aged 65 years and over is likely to become an
increasingly important economic resource.
MBIE’s Regional Economic Activity Report 2015 noted that “Nelson’s ageing workforce will put
pressure on the economy.” The primary sector and healthcare sector both have notably older
workforces. In 2013, 39% of people employed in Nelson were 50 years or older, compared with 25%
of the workforce in 2001.
Table 4: Workforce percentage by age group, Nelson and New Zealand, 2001-20137
Age group’s contribution to total employment Nelson New Zealand
2001 2006 2013 2013
50 years and over 25% 30% 39% 35%
65 years and over 2% 3% 6% 6%
In the 2013 Census, 18% of people aged 65 years and over were employed, compared with 12% in
the 2006 Census. Almost half were employed full-time. Compared with other parts of New Zealand,
Nelson has a relatively low level of work force participation by older people and is the sixth lowest of
all 67 territorial authorities. However, at 21%, New Zealand has one of the highest participation rates
of older people in the OECD, compared with 12% in Australia, 10% in the United Kingdom and 13% in
Canada, due to compulsory retirement being made unlawful8 in New Zealand earlier than other
countries.
Research by the Office for Senior Citizens (2015) suggest older New Zealanders’ participation rate
will increase in the future, from 19% in 2011 to 31% in 2031. The increasing participation rate
combined with the increased number of older people mean the contribution of older people to the
labour force is projected to increase from 5% in 2011 to 12% in 2031, as the baby boomers move into
the 65-plus age group.
Applying these trends to Nelson’s projected population suggests that Nelson’s potential labour force
could be boosted by approximately 4,300 older people in 2028.
Table 5: Potential labour force, Nelson, 2013-2043
2013 2028 2043
Population aged 15-64 years 31,140 31,790 30,670
If maintain 20% of those aged over 65 years working 32,810 34,720 34,460
If assume 30% of those aged over 65 are working 36,190 36,360
7 Census data, Statistics New Zealand 8 Human Rights Act, 1993
A1602240 11
Another key indicator of structural ageing is the ratio of people at labour market entry age (15-24
years) to those in age groups approaching retirement (typically 55-64 years).
Using these age groupings, Nelson’s ratio of people at labour market ‘entry’ to ‘exit’ age is already
below one entrant per exit (0.86) and is projected to decline to 0.73 (73 entrants per 100 exits) by
2023. The ratio will then increase slightly as a large birth cohort (born between 2002 and 2008)
arrives at labour market entry age. However it is not projected to rise above 0.82 entrants per exit.
If the exit age group is expanded to 55+ years to allow for increased participation of older workers, the
ratio is presently 0.37 (37 people at entry age per 100 at exit age), and this ratio will fall steadily
across the projection period, to 0.27 by 2028, and to just 0.22 by 2043.
Both measures9 illustrate significant structural ageing for Nelson; however they also indicate the
arrival of sustained labour shortages, in that even with increased participation at older ages, the
number of people at entry to exit age will continue to decline.
A survey of older workers in Nelson in 200910 found that health was the main enabling factor for
remaining in work. This was mirrored by research by Treasury11into the retirement decisions of older
New Zealanders which found that health status is significantly associated with the decision to work. A
study12 from the Ministry of Social Development noted that participation rates in this age group vary
between genders, with 45% of 65-69 year old men participating in the labour force compared with
31% of 65-69 year old women. However, participation rates for both genders in that age group were
likely to increase by 2051, to 65% for men and 55% for women.
An earlier report13 noted that there can be positive effects on health and wellbeing to those that work
beyond the traditional retirement age, with the mix of effects depending on the individual’s
circumstance, the job and the workplace. Some older people’s capacity to work may be affected by
poor health. New Zealand research shows that health status is a key factor in determining how long
people remain in the workforce14. An earlier study by the Ministry of Social Development in 2009
found that factors which would encourage older workers to say in work included variable hours of
work, more unpaid leave, work with less responsibility or physical demands, and working from home.
9 Entry-exit ratios supplied by Natalie Jackson, personal correspondence 6/9/2016, A1631163 10 Nelson City Council (2009) Older Workers in Nelson: Results from a survey of the attitudes of the over 50s
towards work 11 Scobie, Grant M and Enright, Jamas (2010) Healthy, Wealthy and Working: Retirement Decisions of Older
New Zealanders. 12Ministry of Social Development (2015) 13 Ministry of Social Development (2011) 14 Davey, J A (2007)
A1602240 12
Housing
The majority of Nelson’s older people live in one- or two-person households. The
majority own their homes, live in separate houses, and generally have no major
issues with the condition or warmth of their homes. Older people generally prefer to
age in place and prefer smaller properties than younger age groups.
Current housing15 The majority (78%) of Nelson’s older residents own or partly own16 their usual residence, compared
with 69% of 40-64 year olds and 25% of 15-39 year olds. There has been a small decline in home
ownership by older people, down from 80% in 2006 and 2001. This reflects trends elsewhere in New
Zealand.
The majority (87%) live in private dwellings and half live in single-storey stand-alone houses. A
quarter live in two storey dwellings.
The following data is for residents in private dwellings only and does not include residents in
residential care.
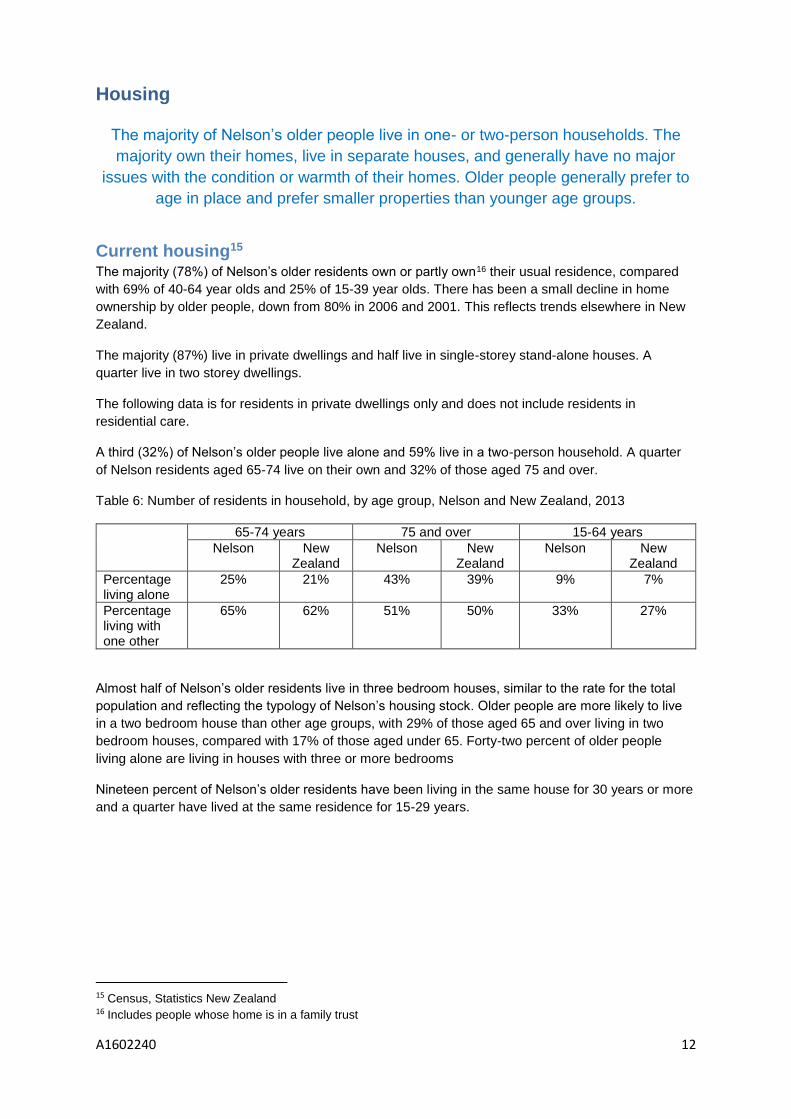
A third (32%) of Nelson’s older people live alone and 59% live in a two-person household. A quarter
of Nelson residents aged 65-74 live on their own and 32% of those aged 75 and over.
Table 6: Number of residents in household, by age group, Nelson and New Zealand, 2013
65-74 years 75 and over 15-64 years
Nelson New Zealand
Nelson New Zealand
Nelson New Zealand
Percentage living alone
25% 21% 43% 39% 9% 7%
Percentage living with one other
65% 62% 51% 50% 33% 27%
Almost half of Nelson’s older residents live in three bedroom houses, similar to the rate for the total
population and reflecting the typology of Nelson’s housing stock. Older people are more likely to live
in a two bedroom house than other age groups, with 29% of those aged 65 and over living in two
bedroom houses, compared with 17% of those aged under 65. Forty-two percent of older people
living alone are living in houses with three or more bedrooms
Nineteen percent of Nelson’s older residents have been living in the same house for 30 years or more
and a quarter have lived at the same residence for 15-29 years.
15 Census, Statistics New Zealand 16 Includes people whose home is in a family trust
A1602240 13
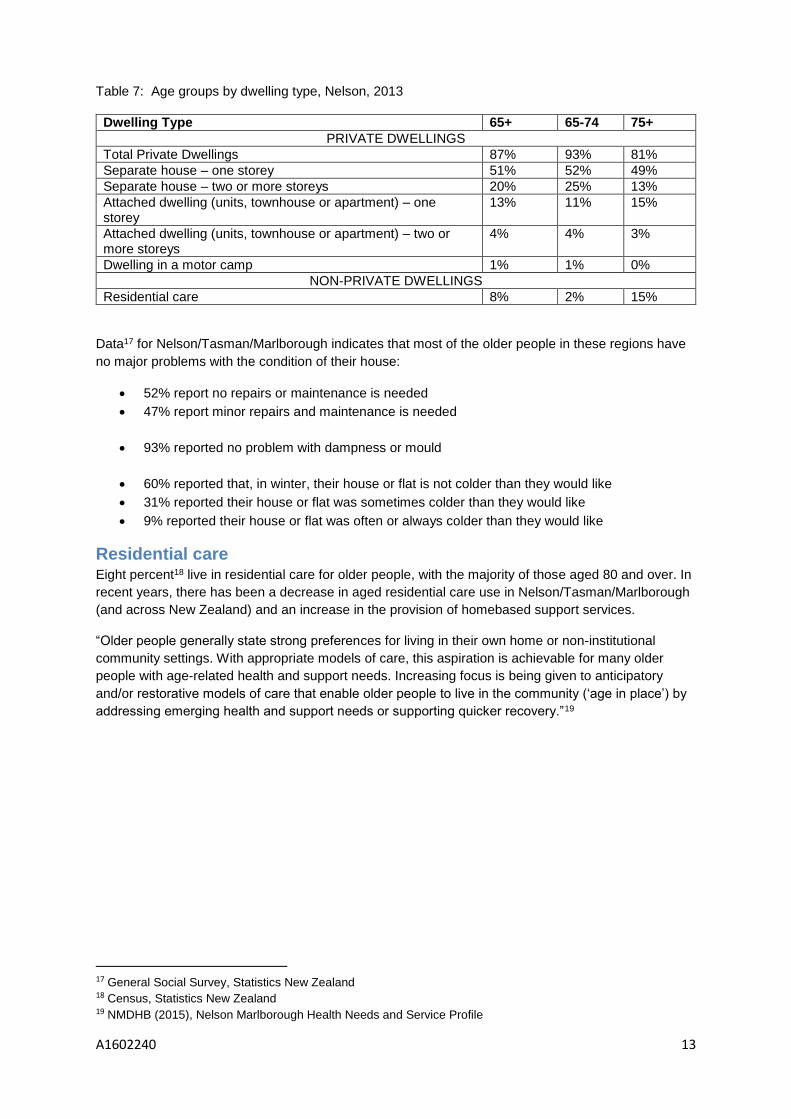
Table 7: Age groups by dwelling type, Nelson, 2013
Dwelling Type 65+ 65-74 75+
PRIVATE DWELLINGS
Total Private Dwellings 87% 93% 81%
Separate house – one storey 51% 52% 49%
Separate house – two or more storeys 20% 25% 13%
Attached dwelling (units, townhouse or apartment) – one storey
13% 11% 15%
Attached dwelling (units, townhouse or apartment) – two or more storeys
4% 4% 3%
Dwelling in a motor camp 1% 1% 0%
NON-PRIVATE DWELLINGS
Residential care 8% 2% 15%
Data17 for Nelson/Tasman/Marlborough indicates that most of the older people in these regions have
no major problems with the condition of their house:
52% report no repairs or maintenance is needed
47% report minor repairs and maintenance is needed
93% reported no problem with dampness or mould
60% reported that, in winter, their house or flat is not colder than they would like
31% reported their house or flat was sometimes colder than they would like
9% reported their house or flat was often or always colder than they would like
Residential care Eight percent18 live in residential care for older people, with the majority of those aged 80 and over. In
recent years, there has been a decrease in aged residential care use in Nelson/Tasman/Marlborough
(and across New Zealand) and an increase in the provision of homebased support services.
“Older people generally state strong preferences for living in their own home or non-institutional
community settings. With appropriate models of care, this aspiration is achievable for many older
people with age-related health and support needs. Increasing focus is being given to anticipatory
and/or restorative models of care that enable older people to live in the community (‘age in place’) by
addressing emerging health and support needs or supporting quicker recovery.”19
17 General Social Survey, Statistics New Zealand 18 Census, Statistics New Zealand 19 NMDHB (2015), Nelson Marlborough Health Needs and Service Profile
A1602240 14
Future Housing Demand The ageing population is driving a trend for smaller households and increasing demand for smaller
properties.
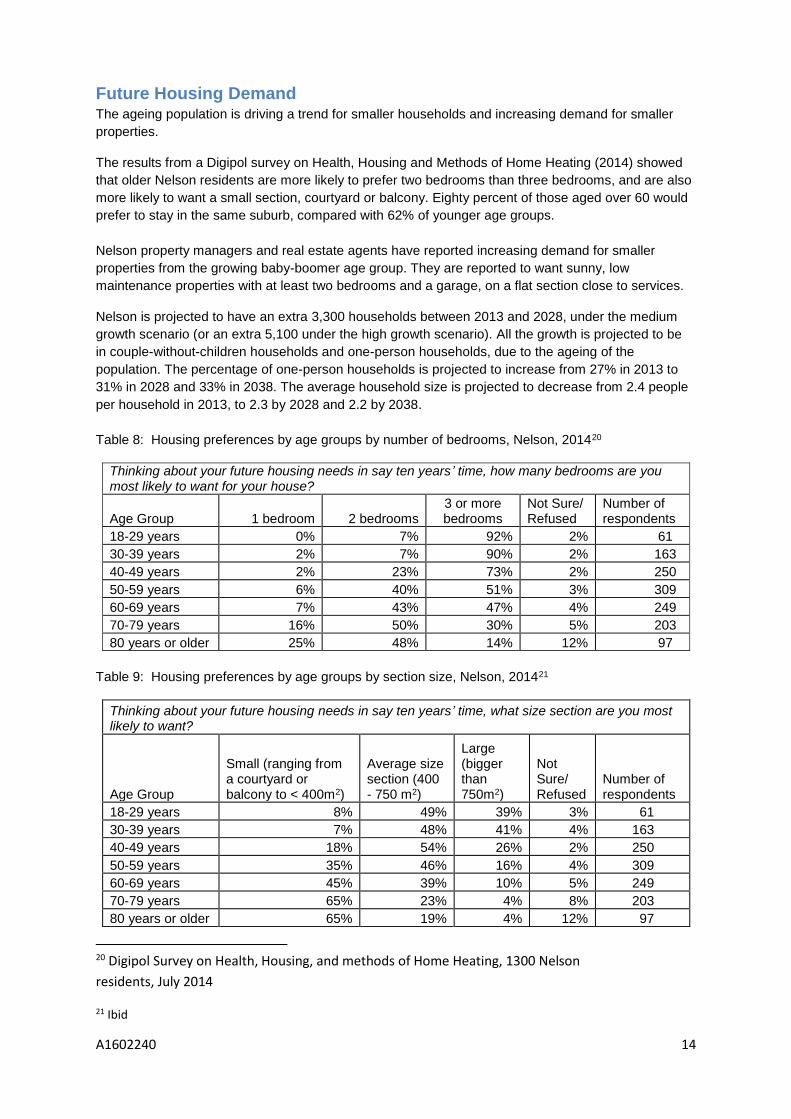
The results from a Digipol survey on Health, Housing and Methods of Home Heating (2014) showed
that older Nelson residents are more likely to prefer two bedrooms than three bedrooms, and are also
more likely to want a small section, courtyard or balcony. Eighty percent of those aged over 60 would
prefer to stay in the same suburb, compared with 62% of younger age groups.
Nelson property managers and real estate agents have reported increasing demand for smaller
properties from the growing baby-boomer age group. They are reported to want sunny, low
maintenance properties with at least two bedrooms and a garage, on a flat section close to services.
Nelson is projected to have an extra 3,300 households between 2013 and 2028, under the medium
growth scenario (or an extra 5,100 under the high growth scenario). All the growth is projected to be
in couple-without-children households and one-person households, due to the ageing of the
population. The percentage of one-person households is projected to increase from 27% in 2013 to
31% in 2028 and 33% in 2038. The average household size is projected to decrease from 2.4 people
per household in 2013, to 2.3 by 2028 and 2.2 by 2038.
Table 8: Housing preferences by age groups by number of bedrooms, Nelson, 201420
Thinking about your future housing needs in say ten years’ time, how many bedrooms are you most likely to want for your house?
Age Group 1 bedroom 2 bedrooms 3 or more bedrooms
Not Sure/ Refused
Number of respondents
18-29 years 0% 7% 92% 2% 61
30-39 years 2% 7% 90% 2% 163
40-49 years 2% 23% 73% 2% 250
50-59 years 6% 40% 51% 3% 309
60-69 years 7% 43% 47% 4% 249
70-79 years 16% 50% 30% 5% 203
80 years or older 25% 48% 14% 12% 97
Table 9: Housing preferences by age groups by section size, Nelson, 201421
Thinking about your future housing needs in say ten years’ time, what size section are you most likely to want?
Age Group
Small (ranging from a courtyard or balcony to < 400m2)
Average size section (400 - 750 m2)
Large (bigger than 750m2)
Not Sure/ Refused
Number of respondents
18-29 years 8% 49% 39% 3% 61
30-39 years 7% 48% 41% 4% 163
40-49 years 18% 54% 26% 2% 250
50-59 years 35% 46% 16% 4% 309
60-69 years 45% 39% 10% 5% 249
70-79 years 65% 23% 4% 8% 203
80 years or older 65% 19% 4% 12% 97
20 Digipol Survey on Health, Housing, and methods of Home Heating, 1300 Nelson
residents, July 2014
21 Ibid
A1602240 15
Financial wellbeing
Despite lower incomes than younger age groups, older people generally report
higher net worth and higher material and financial wellbeing.
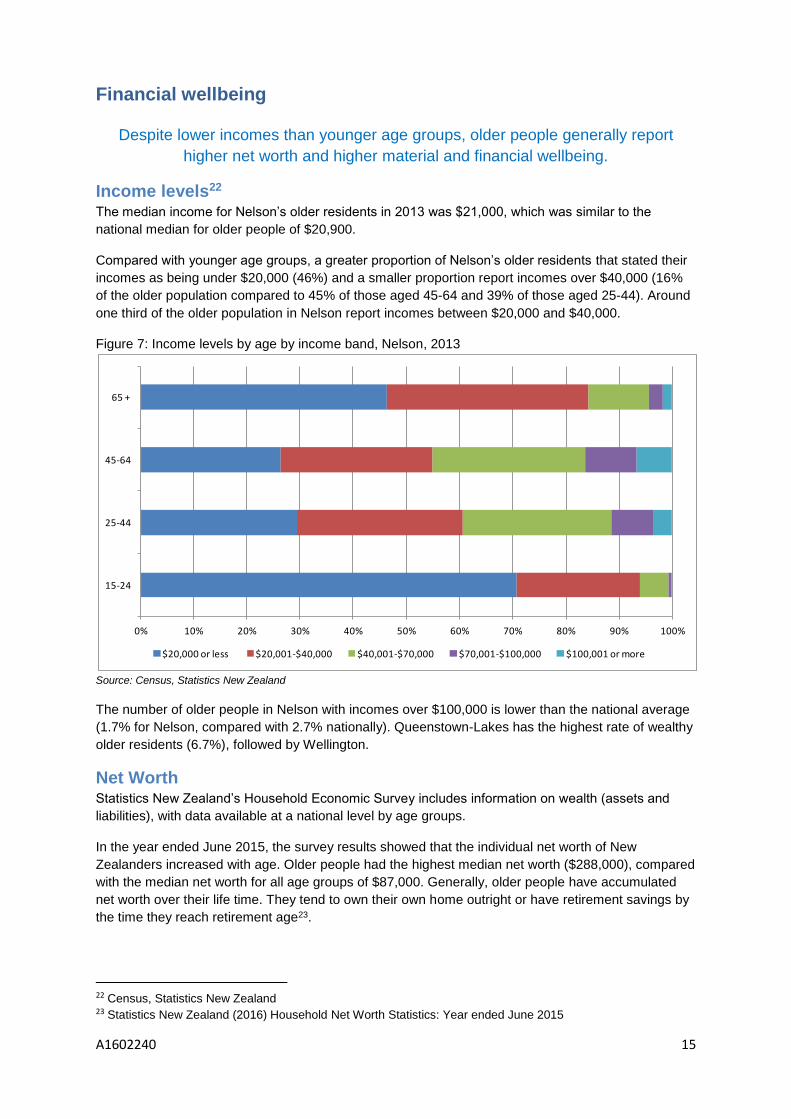
Income levels22 The median income for Nelson’s older residents in 2013 was $21,000, which was similar to the
national median for older people of $20,900.
Compared with younger age groups, a greater proportion of Nelson’s older residents that stated their
incomes as being under $20,000 (46%) and a smaller proportion report incomes over $40,000 (16%
of the older population compared to 45% of those aged 45-64 and 39% of those aged 25-44). Around
one third of the older population in Nelson report incomes between $20,000 and $40,000.
Figure 7: Income levels by age by income band, Nelson, 2013
Source: Census, Statistics New Zealand
The number of older people in Nelson with incomes over $100,000 is lower than the national average
(1.7% for Nelson, compared with 2.7% nationally). Queenstown-Lakes has the highest rate of wealthy
older residents (6.7%), followed by Wellington.
Net Worth Statistics New Zealand’s Household Economic Survey includes information on wealth (assets and
liabilities), with data available at a national level by age groups.
In the year ended June 2015, the survey results showed that the individual net worth of New
Zealanders increased with age. Older people had the highest median net worth ($288,000), compared
with the median net worth for all age groups of $87,000. Generally, older people have accumulated
net worth over their life time. They tend to own their own home outright or have retirement savings by
the time they reach retirement age23.
22 Census, Statistics New Zealand 23 Statistics New Zealand (2016) Household Net Worth Statistics: Year ended June 2015
0% 10% 20% 30% 40% 50% 60% 70% 80% 90% 100%
15-24
25-44
45-64
65 +
$20,000 or less $20,001-$40,000 $40,001-$70,000 $70,001-$100,000 $100,001 or more
A1602240 16
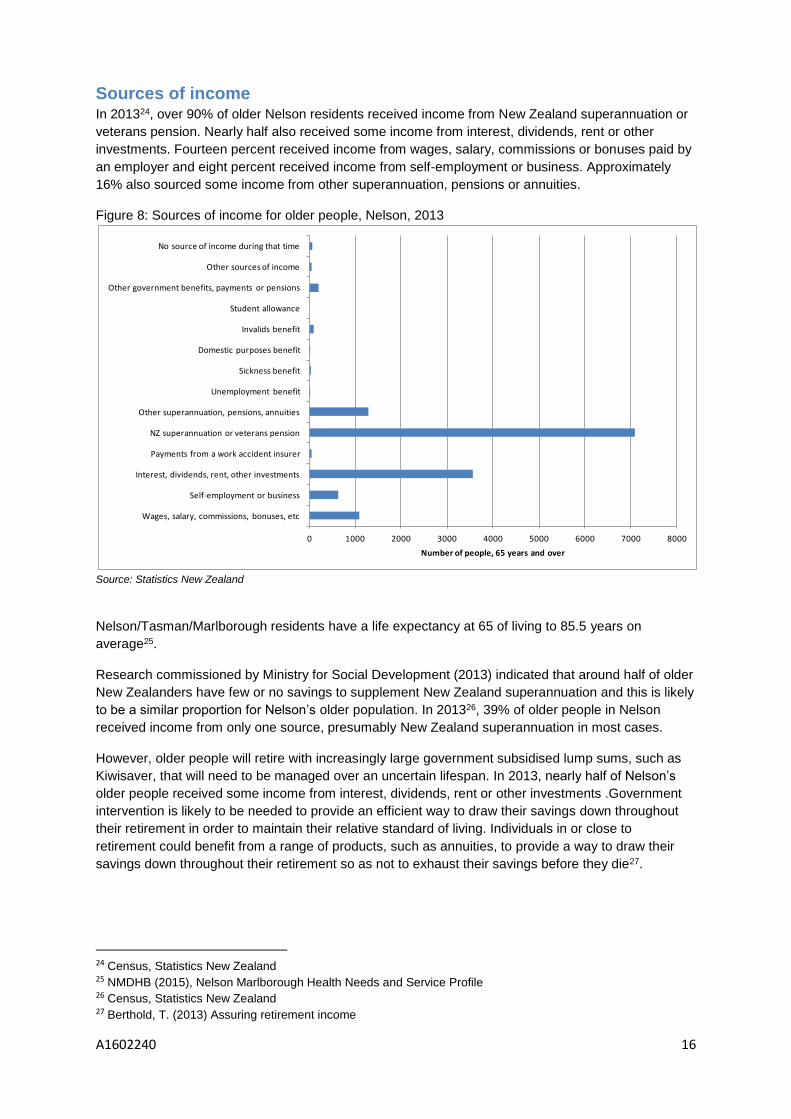
Sources of income In 201324, over 90% of older Nelson residents received income from New Zealand superannuation or
veterans pension. Nearly half also received some income from interest, dividends, rent or other
investments. Fourteen percent received income from wages, salary, commissions or bonuses paid by
an employer and eight percent received income from self-employment or business. Approximately
16% also sourced some income from other superannuation, pensions or annuities.
Figure 8: Sources of income for older people, Nelson, 2013
Source: Statistics New Zealand
Nelson/Tasman/Marlborough residents have a life expectancy at 65 of living to 85.5 years on
average25.
Research commissioned by Ministry for Social Development (2013) indicated that around half of older
New Zealanders have few or no savings to supplement New Zealand superannuation and this is likely
to be a similar proportion for Nelson’s older population. In 201326, 39% of older people in Nelson
received income from only one source, presumably New Zealand superannuation in most cases.
However, older people will retire with increasingly large government subsidised lump sums, such as
Kiwisaver, that will need to be managed over an uncertain lifespan. In 2013, nearly half of Nelson’s
older people received some income from interest, dividends, rent or other investments .Government
intervention is likely to be needed to provide an efficient way to draw their savings down throughout
their retirement in order to maintain their relative standard of living. Individuals in or close to
retirement could benefit from a range of products, such as annuities, to provide a way to draw their
savings down throughout their retirement so as not to exhaust their savings before they die27.
24 Census, Statistics New Zealand 25 NMDHB (2015), Nelson Marlborough Health Needs and Service Profile 26 Census, Statistics New Zealand 27 Berthold, T. (2013) Assuring retirement income
0 1000 2000 3000 4000 5000 6000 7000 8000
Wages, salary, commissions, bonuses, etc
Self-employment or business
Interest, dividends, rent, other investments
Payments from a work accident insurer
NZ superannuation or veterans pension
Other superannuation, pensions, annuities
Unemployment benefit
Sickness benefit
Domestic purposes benefit
Invalids benefit
Student allowance
Other government benefits, payments or pensions
Other sources of income
No source of income during that time
Number of people, 65 years and over
A1602240 17
Material and Financial Wellbeing Statistics New Zealand’s General Social Survey includes measures of material and financial
wellbeing.
The material wellbeing index is a measure of wealth in that it measures the ability to afford things,
ranging from essentials such as healthy food, doctor visits, paying bills and keeping warm, to the
degree of freedom a person has for purchasing desirable non-essentials. Due to sample sizes,
Nelson data is only available in combined totals for Nelson, Tasman and Marlborough.
Results of the 2014 survey show that 52% of older people in the three regions have material
wellbeing that is rated as ‘higher’ and 32% have material wellbeing in the ‘upper middle’ category. The
remaining 16% have ‘lower’ or ‘lower middle’ levels of material wellbeing. Older people in Nelson,
Tasman and Marlborough have higher material wellbeing than younger age groups. 65% of the total
population in Nelson, Tasman, and Marlborough have upper middle or higher material wellbeing,
compared with 84% of those aged 65 and over.
More than two-thirds (68%) of older people in Nelson, Tasman, and Marlborough report having
enough, or more than enough, income to meet everyday needs, while 22% have just enough and
10% report not having enough.
Living standards and financial wellbeing generally rise with age. Older New Zealanders have the most
favourable distribution of living standards of all age groups. According to a 2009 report by MSD28, “this
reflects the combined effect of public provision (mainly New Zealand Superannuation) and private
provision (including own home and other savings) for the current cohort”.
28 Ministry of Social Development (2009) Non-income measures of material wellbeing and hardship: first results
from the 2008 New Zealand Living Standards Survey, with international comparisons.
A1602240 18
Health
Despite trends for disability rates to increase with age and physical activity rates to
decline, older people in the upper South Island generally report good health and
good nutrition.
The majority of older people in Nelson/Tasman/Marlborough rate their general health as good, very
good, or excellent29. However, approximately 20% rate their health as fair or poor. The rate for these
three regions are similar to the national rate for older people. Nationally, self-reported good health of
people aged over 75 has steadily improved over the last decade.
The Nelson Marlborough District Health Board’s Health Needs and Services Profile (2015) states that
the Nelson, Tasman, Marlborough population has generally good health compared to others in New
Zealand. The population aged 75 and over appear to have good access to hospital and community-
based services, with good ageing in place support.
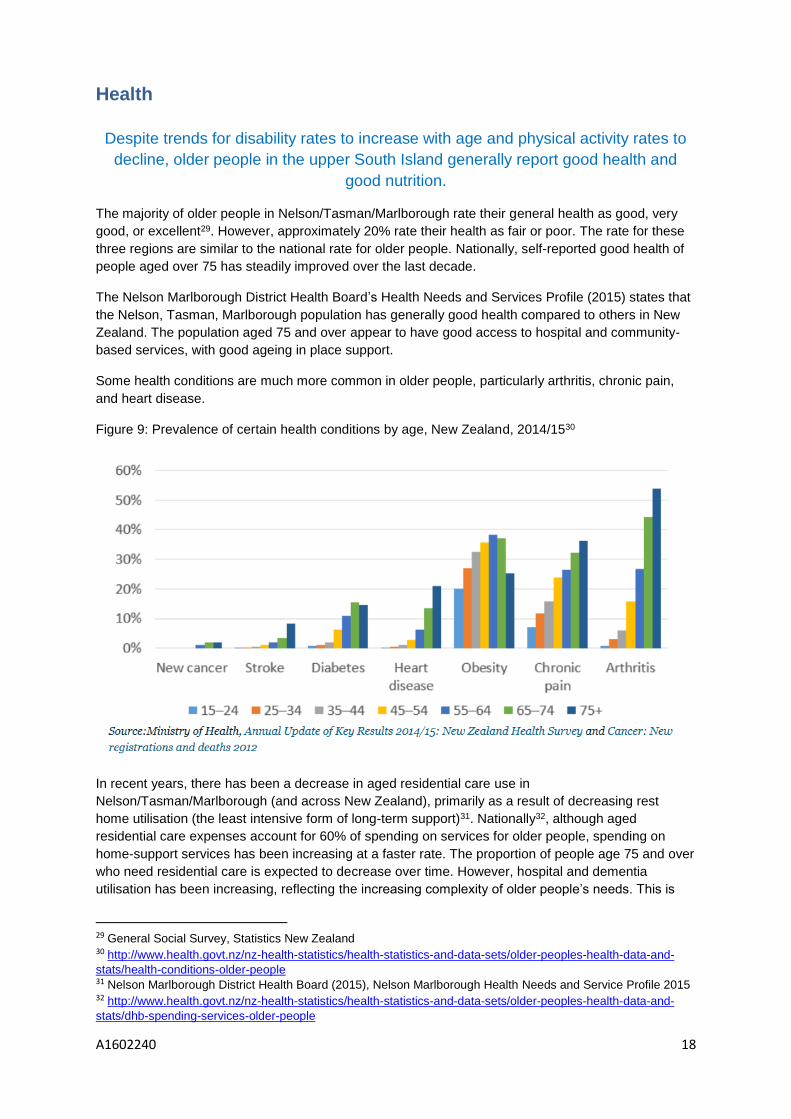
Some health conditions are much more common in older people, particularly arthritis, chronic pain,
and heart disease.
Figure 9: Prevalence of certain health conditions by age, New Zealand, 2014/1530
In recent years, there has been a decrease in aged residential care use in
Nelson/Tasman/Marlborough (and across New Zealand), primarily as a result of decreasing rest
home utilisation (the least intensive form of long-term support)31. Nationally32, although aged
residential care expenses account for 60% of spending on services for older people, spending on
home-support services has been increasing at a faster rate. The proportion of people age 75 and over
who need residential care is expected to decrease over time. However, hospital and dementia
utilisation has been increasing, reflecting the increasing complexity of older people’s needs. This is
29 General Social Survey, Statistics New Zealand 30 http://www.health.govt.nz/nz-health-statistics/health-statistics-and-data-sets/older-peoples-health-data-and-
stats/health-conditions-older-people 31 Nelson Marlborough District Health Board (2015), Nelson Marlborough Health Needs and Service Profile 2015 32 http://www.health.govt.nz/nz-health-statistics/health-statistics-and-data-sets/older-peoples-health-data-and-
stats/dhb-spending-services-older-people
A1602240 19
expected to continue. At the same time it is expected that people will spend a greater proportion of
their older years in reasonable health, with severe ill-health delayed to the last few years. However
the absolute number needing assistance and all forms of health care will increase, due to the increase
in the number of older people.
If current health and disability rates for older age groups continue to prevail for the next generation,
we can expect the prevalence of disabilities and health issues to increase in society as the population
ages.
Disability Levels A disability is defined as any limitation in activity resulting from a long-term condition or health
problem. Long term is defined as six months or longer33. As life expectancy has increased, disability
rates of those aged between 60 and 80 have declined. However, as noted above, it is important to
acknowledge the absolute increase in numbers that will be needing assistance as the result of
numerical increase in the number of older people.
The 2013 Disability Survey found that 60% of older people in Nelson/Tasman/Marlborough/ West
Coast34 households had a disability. This data is for older people in private dwellings and does not
include older people in residential care. The impairment rates for older people are significantly higher
than for younger age groups, for example, 29% of the 45-64 year age group have a disability.
The most common disability was ‘physical’ with 47% of older people reporting mobility and/or agility
impairments. Mobility impairments includes having difficulty with or being unable to walk about 350
metres without resting, walk up or down a flight of stairs, carry an object as heavy as five kilograms
for a 10 metre distance, move from room to room, or stand for periods longer than 20 minutes. Agility
impairments includes having difficulty with or being unable to bend over to pick something up off the
floor, dress or undress themselves, cut their own food, or get themselves in or out of bed.
Thirty-one percent reported a sensory impairment, which includes hearing and vision impairments.
Hearing impairments includes having difficulty hearing or being unable to hear what is said in a
conversation with one other person and/or a conversation with at least three other people. Vision
impairments includes having difficulty seeing or being unable to see ordinary newsprint and/or the
face of someone from across a room, even when wearing corrective lenses.
33 Disability Survey, Statistics New Zealand 34 At time of writing, data was provisional and the sample size for Disability Survey data required Nelson to be
combined with three other regions. Statistics New Zealand will be releasing disability data by territorial authority in early 2017.
A1602240 20
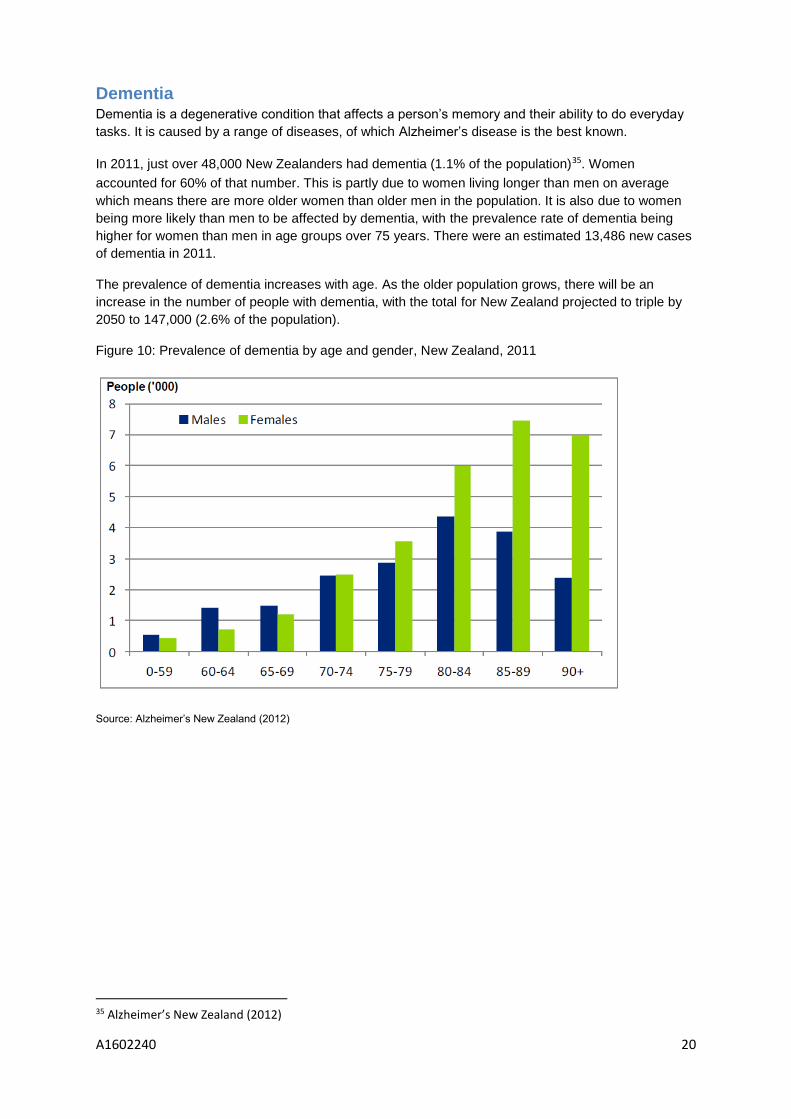
Dementia Dementia is a degenerative condition that affects a person’s memory and their ability to do everyday
tasks. It is caused by a range of diseases, of which Alzheimer’s disease is the best known.
In 2011, just over 48,000 New Zealanders had dementia (1.1% of the population)35. Women
accounted for 60% of that number. This is partly due to women living longer than men on average
which means there are more older women than older men in the population. It is also due to women
being more likely than men to be affected by dementia, with the prevalence rate of dementia being
higher for women than men in age groups over 75 years. There were an estimated 13,486 new cases
of dementia in 2011.
The prevalence of dementia increases with age. As the older population grows, there will be an
increase in the number of people with dementia, with the total for New Zealand projected to triple by
2050 to 147,000 (2.6% of the population).
Figure 10: Prevalence of dementia by age and gender, New Zealand, 2011
Source: Alzheimer’s New Zealand (2012)
35 Alzheimer’s New Zealand (2012)
A1602240 21
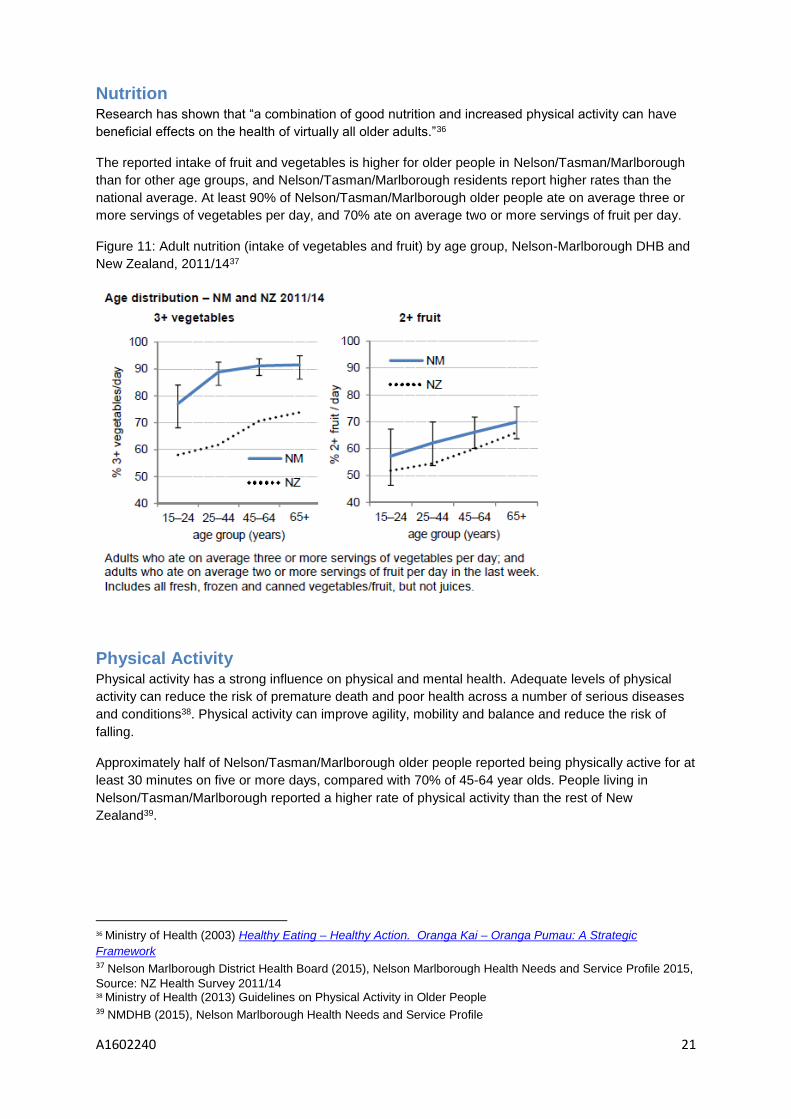
Nutrition Research has shown that “a combination of good nutrition and increased physical activity can have
beneficial effects on the health of virtually all older adults.”36
The reported intake of fruit and vegetables is higher for older people in Nelson/Tasman/Marlborough
than for other age groups, and Nelson/Tasman/Marlborough residents report higher rates than the
national average. At least 90% of Nelson/Tasman/Marlborough older people ate on average three or
more servings of vegetables per day, and 70% ate on average two or more servings of fruit per day.
Figure 11: Adult nutrition (intake of vegetables and fruit) by age group, Nelson-Marlborough DHB and
New Zealand, 2011/1437
Physical Activity Physical activity has a strong influence on physical and mental health. Adequate levels of physical
activity can reduce the risk of premature death and poor health across a number of serious diseases
and conditions38. Physical activity can improve agility, mobility and balance and reduce the risk of
falling.
Approximately half of Nelson/Tasman/Marlborough older people reported being physically active for at
least 30 minutes on five or more days, compared with 70% of 45-64 year olds. People living in
Nelson/Tasman/Marlborough reported a higher rate of physical activity than the rest of New
Zealand39.
36 Ministry of Health (2003) Healthy Eating – Healthy Action. Oranga Kai – Oranga Pumau: A Strategic
Framework 37 Nelson Marlborough District Health Board (2015), Nelson Marlborough Health Needs and Service Profile 2015,
Source: NZ Health Survey 2011/14 38 Ministry of Health (2013) Guidelines on Physical Activity in Older People 39 NMDHB (2015), Nelson Marlborough Health Needs and Service Profile
A1602240 22
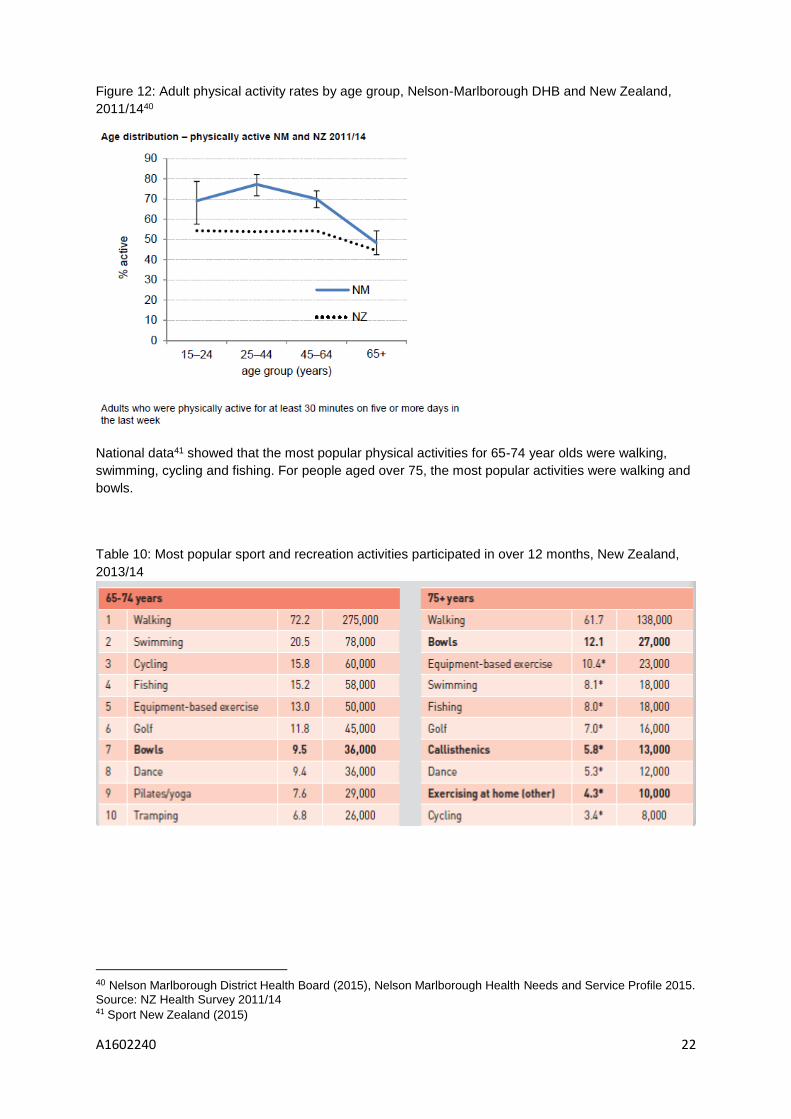
Figure 12: Adult physical activity rates by age group, Nelson-Marlborough DHB and New Zealand,
2011/1440
National data41 showed that the most popular physical activities for 65-74 year olds were walking,
swimming, cycling and fishing. For people aged over 75, the most popular activities were walking and
bowls.
Table 10: Most popular sport and recreation activities participated in over 12 months, New Zealand,
2013/14
40 Nelson Marlborough District Health Board (2015), Nelson Marlborough Health Needs and Service Profile 2015.
Source: NZ Health Survey 2011/14 41 Sport New Zealand (2015)
A1602240 23
Research by Nelson Nursing Services in 200742 found that older people who are isolated and less
socially involved experience a greater number of barriers to participation. Barriers included:
lack of a suitable place to exercise
pain from medical condition e.g. arthritis
scared of hurting themselves or falling
not used to exercising for the sake of it.
Consultation with stakeholders also highlighted a number of considerations:
sport and organised activities are often seen by older people as something for the young
many activity based programmes are aimed at younger people
motivating older people is particularly difficult
intervention aimed at older people must be specific to their needs
falls, or being at risk of falls, is a major cause of disability and declining health.
The research suggested that increasing incidental activity is more likely to work than promoting
‘exercise’. Research in the UK among newly retired people indicated “that the word ‘sport’ is not
received well, that both men and women place more value on ‘active chores’ than on ‘exercise’, and
that gentler activities such as walking are more acceptable.” 43
Social Connection
The majority of older people report rarely feeling lonely and are satisfied with the
amount of contact with family and friends.
Research by the Health Action trust (2014) asked respondents about the issues that affect older
people’s mental health and wellbeing. The issues that were most commonly identified were ‘mental
health and illness’, followed by ‘loneliness and isolation’ and ‘transport’.
However, the 2014 General Social Survey44 showed that in Nelson/Tasman/Marlborough, as well as
generally for New Zealand, older people were less likely to feel lonely than younger age groups.
Three quarters (75%) of those aged 65+ in Nelson/Tasman/Marlborough had felt lonely “none of the
time” in the previous four weeks, compared with two-thirds (66%) for all age groups. Twenty percent
of those aged 65 and over had felt lonely “a little of the time” in the previous four weeks. A small
number reported having felt lonely some, most, or all of the time in the previous four weeks (the small
number meant the sampling error was too high for specific results to be reported).
The majority (96%) of older people in Nelson/Tasman/Marlborough and across New Zealand reported
that the amount of contact with family and friends was “about right”45.
42 Nelson Nursing Services (2007) 43 Sport England (2006) Understanding participation in sport: What determines sports participation among recently retired people? 44 Statistics New Zealand 45 General Social Survey, Statistics New Zealand
A1602240 24
Volunteering
One in five older residents provide help or voluntary work for an organisation, group
or marae.
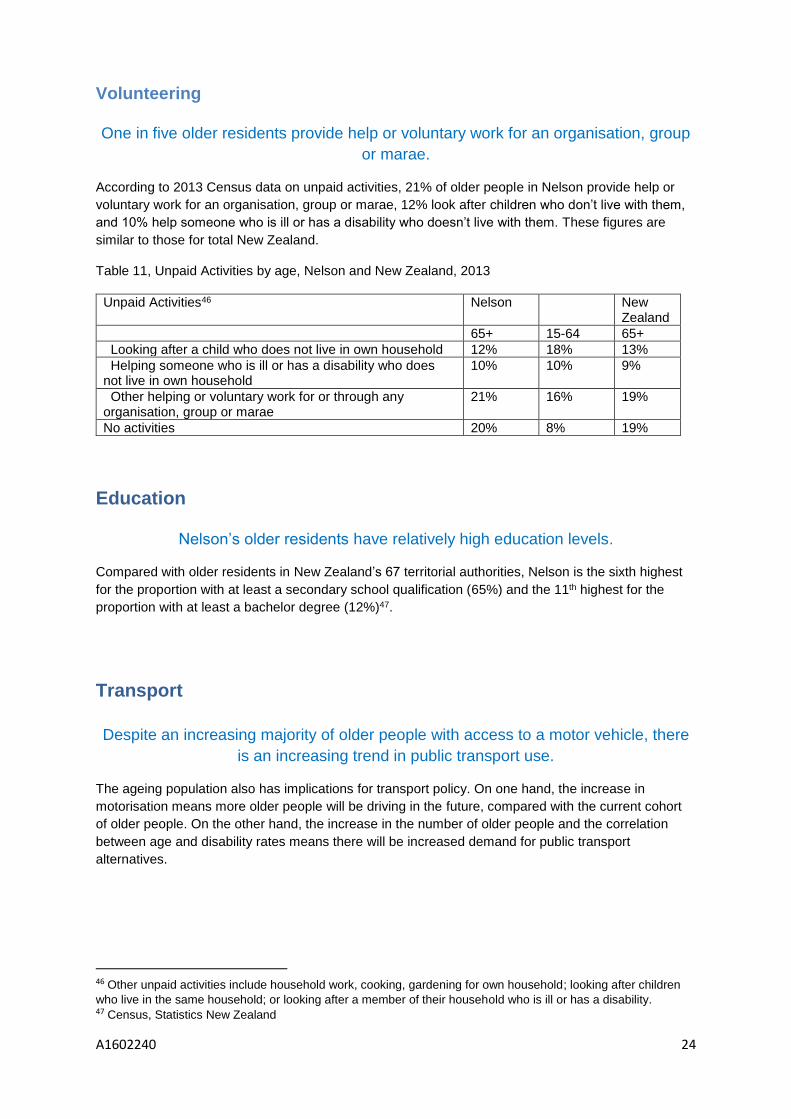
According to 2013 Census data on unpaid activities, 21% of older people in Nelson provide help or
voluntary work for an organisation, group or marae, 12% look after children who don’t live with them,
and 10% help someone who is ill or has a disability who doesn’t live with them. These figures are
similar to those for total New Zealand.
Table 11, Unpaid Activities by age, Nelson and New Zealand, 2013
Unpaid Activities46 Nelson New Zealand
65+ 15-64 65+
Looking after a child who does not live in own household 12% 18% 13%
Helping someone who is ill or has a disability who does not live in own household
10% 10% 9%
Other helping or voluntary work for or through any organisation, group or marae
21% 16% 19%
No activities 20% 8% 19%
Education
Nelson’s older residents have relatively high education levels.
Compared with older residents in New Zealand’s 67 territorial authorities, Nelson is the sixth highest
for the proportion with at least a secondary school qualification (65%) and the 11th highest for the
proportion with at least a bachelor degree (12%)47.
Transport
Despite an increasing majority of older people with access to a motor vehicle, there
is an increasing trend in public transport use.
The ageing population also has implications for transport policy. On one hand, the increase in
motorisation means more older people will be driving in the future, compared with the current cohort
of older people. On the other hand, the increase in the number of older people and the correlation
between age and disability rates means there will be increased demand for public transport
alternatives.
46 Other unpaid activities include household work, cooking, gardening for own household; looking after children
who live in the same household; or looking after a member of their household who is ill or has a disability. 47 Census, Statistics New Zealand
A1602240 25
Private Transport
In 201348, 95% of those aged 65-74 had access to at least one motor vehicle and 85% of those aged
over 75. Since 2001, access to a vehicle has increased for older people in Nelson and across New
Zealand. In 2001, 84% of 65-74 year olds and 74% of 75+ had access to a vehicle.
Vehicle accessibility rates for older people vary throughout the city. Of the 624 older people without
access to a vehicle, 99 live in The Wood area unit49 and 93 live in the Isel Park area unit.
A Ministry of Transport report in 200950 recognised that road safety for people over the age of 75 is an
emerging issue. “The road safety risk is to older New Zealanders rather than from them”. They have
a lower risk of being in a crash than other road users, but a higher risk of being seriously injured.
National research51 has shown that as people grow older, they tend to travel less than those in
younger age groups, and to travel for different purposes. Older people also tend to make most of their
trips off peak and travel more in urban areas than on the open road. These findings have also
highlighted the importance of accounting for an ageing population in transport modelling of future
travel demand.
Public Transport
Under the Supergold scheme, older people are able to travel for free on urban public transport at off
peak times. At present, the Government reimburses Nelson City Council and other regional councils
for SuperGold trips on a per-trip basis. The Government has decided to shift to a bulk funding
approach from 2016/17, where the level of funding will be agreed between regional councils and the
New Zealand Transport Agency. This change will bring SuperGold Card funding into line with the way
other public transport funding is allocated, and provide a ceiling on the cost of the scheme to
Government. Any cost overruns will need to be funded by councils.
Supergold fares contribute 14% of NBus total fare revenue. Supergold fares have increased annually
since NBus was introduced in 2012, although the rate of growth has slowed over time. The annual
number of Supergold trips increased from 53,724 in 2012/13 to 70,536 in 2015/16.
The Total Mobility Scheme provides subsidised taxi services to people who have an impairment that
prevents them from safely getting to or using public transport. The scheme is jointly funded by local
and central government. Since 2005, the number of people registered for the Total Mobility Scheme in
Nelson/ Tasman/Marlborough has doubled, although the number of boardings increased 11%.
48 Census, Statistics New Zealand, for population living in private households, excludes population in residential
care 49 Area units are non-administrative, geographic areas defined by Statistics New Zealand, containing one or more
census meshblocks, the basis geographic unit used for collecting and reporting population data each Census. 50 Ministry of Transport (2009) Safer Journeys Discussion Document. Ministry of Transport, Wellington: New
Zealand 51 Frith, Mara, and Langford (2012).
A1602240 26
Appendix 1: Demographic indicators, territorial authority ranking Rank Percentage of
population aged 65 and over, 2015
Percentage of population aged 65
and over, 2028
Labour force participation rates
for residents aged 65 and over, 2013
Median income for residents aged 65
and over, 2013
1 Thames-Coromandel
29% Thames-Coromandel
38% Chatham Islands
38% Queenstown-Lakes
$28,100
2 Kapiti Coast 26% Central Otago 31% Southland 34% Wellington $25,600
3 Horowhenua 25% Horowhenua 31% Otorohanga 33% Chatham Islands
$22,500
4 Hauraki 23% Hauraki 31% Waitomo 32% Southland $22,500
5 Marlborough 22% Kapiti Coast 30% Hurunui 32% Waipa $22,300
6 Waimate 22% Marlborough 30% Selwyn 31% Porirua $22,200
7 Waitaki 22% Tasman 30% Waikato 31% South Wairarapa
$22,100
8 Central Otago 22% Kaipara 30% Central Hawke's Bay
31% Selwyn $22,100
9 Kaipara 21% Kaikoura 29% Ruapehu 30% Hurunui $22,000
10 South Wairarapa
21% Central Hawke's Bay
28% Queenstown-Lakes
29% Kapiti Coast $21,900
11 Kaikoura 21% Timaru 28% Kaikoura 29% Taupo $21,800
12 Timaru 21% Carterton 28% South Wairarapa
28% Western Bay of Plenty $21,700
13 Western Bay of
Plenty 20% Gore 28% Rangitikei 28% Otorohanga $21,500
14 Tauranga 20% Waimate 28% Manawatu 27% Palmerston North
$21,500
15 Whanganui 20% South Wairarapa
27% Westland 27% Lower Hutt $21,400
16 Masterton 20% Masterton 27% Mackenzie 27% Matamata-Piako
$21,200
17 Carterton 20% Waitaki 27% Central Otago 27% Tauranga $21,200
18 Tasman 20% Whanganui 27% Clutha 27% Waikato $21,100
19 Far North 19% Western Bay of Plenty
27% Western Bay of
Plenty 26% Hamilton $21,100
20 Kawerau 19% Nelson 27% Wairoa 26% Hastings $21,100
21 Napier 19% Tararua 26% Carterton 26% Marlborough
$21,100
22 Central Hawke's Bay
19% Far North 26% Tararua 26% Rotorua $21,000
23 Gore 19%
Grey 26% Waipa 25% Gisborne $21,000
24 Whangarei 18% Napier 26% Wellington 25% Nelson $21,000
25 Matamata-Piako
18% Buller 26% Kaipara 24% Christchurch
$21,000
26 Taupo 18% Hurunui 25% Porirua 24% Ashburton $21,000
27 Opotiki 18% Opotiki 25% Taupo 24% Auckland $20,900
28 Rangitikei 18% Westland 25% Ashburton 24% Whakatane $20,900
29 Tararua 18% Matamata-Piako
25% Rotorua 24% Manawatu $20,900
30 Nelson 18% Rangitikei 24% Stratford 24% Mackenzie $20,900
31 Buller 18% Waimakariri 24% Gisborne 24% Gore $20,900
32 Hurunui 18% Whangarei 24% Far North 23% Central Hawke's Bay
$20,800
33 Waipa 17% Whakatane 24% South Taranaki 23% New Plymouth
$20,700
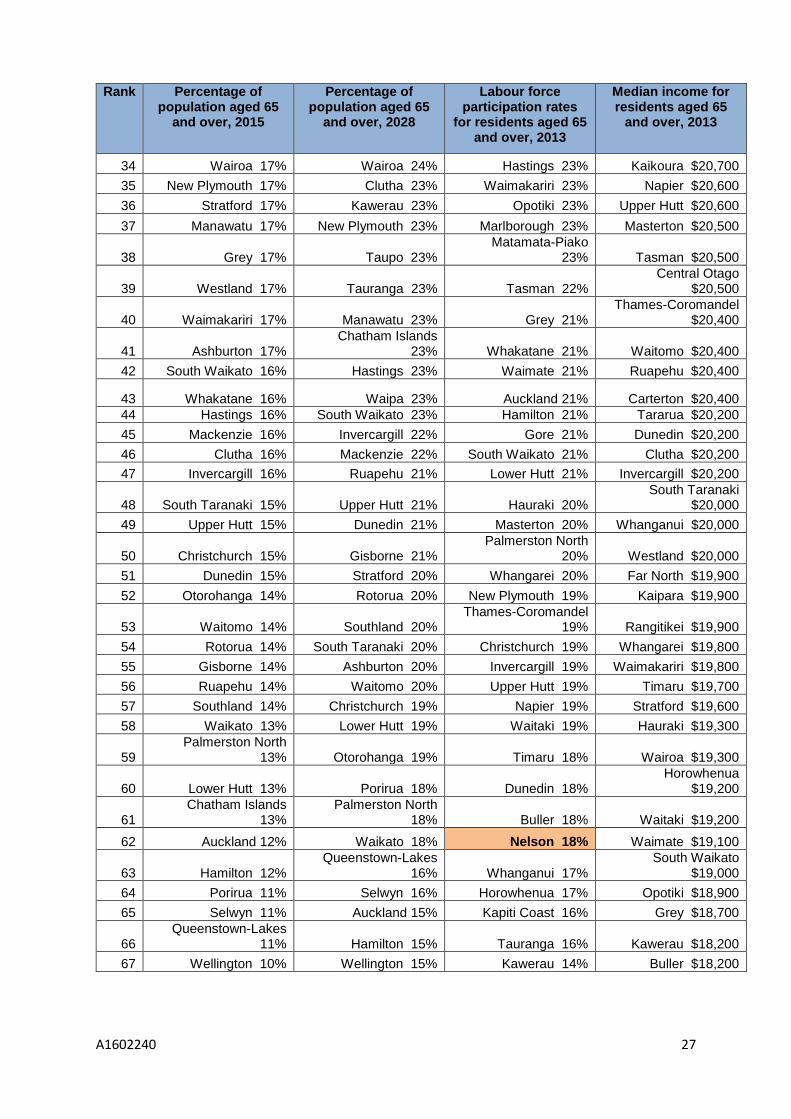
A1602240 27
Rank Percentage of population aged 65
and over, 2015
Percentage of population aged 65
and over, 2028
Labour force participation rates
for residents aged 65 and over, 2013
Median income for residents aged 65
and over, 2013
34 Wairoa 17% Wairoa 24% Hastings 23% Kaikoura $20,700
35 New Plymouth 17% Clutha 23% Waimakariri 23% Napier $20,600
36 Stratford 17% Kawerau 23% Opotiki 23% Upper Hutt $20,600
37 Manawatu 17% New Plymouth 23% Marlborough 23% Masterton $20,500
38 Grey 17% Taupo 23% Matamata-Piako
23% Tasman $20,500
39 Westland 17% Tauranga 23% Tasman 22% Central Otago
$20,500
40 Waimakariri 17% Manawatu 23% Grey 21% Thames-Coromandel
$20,400
41 Ashburton 17% Chatham Islands
23% Whakatane 21% Waitomo $20,400
42 South Waikato 16% Hastings 23% Waimate 21% Ruapehu $20,400
43 Whakatane 16% Waipa 23% Auckland 21% Carterton $20,400
44 Hastings 16% South Waikato 23% Hamilton 21% Tararua $20,200
45 Mackenzie 16% Invercargill 22% Gore 21% Dunedin $20,200
46 Clutha 16% Mackenzie 22% South Waikato 21% Clutha $20,200
47 Invercargill 16% Ruapehu 21% Lower Hutt 21% Invercargill $20,200
48 South Taranaki 15% Upper Hutt 21% Hauraki 20% South Taranaki
$20,000
49 Upper Hutt 15% Dunedin 21% Masterton 20% Whanganui $20,000
50 Christchurch 15% Gisborne 21% Palmerston North
20% Westland $20,000
51 Dunedin 15% Stratford 20% Whangarei 20% Far North $19,900
52 Otorohanga 14% Rotorua 20% New Plymouth 19% Kaipara $19,900
53 Waitomo 14% Southland 20% Thames-Coromandel
19% Rangitikei $19,900
54 Rotorua 14% South Taranaki 20% Christchurch 19% Whangarei $19,800
55 Gisborne 14% Ashburton 20% Invercargill 19% Waimakariri $19,800
56 Ruapehu 14% Waitomo 20% Upper Hutt 19% Timaru $19,700
57 Southland 14% Christchurch 19% Napier 19% Stratford $19,600
58 Waikato 13% Lower Hutt 19% Waitaki 19% Hauraki $19,300
59 Palmerston North
13% Otorohanga 19% Timaru 18% Wairoa $19,300
60 Lower Hutt 13% Porirua 18% Dunedin 18% Horowhenua
$19,200
61 Chatham Islands
13% Palmerston North
18% Buller 18% Waitaki $19,200
62 Auckland 12% Waikato 18% Nelson 18% Waimate $19,100
63 Hamilton 12% Queenstown-Lakes
16% Whanganui 17% South Waikato
$19,000
64 Porirua 11% Selwyn 16% Horowhenua 17% Opotiki $18,900
65 Selwyn 11% Auckland 15% Kapiti Coast 16% Grey $18,700
66 Queenstown-Lakes
11% Hamilton 15% Tauranga 16% Kawerau $18,200
67 Wellington 10% Wellington 15% Kawerau 14% Buller $18,200
A1602240 28
References
Alzheimers Alzheimers New Zealand. (2012). Updated Dementia Economic Impact Report, 2011, New Zealand. Wellington: Deloitte Access Economics. Berthold, T. (2013). Assuring retirement income. Working paper 01/13.
Wellington, New Zealand: Ministry of Social Development.
Davey, J A (2007). Health, Work and Retirement Survey – Summary Report for the 2006 Data Wave:
Qualitative Interviews. Massey University, Palmerston North.
Digipol (2014), Survey on Health Housing and Methods of home heating, 2014 (A1352116)
Frith, W, MK Mara and J Langford (2012). Demand for transport services: impact on networks of older
persons’ travel as the population of New Zealand ages. NZ Transport Agency research report 481.
Health Action Trust (Nelson) Mental Health Promotion (2014), Health of Older People in Nelson Tasman 2013-14, Survey Report, Nelson: New Zealand
Jackson, N.O. and Pawar, S. (2014) NTOM Subnational Demographic Accounting Model for New Zealand, Nga Tangata Oho Mairangi
Ministry of Business, Innovation and Employment (2015) and (2014), Regional Economic Activity
Reports, Wellington
Ministry of Health (2015) Annual Update of Key Results 2014/15, New Zealand Health Survey, Wellington: New Zealand
Ministry of Health (2013) Guidelines on Physical Activity in Older People, Ministry of Health, Wellington: New Zealand
Ministry of Health (2013) Food and Nutrition Guidelines for Healthy Older People: A background paper. Wellington: Ministry of Health.
Ministry of Health (2003) Healthy Eating – Healthy Action. Oranga Kai – Oranga Pumau: A Strategic
Framework. Ministry of Health Manatū Hauora, Wellington: New Zealand
Ministry of Social Development (2015) Realising the economic potential of older people in New Zealand: 2011-2051., An update to the 2011 report, Ministry of Social Development, Wellington: New Zealand
Ministry of Social Development (2011) Realising the economic potential of older people in New Zealand: 2011-2051., Ministry of Social Development, Wellington: New Zealand
Ministry of Social Development (2009) Non-income measures of material wellbeing and hardship: first results from the 2008 New Zealand Living Standards Survey, with international comparisons. Ministry of Social Development, Working Paper 01/09, Wellington: New Zealand
Ministry of Transport (2009) Safer Journeys Discussion Document. Ministry of Transport, Wellington: New Zealand
Nelson City Council, SuperGold Card data, provided August 2016
Nelson City Council (2009) Older Workers in Nelson: Results from a survey of the attitudes of the over 50s towards work. Nelson City Council, Nelson: New Zealand (A597803)
A1602240 29
Nelson Marlborough District Health Board (), Nelson Marlborough Health Needs and Service Profile
2015, Nelson
Nelson Nursing Services (2007) Needs Assessment and Project Development: Nutrition and Physical
Activity for Older People in Nelson Marlborough. Nelson Nursing Services, Nelson: New Zealand
(A96853)
NZTA, Total Mobility data, accessed August 2016
Office for Senior Citizens (2015). The Business of Ageing. Wellington
Organisation for Economic Co-operation and Development (2002) Ageing, Housing and Urban
Development. OECD, Paris: France
Parliamentary Library Research Paper (2011), New Zealand’s ageing population, Wellington: New
Zealand.
Scobie, Grant M and Enright, Jamas (2010) Healthy, Wealthy and Working: Retirement Decisions of Older New Zealanders. New Zealand Treasury, Working Paper 10/02, Wellington: New Zealand
Sport New Zealand (2015). Sport and Active Recreation in the Lives of New Zealand Adults. 2013/14
Active New Zealand Survey Results. Wellington
Sport England (2006) Understanding participation in sport: What determines sports participation among recently retired people? Sport England: England
Statistics New Zealand (2016), Household Net Worth Statistics: Year ended June 2015, Wellington: New Zealand
Statistics New Zealand (2015), General Social Surveys 2008-2014, Wellington: New Zealand (customised request A1601627)
Statistics New Zealand (2015), 2013 Disability Survey, Statistics New Zealand, Wellington: New
Zealand (customised request)
Statistics New Zealand (2013), 2013 Census of population and dwellings, Wellington: New Zealand (NZ.stat and customised request A1601628)