Embed Size (px)
Citation preview
NEESR-SG Final Report
Prepared by Cornell University,
Rensselaer Polytechnic Institute and Sciencenter Discovery Center
February 2, 2009

1
NEESR-SG Final Report Prepared by Cornell University, Rensselaer Polytechnic Institute and
The Sciencenter Discovery Center February 2, 2009
ACTIVITIES AND FINDINGS
1. Describe the Major Research and Education Activities of the Project
1. INTRODUCTION
The overall goal of the research is to provide a systematic and comprehensive assessment of ground rupture effects on critical underground lifelines, including water, liquid and gas fuel, electric, and telecommunication conduits. The research deliverables include, as a minimum: 1) systematic assessment of lifeline performance under permanent ground deformation, 2) quantification of serviceability and ultimate limit states for critical lifelines, 3) design guidelines and improved codes, 4) experimental databases for benchmarking future numerical models and guiding the evolution of numerical simulations for soil-structure interaction, and 5) validation and guidance for advanced sensor and robotics deployment in underground conduits.
The research addresses a fundamental problem affecting all underground lifelines, namely the effects of large differential ground deformation on buried pipeline and conduit performance. The research is producing a seminal outcome through state-of-the-art modeling and quantification of earthquake-induced ground movement effects on lifelines. It also improves the design and construction of lifelines affected by landslides, mining, extraction of subsurface fluids, and underground construction. These research objectives are consistent with the recommendations for geotechnical engineering and lifelines in a recent National Research Council (NRC) report about NEES research opportunities (NRC, 2003) and the EERI Research and Outreach Plan (EERI, 2003).
The research conducted at the Cornell (CU) and Rensselaer (RPI) NEES equipment site utilizes the equipment for large-scale soil-structure interaction and centrifuge-scale split box testing. The equipment at Cornell consists of large-displacement servo-hydraulic actuators and ancillary hydraulic systems, soil-storage facilities and frame support system for large-scale lifeline soil-structure interaction, a variety of instrumentation, and data acquisition systems, including computer support. The RPI facilities use advanced split-box-centrifuge containers for simulation of lifeline systems. These containers are used in the upgraded RPI 150 g-ton centrifuge. Both sites use telepresence (teleobservation, teleoperation, and teleparticipation) consistent with NEESgrid specifications.
The proposed project addresses safety and reliability of critical infrastructure while also creating an innovative outreach program with the Sciencenter of Ithaca, NY. The project team is developing a museum exhibition on earthquake engineering that explains how engineers at NEES sites study earthquake effects using networked experimental facilities. The project team is also developing an interactive website linked to the Sciencenter so that users across the country can experiment with earthquake effects on lifelines, viewing their actual tests via a videocamera.
The project involves substantial collaboration with industry. Hence, the research results are guided by industry for maximum impact in practice, continuing education of the U.S. work force, and nationwide dissemination in infrastructure projects.
2
2. EXPERIMENTAL DESIGN
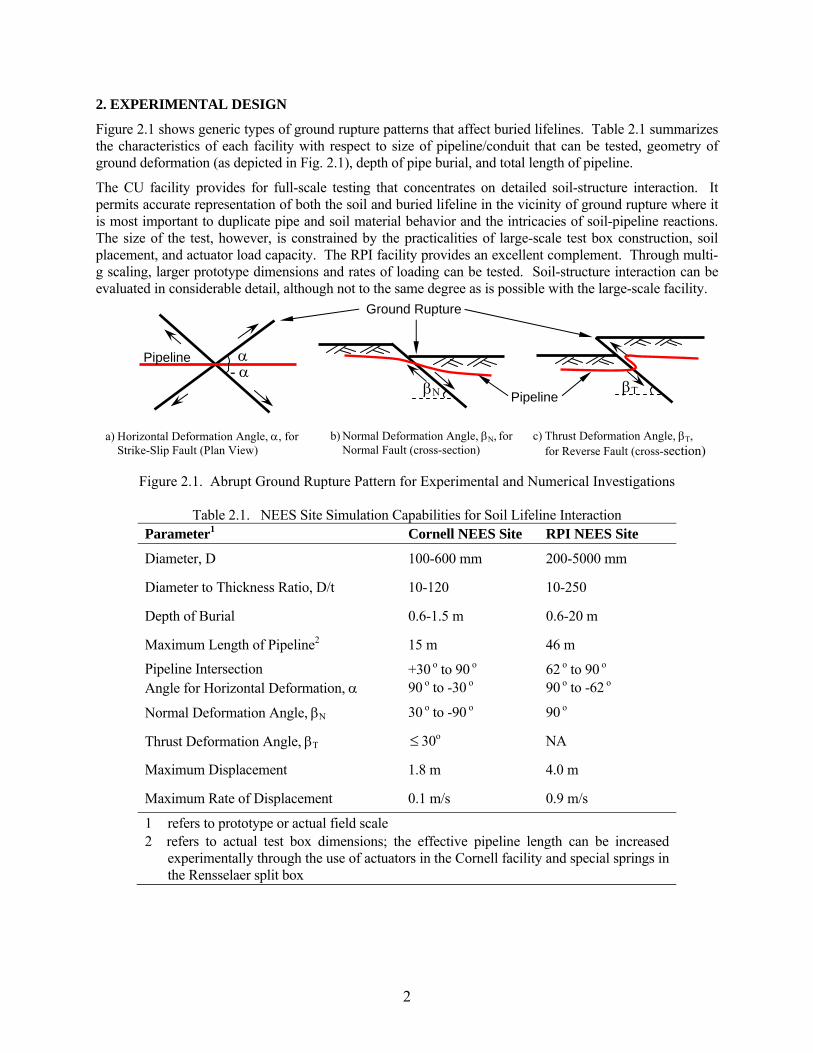
Figure 2.1 shows generic types of ground rupture patterns that affect buried lifelines. Table 2.1 summarizes the characteristics of each facility with respect to size of pipeline/conduit that can be tested, geometry of ground deformation (as depicted in Fig. 2.1), depth of pipe burial, and total length of pipeline.
The CU facility provides for full-scale testing that concentrates on detailed soil-structure interaction. It permits accurate representation of both the soil and buried lifeline in the vicinity of ground rupture where it is most important to duplicate pipe and soil material behavior and the intricacies of soil-pipeline reactions. The size of the test, however, is constrained by the practicalities of large-scale test box construction, soil placement, and actuator load capacity. The RPI facility provides an excellent complement. Through multi-g scaling, larger prototype dimensions and rates of loading can be tested. Soil-structure interaction can be evaluated in considerable detail, although not to the same degree as is possible with the large-scale facility.
Figure 2.1. Abrupt Ground Rupture Pattern for Experimental and Numerical Investigations
Table 2.1. NEES Site Simulation Capabilities for Soil Lifeline Interaction
Parameter1 Cornell NEES Site RPI NEES Site
Diameter, D 100-600 mm 200-5000 mm
Diameter to Thickness Ratio, D/t 10-120 10-250
Depth of Burial 0.6-1.5 m 0.6-20 m
Maximum Length of Pipeline2 15 m 46 m
Pipeline Intersection Angle for Horizontal Deformation,
+30 o to 90 o
90 o to -30 o 62 o to 90 o
90 o to -62 o
Normal Deformation Angle, N 30 o to -90 o 90 o
Thrust Deformation Angle, T 30o NA
Maximum Displacement 1.8 m 4.0 m
Maximum Rate of Displacement 0.1 m/s 0.9 m/s
1 refers to prototype or actual field scale 2 refers to actual test box dimensions; the effective pipeline length can be increased
experimentally through the use of actuators in the Cornell facility and special springs in the Rensselaer split box
a) Horizontal Deformation Angle, , for Strike-Slip Fault (Plan View)
b) Normal Deformation Angle, N, for Normal Fault (cross-section)
c) Thrust Deformation Angle, T, for Reverse Fault (cross-section)
-
Pipeline
Ground Rupture
N T Pipeline
3
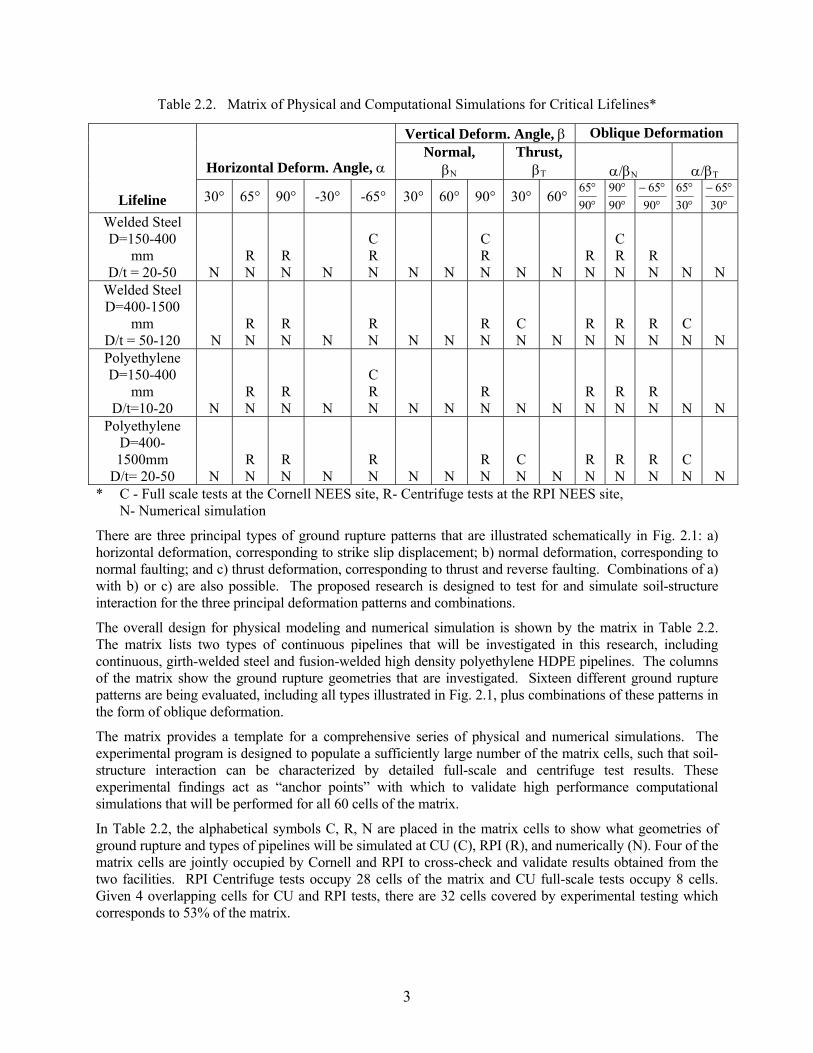
Table 2.2. Matrix of Physical and Computational Simulations for Critical Lifelines*
* C - Full scale tests at the Cornell NEES site, R- Centrifuge tests at the RPI NEES site, N- Numerical simulation
There are three principal types of ground rupture patterns that are illustrated schematically in Fig. 2.1: a) horizontal deformation, corresponding to strike slip displacement; b) normal deformation, corresponding to normal faulting; and c) thrust deformation, corresponding to thrust and reverse faulting. Combinations of a) with b) or c) are also possible. The proposed research is designed to test for and simulate soil-structure interaction for the three principal deformation patterns and combinations.
The overall design for physical modeling and numerical simulation is shown by the matrix in Table 2.2. The matrix lists two types of continuous pipelines that will be investigated in this research, including continuous, girth-welded steel and fusion-welded high density polyethylene HDPE pipelines. The columns of the matrix show the ground rupture geometries that are investigated. Sixteen different ground rupture patterns are being evaluated, including all types illustrated in Fig. 2.1, plus combinations of these patterns in the form of oblique deformation.
The matrix provides a template for a comprehensive series of physical and numerical simulations. The experimental program is designed to populate a sufficiently large number of the matrix cells, such that soil-structure interaction can be characterized by detailed full-scale and centrifuge test results. These experimental findings act as “anchor points” with which to validate high performance computational simulations that will be performed for all 60 cells of the matrix.
In Table 2.2, the alphabetical symbols C, R, N are placed in the matrix cells to show what geometries of ground rupture and types of pipelines will be simulated at CU (C), RPI (R), and numerically (N). Four of the matrix cells are jointly occupied by Cornell and RPI to cross-check and validate results obtained from the two facilities. RPI Centrifuge tests occupy 28 cells of the matrix and CU full-scale tests occupy 8 cells. Given 4 overlapping cells for CU and RPI tests, there are 32 cells covered by experimental testing which corresponds to 53% of the matrix.
Lifeline
Horizontal Deform. Angle,
Vertical Deform. Angle, Oblique Deformation Normal,
N Thrust,
T
/N
/T
30° 65° 90° -30° -65° 30° 60° 90° 30° 60°
90
65
90
90
90
65
30
65
30
65
Welded Steel D=150-400
mm D/t = 20-50 N
R N
R N
N
C R N
N
N
C R N
N
N
R N
C R N
R N
N
N Welded Steel D=400-1500
mm D/t = 50-120 N
R N
R N
N
R N
N
N
R N
C N
N
R N
R N
R N
C N
N Polyethylene D=150-400
mm D/t=10-20 N
R N
R N
N
C R N
N
N
R N
N
N
R N
R N
R N
N
N Polyethylene
D=400-1500mm
D/t= 20-50 N
R N
R N
N
R N
N
N
R N
C N
N
R N
R N
R N
C N
N

4
Most lifelines are buried at depths of 0.9 to 1.5 m to top of pipe/conduit. In the experimental tests, depths of approximately 1 m will be used. Both the CU large-scale and RPI centrifuge tests are performed with differing gradations of medium dense RMS concrete sand at 4-6% water content. Use of this sand provides consistency in the modeling process and, most importantly, achieves conditions that replicate field conditions with respect to density and water content.
3. LARGE SCALE EXPERIMENTAL SIMULATION AND RELATED MODELING ACTIVITIES
Large scale testing at CU follows the overall experimental design illustrated by the matrix in Table 2.2. The goals of the CU experiments are to provide detailed, full-scale experimental data for key cells of the matrix, 4 of which coincide with both RPI centrifuge and numerical simulation to ensure checks on consistency and accuracy among the modeling methods. Approximately four to five full-scale tests are planned for PE pipelines, with the remainder performed on steel pipelines. Hence, emphasis is given to highly ductile pipeline material, namely high density polyethylene (HDPE), which has the capacity to accommodate severe ground deformation while maintaining its continuity and serviceability. Interaction with industry and water supply operators show that substantial improvements in water supply resilience can be achieved by demonstrating the capabilities of this type of pipeline with NEES. Significant attention is also given to steel pipelines used in numerous critical fuel, water, and electrical power facilities.
In Years 1, 2 and 3, tests are being performed on PE and steel pipelines at α = -65º with D/t = 16 for HDPE and D/t 50 for steel. The tests with α = -65º involve pipeline extension with tensile strains well into the inelastic range. The tests with α = 65º involve pipeline compression. These tests required a structural reconfiguration of the test basin, which was originally configured for α = -65º tests. The design for that structural reconfiguration was completed in late Year 3, and structural modifications of the test basin were completed in early Year 4 and an = 65º test was completed in January 2008. In Year 4 significant effort has been focused on measuring interface pressure between the experimental pipeline and soil during large-scale ground rupture tests. The measurements were performed with tactile force sensors, which is a novel technology involving flexible polymer sheets in which are embedded dozens of pressure sensors in a rectilinear matrix. RPI is using tactile force sensors extensively in centrifuge tests of pipeline response to ground rupture. These sensors were adapted to large-scale testing during Year 3. The importance of accurately characterizing the interaction forces and external pipe pressure generated by soil-pipeline interaction cannot be overstated. Obtaining this information is essential for design as well as for future construction and product development.
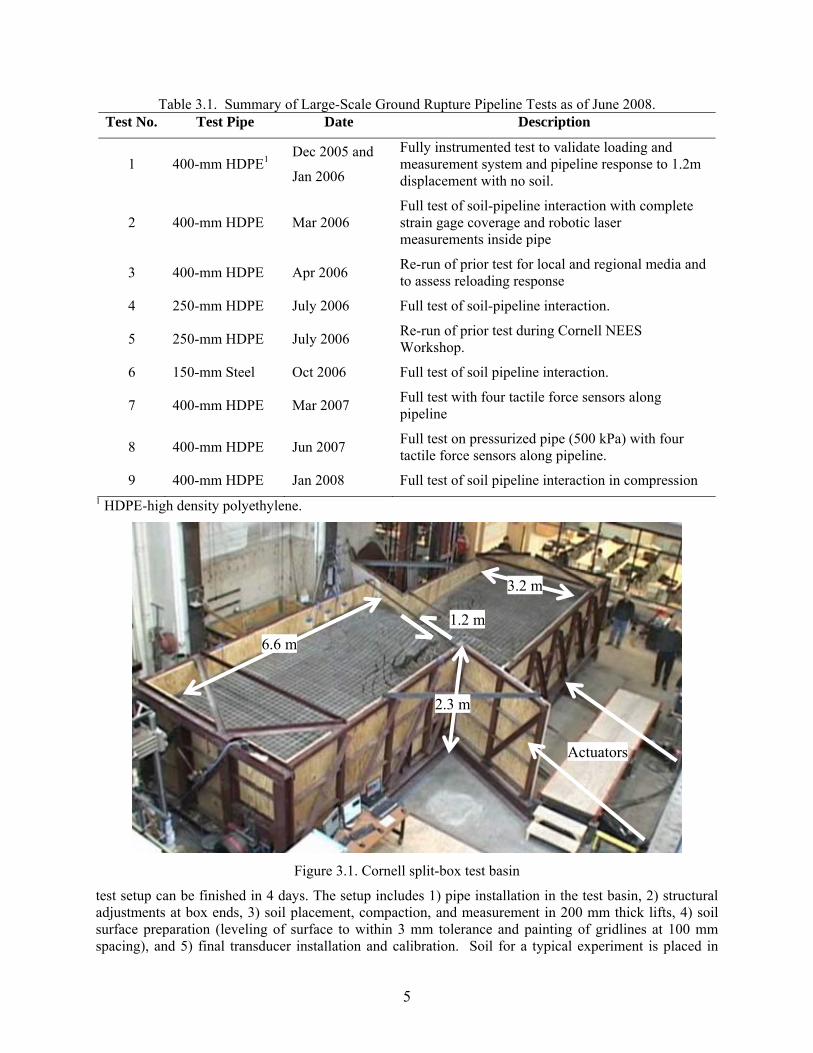
Table 3.1 summarizes the large-scale tests performed as of June 1, 2008. Nine large-scale tests have been conducted before the end of Year 4, exceeding the original estimate in the NEESR proposal of 6-7 by end of Year 4. All tests since July 2006 have been performed with tactile force sensors to obtain measurements of soil-pipeline interaction forces and external reaction pressures on the pipe.
Figure 3.1 shows a view of the CU facility and the current generation of split-box test basin at Cornell that involves over 90 metric tons of partially saturated sand per test and 1.2 m of strike-slip displacement. The displacement is provided by two hydraulic structural actuators with load capacities of 445 kN tension/650 kN compression and a one-way stroke of 1.28 m. Two additional actuators are available with load capacities of 295 kN tension/500 kN compression and a one-way stroke of 1.82 m. Such testing requires that large quantities of soil be prepared in accordance with strict quality control on the sand dry unit weight and water content. Moreover, it is imperative that substantial volumes of soil be moved from storage facilities to the test basin, placed in controlled lift thicknesses, and compacted at a relatively rapid rate.
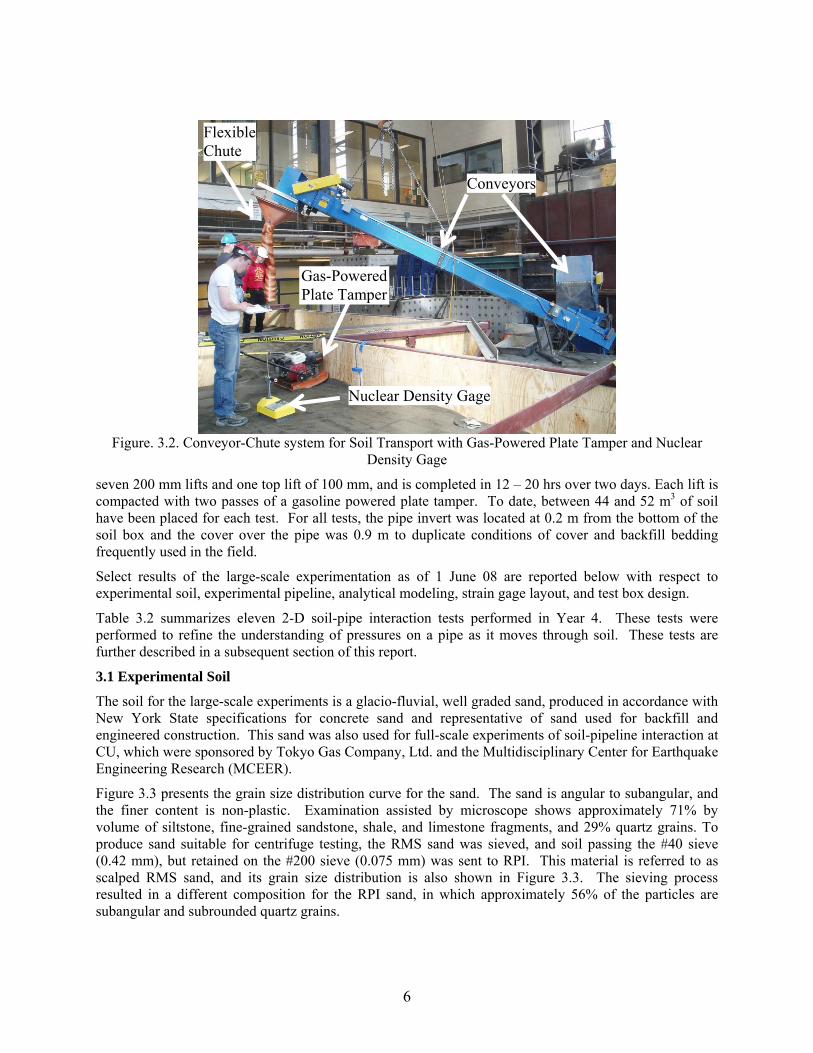
Figure 3.2 shows a photo of the conveyor-chute system to transport the soil. The system consists of two conveyors, each 4 to 7 m long, and a 3 m long flexible soil placement chute. During production, a full
5
Table 3.1. Summary of Large-Scale Ground Rupture Pipeline Tests as of June 2008. Test No. Test Pipe Date Description
1 400-mm HDPE1 Dec 2005 and
Jan 2006
Fully instrumented test to validate loading and measurement system and pipeline response to 1.2m displacement with no soil.
2 400-mm HDPE Mar 2006 Full test of soil-pipeline interaction with complete strain gage coverage and robotic laser measurements inside pipe
3 400-mm HDPE Apr 2006 Re-run of prior test for local and regional media and to assess reloading response
4 250-mm HDPE July 2006 Full test of soil-pipeline interaction.
5 250-mm HDPE July 2006 Re-run of prior test during Cornell NEES Workshop.
6 150-mm Steel Oct 2006 Full test of soil pipeline interaction.
7 400-mm HDPE Mar 2007 Full test with four tactile force sensors along pipeline
8 400-mm HDPE Jun 2007 Full test on pressurized pipe (500 kPa) with four tactile force sensors along pipeline.
9 400-mm HDPE Jan 2008 Full test of soil pipeline interaction in compression 1 HDPE-high density polyethylene.
Actuators
1.2 m
6.6 m
3.2 m
2.3 m
Figure 3.1. Cornell split-box test basin
test setup can be finished in 4 days. The setup includes 1) pipe installation in the test basin, 2) structural adjustments at box ends, 3) soil placement, compaction, and measurement in 200 mm thick lifts, 4) soil surface preparation (leveling of surface to within 3 mm tolerance and painting of gridlines at 100 mm spacing), and 5) final transducer installation and calibration. Soil for a typical experiment is placed in
6
Figure. 3.2. Conveyor-Chute system for Soil Transport with Gas-Powered Plate Tamper and Nuclear
Density Gage
seven 200 mm lifts and one top lift of 100 mm, and is completed in 12 – 20 hrs over two days. Each lift is compacted with two passes of a gasoline powered plate tamper. To date, between 44 and 52 m3 of soil have been placed for each test. For all tests, the pipe invert was located at 0.2 m from the bottom of the soil box and the cover over the pipe was 0.9 m to duplicate conditions of cover and backfill bedding frequently used in the field.
Select results of the large-scale experimentation as of 1 June 08 are reported below with respect to experimental soil, experimental pipeline, analytical modeling, strain gage layout, and test box design.
Table 3.2 summarizes eleven 2-D soil-pipe interaction tests performed in Year 4. These tests were performed to refine the understanding of pressures on a pipe as it moves through soil. These tests are further described in a subsequent section of this report.
3.1 Experimental Soil
The soil for the large-scale experiments is a glacio-fluvial, well graded sand, produced in accordance with New York State specifications for concrete sand and representative of sand used for backfill and engineered construction. This sand was also used for full-scale experiments of soil-pipeline interaction at CU, which were sponsored by Tokyo Gas Company, Ltd. and the Multidisciplinary Center for Earthquake Engineering Research (MCEER).
Figure 3.3 presents the grain size distribution curve for the sand. The sand is angular to subangular, and the finer content is non-plastic. Examination assisted by microscope shows approximately 71% by volume of siltstone, fine-grained sandstone, shale, and limestone fragments, and 29% quartz grains. To produce sand suitable for centrifuge testing, the RMS sand was sieved, and soil passing the #40 sieve (0.42 mm), but retained on the #200 sieve (0.075 mm) was sent to RPI. This material is referred to as scalped RMS sand, and its grain size distribution is also shown in Figure 3.3. The sieving process resulted in a different composition for the RPI sand, in which approximately 56% of the particles are subangular and subrounded quartz grains.
Gas-Powered Plate Tamper
Nuclear Density Gage
Conveyors
Flexible Chute

7
Table 3.2. Summary of Large-Scale 2-D Pipeline Tests July – September 2007.
Test No.
Dimensionless Burial Depth
Dry Unit
Weight, kN/m3
Moisture Content
Soil Friction Angle
Test Description
1 5.5 16.9 0% 43º Full test of soil-pipeline interaction in dry sand.
2 5.3 17.2 0% 45º
Full test of soil-pipeline interaction using 1 tactile force sensor on pipe to measure circumferential stress distribution.
3 5.3 17.2 0% 45º
Full test of soil-pipeline interaction using 2 tactile force sensors on pipe to study load distribution along pipeline.
4 5.3 16.1 4% 41º Full test of soil-pipeline interaction in partially saturated sand.
5 5.3 16.3 4% 43º Full test of soil-pipeline interaction in partially saturated sand.
6 3.5 15.9 5% 41º Full test of soil-pipeline interaction using 2 tactile force sensors on pipe.
7 3.5 16.4 5% 44º
Full test of soil-pipeline interaction using 1 tactile force sensor on pipe and 1 tactile force sensor to study stress distribution on test box sidewall.
8 7.5 15.8 5% 40º
Full test of soil-pipeline interaction at large burial depth using 2 tactile force sensors on sidewall.
9 6.5 15.8 4% 40º Full test of soil-pipeline interaction using 2 tactile force sensors on sidewall.
10 5.5 16.0 4% 40º
Full test of soil-pipeline interaction in smaller test box using 2 tactile force sensors on sidewall.
11 5.5 16.5 5% 45º
Full test of soil-pipeline interaction in smaller test box at high dry unit weight using 2 tactile force sensors on sidewall.
Over 450 direct shear (DS) tests were performed to characterize the strength and stress-deformation properties of the experimental sand. The test procedures were similar to those used previously at CU by Trautmann and O’Rourke (1985) and Turner (2004). Normal stresses of 15 kPa were used in all tests, corresponding to vertical stress at a depth of 1.25 m in sand above the groundwater table. This depth corresponds to the centerline of the HDPE experimental pipeline. The sand was prepared at water contents of 2, 4, and 8%.

8
10 1 0.1 0.01Particle Diameter, mm
0
20
40
60
80
100
% P
assi
ng
RMS Sand
Scalped RMS Sand
Figure 3.3. Grain Size Distribution Curves for Full-Scale (RMS) and Centrifuge (Scalped RMS) Tests.
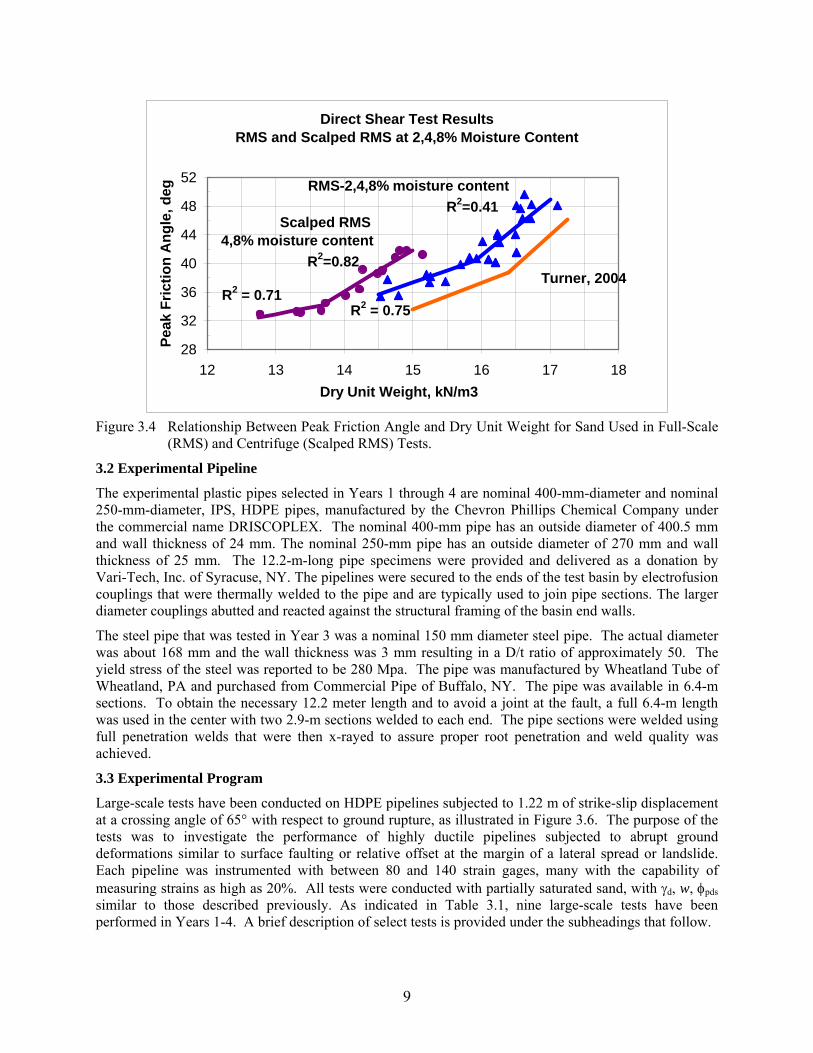
Figure 3.4 shows select DS test results on both RMS and scalped RMS sand. The peak friction angle is plotted as a function of dry unit weight. Bilinear trends of the data are shown with r2 values. The trend lines associated with tests performed by Turner (2004) for a different sand are also indicated in the figure. These plots were used to determine the appropriate dry unit weight for preparation at CU and RPI to provide consistent peak shear strength and stress-deformation characteristics. Selecting a dry unit weight of 15.7 kN/m3 for RMS sand at CU and 14.6 kN/m3 for scalped RMS sand at RPI results in the same peak DS friction angle of 40º as well as compatible force vs. displacement characteristics.
Between 240 and 320 measurements of dry unit weight and moisture content have been recorded for each setup. Dry unit weight, d, was measured in situ using a nuclear density gage according to ASTM D2922-01 (2001), and moisture content was measured in situ according to ASTM D2216-01 (2001). Typically, from 5 to 7 dry unit weight measurements are made per m3 of soil. The peak friction angle, pds, is determined from regressions between d and the peak friction angle determined by direct shear tests for both dry and partially saturated sand. The value of pds is reported in terms of total stress because suction in the moist sand (and thus effective stress conditions) is not measured directly. For dry sand, pds = ’pds.
Figure 3.5 presents plots of the mean dry unit weight, d, water content, w, and peak friction angle, pds, of the sand for each lift with respect to depth for five full-scale split-box pipeline experiments. As shown in the figure, a remarkable degree of control was achieved in the experimental soil properties over many tests with large volumes of material. The preponderance of the measurement data show placement of the sand in the range of d = 15.5 – 15.8 kN/m3, w = 3.5 – 4.5 %, and pds = 39 – 40º. Statistical control procedures described by Trautmann, et al. (1985) were applied to determine confidence intervals for the sand properties based on mean characteristics of the entire soil mass. For example, the 95% confidence intervals on the mean d and pds for any given test were 0.02 – 0.05 kN/m3 and 0.10 – 0.19, respectively. Please note that Figure 3.5 illustrates the spread in soil properties lift by lift among several tests, whereas the confidence intervals pertain to overall average values for each individual test.
9
Direct Shear Test ResultsRMS and Scalped RMS at 2,4,8% Moisture Content
Turner, 2004
RMS-2,4,8% moisture content
R2=0.41 Scalped RMS4,8% moisture content
R2=0.82
R2 = 0.71R2 = 0.75
28
32
36
40
44
48
52
12 13 14 15 16 17 18
Dry Unit Weight, kN/m3
Pea
k F
rict
ion
An
gle
, deg
Figure 3.4 Relationship Between Peak Friction Angle and Dry Unit Weight for Sand Used in Full-Scale
(RMS) and Centrifuge (Scalped RMS) Tests.
3.2 Experimental Pipeline
The experimental plastic pipes selected in Years 1 through 4 are nominal 400-mm-diameter and nominal 250-mm-diameter, IPS, HDPE pipes, manufactured by the Chevron Phillips Chemical Company under the commercial name DRISCOPLEX. The nominal 400-mm pipe has an outside diameter of 400.5 mm and wall thickness of 24 mm. The nominal 250-mm pipe has an outside diameter of 270 mm and wall thickness of 25 mm. The 12.2-m-long pipe specimens were provided and delivered as a donation by Vari-Tech, Inc. of Syracuse, NY. The pipelines were secured to the ends of the test basin by electrofusion couplings that were thermally welded to the pipe and are typically used to join pipe sections. The larger diameter couplings abutted and reacted against the structural framing of the basin end walls.
The steel pipe that was tested in Year 3 was a nominal 150 mm diameter steel pipe. The actual diameter was about 168 mm and the wall thickness was 3 mm resulting in a D/t ratio of approximately 50. The yield stress of the steel was reported to be 280 Mpa. The pipe was manufactured by Wheatland Tube of Wheatland, PA and purchased from Commercial Pipe of Buffalo, NY. The pipe was available in 6.4-m sections. To obtain the necessary 12.2 meter length and to avoid a joint at the fault, a full 6.4-m length was used in the center with two 2.9-m sections welded to each end. The pipe sections were welded using full penetration welds that were then x-rayed to assure proper root penetration and weld quality was achieved.
3.3 Experimental Program
Large-scale tests have been conducted on HDPE pipelines subjected to 1.22 m of strike-slip displacement at a crossing angle of 65° with respect to ground rupture, as illustrated in Figure 3.6. The purpose of the tests was to investigate the performance of highly ductile pipelines subjected to abrupt ground deformations similar to surface faulting or relative offset at the margin of a lateral spread or landslide. Each pipeline was instrumented with between 80 and 140 strain gages, many with the capability of measuring strains as high as 20%. All tests were conducted with partially saturated sand, with d, w, pds similar to those described previously. As indicated in Table 3.1, nine large-scale tests have been performed in Years 1-4. A brief description of select tests is provided under the subheadings that follow.

10
38.0
39.0
40.0
41.0
42.0
pds (deg)
0.0
0.4
0.8
1.2
1.6
2.0D
epth
(m
)
15.2
15.6
16.0
16.4
d (kN/m3)
0.02
0.03
0.04
0.05
0.06
0.07
w
Legend:Test 1
Test 2
Test 3Test 4
Test 5
15.5 - 15.8 kN/m3 3.5 - 4.5% 39.0 - 40.0
Figure 3.5. Mean Dry Unit Weight, Water Content, and Peak Friction Angle by Lift vs Depth for Five
Large-Scale Tests
3.3.1 250-mm HDPE Ground Rupture Test
A test on a 250 mm nominal diameter HDPE pipe was performed in July 2006. This test involved a different diameter, different D/t ratio, and a different H/D ratio than the previous tests on the 400 mm pipe. The test involved 1.2 m of displacement along a 65 degree fault that resulted in both tension and bending in the pipe. The pipe was instrumented in the same manner as the previous 400 mm pipes with strain gages and tactile force sensors. Details on the instrumentation will be discussed in Section 3.4.1
3.3.2 250-mm HDPE Full-Scale Repeat Ground Rupture Test
This test was a repeat of the test described in section 3.3.1. After that test, the movable portion of the test basin was retracted. This required some minor excavation along the pipe. The soil surface was smoothed and the surface grid repainted. The pipe was not moved and the gages and sensors were left in-place. This test was completed to demonstrate a full-scale experiment and obtain supplemental data for Cornell NEES workshop attendees. It also provided data on the behavior of a previously displaced pipe and on the forces necessary to displace a pipe that had been previously strained to the levels encountered in the first test.
3.3.3 150-mm Steel Full-Scale Ground Rupture Test
This test, conducted in October 2006, was similar to those previously conducted on the HDPE pipes. Once again the movable portion of the test basin was displaced 1.2 m along a 65 degree fault resulting in both tension and bending on the test pipe. Due to the smaller diameter of this pipe, it was possible to wrap the pipe with tactile force sensors across the pipe area in contact with adjacent soil. This allowed acquisition of data from the entire pipe-soil interface.

11
651.22 m
3.2 m
10.6 m
Initial Pipe Position
Initial Box Position
Final Box Position
Final Pipe Position
Figure3.6. Plan View of Large-Scale Pipeline Test with Key Dimensions and Geometry
3.3.4 400-mm HDPE Ground Rupture Test
This test is very similar to the first full scale test performed in March 2006. The primary focus of this test was the pressure induced on the side of the pipe as a result of the ground deformation rather than the resulting strains. Work performed between the March 2006 test and this test in March 2007 on a tactile force sensor protection system allowed the sensors to be deployed such that the normal pressures induced during the test were recorded without cross-sensitivity effects on sensor measurements induced by shear forces.
3.3.5 400-mm Pressurized HDPE Ground Rupture Test.
This test was a repeat of the March 2007 test on the 400 mm pipe with the exception that this pipe was pressurized to 500 kPa. The pipe was instrumented exactly as the March 2007 test to allow direct comparision of the results between non-pressurized and pressurized conditions. This test was performed to examine the effects pressurization would have on pipe behavior. Since transmission and distribution pipes are under pressure while in service, this test was an important step in understanding the behavior of actual pipelines.
3.3.6 400-mm HDPE Compression Test
This test was similar to the pervious ground rupture tests using 400 mm HDPE pipe with the exception that the previous tests were tension tests and this one was a compressions test. The test basin was modified and reconfigured to allow the 1.2 m of displacement to result in compression in the pipe. The pipe was instrumented similarly to the previous tests. Video cameras were placed inside the pipe to capture the behavior as the pipe buckled. After the test the pipe was carefully excavated and the test was reversed and then repeated to allow video capture of the test via overhead cameras.
Figure 3.7 shows a comparison of the measured axial and bending strains along a nominal 400 mm diameter (outside diameter = 407 mm, wall thickness = 24 mm) pipeline at 1.22 m of strike-slip displacement for three large-scale tests. One of the inset diagrams in Figure 3.7 shows a schematic of the deformed shape of the test pipe within the test basin. Axial strains are the average of the pipe crown and invert strains, and bending strains were determined as one half the difference between the springline strains (please see the inset diagram in Fig. 3.6 for the crown, invert, and springline locations). The bending strain so calculated is the incremental strain caused by pipeline flexure relative to the axial strain Plotting the strain in this way allows one to see the axial strains caused by pipeline extension relative to the additional strains generated by bending.

12
-5 -4 -3 -2 -1 0 1 2 3 4 5Position, mS (-), N (+)
-2
0
2
4
6
8
10
Stra
in (
%)
Test 1: Axial
Test 1: Bending
Test 3: Axial
Test 3: BendingTest 2: Axial
Test 2: Bending
Location ofTactile Force Sensors
Split Box
Pipe
N
Split Box
Pipe
N
Crown
Springline
Invert
Crown
Springline
Invert
Figure 3.7. Comparison of Pipeline Strain Measured in Three Nominal 400 mm Diameter Large-Scale
Tests
The axial pipe strains are maximum at the location of ground rupture and decrease with increasing distance from this location. Pipe flexural strains are zero at the location of abrupt ground deformation, consistent with double curvature bending and a point of counterflexure at the plane of strike-slip displacement.
There is a remarkable degree of consistency in the measured bending strains. The axial strains show some differences caused in part by Teflon wrapping around the pipes in Tests 2 and 3, which was used as protection for the tactile force sensors. (These sensors measure lateral soil pressures and are described later in this paper.) The Teflon wrapping was placed over the sensors on the south end of the pipe, as shown in Fig. 3.6. The Teflon wrapping was applied as a double layer so that the outer sheet could move relative to the inner one, thereby providing a zone in which very low shear stress was transmitted to the sensor and pipe. With nearly half the pipeline south of the ground rupture isolated from the effects of axial shear forces from the surrounding soil, additional load was conveyed asymmetrically to each end of the test pipes, with higher axial strains at the south end. The maximum measured strain was 8.0%, representing the combined axial and bending strains shown in the figure, and was offset from the ground rupture approximately 1.0 m either side of the fault. This strain is well into the inelastic range of HDPE deformation, but far from the level of strain associated with pipe wall rupture, which may exceed several times this level, depending on the duration of loading.
Full-scale measurements showed that the axial load in the pipeline decreased by 40% within 2 hours after ground rupture. Because HDPE is visco-elastic, it has the beneficial effect of reducing the load with time at anchorages outside the ground rupture zone.
Additional measurements of changes in internal pipe diameter during ground rupture are described by O’Rourke and Bonneau (2007). These measurements were performed with a laser profiling device that generates an image of the pipe cross-section continuously as a robotic crawler traverses the pipeline. The laser profiling measurements showed a maximum increase in diameter of 12% at the location of ground rupture. The measurements also showed about 6% maximum loss of the internal cross-sectional area of

13
Table 3.3. Status of Data from Large-Scale and Centrifuge Experiments.
Award No. And Title
NSF Award 0421142, NSF Program Solicitation 03-589, NEESR-SG Evaluation of Ground Rupture Effects on Critical Lifelines
Personnel Cornell Research Team: T. D. O’Rourke, H.E. Stewart, M.C. Palmer, T.K. Bond, J.M. Jezerski, N.A. Olson RPI Research Team: M.J. O’Rourke, M.D. Symans, T. Abdoun, D. Ha
Status of Experimental Data
Nine large-scale soil-pipe interaction tests have been performed to date on various diameters of HDPE and steel pipe. Tests were performed in a basin measuring 10.7 m long and 3.3 m wide and containing over 90 metric tones of sand. Data produced includes strain gage readings, load cell readings, actuator load data, soil pressuremeter readings, tactile force sensor readings, pipe temperature data, test basin deformation data, soils density and moisture content data, and pipe displacement and deformation data. A large number of photos and video were taken of test setup, preparation, and during the tests.
Eleven large-scale force vs horizontal displacement tests to determine p-y relationships for modeling soil-pipe interaction. These were performed in a basin that measured 2.4 m square. Data produced includes strain gage readings, load cell readings, actuator load data, soil pressuremeter readings, tactile force sensor readings, pipe temperature data, test basin deformation data, soils density and moisture content data, and pipe displacement and deformation data.
A large number of photos and video were taken of test setup, preparation, and during the tests. Photos and videos are currently available on the Cornell/NEESR-SG project website at http://projects.nees.cornell.edu. Data from all tests have been uploaded to the NEES Central Repository, Data from the first large-scale test performed in March 2006 were uploaded beginning in April 2006. The data were curated in November 2007 and the Cornell/NEES site was notified that curation was complete in January 2008. All data will be archived and made publicly available in accordance with NEES procedures.
Twenty-four centrifuge tests have been performed to date on various diameters of HDPE and steel pipe. Data produced includes strain gage readings, load cell readings, actuator load data and tactile force sensor readings. The strain gage results of ten centrifuge tests with the corresponding photos and video taken of test setup, preparation, and during the tests were uploaded to NEES Central Repository. RPI team is working with NEESit to upload the remaining centrifuge tests that include tactile force sensor data which are not supported by NEES Central Repository
the pipe. Most importantly, the laser profiling provided an accurate, continuous record of cross-sectional change in shape, demonstrating that the full-scale pipeline deformed as a 3-D cylinder.
The experimental evidence confirms the substantial ductility of HDPE pipe and the beneficial effects of its highly ductile performance in accommodating permanent ground deformation. The maximum measured strains for 1.22 m of strike-slip displacement were far below strain levels associated with rupture of the pipe wall. The maximum reduction of pipe diameter due to ovaling, however, was 12%. The experimental evidence therefore shows that loss of pipe cross-sectional area due to ovaling is likely to be the mode of deformation governing failure of larger HDPE pipes for earthquake-induced ground rupture effects.

14
Tactile Force Sensor
427 mm
488 mm
Figure 3.8. Photo of the Tactile Force Sensor Used in the Investigations (Tekscan Sensor Model 5315)
Table 3.3 summarizes the status of experimental data for the experiments performed at Cornell University and RPI. After data from the tests have been assembled and reviewed it will uploaded to the NEES Central Repository. All data will be archived and made publicly available in accordance with NEES procedures
3.4 Tactile Force Sensors
A noteworthy development associated with NEES large-scale and centrifuge testing is the adaptation of tactile force sensors to evaluate pressure distribution at the soil-pipe interface (Ha et al., 2008a and 2008b). A tactile force sensor is an array of small sensors, embedded in a polymeric sheet or pad, that measure the distribution of contact stresses associated with externally applied loads. Each small sensor, or sensel, is formed by the intersection of strips of semi-conductive ink embedded in two adjoined polymeric sheets.
Tactile force sensors were originally developed by Hillis (1981) and Purbrick (1981) to support artificial intelligence (Paikowsky and Hajduk, 1997) and have since been used in many industrial and ergonomic applications including automotive brake pad and seat design (Tekscan, 2003). Their application in geotechnical engineering offers many advantages. They are thin, wide and flexible, thus possessing excellent characteristics with respect to aspect ratio and stiffness. Because of their flexibility, they can be adapted to a variety of surface geometries not possible with soil stress cells. For example, they will conform to the curved surfaces of piles, drilled shafts, pipelines, and culverts.
As shown in Fig. 3.7, tactile force sensors, manufactured by Tekscan, Inc., were used in the large-scale tests. Each sensor sheet was 622 x 530 mm in area with a sensing region of 488 x 427 mm. The sensor contains 2016 sensels spaced on 10-mm centers in each direction. The data acquisition system and specialized software allow for the distribution of pressure to be visualized as a function of time and quantified across all or part of the polymeric sheet.
Shear stresses on tactile force sensors may cause relative slip between the two adjoined polymeric sheets, generating perturbations in the registered voltage. Methods of reducing shear stress effects were

15
2.4 m2.
4 m
1.8 m
Direction ofpipe movement
North
Buriedpipe
investigated by comparing measured and applied normal stresses during direct shear tests in which various combinations of overlying polymeric sheets were used to protect and insulate the sensor. It was found that using two layers of Teflon is effective in reducing shear stress effects to negligible levels. A double layer of Teflon sheets was therefore used in all large-scale tests.
Tactile force sensors were used in full-scale 3-D tests of ground rupture effects on buried pipelines and full-scale 2-D tests of pipelines under horizontal ground displacements (O’Rourke and Bonneau, 2007). In addition, tactile force sensors were used in the centrifuge tests (Abdoun et al., 2008; Ha et al., 2008). Figure 3.9 shows the 2-D test basin, which was used to evaluate horizontal force vs displacement relationships of pipelines buried at various depth-to-diameter ratios in dry and partially saturated sand. The glacio-fluvial sand described previously was used in all tests, and the sand placement procedures were similar to those described previously.
Horizontal force was applied with two long-stroke (1.2-m in one direction) hydraulic actuators and was measured with load cells. Lateral movement was measured with displacement transducers. The loading arm was designed so that the test pipe could rise vertically without restraint as it was displaced laterally though the soil. The test basin and loading conditions were similar to those used in previous full-scale tests (e.g., Trautmann and O’Rourke, 1985: O’Rourke, et al. 2004) with the main exception being size.
The internal dimensions of the test basin were 2.44 m x 2.44 m in plan and 1.82 m in depth. The end effects of wall friction were minimized by the relatively large width of the test basin and by lining the interior of the box with Formica and glass, both of which provide for relatively low angles of interface friction.
As shown in Fig. 3.10a, soil displacement relative to the pipe divides at the springline into movement over and under the pipe. Figure 3.10b shows the distribution of pressure over the surface of the pipe. Letting p denote the soil pressure per unit length along the pipe surface and f denote the frictional force between soil and pipe per unit length, the total force per unit length acting on the pipe is obtained by combining p and f appropriately. The frictional force per unit length is given by f() = p()sintanSI where SI is the interface friction angle between the pipe and soil. The net force acting on the pipe surface in the transverse horizontal direction, PH, is given by
2
0
2
0sintancos dRpdRpP SIH (1)
The net force per unit length can also be obtained from the experimental data using the following relation
J
jjjjmSI
J
jjjjmH SpSpP
11
sintancos (2)
where (pm)j is the measured pressure, pm, at the j-th pressure sensor node, Sj is the arc length associated with the j-th pressure sensor node (Sj = 2R/J), j is the angle defining the orientation of (pm)j, and J is the total number of pressure sensor nodes around the pipe surface per unit length.
Figure 3.9. Photo of Test Basin for Large-Scale 2-D Tests of Lateral Force vs Displacement in Sand

16
b) Normal Stress Distribution
c) Expanded View
N
O
R
ExpandedView
O
FH
a) Shear Stress Orientation
ds = Rd
Figure 3.10. Soil-Pipe Interaction Showing Shear and Normal Stresses
0
45
90
135
180
225
270
315
0 50 100 150 200Normal Stress, kPa
= 10 mm
0
45
90
135
180
225
270
315
0 50 100 150 200Normal Stress, kPa
= 30 mm
0
45
90
135
180
225
270
315
0 50 100 150 200Normal Stress, kPa
= 225 mm
0
45
90
135
180
225
270
315
0 50 100 150 200Normal Stress, kPa
= 10 mm
0
45
90
135
180
225
270
315
0 50 100 150 200Normal Stress, kPa
= 30 mm
0
45
90
135
180
225
270
315
0 50 100 150 200Normal Stress, kPa
= 225 mm
b) Centerline Sensor
a) Side Sensor
Figure 3.11. Distribution of Normal Pressure Measured by Tactile Force Sensors
Figure 3.11 shows the normal pressure distribution measured by tactile force sensors at various stages during the application of a lateral load for a large-scale test using dry sand with dry unit weight of 17.2 kN/m3 and pds = 45, D = 100 mm, and a pipe center depth to outside pipe diameter ratio of 5.3. Two tactile force sensors were used during the test. One was positioned between 90 - 520 mm from the end of the pipe, and is referred to as the side sensor. The other was positioned between 1000 – 1430 mm from the end of the pipe, and is referred to as the centerline sensor. The measured pressure distributions are shown at lateral displacements, δ, of the test pipe of 10, 30, and 225 mm, corresponding to a pre-peak, peak, and final post-peak load on the pipe, respectively. For the 100 mm diameter pipe, the sensel width of 10.2 mm corresponds to about 9° of arc length. Thus, the pressure distribution is shown as 19 discrete measurements around the pipe. Virtually all pressure was confined to the front half circumference of the pipe.
Figure 3.12 shows the lateral force vs displacement plot developed from the tactile force sensors in comparison with that developed from the load cell measurements external to the test basin, as described above. Inset photos show the tactile force sensor on the pipe and Teflon protective cover. The horizontal

17
Figure 3.12. Comparison of Lateral Force vs Displacement Plots for Tactile Force Sensors and External
Load Cells
force for each sensor at each increment of lateral displacement was calculated for the measured pressure distribution using Eqn. 2. The angle of interface shear, δSI, for sand on Teflon was determined from direct shear tests and the correlation between δSI/’ and Shore D hardness established by O’Rourke et al. (1990) for smooth polymers in contact with granular soil. The value of δSI so determined is 29. The measured forces from the two sensors were averaged at each movement increment to produce the horizontal force vs lateral displacement plot for the tactile force sensors.
The horizontal force vs displacement measurements with the tactile force sensors compare favorably with those taken independently with the external load cell. The agreement is especially good for loads increasing to peak values. The peak load from the tactile force sensor was 48 kN, compared to 52 kN from the load cell, resulting in a difference of about 8%. The difference between the tactile force sensor and load cell measurements after peak load is attributed to tactile force sensor creep and a tendency to exceed the measurement range of some of the sensels near the springline of the pipe during the generation of soil failure and high lateral soil stress.
3.5 Lateral Soil Reaction
An important parameter for modeling soil-pipeline interaction is the maximum lateral force between pipe and soil during relative soil displacement and the lateral soil force vs horizontal soil displacement relationship. The latter relationship is often referred to as a p-y curve, and is used for numerical simulations of soil-pipeline interaction that represent the interaction between pipe and soil as the equivalent of a nonlinear spring or spring-slider system. Large-scale 3-D tests performed with the split-box facilities using tactile force sensors provide a definitive means of evaluating the maximum lateral force between pipe and partially saturated soil.
Current industry guidelines for p-y modeling of lateral soil-pipeline interaction are provided by ASCE (1984) and Honegger and Nyman (2004). The information used in the ASCE guidelines are derived from the results of full-scale 2-D tests in dry sand of lateral force vs displacement reported by Trautmann and O’Rourke (1985). The results of subsequent tests in partially saturated sand with similar grain size characteristics have been reported (e.g., O’Rourke et al., 2004; O’Rourke and Bonneau, 2007). These tests were performed with a test facility according to testing procedures similar to those used by
0 50 100 150 200 25025 75 125 175 225Horizontal Pipe Displacement, mm
0
20
40
60
Hor
izon
tal P
ipe
For
ce, k
NLoad Cell Measured P-Y
Tactile Force Sensor P-Y
TACTILE FORCE SENSOR
TEFLON COVER
18
0 4 8 12Dimensionless Depth, Hc/D
0
4
8
12
16
20
24
28
Max
imum
Dim
ensi
onle
ss F
orce
, NqH
= F
/(H
cDL
)
Legend: ASCE (1984)
Centrifuge 3-D, D = 400 mm
Large-Scale 3-D, D = 150 mm
pds = 45
pds = 40
pds = 35
0 4 8 12Dimensionless Depth, Hc/D
Large-Scale 3-D, D = 250 mm
Large-Scale 3-D, D = 400 mm
Large-Scale 2-D, D = 100 mm
Large-Scale 2-D, D = 150 mm
pds = 45
pds = 40
pds = 35
D
Hc
D
Hc
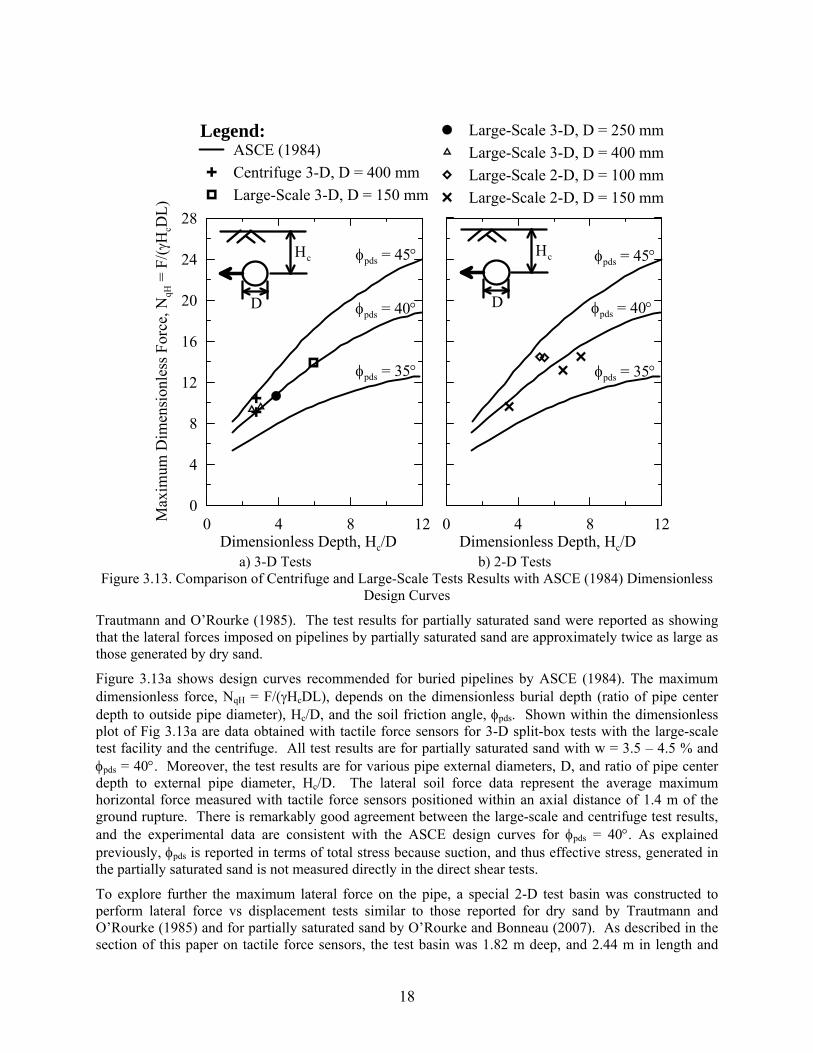
a) 3-D Tests b) 2-D Tests Figure 3.13. Comparison of Centrifuge and Large-Scale Tests Results with ASCE (1984) Dimensionless
Design Curves
Trautmann and O’Rourke (1985). The test results for partially saturated sand were reported as showing that the lateral forces imposed on pipelines by partially saturated sand are approximately twice as large as those generated by dry sand.
Figure 3.13a shows design curves recommended for buried pipelines by ASCE (1984). The maximum dimensionless force, NqH = F/(HcDL), depends on the dimensionless burial depth (ratio of pipe center depth to outside pipe diameter), Hc/D, and the soil friction angle, pds. Shown within the dimensionless plot of Fig 3.13a are data obtained with tactile force sensors for 3-D split-box tests with the large-scale test facility and the centrifuge. All test results are for partially saturated sand with w = 3.5 – 4.5 % and pds = 40. Moreover, the test results are for various pipe external diameters, D, and ratio of pipe center depth to external pipe diameter, Hc/D. The lateral soil force data represent the average maximum horizontal force measured with tactile force sensors positioned within an axial distance of 1.4 m of the ground rupture. There is remarkably good agreement between the large-scale and centrifuge test results, and the experimental data are consistent with the ASCE design curves for pds = 40. As explained previously, pds is reported in terms of total stress because suction, and thus effective stress, generated in the partially saturated sand is not measured directly in the direct shear tests.
To explore further the maximum lateral force on the pipe, a special 2-D test basin was constructed to perform lateral force vs displacement tests similar to those reported for dry sand by Trautmann and O’Rourke (1985) and for partially saturated sand by O’Rourke and Bonneau (2007). As described in the section of this paper on tactile force sensors, the test basin was 1.82 m deep, and 2.44 m in length and

19
width, being two times as wide as the test basins previously used for 2-D tests in sand. Moreover, measurements of lateral soil forces in the enlarged test basin were taken by tactile force sensors as well as independent external load cells.
Figure 3.13b presents the data for the 2-D tests in partially saturated sand with pds = 40. The partially saturated sand was prepared with w = 4.0 – 5.0 %. The 2-D test results compare very favorably with the 3-D test results, and the 2-D experimental data are consistent with the ASCE design curve for pds = 40.
The test results show no significant difference in the maximum horizontal force for dry and partially saturated sand for the same Hc/D and pds pertaining to the D (100 to 400 mm) and HC/D (2.75 to 7.5) that were tested. They also show conclusively that the previously reported test results for a maximum lateral force twice as high in partially saturated sand relative to dry sand for similar burial and soil conditions are not correct.
Further investigations were performed with partially saturated sand in a test basin of the same size as the one used for the overly high test results, reported by O’Rourke et al. (2004) and O’Rourke and Bonneau (2007). Measurements with tactile force sensors of horizontal pressure near the center and ends of the test pipe show substantially elevated lateral stresses on the pipe associated with high side wall shear resistance. The side wall shear resistance in partially saturated sand was significantly larger than that for dry sand with similar soil properties. It was primarily the unrecognized high side wall shear resistance that contributed to the very large horizontal forces previously reported.
3.6 Log Spiral Model
To predict the lateral, or horizontal force, PH, imposed on the pipe as relative lateral displacement of the soil occurs, a limiting equilibrium approach was adopted in which the soil failure surface in front of the pipe is assumed to be a log spiral of the form:
tan0r r e (3)
in which r0 is a reference radius, r is the radius at any angle, , and is the soil angle of shear resistance, which is estimated as pds.
This form of the log spiral was used by Terzaghi (1943) to evaluate the passive earth forces associated with retaining walls, and is the basis for passive earth pressure calculations in current design practice (e.g., NAVFAC, 1982). The log spiral has advantageous qualities in that 1) its shape is frequently consistent with the rupture surface in real soils subject to failure loads, and 2) the resultant force at equilibrium along the sliding surface is oriented so that it is directed through the center of the log spiral.
Figure 3.14 illustrates the application of the log spiral to model the soil failure conditions associated with the horizontal displacement of a pipeline in granular soil. Figure 3.14a shows a slip or rupture surface through soil in front of the pipe modeled as a log spiral of the form given by Eqn. 3. Experimental observations and measurements indicate that a tensile zone develops directly above the pipe during lateral movement in both dry and partially saturated sand. The zone is especially prominent in partially saturated sand, where a tensile crack develops immediately over the pipe centerline when Hc/D ≤ 5-6 for pds ≥ 40. This tensile zone is simplified as a vertical line above the pipe center, and is taken as the rear boundary of the soil mass bounded by the pipe, log spiral, and ground surface on its other sides.
During the large-scale 2-D tests, measurements were taken of the vertical and horizontal movement of the pipe. Vertical movement commenced when the maximum horizontal force for tests in dry sand was mobilized in dilatent soil, and the ratio of vertical to horizontal movement was found to be approximately equal to tan , where is the angle of dilatency estimated from the expression proposed by Bolton (1986) for the relationship between the peak, ’p, and critical, ’crit, friction angle of sand:

20
b) Expanded View
Point of Tangency
PH
r1
ro
a) Log Spiral Failure Surface
PH
Center of Rotation (COR)
Hc
< 90°
Settlement
Failure Surface Represented by Log Spiral
r1
Tension Zone
Heave
WS
r1L1
c) Moment Equilibrium
CORL2
WP
L3
PH
R
Soil Failure mass
(shaded)
Figure 3.14. Schematic of Log Spiral Model to Predict Maximum Lateral Soil-Pipe Interaction Force
8.0'' critp (4)
Adapting the above equation for direct shear test results gives
critdspds ''4
5 (5)
For tests in partially saturated sand, ’pds may be estimated from pds. Direct shear tests on the partially saturated experimental sand showed that pds is between 2° and 3° larger than ’pds for the same γd and w.
Since the pipe at maximum horizontal force displaces at an angle with respect to the horizontal, the point of tangency for movement between the pipe and soil is oriented at as illustrated in the expanded view in Fig. 3.14b. This point is taken as the beginning of the log spiral rupture surface, which will have its center of rotation (COR) located along the trajectory oriented at relative to the horizontal.
The force system acting on the pipe and soil failure mass is illustrated in Fig 3.14c. The moment equilibrium equation for the force system is given by
3210 0 LWLWLPM PSH (6)
in which M0 is the summation of moments about the COR; PH = maximum lateral pipe force per unit distance; WS = weight per unit distance of the log spiral soil mass; WP = pipe weight per unit distance; and L1, L2, and L3 are the moment arms associated with PH, WS, and WP, respectively. The moment arm of WS is taken with respect to the center of gravity of the log spiral soil mass. Please note that the resultant at all locations along the log spiral passes through the COR, and hence does not contribute to the moment equilibrium in Eqn. 6.
Simplifying Eqn. 6 results in
2 3
1
S PH
W L W LP
L

21
0 4 8Dimensionless Depth, Hc/D
0
8
16
24
Max
imum
Dim
ensi
onle
ss F
orce
, NqH
= F
/(H
cDL
)
0
8
16
24
0 4 8 12
Trautmann & O'Rourke (1985) NEES Dry Sand NEES Moist Sand ----- Nonlinear Regression Log Spiral
a) pds = 36 b) pds = 40
c) pds = 44 d) Multiple pds
pds44
pds36
pds40
r2 = 0.75
r2 = 0.87
r2 = 0.87
Figure 3.15. Comparison of Experimental Data with Log Spiral Model Predictions
(7)
A limiting equilibrium analysis is then performed by solving Eqn. 7 for various candidate CORs along the trajectory oriented at with respect to the horizontal, as illustrated in Fig. 3.14b. (Please note that Fig. 3.14c shows moment equilibrium for only one candidate force system with log spiral radius, r1, at the point of tangency between pipe and soil rupture surface.) The process continues until the minimum PH is found.
To test the validity of the log spiral model, 2-D load test data for dry sand from Trautmann and O’Rourke (1985) and 2-D NEES load test data for both dry and partially saturated sand were plotted as dimensionless force, NqH, vs Hc/D for pds = 36, 40, and 44, as shown in Fig. 3.15. The nonlinear regression for the experimental data set are presented as dashed lines. The coefficient of determination, r2, is given for each regression. The dimensionless force vs Hc/D for each pds was calculated with the log spiral model and plotted as a solid line for each of the data sets. A plot comparing all curves determined with the log spiral model and nonlinear regressions is presented in Fig.3.15.
As can be seen from the plots, there is excellent agreement between the NqH vs Hc/D relationships for the log spiral model and the best fit plots for the experimental data at all pds. In all cases the experimental data provide a dimensionless force for a given Hc/D within 0 – 9 % of that predicted by the log spiral model for 2 ≤ Hc/D ≤10.
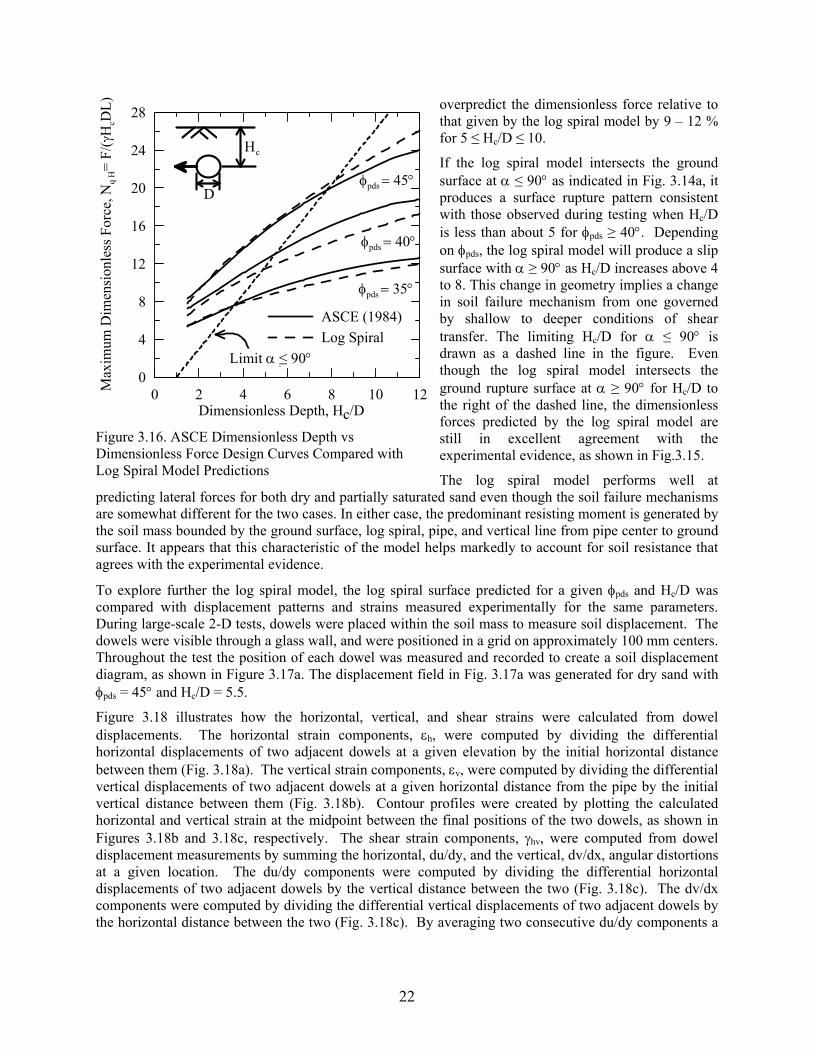
Figure 3.16 compares the dimensionless force vs Hc/D relationships produced by the log spiral model with those given by ASCE (1984). In general, there is good agreement between the two. There are, however, some notable local differences. For example, with pds = 40, the ASCE trend line tends to
22
0 2 4 6 8 10 12Dimensionless Depth, Hc/D
0
4
8
12
16
20
24
28M
axim
um D
imen
sion
less
For
ce, N
q H=
F/(H
cDL
)
ASCE (1984)
Log Spiral
pds 45
pds 40
pds 35
Limit 90
D
Hc
Limit ≤ 90
overpredict the dimensionless force relative to that given by the log spiral model by 9 – 12 % for 5 ≤ Hc/D ≤ 10.
If the log spiral model intersects the ground surface at ≤ 90 as indicated in Fig. 3.14a, it produces a surface rupture pattern consistent with those observed during testing when Hc/D is less than about 5 for pds ≥ 40. Depending on pds, the log spiral model will produce a slip surface with ≥ 90 as Hc/D increases above 4 to 8. This change in geometry implies a change in soil failure mechanism from one governed by shallow to deeper conditions of shear transfer. The limiting Hc/D for ≤ 90 is drawn as a dashed line in the figure. Even though the log spiral model intersects the ground rupture surface at ≥ 90 for Hc/D to the right of the dashed line, the dimensionless forces predicted by the log spiral model are still in excellent agreement with the experimental evidence, as shown in Fig.3.15.
The log spiral model performs well at predicting lateral forces for both dry and partially saturated sand even though the soil failure mechanisms are somewhat different for the two cases. In either case, the predominant resisting moment is generated by the soil mass bounded by the ground surface, log spiral, pipe, and vertical line from pipe center to ground surface. It appears that this characteristic of the model helps markedly to account for soil resistance that agrees with the experimental evidence.
To explore further the log spiral model, the log spiral surface predicted for a given pds and Hc/D was compared with displacement patterns and strains measured experimentally for the same parameters. During large-scale 2-D tests, dowels were placed within the soil mass to measure soil displacement. The dowels were visible through a glass wall, and were positioned in a grid on approximately 100 mm centers. Throughout the test the position of each dowel was measured and recorded to create a soil displacement diagram, as shown in Figure 3.17a. The displacement field in Fig. 3.17a was generated for dry sand with pds = 45 and Hc/D = 5.5.
Figure 3.18 illustrates how the horizontal, vertical, and shear strains were calculated from dowel displacements. The horizontal strain components, h, were computed by dividing the differential horizontal displacements of two adjacent dowels at a given elevation by the initial horizontal distance between them (Fig. 3.18a). The vertical strain components, v, were computed by dividing the differential vertical displacements of two adjacent dowels at a given horizontal distance from the pipe by the initial vertical distance between them (Fig. 3.18b). Contour profiles were created by plotting the calculated horizontal and vertical strain at the midpoint between the final positions of the two dowels, as shown in Figures 3.18b and 3.18c, respectively. The shear strain components, hv, were computed from dowel displacement measurements by summing the horizontal, du/dy, and the vertical, dv/dx, angular distortions at a given location. The du/dy components were computed by dividing the differential horizontal displacements of two adjacent dowels by the vertical distance between the two (Fig. 3.18c). The dv/dx components were computed by dividing the differential vertical displacements of two adjacent dowels by the horizontal distance between the two (Fig. 3.18c). By averaging two consecutive du/dy components a
Figure 3.16. ASCE Dimensionless Depth vs Dimensionless Force Design Curves Compared with Log Spiral Model Predictions
23
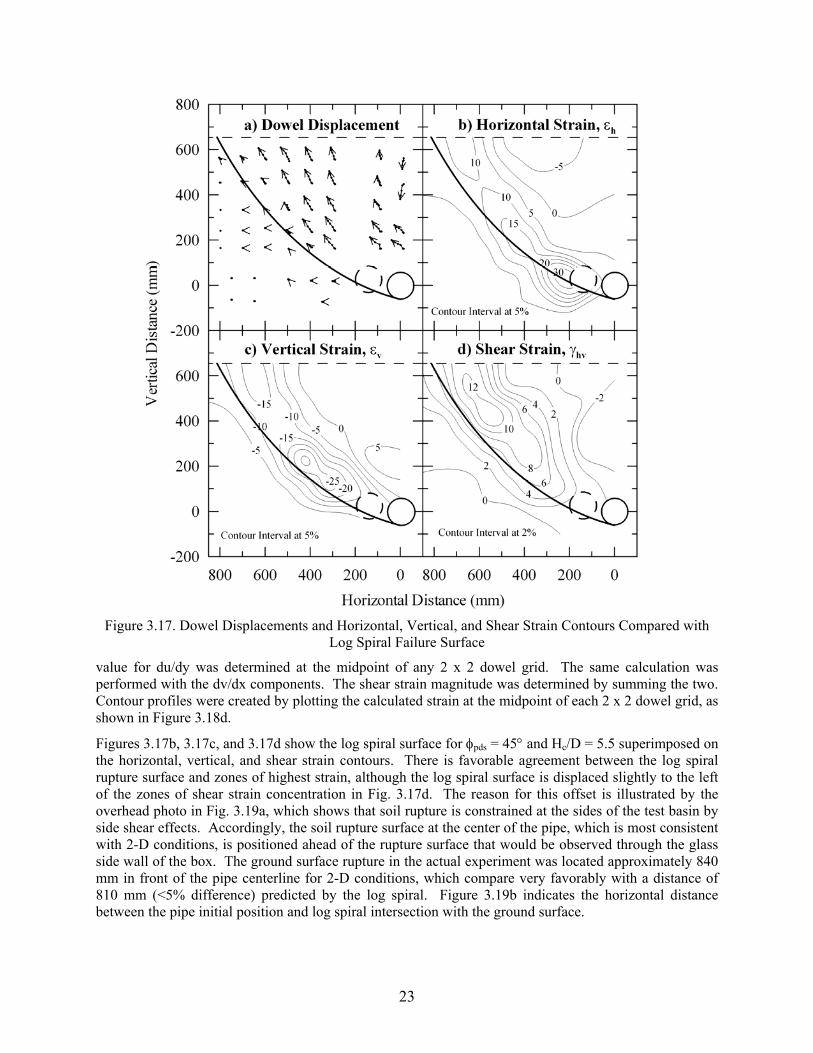
Figure 3.17. Dowel Displacements and Horizontal, Vertical, and Shear Strain Contours Compared with Log Spiral Failure Surface
value for du/dy was determined at the midpoint of any 2 x 2 dowel grid. The same calculation was performed with the dv/dx components. The shear strain magnitude was determined by summing the two. Contour profiles were created by plotting the calculated strain at the midpoint of each 2 x 2 dowel grid, as shown in Figure 3.18d.
Figures 3.17b, 3.17c, and 3.17d show the log spiral surface for pds = 45 and Hc/D = 5.5 superimposed on the horizontal, vertical, and shear strain contours. There is favorable agreement between the log spiral rupture surface and zones of highest strain, although the log spiral surface is displaced slightly to the left of the zones of shear strain concentration in Fig. 3.17d. The reason for this offset is illustrated by the overhead photo in Fig. 3.19a, which shows that soil rupture is constrained at the sides of the test basin by side shear effects. Accordingly, the soil rupture surface at the center of the pipe, which is most consistent with 2-D conditions, is positioned ahead of the rupture surface that would be observed through the glass side wall of the box. The ground surface rupture in the actual experiment was located approximately 840 mm in front of the pipe centerline for 2-D conditions, which compare very favorably with a distance of 810 mm (<5% difference) predicted by the log spiral. Figure 3.19b indicates the horizontal distance between the pipe initial position and log spiral intersection with the ground surface.

24
dx
dv
dy
duhv
12
12
12L
uu
L
duh
13
13
L
uu
dy
du
12
12
L
vv
dx
dv
13
13
13L
vv
L
dvv
L13
v3u1
v1L12
u2
12
1
3 v3
v2 v1
3
2 1
u3
u2 u1
L13
L12
a) Horizontal Strain
b) Vertical Strain
c) Shear Strain
Figure 3.18. Formulations for Calculating Horizontal, Vertical, and Shear Strain from Dowel
Displacements
Pipe
850 mm
100 mm
a) Surface deformation
810 mm
840 mm
Figure 3.19. Photo of 2-D Test Ground Surface Deformation and Comparison of Shear Strain Contour
with Log Spiral Failure Surface
3.7 Numerical Simulation
Numerical simulation of HDPE pipeline response to ground rupture have been performed with the finite element computer code ABAQUS (2006). A constitutive model for HDPE was developed from the hyperbolic model proposed by Merry and Bray (1997) by formulating the nonlinear stress vs strain relationships according to uniaxial tension test results rather than biaxial membrane test results used in the Merry and Bray model. Strain rate and temperature effects were incorporated in the HDPE model by means of uniaxial tension test results acquired in an environmental chamber to quantify the influence of strain rate and temperature. The pipeline was modeled with ABAQUS PIPE32 elements, and soil interaction with the pipe was modeled by spring-slider elements to represent both lateral and axial force vs displacement relationships in accordance with the experimental results described previously in this paper and the general procedures in the ASCE guidelines (1984). The ABAQUS simulations were performed with 35 pipe elements and 68 spring-slider elements to represent each of the lateral and axial force vs displacement relationships.
Figure 3.20 compares the axial and bending strains obtained from both a large-scale test and numerical simulation of soil-HDPE pipeline interaction for 1.22 m of strike-slip displacement at a 65 angle of

25
-5 -4 -3 -2 -1 0 1 2 3 4 5Position, mS (-), N (+)
-4
-2
0
2
4
6
8
10
12
Stra
in (
%)
ABAQUS Bending
ABAQUS Axial
Measured Axial
Measured Bending
Location ofTactile Force Sensors
Split Box
Pipe
N
Split Box
Pipe
N
Figure 3.20. Comparison of Measured and Numerically Simulated Strains for Large-Scale Test of 250 mm HDPE Pipe
pipeline/fault intersection. The axial and bending strains were determined as previously discussed in relation to Fig. 3.7. The results are presented for a 250 mm nominal HDPE pipeline with 272 mm outside diameter and 24.9 mm wall thickness. The figure shows excellent agreement between measured and simulated response for both axial and bending strains. The large-scale axial strains are about 5 to 10% lower than the numerically simulated ones. This difference is primarily due to the tactile force sensors that were covered with a double layer of Teflon to promote reliable soil pressure measurements. The Teflon covering also reduces axial shear forces between the soil and pipe, resulting in slightly lower maximum axial strains and an asymmetric distribution of strain. The favorable comparison between experimental and numerical results demonstrates that reliable models have been developed and are available for evaluating visco-elastic pipeline performance under extreme deformation conditions.
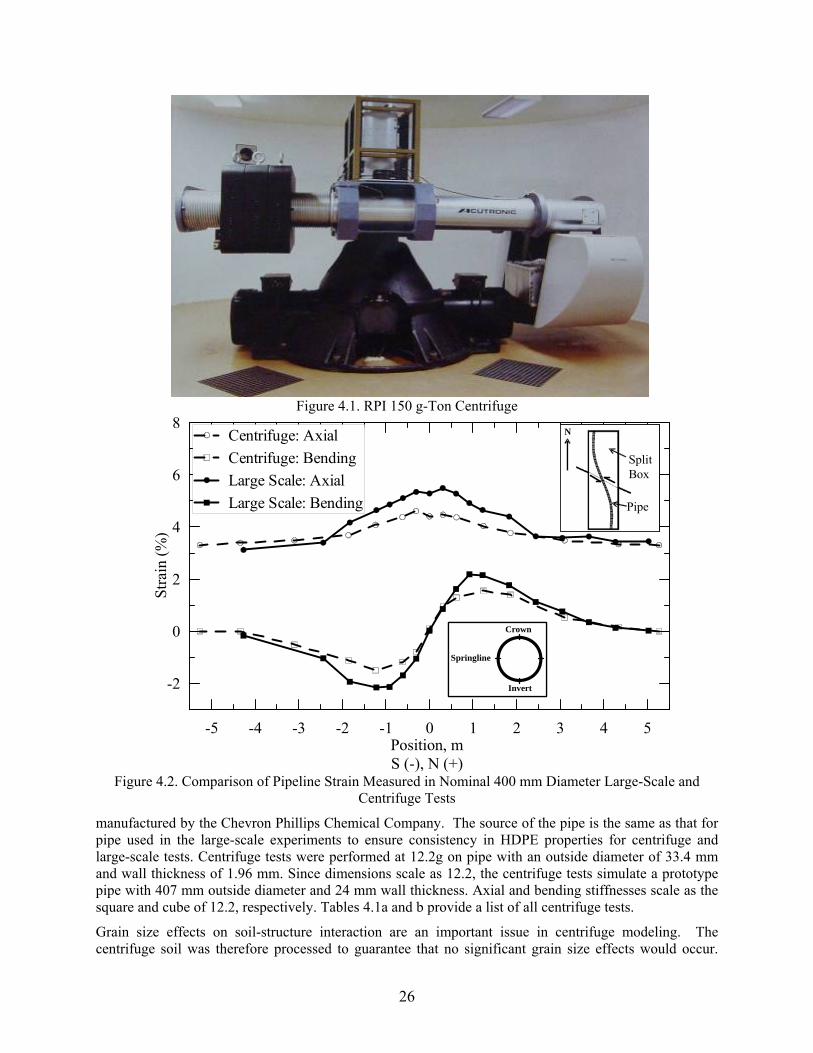
4. CENTRIFUGE TESTING
Split-box testing at the NEES equipment sites has been designed as an integrated program of experiments with the large-scale test facility at Cornell University and the 150 g-ton centrifuge at RPI. Fig. 4.1 shows a photo of the centrifuge. Large-scale testing provides an accurate representation of both the soil and pipeline in the vicinity of ground rupture where it is most important to duplicate pipe and soil material behavior and the intricacies of soil-pipeline interaction. The size of the test facility, however, is constrained by the practicalities of large-scale test box construction, soil placement, and actuator load capacity. The RPI facility provides an excellent complement. Through multi-g scaling, larger prototype dimensions and rates of loading can be tested. Soil-structure interaction can be evaluated in considerable detail, although not to the same degree as is possible with the large-scale facility.
Centrifuge test results obtained with a special split box designed for in-flight ground rupture have been described in other publications (O’Rourke et al., 2003 and 2005; Ha et al., 2008a and 2008b), and only select results are described in this paper. The centrifuge tests were conducted with HDPE pipe
26
Figure 4.1. RPI 150 g-Ton Centrifuge
-5 -4 -3 -2 -1 0 1 2 3 4 5Position, mS (-), N (+)
-2
0
2
4
6
8
Stra
in (
%)
Centrifuge: Axial
Centrifuge: Bending
Large Scale: Axial
Large Scale: Bending
Split Box
Pipe
N
Split Box
Pipe
N
Crown
Springline
Invert
Crown
Springline
Invert
Figure 4.2. Comparison of Pipeline Strain Measured in Nominal 400 mm Diameter Large-Scale and
Centrifuge Tests
manufactured by the Chevron Phillips Chemical Company. The source of the pipe is the same as that for pipe used in the large-scale experiments to ensure consistency in HDPE properties for centrifuge and large-scale tests. Centrifuge tests were performed at 12.2g on pipe with an outside diameter of 33.4 mm and wall thickness of 1.96 mm. Since dimensions scale as 12.2, the centrifuge tests simulate a prototype pipe with 407 mm outside diameter and 24 mm wall thickness. Axial and bending stiffnesses scale as the square and cube of 12.2, respectively. Tables 4.1a and b provide a list of all centrifuge tests.
Grain size effects on soil-structure interaction are an important issue in centrifuge modeling. The centrifuge soil was therefore processed to guarantee that no significant grain size effects would occur.

27
The soil was prepared from the same glacio-fluvial sand that was described previously for the large-scale tests. As described earlier, that sand was sieved to produce a grain size distribution suitable for centrifuge testing. Soil passing the #40 sieve (0.42 mm), but retained on the #200 sieve (0.075 mm) was used. The sieving process resulted in a uniform, subangular to subrounded sand with a mean grain size diameter of D50 = 0.29 mm. Hence, the pipe outside diameter to average grain size ratio was 115, which satisfies the criterion that such a ratio exceed 48 recommended by the International Technical Committee TC2 (2005).
Table 4.1a List of Centrifuge Tests using Strain Gages
Test Number
Instrumentation Type
WC (%)
(or ) (degree)
Offset Rate (m/min)
H (m)
D (m)
H/D
1 Strain Gages 4 ~ 4.5 -85 0.318 1.12 0.41 2.8 3 Strain Gages 4 ~ 4.5 -63.5 0.318 1.12 0.41 2.8 5 Strain Gages 4 ~ 4.5 60 0.318 1.12 0.41 2.8 7 Strain Gages 4 ~ 4.5 -90 () 0.318 1.12 0.41 2.8 9 Strain Gages 4 ~ 4.5 -63.5 41.3 1.12 0.41 2.8 11 Strain Gages 0 -63.5 0.318 1.12 0.41 2.8 13 Strain Gages 3.5 ~ 4.0 -63.5 0.318 2.40 0.41 6.0 15 Strain Gages 3.5 ~ 4.0 -63.5 0.318 1.12 0.19 5.9
Table 4.1b List of Centrifuge Tests using Tekscan tactile force sensors
Test Number
Instrumentation Type
WC (%)
(or ) (degree)
Offset Rate (m/min)
H (m)
D (m)
H/D
2 Tactile 4 ~ 4.5 -85 0.318 1.12 0.41 2.8 4 Tactile 4 ~ 4.5 -63.5 0.318 1.12 0.41 2.8 6 Tactile 4 ~ 4.5 60 0.318 1.12 0.41 2.8 8 Tactile 4 ~ 4.5 -90 () 0.318 1.12 0.41 2.8
10 Tactile 4 ~ 4.5 -63.5 41.3 1.12 0.41 2.8 12 Tactile 0 -63.5 0.318 1.12 0.41 2.8 14 Tactile 3.5 ~ 4.0 -63.5 0.318 2.40 0.41 6.0 16 Tactile 3.5 ~ 4.0 -63.5 0.318 1.12 0.19 5.9
Extensive direct shear tests of both the large-scale and centrifuge sands were performed at w = 4 % to develop relationships of pds vs d for both sands. A dry unit weight, d, was then selected for the large-scale and centrifuge tests at which pds = 40. This selection process ensured that sand composition and pds for both the large-scale and centrifuge tests would promote behavior that was nearly identical for both types of test.
Figure 4.2 compares the measured axial and bending strains along a nominal 400 mm HDPE pipeline tested at large-scale and in the centrifuge. As described above the prototype diameter and wall thickness of the centrifuge pipe were identical to those of the large-scale pipe. The centrifuge angle of pipeline/fault intersection was 63.5 compared with 65 for the large-scale test, and the total prototype length of the centrifuge pipeline was 15.6 m compared to 10.7 m for the large-scale pipeline, measured within the interior dimensions of the split boxes. The strains shown in Fig. 4.2 are for 1.06 m of strike slip displacement. These test results represent the first time ever that data have been acquired and compared at full- and centrifuge-scale for virtually identical conditions of soil properties, geometry of structure, and structural material properties. The figure shows favorable comparison between large-scale and centrifuge strains. The axial strains for the large-scale test are about 15% larger than those for the centrifuge test. Since the unanchored length of the large scale test is smaller than the centrifuge prototype length, larger strains of about this percentage difference would be expected. The bending strains for the large-scale test are higher than those for the centrifuge test at the locations of maximum flexure either side of the fault, but in close agreement at other locations.

28
Thirty-two centrifuge tests have been performed to date on various diameters of HDPE and steel pipe. Data produced includes strain gage readings, load cell readings, actuator load data and tactile force sensor readings. The strain gage results from all centrifuge tests with the corresponding photos and video taken of test setup, preparation, and during the tests were uploaded to NEES Central Repository. The RPI team is working with NEESit to upload the remaining centrifuge tests that include tactile force sensor data which are not supported by NEES Central Repository
5. SCIENCENTER OUTREACH
5.1 Objectives and Audience
The three principal goals for the Sciencenter outreach project were to: 1) attract, engage, and inspire the public to learn more about earthquakes, earthquake engineering, and earthquake impacts on the built environment – including both buried and above-ground structures, 2) highlight for children and the general public the possibilities for remote, experimental science and engineering using the Internet, and 3) promote the capabilities and research accomplishments of CU (experimental work on buried pipeline systems), RPI (centrifuge testing), and the NEES program (national distributed laboratory network).
Working in close collaboration with CU and RPI, the Sciencenter has created a museum exhibition to engage the public about science and engineering of earthquakes and how engineers at NEES sites study earthquake effects using networked experimental facilities. The target audience includes: 1) families with children ages 3-14 at science museums, 2) remote Internet users of all ages, and 3) underserved teens with few opportunities to engage with science and engineering. To reach a diverse audience, the Sciencenter trains teen museum guides from underserved backgrounds on how to use and explain the exhibition to the public, making use of the Sciencenter’s existing Teen Docents Program.
Overall, it is estimated that 600,000 museum and web visitors will use the exhibition over a 4-year period. Museum attendance is over 90,000 visitors per year. It is anticipated that several hundred visits to the exhibition website will occur each day.
5.2 Museum Exhibition
This project reaches visitors at the museum (Figure 5.1) and at the exhibition website. Website users will be able to conduct tests remotely on a shake table and view the results. They can learn more by watching the five videos developed for this exhibition, and following links to learn more about NEES and earthquake engineering.
The exhibition is about an important topic with a lot of fascinating engineering and science. One of the most challenging aspects in developing the exhibition was to ensure that it is appealing and interesting to visitors, inspiring them to learn more. An experienced graphic designer and a video producer worked with project staff to develop products that were appealing to both children and parents. This effort has been successful because these exhibits are receiving a lot of notice and use by museum visitors.

29
Figure 5.1 Overview of Exhibition (before posters were added)
The exhibition includes five components: 1) Entrance area with photo images and graphics on four crooked cinderblock walls, that set the stage for the exhibition and inform visitors about its central ideas. 2) Kiosk with interactive multimedia DVD primer on seismic damage, causes of earthquakes, earthquake engineering and research, with emphasis on NEES and Cornell/RPI research. 3) Remote non-destructive shake test of a model building with structural frame that is accessible at the museum and on a continuing basis via the Internet. This interactive exhibit, with computer kiosk and shake table, forms the centerpiece of the exhibition. It allows on-site or remote users to perform a real-time, non-destructive shake test on a 1.5-m-tall model building. Users can set parameters (e.g., select an earthquake and epicentral distance) and perform a remote shaking test, watching the results on a webcam. The tests take about 40 s. They help those interacting with the exhibition to experience remote testing and thus provide a better appreciation for remote tests at NEES facilities. The website includes links for viewing or downloading the five videos, and links for more information about earthquakes and engineering. 4) Shake table with building blocks and reinforcing rods, where museum visitors can create simple block structures and test them. 5) Earthquakes around the world. a live map of recent earthquakes (from IRIS) helps visitors appreciate how earthquakes and earth science affect our lives.
Each component is described briefly under the following subheadings:
Entrance Area and Graphics. The exhibition logo is shown in Figure 5.2. Posters, such as the one shown in Figure 5.3, are mounted on four walls and provide written information and photos about earthquake damage and engineering. Three-dimensional panels, 200 mm thick, which look like cracked masonry walls, form the backdrop for the exhibition. The vacuum-formed plastic wall panels are realistic in appearance, and help to attract visitors and engage them in the exhibition.

30
Figure 5.2.Exhibition Logo
Three walls have posters on them:1) “Earthquake Damage” includes examples of damage to buildings, pipelines, and transportation structures, as well as examples of engineering solutions; 2) “Earthquake Engineers Work Right Nearby” highlights the large-scale earthquake engineering testing performed at Cornell University and RPI; and 3) “Exciting Earthquake Experiments” highlights the NEES network and work on soils, pipelines and structures, as well as explaining briefly about computer modeling.
Figure 5.3 Poster About NEES Network and Experiments

31
In addition, one wall has a bulletin board for “Earthquake Headlines from Around the World,” featuring recent newspaper clippings. Another wall has the detailed USGS map “This Dynamic Planet” that highlights the tectonic plates.
Videos. The five videos have been on display at the Sciencenter in an intimate, attractive theater/seating area, shown in Figure 5.4, for over a year. The videos are each about 1 ½ minutes long, which is long enough to cover key messages, yet short enough so that children will stay and watch. They are close-captioned.
A push-button control panel lets visitors choose among the five clips which highlight the key aspects of 1) damage caused by earthquakes to structures and underground pipelines, 2) the underlying causes of earthquakes, 3) how earthquake engineers are working to make our built world safer, 4) lifelines research being conducted by CU and RPI, and 5) the NEES network and research.
The scripts for each video are available to view or download from the exhibition website as PDFs. The earthquake location, date and magnitude are given along with credits for both still photographs of earthquake damage and commercial stock footage taken during and after earthquakes. For the video footage of NEES earthquake experiments and interviews, the equipment site and type of test are listed.
The exhibition website has a video page (www.sciencenter.org/earthquake/video_clips.asp) that has the five videos available in Quicktime format in both low resolution for live viewing and higher resolution suitable for downloading and showing on a video projector in a classroom or other venue. Copies of the videos have also been distributed to NSF, NEESinc, Cornell and RPI. They are available for viewing at the Cornell NEES web site.
Video footage secured from commercial video libraries shows live earthquake effects. The Earthquake Engineering Research Institute (EERI) has a large photo library with still photos of earthquake damage around the world, which has been a source of images for the project. Animated graphics explain in general terms the underlying causes of earthquakes. Interviews with engineers show how they conduct tests and model the behavior of structures affected by earthquakes. Video clips of Cornell and RPI tests provide graphic examples of how engineers conduct research. Time-lapse videos show the setup and testing. A large-scale pipeline test at Cornell was filmed, and researchers were interviewed on camera. RPI has provided close-up video footage of a centrifuge test of a pipeline in a split box, and of the centrifuge spinning. Footage was acquired from many of the NEES sites to highlight various aspects of the testing, simulation, and collaboration among the NEES researchers. The videos include footage of men and women of diverse national and racial origins, both young and old, engaged in earthquake engineering. There are interviews with engineers and researchers distributed throughout the videos. The videos each include a credit screen with logos for the NSF, NEES, CU, RPI, and EERI.
The earthquake videos have won three national awards:
Davey Award (silver)
Millenium Award (bronze)
Chicago Film Festival Award (Certificate of Merit)
Remote Shake Table and Web Site. The shake table and its housing, shown in Figure 5.5, have been on display at the Sciencenter since August 2008. Museum visitors, both children and adults, stay and conduct multiple tests.

32
Figure 5.4. Exhibition Video Kiosk (left) and Family Group Watching an Exhibit Video (right)
Figure 5.5. Quanser Shake Table and Building Model in Use (left) and Closeup of Graphics and Model Building (right)

33
The exhibition website, www.sciencenter.org/earthquake, will allow remote users to run shake table tests starting in March 2009. The software has been developed and tested, and the equipment is in place; a final software issue is being resolved. A dedicated computer receives information from remote and local users, and creates a job que as users submit shake tests to run. When ready to start a test, the web server sends the shake-table computer instructions. A 1.5-m-tall model building built by Cornell has been set up on the table for testing. Remote users can watch their tests live with a streaming video camera focused on the shake-table. As the shake-table test takes place, the shake-table computer saves the time-dependent displacement records of the building and ground, which are sent to the web server that, in turn, provides remote and local users with a graph of the movements.
The computer-controlled shake table was obtained from Quanser Consulting, Inc. (Markham, Ontario, Canada). Quanser Consulting previously developed computer-controlled shake tables for teaching purposes for the UCIST project (University Consortium for Instructional Shake Tables) in 2000. The table uses their recently-developed “exhibit version” Shaker 1.5 which has a simple interface for educational outreach purposes. A professional LabView programmer made significant changes to the LabView software provided by Quanser to enable it to be used in this web-based application. That software resides on a dedicated computer that has the necessary hardware to run the Quanser table.
Working with Cornell researchers, four different ground motion time records were selected for simulation with the Quanser shake table. The earthquakes represented are 1941 Imperial Valley, 1992 Landers, 1994 Northridge, and 1995 Kobe earthquakes. The basic software supplied with the table allows a user to select one of the four different quakes, distance from the epicenter, and rock or soil type.
Exhibit users can choose 1) one of four earthquakes (Kobe, El Centro, Landers, or Northridge), 2) distance from the epicenter of the earthquake, between 0 and 100 km, and 3) type of ground under the building (bedrock, clay soil, or sandy soil). Museum visitors at the Sciencenter will also be able to conduct shake-table tests. If the job queue is empty (tests submitted by remote users are all completed) the test will run immediately; if a test by a remote user is running, the local test will be placed next in the queue, and the museum visitors can watch the current test; the program will inform them when their job is about to start.
The Sciencenter has added a separate, dedicated cable line for Internet access for this project, and necessary hardware for this computer network and associated firewall; this is separate from the connection and network used by Sciencenter staff, to ensure that users will find the website to work well and quickly.
From the exhibition web site, visitors can watch the videos, follow links to NEES, Cornell and RPI project websites, and click on a link to “learn more” with linkages to other websites about earthquakes and about earthquake engineering, that provide information and tutorials for children, parents and educators. A credits page acknowledges all the many partners in this project.
Shake table with blocks and reinforcing rods. This part of the exhibit, shown in Figure 5.6, has been on the museum floor for a year. It provides hands-on interaction with children and parents, who build simple wooden block structures, with and without reinforcements, and test then on a 45 cm2 platform that is cranked by and forth by the users with a 1cm travel. Visitors can start and stop the shaking, and also choose the shake frequency. The activity is inherently engaging, and groups will stay a long time and try a number of different building designs. From visitor conversations it is clear that they connect what they saw in the videos with their experiments at this hands-on exhibit, including conversations about safety and building design.

34
Figure 5.6. Shake Table with Blocks and Reinforcing Rods.
Earthquakes around the World: The live map of recent earthquakes (from IRIS) helps visitors appreciate how earthquakes and earth science affect our lives.
Credits: The project team has significantly enhanced the exhibition, website and videos with substantial effort by Sciencenter volunteers and pro-bono work on the part of the video producers and web site programmers. Their efforts and contributions are gratefully acknowledged.
Future plans: The Sciencenter seeks to expand this project, and secure funds to develop a traveling exhibition on earthquakes and engineering. The need is three-fold: first is to educate the general public on earthquakes and their causes; second, to educate the public about what engineers do by seeing real, diverse engineers working on very important issues that affect our safety and infrastructure, and inspire more young children to consider careers in engineering; third for NEES to share with the general public the equipment and research that NEES has been engaged in.
A traveling exhibition would reach a broader audience. Traveling exhibitions typically are hosted by three different museums each year, for 4 months at each site. They would typically reach between 50,000 to 150,000 visitors per year. The Sciencenter has to date developed six different traveling exhibitions on math, engineering, nanotechnology and other topics. The Sciencenter is also managing the tours for a number of other exhibitions developed by smaller museums. Based on experience with touring exhibitions, ScienCenter personnel are convinced that there is strong interest in the museum community to host such an exhibition on earthquakes and earthquake engineering.
6. REFERENCES
ABAQUS Version 6.4.2, (2004). ABAQUS, Inc., Providence, RI.
ABAQUS (2006). “User’s manual.” ABAQUS, Inc., Providence, RI.
ASCE (1984), "Guidelines for the Seismic Design of Oil and Gas Pipeline Systems",Committee on Gas and Liquid Fuel Lifelines, American Society of Civil Engineering, Reston, VA.
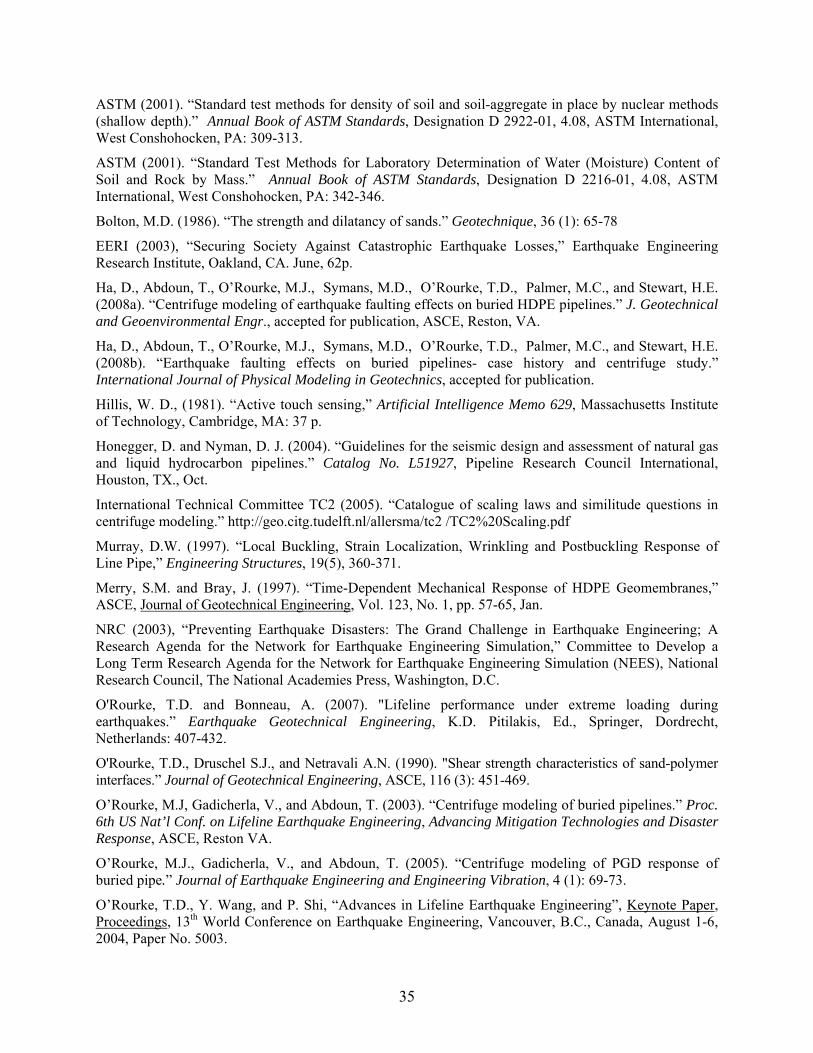
35
ASTM (2001). “Standard test methods for density of soil and soil-aggregate in place by nuclear methods (shallow depth).” Annual Book of ASTM Standards, Designation D 2922-01, 4.08, ASTM International, West Conshohocken, PA: 309-313.
ASTM (2001). “Standard Test Methods for Laboratory Determination of Water (Moisture) Content of Soil and Rock by Mass.” Annual Book of ASTM Standards, Designation D 2216-01, 4.08, ASTM International, West Conshohocken, PA: 342-346.
Bolton, M.D. (1986). “The strength and dilatancy of sands.” Geotechnique, 36 (1): 65-78
EERI (2003), “Securing Society Against Catastrophic Earthquake Losses,” Earthquake Engineering Research Institute, Oakland, CA. June, 62p.
Ha, D., Abdoun, T., O’Rourke, M.J., Symans, M.D., O’Rourke, T.D., Palmer, M.C., and Stewart, H.E. (2008a). “Centrifuge modeling of earthquake faulting effects on buried HDPE pipelines.” J. Geotechnical and Geoenvironmental Engr., accepted for publication, ASCE, Reston, VA.
Ha, D., Abdoun, T., O’Rourke, M.J., Symans, M.D., O’Rourke, T.D., Palmer, M.C., and Stewart, H.E. (2008b). “Earthquake faulting effects on buried pipelines- case history and centrifuge study.” International Journal of Physical Modeling in Geotechnics, accepted for publication.
Hillis, W. D., (1981). “Active touch sensing,” Artificial Intelligence Memo 629, Massachusetts Institute of Technology, Cambridge, MA: 37 p.
Honegger, D. and Nyman, D. J. (2004). “Guidelines for the seismic design and assessment of natural gas and liquid hydrocarbon pipelines.” Catalog No. L51927, Pipeline Research Council International, Houston, TX., Oct.
International Technical Committee TC2 (2005). “Catalogue of scaling laws and similitude questions in centrifuge modeling.” http://geo.citg.tudelft.nl/allersma/tc2 /TC2%20Scaling.pdf
Murray, D.W. (1997). “Local Buckling, Strain Localization, Wrinkling and Postbuckling Response of Line Pipe,” Engineering Structures, 19(5), 360-371.
Merry, S.M. and Bray, J. (1997). “Time-Dependent Mechanical Response of HDPE Geomembranes,” ASCE, Journal of Geotechnical Engineering, Vol. 123, No. 1, pp. 57-65, Jan.
NRC (2003), “Preventing Earthquake Disasters: The Grand Challenge in Earthquake Engineering; A Research Agenda for the Network for Earthquake Engineering Simulation,” Committee to Develop a Long Term Research Agenda for the Network for Earthquake Engineering Simulation (NEES), National Research Council, The National Academies Press, Washington, D.C.
O'Rourke, T.D. and Bonneau, A. (2007). "Lifeline performance under extreme loading during earthquakes.” Earthquake Geotechnical Engineering, K.D. Pitilakis, Ed., Springer, Dordrecht, Netherlands: 407-432.
O'Rourke, T.D., Druschel S.J., and Netravali A.N. (1990). "Shear strength characteristics of sand-polymer interfaces.” Journal of Geotechnical Engineering, ASCE, 116 (3): 451-469.
O’Rourke, M.J, Gadicherla, V., and Abdoun, T. (2003). “Centrifuge modeling of buried pipelines.” Proc. 6th US Nat’l Conf. on Lifeline Earthquake Engineering, Advancing Mitigation Technologies and Disaster Response, ASCE, Reston VA.
O’Rourke, M.J., Gadicherla, V., and Abdoun, T. (2005). “Centrifuge modeling of PGD response of buried pipe.” Journal of Earthquake Engineering and Engineering Vibration, 4 (1): 69-73.
O’Rourke, T.D., Y. Wang, and P. Shi, “Advances in Lifeline Earthquake Engineering”, Keynote Paper, Proceedings, 13th World Conference on Earthquake Engineering, Vancouver, B.C., Canada, August 1-6, 2004, Paper No. 5003.

36
Naval Facilities Engineering Command (1982). "Soil mechanics design manual." NAVFAC DM-7, Department of Navy, Alexandria, VA.
Paikowsky, S.G. and Hajduk, E.L. (1997). “Calibration and use of grid-based tactile pressure sensors in granular material.” Geotechnical Testing Journal, ASTM, 20 (2) : 218-241.
Purbrick, J. A., (1981). “A force transducer employing conductive silicone rubber.” First Robotic Vision and Sensors Conference, Stratford-on-Avon, UK.
Takada, S., Hassani, N. and Fukuda, K. (2001). “A New Proposal for Simplified Design of Buried Steel Pipes Crossing Active Faults,” Earthquake Engineering and Structural Dynamics, 30(8), 1243-1257.
Tekscan (2003). “Tekscan i-scan equilibration and calibration practical suggestions.” Tekscan, Inc, South Boston, MA.
Terzaghi K. (1943). “Theoretical soil mechanics.” John Wiley and Sons, Inc., New York, NY: 510 p.
Trautmann, C.H., Kulhawy, F.H. and O'Rourke, T.D. (1985). "Sand density measurements for laboratory studies." Geotechnical Testing Journal, ASTM, 6(4): 159-165.
Trautmann, C.H. and T.D. O'Rourke (1985), "Lateral Force-Displacement Response of Buried Pipe," Journal of Geotechnical Engineering, ASCE, Vol. 111, No. 9, Sept., pp. 1068-1084
Turner, J.E. (2004). “Lateral Loading of Pipe in Dry and Partially Saturated Sand,” MS Thesis, Cornell University, May 2004.
Yimsiri, S., Soga, K., Yoshizaki, K., Dasari, G. and O’Rourke, T.D. (2004). “Lateral and Upward Soil-Pipeline Interactions in Sand for Deep Embedment Conditions,” J. of Geotechnical and Geoenvironmental Engineering, 130(8), 830-842.

37
2. Describe the major findings resulting from these activities
The goal of the project is to produce a seminal outcome through state-of-the-art modeling and quantification of earthquake-induced ground movement effects on lifelines. The project will also improve the design and construction of lifelines affected by landslides, mining, extraction of subsurface fluids, and underground construction. The research deliverables include, as a minimum: 1) systematic assessment of lifeline performance under permanent ground deformation, 2) quantification of serviceability and ultimate limit states for critical lifelines, 3) design guidelines, 4) experimental databases for benchmarking future numerical models and guiding the evolution of numerical simulations for soil-structure interaction, and 5) validation and guidance for advanced materials as well as sensor and robotics deployment in underground conduits.
There are many significant accomplishments:
1. A comprehensive suite of laboratory tests has been completed to characterize the shear strength of sand at a variety of dry unit weights, grain size characteristics, and water contents. These tests provide data of fundamental importance for relating shear strength in partially saturated sand to water content, dry unit weight, and median grain size.
2. A process has been developed for establishing similitude in shear strength and stiffness characteristics of sand used in large-scale testing with sand used in centrifuge tests. The methodology involves screening well-graded sand for large-scale tests to obtain derivative uniform sand for centrifuge tests, and then selecting the appropriate dry unit weight at a specific water content for each of the large-scale and centrifuge soils to achieve the same peak shear strength and similar stress-deformation behavior. This is the first time that such a process has been developed.
3. The special split-box apparatus for centrifuge experiments to characterize ground rupture effects on pipelines has been successfully tested and its performance validated. Centrifuge tests have been designed to use partially saturated sand with the same strength and deformation characteristics as those associated with full-scale tests. Moreover, the centrifuge tests use HDPE pipe, appropriately scaled, with the same properties as its full-scale counterpart. The NEES experimental results represent the first time ever that data have been acquired and compared at full- and centrifuge-scale for virtually identical conditions of soil properties, geometry of structure, and structural material properties. A side by side comparison shows favorable agreement between large-scale and centrifuge strains.
4. The large-scale ground rupture experiments involve the largest laboratory tests ever performed on pipeline response to ground deformation. Over one hundred tons of soil were sheared and ruptured, displacing 1.2 m (4 ft) at the center of 150 – 400-mm-diameter pipelines composed of HDPE and steel. Combined testing at CU and RPI provides information essential for design and construction in response to earthquakes, floods, landslides, large deformation induced by tunneling and deep excavations, and subsidence caused by severe dewatering or withdrawal of minerals and fluids during mining and oil production. Similar tests were performed on 270 mm HDPE and on 150 mm steel pipe to allow study of the effect of the ratio between pipe depth and pipe diameter on pipeline behavior during ground rupture.
5. Large scale tests with centrifuge experiments at RPI, using its 150 g-ton NEES facility to perform identical experiments at 1/12th scale, provide fundamentally important information about modeling complex soil-structure interactions at both full size and reduced scale. They provide data about physical testing at multiple scales to understand complex loading effects, polymer product performance, and the intricacies of soil-pipe interaction under large plastic, irrecoverable deformation of both the soil and piping.
38
6. Tactile force sensors have been successfully deployed in both the full scale tests and in the centrifuge and demonstrate an emerging technology that is able to measure soil-structure interaction stresses for various shapes under conditions of both small and large deformation. Tactile force sensors were used successfully to measure soil pressure distribution on pipes in both the centrifuge and large-scale test facility during ground rupture. Reliable large-scale measurements were accomplished by covering the sensor with a protective double layer of Teflon sheets to isolate the sensor from soil shear effects. Because tactile force sensors can measure soil pressures on structures with curved surfaces, such as pipelines and piles, they are exceptionally versatile and provide for break-through capabilities unavailable with previous sensor technologies.
7. Laser profiling and robotics technology has been successfully demonstrated in the large-scale tests for accurately measuring changes in the cross-sectional shape of pipelines. Data acquired with these devices provide a comprehensive picture of three-dimensional pipeline deformation, which is critically important for validating the next generation of 3-D soil-structure interaction models for numerical simulation of underground pipeline performance.
8. The use of highly ductile HDPE pipelines to accommodate severe deformation associated with earthquake-induced ground rupture has been successfully demonstrated. Such pipelines represent an important class of conduits with high ductility and the capacity to stretch and deform without rupture under extreme loading conditions. The test not only demonstrates the ability of such pipelines to accommodate severe movement, but provides important data about strain concentrations, changes in shape, and soil-structure interaction – all of which will improve analytical models to evaluate polyethylene piping and its performance during extreme events.
9. A log spiral model was developed to account analytically for maximum horizontal pipe force due to relative soil-pipe displacement as a function of depth to pipe diameter ratio and peak direct shear soil friction angle. Excellent agreement is shown between the log spiral predictions and full-scale test data when maximum horizontal force is expressed in dimensionless terms as a function of depth to pipe diameter ratio and peak direct shear angle of soil friction. Moreover, the ground rupture surface predicted by the log spiral model compares favorably with the location of concentrated soil strain during large-scale 2-D tests.
10. The strains resulting from numerical modeling of soil-HDPE pipeline interaction during strike-slip ground rupture are shown to be in excellent agreement with those measured in large-scale tests. The favorable comparison between experimental and numerical results demonstrates that reliable models have been developed and are available for evaluating pipeline performance under extreme loading conditions.
3. Describe the opportunities for training and development provided by your project
Many opportunities for training and development were available through this project. Each semester, undergraduates (UG) participated in research projects associated with NEESR research through a program sponsored by the Cornell College of Engineering. In addition, Cornell faculty members on NEESR research are actively soliciting UGs to engage in NEESR-related research as part of their curriculum. Cornell CEE allows BS-degree credits to be earned for UG research projects.
During Summer 2005, 2006, 2007 and 2008, over 18 UGs were engaged in research activities at the Cornell NEES facility. Approximately one-third of these students were women and URMs. Similar engagement of UGs has been pursued at RPI. Both Cornell and RPI support 4 graduate students through the NEESR research.

39
The Cornell NEES equipment site is used for lab demonstrations and advanced engineering presentations in freshman orientation courses at Cornell, and as part of CEE Introductory Civil Engineering courses. Similar UG involvement has been implemented at RPI.
4. Describe outreach activities your project has undertaken
The project involves an innovative outreach program with the Sciencenter of Ithaca, NY. The project team has developed a 300-SF museum exhibition on earthquake engineering that explains how engineers at NEES sites study earthquake effects using networked experimental facilities. An interactive shake table that can be controlled by anyone on the Internet will allow museum visitors, school classes, and home users to participate in earthquake engineering experiments, reaching an estimated 600,000 individuals over four years. The project serves as a model for how other NEES sites can link with 350 science museums and centers throughout the U.S.
The project involves substantial collaboration with industry, including Consolidated Edison Company of New York, Corning, Inc., Exxon Mobil, Inc., Gas Technology Institute, Insituform Technologies, Los Angeles Department of Water and Power, San Francisco Public Utilities Commission, Tekscan, Inc., Tokyo Gas Co., Ltd., ULC Robotics, Inc., Vari-Tech LLC. Hence, the research results are guided by industry for maximum impact in practice, continuing education of the U.S. work force, and nationwide dissemination in infrastructure projects.
The project received assistance from Cornell in supporting women and minority summer research experiences for undergraduates, and benefits from a Sciencenter program that supports teenage museum guides from underserved communities.
A workshop and training session was held in July 2006 at Cornell’s NEES facility. The workshop was attended by over 20 researchers from US and international universities, as well as representatives of industry and various research centers. One result of the workshop was the submittal of a successful proposal by the University of Michigan group to perform pipeline tests at the Cornell NEES facility. This work began in June 2008, and the first phase has been successfully completed.
A NEES Webinar, entitled “Ground Rupture Effects on Critical Lifelines”, was given on 9 October 2007. The webinar was hosted by the Earthquake Engineering Research Institute, ASCE Technical Committee on Lifeline Earthquake Engineering, and the Network for Earthquake Engineering Consortium. It focused on practical lessons learned for water supply lifelines from the NEESR-SG research at Cornell and RPI. The webinar was the first to be conducted entirely remotely with Professor Tom O’Rourke presenting on the NEESR-SG research findings at Cornell University at Ithaca, NY, Mr. Brian Sadden, Manager of Engineering Management at the San Francisco Public Utilities Commission (SFPUC) presenting on the SFPUC System Improvement Plan from San Francisco, CA, and Mr. Robert Zirlin, Director of Marketing for Insituform Technologies, Inc, presenting on emerging pipeline technologies from St Louis, MO. The webinar was a success, with over 200 participants during the web casts, and 104 others who downloaded the presentation within the first day after the webinar. The webinar is retrievable at https://nees.webex.com/ec0600l/eventcenter/recording/recordAction.do?theAction=poprecord&recordID=21147332&rnd=7362114359&siteurl=nees&servicename=EC&recordKey=61DC6BE84F5FE240488DBCC947C803908788DE1A75B060106FB830B1EB34B10D&RecordingID=21147332&AT=VR&needFilter=false .
In June 2008 CBS News visited the Cornell NEES facility with a film crew. They filmed a large-scale test and interviewed NEESR-SG researchers on issues related to critical U.S. infrastructure and seismic vulnerability. The filming and interviews will be used as part of a TV documentary to be aired on the The Discovery Channel in Fall, 2008.

40
The Cornell NEES equipment site has been approached to conduct large-scale tests for SFPUC to help evaluate soil-structure interaction of a special protective enclosure being designed for a major transmission pipeline crossing the Hayward Fault. SFPUC has agreed to archive all data with the NEES repository. Contract negotiations are underway, and it is hoped that work will begin in July or August, 2008.

41
PUBLICATIONS AND PRODUCTS
Journal Publications
Yimsiri, S., K. Soga, K. Yoshizaki, G. Dasari, and T.D. O’Rourke, “Lateral and Upward Soil-Pipeline Interactions in Sand for Deep Embedment Conditions”, Journal of Geotech and Geoenvir. Eng., ASCE, Aug., 2004, pp. 830-842.
O’Rourke, M. , Gadicherla, V., and Abdoun, T., (2005), “Centrifuge Modeling of PGD Response of Buried Pipe”, Earthquake Engineering and Engineering Vibration , Vol. 4 , No. 1, pp. 69-73.
Choo, Y.W., Abdoun, T., O’Rourke, M.J., and Ha, D., (2007), Remediation for Buried pipeline Systems Under Permanent Ground Deformation, Soils Dynamics and Earthquake Engineering, Vol. 27, pp. 1043-1055.
O’Rourke, T.D, Jezerski, J.M., Olson, N.A., Bonneau, A.M., Palmer, M.C., Stewart, H.E., O’Rourke, M.J., Abdoun, T., “Geotechnics of Pipeline System Response to Earthquakes,” Keynote Paper, Proceedings, 4th Decennial Geotechnical Earthquake Engineering and Soil Dynamics Conference, Sacramento, CA, May 18-22, 2008.
T. Abdoun, Ha, D., O’Rourke, M. J., Symans, M. D., O’Rourke, T. D., Palmer, M. and Stewart, H. E. (2008), Buried HDPE Pipelines Subjected to Normal Faulting- A Centrifuge Investigation, Canadian Geotechnical Journal (in press).
Ha, D., Abdoun, T., O’Rourke, M. J., Symans, M. D., O’Rourke, T. D., Palmer, M. and Stewart, H. E. (2008), Factors Influencing the Behavior of Buried Pipelines Subjected to Ground Faulting, Soils Dynamics and Earthquake Engineering (in press).
Ha, D., T. Abdoun, M.J. O’Rourke, M.D. Symans, T.D. O’Rourke, M.C. Palmer, and H.E. Stewart, “Centrifuge Modeling of Permanent Ground Deformation Effects on Buried HDPE Pipelines,” Journal of Geotechnical and Geoenvir. Eng., ASCE, (in press).
Ha, D., T. Abdoun, M.J. O’Rourke, M.D. Symans, T.D. O’Rourke, M.C. Palmer, and H.E. Stewart, “Earthquake Faulting Effects on Buried Pipelines – the Case History and Centrifuge Study,” Journal of Physical Modeling, (in press).
Palmer, M.C., O’Rourke, T.D., Olson, N.A., Abdoun, T., Ha, D., O’Rourke, M.J., “Tactile Force Sensors for Soil-Structure Interaction Assessment,” Journal of Geotechnical and Geoenvir. Eng., ASCE, (in press).
Books or Other Non-Periodical, One-Time Publications
O’Rourke, T.D., Y. Wang, and P. Shi, “Advances in Lifeline Earthquake Engineering”, Keynote Paper, Proceedings, 13th World Conference on Earthquake Engineering, Vancouver, B.C., Canada, August 1-6, 2004, Paper No. 5003.
Jones, S.L., K.E. Kesner, T.D. O’Rourke, H.E. Stewart, T. Abdoun, and M.J. O’Rourke, “Soil Structure Interaction Facility for Lifeline Systems”, Proceedings, 13th World Conference on Earthquake Engineering, Vancouver, B.C., Canada, August 1-6, 2004, Paper No. 5003.
Jones, S.L., T.D. O’Rourke, H.E. Stewart, and S.L. Billington, “Large-Displacement Soil-Structure Interaction Facility for Lifeline Systems”, Proc. 6th US Conf. and Workshop on Lifeline Earthquake Eng., J.E. Beavers, Ed., TCLEE Monograph No. 25, Aug. 2003, pp. 936-945.
Ash, D. and T. O’Rourke. “Application of Information Technology with Cornell NEES Lifeline Facility.” Proceedings 8th US National Conference on Earthquake Engineering, San Francisco, CA, April, 2006.

42
Palmer, M.C., T.D. O’Rourke, H.E. Stewart, M.J. O’Rourke, and M. Symans. “Large Displacement Soil-Structure Interaction Test Facility for Lifelines.” Proceedings 8th US National Conference on Earthquake Engineering, San Francisco, CA, April, 2006.
Trautmann, C.H., K. Krafft, T.D. O’Rourke, A. Bonneau and H.E. Stewart. “Science Museum Outreach with NEES Lifeline Test Facility.” Proceedings 8th US National Conference on Earthquake Engineering, San Francisco, CA, April, 2006.
O’Rourke, T.D. and J. Turner. “Earthquake Soil-Pipeline Interaction in Partially Saturated Sand.” Proceedings 8th US National Conference on Earthquake Engineering, San Francisco, CA, April, 2006.
O'Rourke, T.D. and A. Bonneau, "Lifeline Performance Under Extreme Loading During Earthquakes",Earthquake Geotechnical Engineering , K.D. Pitilakis, Ed., Springer, Dordrecht, Netherlands, pp. 407-432, June 2007.
Xiaojian, X., Symans, M.D. and O’Rourke, M.J. “Performance of Buried Pipelines Subjected to Ground Fault Rupture: Numerical Predictions of Experimental Results,” Proc. of Eighth U.S. National Conf. on Earthquake Engineering, San Francisco, CA, April, 2006.
Xie, X., Symans, M.D., and O’Rourke, M.J. (2006). “Performance of Buried Pipelines Subjected to Ground Fault Rupture: Numerical Predictions of Experimental Behavior,” Proc. of Eighth U.S. National Conf. on Earthquake Engineering, San Francisco, CA, April, Paper No. 944.
Da, H., T. Abdoun, M. O’Rourke, P. Van Laak, T. O’Rourke, and H. Stewart, (2006) “Centrifuge Modeling of Permanent Ground Deformation Hazard on Buried Pipeline Systems” Proc. Intl. Conf. on Physical Modeling in Geotechnics, ICPMG, Hong Kong, Aug. 4-6, Vol. 1, pp. 729 - 734.
O'Rourke, M., D. Ha and T. Abdoun (2007). "Compression Buckling of Buried Pipelines under Strike-Slip Faulting", Proc. of 5th China-US-Japan Trilateral Symposium on Lifeline Earthquake Engineering, Haikou, China. Nov. 26-28, 2007.
T. Abdoun, D., Ha and M. O'Rourke (2008). “Influencing Parameters for behavior of Moderately Buried HDPE Pipelines Subject to Seismic Ground Faulting” Proc. of 5th International conference on Urban Earthquake Engineering, Tokyo, Japan, March 4-5, pp. 323.
Ha, D., T. Abdoun and M. O'Rourke (2008). "Soil-Pipe Interaction Behavior under Strike-Slip Faulting", Proc. of the 4th Decennial Geotechnical Earthquake Engineering and Soil Dynamics Conference, Sacramento, CA, May 18-22.
Abdoun, T., D. Ha and M. O'Rourke (2008). " Behavior of Moderately Buried HDPE Pipelines Subject Strike-Slip Faulting", Proc. of the 12th International Conference of International Association for Computer Methods and Advances in Geomechanics (IACMAG), Goa, India, October 1-6.

43
CONTRIBUTIONS
1. The Principal Discipline of the Project
The principal disciplines of the project are geotechnical engineering and structural engineering. The project is focused on resolving fundamental issues of soil-structure interaction, thus requiring a team of experienced, knowledgeable geotechnical and structural engineers.
2. Other Disciplines of Science and Engineering
Other disciplines involved in the project include material science, needed to test and characterize the properties of HDPE and other materials/substances that will be explored with the research. As with most NEESR projects, there is a strong component of IT, which requires continuous interaction with the NEES IT specialist. Electrical and computer engineering is being used to select and test special sensors and opto-electronics for experimental monitoring and payloads to accompany the scheduled experiments. Mechanical engineering is employed through the design of pipeline robots that will be deployed as payload projects in the scheduled experiments.
3. The Development of Human Resources
Please see answer to #3 under Activities and Findings. A listing of those, who have been engaged in the project, is provided as follows:
CORNELL-RPI-NSF NEESR Research Team Name Title Address Phone Email
Tom O'Rourke Professor 273 Hollister, Cornell University, Ithaca, NY 14853
607-255-6470 (w) 607-272-4029 (h)
Harry Stewart Associate Professor
271 Hollister, Cornell University, Ithaca, NY 14853
607-255-4734 (w) 607-256-3132(h)
Mike Palmer Research Associate
B63 Hollister, Cornell University, Ithaca, NY 14853
607-255-4899 (w) 607-256-8765(h)
Tim Bond Manager CI Complex
B02 Thurston, Cornell University, Ithaca, NY 14853
607-255-4078 (w) 607-387-5714 (h)
Elizabeth Crowley Student researcher
B02 Thurston, Cornell University, Ithaca, NY 14853
607-255-4078 (w) [email protected]
Jeremiah Jezerski Grad Research Assistant
B02 Thurston, Cornell University, Ithaca, NY 14853
607-255-4078 (w) [email protected]
Nathaniel Olson Grad Research Assistant
B02 Thurston, Cornell University, Ithaca, NY 14853
607-255-4078 (w) [email protected]
Will Graeper Student Researcher
B02 Thurston, Cornell University, Ithaca, NY 14853
607-255-4078 (w) [email protected]
Gavin Graeper HS Student- Lab assistant
B02 Thurston, Cornell University, Ithaca, NY 14853
607-255-4078 (w) [email protected]
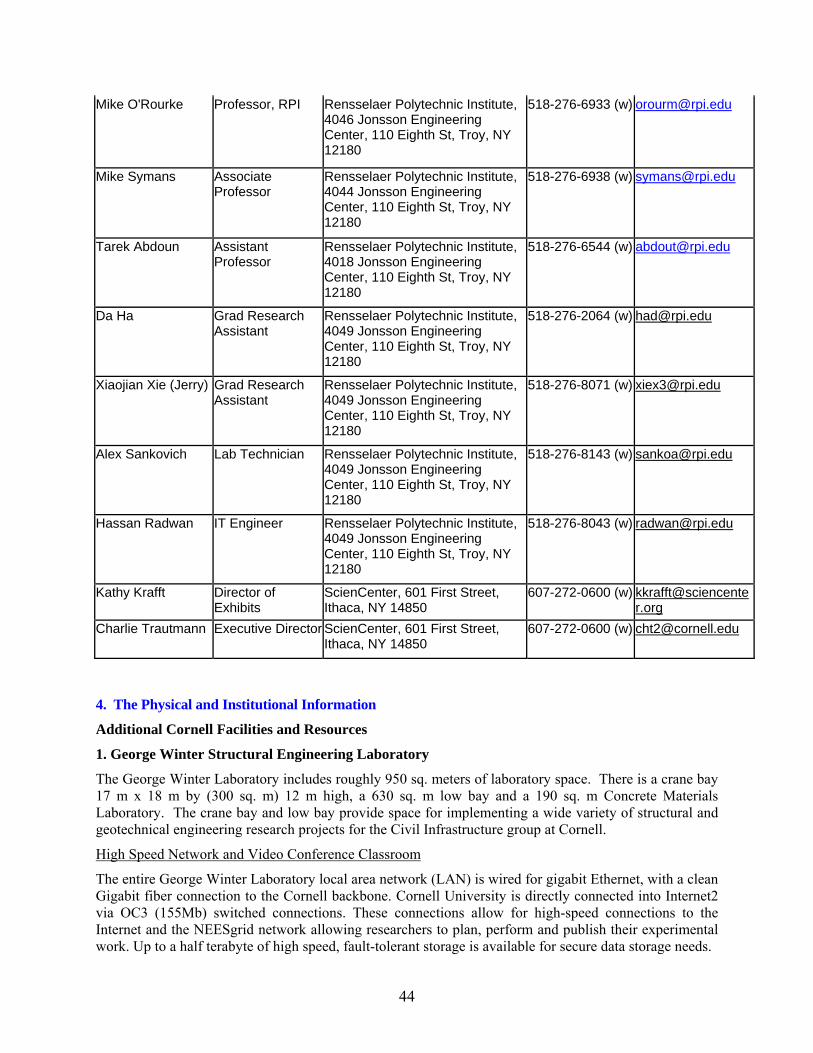
44
Mike O'Rourke Professor, RPI Rensselaer Polytechnic Institute, 4046 Jonsson Engineering Center, 110 Eighth St, Troy, NY 12180
518-276-6933 (w) [email protected]
Mike Symans Associate Professor
Rensselaer Polytechnic Institute, 4044 Jonsson Engineering Center, 110 Eighth St, Troy, NY 12180
518-276-6938 (w) [email protected]
Tarek Abdoun Assistant Professor
Rensselaer Polytechnic Institute, 4018 Jonsson Engineering Center, 110 Eighth St, Troy, NY 12180
518-276-6544 (w) [email protected]
Da Ha Grad Research Assistant
Rensselaer Polytechnic Institute, 4049 Jonsson Engineering Center, 110 Eighth St, Troy, NY 12180
518-276-2064 (w) [email protected]
Xiaojian Xie (Jerry) Grad Research Assistant
Rensselaer Polytechnic Institute, 4049 Jonsson Engineering Center, 110 Eighth St, Troy, NY 12180
518-276-8071 (w) [email protected]
Alex Sankovich Lab Technician Rensselaer Polytechnic Institute, 4049 Jonsson Engineering Center, 110 Eighth St, Troy, NY 12180
518-276-8143 (w) [email protected]
Hassan Radwan IT Engineer Rensselaer Polytechnic Institute, 4049 Jonsson Engineering Center, 110 Eighth St, Troy, NY 12180
518-276-8043 (w) [email protected]
Kathy Krafft Director of Exhibits
ScienCenter, 601 First Street, Ithaca, NY 14850
607-272-0600 (w) [email protected]
Charlie Trautmann Executive Director ScienCenter, 601 First Street, Ithaca, NY 14850
607-272-0600 (w) [email protected]
4. The Physical and Institutional Information
Additional Cornell Facilities and Resources
1. George Winter Structural Engineering Laboratory
The George Winter Laboratory includes roughly 950 sq. meters of laboratory space. There is a crane bay 17 m x 18 m by (300 sq. m) 12 m high, a 630 sq. m low bay and a 190 sq. m Concrete Materials Laboratory. The crane bay and low bay provide space for implementing a wide variety of structural and geotechnical engineering research projects for the Civil Infrastructure group at Cornell.
High Speed Network and Video Conference Classroom
The entire George Winter Laboratory local area network (LAN) is wired for gigabit Ethernet, with a clean Gigabit fiber connection to the Cornell backbone. Cornell University is directly connected into Internet2 via OC3 (155Mb) switched connections. These connections allow for high-speed connections to the Internet and the NEESgrid network allowing researchers to plan, perform and publish their experimental work. Up to a half terabyte of high speed, fault-tolerant storage is available for secure data storage needs.
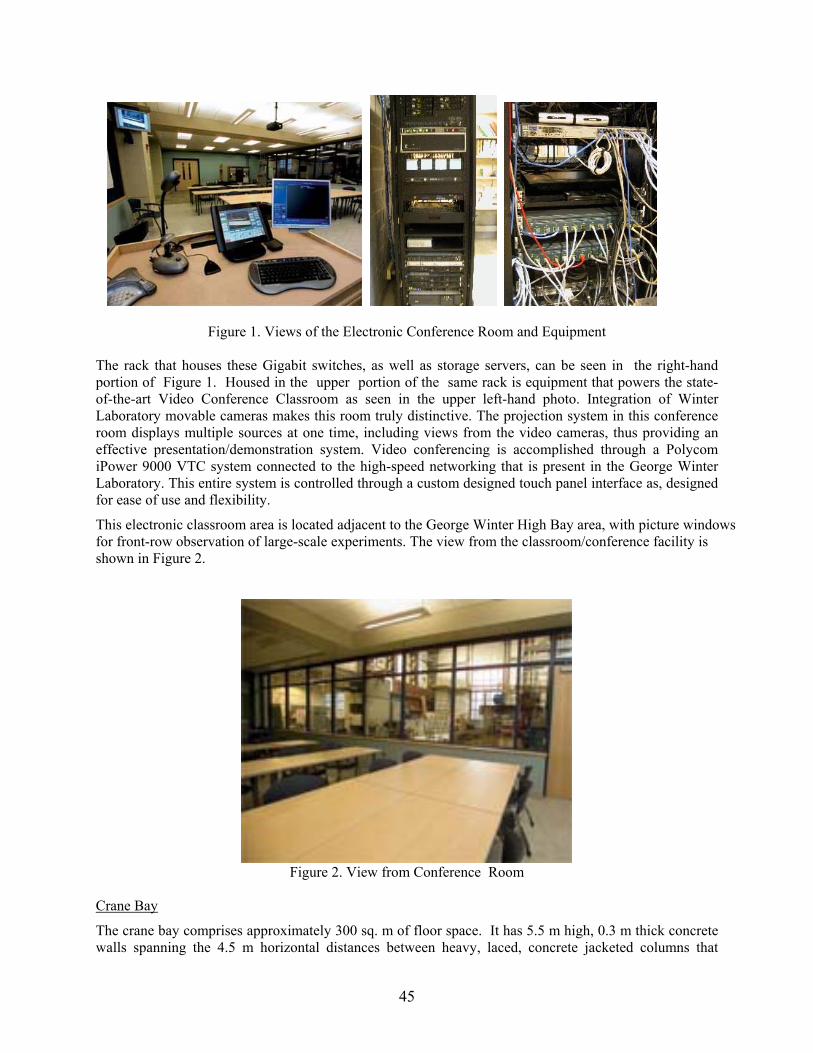
45
Figure 1. Views of the Electronic Conference Room and Equipment
The rack that houses these Gigabit switches, as well as storage servers, can be seen in the right-hand portion of Figure 1. Housed in the upper portion of the same rack is equipment that powers the state-of-the-art Video Conference Classroom as seen in the upper left-hand photo. Integration of Winter Laboratory movable cameras makes this room truly distinctive. The projection system in this conference room displays multiple sources at one time, including views from the video cameras, thus providing an effective presentation/demonstration system. Video conferencing is accomplished through a Polycom iPower 9000 VTC system connected to the high-speed networking that is present in the George Winter Laboratory. This entire system is controlled through a custom designed touch panel interface as, designed for ease of use and flexibility.
This electronic classroom area is located adjacent to the George Winter High Bay area, with picture windows for front-row observation of large-scale experiments. The view from the classroom/conference facility is shown in Figure 2.
Figure 2. View from Conference Room
Crane Bay
The crane bay comprises approximately 300 sq. m of floor space. It has 5.5 m high, 0.3 m thick concrete walls spanning the 4.5 m horizontal distances between heavy, laced, concrete jacketed columns that

46
support the roof. The columns are jacketed for their lower 5.5 m and unjacketed for the remaining 6.7 m. They are designed as reaction points for vertical downward loads up to 3340 kN at any point, vertical upward loads up to 220 kN at any point, and horizontal loads up to 220 kN in any direction within the lower 5.5 m of the columns. The high crane bay is floored with 0.46 m of reinforced concrete that can withstand a load of 4.8 MPa. There is a grid of twenty-seven floor anchors, each with a vertical uplift capacity of 890 kN. A 90-kN capacity crane services the bay. An 18-kN capacity forklift (with a 4.3 m lifting height) services the Winter and Concrete Labs. Several large testing facilities exist in the crane bay. The first is an earthquake simulator that measures 1.5 m by 2.1 m. It is used to simulate earthquakes and their effect on the built environment.
Low Bay
The connected low bay is 5.2 m high. This lab is used for testing many different materials (including concrete, steel and composites) and structural and geotechnical components made from these materials. Components are tested by applying force or displacement while examining the resulting behavior. The low bay includes many testing machines. This 1780 kN Baldwin Universal Testing Machine is set up to test a concrete beam with composite reinforcing bars (made by students during part of the CEE 476 Civil Engineering Materials Course).
Concrete Materials Lab
The Concrete Materials Lab is a 190 sq. m space with a 5.2 m ceiling attached to the low bay of the George Winter Lab. It provides space and houses equipment for concrete materials research. The lab equipment includes: a variety of mixers ranging from Hobart bench-top models to a 0.07 cubic meter mixer; bulk aggregate storage facilities; ASTM standard equipment for characterizing aggregate, cement, mortar and concrete parameters; curing chambers; drying ovens; and freezers (two are fitted with low temperature control systems). Equipment for characterizing dynamic modulus of elasticity, ultrasonic pulse velocity, pH, temperature, and wind speed are available in the Concrete Lab. A high torque coring drill, a Highland Park geological slab saw and a grinding and polishing table are available for specimen preparation. Two testing frames (a 2670 kN kip Forney and a 267 kN Baldwin) allow testing of cube, cylinder and prism specimens.
Instrumentation
A variety of high-resolution, multi-channel, IEEE488 measuring systems are available for use throughout the testing labs (for measuring up to 220 channels during experiments). Another group of data acquisition systems with high speed data acquisition cards allows measurements of up to 192 channels during dynamic tests. These systems can be used separately for smaller research projects or together for larger projects. Appropriate signal conditioning is available for all measurements, including strain gage bridge completion, excitation and amplification. A wide variety of load cells, pressure sensors, LVDTs, Temposonic (magneto-strictive) displacement measuring devices, accelerometers, extensometers, humidity and temperature sensors are available.
2. Takeo Mogami Geotechnical Laboratory
The Takeo Mogami Geotechnical Laboratory has excellent facilities for experimental testing, particularly soil dynamics. One room in the lab has a floor area of about 75 sq. m and the other has roughly 130 sq. m of useable space. Major space renovations were performed in the late 1980s. Both rooms were rewired to provide separate circuits for both 110 and 220 V so that future increases in electronic equipment demands could be accommodated without overloading the existing electrical systems. Chilled water lines and air conditioning was installed.
Special testing equipment includes a variety of systems for cyclic and dynamic soil testing. One system is a resonant column/torsional shear (RC/TS) system. This device is capable of testing solid or hollow
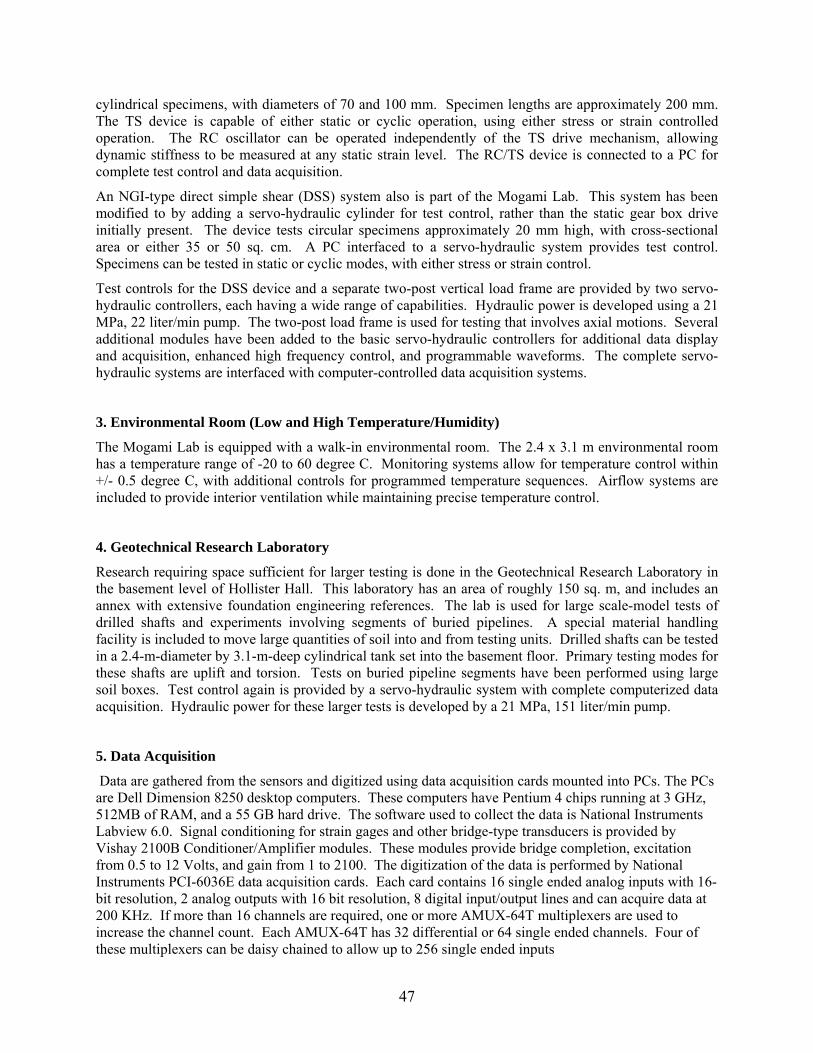
47
cylindrical specimens, with diameters of 70 and 100 mm. Specimen lengths are approximately 200 mm. The TS device is capable of either static or cyclic operation, using either stress or strain controlled operation. The RC oscillator can be operated independently of the TS drive mechanism, allowing dynamic stiffness to be measured at any static strain level. The RC/TS device is connected to a PC for complete test control and data acquisition.
An NGI-type direct simple shear (DSS) system also is part of the Mogami Lab. This system has been modified to by adding a servo-hydraulic cylinder for test control, rather than the static gear box drive initially present. The device tests circular specimens approximately 20 mm high, with cross-sectional area or either 35 or 50 sq. cm. A PC interfaced to a servo-hydraulic system provides test control. Specimens can be tested in static or cyclic modes, with either stress or strain control.
Test controls for the DSS device and a separate two-post vertical load frame are provided by two servo-hydraulic controllers, each having a wide range of capabilities. Hydraulic power is developed using a 21 MPa, 22 liter/min pump. The two-post load frame is used for testing that involves axial motions. Several additional modules have been added to the basic servo-hydraulic controllers for additional data display and acquisition, enhanced high frequency control, and programmable waveforms. The complete servo-hydraulic systems are interfaced with computer-controlled data acquisition systems.
3. Environmental Room (Low and High Temperature/Humidity)
The Mogami Lab is equipped with a walk-in environmental room. The 2.4 x 3.1 m environmental room has a temperature range of -20 to 60 degree C. Monitoring systems allow for temperature control within +/- 0.5 degree C, with additional controls for programmed temperature sequences. Airflow systems are included to provide interior ventilation while maintaining precise temperature control.
4. Geotechnical Research Laboratory
Research requiring space sufficient for larger testing is done in the Geotechnical Research Laboratory in the basement level of Hollister Hall. This laboratory has an area of roughly 150 sq. m, and includes an annex with extensive foundation engineering references. The lab is used for large scale-model tests of drilled shafts and experiments involving segments of buried pipelines. A special material handling facility is included to move large quantities of soil into and from testing units. Drilled shafts can be tested in a 2.4-m-diameter by 3.1-m-deep cylindrical tank set into the basement floor. Primary testing modes for these shafts are uplift and torsion. Tests on buried pipeline segments have been performed using large soil boxes. Test control again is provided by a servo-hydraulic system with complete computerized data acquisition. Hydraulic power for these larger tests is developed by a 21 MPa, 151 liter/min pump.
5. Data Acquisition
Data are gathered from the sensors and digitized using data acquisition cards mounted into PCs. The PCs are Dell Dimension 8250 desktop computers. These computers have Pentium 4 chips running at 3 GHz, 512MB of RAM, and a 55 GB hard drive. The software used to collect the data is National Instruments Labview 6.0. Signal conditioning for strain gages and other bridge-type transducers is provided by Vishay 2100B Conditioner/Amplifier modules. These modules provide bridge completion, excitation from 0.5 to 12 Volts, and gain from 1 to 2100. The digitization of the data is performed by National Instruments PCI-6036E data acquisition cards. Each card contains 16 single ended analog inputs with 16-bit resolution, 2 analog outputs with 16 bit resolution, 8 digital input/output lines and can acquire data at 200 KHz. If more than 16 channels are required, one or more AMUX-64T multiplexers are used to increase the channel count. Each AMUX-64T has 32 differential or 64 single ended channels. Four of these multiplexers can be daisy chained to allow up to 256 single ended inputs

48
6. Major Equipment
The following additional equipment is located at Cornell University in the George Winter Civil Infrastructure Laboratory.
Servohydraulic Equipment: Hydraulic pumps with 150 and 226 liter/min (lpm) capacities at 21 MPa service pressure (6) Multiple and single station 293.11 Service Manifolds at 190 lpm (2) 243.40T Actuators, +/- 0.91 meter stroke, 295 kN Tension, 498 kN Compression (2) 243.45T Actuators. +/- 0.63 meter stroke, 445 kN Tension, 649 kN Compression (1) 647.25A-01 Hydraulic Wedge Grip Set with surfalloy, serrated, and diamond grip assemblies (1) Flextest GT and (2) SE servo controllers Instrumentation, Sensors: (6) 2110B Power Supplies (30) 2120B System Signal Conditioner/Amplifiers (1) FTI-100i-8 8-channel fiber optic signal conditioner (1) LX 1500 Laser Extensometer (8-381 mm) (1) LX 1500 Laser Extensometer (5-127 mm) (10) Temposonics 2000mm disp. transducers (6) Geokon 3500-1-100 earth pressure cells and (6) Geokon 3500FB-1-100 earth pressure cells (6) Dynatest SOPT-68A soil stress cells 5. Other Aspects of Public Welfare Beyond Science and Engineering
The project is designed to address a fundamental problem affecting all underground lifelines, namely the effects of large differential ground deformation on buried pipeline and conduit performance. The research will produce a seminal outcome through state-of-the-art modeling and quantification of earthquake-induced ground movement effects on lifelines. It also will improve the design and construction of lifelines affected by landslides, mining, extraction of subsurface fluids, and underground construction.
The project is designed to advance commercial technology. Table 1 lists the companies and principal contacts, who have agreed to participate in the research. Several companies have sponsored large-scale testing and numerical simulation of pipelines subjected to earthquake-induced PGD at Cornell in the past. For example, LADWP and Tokyo Gas, Ltd. have contributed approximately $300K each in the form of direct funds and contributions of materials, services, and personnel. It is fully anticipated that several or all of the industrial partners will contribute both financially and with donations of material, personnel, and equipment. Such contributions are consistent with joint industry experiments that have been performed at Cornell during previous projects.

49
Table 1. Industry Participants in NEESR Project
Company Principal Contact Consolidated Edison Company of New York New York, NY
Mr. Anthony Hranika Manager, R&D
Corning, Inc.** Corning, NY
Dr. Mark Taylor Director, Exploratory Markets and Technology
Exxon Mobil, Inc. Houston, TX
Dr. Rahul Pakal Exxon Mobil Upstream Company
Gas Technology Institute Des Plaines, IL
Dr. Khalid Farraz Manager, Civil Engineering Research
Insituform Technologies, Inc., * St. Louis, MO
Mr. Alex Buehler Vice President, Marketing and Research
Los Angeles Dept. of Water and Power Los Angeles, CA
Mr. Glenn Singley Director, Water Engineering and Technical Services
San Francisco Public Utilities Commission San Francisco, CA
Mr. Brian Sadden Director, Engineering Management
Tekscan, Inc. Boston, MA
Mr. Chuck McWilliams Manager, Industrial Sales
Tokyo Gas Co., Ltd. Tokyo, Japan
Dr. Koji Yoshisaki Pipeline Technology Center
ULC Robotics, Inc.** Deer Park, NY
Mr. Gregory Penza President, ULC Robotics
Vari-Tech LLC* Liverpool, NY
Mr. Tracy Guhin Area Manager
* Participant for pipe product payload ** Participant for sensor payload
All companies identified by asterisk in the table have indicated a strong interest in payload projects. Insituform Technologies, Inc., and ULC Robotics, in particular, are making significant company contributions for advanced materials and pipeline robots, respectively.