Embed Size (px)
Citation preview

BRTS Evaluation and Design Tool
Institute of Urban Transport (India)
Transportation Research and
BEAD
BRTS Evaluation and Design Tool Version 1.60
developed for
Institute of Urban Transport (India)
Interim Report
October 2011
SGASGASGASGArchitects www.sgarchitects.in
Under technical advice from
Transportation Research and Injury Prevention Program, IIT Delhi
Supported by Supported by
[BRTS Evaluation and Design (BEAD) Tool, Interim Report, Oct 2011]
2 SGArchitects
©SGArchitects, New Delhi
Acknowledgement
This work was supported through a project awarded by the Shakti Foundation, India
We are grateful to Mr. B I Singal, Institute of Urban Transport (India) and Dr. Geetam Tiwari, Transportation
Research and Injury Prevention Program (TRIPP), IIT Delhi, for providing their valuable inputs and guidance,
without which this work would not have been possible.
We are thankful to Dr. Joseph Fazio, who has been our valuable technical guide and an essential partner in the
development and working of the tool
We are also thankful to Mr. Saha, Institute of Urban Transport (India) and all participants of the two BEAD
workshops, for providing there valuable support and inputs which resulted in the success of these sessions.
Copyright
© This report may be reproduced and quoted in entirely or part thereof with due accreditation to
the team and SGArchitects
SGArchitects, 6151/8, Sector D, Pocket 6, Vasant kunj, New Delhi – 110070
Tel: - +91 11 42147521, Email – [email protected], Web: www.sgarchitects.in

[BRTS Evaluation and Design (BEAD) Tool, Interim Report, Oct 2011]
3 SGArchitects
Contents 1 Background ................................................................................................................................... 12
2 Approach ....................................................................................................................................... 13
3 Methodology – Working of BEAD Tool ......................................................................................... 15
3.1 Principles or Base Logic behind the Working of BEAD .......................................................... 16
3.1.1 Signal Cycle Design ........................................................................................................ 16
3.1.2 Cross Section Design ..................................................................................................... 16
3.1.3 Capacity Estimation ....................................................................................................... 17
3.2 Input Fields ............................................................................................................................ 18
3.2.1 User Inputs .................................................................................................................... 18
3.2.2 Default Variables ........................................................................................................... 19
3.2.3 Assumptions .................................................................................................................. 19
3.3 Background Processes and Calculations ............................................................................... 27
3.3.1 The Theoretical Base ..................................................................................................... 27
3.3.2 Description of Processes ............................................................................................... 29
3.4 Results ................................................................................................................................... 40
3.4.1 Result Categories .......................................................................................................... 40
3.4.2 Application of Results ................................................................................................... 46
4 Validation of Results ..................................................................................................................... 52
4.1 Delhi BRTS ............................................................................................................................. 52
4.2 Ahmadabad BRTS .................................................................................................................. 53
4.3 Bogota BRTS .......................................................................................................................... 54
Annexure 1: First BEAD Workshop – Finalization of Input Variables .................................................... 56
Annexure 2: Second BEAD Workshop – Finalization of Output Variables and Discussions on the
Working of the Tool .............................................................................................................................. 57
Annexure 3: List of Input Variables and Output Fields Used in the Tool .............................................. 60
Annexure 4: Boarding Alighting Survey Data ........................................................................................ 65
Annexure 5: Flow Charts for Important Processes used in the BEAD Tool ........................................... 67
Annexure 6: Methodology for Deriving Weightage for Different Performance Indicators Used for
Determining Overall BRT System LOS by the Tool .............................................................................. 142
Categorization of Performance Indicators in BEAD Tool ................................................................ 142
Assigning Weights to Indicators ...................................................................................................... 144
Assigning Weights to Each Category ........................................................................................... 144
Assigning Weights to Indicators within Each Category ............................................................... 145
Determination of Overall Weightage of all Indicators ................................................................ 148

[BRTS Evaluation and Design (BEAD) Tool, Interim Report, Oct 2011]
4 SGArchitects
Annexure 7: Comparative graphs using BEAD Tool Generated Results ............................................. 149

[BRTS Evaluation and Design (BEAD) Tool, Interim Report, Oct 2011]
5 SGArchitects
List of Figures Figure 1: BRTS Evaluation and Design (BEAD) tool Methodology ....................................................... 15
Figure 2: Categorization if Input fields for BEAD Tool .......................................................................... 18
Figure 3: Categorization of default variables used in BEAD Tool .......................................................... 19
Figure 4: BEAD Tool – First Page form .................................................................................................. 20
Figure 5: BEAD TOOL – Default variables form ..................................................................................... 21
Figure 6: BEAD Tool - Segment Details form ......................................................................................... 22
Figure 7: BEAD Tool – General inputs form .......................................................................................... 23
Figure 8: BEAD Tool - Intersection (for junction stations), input form ................................................. 23
Figure 9: BEAD Tool – Station Design input form (common for junction or mid block stations) ......... 24
Figure 10: BEAD Tool - Additional junction input form, specific for junctions between mid block
stations .................................................................................................................................................. 24
Figure 11: BEAD Tool – Results/Output sheet ...................................................................................... 25
Figure 12: BEAD Tool – Edit results form .............................................................................................. 26
Figure 13: Comparison of trends for journey time changes (for 6 and 10km trip lengths using BRTS
system) in an open system with staggered junction stations (based on results derived from BEAD
Tool). ..................................................................................................................................................... 48
Figure 14: Comparison of trends for journey time changes (for 6 and 10km trip lengths using BRTS
system) in a closed system with island junction stations (Based on results derived from BEAD Tool).
.............................................................................................................................................................. 49
Figure 15: Passenger and operational speed comparison between open and closed system for
different trip lengths ............................................................................................................................. 50
Figure 16: Operational and passenger speed comparison for closed system (with island stations) for a
trip length of 8 km and varying stations spacing as well peak bus speeds in the corridor. ................. 50
Figure 17: Time gain for passengers in BRTS over regular bus service (in mixed condition) compared
for open and closed system against varying trip lengths and average speed of motorized vehicles in
mixed traffic (on the corridor or in the city). ........................................................................................ 51
Figure 18: Aerial view (Google Earth) of Siri Fort Junction Station, Delhi BRTS corridor ..................... 52
Figure 19: Aerial view of Ahmedabad BRTS corridor ............................................................................ 54
Figure 20: Aerial view of (Google Earth) Bogota BRTS – Caracas Corridor ........................................... 55
Figure 21 – Process 1: Journey time for average trip in the city, in mins ............................................. 68
Figure 22 – Process 2: Determining average bus speed in the BRTS corridor ...................................... 69
Figure 23 – Process 3: Determining Capacity of the BRTS Corridor/Segment ...................................... 70
Figure 24: Process 4 – Journey time in secs for average trip in open system ...................................... 71
Figure 25 – Process 5 – Average journey time in secs for average trip length in a closed system ....... 72
Figure 26 – Process 6: Bus delay at stations including signal delay (pedestrian signal delay at mid
block stations) ....................................................................................................................................... 73
Figure 27 – Process 7: Bus delay at intersection (cross roads) on corridors with mid block stations .. 74
Figure 28: Flow chart for Process 8 - Bus throughput per signal cycle per direction from station
including intersections throughput for junction stations (roundabout or signalized). ........................ 75
Figure 29: Flow chart for Process 9 - Total Buses Throughput per signal cycle per direction from
intersection (for mid block station) ...................................................................................................... 76
Figure 30: Flow chart for Process 10 – Signal cycle length in secs at intersection. .............................. 77
Figure 31: Flowchart for Process 11 - Average O to D travel time for O-D located within 0-500m from
the corridor – no interchange (in an open or closed system) .............................................................. 78
[BRTS Evaluation and Design (BEAD) Tool, Interim Report, Oct 2011]
6 SGArchitects
Figure 32: Flowchart for process 12 – Average O to D travel time for O-D located within 500-1000m
from the corridor – no interchange (in an open system) ..................................................................... 79
Figure 33: Flowchart for process 13 – Average O to D travel time for O-D located within 1000-2000m
from the corridor – no interchange (in an open system) ..................................................................... 80
Figure 34: Flowchart for process 14 – Average O to D travel time for O-D located within 2000-3000m
from the corridor – no interchange (in an open system) ..................................................................... 81
Figure 35: Flowchart for Process 15 - Average O to D travel time for O-D located within 500-1000m
from the corridor in a closed system .................................................................................................... 82
Figure 36: Flowchart for Process 16 - Average O to D travel time for O-D located within 1000-2000m
from the corridor in a closed system .................................................................................................... 83
Figure 37: Flowchart for Process 17 - Average O to D travel time for O-D located within 2000-3000m
from the corridor in a closed system .................................................................................................... 84
Figure 38: Flow chart for Process 18 - Average per bus delay at near side (staggered) junction
stations (including junction delay) in secs (with or without overtaking lane) ...................................... 85
Figure 39: Flow chart for Process 19 - Average per bus delay at far side (staggered) junction stations
(including junction delay) in secs (with overtaking lane) ...................................................................... 86
Figure 40: Flow chart for Process 20 - Average per bus delay at far side (staggered) junction stations
(including junction delay) in secs (without overtaking lane) ................................................................ 87
Figure 41: Flow chart for Process 21 - Average per bus delay at Junction Island stations with
overtaking lane ..................................................................................................................................... 88
Figure 42: Flow chart for Process 22 - Average per bus delay at Junction Island stations without
overtaking lane ..................................................................................................................................... 89
Figure 43: Flowchart for process 23 – Straight bus throughput per cycle per direction at intersections
(between mid block stations). .............................................................................................................. 90
Figure 44: Flowchart for process 24 – Turning bus throughput per cycle per direction at intersections
(between mid block stations). .............................................................................................................. 91
Figure 45: Flowchart for process no. 25 – Weighted average of bus delay for straight moving bus at a
signalized intersection between bid block stations. ............................................................................. 92
Figure 46: Flowchart for process no. 26 – Weighted average of bus delay for turning bus at a
signalized intersection between bid block stations. ............................................................................. 93
Figure 47: Flowchart for Process 27 – Total bus throughput per signal cycle per direction at (junction
or mid block) island stations ................................................................................................................. 94
Figure 48: Flowchart for Process 28 – Total bus throughput per signal cycle per direction at (junction
or mid block) staggered, near side stations .......................................................................................... 95
Figure 49: Flowchart for Process 29 – Total bus throughput per signal cycle per direction at (junction
or mid block) staggered, far side stations ............................................................................................. 96
Figure 50: Flow chart for process 30 – Signal cycle length in sec for junction station intersections ... 97
Figure 51: Flow chart for process 31 – Signal cycle length in sec for Mid Block station intersections . 98
Figure 52: Flowchart for Process No. 32 – Passenger access delay for a BRTS bus based on average
walking distance from median on the cross roads. .............................................................................. 99
Figure 53: Flow chart for Process no. 33 – Average walking distance in m. from origin/destination
point to the BRTS or feeder station location. ..................................................................................... 100
Figure 54: Flowchart for process no. 34 – Average total access delay to bus outside the corridor in an
open system ........................................................................................................................................ 101
Figure 55: Flowchart for Process no. – Average bus speed in mixed conditions in m/s. ................... 102

[BRTS Evaluation and Design (BEAD) Tool, Interim Report, Oct 2011]
7 SGArchitects
Figure 56: Flowchart for Process no. 36 - Average total access delay to bus outside the corridor in
closed system ...................................................................................................................................... 103
Figure 57: Flow chart for process 37 – Straight moving per bus per cycle per direction delay for buses
at near side (staggered stations) in secs. ............................................................................................ 104
Figure 58: Flowchart for process 38 - Turning per bus per cycle per direction delay for buses at near
side (staggered stations) in secs. ........................................................................................................ 105
Figure 59: Flow chart for process 39 – Straight moving bus throughput per direction per signal cycle
for near side stations .......................................................................................................................... 106
Figure 60: Flowchart for process 40 - Turning bus throughput per direction per signal cycle for near
side stations ........................................................................................................................................ 107
Figure 61: Flow chart for process 41 - Straight moving per bus per cycle per direction delay for buses
at far side (staggered stations) with overtaking lanes in secs. ........................................................... 108
Figure 62: Flow chart for process 42 –Per bus per cycle per direction delay for turning buses at far
side (staggered stations) with overtaking lanes in secs. ..................................................................... 109
Figure 63: Flow chart for process 43 – Per cycle per direction straight moving bus throughput for far
side stations with or without overtaking lanes ................................................................................... 110
Figure 64: Flow chart for process 44 – Per cycle per direction turning bus throughput for far side
stations with overtaking lanes ............................................................................................................ 111
Figure 65: Flow chart for process 45 - Straight moving per bus per cycle per direction delay for buses
at far side (staggered stations) without overtaking lanes, in secs. ..................................................... 112
Figure 66: Flow chart for process 46 –Per bus per cycle per direction delay for turning buses at far
side (staggered stations) without overtaking, lanes in secs. .............................................................. 113
Figure 67: Flow chart for process 47 – Percentage of trips with varying distance of O-D situated of
the corridor on the basis of average motorized trip length in the city .............................................. 114
Figure 68: Flowchart for process 48 – Total bus throughput per hour per direction capacity of the
corridor. .............................................................................................................................................. 115
Figure 69: Flow chart for process 49 – Average per bus delay for straight moving buses at common or
island stations with overtaking lanes. ................................................................................................. 116
Figure 70: Flow chart for process 50 – Average per bus delay for turning buses at common or island
stations with overtaking lanes. ........................................................................................................... 117
Figure 71: Flow chart for process 51 - Per cycle per direction straight moving bus throughput for
common/island stations with or without overtaking lanes ................................................................ 118
Figure 72: Flow chart for process no. 52 - Per cycle per direction turning bus throughput for
common/island stations with or without overtaking lanes ................................................................ 119
Figure 73: Flowchart for Process no. 53 - Straight moving average per bus per cycle per direction
delay in sec for island stations without overtaking lanes. .................................................................. 120
Figure 74: Flowchart for process no. 54 - Average per bus per cycle per direction delay in sec for
island stations without overtaking lanes for turning buses. ............................................................... 121
Figure 75: Flowchart for process 55 – Safe gap between buses on the corridor ............................... 122
Figure 76: Flow chart for process 56 – Maximum no. of buses (per hour per direction) that can cruise
in the corridor safely (maintaining safe gap between buses) ............................................................. 123
Figure 77: Flowchart for Process 57 – Maximum number of straight buses that can be throughput at
an intersection signal cycle between two mid block stations. ........................................................... 124
Figure 78: Flowchart for process no. 58 - Maximum number of turning buses that can be throughput
at an intersection signal cycle between two mid block stations. ....................................................... 125

[BRTS Evaluation and Design (BEAD) Tool, Interim Report, Oct 2011]
8 SGArchitects
Figure 79: Flow chart for process no. 59 – Total red phase length for buses (excluding yellow) in
seconds, for straight buses at vehicular intersection between two mid block stations. ................... 126
Figure 80: Flow chart for process 60 - Total red phase length for buses (excluding yellow) in seconds,
for turning buses at vehicular intersection between two mid block stations. ................................... 127
Figure 81: Flow chart for process 61 – Total no. of phases at Station Crossing Signal/ intersection
signal ................................................................................................................................................... 128
Figure 82: Flow chart for process 62 - Minimum Desirable signal cycle length in sec for
station/junction signal with more than 2 phase signal cycle .............................................................. 129
Figure 83: Flow chart for process 63 – Total no. of phases at Junction Signal between two mid block
stations ................................................................................................................................................ 130
Figure 84: Flow chart for process 64 - Minimum Desirable signal cycle length in sec for
station/junction signal with more than two phase signal cycle ......................................................... 131
Figure 85: Flow chart for process 65 - Average one way access delay/time for passengers accessing
Buses on BRTS station from median on the cross road (in sec).......................................................... 132
Figure 86: Flowchart for process 66 – Average wait time for buses (in sec) in open system ............. 133
Figure 87: Flowchart for process 67 – Average wait time for buses (in sec) in closed system ........... 134
Figure 88: Flowchart for process 68 – Average crossing delay in sec, on cross roads (outside the
corridor) .............................................................................................................................................. 135
Figure 89: Flowchart for process 69 – Minimum green phase length for pedestrian crossing
requirements in seconds..................................................................................................................... 136
Figure 90: Flowchart for process 70 – Total time lost (in seconds) in acceleration and deceleration of
bus to and from peak speed ............................................................................................................... 137
Figure 91: Flowchart for process 71 – Average dwell time for buses in seconds ............................... 138
Figure 92: Flowchart for process 72 – Maximum crossing or access distance (in m) for passengers, in
order to access the bus stop ............................................................................................................... 139
Figure 93: Flow chart for process 73 – Weighted average of straight moving bus delay at bus stop or
junction bus stop signal. ..................................................................................................................... 140
Figure 94: Flow chart for process 75 – Weighted average of turning bus delay at bus stop or junction
bus stop signal..................................................................................................................................... 141
[BRTS Evaluation and Design (BEAD) Tool, Interim Report, Oct 2011]
9 SGArchitects
List of Tables Table 1 : Results for boarding and alighting survey conducted at BRTS Delhi on Nov 4, 2011 ............ 28
Table 2 : Average per passenger time required for boarding or alighting low floor (level boarding),
one step inside two steps inside and three steps inside the bus. ........................................................ 29
Table 3: Categorization of performance indicators by score ranging from ‘A’ to ‘F’ ............................ 45
Table 4: The standard values of parameters used for each of the 16 design types defined in BEAD
Tool ....................................................................................................................................................... 47
Table 5: Validation of Results for Delhi BRTS Corridor ......................................................................... 53
Table 6: Validation of results for Ahmadabad BRTS corridor ............................................................... 54
Table 7: Validation of results for Bogota BRTS corridor ....................................................................... 55

[BRTS Evaluation and Design (BEAD) Tool, Interim Report, Oct 2011]
10 SGArchitects
Project Team
SGArchitects
Sandeep Gandhi
Ankur Dadheech
Fazio Engineerware
Dr. Joseph Fazio
I-Trans
Ravi Gadepalli
Technical Advisor
TRIPP, IIT Delhi
Prof. Geetam Tiwari
Pushkar Makarand Dhawale

[BRTS Evaluation and Design (BEAD) Tool, Interim Report, Oct 2011]
11 SGArchitects
Explanation of Terms Used in this Report
PPHPD Passengers per hour per direction
O-D Origin to Destination; or Origin and/or Destination
Transfer or Interchange Interchanging routes mainly between feeder and trunk route in a
closed system
No Interchange Refers to direct route moving both within the BRTS corridor and
outside in mixed conditions.
BRTS Bus Rapid Transit System
Tool Referred to the BEAD tool
Straight Bus Buses moving straight along the corridor at signalized intersection
Turning Bus Buses turning off the corridor at signalized intersection
BPHPD Buses per hour per direction
Xing Crossing or Intersection, generally signalized
Common buses or common
lane
Refers to buses in common lane or the lane hosting both straight
moving and turning buses
FOB (Pedestrian) Foot over bridge

[BRTS Evaluation and Design (BEAD) Tool, Interim Report, Oct 2011]
12 SGArchitects
1 Background Bus Rapid Transit System or BRTS is a bus based transit system which allows higher speed, capacity
and safety of buses by segregating them from other traffic on a roadway into a separated bus way.
As more and more cities throughout the world opted for BRTS, further work into BRTS design and
performance has made BRTS evolve into an advanced and optimized “bus” system with increasingly
flexible and adaptable, operational and service characteristics. More than 150 cities in the world
now operate BRTS corridors. No two systems are identical; their characteristics vary. Their
uniqueness is because the system is flexible enough to allow variation and adaptation. A BRTS is
custom built to the needs of the city. However, BRTS uniqueness leads to debates on which features
are better and in which manner is it better.
The development of BRTS in India has been taken up on a large scale by more than 11 Indian cities
and a total of more than 1250 km of BRTS is slated to be developed in the country mostly supported
by the Ministry of Urban Development, Government of India (MoUD) under the JnNURM mission.
More than 100 parameters are involved in the design of BRT. About 1/3rd
are related to site
conditions and hence fixed. The balance 2/3rd
parameters are variable and depend on design. There
is a perennial controversy on several design features such as;
a) Dedicated lanes in the middle of the road or on the sides
b) Location of stations on the right hand or left hand side
c) Distance of station platform from the road intersection
d) Height of the station platform and the bus floor
e) Signal cycle phasing
Discussion on the merit and demerit of each alternative design feature is at present subjective and a
rational decision is not possible.
Thus there exists an urgent need for an evaluation tool, which can provide quantified evaluation of
alternative design features to the planners and engineers (or the consultants) and the Municipal
and/or development authorities of the city; for a rational decision making.
This has led to the development of the Bus Rapid Transit System (BRTS) Evaluation and Design
(BEAD) Tool. This is is a *.xls based interactive tool which allows engineers, planners, designers and
decision makers to make a comparative evaluation against any proposed changes in the features
(and their configuration) in a (BRT) system.
The tool provides the effect on journey speed, throughput capacity of the system and number of
buses needed due to change in multiple design parameters. In a typical case the impact on the
performance of the system due to the use of alternative design features can be evaluated due to
comparative assessment. In addition the tool can be used to generate data for research and
academic use.

[BRTS Evaluation and Design (BEAD) Tool, Interim Report, Oct 2011]
13 SGArchitects
2 Approach
The development of BEAD arises from the need for a tool which can provide planners/designers with
a comparative evaluation of BRTS system before its implementation and operations. To allow this
the exact details of the system need to be defined in a manner which can form the basis for
application of standard public transport theories and formulas. The tool may then use the fed
processes to calculate and present the expected performance of the system in a measurable format.
To do so the tool has been designed with three integrated parts which also form the stages of the
estimation of final output. These are:
1. Input Fields
2. Calculation
3. Result Output
The project team undertook detailed discussions with its technical advisor, i.e. TRIPP, IIT Delhi on the
finalization of the parts of the tool mentioned above. These were based on the experience of the
team members in developing and assessing a number of BRTS projects as well as their understanding
of best practices from a variety of case studies and other literature.
The second important step was to finalize the performance indicators which would be presented
and compared in the output results. It is understood that the key performance indicators mainly
focus on a global indicator (defined by agencies such as UNEP) which focuses on the reduction of
green house gases (GHGs) and local (such as those set by project operators) who focuses on the
increase in the passenger usage. These two are interconnected if the increase in passengers can be
shown as a result of migration from private motorized modes or even if the current rate of migration
to the private modes is shown to minimized.
This requires that the utility of the proposed BRT system be higher than what is derived from the use
of private motorized modes. Transportation models such as proposed by Oort (1969) use the
concept of maximizing utility by increasing work time, time for leisure, reducing expenditure (or
increasing income) and reducing the unpleasantness of travel (or reducing the time spent in travel
when not undertaken for leisure) (Sergio R.Jara-Diaz 303-19). Hence for most work trips served by
public transport, utility can be maximized by minimizing the cost of travel, journey time and
inconvenience or unpleasantness involved. In other words performance indicator of a good public
transport mode can be defined as those which relate to reduced journey time, reduced cost, and
increased comfort over private motorized (or more inefficient) modes; thereby maximising the
chances of a migration to public transport leading to increased passenger demand (to match the
local performance indicator) and increased efficiency leading to reduced GHGs (to match the global
indicator).
The common factors affecting all these parameters are delays experienced by transit vehicles and
passengers as well capacity of the system. These can be broadly categorized as:
• Faster door to door connectivity,
[BRTS Evaluation and Design (BEAD) Tool, Interim Report, Oct 2011]
14 SGArchitects
• Higher capacity for better convenience and comfort
• and resultant reduced out of pocket travel cost
Thus when systems or their features, reduced delays (directly leading to reduced journey time) and
better capacity (subject to projected demand) can be used as effective indicators for evaluation.
The performance indicators have been broadly based on the delays involved in different parts of the
journey and the expected capacity of the system. These have been broken down in to further details
for easy and direct comparison by the users. Using these indicators along with the finalized filed and
equipped with standard transit capacity, headway and frequency equations the first Beta version of
the tool was based developed and the results validated using three well documented BRTS corridors,
i.e. Delhi, Ahmadabad and Bogota.
Following this feedback of other experts and consultants in the field was collected as a part of the
first BEAD workshop organized by IUT, at TRIPP, IIT Delhi on July 25, 2011 (Annexure 1). This was
used to update the list of input fields and also to upgrade the calculations and processes in the tool,
leading to the second Beta version of the tool.
This improved version was upgraded using the VBA script in the MS Excel software and allowed
additional features of specifying multiple different segment designs on a single corridor to arrive at
an overall and segmental corridor performance. The improved version was presented in a two day
seminar organized by IUT in Goa on October 21-22, 2011 (Annexure 2). This workshop was attended
by expected users of the tool including Municipal and Development bodies undertaking the
development of BRTS in six different cities, consultants, operators, project regulating agencies
(UTTIPEC) and NGOs (ITDP). The feedback collected from this workshop is currently being used to
improve the presentation and usability of the results. For example as a part of the feedback received
from the participants, the development team is undertaking a consultation with TRIPP, to finalize the
Service Level benchmarking of an input design or a segment design based on the performance
criterion.

[BRTS Evaluation and Design (BEAD) Tool, Interim Report, Oct 2011]
15 SGArchitects
3 Methodology – Working of BEAD ToolThe tool relies on inputs provided by the user. It combines this with pre
partial picture of the proposed design and all its features. To complete the picture, the signal phase
plan of intersections involved and cross section design at bus shelters is required. The tool generates
a signal design (phase plan and cycle length) along with a cross section design at station. The user
can check and finalize these. Internal logic is used by the tool to g
passengers in the system based on average values (as defined in the user input or the base data).
The tool then uses this behaviour inputs along with signal phase plan, cross section design, user
inputs and base data to generate the expected capacity of the system, which is subsequently used to
generate delays expected when the system operates at that capacity. These delays are generated
both for within the system and outside the system (access delays) and can be used to ge
average speed of buses within the corridor as well the average journey time (for the average trip
length in the city). The diagrammatic representation of this methodology has been presented in
Figure 1: BRTS Evaluation and Design (BEAD) tool M
The working of the tool required scores of complex interconnected processes, to allow estimation of
the effect on performance against the use of all variables in all possible combination with each
other. This required developing a detailed picture of the design. The project team concluded that the
in order to make the tool user friendly, the input variables are required to be understood and easily
provided by the user. To achieve this all inputs to the tool have been d
are:
• User Input
• Default Variables (editable by user on demand)
• Base Assumptions
In addition the tool needed to fix the boundary limits of all values to ensure that the inputs comply
with the broad BRTS planning and design
the working of the tool has been defined. These principles have been listed below along with the list
of Input fields used in the tool.
[BRTS Evaluation and Design (BEAD) Tool, Interim Report, Oct 2011]
Working of BEAD Tool The tool relies on inputs provided by the user. It combines this with pre-fed base data to generate a
partial picture of the proposed design and all its features. To complete the picture, the signal phase
ons involved and cross section design at bus shelters is required. The tool generates
a signal design (phase plan and cycle length) along with a cross section design at station. The user
can check and finalize these. Internal logic is used by the tool to generate behaviour of vehicles and
passengers in the system based on average values (as defined in the user input or the base data).
The tool then uses this behaviour inputs along with signal phase plan, cross section design, user
nerate the expected capacity of the system, which is subsequently used to
generate delays expected when the system operates at that capacity. These delays are generated
both for within the system and outside the system (access delays) and can be used to ge
average speed of buses within the corridor as well the average journey time (for the average trip
length in the city). The diagrammatic representation of this methodology has been presented in
on and Design (BEAD) tool Methodology
of the tool required scores of complex interconnected processes, to allow estimation of
the effect on performance against the use of all variables in all possible combination with each
developing a detailed picture of the design. The project team concluded that the
in order to make the tool user friendly, the input variables are required to be understood and easily
provided by the user. To achieve this all inputs to the tool have been divided in to three parts. These
Default Variables (editable by user on demand)
In addition the tool needed to fix the boundary limits of all values to ensure that the inputs comply
design principles. For this the, a set of principles or base log for
the working of the tool has been defined. These principles have been listed below along with the list
fed base data to generate a
partial picture of the proposed design and all its features. To complete the picture, the signal phase
ons involved and cross section design at bus shelters is required. The tool generates
a signal design (phase plan and cycle length) along with a cross section design at station. The user
enerate behaviour of vehicles and
passengers in the system based on average values (as defined in the user input or the base data).
The tool then uses this behaviour inputs along with signal phase plan, cross section design, user
nerate the expected capacity of the system, which is subsequently used to
generate delays expected when the system operates at that capacity. These delays are generated
both for within the system and outside the system (access delays) and can be used to generate the
average speed of buses within the corridor as well the average journey time (for the average trip
length in the city). The diagrammatic representation of this methodology has been presented in
of the tool required scores of complex interconnected processes, to allow estimation of
the effect on performance against the use of all variables in all possible combination with each
developing a detailed picture of the design. The project team concluded that the
in order to make the tool user friendly, the input variables are required to be understood and easily
ivided in to three parts. These
In addition the tool needed to fix the boundary limits of all values to ensure that the inputs comply
set of principles or base log for
the working of the tool has been defined. These principles have been listed below along with the list

[BRTS Evaluation and Design (BEAD) Tool, Interim Report, Oct 2011]
16 SGArchitects
3.1 Principles or Base Logic behind the Working of BEAD
The tool is a Microsoft excel based mathematical model based on assessing junction and station
access and delays. It is based on the principal that performance of vehicles (buses) in a controlled
environment (such as segregated lane) is predictable through a simple analytical process. Main
variable factors affecting this performance in a linear relationship are:
• Station Gaps
• Acceleration/Deceleration
• Peak speeds
• Signal Delays (based on signal cycle and crossing distances)
• Stacking delays (Based on capacity)
• Dwell time (based on steps to entry)
The broad listing of principles (in defined categories) used for establishing the platform for
estimating the performance indicators in BEAD are as following:
3.1.1 Signal Cycle Design
• Signal phase design is required to assess bus and pedestrian crossing delays as well
maximum and minimum throughput possible
• Total no. of phases shall be assessed from bus and vehicle turning requirement and arms at
junction
• Signal cycle length shall be optimized from input to be in the range of 150 to 225 sec for 4
arm junction, 90 to 180 sec for 3 arm junction and up to 90 sec for mid block stations
• Cycle length optimization shall be based on bus phase length as min. 8% of cycle time within
12-21 sec range
• Multiple bus lanes at junction/intersection allow phase design with separate phases for
straight and turning vehicles.
• In the absence of additional turn lanes (with turn requirements) for buses, phase design is
sequential with common straight and turn phases for all arms.
• Model shall allow modification of output results.
3.1.2 Cross Section Design
• Cross section design is required for assessing crossing delays
• Cross Section design development shall assumes provision of bus lanes, car lanes, pedestrian
paths, cycle tracks, service lanes, green belt, parking, turning pockets, medians segregators
etc.
• It shall works on allocating a range of width to each, and starts from bus lanes and bus
shelter width allocation based on station type and bus lane configuration input.

[BRTS Evaluation and Design (BEAD) Tool, Interim Report, Oct 2011]
17 SGArchitects
• It shall allocate width for remaining ROW in order of priority, allowing minimum width
allocation to all primary functions, i.e. car lanes, pedestrian path and cycle infrastructure.
• The cross section design shall be editable by the user and the edited cross section design
shall be used in the estimation of values for the performance indicators.
3.1.3 Capacity Estimation
• The tool shall to maximize capacity based on constraints such as:
– Stacking length available before and/or after the intersection.
– Cumulative green phase available to throughput buses.
• Capacity of the system is effected by the following (which impact minimum headway,
frequency, etc.):
– Signal Cycle design
– Junction width
– Bus length
– Acceleration/Deceleration
– Dwell time
Performance Estimation
• Performance shall be estimated based on point to point journey time of average motorized
trip length in city
• Additional factors for estimating performance shall be:
– Total walking distance per passenger in a return trip
– Average speed within corridor (including delays faced by buses at signal)
– Access delays to stations
– Interchange Delays
– Access delays to feeder buses
• In a closed system 100% of the trips shall be interchange trips. In an open system a specified
percentage can be defined as interchange trips between the main corridor and feeder routes
for access and egress.
• Fixed trip composition in terms of distance from corridor (ex. Avg. trip length more than
6.5km) is defined against the land use along the corridor (specified as user input) and the
average motorized trip length for the corridor or for the city.
• Other factors that shall determine the performance of the system are:

[BRTS Evaluation and Design (BEAD) Tool, Interim Report, Oct 2011]
18 SGArchitects
– Average bus speeds in mixed condition
– Average walking speeds
– Average delays (based on feeder and main line frequencies), etc.
– Crossing distances and signal timings on the corridor and side roads
3.2 Input Fields
The tool relies on inputs provided by the user. It combines this with pre-fed base data to generate a
partial picture of the proposed design and all its features. These input elements are been further
categorized in three different levels. These levels are as follows:
3.2.1 User Inputs
These variables are necessary to be provided by the user and will vary from corridor to corridor and
segment to segment within the corridor. These variables define a specific design and thus cannot be
generalized.
1. Global
a. System - Open or Closed
b. City Profile – Average Speeds, Trip length
2. Macro
a. Corridor – length, segments
b. Bus Lanes – Type and location
3. Micro
a. Station – Island, staggered, mid block, junction
b. Junction – Signalized, roundabout, ped only, signal free
c. Signal Design – Cycle length, special phase requirements, etc.
d. Special – Off board ticketing, bus boarding doors.
Figure 2: Categorization if Input fields for BEAD Tool
Global
• System - Open or Closed
• City Profile – Average Speeds, Trip length
Macro
• Corridor – length, segments
• Bus Lanes – Type and location
Micro
• Station – Island, staggered, mid block, junction
• Junction – Signalized, roundabout, ped only, signal free
• Signal Design – Cycle length, special phase requirements, etc.
• Special–Off board ticketing, bus boarding doors, dedicated Ped. phase
[BRTS Evaluation and Design (BEAD) Tool, Interim Report, Oct 2011]
19 SGArchitects
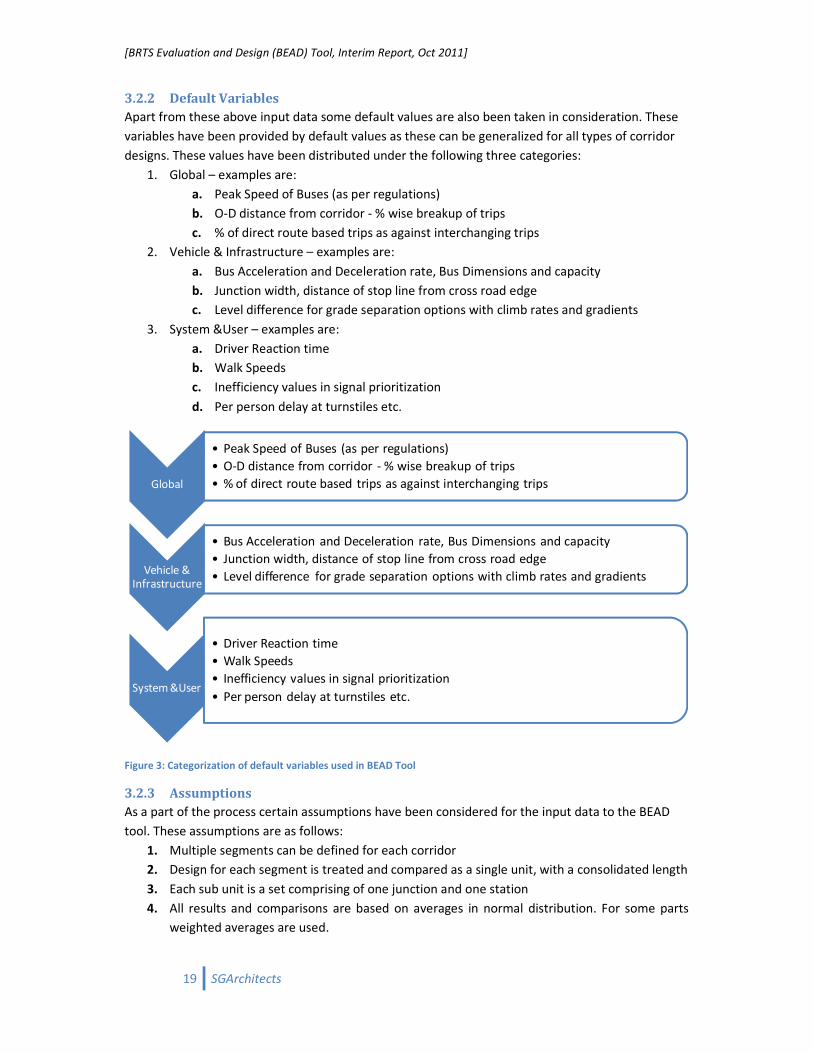
3.2.2 Default Variables
Apart from these above input data some default values are also been taken in consideration. These
variables have been provided by default values as these can be generalized for all types of corridor
designs. These values have been distributed under the following three categories:
1. Global – examples are:
a. Peak Speed of Buses (as per regulations)
b. O-D distance from corridor - % wise breakup of trips
c. % of direct route based trips as against interchanging trips
2. Vehicle & Infrastructure – examples are:
a. Bus Acceleration and Deceleration rate, Bus Dimensions and capacity
b. Junction width, distance of stop line from cross road edge
c. Level difference for grade separation options with climb rates and gradients
3. System &User – examples are:
a. Driver Reaction time
b. Walk Speeds
c. Inefficiency values in signal prioritization
d. Per person delay at turnstiles etc.
Figure 3: Categorization of default variables used in BEAD Tool
3.2.3 Assumptions
As a part of the process certain assumptions have been considered for the input data to the BEAD
tool. These assumptions are as follows:
1. Multiple segments can be defined for each corridor
2. Design for each segment is treated and compared as a single unit, with a consolidated length
3. Each sub unit is a set comprising of one junction and one station
4. All results and comparisons are based on averages in normal distribution. For some parts
weighted averages are used.
Global
• Peak Speed of Buses (as per regulations)
• O-D distance from corridor - % wise breakup of trips
• % of direct route based trips as against interchanging trips
Vehicle & Infrastructure
• Bus Acceleration and Deceleration rate, Bus Dimensions and capacity
• Junction width, distance of stop line from cross road edge
• Level difference for grade separation options with climb rates and gradients
System &User
• Driver Reaction time
• Walk Speeds
• Inefficiency values in signal prioritization
• Per person delay at turnstiles etc.

[BRTS Evaluation and Design (BEAD) Tool, Interim Report, Oct 2011]
20 SGArchitects
5. Nodes or cross roads are assumed as destinations for commuters, and delays estimated
accordingly
6. The corridor is assumed with BRT only operations, no other parallel modes exist.
7. All interchange access and egress trips are assumed to be walk trips, to minimize travel cost.
8. Feeder trips longer than 0.5km are assumed as bus trips in mixed condition
9. Each dedicated bus phase is not more than 10-15% of signal cycle length
10. Fixed % of trips assumed for up to 0.5km from corridor, 0.5 to 1 km from corridor, 1-2km
from corridor and 2-3km from corridor for different average trip lengths.
11. System capacity is independent of demand, and demand is not estimated by the tool.
12. All crossing distances for pedestrians are calculated from primary pedestrian paths or those
which are adjacent to the carriageway and not those next to the building boundary.
13. Bus dwell time is estimated for average 10% passenger exchange for average bus capacity,
with 2 second additional time each to account for reaction time for door opening/closing as
well door opening and closing time each.
Figure 4 to Figure 12 below present an impression of the input forms as seen by the user of the
BEAD tool. These forms have been categorized as per the above mentioned principles. The first or
the base form allows user to define corridor specific parameters, whereas the following forms are
repeated for each segment of the corridor to allow the user to input design parameters specific to
each different segment on the corridor. Each segment on the corridor is defined by the difference in
decisive design factors such as intersection, station or signal design, and similar design although
separated on the corridor, can be clubbed as one segment under a sum total of their lengths. The
tool allows and output showing individual segment results as well as combined or overall corridor
performance results. A detailed list of all input variables and default values presented on the forms
has been listed in Annexure 3.
Figure 4: BEAD Tool – First Page form

[BRTS Evaluation and Design (BEAD) Tool, Interim Report, Oct 2011]
21 SGArchitects
Figure 5: BEAD TOOL – Default variables form

[BRTS Evaluation and Design (BEAD) Tool, Interim Report, Oct 2011]
22 SGArchitects
Figure 6: BEAD Tool - Segment Details form

[BRTS Evaluation and Design (BEAD) Tool, Interim Report, Oct 2011]
23 SGArchitects
Figure 7: BEAD Tool – General inputs form
Figure 8: BEAD Tool - Intersection (for junction stations), input form

[BRTS Evaluation and Design (BEAD) Tool, Interim Report, Oct 2011]
24 SGArchitects
Figure 9: BEAD Tool – Station Design input form (common for junction or mid block stations)
Figure 10: BEAD Tool - Additional junction input form, specific for junctions between mid block stations

[BRTS Evaluation and Design (BEAD) Tool, Interim Report, Oct 2011]
25 SGArchitects
Figure 11: BEAD Tool – Results/Output sheet
[BRTS Evaluation and Design (BEAD) Tool, Interim Report, Oct 2011]
26 SGArchitects
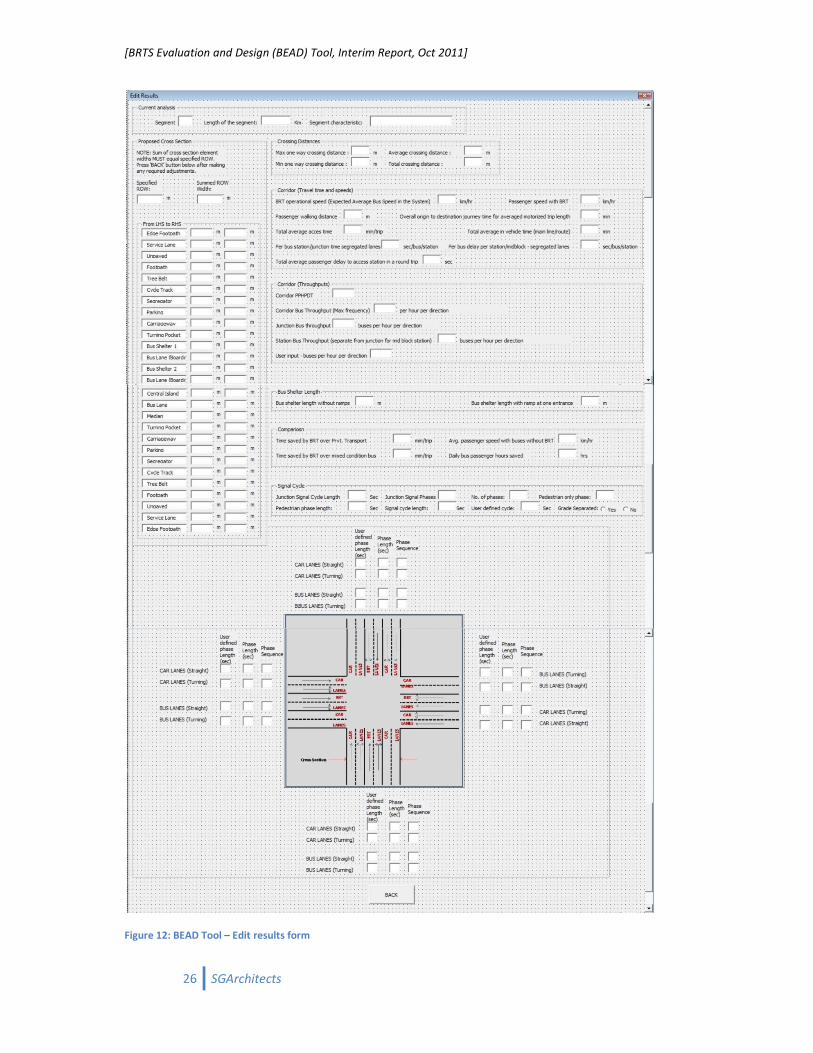
Figure 12: BEAD Tool – Edit results form

[BRTS Evaluation and Design (BEAD) Tool, Interim Report, Oct 2011]
27 SGArchitects
3.3 Background Processes and Calculations
This section explains the background processes and calculations undertaken by the tool, using the
input data, principles and assumptions; in order to generate the output results. To understand these
processes one needs to first understand the theoretical base of the system.
3.3.1 The Theoretical Base
This consists of the background formulas. All processes in the BEAD tool are based on these standard
formulas and guidelines. Some of the formulas used are as following table:
Process Formula
Line Capacity C = Cv*n*f*α (at σ of 0.3)
Headway (in min) H = 60/f
Min Headway (reaction time
modified)
Hmin
= ts +(t
r*ns) + n*l’/v + v(k + 1)/2b + √(2*ns*l’/a)
Operation Time for buses To = n
s (t
a + t
b + t
s) + ∑t
vi
Operation Speed Vo = 3600* L/T
o
Min Gap between buses S
min = V
2
*(a+b)/(5*a*b)
Poisson Distribution P(x) = e-λ
*λx/x!
Where:
C Line Capacity
Cv Vehicle capacity in spaces per vehicle
n No. of vehicles in each transit unit
f Frequency in terms of transit units per hour per direction
α Load Factor of vehicle
σ Comfort Factor in terms of sq. m. per person for standing space in the vehicle
H Headway in min.
Hmin
Minimum headway possible (not including junction delays)
ts Station time in seconds (includes dwell time)
ns No. of stations on a line or on a corridor
tr Driver Reaction Time
l’ Vehicle length in m.
v Approach velocity of vehicle approaching bus station
k Safety constant (assumed as minimum spacing between buses = 1m)
a Acceleration rate in m/s2
b Deceleration rate in m/s2
To Operational time in sec (total time consumed in operations on a line)
ta Time consumed during acceleration by the transit vehicle in seconds
tb Time consumed during deceleration by the transit vehicle in seconds
tvi Time consumed in sec during cruising of bus between two subsequent station intervals, i
Vo Operational speed in km/hr
L Total corridor length in km
[BRTS Evaluation and Design (BEAD) Tool, Interim Report, Oct 2011]
28 SGArchitects
V Peak transit vehicle speed in km/hr.
Smin Minimum distance in m, between two subsequent transit vehicles
P(x) Probability of X
e Exponential (constant =
λ Rate of arrival of transit vehicles at a junction
x No. of transit vehicles arriving at an intersection in a unit time
The above standard formulas and guidelines, are from Urban Transit, Operations, Planning and
Economics by Vukan R. Vuchic. Standards for lane widths and other dimensions for cross section
design have been used from ‘Recommendations for Traffic Provisions in built-up areas (ASVV)
CROW’, Record 15.
In addition to using standard textbook formulas to achieve the results the tool uses data derived
from primary survey conducted to estimate per passenger boarding alighting time for buses with
varying floor height relative to bus platform height. The data collected as a part of this survey has
been presented in Annexure 4 and the results have been presented below.
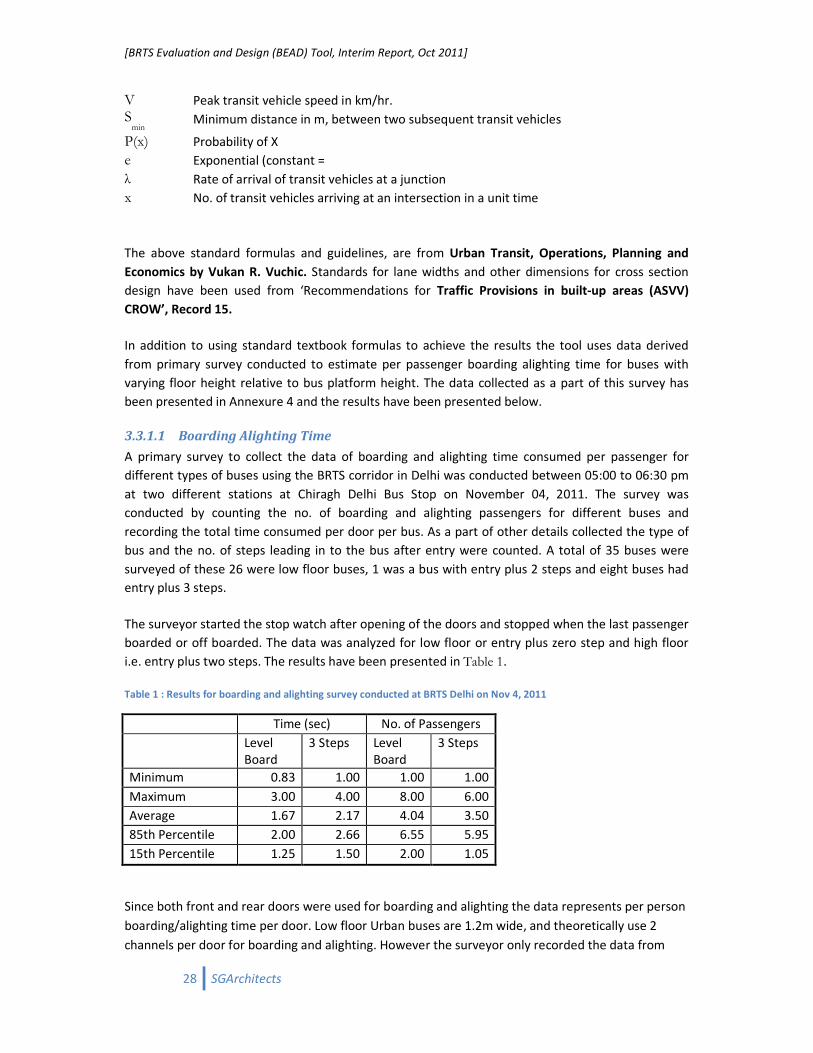
3.3.1.1 Boarding Alighting Time
A primary survey to collect the data of boarding and alighting time consumed per passenger for
different types of buses using the BRTS corridor in Delhi was conducted between 05:00 to 06:30 pm
at two different stations at Chiragh Delhi Bus Stop on November 04, 2011. The survey was
conducted by counting the no. of boarding and alighting passengers for different buses and
recording the total time consumed per door per bus. As a part of other details collected the type of
bus and the no. of steps leading in to the bus after entry were counted. A total of 35 buses were
surveyed of these 26 were low floor buses, 1 was a bus with entry plus 2 steps and eight buses had
entry plus 3 steps.
The surveyor started the stop watch after opening of the doors and stopped when the last passenger
boarded or off boarded. The data was analyzed for low floor or entry plus zero step and high floor
i.e. entry plus two steps. The results have been presented in Table 1.
Table 1 : Results for boarding and alighting survey conducted at BRTS Delhi on Nov 4, 2011
Time (sec) No. of Passengers
Level
Board
3 Steps Level
Board
3 Steps
Minimum 0.83 1.00 1.00 1.00
Maximum 3.00 4.00 8.00 6.00
Average 1.67 2.17 4.04 3.50
85th Percentile 2.00 2.66 6.55 5.95
15th Percentile 1.25 1.50 2.00 1.05
Since both front and rear doors were used for boarding and alighting the data represents per person
boarding/alighting time per door. Low floor Urban buses are 1.2m wide, and theoretically use 2
channels per door for boarding and alighting. However the surveyor only recorded the data from

[BRTS Evaluation and Design (BEAD) Tool, Interim Report, Oct 2011]
29 SGArchitects
buses where people boarding or alighting used a single channel even in low floor buses. This was
done for easy comparison with high floor buses which had single channel of passenger movement on
each door due to reduced width. Also since the data is only available for zero or three steps inside
the bus; the average per passenger time required for boarding and alighting have been interpolated
for one and two steps inside the bus. This has been presented in Table 2
Table 2 : Average per passenger time required for boarding or alighting low floor (level boarding), one step inside two
steps inside and three steps inside the bus.
Time in Sec
Level Board 1.67
1 step 1.83
2 step 2.00
3 Step 2.17
The data has primarily been collected from standard and urban buses. These have 2 channels for
boarding and alighting. The average capacity of these buses is assumed to be 60 on the basis of at σ
of 0.3. The assumed that on an average 10% passenger exchange takes place at each station,
i.e. 6 boarding and 6 alighting passengers from each channel. Using this and a 2 second time
penalty for opening and closing of doors and reaction time on part of the driver to do so, the
following dwell time values are generated for buses with varying floor height with respect to
platform level:
• Level Boarding or no steps inside the bus = 1.67*6 + 4 = 14 sec
• Boarding with 1 step inside the bus = 1.83*6 + 4 = 15 sec
• Boarding with 2 steps inside the bus = 2.00*6 + 4 = 16 sec
• Boarding with 3 steps inside the bus = 2.17*6 + 4 = 17 sec
Since no. of channels increase proportionately with the size of the transit vehicle, it is assumed that
vehicle type has no impact on the dwell time, and it is only dependent on the no. of steps
encountered by the passengers on entering the bus. Thus the tool uses a one second penalty for
every step added after entering the bus or as a result of level difference between the bus floor and
the platform height.
3.3.2 Description of Processes
The equations and assumptions explained above have been built into a number of sequential
processes, which generate the output of the tool. As per the overall methodology represented in
Figure 1 above, the eventual estimation of delays, used in the output, requires the system capacity
as the input while estimation of system capacity require the signal phase design and cross section
design as the input, along with other user input and default variables that are used selectively in all
processes. Thus the processes designed in tool follow this sequence, i.e. signal and cross section
design, followed by capacity estimation, followed by delay estimation. However for the purpose of
explanation the processes presented in Annexure 5 and explained below have been described from
the final output backward.

[BRTS Evaluation and Design (BEAD) Tool, Interim Report, Oct 2011]
30 SGArchitects
The tool uses close to 200 interrelated processes, of which 76 have been presented in Annexure 5.
Some of the critical logic or processes used in the tool have been explained below under three
heads:
• Vehicle Bus Behaviour Logic and Processes applied in the tool
• Commuter Behaviour Logic (outside the vehicle)
• Signal Cycle Design Logic
Before getting in to the description of these processes, it is important to discuss the potential and
the limitations of the tool. The tool in its current form is a ‘vba’ script based tool written on the base
Microsoft Excel software. The tool allows the user to define the corridor as a sum of distinctly
different segments, each of which can be defined in detail using a set of input forms (separate for
each segment). This is why though for a closed system, the user is prompted to not select bus
turning option at intersections, for an open system, some segments can be chosen with bus turning
at intersection, while others can be without bus turning option, allowing one to generate a hybrid
system design.
After inputting the data for each segment the tool presents the performance of the segment design
as an output sheet which can be printed. When the user chooses to fill or define the next segment of
the corridor design in the tool the output results of the first tool are saved by the tool, and the
process follows for all designed segments. At the end of this process the tool prompts the user to
save an output file at a user prescribed location. The output file is generated in an ‘xls’ format to
allow the users to use the result for any further analysis. The output file, present s all input values
for all segments along with the summary of results for each segment along with an overall result for
the combined corridor (considering the effect of all corridors on important performance indicators
such as corridor capacity, passenger speeds, operational speeds etc. The output results have been
explained in detail in section 3.4 of this report.
3.3.2.1 Vehicle/Bus Behaviour Logic applied in the Tool
The following logic has been used for vehicle behaviour in the processes generated by the tool.
1. Vehicle movement is simplified for estimation purposes, hence the following logic is used:
a. Vehicles/Buses accelerate and decelerate at a constant rate.
b. The acceleration and deceleration of buses has been set as 1 m/s2 in the default
sheet and can be modified to have a value of between 0.5 to 1.5 m/s2
2. Vehicle movement is governed by efforts to minimize delay. To achieve this following logic is
used.
a. Vehicles try to achieve the peak speed (as defined in the default input data) after
acceleration. Vehicles never cross the speed limit and may remain slightly below it
(for cruising calculations) due to estimation processes.
b. Peak bus speed is considered as the desirable speed limit in bus lanes. This is set as
40km/hr. (for safety considerations) in the default input sheet.
c. Vehicles try to accelerate (at defined constant acceleration rate) to a maximum
speed even for short distances, thus vehicles will switch from acceleration to
deceleration without moving on constant speed when short distance are to be
covered.

[BRTS Evaluation and Design (BEAD) Tool, Interim Report, Oct 2011]
31 SGArchitects
d. Start up delay on account of reaction time for bus drivers is assumed to be 2
seconds.
e. Buses occupy the first empty bay while approaching bus station. Bus speeds and
delays are estimated based on average delays at bus stations and intersections.
f. For delay estimation, the tool estimates the combined delay of station and signal for
junction stations (because of their close proximity they work as one system),
whereas for mid block stations the station delay is estimated along with the delay at
the pedestrian signal (in case of the signalized crossing because of their expected
close proximity), whereas the intersection (between mid block stations) delay is
estimated independently and combined with the station delay to arrive at an
estimate of an overall delay (for buses at stations and intersection). For situations
where mid block stations falls within two junction stations, the segments of the
corridor (as defined in the master corridor input data form, by the user) explaining
the mid block design considers the junction between two mid block stations as
signal free and its location or distance from the mid block station is termed as the
average distance to a major road meeting the corridor (where only left turns are
allowed as no intersection for bus or vehicular turning exists).
g. Delays are estimated based on the smallest unit of length between two stations
(based on average gap between stations input by users). This unit of design is
constructed for each specific segment of the corridor on the basis of inputs by the
user in the global variables, user input form. This unit length covers one station, and
one signalized intersection, based on the assumption that between each set of mid
block stations lies a single signalized intersection, whereas between junction
stations lies no mid block station. In this manner the tool compares smallest unit of
design, and indicates the impact of corridor (in terms of travel time and capacity)
assuming a uniform reproduction of the defined unit throughout the segment.
Distinctly different design sections of the corridor may be defined as different
segments in the master sheet, and the tool will allow the user to subsequently input
uniform values for different segments, and the combined corridor performance is
presented in the output xls file.
h. Bus delays are estimated on the basis of per bus delay assessment at a signal. This is
based primarily on the weighted average delay experienced due to the red phase of
the signal. The weighted average is derived to account for zero delay for buses
arriving during the green phase of the signal (this is why average value of the total
red phase is not used).
i. Average bus speed of buses in mixed condition (refer Figure 55 ) is estimated on the
basis of average vehicular speed in mixed condition discounted for the lower
acceleration and deceleration of buses (than motorized four and two wheelers) and
the frequent stops. To assess this the following assumptions are made:
i. Average distance between stations in mixed condition is assumed to be the
same as that specified for the corridor.
ii. Average running speed of buses in mixed conditions (including delays at
junctions) is assumed to be 80% of the average vehicular speed in the city.
iii. Buses docking at curb side station in mixed condition are assumed not to be
delayed due to a queue of buses waiting to dock at the station (as in practice

[BRTS Evaluation and Design (BEAD) Tool, Interim Report, Oct 2011]
32 SGArchitects
buses spill-over on to the general vehicular lanes or use the same for
overtaking). Hence at a time only one bus is assumed to arrive at the bus
stop and thus the acceleration deceleration time and the dwell time is
accounted for accordingly in the average speed estimation
iv. The average dwell time of buses in the mixed condition is assumed to be the
same as the dwell time of buses estimated for the corridor.
j. Average delay experienced by each bus per signal cycle per direction is used as an
important means to estimate the overall system delays and the resultant travel time
and average speed of buses in the corridor. Different principles are used for the
assessment of this junction delay for buses for different station-junction
configurations. These are as following:
i. For Near side (staggered) stations (both for junction or mid block) (Figure
57) – In case of junction stations the common pedestrian cum vehicular
crossing signal design is used for assessment, while in case of mid block
stations the pedestrian signal design (where used) is used for the
assessment of delay. For all station configurations, the capacity is based on
the throughput possible in one signal cycle. Hence for delay estimates and
important understanding is that the bus delay is in no condition longer than
the signal cycle. For near side stations the bus must board and offload
passengers before passing through the junction, and hence minimum delay
is the dwell time and the reaction time involved. Add to this the necessary
time lost in acceleration and deceleration of the bus. Thus even if the bus is
ready to leave within the green phase of the signal (signal delays are zero),
the minimum delay is the dwell time + reaction time + acceleration and
deceleration time lost. Additional delays can be the delay caused by waiting
at the signal and the delay caused because of waiting outside the station in a
queue of buses. Thus in the worst case scenario the delay shall be dwell time
+ reaction time + acceleration and deceleration time lost + time lost in
waiting for a boarding slot at the station (buses queuing to enter station) +
delay at the signal during the red phase. Since all buses must pass through
during one signal cycle the maximum red phase delay has to be longer than
or account for the time lost in waiting for a boarding slot at the station
(buses queuing to enter station). In other words for the average delay (or in
a controlled scenario) buses will find a boarding slot within the red phase of
the signal. Thus the maximum delay can be calculated by dwell time +
reaction time + acceleration and deceleration time lost + maximum delay at
the signal during the red phase. Thus average per bus delay at the signal can
be estimated by - dwell time + reaction time + acceleration and deceleration
time lost + average delay at the signal during the red phase. However
average delay at the signal phase is weighted to account for the green phase
duration and hence the weighted average signal delay is used. The delay is
estimated separately for straight moving and turning buses (Figure 58).
Turning bus delay differs from straight moving buses as in case of overtaking
lanes the signal delay for turning buses is different from that of straight
moving buses.

[BRTS Evaluation and Design (BEAD) Tool, Interim Report, Oct 2011]
33 SGArchitects
ii. Far side stations – In case of far side stations, delay at station (including the
delay at signalized pedestrian and/or vehicular crossing) has to estimated on
the basis of whether the station is with or without overtaking lane, and
separately for turning and straight buses (Figure 61 –straight moving bus
delay at far side stations with overtaking lane, Figure 62 – turning bus delay
at far side stations with overtaking lane, Figure 65 – straight moving bus
delay at far side station without overtaking lane, Figure 66 – turning bus
delay at far side stations without overtaking lanes). This is because the
stations with overtaking lanes allow additional stacking of buses in the
overtaking lane and thus allow higher capacity. The tool assumes that the
boarding lane is used for stacking of straight arriving buses while the
overtaking lanes is used by buses which have turned in to the corridor from
cross roads (in case where turning at junctions is allowed). Thus this effect
the station length as the no. of boarding bays are divided into bays serving
straight arriving and turned in buses, and the two sets are separated by a
length equivalent to the bus length + 3 m (to allow manoeuvring of buses).
Thus in case of stations with overtaking lanes on the far side the station
length also gets effected thereby impacting the acceleration/deceleration
delays and capacity. Here increased capacity in turn results in increase
delays as all buses stack during green phases of different arms. But they are
processed gradually and hence the stacked buses experience delay which is
directly proportional to the total buses waiting in the queue, thereby
increasing the average delay considerably.
iii. Common or Island Stations – Since at island stations, buses for both
direction dock at the same platform (that is why it is known as a common
station), it is located such that it is on the near side of junction for one
direction of bus movement and on the far side for the other direction.
Hence the average per bus delay expected for straight moving buses is the
average of delay expected at near side station and that expected at far side
stations for the capacity calculated by the tool for common stations. This is
achieved separate for straight buses at stations with (Figure 69) and without
overtaking lane(Figure 70) as well turning buses at common station with
(Figure 71) and without overtaking lanes (Figure 72).
3. Intersection signal phasing plays an important role in estimating bus delays, which effect
average operational and passenger speeds in the corridor in the corridor. The delays at
signal are estimated per bus, based on averages. The following logic is used to assess delays
at signalized intersections (with cross roads, i.e. 3 or 4 arm junction):
a. Weighted average of bus delay per cycle is used to estimate average per bus delay at
the signal.
b. If the design allows the use of priority signal for buses, the tool estimates the
reduction in signal delay on the basis of calling an early green phase for buses as
soon as all buses as per the system capacity or the demand for which the system is
designed (in terms of buses per cycle) arrive at the junction and are ready to leave.
This leads to estimation of probabilities of buses arriving in red and green phase and
also of buses (throughput in each cycle) being stacked together with minimum

[BRTS Evaluation and Design (BEAD) Tool, Interim Report, Oct 2011]
34 SGArchitects
headway verses their arrival rate being equally distributed in the entire red phase at
the signal (for buses).
4. The tool tries to maximize the capacity in terms of number of passengers’
throughput/processed by the system per hour per direction. This is based on:
a. The number of buses throughput in one hour, which is calculated on the basis of
number of buses throughput in each cycle at a signalized intersection, mid block
station or a roundabout. Where no signals exist the system assumes as signal cycle
length as 3600 seconds and calculates the throughput in one hour.
b. If vehicular intersections and stations are separate (in case of mid block station) the
capacity of the system is governed by the minimum throughput of the two locations.
c. For junction stations (signalized junctions and roundabouts), the bus throughput per
cycle is estimated after accounting for the effect of both station and the
intersection, treated as common unit.
d. For mid block stations, the capacity is estimated on the basis of the lower value of
throughputs possible at the mid block signal and a signalized junction between mid
block stations. For this per cycle per direction assessment of straight and turning bus
throughput is made at the pedestrian signal at mid block station. This is then used as
the maximum no. of vehicles that will arrive at the following signalized junction
(based on the no. of pedestrian signal cycles that can be completed within one
junction signal cycle). The tool then asses the maximum no. of buses that can be
throughput during the green phase at the signalized junction (separately for straight
and turning). The minimum of the two values (i.e. buses arriving at the junction and
the buses that can be throughput during the green phase) is used (after doing a
weighted average of straight and turning buses) to arrive at the throughput of buses
per cycle per direction in a system with mid block stations. This can be extrapolated
over an hour to get an hourly capacity (BPHPD) using the intersection signal cycle
length.
e. The system estimates the total throughput of buses per cycle per direction
separately for near and far side staggered station types (mid block or junction) by
determining separately the throughput possible for straight and turning buses per
cycle and then totalling them. For island stations the capacity is estimated by
selecting the minimum of the throughput values for near and far side stations. This
is because the island station has one direction as near side while the other is far
side. In a round trip the total capacity would be determined by the minimum
throughput capacity of either the far side direction or the near side direction.
f. The throughput of straight (Figure 59) or turning (Figure 60) buses per signal cycle
for near side stations is dependent on how many buses can be throughput in green
phase length (for straight and for turning buses). The no. of buses throughput can be
of two types. These are either buses that are stacked, i.e. they have finished their
boarding/alighting cycle and are ready to go; or the buses which are yet to
undertake there boarding/alighting cycle and they will undertake that during the
green phase after the stacked buses vacate boarding bays. The no. of buses that can
be throughput depends on the length of the green phase. If the green phase is short,
part of the stacking capacity of the station can be vacated and this defines the no. of
uses that can be throughput in a signal cycle. If the green phase is long apart from

[BRTS Evaluation and Design (BEAD) Tool, Interim Report, Oct 2011]
35 SGArchitects
stacked buses, additional buses can board and depart within the length of the
additional green phase time (time in excess of that required to clear the stacked
buses).
g. In case of far side stations, the bus throughput capacity is the sum of buses from all
arms, entering the far side bus lane/station. The throughput of straight (Figure 63)
and turning (Figure 64) buses at far side stations is governed by three factors. This
includes the no. of buses that can be stacked (including any bus completing its
boarding and alighting cycle) in the green phase (accounting for all three arms,
separately for straight and turning phases), the no. of buses that can be throughput
in the green phase from each of these arms (based on the limitation of the length of
green phase for each arm) and the no. of buses that can be processed in one signal
cycle by the far side station (based on the limitation of no. of bays available and the
length of the signal cycle). Here the minimum of the three limitations governs the
capacity at the station.
5. Stations can be junction (either signalized junction or roundabout) or mid block. The tool
considers stations with first boarding bay less than 80m from the stop line as junction
station while others are considered as mid block stations. This is based on the estimated
length of vehicular queue that can be throughput in each green phase at the intersection
signal.
6. Stations can be parallel (2 stations each served by a bus lane) or single with or without an
overtaking lane. Parallel stations are treated as two single stations working simultaneously.
Hence for capacity estimation and station delays, estimations are made by extrapolating the
functioning of a single station and logic of single stations is applied for these calculations.
7. Stations can be near side or far side. For staggered stations each direction has the same type
of stations, i.e. near side or far side. In case of island or median stations near intersections,
one direction has all or most near side stations while the other has mostly far side. This
arrangement can be different for the two directions at different stations, however for
estimation, the total no. of station near side and far side will remain the same, and hence for
island stations the results for delay is based on an average of near and far side station
delays, while for capacity the minimum capacity of near and far side stations is selected (as
in a closed loop system the overall bus throughput will be equivalent to the least amount of
buses that can be throughput from any point). The following logic is applied by the tool to
calculate the delays at intersections or junction stations based on whether they are near side
or far side:
a. Near Side Stations
i. Near Side Stations with single lane(without overtaking lane) - Based on
whether the input values specify turning at junctions or not, the tool designs
the signal phasing as a dedicated bus phase per direction or a combined
phase with straight moving motorized vehicles.
ii. Near Side Station with overtaking lane – Based on whether the system
allows turning at junctions or not, the tool designs the signal phasing with
the overtaking lane as a dedicated turning lane (with common bus turning
phase for both directions) and the bus boarding lane as straight bus
movement lane with a common phase with straight moving vehicles; or both

[BRTS Evaluation and Design (BEAD) Tool, Interim Report, Oct 2011]
36 SGArchitects
lanes moving together in a common phase with straight motor vehicles (for
a closed system).
iii. The delay estimate for near side station with or without overtaking lane
(either mid-block or junction station) uses common logic stream. This is
based on the buses being stacked before the stop line (either a junction
signal in case of intersection stations or pedestrian signal in case of mid
block stations) after being finishing boarding alighting within the red phase
of the signal. During the green phase buses are throughput based on the
reaction time, bus acceleration, bus queue length, etc.
iv. For near side stations without overtaking lane, all bus boarding areas are
designed to be segregated by a gap of 3m. Each bus boarding bay is
equivalent to the length of the bus length selected for the system based on
the user input. In case of stations with overtaking lanes (for both open and
closed system) the tool provides an overtaking length equivalent to one bus
bay plus 3m is between two equivalent no. of bus boarding bays. For opens
system the rear set of bus boarding bays (i.e. behind the overtaking length)
is dedicated for turning buses while the front set (i.e. ahead of overtaking
length) is dedicated for straight buses.
v. The gap of the first boarding bay from the stop line is based on user input.
vi. These distances (discussed in ‘d’ and ‘e’ above) are used to estimate bus
stacking during red phase of the signal (to estimate capacity) and also to
arrive at throughputs and station delays (for near side stations).
b. Far Side Stations
i. For far Side Stations, the assumption is that the no. of bus lanes at near side
of the junction is always the same as the number of lanes provided for the
station. This is because if a turn lane is provided at a station, then the same
would need to be provided at the intersection, and since for far side stations
the bus stopping for boarding/alighting and that for the signal is on either
side of the junction (unlike in near side stations) and thus similar lane
configuration is required on both sides.
ii. In a system or segment with single bus lane(without overtaking lane) - based
on whether the input values specify turning at junctions or not, the tool
designs the signal phasing as a dedicated bus phase per direction or a
combined phase with straight moving motorized vehicles.
iii. Far Side Station with overtaking lane – Based on whether the system allows
turning at junctions or not, the tool designs the signal phasing with the
overtaking lane as a dedicated turning lane (with common bus turning phase
for both directions) and the bus boarding lane as straight bus movement
lane with a common phase with straight moving vehicles; or both lanes
moving together in a common phase with straight motor vehicles (for a
closed system).
iv. The delay estimate for far side station with or without overtaking lane
(either mid-block or junction station) uses common logic stream. This is
based on the buses being stacked backward all the way from first boarding
bay (farthest after crossing the junction) all the way up to the stop line

[BRTS Evaluation and Design (BEAD) Tool, Interim Report, Oct 2011]
37 SGArchitects
location (for near side on the same arm).The stacking can happen
throughout the signal cycles as buses in an open system (for junctions where
turns are allowed) will be pushed in to the bus lane during different phases.
However the system does not allow the number of buses input in to the bus
lane to exceed more than the number that can be processed by the (number
of) boarding bays provided. This allows higher capacity then near side
stations if the bus stops are located at a sufficient distance from the
junction, however the delays increase substantially as, unlike in near side
stations where the maximum delay is the length of red (bus) phase, in case
of far side the maximum delay is defined as the signal cycle length.
v. For far side stations without overtaking lane, all bus boarding areas are
designed to be segregated by a gap of 3m. Each bus boarding bay is
equivalent to the length of the bus length selected for the system based on
the user input. In case of stations with overtaking lanes (for both open and
closed system) the tool provides an overtaking length equivalent to one bus
bay plus 3m is between two equivalent no. of bus boarding bays. For opens
system the rear set of bus boarding bays (i.e. behind the overtaking length)
is dedicated for turning buses while the front set (i.e. ahead of overtaking
length) is dedicated for straight buses.
vi. The gap of the last boarding bay (or that nearest to the intersection) from
the stop line is based on user input.
vii. These distances (discussed in ‘v’ and ‘vi’ above) are used to estimate bus
stacking during red phase of the signal (to estimate capacity) and also to
arrive at throughputs and station delays (for near side stations).
3.3.2.2 Commuter Behaviour Logic (Outside the Bus)
Commuters try to minimize their delay. The tool works on the logic that each passenger attempts to
minimize its delay. The delay estimation of passenger uses the following logic:
1. The tool derives an average travel time for all commuters using a breakup of trips in 4
categories (i.e. 0-500m, 500-1000m, 1000-2000m, 2000-3000m), and using the average trip
length in the city (input by user) and the average distance between stations (input by the
user). Based on this the access distances for each category and resultant delays are
calculated and averaged using the following logic:
a. Based on the access distance (for each category) the average trip length is broken in
to journey by walk, by bus or IPT (considered at same average speed) in mixed
condition and journey by bus in the corridor.
b. It is assumed that walk trips are no longer than within 500m radius of the bus stops,
and each end of the journey a total of 1000m is deducted from the average trip
length and the remaining distance is allocated for travel by motorized mode
(including main corridor and feeder mode).
c. All trips by feeder modes are estimated by a bus (or a motorized IPT such as a three
wheeled auto rickshaw) in mixed condition
d. Average walk trip delay is based on length calculated on the basis of perpendicular
walking distances from within a neighbourhood to the main spine or arterial which is

[BRTS Evaluation and Design (BEAD) Tool, Interim Report, Oct 2011]
38 SGArchitects
either the corridor or a road leading to the corridor which is served by a bus route
linking to the corridor; plus the walking distance along the corridor to the bus stop.
e. The walk trips distance are calculated as a sum of average depth (of O-D) from the
corridor or main road served by a bus route or IPT (this is taken as an average of 0 to
500m, which is 250m) and average walking distance along the corridor (which is
taken as 1/4th
the average distance between two stations as input by the user).
f. The overall passenger delay is estimated as a sum of passenger delay in accessing
the feeder (for closed system) or direct route station (for open system) outside the
corridor, the travel time for feeder or direct route bus in mixed conditions, the delay
in accessing the BRTS station (in case of closed system) from the feeder route station
and the travel time of direct route bus or trunk line (for closed system) in the
dedicated bus lanes of the BRT corridor.
g. Access delay to feeder or direct route station outside the corridor is estimated as a
sum of time consumed in average walking distance, average crossing delay (to
access the feeder station) and the average wait time for feeder or direct route bus.
h. The bus frequency outside the corridor is assumed to be the same as that within the
corridor. The average spacing between bus stations outside the corridor is also
assumed to be the same as the average spacing of stations within the corridor.
i. The bus speed in mixed condition is necessary to estimate the travel time by feeder
bus or a direct route bus in mixed condition. This is estimated from the average
speed of vehicles in the city, inserted in the predefined data sheet as 22km/hr. (as
per average speed of vehicles in Delhi as listed in CTTS study by Rites). The speed is
discounted by a factor of 4/5 to account for lower acceleration and deceleration of
buses in the mixed condition. In addition bus dwell time (assumed to be the same as
swell time for buses in the corridor) as well acceleration deceleration delay (for
station access) is added to the time it would take (at the discounted average speed)
for the bus between two stations (as per the average distance between stations
input by the user). The resultant time is then used to derive the average speed of
bus in mixed condition.
j. Travel time by bus in mixed condition is estimated up to the stop line of the
perpendicular road at the BRTS corridor junction
k. The BRTS station access delay is estimated from the feeder station (and hence only
used for estimation in case of a closed system) on the perpendicular road, and
includes the walking distances from the feeder station up to the middle of the BRTS
station (as an average walking distance), the average delay in crossing the side road
(assumed as average delay in crossing the main BRTS corridor), the average delay in
crossing the BRTS corridor to access the station and the average wait time for a BRTS
bus on the corridor.
l. For closed system passenger delay estimation, the walking distance from the feeder
station till the BRTS corridor edge (or the stop line) is deducted from the distance
travelled by the feeder bus in mixed condition (as the feeder bus travel time is
estimated up to the stop line of the perpendicular road while the station is at a set
distance before the stop line).
m. The distance of feeder station from the BRTS corridor edge is assumed as 150m. This
is based on the assumption that the minimum distance of a bus station to the

[BRTS Evaluation and Design (BEAD) Tool, Interim Report, Oct 2011]
39 SGArchitects
corridor in mixed condition is 50m and the maximum is 250m. However in
metropolitan areas such as Delhi the minimum distance defined by administration is
150m, and the maximum distance is 650m where flyovers or vehicular underpasses
are constructed. Hence in case of large metropolitan cities this predefined value may
need to be changed to 400m. However since 150m also coincides with the minimum
distance for cities like Delhi, this value is used in the model.
n. The travel time by bus in the BRTS corridor is based on the average system of buses
in the proposed value which is derived by a different process.
o. One of the components effecting delay for passengers is the waiting time for the bus
at a station. This is dependent on bus frequency. To estimate the wait time for a bus
the tool uses the maximum capacity of the system and works out the average
waiting time for a bus. In a closed system, since all buses move on the same route,
this is estimated through a simple calculation of averaging the maximum and
minimum waiting time. In an open system the tool makes a calculation on the basis
of 5 routes using the corridor and hence delay in waiting for a direct route is
estimated as five times the delay in a closed system.
3.3.2.3 Signal Cycle Design Logic
Signal cycle at intersections or at mid block pedestrian crossing effect both the vehicle (bus) and the
passenger delay on the corridor. Lower signal cycle lengths lead to lower delays for buses and
passengers. The tool works around this principle to minimize signal cycle length on the basis of
desirable signal cycle length input by the user, and subsequently proposes a phase design to fit the
optimized cycle length. The tool also provides the user an option to override the system designed
signal cycle and phase design, by allowing a user input for the same. The user inputs override system
proposed cycle design and all estimates in the tool, use user inputs when the same are defined in
the results sheet. However the system design of signal cycle is an essential start point and forms the
basis os the initial result which can be modified by modifying cycle design, by the user if required.
The tool uses the following logic to design the signal cycle and phase sequence/length etc.:
1. The tool has two signal cycle design sub-components.
a. One of the components deals with the design for the station access signal; which is a
pedestrian only signal for mid block stations or a combined pedestrian and vehicular
signal for junction stations.
b. The other component or sub-tool deals with the intersection signal design for
junctions located between mid block stations.
Hence for junction stations only the first or the station access signal design component is
activated, whereas for the mid block stations, the delay and capacity contribution of both
signals are taken in to account. For the latter the delay estimate is accumulation of both
signals whereas the capacity estimation is the minimum throughput possible at either of the
two signals.
2. The input value of desirable signal cycle is verified/ modified to produce an optimum signal
cycle length. This is achieved by:
a. Estimating the number of phases that are required based on the given design and
other intersection information input by the user.
[BRTS Evaluation and Design (BEAD) Tool, Interim Report, Oct 2011]
40 SGArchitects
b. In addition the tool estimates the minimum signal cycle length required to process
all phases as per design features input by the user.
c. Following this the tool checks if the user input value is too less for the design, or is it
too high to be efficient. Low values are increased based on the no. of phases
estimated by the tool, while high values are brought down based on the ratio of the
input value and the minimum desirable value for the no. of arms at the junction (as
input by the user). The tool has inbuilt values for the minimum and maximum
desirable signal cycle length which is as following:
i. Minimum and maximum signal cycle lengths are defined in the tool as
following:
ii. The system Maximum permissible cycle length is 225sec long
iii. Minimum and maximum desirable cycle length for 4 arm junction is 150 sec
and 180 sec respectively.
iv. Minimum and maximum desirable cycle length for 3 arm junction is 120 sec
and 150 sec respectively.
v. Minimum and maximum desirable cycle length for 2 arm location (or mid
block station with a pedestrian signal) is 60 sec and 90 sec respectively.
d. The above minimum and maximum and desirable cycle lengths are a part of default
values which can also be modified by the user (in the default value form) if required.
3. User defined signal cycle length are also subject to a maximum and minimum range and
which is between 30 to 300 seconds for different types of junction types.
3.4 Results
The BEAD tool presents results or performance values of different indicators of the design in two
stages:
• Segment Wise Results
• Overall Aggregated Results for the Entire Corridor
The results for both the above categories are presented under same heads. However segment wise
results are presented after the inputs for each segment have been fed in the tool. These include
additional signal and cross section design information specific to the input segment and can be
printed using a print button. Overall corridor results are saved in an output xls file when all segments
are input in the tool. It is also important to note that users have the flexibility to edit defining values
in the output sheet for each segment, and generate revised values; however the same is not permit
in the aggregate output of the corridor. The users can though use the output xls file to load data
3.4.1 Result Categories
The results presented under both the stages discussed above are classified and presented under the
following categories (Annexure 3) :
3.4.1.1 Cross Section Design
Here the width and order of arrangement of each road component such as service lane, footpath,
cycle track, green belt, service belt, IPT Parking, carriageway for motorized vehicles, bus lanes, bus
stop etc. The cross section designs are presented in two parts, viz., system designed and user
defined. The cross section design is generated for the most critical location, i.e. the bus station. As

[BRTS Evaluation and Design (BEAD) Tool, Interim Report, Oct 2011]
41 SGArchitects
default the output sheet uses the above defined processes to generate a cross section design which
is presented both as same under system and user defined head. The user has the flexibility to edit
these cross section design values using the edit results button. Here the user can input/change all
the individual cross section design elements. These will be totalled and checked against the ROW
width input by the user in the user forms, and an error message returned till the same is corrected.
The evaluation of crossing distances are estimated based on the user input values which over-ride
the system defined design.
3.4.1.2 Signal Design
This component displays the results of a system designed signal cycle and phase sequencing as well
distribution. The signal cycle design is based on background process mentioned above and allows
the user to edit the same (system overrides the system designed signal cycle with user defined one),
using an edit button on the first results/output sheet. This leads the user to a result editing sheet.
As discussed in the previous section, user can defined specific signal cycle and phase group lengths,
which are checked by the system and an error message returned till the time all errors in the input
are removed. On pressing the back button which brings displays the edit sheet presenting the output
results based on the inputs/editions provided by the user.
3.4.1.3 Corridor Travel Time and Speed
This category presents all speed and travel time related outputs as estimated for the unput design,
by the BEAD tool. These results are presented under the following sub heads:
1. BRT operational speed (Expected Average Bus Speed in the System)
2. Passenger speed with BRT
3. Passenger walking distance
4. Overall origin to destination journey time (using BRTS) for average motorized trip length
5. Total average access time
6. Total average in vehicle time (main line/route)
7. Per bus delay per station/junction in segregated lanes
8. Per bus delay per midblock station in segregated lanes
9. Total average passenger delay in the sytem
BRT Operational Speed – This is the expected average bus speed in the system, after accounting for
all station, signal and acceleration/deceleration related delays. It is affected by the spacing between
intersections, signal cycle length, station set back from intersection etc. The operational speed of
buses in the BRTS system is presented on the output sheet in Km/h.
Passenger Speed with BRT – This value in the output sheet indicates average speed in km/h
experienced by the passenger in undertaking the total journey including walk trips, feeder bus trip
and transit trip. This is considered and important measure in the performance of the system as it
aggregates the delay experienced by the passenger in the entire journey (and not just the journey
within the BRTS corridor – which is represented by operational speed and which does not account
for important factors such as access and egress delays) and presents it as speed for easy comparison
with other modes such as private motorized modes.

[BRTS Evaluation and Design (BEAD) Tool, Interim Report, Oct 2011]
42 SGArchitects
Passenger Walking Distance – Total passenger walking distance in meters (averaged over different
trip types) in a one way trip are estimated and presented by the tool in the output sheet. This is an
important indicator for comparison between different designs as it directly relates to passenger
inconvenience and perceived time. This value is majorly dependent on average spacing between
stations, crossing widths, crossing type (grade separated pedestrian crossing facilities with ramps
add to walking distances), etc.
Overall origin to destination journey time (using BRTS) for average motorized trip length – Under
this head the overall passenger journey time between origin and destination is estimated by the tool
and presented in minutes. The journey time is estimated after accounting for passenger speed in
different trip components or using different modes, waiting delays, crossing delays, etc.
Total Average Access Time – The point to point journey time for an average passenger undertaking a
trip equivalent to average trip length in the city or along the corridor; is broken in to two
components, i.e. ‘Total Access and Egress Time’ and total in vehicle time. Total Access and egress
time is presented under this head in minutes, and includes time spent in any feeder bus to access
the transit station and also accounts for any changeover delays.
Total Average In-Vehicle Time – Total average in-vehicle time is the time spent on the main line
transit vehicle. In an open system it includes the journey (for direct routes) outside the BRTS
corridor. This time is estimated after subtracting the total access and egress time from the total
journey time (discussed above) and presented in minutes.
Per bus delay per station/junction in segregated lanes – This head presents the delay experienced
by an average bus per station junction combination for junction stations or just junction delay for
intersections between mid block stations (as per user inputs defining BRTS design in the user input
forms). These values are presented in seconds.
Per bus delay per midblock station in segregated lanes – This heads presents the delay experience
per bus per mid block station (in combination with a pedestrian signal delay if defined in the user
input). This delay is presented in seconds. In case of junction stations this delay value appears as ‘0’,
whereas in case of mid blocks stations this delay is aggregated with the junction delay (explained)
above for the specified number of stations (derived from the average station spacing input by the
user).
Total Average Passenger Delay in the System – This head presents average passenger delay
encountered for an average trip length, excluding time spent in walking, but including time lost for
waiting the bus, crossing the road, and reaching the bus boarding bay from the middle of the cross
road.. This value is presented in seconds.
3.4.1.4 Corridor Throughput
This category presents results under the following sub heads:
1. Corridor PPHPDT
2. Corridor Bus Throughput (Max frequency)
3. Junction Bus throughput
4. Station Bus Throughput (separate from junction for mid block station)
5. User input - buses per hour per direction

[BRTS Evaluation and Design (BEAD) Tool, Interim Report, Oct 2011]
43 SGArchitects
Corridor PPHPDT – Corridor PPHPDT implies Peak per Hour per Direction Trips transported by the
BRTS system as per the specified corridor design, and relates to the peak hour peak direction
capacity (in terms of passengers) offered by the corridor. This typically varies between 4000 to
20000.
Corridor Bus Throughput (Max Frequency) – Peak passenger carrying capacity is derived from the
vehicle type (specified by the user in the user forms) and the peak corridor bus throughput. This
value is presented separately so as users can relate to the fleet volume handling capacity of the
system.
Junction Bus Throughput – Corridor bus throughput is derived from the per cycle throughput of
buses, which is based on the minimum headway calculations for the data input by the user. This
value is presented separately for mid block throughput (at pedestrian signal cycles) and at junction
throughput (for junctions between mid block stations or junction stations).
Station Bus Throughput – This is the same as junction bus throughput for junction stations (as it acts
as a combined unit) whereas for mid block stations it is presented separately. This is also based on
the minimum headway estimates calculated from the user input.
Bus Demand User Input – By default this value is set the same as Corridor Bus Throughput or
Maximum Frequency derived by the tool. However the user can use the edit results button and set
this to a lower value as per estimated design. This will override the Maximum frequency value
derived by the system and other performance measures such as delay, speeds etc. are recalculated
as per the user input value.
3.4.1.5 Bus Shelter Length
This category presents the calculated length of the bus station, with and without ramps. When
combined with the station width generated by the cross section design utility of the tool, the user
can estimate the station and ramp sq. M. area, which is useful in determining a rough estimate of
costs involves.
3.4.1.6 Comparisons
The tool presents the following additional data/results for comparison with the proposed system
performance:
1. Time saved by BRT over Private Transport
2. Avg. passenger speed with buses without BRT
3. Time saved by BRT over mixed condition bus
4. Daily bus passenger hours saved
Time Saved over Private Transport – This uses the average motor vehicle speed in the corridor or
the city (from default values – set as 20km/h but editable by the user) and estimates the passenger
speed on the basis of walking distance to access parked vehicle (50m in the default values). It then
compares this with the passenger speeds estimated by the tool for the proposed BRTS design. The
difference time per passenger trip is presented as the time saved by using BRTS over private
transport.

[BRTS Evaluation and Design (BEAD) Tool, Interim Report, Oct 2011]
44 SGArchitects
Average Passenger Speed with Buses without BRTS – Under this head the passenger speed for bus
transit in mixed conditions is estimated as per the process defined above. The values are presented
in Km/h.
Time Saved by BRT over mixed condition bus – Under this sub head the time savings are calculated
in daily hours saved. This is done by deriving the time difference (in hours) per passenger trip (using
passenger speed values derived by the tool) between buses using the BRTS system and those moving
in mixed condition.
Daily Bus Passenger Hours Saved - This value is multiplied by the total passenger trips expected in
the segment (using the corridor PPHPDT value estimated by the tool and multiplying it by 10 * 2 to
arrive at daily two directional trips) to arrive at a an estimate of total hours saved per day.
3.4.1.7 Level of Service (LOS) as an Overall Performance Indicator
BEAD tool employs a sub LOS estimator tool, which derives the values from the output sheet under
10 different heads, and the same are divided in to three categories, based on the main recipient of
benefits under that head. These categories are:
• Societal
• User
• Operator
The LOS estimator assigns weights to each of the 10 indicators based on the relative weights of the
category under which they fall and the relative weights of indicators within each category. These
indicators are:
1. Attractiveness for Public Transport Users – This indicator uses the ratio of passenger speed
in the proposed BRTS system and that in the existing bus based or IPT based public
transport. A higher ratio indicates better performance.
2. Passenger Speed – This indicator uses the absolute value of passenger speed (ratio of total
O-D distance by total time spent by the passenger in the journey). A higher passenger speed
indicates better performance
3. Safety – Empirical evidence shows that 1% increase in speed of motorized vehicles results in
4% increase in chances of a fatal accident. This is why the peak cruising speed limit of transit
vehicle plays an important role in ensuring safety of pedestrians and other road users. Thus
a lower peak speed limit for buses using BRTS is considered a better, as an indicator of
safety.
4. Walking Distance – Longer walking or access/egress distances increase inconvenience which
results in a higher perceived time (than actual time), reducing the attractiveness of public
transport. Thus reduced walk distances are considered better in the overall performance of
the BRT system being evaluated.
5. Attractiveness for Private Two Wheelers – Buses and typically BRTS systems present travel
costs similar to the operational cost of motorized two wheelers. Thus a reduced passenger
time in the BRTS than motorized modes is likely to attract mode shift from motorized two
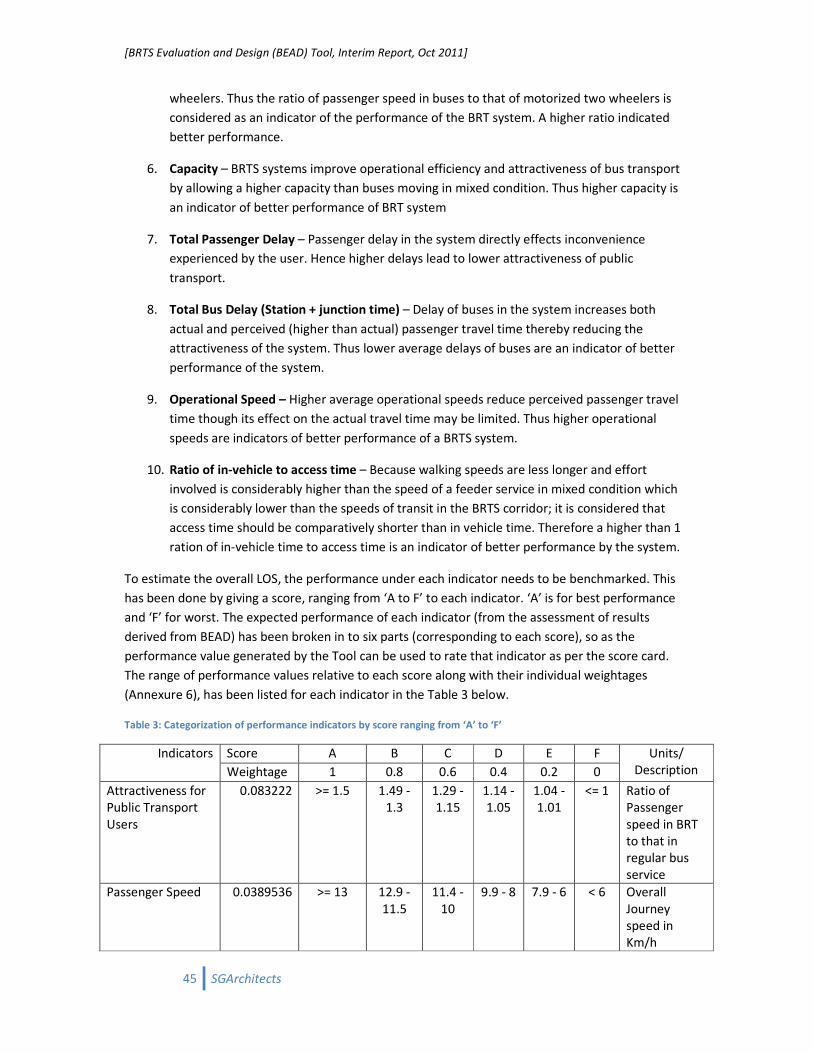
[BRTS Evaluation and Design (BEAD) Tool, Interim Report, Oct 2011]
45 SGArchitects
wheelers. Thus the ratio of passenger speed in buses to that of motorized two wheelers is
considered as an indicator of the performance of the BRT system. A higher ratio indicated
better performance.
6. Capacity – BRTS systems improve operational efficiency and attractiveness of bus transport
by allowing a higher capacity than buses moving in mixed condition. Thus higher capacity is
an indicator of better performance of BRT system
7. Total Passenger Delay – Passenger delay in the system directly effects inconvenience
experienced by the user. Hence higher delays lead to lower attractiveness of public
transport.
8. Total Bus Delay (Station + junction time) – Delay of buses in the system increases both
actual and perceived (higher than actual) passenger travel time thereby reducing the
attractiveness of the system. Thus lower average delays of buses are an indicator of better
performance of the system.
9. Operational Speed – Higher average operational speeds reduce perceived passenger travel
time though its effect on the actual travel time may be limited. Thus higher operational
speeds are indicators of better performance of a BRTS system.
10. Ratio of in-vehicle to access time – Because walking speeds are less longer and effort
involved is considerably higher than the speed of a feeder service in mixed condition which
is considerably lower than the speeds of transit in the BRTS corridor; it is considered that
access time should be comparatively shorter than in vehicle time. Therefore a higher than 1
ration of in-vehicle time to access time is an indicator of better performance by the system.
To estimate the overall LOS, the performance under each indicator needs to be benchmarked. This
has been done by giving a score, ranging from ‘A to F’ to each indicator. ‘A’ is for best performance
and ‘F’ for worst. The expected performance of each indicator (from the assessment of results
derived from BEAD) has been broken in to six parts (corresponding to each score), so as the
performance value generated by the Tool can be used to rate that indicator as per the score card.
The range of performance values relative to each score along with their individual weightages
(Annexure 6), has been listed for each indicator in the Table 3 below.
Table 3: Categorization of performance indicators by score ranging from ‘A’ to ‘F’
Indicators Score A B C D E F Units/
Description Weightage 1 0.8 0.6 0.4 0.2 0
Attractiveness for
Public Transport
Users
0.083222 >= 1.5 1.49 -
1.3
1.29 -
1.15
1.14 -
1.05
1.04 -
1.01
<= 1 Ratio of
Passenger
speed in BRT
to that in
regular bus
service
Passenger Speed 0.0389536 >= 13 12.9 -
11.5
11.4 -
10
9.9 - 8 7.9 - 6 < 6 Overall
Journey
speed in
Km/h
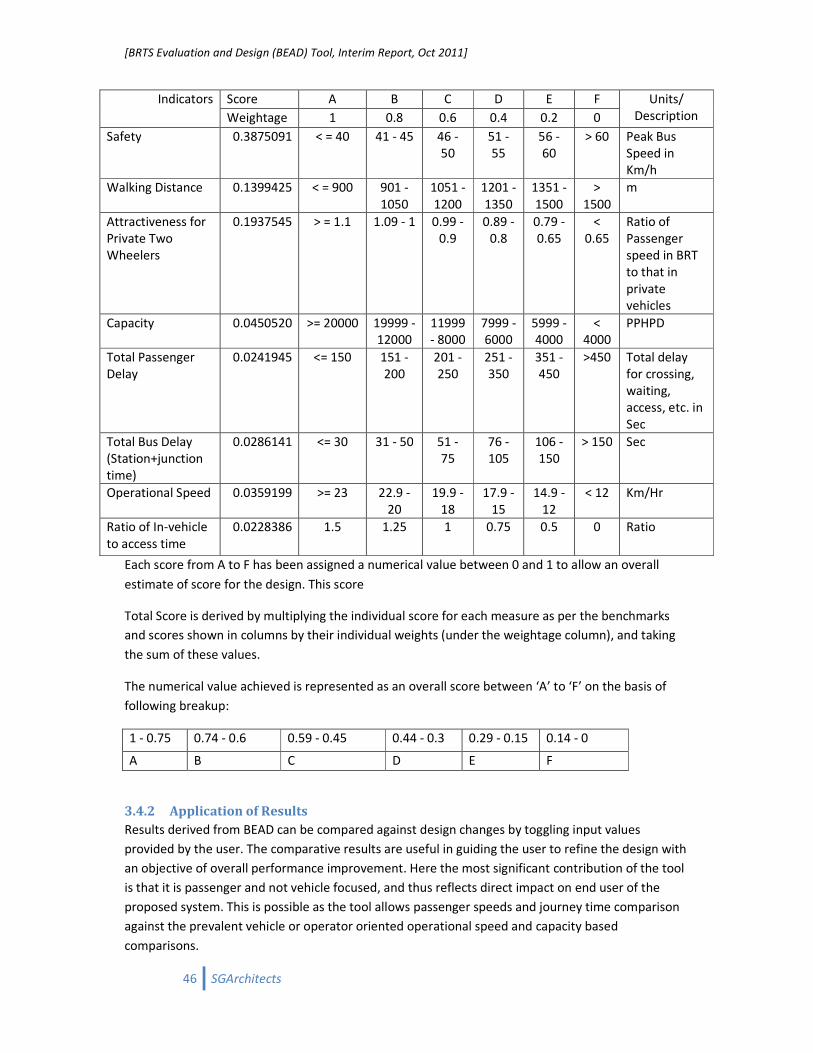
[BRTS Evaluation and Design (BEAD) Tool, Interim Report, Oct 2011]
46 SGArchitects
Indicators Score A B C D E F Units/
Description Weightage 1 0.8 0.6 0.4 0.2 0
Safety 0.3875091 < = 40 41 - 45 46 -
50
51 -
55
56 -
60
> 60 Peak Bus
Speed in
Km/h
Walking Distance 0.1399425 < = 900 901 -
1050
1051 -
1200
1201 -
1350
1351 -
1500
>
1500
m
Attractiveness for
Private Two
Wheelers
0.1937545 > = 1.1 1.09 - 1 0.99 -
0.9
0.89 -
0.8
0.79 -
0.65
<
0.65
Ratio of
Passenger
speed in BRT
to that in
private
vehicles
Capacity 0.0450520 >= 20000 19999 -
12000
11999
- 8000
7999 -
6000
5999 -
4000
<
4000
PPHPD
Total Passenger
Delay
0.0241945 <= 150 151 -
200
201 -
250
251 -
350
351 -
450
>450 Total delay
for crossing,
waiting,
access, etc. in
Sec
Total Bus Delay
(Station+junction
time)
0.0286141 <= 30 31 - 50 51 -
75
76 -
105
106 -
150
> 150 Sec
Operational Speed 0.0359199 >= 23 22.9 -
20
19.9 -
18
17.9 -
15
14.9 -
12
< 12 Km/Hr
Ratio of In-vehicle
to access time
0.0228386 1.5 1.25 1 0.75 0.5 0 Ratio
Each score from A to F has been assigned a numerical value between 0 and 1 to allow an overall
estimate of score for the design. This score
Total Score is derived by multiplying the individual score for each measure as per the benchmarks
and scores shown in columns by their individual weights (under the weightage column), and taking
the sum of these values.
The numerical value achieved is represented as an overall score between ‘A’ to ‘F’ on the basis of
following breakup:
1 - 0.75 0.74 - 0.6 0.59 - 0.45 0.44 - 0.3 0.29 - 0.15 0.14 - 0
A B C D E F
3.4.2 Application of Results
Results derived from BEAD can be compared against design changes by toggling input values
provided by the user. The comparative results are useful in guiding the user to refine the design with
an objective of overall performance improvement. Here the most significant contribution of the tool
is that it is passenger and not vehicle focused, and thus reflects direct impact on end user of the
proposed system. This is possible as the tool allows passenger speeds and journey time comparison
against the prevalent vehicle or operator oriented operational speed and capacity based
comparisons.

[BRTS Evaluation and Design (BEAD) Tool, Interim Report, Oct 2011]
47 SGArchitects
In addition the Tool will be provided with a comprehensive user manual (currently under
development) which standard trend charts using results, derived for different design combinations,
from the BEAD tool. The charts would be useful in guiding the user on what features to adjust to
achieve specific design performance improvements.
To develop these charts a standard set of parameters (listed in Table 4) have been defined in the
BEAD Tool to derive results for 16 different design options. These options differ from each other
through following combination of features:
1. System or operations type, i.e. open or closed
2. Station type, i.e. island or staggered
3. Presence or absence of an overtaking lane at the station
4. Station Location, i.e. island or mid block
Table 4: The standard values of parameters used for each of the 16 design types defined in BEAD Tool
Parameter Standard Value Variations Unit
Average Distance Between Stations 600 500 to 1000 m
Designed or Desired Frequency (Demand) 2500 2500 to 22500 PPHPDT
1st
bus boarding distance From Stop Line 26 13 to 78 m
Signal Cycle Length 150 for
intersection
60 for mid block
120 to 300 for
Intersections
Seconds
The results were derived from BEAD for each of the 16 designs separately, and then compared
against variations in the standard value within a range (Table 4). The data derived from this exercise
was plotted as trends. Some of these charts have been presented in Annexure 7 of this report.
In addition the tool can be used to derive policy level indicators on an optimum design for different
city conditions (instead of proposing a blanket design for all cities). In one way this can be achieved
is by using passenger journey time as an indicator of the corridor design performance and
comparing its trend with varying average trip lengths (along the corridor or for the city), peak speeds
of buses in segregated conditions and average spacing of stations in the corridor. Figure 13 to Figure
17, present these charts for two broad design categories, i.e. closed systems with island stations
located 50m from the stop line and staggered stations with island stations located 13m from stop
line (in both cases no overtaking lane is provided). These charts can be used as a basis of important
conclusions effecting design and planning decisions at policy and conceptualization levels; such as:
1. Peak speed of buses higher than 40km/h in the corridor provides little or no advantage in
terms of passenger journey time saving; however the adverse impact of this increase is
known to be significant on the safety of community where such systems are planned. Hence
it can be recommended that the peak speed limit of buses within BRTS corridors should be
retained as per the current motor vehicle norms, at 40km/h.
2. Closed systems show very little sensitivity to average spacing between bus stations on the
corridor. However in case of open systems, the passenger journey time savings are
significant for station spacing around 750m, than those at 500 or 1000m. Even for closed
system designs 750m spacing allows the maximum travel time saving (though this saving is

[BRTS Evaluation and Design (BEAD) Tool, Interim Report, Oct 2011]
48 SGArchitects
lesser in terms of absolute numbers) and hence it can be suggested that average bus stop
spacing of about 750m is desirable for all types of BRTS corridor designs with junction
stations.
3. There is no significant gain to existing public transport users if the current or horizon year
average speeds on the corridor (in mixed condition) are more than 20-25km/h.
4. Closed systems (with or without the use of island stations) provide significantly higher
operational speeds of buses in the corridor, than the open systems. Though this operational
speed advantage does not translate in to journey time savings; and open systems provided
faster journey time than closed system for up to 10-12km trip length while closed systems
prove advantageous for longer trips.
Figure 13: Comparison of trends for journey time changes (for 6 and 10km trip lengths using BRTS system) in an open
system with staggered junction stations (based on results derived from BEAD Tool).
500600
700800
9001000
36
37
38
39
40
41
42
43
44
45
40
60
80
100
Trip
tim
e in
min
Peak Bus Speed in
Km/hr
Open System Travel Time Comparison for 6 Km Trip Length
44-45
43-44
42-43
41-42
40-41
39-40
38-39
37-38
36-37
500m600m
700m800m
900m1000m
46
48
50
52
54
56
58
60
62
64
40
60
80
100
Trip
tim
e in
min
Peak Bus Speed in
Km/hr
Open System Travel Time Comparison for 10 Km Trip
Length
62-64
60-62
58-60
56-58
54-56
52-54
50-52
48-50
46-48

[BRTS Evaluation and Design (BEAD) Tool, Interim Report, Oct 2011]
49 SGArchitects
Figure 14: Comparison of trends for journey time changes (for 6 and 10km trip lengths using BRTS system) in a closed
system with island junction stations (Based on results derived from BEAD Tool).
500m600m
700m800m
900m1000m
36
37
38
39
40
41
42
43
44
45
40
60
80
100
Trip
tim
e in
min
Peak Bus Speed in
Km/hr
Close System Travel Time Comparison for 6 Km Trip Length
44-45
43-44
42-43
41-42
40-41
39-40
38-39
37-38
36-37
500m600m
700m800m
900m1000m
46
48
50
52
54
56
58
60
62
64
40
60
80
100
Trip
tim
e in
min
Peak Bus Speed in
Km/hr
Closed System Travel Time Comparison for 10 Km Trip
Length
62-64
60-62
58-60
56-58
54-56
52-54
50-52
48-50
46-48

[BRTS Evaluation and Design (BEAD) Tool, Interim Report, Oct 2011]
50 SGArchitects
Figure 15: Passenger and operational speed comparison between open and closed system for different trip lengths
Figure 16: Operational and passenger speed comparison for closed system (with island stations) for a trip length of 8 km
and varying stations spacing as well peak bus speeds in the corridor.
0
5
10
15
20
25
4 6 8 10 12 14 16
Sp
ee
d in
km
/hr
Trip Length in km
Passenger and Operational Speed Comparison of Open and Closed System
Passenger Speed - Mixed Condition
Passenger Speed - Open BRTS
Passenger Speed - Closed BRTS
Operational Speed - Open BRTS
Operational Speed - Closed BRTS
44
46
48
50
52
40
60
80
100
Trip
tim
e in
min
Peak Bus Speed in
Km/hr
Close System Travel Time Comparison for 8 Km Trip Length
50-52
48-50
46-48
44-46
18
23
28
33
40
60
80
100
Op
era
tio
na
l Sp
ee
d in
Km
/Hr
Peak Bus Speed in
Km/hr
Close System Op. Speed Comparison for 8 Km Trip Length
33-36
28-33
23-28
18-23
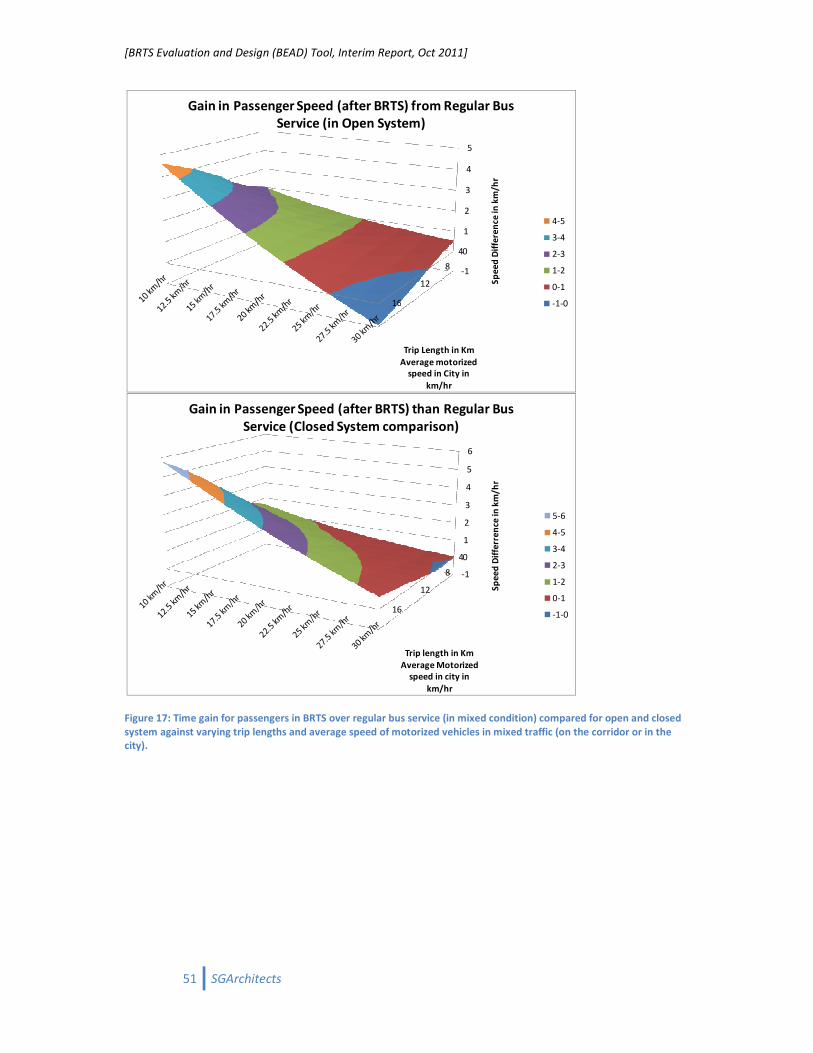
[BRTS Evaluation and Design (BEAD) Tool, Interim Report, Oct 2011]
51 SGArchitects
Figure 17: Time gain for passengers in BRTS over regular bus service (in mixed condition) compared for open and closed
system against varying trip lengths and average speed of motorized vehicles in mixed traffic (on the corridor or in the
city).
-1
0
1
2
3
4
5
4
8
12
16
Sp
ee
d D
iffe
ren
ce in
km
/hr
Trip Length in Km
Average motorized
speed in City in
km/hr
Gain in Passenger Speed (after BRTS) from Regular Bus
Service (in Open System)
4-5
3-4
2-3
1-2
0-1
-1-0
-1
0
1
2
3
4
5
6
4
8
12
16
Sp
ee
d D
iffe
rre
nce
in k
m/h
r
Trip length in Km
Average Motorized
speed in city in
km/hr
Gain in Passenger Speed (after BRTS) than Regular Bus
Service (Closed System comparison)
5-6
4-5
3-4
2-3
1-2
0-1
-1-0
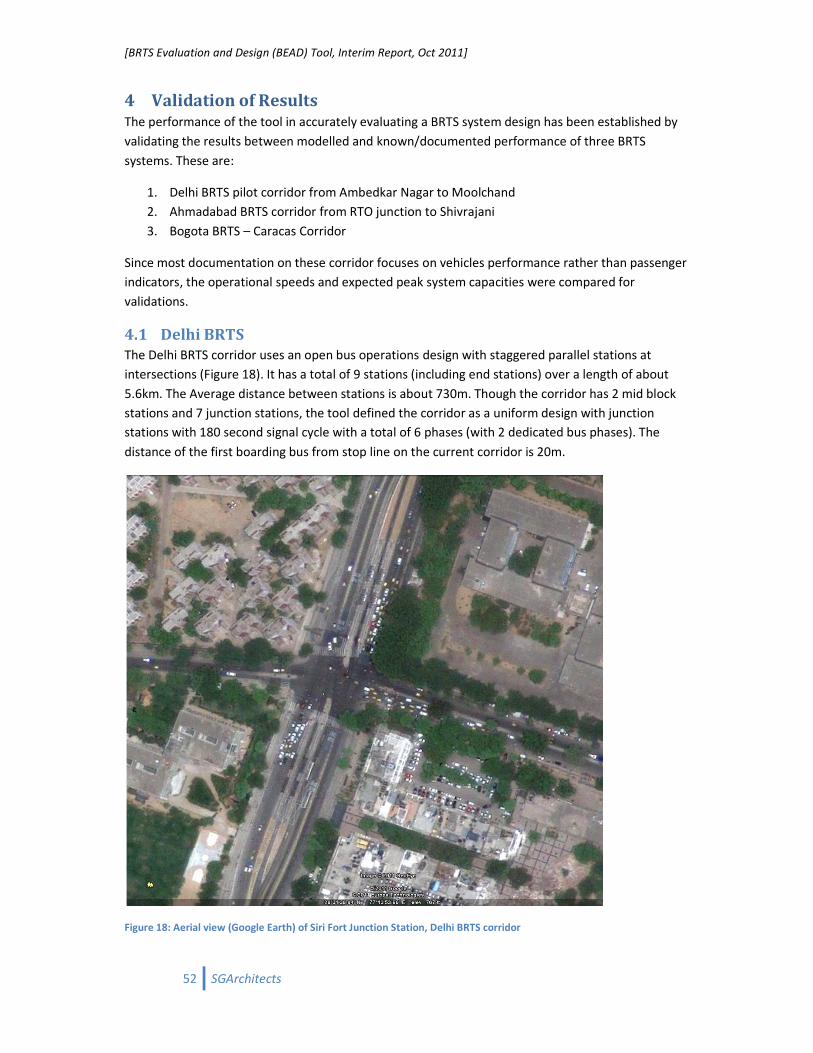
[BRTS Evaluation and Design (BEAD) Tool, Interim Report, Oct 2011]
52 SGArchitects
4 Validation of Results The performance of the tool in accurately evaluating a BRTS system design has been established by
validating the results between modelled and known/documented performance of three BRTS
systems. These are:
1. Delhi BRTS pilot corridor from Ambedkar Nagar to Moolchand
2. Ahmadabad BRTS corridor from RTO junction to Shivrajani
3. Bogota BRTS – Caracas Corridor
Since most documentation on these corridor focuses on vehicles performance rather than passenger
indicators, the operational speeds and expected peak system capacities were compared for
validations.
4.1 Delhi BRTS
The Delhi BRTS corridor uses an open bus operations design with staggered parallel stations at
intersections (Figure 18). It has a total of 9 stations (including end stations) over a length of about
5.6km. The Average distance between stations is about 730m. Though the corridor has 2 mid block
stations and 7 junction stations, the tool defined the corridor as a uniform design with junction
stations with 180 second signal cycle with a total of 6 phases (with 2 dedicated bus phases). The
distance of the first boarding bus from stop line on the current corridor is 20m.
Figure 18: Aerial view (Google Earth) of Siri Fort Junction Station, Delhi BRTS corridor

[BRTS Evaluation and Design (BEAD) Tool, Interim Report, Oct 2011]
53 SGArchitects
The comparative results, between the tool output and the actual site studies generated by DIMTS
Ltd., have been presented in Table 5.
Table 5: Validation of Results for Delhi BRTS Corridor
Data from Studies/Surveys Model Results
Current Demand – 120-150 buses, 13500PPHPD
(Geetam Tiwari and Deepty Jain)–100 pas/bus
Current Demand – 160 buses, 16000 PPHPD (100
pas/bus)
Average Corridor Speed (in current demand)– 18
Km/hr (Geetam Tiwari and Deepty Jain)
Average Corridor Speed (with current demand) –
16.92Km/hr
Peak Capacity – 200-240 Buses, 20000-
24000PPHPD (Geetam Tiwari and Deepty Jain)
(100 pas/bus)
Peak Capacity – 320 Buses, 32000 PPHPD (100
pas/bus)
Avg. Corridor Speed (Peak Capacity) - ? Avg. Cor. Speed (Peak Capacity) – 20.74 Km/h
(for modified signal cycle option)
4.2 Ahmadabad BRTS
The 8km long first Ahemedabad BRTS corridor from RTO to Shivrajani (Figure 19) uses closed bus
operations with island stations. It has an average station spacing of about 800m and deploys 12m
long high floor urban buses, with a possibility of maximum two simultaneous boarding’s at each
station. The first bus boards about 50-60m from the stop line and the junction signal cycle is about
120 seconds, with 4 phases.
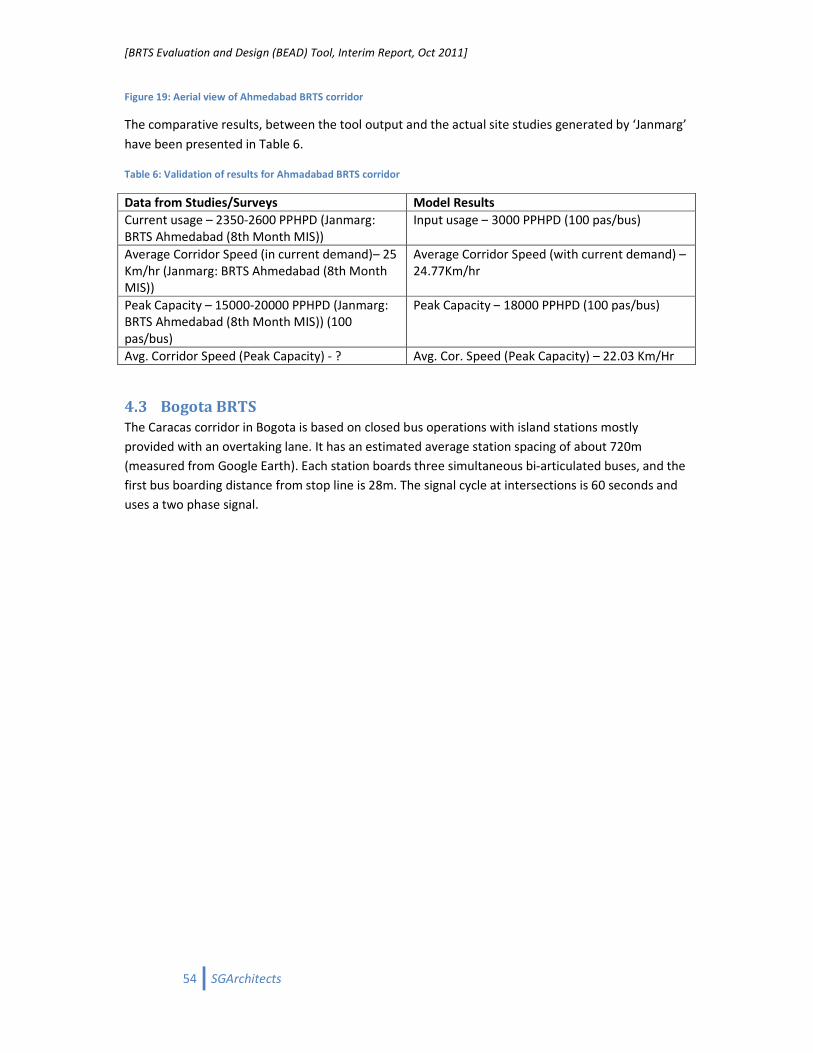
[BRTS Evaluation and Design (BEAD) Tool, Interim Report, Oct 2011]
54 SGArchitects
Figure 19: Aerial view of Ahmedabad BRTS corridor
The comparative results, between the tool output and the actual site studies generated by ‘Janmarg’
have been presented in Table 6.
Table 6: Validation of results for Ahmadabad BRTS corridor
Data from Studies/Surveys Model Results
Current usage – 2350-2600 PPHPD (Janmarg:
BRTS Ahmedabad (8th Month MIS))
Input usage – 3000 PPHPD (100 pas/bus)
Average Corridor Speed (in current demand)– 25
Km/hr (Janmarg: BRTS Ahmedabad (8th Month
MIS))
Average Corridor Speed (with current demand) –
24.77Km/hr
Peak Capacity – 15000-20000 PPHPD (Janmarg:
BRTS Ahmedabad (8th Month MIS)) (100
pas/bus)
Peak Capacity – 18000 PPHPD (100 pas/bus)
Avg. Corridor Speed (Peak Capacity) - ? Avg. Cor. Speed (Peak Capacity) – 22.03 Km/Hr
4.3 Bogota BRTS
The Caracas corridor in Bogota is based on closed bus operations with island stations mostly
provided with an overtaking lane. It has an estimated average station spacing of about 720m
(measured from Google Earth). Each station boards three simultaneous bi-articulated buses, and the
first bus boarding distance from stop line is 28m. The signal cycle at intersections is 60 seconds and
uses a two phase signal.

[BRTS Evaluation and Design (BEAD) Tool, Interim Report, Oct 2011]
55 SGArchitects
Figure 20: Aerial view of (Google Earth) Bogota BRTS – Caracas Corridor
The comparative results, between the tool output and the actual site studies generated by ITDP have
been presented in Table 7.
Table 7: Validation of results for Bogota BRTS corridor
Data from Studies/Surveys Model Results
PPHPDT – 45000 (Walter Hook) (150 pas/bus)
(300 buses/hr/dir)
PPHPDT – 48000 (160 pas/bus) (300
buses/hr/dir)
Average Corridor Speed – 26 Km/hr (Express
Service), 21 Km/hr. (all stop service)
Average Corridor Speed – 26.70 Km/hr

[BRTS Evaluation and Design (BEAD) Tool, Interim Report, Oct 2011]
56 SGArchitects
Annexure 1: First BEAD Workshop – Finalization of Input Variables
Objective of the workshop:
To discuss and get feedback on establishing and identifying important input variables as well their
relationship in determining system performance as measured by its capacity and various delays for
the development of the Bus Rapid Transit System (BRTS) Design and Evaluation Tool (BEAD)
Participants:
1. Institute for Urban Transport (IUT)
2. Transportation Research and Injury Prevention Program (TRIPP), IIT Delhi
3. Shakti Sustainable Energy Foundation (SSEF)
4. Delhi Integrated Multi Modal Transport Systems Ltd (DIMMTS)
5. Urban Mass Transit Company (UMTC)
6. Capita Symonds
7. Innovative Transport Solutions (i-Trans)
8. S G Architects (SGA)
9. Dr. Joseph Fazio
Comments:
• Allow users to choose pedestrian crossing options at junctions. ‘Walk With’ or ‘All Red’
policy.
• Include ‘Land Use Pattern’ as one of the variables as it would affect model output.
• In assumptions - the ROW up to 120m may be added.
• Constant spacing of stops (770m) needs some alteration to fit in more mid block stations.
• Mid block stops not present right now. Can be included.

[BRTS Evaluation and Design (BEAD) Tool, Interim Report, Oct 2011]
57 SGArchitects
Annexure 2: Second BEAD Workshop
Variables and Discussions on the Working of the Tool
Objective of the workshop:
The objective of this workshop was to present the
collect feedback on the user friendliness of the tool as well as the utility and application of results
generated by the same
List of Participants:
1. Institute for Urban Transport (IUT)
2. Transportation Research an
3. Shakti Sustainable Energy Foundation (SSEF)
4. Delhi Integrated Multi Modal Transport Systems Ltd (DIMMTS)
5. Innovative Transport Solutions (i
6. S G Architects (SGA)
7. Pune Municipal Coporation (PMC)
8. Greater Vishakapatnam Municipal Coporation (GVMC)
9. Rajkot Municipal Corporation (RMC)
10. Surat Municipal Coproration (SMC)
11. Institute for Transportation & Development Policy
12. UTTIPEC, DDA (Delhi Development Authority)
13. Kolkata Metropolitan Development Authority (KMDA)
14. IL&FS Infrastructure Development Corporation Ltd.
15. Voyants Solutions Pvt. Ltd.
16. PWD, Govt. Of NCT, Delhi
[BRTS Evaluation and Design (BEAD) Tool, Interim Report, Oct 2011]
Annexure 2: Second BEAD Workshop – Finalization of Output
Variables and Discussions on the Working of the Tool
Objective of the workshop:
The objective of this workshop was to present the BETA version of the tool and its working, and
back on the user friendliness of the tool as well as the utility and application of results
Institute for Urban Transport (IUT)
Transportation Research and Injury Prevention Program (TRIPP), IIT Delhi
Shakti Sustainable Energy Foundation (SSEF)
Delhi Integrated Multi Modal Transport Systems Ltd (DIMMTS)
Innovative Transport Solutions (i-Trans)
Pune Municipal Coporation (PMC)
hakapatnam Municipal Coporation (GVMC)
Rajkot Municipal Corporation (RMC)
Surat Municipal Coproration (SMC)
Institute for Transportation & Development Policy
UTTIPEC, DDA (Delhi Development Authority)
Kolkata Metropolitan Development Authority (KMDA)
Infrastructure Development Corporation Ltd.
Finalization of Output
d its working, and
back on the user friendliness of the tool as well as the utility and application of results

[BRTS Evaluation and Design (BEAD) Tool, Interim Report, Oct 2011]
58 SGArchitects
Comments provided by Participants during the two day session at the
Workshop:
• Hybrid system selection option should be given along with o
• Effect of set back at the far-side station should be explained in the manual
• Bus shelter/ Bus station a more appropriate word than Bus stop. The main station can be called
as a Bus terminal
• Can the mid-block station take a signal?
• Can we see the performance of the BRT as a function of its demand as demand also includes
performance?
• Fixing 10-15% of the junction signal cycle for buses might not be correct because at smaller
junctions the % may be more and at bigger junctions it might
accumulation in smaller junctions is also small due to smaller cycles hence the bigger junctions
might be the issue.
• Area (m2/pass)should be related for various LOS
• Can we have different corridor designs and integrate them in this s
• A glossary of definitions of technical terms used in BEAD to help the users
• Make a user manual and explain how the dummy variables can be changed to get required
results.
• The signal phasing diagram should change for different designs. Right now it
designs.
• In the output, colour the various results obtained to show whether the result is correct or wrong
to make it easier for the users to evaluate a design
• Assign a LOS to the output obtained and make this decision city specific.
based on NMT infrastructure availability and
• If there is a green phase for Buses and Boarding and alighting is still in progress at the station, is
the delay caused accounted for in BEAD??
• Access trips’ trip length frequency dis
• Access trip by cycle parking also
• Is the delay in access difference between Low floor and high floor buses considered?
• What about V/C ratios in MV lanes. A lot of opposition to BRT is
should assess MV lane performance for various designs also
• Turnstiles and ticket vending can be staggered to make way for 2 turnstiles at the same time
[BRTS Evaluation and Design (BEAD) Tool, Interim Report, Oct 2011]
Comments provided by Participants during the two day session at the
Hybrid system selection option should be given along with open and closed systems
side station should be explained in the manual
Bus shelter/ Bus station a more appropriate word than Bus stop. The main station can be called
block station take a signal?
an we see the performance of the BRT as a function of its demand as demand also includes
15% of the junction signal cycle for buses might not be correct because at smaller
junctions the % may be more and at bigger junctions it might be lesser. But the bus
accumulation in smaller junctions is also small due to smaller cycles hence the bigger junctions
/pass)should be related for various LOS
Can we have different corridor designs and integrate them in this software?
A glossary of definitions of technical terms used in BEAD to help the users
Make a user manual and explain how the dummy variables can be changed to get required
The signal phasing diagram should change for different designs. Right now it is constant for all
In the output, colour the various results obtained to show whether the result is correct or wrong
to make it easier for the users to evaluate a design.
Assign a LOS to the output obtained and make this decision city specific. Can we have the LOS
vailability and access?
If there is a green phase for Buses and Boarding and alighting is still in progress at the station, is
the delay caused accounted for in BEAD??
Access trips’ trip length frequency distribution to be considered for different access types
Access trip by cycle parking also should be included
Is the delay in access difference between Low floor and high floor buses considered?
What about V/C ratios in MV lanes. A lot of opposition to BRT is from the car lobby and the tool
should assess MV lane performance for various designs also.
Turnstiles and ticket vending can be staggered to make way for 2 turnstiles at the same time
Comments provided by Participants during the two day session at the
pen and closed systems
Bus shelter/ Bus station a more appropriate word than Bus stop. The main station can be called
an we see the performance of the BRT as a function of its demand as demand also includes
15% of the junction signal cycle for buses might not be correct because at smaller
be lesser. But the bus
accumulation in smaller junctions is also small due to smaller cycles hence the bigger junctions
Make a user manual and explain how the dummy variables can be changed to get required
is constant for all
In the output, colour the various results obtained to show whether the result is correct or wrong
Can we have the LOS
If there is a green phase for Buses and Boarding and alighting is still in progress at the station, is
tribution to be considered for different access types
Is the delay in access difference between Low floor and high floor buses considered?
from the car lobby and the tool
Turnstiles and ticket vending can be staggered to make way for 2 turnstiles at the same time

[BRTS Evaluation and Design (BEAD) Tool, Interim Report, Oct 2011]
59 SGArchitects
Feed back provided by the Participants
IUT:
• About one-third of the variables are fixed and the remaining are variable
• Output should be specific to Users, operators and the owner of the system
• User manual should contain details on what specific inputs need to be changed for what specific
output required
• Impact on other road users, apart from bus users also to be given in output
Different user groups
Designers/ Consultants
• BEAD in its current form can be used for evaluating but not designing a new system from scratch
• Existing designs can be altered and their effects can be observed using BEAD
• Benchmarking of different designs required to define an optimum design
Operators
• Open system better than closed. We can’t have buses operating like Metro.
• Station location (island/ staggered) also plays a role
• Travel without ticket involves queues at checking points and that can also be included
ULBs who evaluate the BRT designs
• Detailed training required for ULBs, one 2-day session insufficient (VIzag, Rajkot)
• Glossary required so that BEAD can be used on their own (Pune)
• Useful, but only after more practice (Pune, Vizag, Surat)
• In case of Metro running parallel to BRTS, some of the variables are fixed and same as Metro,
can BEAD function in such a scenario (Kolkata)
• Impact of BRT on motorised vehicles is important (Delhi PWD)

[BRTS Evaluation and Design (BEAD) Tool, Interim Report, Oct 2011]
60 SGArchitects
Annexure 3: List of Input Variables and Output Fields Used in the Tool
Parameters involved in the design of BRT
Sr.No. Input Variables Category
1 Mid block, Signalized or roundabout junction station
2 System Operation Type
3 Use of physically segregated bus ways or dedicated lanes
4 Staggered or common station
5 Station is Left or right side of bus boarding lane
6 Parallel or single station
7 With or without overtaking lanes
8 First Bus boarding front edge from stop line (for near side) or last bus rear edge from stop line
(for far side)
9 No. of Simultaneous buses to be catered (total for both directions)
10 Platform Height
11 Designed platform width (each)
12 Grade separated Junction (no signal delay for buses)
13 Junction signal cycle
14 Near side or far side
15 With or without doors
16 Bus Type planned for
17 Off board fare collection
18 Bus Turning allowed at this junction (not for end of corridor turns)
19 Vehicle turning allowed at junction
20 Pedestrian access type
21 Grade Separated Pedestrian crossing access type
22 Row Width
23 Average distance between junctions/stoppages
24 Expected motor vehicular queue length in peak hours
25 No. of MV lanes desired per direction at mid block
26 Ratio of turning buses as a proportion of total buses
27 Is there BRTS on cross roads at intersection
28 Junction Type
29 Cross Road traffic type
30 BRTS corridor Traffic Type
31 Distance from first bus front (in case of near station) or last bus rear (in case of far side
station) to nearest Intersection
32 Boarding level
33 No. of access to the station
34 Corridor Length
35 Average Motorized Trip length in the city
36 Bus priority signal
37 All Red phase for vehicles or dedicated pedestrian green phase
38 Land use along the corridor
Additional Corridor Junction Information for Mid block Stations

[BRTS Evaluation and Design (BEAD) Tool, Interim Report, Oct 2011]
61 SGArchitects
39 Single or parallel lanes on near side of intersection
40 Grade separated Junction (no signal delay for buses)
41 Junction signal cycle
42 Bus Turning allowed at this junction (not for end of corridor turns)
43 Vehicle turning allowed at junction
44 Expected motor vehicular queue length in peak hours
45 Ratio of turning buses as a proportion of total buses
46 Is there BRTS on cross roads at intersection
47 Junction Type
48 Cross Road traffic type
49 BRTS corridor Traffic Type
50 Bus Priority Signal
51 All Red phase for vehicles or dedicated pedestrian green phase
52 Jurisdiction of BRTS corridor
53 BRTS Corridor name
54 Begin point of BRTS corridor
55 End point of BRTS corridor
56 Number of segments in corridor length
Sr.No. Default Variables Category (Editable)
1 Green phase for buses per direction without turning
2 Green phase for buses per direction turning phase (separate turning phase)
3 Minimum bus delay
4 Average bus acceleration
5 Average Bus Deceleration
6 Junction width
7 Minibus length
8 Urban Bus length
9 Articulated bus length
10 Bi articulated bus length
11 Gap between bus without overtaking
12 Gap between buse with overtaking
13 Ratio of turning buses as a proportion of total buses
14 Overtaking lane rule
15 Pedestrian Ramp gradient
16 Walking speed
17 Half Subway level difference
18 Full subway level difference
19 FOB level difference
20 Climb rate for Escalator
21 Climb rate for Ramps
22 Climb rate for steps
23 Gap between waiting buses
24 Minibus Capacity
25 Urban Bus Capacity
26 Articulated bus Capacity
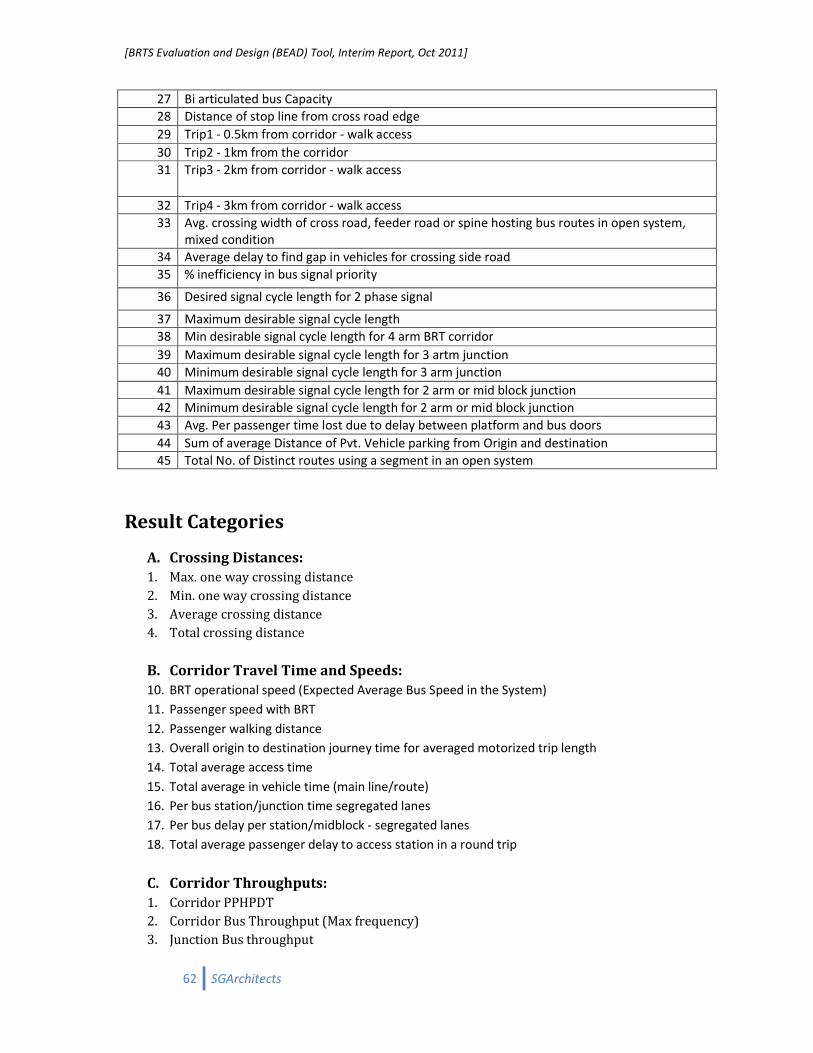
[BRTS Evaluation and Design (BEAD) Tool, Interim Report, Oct 2011]
62 SGArchitects
27 Bi articulated bus Capacity
28 Distance of stop line from cross road edge
29 Trip1 - 0.5km from corridor - walk access
30 Trip2 - 1km from the corridor
31 Trip3 - 2km from corridor - walk access
32 Trip4 - 3km from corridor - walk access
33 Avg. crossing width of cross road, feeder road or spine hosting bus routes in open system,
mixed condition
34 Average delay to find gap in vehicles for crossing side road
35 % inefficiency in bus signal priority
36 Desired signal cycle length for 2 phase signal
37 Maximum desirable signal cycle length
38 Min desirable signal cycle length for 4 arm BRT corridor
39 Maximum desirable signal cycle length for 3 artm junction
40 Minimum desirable signal cycle length for 3 arm junction
41 Maximum desirable signal cycle length for 2 arm or mid block junction
42 Minimum desirable signal cycle length for 2 arm or mid block junction
43 Avg. Per passenger time lost due to delay between platform and bus doors
44 Sum of average Distance of Pvt. Vehicle parking from Origin and destination
45 Total No. of Distinct routes using a segment in an open system
Result Categories
A. Crossing Distances:
1. Max. one way crossing distance
2. Min. one way crossing distance
3. Average crossing distance
4. Total crossing distance
B. Corridor Travel Time and Speeds:
10. BRT operational speed (Expected Average Bus Speed in the System)
11. Passenger speed with BRT
12. Passenger walking distance
13. Overall origin to destination journey time for averaged motorized trip length
14. Total average access time
15. Total average in vehicle time (main line/route)
16. Per bus station/junction time segregated lanes
17. Per bus delay per station/midblock - segregated lanes
18. Total average passenger delay to access station in a round trip
C. Corridor Throughputs:
1. Corridor PPHPDT
2. Corridor Bus Throughput (Max frequency)
3. Junction Bus throughput

[BRTS Evaluation and Design (BEAD) Tool, Interim Report, Oct 2011]
63 SGArchitects
4. Station Bus Throughput (separate from junction for mid block station)
5. User input - buses per hour per direction
D. Bus Shelter Length:
1. Bus shelter length without ramp
2. Bus shelter length with ramp at one entrance
E. Comparison:
5. Time saved by BRT over Private Transport
6. Avg. passenger speed with buses without BRT
7. Time saved by BRT over mixed condition bus
8. Daily bus passenger hours saved
F. Signal Cycle:
1. Junction signal cycle length
2. Junction signal phases
3. No. Of phases
4. Pedestrian only phase
5. Pedestrian phase length
6. User defined signal cycle
7. Junction is grade separated or not
G. Proposed Cross Section (From LHS to RHS)
1. Edge Footpath
2. Service Lane
3. Unpaved
4. Footpath
5. Tree Belt
6. Cycle Track
7. Segregator
8. Parking
9. Carriageway
10. Turning Pocket
11. Bus Shelter 1
12. Bus Lane (Boarding 1)
13. Bus Shelter 2
14. Bus Lane (Boarding 2)
15. Central Island
16. Bus Lane
17. Median
18. Turning Pocket
19. Carriageway
20. Parking Segregator
21. Cycle Track
22. Tree Belt
23. Footpath

[BRTS Evaluation and Design (BEAD) Tool, Interim Report, Oct 2011]
64 SGArchitects
24. Unpaved
25. Service Lane
26. Edge Footpath

[BRTS Evaluation and Design (BEAD) Tool, Interim Report, Oct 2011]
65 SGArchitects
Annexure 4: Boarding Alighting Survey Data
Data for buses with three steps:
Bus type Door No. of
Steps
Time in Sec No. of passengers Boarding
or
Alighting
Average
Per Pass.
Time in
Sec
Rear
Door
Front
Door
DTC H Open 3 4 1 down 4
DTC H Open 3 12 6 down 2
DTC H Open 3 5 2 down 2.5
DTC H Open 3 8 3 up 2.6666666
7
DTC H Open 3 11 5 up 2.2
DTC H Open 3 9 6 down 1.5
DTC H Open 3 6 4 down 1.5
DTC H Open 3 1 1 down 1
Data for buses with level boarding
Bus type Door No. of
Steps
Time in
Sec
No. of passengers Boarding
or
Alighting
Average
Per Pass.
Time in
Sec
Rear Door Front Door
DTC L Closed 5 3 down 1.66666
7
Orange Closed 3 2 down 1.5
DTC L Closed 15 8 down 1.875
Orange Closed 8 4 down 2
DTC L Closed 6 4 down 1.5
Orange Closed 9 5 down 1.8
DTC L Closed 3 1 down 3
DTC L Closed 3 2 down 1.5
DTC L Closed 5 4 down 1.25
DTC L Closed 5 3 down 1.66666
7
Orange Closed 6 3 up 2
Orange Closed 10 6 down 1.66666
7
DTC L Closed 8 6 down 1.33333
3
DTC L Closed 10 8 down 1.25
DTC L Closed 9 7 down 1.28571
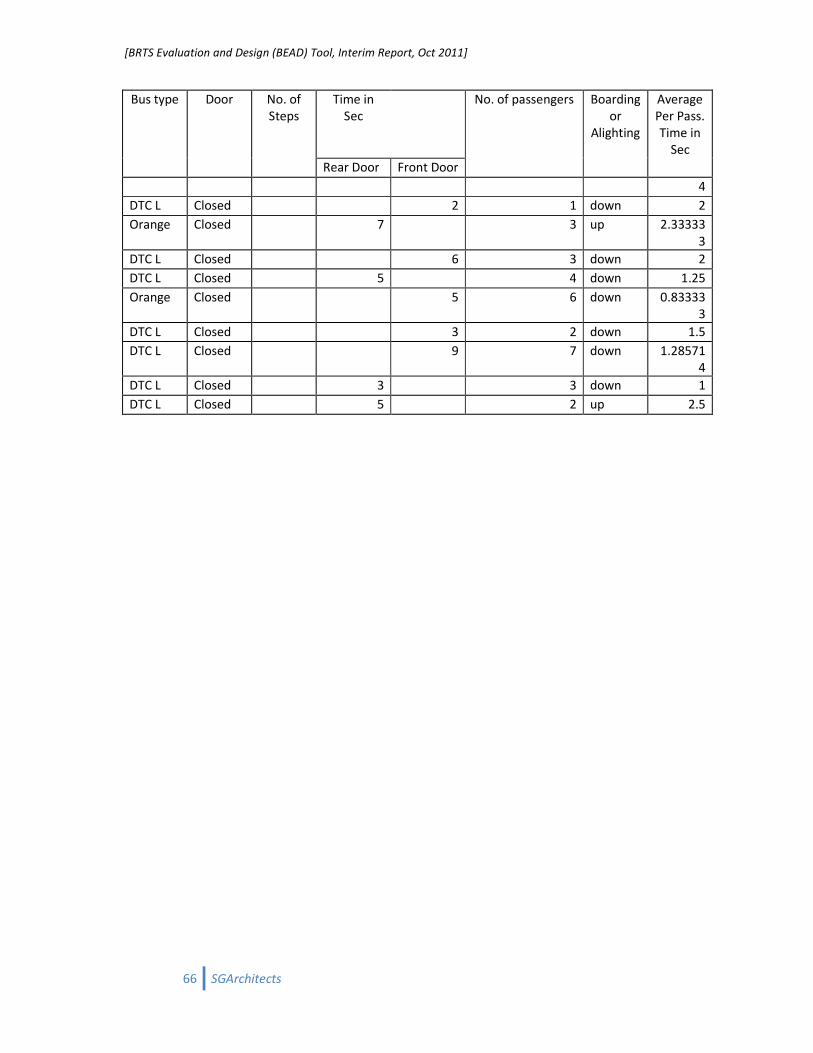
[BRTS Evaluation and Design (BEAD) Tool, Interim Report, Oct 2011]
66 SGArchitects
Bus type Door No. of
Steps
Time in
Sec
No. of passengers Boarding
or
Alighting
Average
Per Pass.
Time in
Sec
Rear Door Front Door
4
DTC L Closed 2 1 down 2
Orange Closed 7 3 up 2.33333
3
DTC L Closed 6 3 down 2
DTC L Closed 5 4 down 1.25
Orange Closed 5 6 down 0.83333
3
DTC L Closed 3 2 down 1.5
DTC L Closed 9 7 down 1.28571
4
DTC L Closed 3 3 down 1
DTC L Closed 5 2 up 2.5

[BRTS Evaluation and Design (BEAD) Tool, Interim Report, Oct 2011]
67 SGArchitects
Annexure 5: Flow Charts for Important Processes used in the BEAD
Tool The following pages present flow diagrams of some of the processes used in the BEAD Tool. The
symbols used in the diagram are as following:
Process
Alternate Process
Terminator
Decision
Data
Manual Input
Collate
Sort
Display
Stored Data

[BRTS Evaluation and Design (BEAD) Tool, Interim Report, Oct 2011]
68 SGArchitects
Figure 21 – Process 1: Journey time for average trip in the city, in mins
Open Closed
Start
System open
or closed
Journey Time
for average
trip in Min
End
Process 4 Process 5
Journey time
in Secs for
average trip
(open
system)
Journey time
in Secs for
average trip
(open
system)
Divide by 60

[BRTS Evaluation and Design (BEAD) Tool, Interim Report, Oct 2011]
69 SGArchitects
Figure 22 – Process 2: Determining average bus speed in the BRTS corridor
Peak Bus
speed in
m/s = B
{((A/B)+C+D)*3.6}
Average Bus
Speed in
Corridor in
Km/hr
End
Start
Average Distance
between Stations
in m. = A
Bus Delay at
(Intersection)
Station in
secs = C
Bus Delay at
Intersection
(cross roads
away from
station) in secs
Process 6 Process 7
Is this a
mid-block
station
Yes
No, D=0
Segregated
bus lanes
Process 35
Yes
No
Average bus
speed in
mixed
conditions
Bus lanes type –
segregated or
unsegregated

[BRTS Evaluation and Design (BEAD) Tool, Interim Report, Oct 2011]
70 SGArchitects
Figure 23 – Process 3: Determining Capacity of the BRTS Corridor/Segment
Total bus
throughput per
hour per
direction = C
Process 48
Passenger
Capacity in
PPHPD
End
Passenger
capacity of
bus = D
Passenger
Capacity for
different bus
types
Bus Type
C*D
Start

[BRTS Evaluation and Design (BEAD) Tool, Interim Report, Oct 2011]
71 SGArchitects
Figure 24: Process 4 – Journey time in secs for average trip in open system
Start
Process 11
E = Avg. O to D
travel time in sec
for O-D located
within 0-500m
from the corridor
– no interchange
G = Avg. O-D travel
time in sec for O-D
located within
1000-2000m from
the corridor - no
interchange
Process 13
Avg. Pas. journey
time for avg. trip
in open system
in sec
End
(K*J)+ {I*(100-J)} J = % of trips
transferring at
the corridor
K = Average O
to D travel time
(in secs) for
average trip in
a closed system
Process 5
F = Avg. O to D
travel time in sec
for O-D located
within 500-1000m
from the corridor –
no interchange
Process 12
I = (E*A)+(F*B)+
(G*C)+(H*D)
Process 14
H = Avg. O to D
travel time in sec
for O-D located
within 2000-3000m
from the corridor –
no interchange
% of trips (distance
from corridor):
A = 0 - 500m
B = 500 - 1000m
C = 1000 to 2000m
D = 2000 to 3000m
Process 47

[BRTS Evaluation and Design (BEAD) Tool, Interim Report, Oct 2011]
72 SGArchitects
Figure 25 – Process 5 – Average journey time in secs for average trip length in a closed system
Start
Process 11
E = Average O to
D travel time for
O-D located
within 0-500m
from the corridor
– no interchange
G = Average O to D
travel time for O-D
located within
1000-2000m from
the corridor –
transfer at corridor
Process 16
Avg. Pas. journey
time for avg. trip
in closed system
in sec
End
F = Average O to D
travel time for O-D
located within 500-
1000m from the
corridor – transfer
at corridor
Process 15
I = (E*A)+(F*B)+
(G*C)+(H*D)
Process 17
H = Average O to D
travel time for O-D
located within
2000-3000m from
the corridor–
transfer at corridor
% of trips (distance
from corridor):
A = 0 - 500m
B = 500 - 1000m
C = 1000 to 2000m
D = 2000 to 3000m
Process 47

[BRTS Evaluation and Design (BEAD) Tool, Interim Report, Oct 2011]
73 SGArchitects
Figure 26 – Process 6: Bus delay at stations including signal delay (pedestrian signal delay at mid block stations)
Avg. Pas. Delay
at stations signal
(for mid block
stations ped.
Signal)
End
Start
Process 18
Station is
Island or
staggere
d
Process 21
Island
Staggered
Total time lost
in near side
station (with
or without
overtaking
lane)
Process 19
Station is
near or
far side
With or
without
overtaking
lane
Total time lost
in island
station with
overtaking
lane
With
Without
Far
Near
Total time
lost in far
side
stations
with
overtaking
lane
Total time
lost in a far
side station
without
overtaking
lane
Process 20
With or
without
overtaking
lane
Total time lost
in island
station
without
overtaking
lane
Process 22
Without
With

[BRTS Evaluation and Design (BEAD) Tool, Interim Report, Oct 2011]
74 SGArchitects
Figure 27 – Process 7: Bus delay at intersection (cross roads) on corridors with mid block stations
Start
{(A*C)+(B*
D)}/(A+B)
Process 23
A = Straight
bus
throughput
capacity per
cycle per dir.
at intersection
Process 24
B = Turning
bus
throughput
capacity per
cycle at
intersection
Avg. Per bus delay
at signalized
intersection
following a mid
block station
End
C = Weighted
average of bus
delay for
straight bus at
signalized
intersection
D = Weighted
average of bus
delay for
turning bus at
signalized
intersection
Process 25 Process 26

[BRTS Evaluation and Design (BEAD) Tool, Interim Report, Oct 2011]
75 SGArchitects
Figure 28: Flow chart for Process 8 - Bus throughput per signal cycle per direction from station including intersections
throughput for junction stations (roundabout or signalized).
Island
Staggered
Far Near
Total bus
throughput
per cycle per
direction for
far side
stations
Process 29
Total Bus through-
put per cycle from
station (including
intersection for
junction stations
End
Total bus
throughput
per cycle per
direction for
near side
stations
Station is
near or
far side
Total bus
throughput
per cycle per
direction for
island stations
Start
Process 28
Station is
Island or
staggere
d
Process 27

[BRTS Evaluation and Design (BEAD) Tool, Interim Report, Oct 2011]
76 SGArchitects
Figure 29: Flow chart for Process 9 - Total Buses Throughput per signal cycle per direction from intersection (for mid
block station)
A = Throughput
per signal cycle
per direction
for straight
buses
Process 23
A+B
Total bus throughput
per cycle per direction
at intersection
between mid block
stations
End
Start
Total Buses
Throughput per
signal cycle per
direction from
junction station
Process 8
Is this a
mid block
station
B = Throughput
per signal cycle
per direction
for straight
buses
Process 24
Yes
No

[BRTS Evaluation and Design (BEAD) Tool, Interim Report, Oct 2011]
77 SGArchitects
Figure 30: Flow chart for Process 10 – Signal cycle length in secs at intersection.
Signal cycle
length in sec at
Junction station
intersections
Process 30
Signal cycle at
signalized or
roundabout
intersection
End
Start
Signal cycle
length in sec at
intersection
located between
mid block
stations
Process 31
Is this a
mid block
station
Yes No
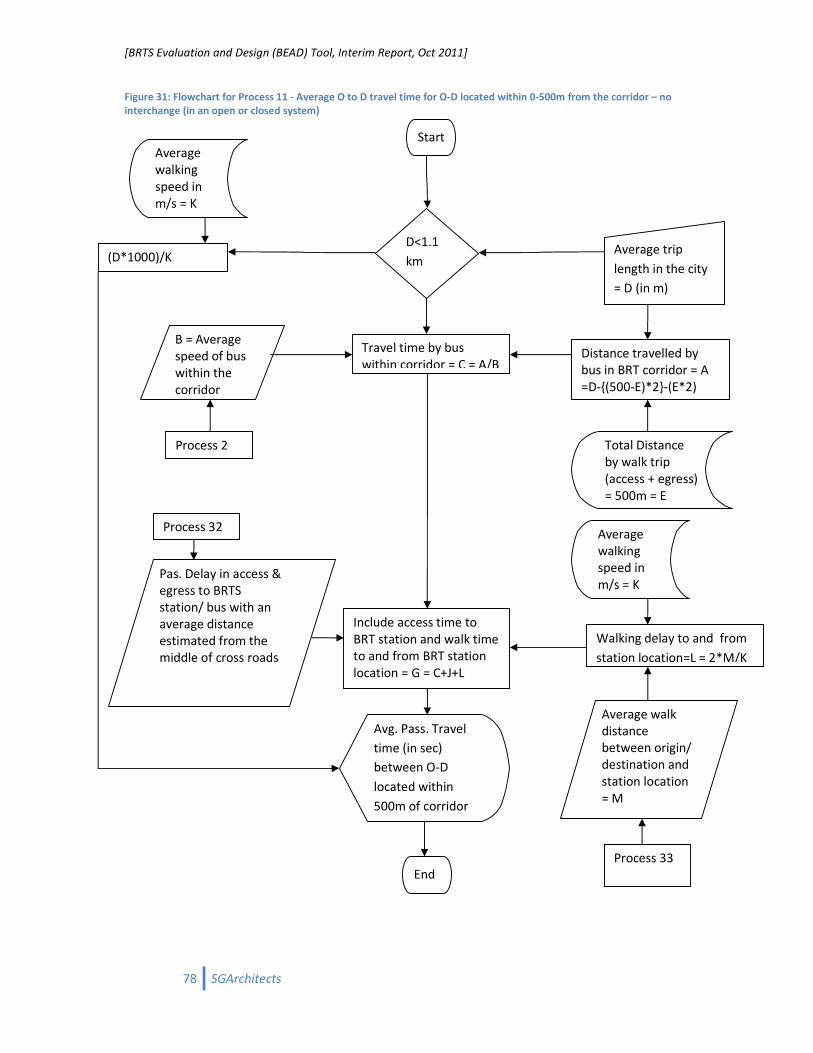
[BRTS Evaluation and Design (BEAD) Tool, Interim Report, Oct 2011]
78 SGArchitects
Figure 31: Flowchart for Process 11 - Average O to D travel time for O-D located within 0-500m from the corridor – no
interchange (in an open or closed system)
Pas. Delay in access &
egress to BRTS
station/ bus with an
average distance
estimated from the
middle of cross roads
Process 32
Include access time to
BRT station and walk time
to and from BRT station
location = G = C+J+L
Avg. Pass. Travel
time (in sec)
between O-D
located within
500m of corridor
End
Total Distance
by walk trip
(access + egress)
= 500m = E
Average trip
length in the city
= D (in m)
Walking delay to and from
station location=L = 2*M/K
Start
Process 33
Average walk
distance
between origin/
destination and
station location
= M
B = Average
speed of bus
within the
corridor
Process 2
Travel time by bus
within corridor = C = A/B Distance travelled by
bus in BRT corridor = A
=D-{(500-E)*2}-(E*2)
Average
walking
speed in
m/s = K
D<1.1
km (D*1000)/K
Average
walking
speed in
m/s = K

[BRTS Evaluation and Design (BEAD) Tool, Interim Report, Oct 2011]
79 SGArchitects
Figure 32: Flowchart for process 12 – Average O to D travel time for O-D located within 500-1000m from the corridor –
no interchange (in an open system)
Avg. O-D access and
egress delay in open
system, from/to
station location = N
Process 34
Include total travel time outside
corridor = G = C+Q
Avg. Pass. Travel
time (in sec)
between O-D
located within
1000m of corridor
End
Total Distance
by walk trip
(access + egress)
= 500m = E
Average trip
length in the city
= D (in m)
Start
B = Average
speed of bus
within the
corridor
Process 2
Travel time by bus
within corridor = C = A/B Distance travelled by
bus in BRT corridor = A
=D-{(1000-E)*2}-(E*2)
Time spent outside BRT
corridor = Q = (N*2)+O
Total Time taken by bus to
travel in mixed condition =
O={(1000-E)/P}*2
Avg. Bus
speed in
mixed
condition
in m/s = P
Process 35
Total
Distance by
walk trip
(access +
egress) =
500m = E

[BRTS Evaluation and Design (BEAD) Tool, Interim Report, Oct 2011]
80 SGArchitects
Figure 33: Flowchart for process 13 – Average O to D travel time for O-D located within 1000-2000m from the corridor –
no interchange (in an open system)
Avg. O-D access and
egress delay in open
system, from/to
station location = N
Process 34
Include total travel time outside
corridor = G = C+Q
Avg. Pass. Travel
time (in sec)
between O-D
located within
2000m of corridor
End
Total Distance
by walk trip
(access + egress)
= 500m = E
Average trip
length in the city
= D (in m)
Start
B = Average
speed of bus
within the
corridor
Process 2
Travel time by bus
within corridor = C = A/B Distance travelled by
bus in BRT corridor = A
=D-{(2000-E)*2}-(E*2)
Time spent outside BRT
corridor = Q = (N*2)+O
Total Time taken by bus to
travel in mixed condition =
O={(2000-E)/P}*2
Avg. Bus
speed in
mixed
condition
in m/s = P
Process 35
Total
Distance by
walk trip
(access +
egress) =
500m = E
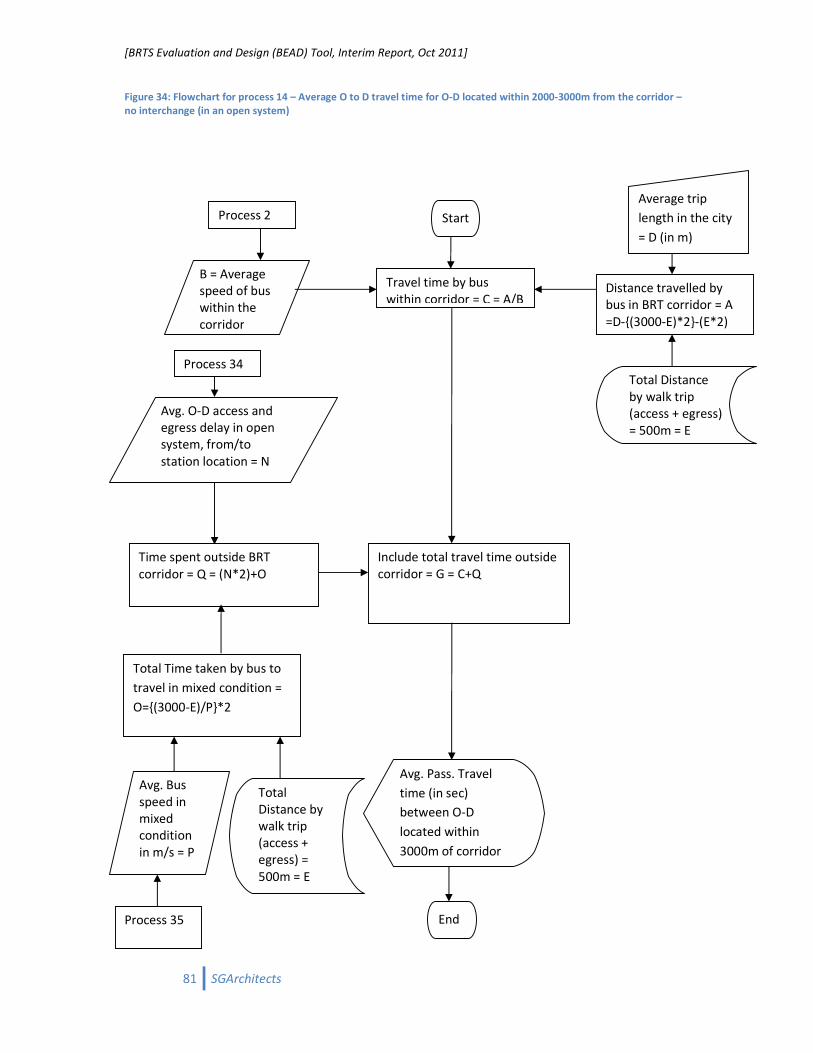
[BRTS Evaluation and Design (BEAD) Tool, Interim Report, Oct 2011]
81 SGArchitects
Figure 34: Flowchart for process 14 – Average O to D travel time for O-D located within 2000-3000m from the corridor –
no interchange (in an open system)
Avg. O-D access and
egress delay in open
system, from/to
station location = N
Process 34
Include total travel time outside
corridor = G = C+Q
Avg. Pass. Travel
time (in sec)
between O-D
located within
3000m of corridor
End
Total Distance
by walk trip
(access + egress)
= 500m = E
Average trip
length in the city
= D (in m)
Start
B = Average
speed of bus
within the
corridor
Process 2
Travel time by bus
within corridor = C = A/B Distance travelled by
bus in BRT corridor = A
=D-{(3000-E)*2}-(E*2)
Time spent outside BRT
corridor = Q = (N*2)+O
Total Time taken by bus to
travel in mixed condition =
O={(3000-E)/P}*2
Avg. Bus
speed in
mixed
condition
in m/s = P
Process 35
Total
Distance by
walk trip
(access +
egress) =
500m = E

[BRTS Evaluation and Design (BEAD) Tool, Interim Report, Oct 2011]
82 SGArchitects
Figure 35: Flowchart for Process 15 - Average O to D travel time for O-D located within 500-1000m from the corridor in a
closed system
Pas. Delay in
access &
egress to
BRTS station/
bus from
feeder
station = H
Process 32
Avg. O-D access and
egress delay from/to
station in closed
system= N
Process 36
Include total travel time outside
corridor = G = C+Q+H
Avg. Pass. Travel
time (in sec)
between O-D
located within
1000m of corridor
End
Total Distance
by walk trip
(access + egress)
= 500m = E
Average trip
length in the city
= D (in m)
Start
B = Average
speed of bus
within the
corridor
Process 2
Travel time by bus
within corridor = C = A/B Distance travelled by
bus in BRT corridor = A
=D-{(1000-E)*2}-(E*2)
Time spent outside BRT
corridor = Q = (N*2)+O
Total Time taken by bus to
travel in mixed condition =
O={(1000-E)/P}*2
Avg. Bus
speed in
mixed
condition
in m/s = P
Process 35
Total
Distance by
walk trip
(access +
egress) =
500m = E Is this a
mid block
station
Station type, mid
block junction, or
roundabout
Total walk time from
mid block station to
nearest junction I = J/H
Walking
speed in m/s
= H
Distance from mid
block stn. Crossing to
nearest junction = J
G+I
No,
J=0 Yes
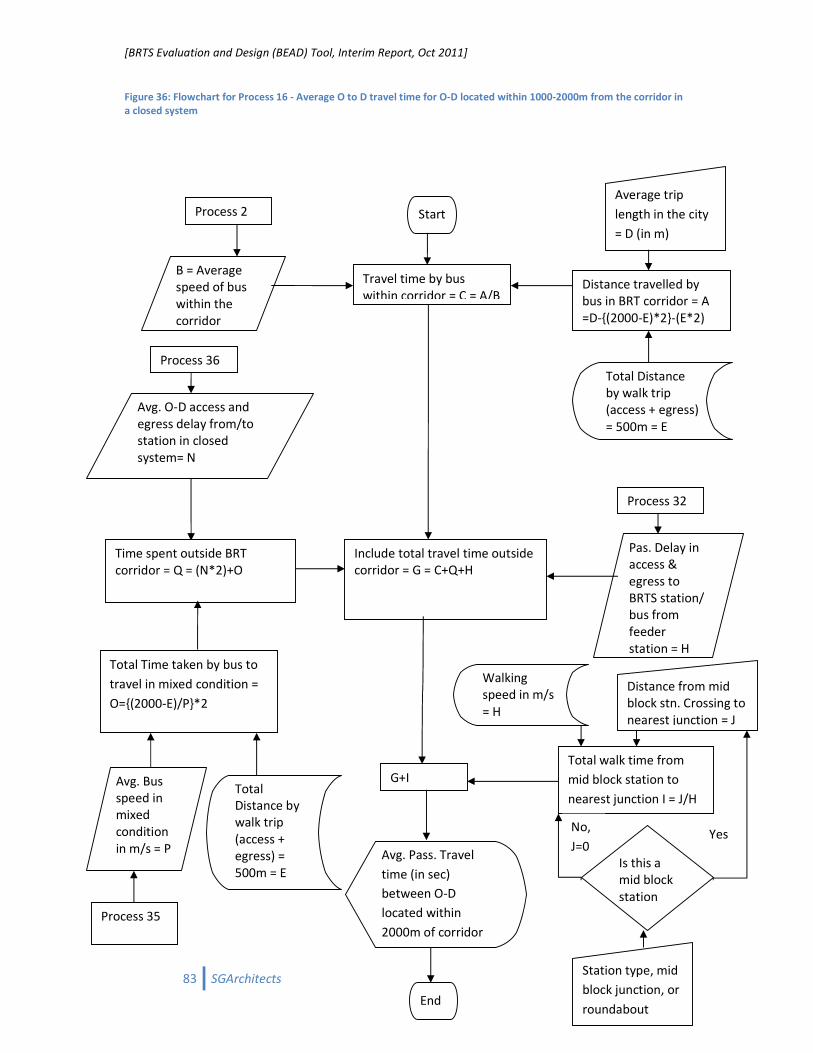
[BRTS Evaluation and Design (BEAD) Tool, Interim Report, Oct 2011]
83 SGArchitects
Figure 36: Flowchart for Process 16 - Average O to D travel time for O-D located within 1000-2000m from the corridor in
a closed system
Pas. Delay in
access &
egress to
BRTS station/
bus from
feeder
station = H
Process 32
Avg. O-D access and
egress delay from/to
station in closed
system= N
Process 36
Include total travel time outside
corridor = G = C+Q+H
Avg. Pass. Travel
time (in sec)
between O-D
located within
2000m of corridor
End
Total Distance
by walk trip
(access + egress)
= 500m = E
Average trip
length in the city
= D (in m)
Start
B = Average
speed of bus
within the
corridor
Process 2
Travel time by bus
within corridor = C = A/B Distance travelled by
bus in BRT corridor = A
=D-{(2000-E)*2}-(E*2)
Time spent outside BRT
corridor = Q = (N*2)+O
Total Time taken by bus to
travel in mixed condition =
O={(2000-E)/P}*2
Avg. Bus
speed in
mixed
condition
in m/s = P
Process 35
Total
Distance by
walk trip
(access +
egress) =
500m = E Is this a
mid block
station
Station type, mid
block junction, or
roundabout
Total walk time from
mid block station to
nearest junction I = J/H
Walking
speed in m/s
= H
Distance from mid
block stn. Crossing to
nearest junction = J
G+I
No,
J=0 Yes

[BRTS Evaluation and Design (BEAD) Tool, Interim Report, Oct 2011]
84 SGArchitects
Figure 37: Flowchart for Process 17 - Average O to D travel time for O-D located within 2000-3000m from the corridor in
a closed system
Pas. Delay in
access &
egress to
BRTS station/
bus from
feeder
station = H
Process 32
Avg. O-D access and
egress delay from/to
station in closed
system= N
Process 36
Include total travel time outside
corridor = G = C+Q+H
Avg. Pass. Travel
time (in sec)
between O-D
located within
3000m of corridor
End
Total Distance
by walk trip
(access + egress)
= 500m = E
Average trip
length in the city
= D (in m)
Start
B = Average
speed of bus
within the
corridor
Process 2
Travel time by bus
within corridor = C = A/B Distance travelled by
bus in BRT corridor = A
=D-{(3000-E)*2}-(E*2)
Time spent outside BRT
corridor = Q = (N*2)+O
Total Time taken by bus to
travel in mixed condition =
O={(3000-E)/P}*2
Avg. Bus
speed in
mixed
condition
in m/s = P
Process 35
Total
Distance by
walk trip
(access +
egress) =
500m = E Is this a
mid block
station
Station type, mid
block junction, or
roundabout
Total walk time from
mid block station to
nearest junction I = J/H
Walking
speed in m/s
= H
Distance from mid
block stn. Crossing to
nearest junction = J
G+I
No,
J=0 Yes

[BRTS Evaluation and Design (BEAD) Tool, Interim Report, Oct 2011]
85 SGArchitects
Figure 38: Flow chart for Process 18 - Average per bus delay at near side (staggered) junction stations (including junction
delay) in secs (with or without overtaking lane)
Start
Average per bus
delay at
staggered, near
side junction
stations in secs
End
Process 37 Process 38
Straight
moving per
bus per cycle
per direction
delay in sec =
A
Turning per
bus per cycle
per direction
delay in sec =
B
{(A*C)+(B*D)}/
(A+B)
Per cycle per
direction
straight
moving bus
throughput
for near side
stations = C
Per cycle per
direction
turning bus
throughput
for near side
stations= D
Process 39 Process 40

[BRTS Evaluation and Design (BEAD) Tool, Interim Report, Oct 2011]
86 SGArchitects
Figure 39: Flow chart for Process 19 - Average per bus delay at far side (staggered) junction stations (including junction
delay) in secs (with overtaking lane)
Start
Avg. per bus
delay at stagg-
ered, far side
junction stations
with overtaking
lanes in secs
End
Process 41 Process 42
Straight
moving per
bus per cycle
per direction
delay in sec =
A
Turning per
bus per cycle
per direction
delay in sec =
B
{(A*C)+(B*D)}/
(A+B)
Per cycle per
direction
straight
moving bus
throughput =
C
Per cycle per
direction
turning bus
throughput =
D
Process 43 Process 44

[BRTS Evaluation and Design (BEAD) Tool, Interim Report, Oct 2011]
87 SGArchitects
Figure 40: Flow chart for Process 20 - Average per bus delay at far side (staggered) junction stations (including junction
delay) in secs (without overtaking lane)
Start
Avg. per bus
delay at stagg-
ered, far side
junction stations
without over-
taking lane in s.
End
Process 45 Process 46
Straight
moving per
bus per cycle
per direction
delay in sec =
A
Turning per
bus per cycle
per direction
delay in sec =
B
{(A*C)+(B*D)}/
(A+B)
Per cycle per
direction
straight
moving bus
throughput =
C
Per cycle per
direction
turning bus
throughput =
D
Process 43 Process 44

[BRTS Evaluation and Design (BEAD) Tool, Interim Report, Oct 2011]
88 SGArchitects
Figure 41: Flow chart for Process 21 - Average per bus delay at Junction Island stations with overtaking lane
Start
Average per bus
delay at junction
island stations
with overtaking
lanes (in secs)
End
Process 49 Process 50
Straight
moving per
bus per cycle
per direction
delay in sec =
A
Turning per
bus per cycle
per direction
delay in sec =
B
{(A*C)+(B*D)}/
(A+B)
Per cycle per
direction
straight
moving bus
throughput =
C
Per cycle per
direction
turning bus
throughput =
D
Process 51 Process 52
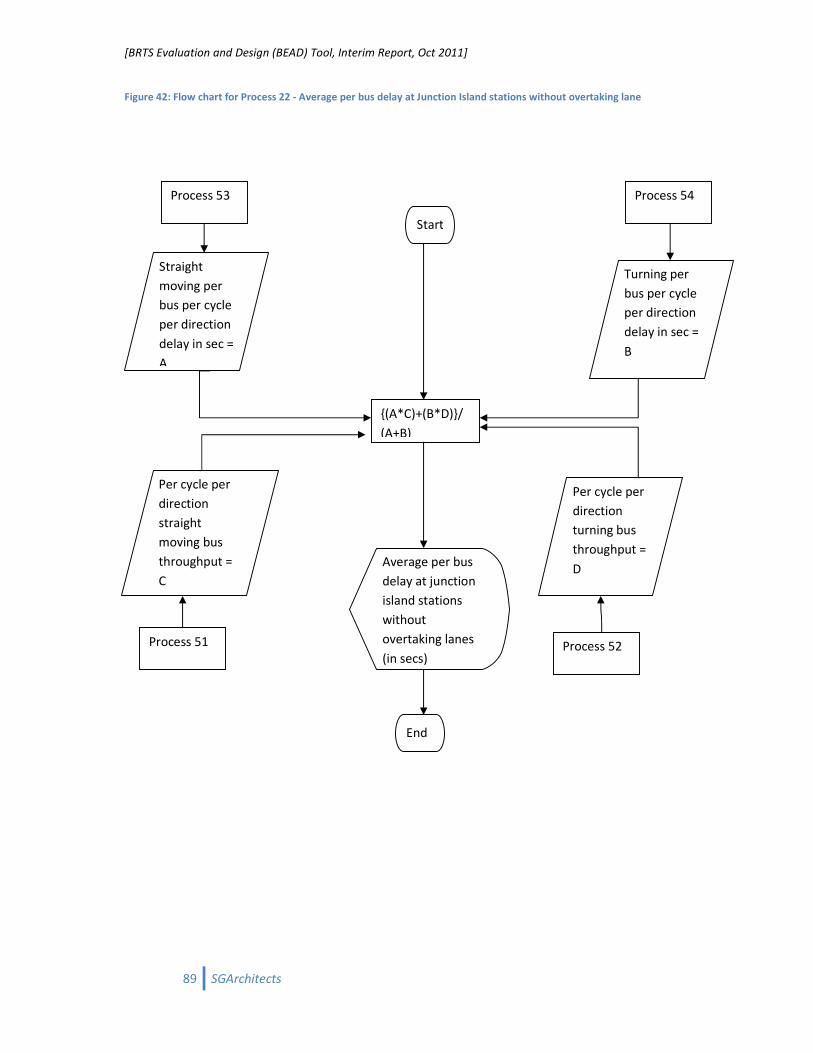
[BRTS Evaluation and Design (BEAD) Tool, Interim Report, Oct 2011]
89 SGArchitects
Figure 42: Flow chart for Process 22 - Average per bus delay at Junction Island stations without overtaking lane
Start
Average per bus
delay at junction
island stations
without
overtaking lanes
(in secs)
End
Process 53 Process 54
Straight
moving per
bus per cycle
per direction
delay in sec =
A
Turning per
bus per cycle
per direction
delay in sec =
B
{(A*C)+(B*D)}/
(A+B)
Per cycle per
direction
straight
moving bus
throughput =
C
Per cycle per
direction
turning bus
throughput =
D
Process 51 Process 52
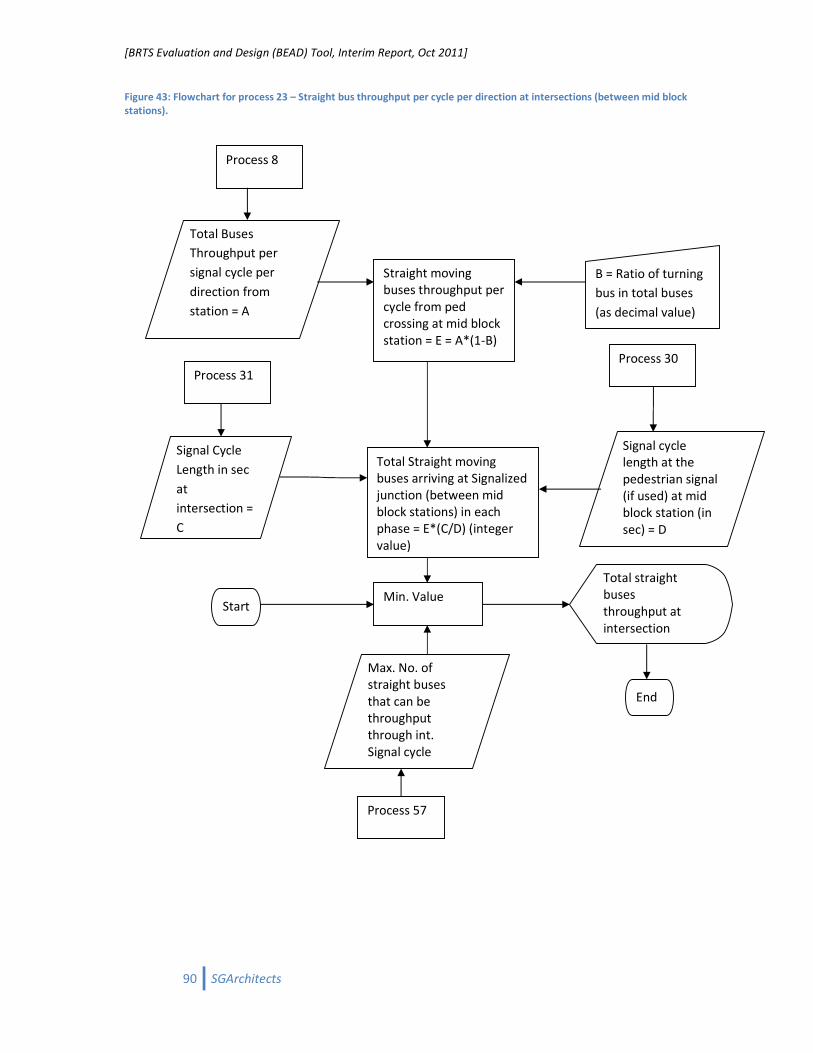
[BRTS Evaluation and Design (BEAD) Tool, Interim Report, Oct 2011]
90 SGArchitects
Figure 43: Flowchart for process 23 – Straight bus throughput per cycle per direction at intersections (between mid block
stations).
Signal Cycle
Length in sec
at
intersection =
C
Process 31
Total Straight moving
buses arriving at Signalized
junction (between mid
block stations) in each
phase = E*(C/D) (integer
value)
Total straight
buses
throughput at
intersection
End
B = Ratio of turning
bus in total buses
(as decimal value)
Min. Value Start
Process 8
Total Buses
Throughput per
signal cycle per
direction from
station = A
Straight moving
buses throughput per
cycle from ped
crossing at mid block
station = E = A*(1-B)
Signal cycle
length at the
pedestrian signal
(if used) at mid
block station (in
sec) = D
Process 30
Max. No. of
straight buses
that can be
throughput
through int.
Signal cycle
Process 57

[BRTS Evaluation and Design (BEAD) Tool, Interim Report, Oct 2011]
91 SGArchitects
Figure 44: Flowchart for process 24 – Turning bus throughput per cycle per direction at intersections (between mid block
stations).
Signal Cycle
Length in sec
at
intersection =
C
Process 31
Total turning buses
arriving at Signalized
junction (between mid
block stations) in each
phase = E*(C/D) (integer
value)
Total turning bus
throughput at
intersection
End
B = Ratio of turning
bus in total buses
(as decimal value)
Min. Value Start
Process 8
Total Buses
Throughput per
signal cycle per
direction from
station = A
Turning bus
throughput per cycle
from ped. crossing at
mid block station = E
= A*B
Signal cycle
length at the
pedestrian signal
(if used) at mid
block station (in
sec) = D
Process 30
Max. No. of
turning buses
that can be
throughput
through int.
Signal cycle
Process 58
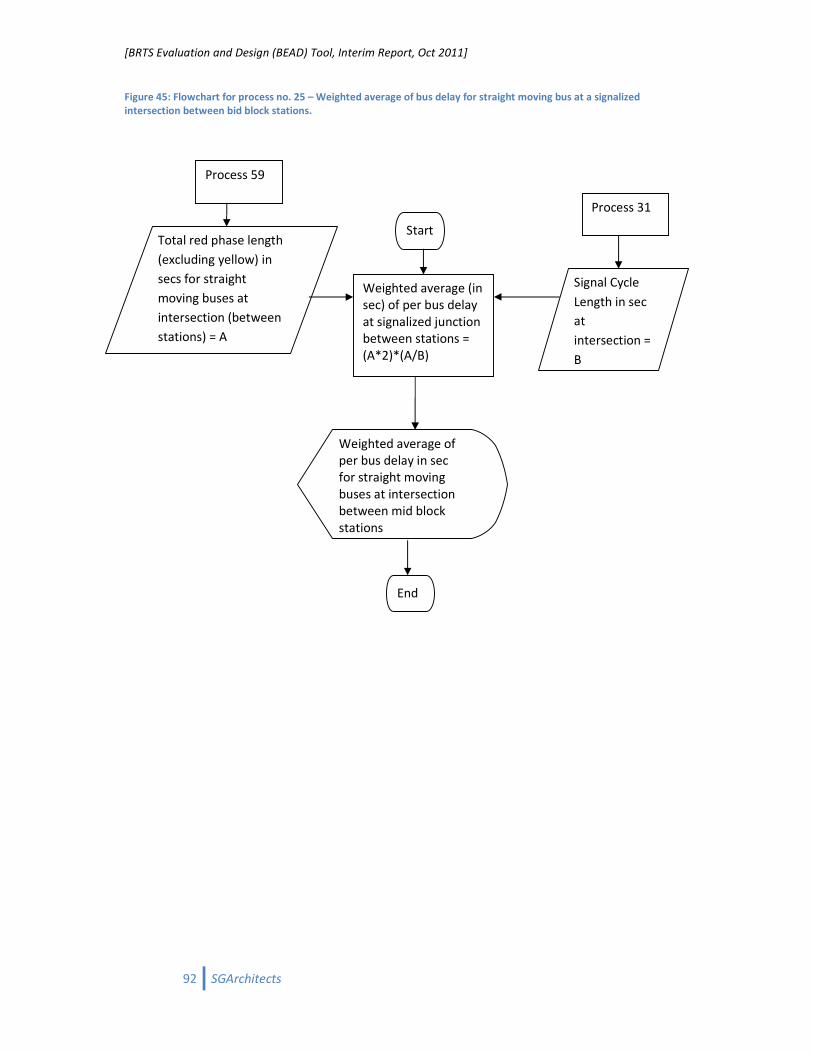
[BRTS Evaluation and Design (BEAD) Tool, Interim Report, Oct 2011]
92 SGArchitects
Figure 45: Flowchart for process no. 25 – Weighted average of bus delay for straight moving bus at a signalized
intersection between bid block stations.
Signal Cycle
Length in sec
at
intersection =
B
Process 31
Weighted average of
per bus delay in sec
for straight moving
buses at intersection
between mid block
stations
End
Start
Process 59
Total red phase length
(excluding yellow) in
secs for straight
moving buses at
intersection (between
stations) = A
Weighted average (in
sec) of per bus delay
at signalized junction
between stations =
(A*2)*(A/B)
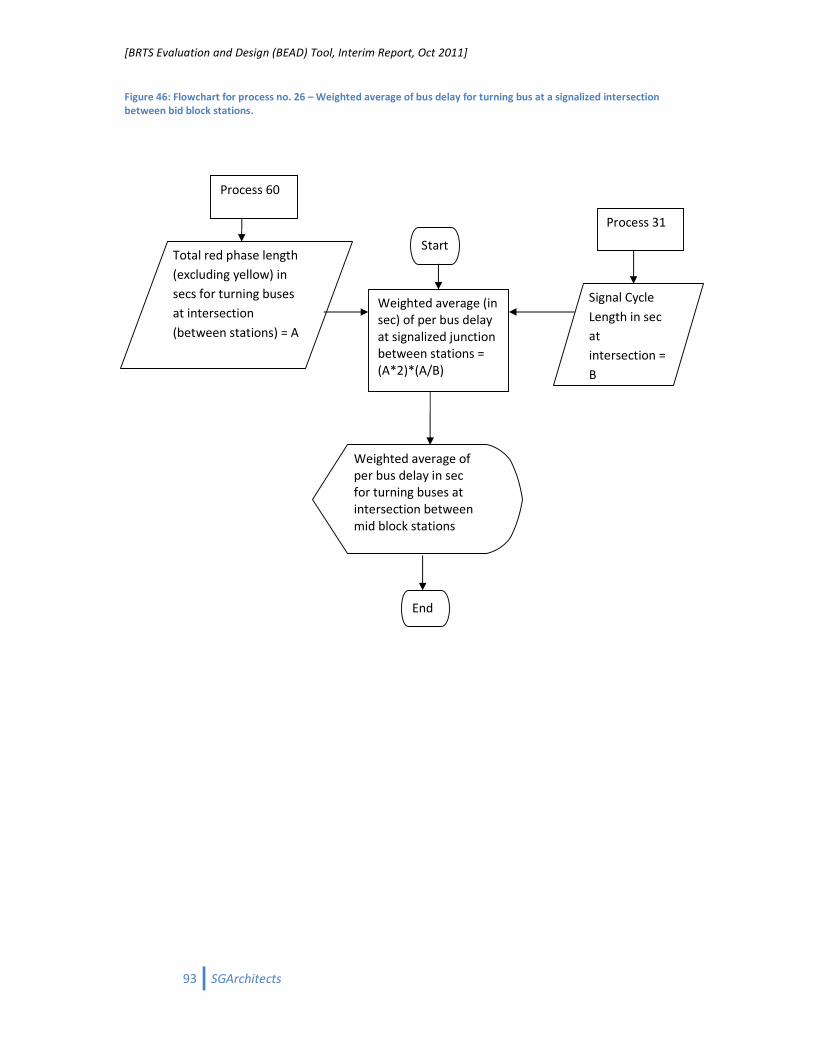
[BRTS Evaluation and Design (BEAD) Tool, Interim Report, Oct 2011]
93 SGArchitects
Figure 46: Flowchart for process no. 26 – Weighted average of bus delay for turning bus at a signalized intersection
between bid block stations.
Signal Cycle
Length in sec
at
intersection =
B
Process 31
Weighted average of
per bus delay in sec
for turning buses at
intersection between
mid block stations
End
Start
Process 60
Total red phase length
(excluding yellow) in
secs for turning buses
at intersection
(between stations) = A
Weighted average (in
sec) of per bus delay
at signalized junction
between stations =
(A*2)*(A/B)

[BRTS Evaluation and Design (BEAD) Tool, Interim Report, Oct 2011]
94 SGArchitects
Figure 47: Flowchart for Process 27 – Total bus throughput per signal cycle per direction at (junction or mid block) island
stations
Total bus
throughput per
signal cycle per
direction for far
side staggered
stations
Process 29
Total bus throughput
per signal cycle per
direction from island
stations
End
Start Process 28
Total bus throughput
per signal cycle per
direction from near
side staggered
stations
Min. Value

[BRTS Evaluation and Design (BEAD) Tool, Interim Report, Oct 2011]
95 SGArchitects
Figure 48: Flowchart for Process 28 – Total bus throughput per signal cycle per direction at (junction or mid block)
staggered, near side stations
Total turning buses
throughput per
signal cycle per
direction from near
side staggered
junction = B
Process 40
Total buses
throughput per signal
cycle per direction for
near side staggered
stations
End
Start
Process 39
Total straight moving
buses throughput per
cycle per direction
from near side
staggered stations = A
A+B
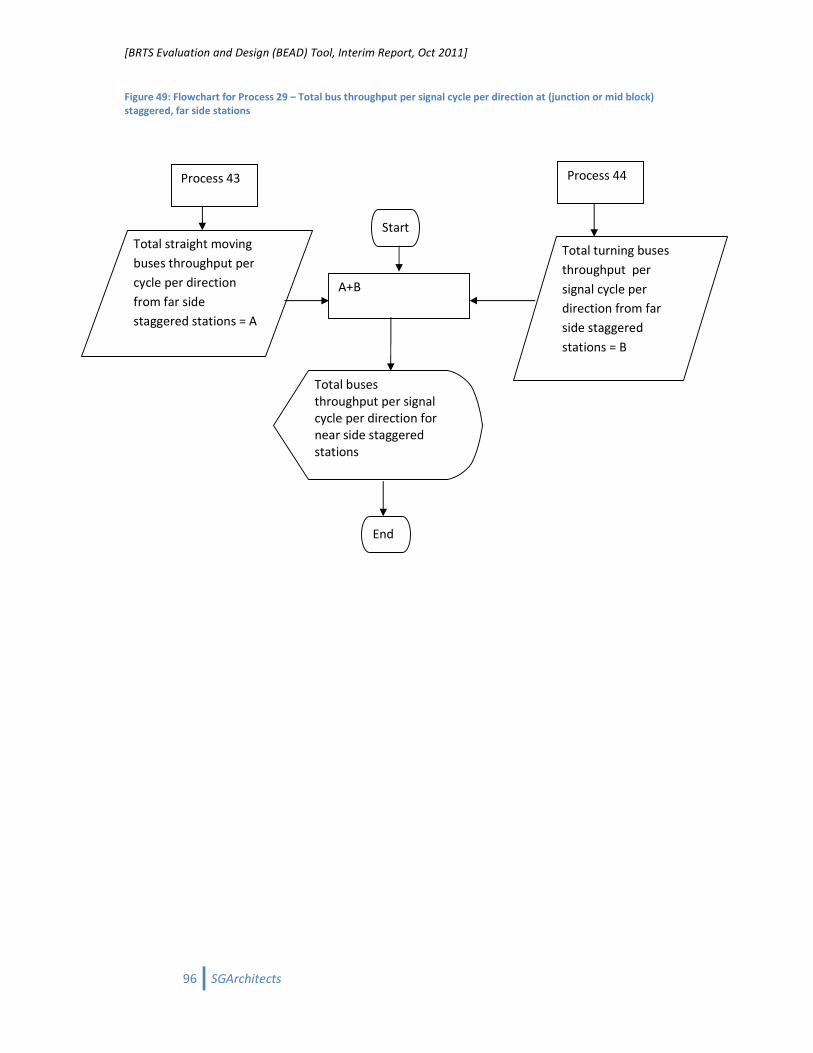
[BRTS Evaluation and Design (BEAD) Tool, Interim Report, Oct 2011]
96 SGArchitects
Figure 49: Flowchart for Process 29 – Total bus throughput per signal cycle per direction at (junction or mid block)
staggered, far side stations
Total turning buses
throughput per
signal cycle per
direction from far
side staggered
stations = B
Process 44
Total buses
throughput per signal
cycle per direction for
near side staggered
stations
End
Start
Process 43
Total straight moving
buses throughput per
cycle per direction
from far side
staggered stations = A
A+B
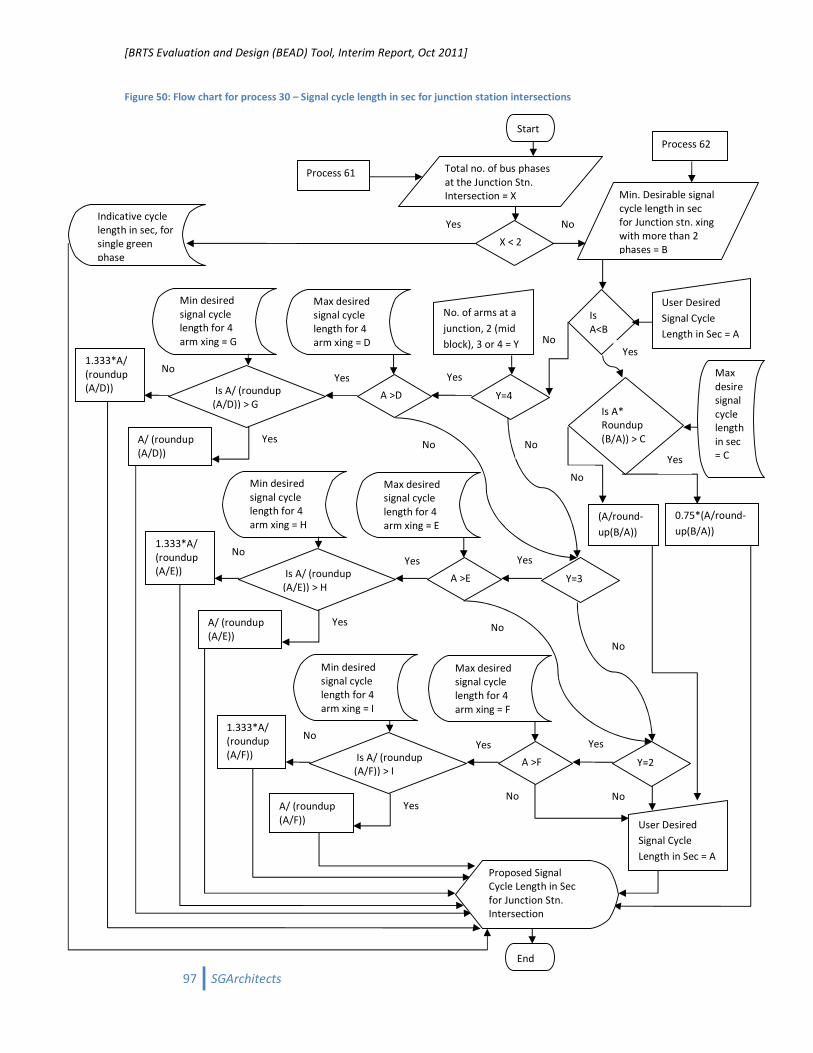
[BRTS Evaluation and Design (BEAD) Tool, Interim Report, Oct 2011]
97 SGArchitects
Figure 50: Flow chart for process 30 – Signal cycle length in sec for junction station intersections
Y=3
Max desired
signal cycle
length for 4
arm xing = E
A >E
Min desired
signal cycle
length for 4
arm xing = H
Is A/ (roundup
(A/E)) > H
Yes Yes
Yes
No 1.333*A/
(roundup
(A/E))
A/ (roundup
(A/E))
Y=2
Max desired
signal cycle
length for 4
arm xing = F
A >F
Min desired
signal cycle
length for 4
arm xing = I
Is A/ (roundup
(A/F)) > I
Yes Yes
Yes
No 1.333*A/
(roundup
(A/F))
A/ (roundup
(A/F))
Y=4
Max desired
signal cycle
length for 4
arm xing = D
A >D
Min desired
signal cycle
length for 4
arm xing = G
Is A/ (roundup
(A/D)) > G
Yes Yes
Yes
No 1.333*A/
(roundup
(A/D))
A/ (roundup
(A/D))
No
User Desired
Signal Cycle
Length in Sec = A
Is
A<B
Is A*
Roundup
(B/A)) > C
No. of arms at a
junction, 2 (mid
block), 3 or 4 = Y Yes
0.75*(A/round-
up(B/A))
(A/round-
up(B/A))
Max
desire
signal
cycle
length
in sec
= C Yes
No
No No
No
No
User Desired
Signal Cycle
Length in Sec = A
Proposed Signal
Cycle Length in Sec
for Junction Stn.
Intersection
End
No No
Start
Total no. of bus phases
at the Junction Stn.
Intersection = X
X < 2
Min. Desirable signal
cycle length in sec
for Junction stn. xing
with more than 2
phases = B
Process 62
Yes No Indicative cycle
length in sec, for
single green
phase
Process 61

[BRTS Evaluation and Design (BEAD) Tool, Interim Report, Oct 2011]
98 SGArchitects
Figure 51: Flow chart for process 31 – Signal cycle length in sec for Mid Block station intersections
Y=3
Max desired
signal cycle
length for 4
arm xing = E
A >E
Min desired
signal cycle
length for 4
arm xing = H
Is A/ (roundup
(A/E)) > H
Yes Yes
Yes
No 1.333*A/
(roundup
(A/E))
A/ (roundup
(A/E))
Y=2
Max desired
signal cycle
length for 4
arm xing = F
A >F
Min desired
signal cycle
length for 4
arm xing = I
Is A/ (roundup
(A/F)) > I
Yes Yes
Yes
No 1.333*A/
(roundup
(A/F))
A/ (roundup
(A/F))
Y=4
Max desired
signal cycle
length for 4
arm xing = D
A >D
Min desired
signal cycle
length for 4
arm xing = G
Is A/ (roundup
(A/D)) > G
Yes Yes
Yes
No 1.333*A/
(roundup
(A/D))
A/ (roundup
(A/D)) Yes
No
No No
No
No
User Desired
Signal Cycle
Length in Sec = A
Proposed Signal
Cycle Length in Sec
for Mid block Stn.
Intersection
End
No No
Start
Total no. of bus phases
at the Mid Block Stn.
intersection = X
X < 2
Min. Desirable signal
cycle length in sec
for mid block stn.
xing with more than
2 phases = B
Process 64
Yes No Indicative cycle
length for single
green phase
Process 63
No
User Desired
Signal Cycle
Length in Sec = A
Is
A<B
Is A*
Roundup
(B/A)) > C
No. of arms at a
junction, 2 (mid
block), 3 or 4 = Y Yes
0.75*(A/round-
up(B/A))
(A/round-
up(B/A))
Max
desire
signal
cycle
length
in sec
= C
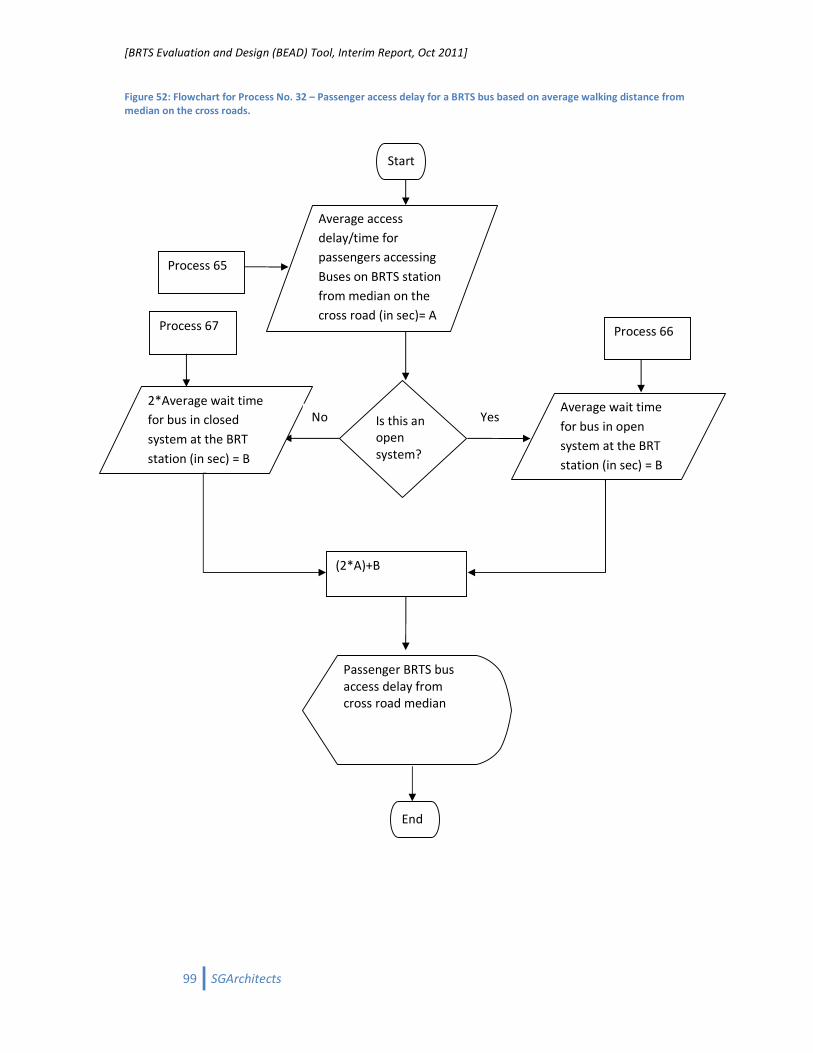
[BRTS Evaluation and Design (BEAD) Tool, Interim Report, Oct 2011]
99 SGArchitects
Figure 52: Flowchart for Process No. 32 – Passenger access delay for a BRTS bus based on average walking distance from
median on the cross roads.
Is this an
open
system?
Average wait time
for bus in open
system at the BRT
station (in sec) = B
Process 66
Passenger BRTS bus
access delay from
cross road median
End
Start
Process 65
Average access
delay/time for
passengers accessing
Buses on BRTS station
from median on the
cross road (in sec)= A
(2*A)+B
2*Average wait time
for bus in closed
system at the BRT
station (in sec) = B
Process 67
Yes No

[BRTS Evaluation and Design (BEAD) Tool, Interim Report, Oct 2011]
100 SGArchitects
Figure 53: Flow chart for Process no. 33 – Average walking distance in m. from origin/destination point to the BRTS or
feeder station location.
Average walking
distance in m from O-
D to the BRTS or
feeder station
location
End
Start
Average access
depth from the
corridor/cross
road = 250m + B
Average walking
distance along the
corridor based on
the access distance
to the station = B =
C/4
User input on
average gap
between stations in
, m. = C

[BRTS Evaluation and Design (BEAD) Tool, Interim Report, Oct 2011]
101 SGArchitects
Figure 54: Flowchart for process no. 34 – Average total access delay to bus outside the corridor in an open system
Passenger BRTS bus
access delay from
cross road median
End
Start
D=2*{A+(B/C)}
Average crossing
delay in sec, on
cross roads
(outside the
corridor) = A
Process 68
Average walking
distance to access
station location
from O-D = B
Average
pedestrian
walking
speed in m/s
= C
Process 33
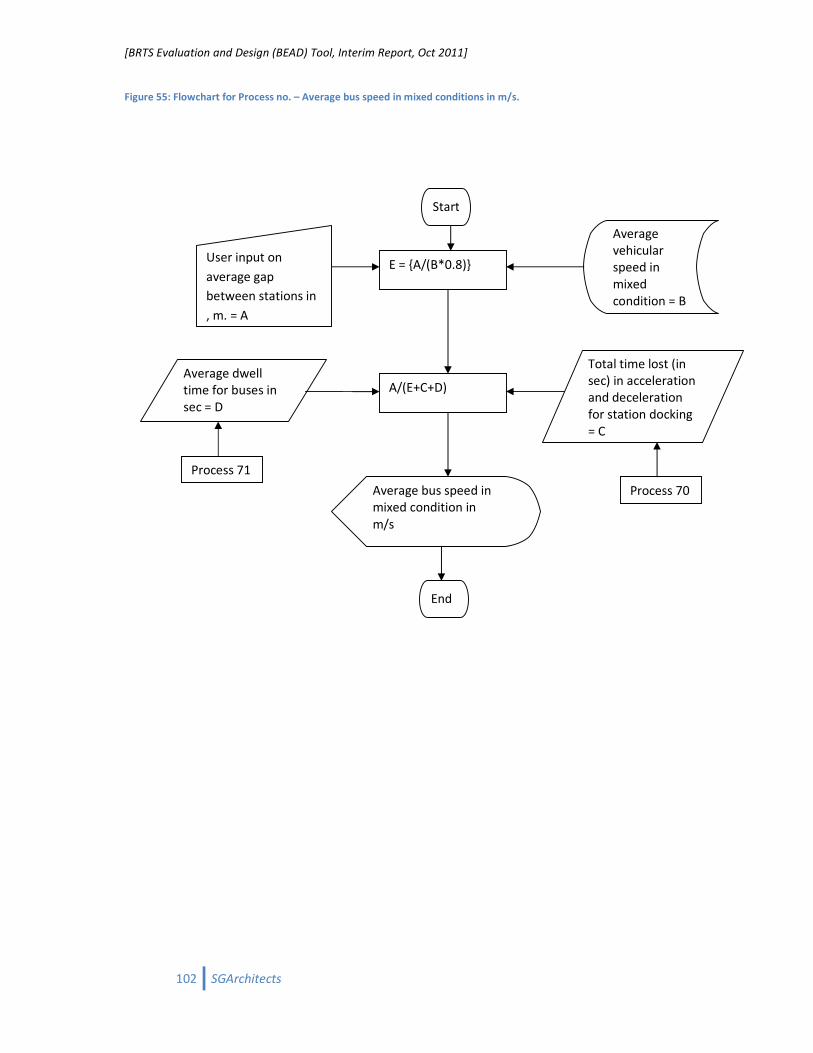
[BRTS Evaluation and Design (BEAD) Tool, Interim Report, Oct 2011]
102 SGArchitects
Figure 55: Flowchart for Process no. – Average bus speed in mixed conditions in m/s.
Average bus speed in
mixed condition in
m/s
End
Start
E = {A/(B*0.8)}
Total time lost (in
sec) in acceleration
and deceleration
for station docking
= C
Process 70
A/(E+C+D) Average dwell
time for buses in
sec = D
Process 71
User input on
average gap
between stations in
, m. = A
Average
vehicular
speed in
mixed
condition = B

[BRTS Evaluation and Design (BEAD) Tool, Interim Report, Oct 2011]
103 SGArchitects
Figure 56: Flowchart for Process no. 36 - Average total access delay to bus outside the corridor in closed system
2*(D+E+F)
Passenger BRTS bus
access delay from
cross road median in
closed system
End
Start
F = (A+C)/B
Process 33
Average walking
distance to access
station location
from O-D = A
Average
pedestrian
walking
speed in m/s
= B
Average crossing
delay in sec, on
cross roads
(outside the
corridor) = E
Process 68
Average distance
between stop line of
cross road meeting
the corridor and
feeder stop on cross
sroad = C

[BRTS Evaluation and Design (BEAD) Tool, Interim Report, Oct 2011]
104 SGArchitects
Figure 57: Flow chart for process 37 – Straight moving per bus per cycle per direction delay for buses at near side
(staggered stations) in secs.
Average
reaction time
in sec for bus
drivers = B Average dwell
time for buses in
sec = A
Process 71
Start
Total dwell time
including reaction delay
per bus = C = A+B
Process 70
Total time lost in sec;
in acceleration and
deceleration per bus
per station for near
side stations (in access
and egress to the
station) = D
Weighted average of
per bus per direction
signal delay in sec
(derived from delay
estimation tool) for
straight moving
buses= E
End
Straight moving per
bus per cycle per
direction delay for
buses at near side
stations in sec
Process 73
C+D+E

[BRTS Evaluation and Design (BEAD) Tool, Interim Report, Oct 2011]
105 SGArchitects
Figure 58: Flowchart for process 38 - Turning per bus per cycle per direction delay for buses at near side (staggered
stations) in secs.
End
Average
reaction time
in sec for bus
drivers = B
Average dwell
time for buses in
sec = A
Process 71
F = C+D+E
Straight moving per
bus per cycle per
direction delay for
buses at near side
stations in sec
Start
Total dwell time
including reaction delay
per bus = C = A+B
Process 70
Total time lost in sec;
in acceleration and
deceleration per bus
per station for near
side stations (in access
and egress to the
station) = D
Weighted average of
per bus per direction
signal delay in sec
(derived from delay
estimation tool) for
turning buses= E
Process 75

[BRTS Evaluation and Design (BEAD) Tool, Interim Report, Oct 2011]
106 SGArchitects
Figure 59: Flow chart for process 39 – Straight moving bus throughput per direction per signal cycle for near side stations
Time required for
stacked straight
buses to accelerate
and clear
intersection = B
A-B<0
C+D
No. of straight moving
buses throughput in
each signal cycle for
near side stations
End
Start
Process 76
Straight green
phase length at
station/junction
signal in sec = A
Process 77
No. of buses
throughput for
straight green
phase length
No. of straight buses
that can be stacked on
near side of junction
(from bus station to
junction) = D
Additional (to
stacked buses) no.
of straight buses
that can be cleared
in a green phase = D
Process 78 Process 79
Yes
No

[BRTS Evaluation and Design (BEAD) Tool, Interim Report, Oct 2011]
107 SGArchitects
Figure 60: Flowchart for process 40 - Turning bus throughput per direction per signal cycle for near side stations
A-B<0
C+D
No. of turning buses
throughput in each
signal cycle for near
side stations
End
Start
Process 80
Turning bus green
phase length at
station/junction
signal in sec = A
Process 81
No. of buses
throughput for
turning green
phase length
No. of turning buses
that can be stacked on
near side of junction
(from bus station to
junction) = D
Additional (to
stacked buses) no.
of turning buses
that can be cleared
in a green phase = D
Process 82 Process 83
Yes
No
Time required for
stacked turning
buses to accelerate
and clear
intersection = B

[BRTS Evaluation and Design (BEAD) Tool, Interim Report, Oct 2011]
108 SGArchitects
Figure 61: Flow chart for process 41 - Straight moving per bus per cycle per direction delay for buses at far side
(staggered stations) with overtaking lanes in secs.
Overall Average
boarding/ alighting
time for straight
buses in sec = A
Process 84
Start
C = A+B
Process 85
Weighted avg. of delay
in sec; in acceleration
and deceleration per
straight moving bus
per station for junction
approach in case of far
side stations (with
overtaking lane) = B
Weighted average of
per bus per direction
signal delay in sec
(derived from delay
estimation tool) for
straight moving
buses= E
End
Per straight bus per
cycle per direction
delay for buses at far
side stations with
overtaking lane, in sec
Process 87
F =C+D+E
Process 86
Time lost in additional
deceleration and
acceleration cycle for
straight buses to
access bus station after
junction on the far side
= D

[BRTS Evaluation and Design (BEAD) Tool, Interim Report, Oct 2011]
109 SGArchitects
Figure 62: Flow chart for process 42 –Per bus per cycle per direction delay for turning buses at far side (staggered
stations) with overtaking lanes in secs.
Overall Average
boarding/ alighting
time for turning
buses in sec = A
Process 88
Start
C = A+B
Process 89
Weighted average of
total time lost in sec; in
acceleration and
deceleration per
turning bus per station
for junction approach
in case of far side
stations = B
Weighted average of
per bus per direction
signal delay in sec
(derived from delay
estimation tool) for
turning buses= E
End
Per turning bus per
cycle per direction
delay for buses at far
side station with
overtaking lane, in sec
Process 91
C+D+E
Process 90
Time lost in additional
deceleration and
acceleration cycle for
turning buses to access
bus station after
junction on the far side
= D

[BRTS Evaluation and Design (BEAD) Tool, Interim Report, Oct 2011]
110 SGArchitects
Figure 63: Flow chart for process 43 – Per cycle per direction straight moving bus throughput for far side stations with or
without overtaking lanes
No. of straight buses
that can be processed
in the signal cycle, at
the far side station
(station length and
signal cycle limitation)
Min. Value
No. of straight moving
buses throughput in
each signal cycle for
far side stations
End
Process 92
Total effective number
of straight buses that
can be stacked in the
straight/common green
phase on the after side
of junction (station
length and junction gap
limitation)
Process 93
No. of buses that can be
throughput in straight signal
phase lengths (combined for
all arms at junction)
Process 94
Start

[BRTS Evaluation and Design (BEAD) Tool, Interim Report, Oct 2011]
111 SGArchitects
Figure 64: Flow chart for process 44 – Per cycle per direction turning bus throughput for far side stations with overtaking
lanes
No. of turning buses
that can be processed
in the signal cycle, at
the far side station
(station length and
signal cycle limitation)
Min. Value
No. of turning buses
throughput in each
signal cycle for far
side stations
End
Process 95
Total effective number
of turning buses that
can be stacked in the
straight/common green
phase on the after side
of junction (station
length and junction gap
limitation)
Process 96
No. of turning buses that can
be throughput in turn signal
phase lengths (combined for
all arms at junction)
Process 97
Start

[BRTS Evaluation and Design (BEAD) Tool, Interim Report, Oct 2011]
112 SGArchitects
Figure 65: Flow chart for process 45 - Straight moving per bus per cycle per direction delay for buses at far side
(staggered stations) without overtaking lanes, in secs.
Overall Average
boarding/ alighting
time for straight
buses in sec = A
Process 84
Start
C = A+B
Process 98
Weighted avg. of delay
in sec; in acceleration
and deceleration per
straight moving bus
per station for junction
approach in case of far
side stations (without
overtaking lane) = B
Weighted average of
per bus per direction
signal delay in sec
(derived from delay
estimation tool) for
straight moving
buses= E
End
Per straight bus per
cycle per direction
delay for buses at far
side stations without
overtaking lane, in sec
Process 87
C+D+E
Process 86
Time lost in additional
deceleration and
acceleration cycle for
straight buses to
access bus station after
junction on the far side
= D

[BRTS Evaluation and Design (BEAD) Tool, Interim Report, Oct 2011]
113 SGArchitects
Figure 66: Flow chart for process 46 –Per bus per cycle per direction delay for turning buses at far side (staggered
stations) without overtaking, lanes in secs.
Overall Average
boarding/ alighting
time for turning
buses in sec = A
Process 88
Start
C = A+B
Process 98
Weighted avg. of delay
in sec; in acceleration
and deceleration per
straight moving bus
per station for junction
approach in case of far
side stations (without
overtaking lane) = B
Weighted average of
per bus per direction
signal delay in sec
(derived from delay
estimation tool) for
turning buses= E
End
Per turning bus per
cycle per direction
delay for buses at far
side station with
overtaking lane, in sec
Process 91
C+D+E
Process 90
Time lost in additional
deceleration and
acceleration cycle for
turning buses to access
bus station after
junction on the far side
= D

[BRTS Evaluation and Design (BEAD) Tool, Interim Report, Oct 2011]
114 SGArchitects
Figure 67: Flow chart for process 47 – Percentage of trips with varying distance of O-D situated of the corridor on the
basis of average motorized trip length in the city
Average
Motorized trip
length in the city =
A
Sort by
Range
100%
trips with
O-D up to
500m
from
corridor
80% trips
with O-D
up to 500m
from
corridor,
20% trips
with O-D
frop 500m
up to
1000m
from
corridor
60% trips
with O-D up
to 500m,
30% trips
with O-D
from 500m
up to
1000m. 10%
trips with O-
D from
1000m up to
2000m from
corridor
50% trips
with O-D up
to 500m,
30% trips
with O-D
from 500m
up to
1000m, 20%
trips with O-
D from
1000m up to
2000m from
corridor
40% trips
with O-D up
to 500m,
30% trips
with O-D
from 500m
up to
1000m, 20%
trips with O-
D from
1000m up to
2000m, 10%
trips with O-
D from
2000m up to
3000m,
from
corridor
35% trips
with O-D up
to 500m,
30% trips
with O-D
from 500m
up to
1000m, 20%
trips with O-
D from
1000m up to
2000m, 15%
trips with O-
D from
2000m up to
3000m,
from
corridor
<2.5km
2.5km
to
3.5km 3.5km
to
4.5km
4.5km
to
5.5km
5.5km
to
6.5km
>6.5km
End
Start
% of trips under
varying O-D
distance from
corridor
categories

[BRTS Evaluation and Design (BEAD) Tool, Interim Report, Oct 2011]
115 SGArchitects
Figure 68: Flowchart for process 48 – Total bus throughput per hour per direction capacity of the corridor.
Start
Process 8
Total Buses
Throughput per
signal cycle per
direction from
intersection
(station)
Minimum Value
= A
Total Buses
Throughput per
signal cycle per
direction from
intersection (for
mid block station)
Process 9
Signal Cycle
Length in sec
at
intersection =
B
Process 10 C=(3600/B)*A
Process 56
Max. No. bus
throughput
possible per
hour per
direction = D
Is C<D
C = Corridor bus
throughput
capacity per
hour per
direction
D = Corridor bus
throughput
capacity per
hour per
direction
End
No
Yes

[BRTS Evaluation and Design (BEAD) Tool, Interim Report, Oct 2011]
116 SGArchitects
Figure 69: Flow chart for process 49 – Average per bus delay for straight moving buses at common or island stations with
overtaking lanes.
Average per bus
time lost for
straight moving
buses at junctions
and/or shelter for
near side stations
Process 37
Start
Average value
Process 41
Average per bus
time lost for straight
moving buses at
junctions and/or
shelter for far side
stations
End
Per straight bus per
cycle per direction
delay for buses at
common or island
station with
overtaking lane, in sec

[BRTS Evaluation and Design (BEAD) Tool, Interim Report, Oct 2011]
117 SGArchitects
Figure 70: Flow chart for process 50 – Average per bus delay for turning buses at common or island stations with
overtaking lanes.
Average per bus
time lost for
turning buses at
junctions and/or
shelter for near
side stations
Process 38
Start
Average value
Process 42
Average per bus
time lost for turning
buses at junctions
and/or shelter for far
side stations with
overtaking lanes
End
Per turning bus per
cycle per direction
delay for buses at
common or island
station with
overtaking lane, in sec

[BRTS Evaluation and Design (BEAD) Tool, Interim Report, Oct 2011]
118 SGArchitects
Figure 71: Flow chart for process 51 - Per cycle per direction straight moving bus throughput for common/island stations
with or without overtaking lanes
Average per
direction per signal
cycle throughput
of straight buses at
near side
stations(with or
without overtaking
lanes)
Process 39
Start
Minimum Value
Process 43
Average per
direction per signal
cycle throughput of
straight buses at far
side stations (with or
without overtaking
lanes)
End
Per cycle per
direction straight
moving bus
throughput for
common/island
stations with or
without overtaking
lanes

[BRTS Evaluation and Design (BEAD) Tool, Interim Report, Oct 2011]
119 SGArchitects
Figure 72: Flow chart for process no. 52 - Per cycle per direction turning bus throughput for common/island stations with
or without overtaking lanes
Average per
direction per signal
cycle throughput
of turning buses at
near side
stations(with or
without overtaking
lanes)
Process 40
Start
Minimum Value
Process 44
Average per
direction per signal
cycle throughput of
turning buses at far
side stations (with or
without overtaking
lanes)
End
Per cycle per direction
turning bus
throughput for
common/island
stations with or
without overtaking
lanes
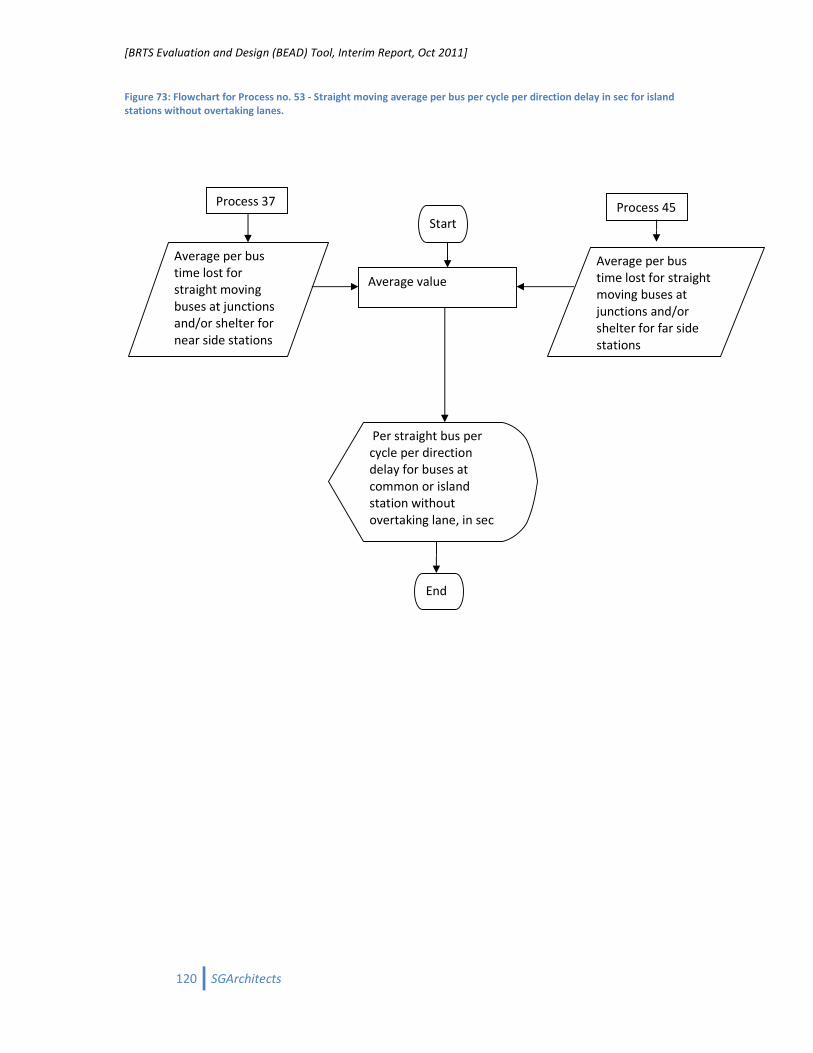
[BRTS Evaluation and Design (BEAD) Tool, Interim Report, Oct 2011]
120 SGArchitects
Figure 73: Flowchart for Process no. 53 - Straight moving average per bus per cycle per direction delay in sec for island
stations without overtaking lanes.
Average per bus
time lost for
straight moving
buses at junctions
and/or shelter for
near side stations
Process 37
Start
Average value
Process 45
Average per bus
time lost for straight
moving buses at
junctions and/or
shelter for far side
stations
End
Per straight bus per
cycle per direction
delay for buses at
common or island
station without
overtaking lane, in sec
[BRTS Evaluation and Design (BEAD) Tool, Interim Report, Oct 2011]
121 SGArchitects
Figure 74: Flowchart for process no. 54 - Average per bus per cycle per direction delay in sec for island stations without
overtaking lanes for turning buses.
Average per bus
time lost for
turning buses at
junctions and/or
shelter for near
side stations
Process 38
Start
Average value
Process 46
Average per bus
time lost for turning
buses at junctions
and/or shelter for far
side stations without
overtaking lanes
End
Per turning bus per
cycle per direction
delay for buses at
common or island
station without
overtaking lane, in sec
[BRTS Evaluation and Design (BEAD) Tool, Interim Report, Oct 2011]
122 SGArchitects
Figure 75: Flowchart for process 55 – Safe gap between buses on the corridor
Corridor
speed limit
in Km/hr. =
A
End
Start
Safe stopping
distance and gap
between buses at
speed limit in m
Average
Acceleratio
n rate in
m/sec2 = D
Corridor speed
limit in m/s = B
= A/3.6
E =
{B2*(C+D)}/(C*D)
Average
deceleratio
n rate in
m/s2 =C
E+F
Bus type
used in the
system
F = Bus
length in

[BRTS Evaluation and Design (BEAD) Tool, Interim Report, Oct 2011]
123 SGArchitects
Figure 76: Flow chart for process 56 – Maximum no. of buses (per hour per direction) that can cruise in the corridor
safely (maintaining safe gap between buses)
End
Start
Maximum no. of
buses that cruise in
the corridor safely
(per hour per
direction)
Process 99 (Max
buses that can
cruise in corridor for
far side stations)
Process 100 (Max.
Buses that can
cruise in corridor)
for far side stations)
Process 101 (max
buses that can cruise
in corridor for island
stations)
System has
near side
stations
System has
far side
stations
Yes
Yes
No
No

[BRTS Evaluation and Design (BEAD) Tool, Interim Report, Oct 2011]
124 SGArchitects
Figure 77: Flowchart for Process 57 – Maximum number of straight buses that can be throughput at an intersection
signal cycle between two mid block stations.
2
1
Sort by
Phase
length in
sec
Bus queue
throughput
for different
signal phase
lengths
End
Start
Max. straight buses
that can be
throughput in straight
green phase at
intersection between
mid block stations
Green phase
length in secs for
straight buses at
intersection signal
Process 102
No. of bus lanes
on near side
1 or 2
bus lanes
Open or closed
bus operations
Open or
closed
system Round of (A * B)
Ratio of turning
buses = C
No. of buses that
can be throughput
in straight green
phase length at
signal = A
B = 1-C
B = 1
B = 2
Open
Closed

[BRTS Evaluation and Design (BEAD) Tool, Interim Report, Oct 2011]
125 SGArchitects
Figure 78: Flowchart for process no. 58 - Maximum number of turning buses that can be throughput at an intersection
signal cycle between two mid block stations.
Sort by
Phase
length in
sec
Bus queue
throughput
for different
signal phase
lengths
End
Start
Total turning buses that
can be throughput in
dedicated turning green
phase at intersection
between mid block
stations
Green phase
length in secs for
turning buses at
intersection signal
Process 103
No. of buses that
can be throughput
in straight green
phase length at
signal = A

[BRTS Evaluation and Design (BEAD) Tool, Interim Report, Oct 2011]
126 SGArchitects
Figure 79: Flow chart for process no. 59 – Total red phase length for buses (excluding yellow) in seconds, for straight
buses at vehicular intersection between two mid block stations.
Start
Signal cycle length
at vehicular
intersection
between mid block
stations = A
Process 31
End
Green phase
length in secs for
Straight buses at
vehicular
intersection
between mid block
stations = B
Process 102
A-B
Total red phase length
(excluding yellow) in secs
for straight moving buses
at intersection (between
stations)

[BRTS Evaluation and Design (BEAD) Tool, Interim Report, Oct 2011]
127 SGArchitects
Figure 80: Flow chart for process 60 - Total red phase length for buses (excluding yellow) in seconds, for turning buses at
vehicular intersection between two mid block stations.
Start
Signal cycle length
at vehicular
intersection
between mid block
stations = A
Process 31
End
Green phase
length in secs for
turning buses at
vehicular
intersection
between mid block
stations = B
Process 103
A-B
Total red phase length
(excluding yellow) in secs
for turning buses at
intersection (between
stations)
[BRTS Evaluation and Design (BEAD) Tool, Interim Report, Oct 2011]
128 SGArchitects
Figure 81: Flow chart for process 61 – Total no. of phases at Station Crossing Signal/ intersection signal
Start
No. of vehicular
phases = A
Process 104
End
No. of Bus only
phases for main
corridor = B
Process 105
A+B+C
No. of Bus only
phases for main
corridor = B
Process 106 Total no. of phases at
station/ intersection
signal
[BRTS Evaluation and Design (BEAD) Tool, Interim Report, Oct 2011]
129 SGArchitects
Figure 82: Flow chart for process 62 - Minimum Desirable signal cycle length in sec for station/junction signal with more
than 2 phase signal cycle
Start
Minimum green
phase for
pedestrian
crossing = A
Process 69
End
Total no. of signal
phases = B
Process 61
C = A rounded
to nearest 10
seconds * B
Multiplying factor = D C*D
No. of phases
at signal <3 or
No. of arms at
crossing <3
Yes, D
= 1.5
No, D
= 1.3
Process 61
Start
Minimum green
phase for
pedestrian
crossing = A
Process 69
Total no. of signal
phases = B
Process 61
C = A rounded
to nearest 10
seconds * B
Multiplying factor = D C*D
Yes, D
= 1.5
Start
Minimum green
phase for
pedestrian
crossing = A
Process 69
Total no. of signal
phases = B
Process 61
C = A rounded
to nearest 10
seconds * B
Multiplying factor = D C*D
Minimum Desirable
signal cycle length in sec
for station /intersection
signal with more than 2
phase signal cycle

[BRTS Evaluation and Design (BEAD) Tool, Interim Report, Oct 2011]
130 SGArchitects
Figure 83: Flow chart for process 63 – Total no. of phases at Junction Signal between two mid block stations
Start
No. of vehicular
phases = A
Process 107
End
No. of Bus only
phases for main
corridor = B
Process 108
A+B+C
No. of Bus only
phases for main
corridor = B
Process 109 Total no. of phases at
Junction signals between
two mid block stations

[BRTS Evaluation and Design (BEAD) Tool, Interim Report, Oct 2011]
131 SGArchitects
Figure 84: Flow chart for process 64 - Minimum Desirable signal cycle length in sec for station/junction signal with more
than two phase signal cycle
End
No. of phases
at signal <3 or
No. of arms at
crossing <3
No, D
= 1.3
Process 61
Yes, D
= 1.5
Start
Minimum green
phase for
pedestrian
crossing = A
Process 69
Total no. of signal
phases = B
Process 61
C = A rounded
to nearest 10
seconds * B
Multiplying factor = D C*D
Minimum Desirable
signal cycle length in sec
for Intersections
between two mid block
stations with more than
2 phase
[BRTS Evaluation and Design (BEAD) Tool, Interim Report, Oct 2011]
132 SGArchitects
Figure 85: Flow chart for process 65 - Average one way access delay/time for passengers accessing Buses on BRTS station
from median on the cross road (in sec)
End
Start
Time lost at
validators for off
board fare
collection = A
Process 110
Average crossing delay of
main corridor to access
BRTS stations (s) = D Process 111
C=A+B
Average one way access
delay/time for passengers
accessing Buses on BRTS
station from median on the
cross road in sec (excluding
bus wait time)
Sort by station
access grade type
Station access type At grade
station
access
Time lost due to
delay between
platform and bus
door opening = B
Process 112
C+D+E
Average walking delay
from cross road median to
station including cross
road crossing delay (s) = E
Yes
No
Sort by
access to
grade
separation
Level diff.
Half
subway= I
Climb rate
– escalator
= J
Half Subway Full Subway
FOB
C+E+(2*I/J)
Climb rate
–Steps = J
Climb rate
–ramp = J
Level diff.
Full
subway= I
Level diff.
FOB = I
Access to grade
separation at
station type
Process 112
Average walking
delay from cross
road median to
station including
cross road
crossing delay (s)
= E
Escalator
Steps
Ramp
[BRTS Evaluation and Design (BEAD) Tool, Interim Report, Oct 2011]
133 SGArchitects
Figure 86: Flowchart for process 66 – Average wait time for buses (in sec) in open system
End
Start
Average wait
time for (specific
bus/route) in an
open system in
seconds
Peak capacity in
buses per hour per
direction
User input to
modify capacity as
per lower current
requirement or
demand = A
{(3600/A)/2}*B
Process 48
Assumed
average no. of
different route
groups at
stations = 5 = B

[BRTS Evaluation and Design (BEAD) Tool, Interim Report, Oct 2011]
134 SGArchitects
Figure 87: Flowchart for process 67 – Average wait time for buses (in sec) in closed system
End
Start
Average wait time
for (specific
bus/route) in a
closed system in
seconds
Peak capacity in buses
per hour per direction
User input to modify
capacity as per lower
current requirement
or demand = A
B = (3600/A)/2
Process 48
{(3600/A)
* E} < F
Process 113
No. of bus boarding
bays dedicated to
straight buses at a
station = C
No. of bus boarding
bays dedicated to
turning buses at a
station = D
Process 114
E = C+D
{(3600/A)/2}*
E
Bus stop type, mid
block, junction or
roundabout
Mid
block
bus stop
Junction
between
stations is
signal free
Station or
junction
station is
signal free
Value of F
F = 0
(3600/A)/2
F/2
Grade separation at
junction between mid
block stations
Grade separation
at station access/
junction station
No, F =
Signal
cycle
Yes
Yes
No
Yes, F = 0
No, F =
Signal
cycle
Yes
No
No
Yes

[BRTS Evaluation and Design (BEAD) Tool, Interim Report, Oct 2011]
135 SGArchitects
Figure 88: Flowchart for process 68 – Average crossing delay in sec, on cross roads (outside the corridor)
End
Start
Average crossing
delay in secs on
cross roads
Average delay in
secs in half
crossing of BRTS
corridor = A
A*B
Process 111
Mid block
stations
Station type on
the corridor
Cross road
traffic type
Main corridor
traffic type
Cross road
traffic = main
corridor traffic
Cross road
traffic > main
corridor
traffic
Average delay in
secs in half
crossing of BRTS
corridor = A
A*B
Process 111
Cross road
traffic type
Main corridor
traffic type
Cross road
traffic = main
corridor traffic
Cross road
traffic > main
corridor
traffic
Yes, Junction
between mid
block stations
No,
Intersection
at bus
stations Yes, B = 1 Yes, B = 1
Yes, B = 1.33 Yes, B = 1.33
No, B=0.33 No, B=0.33

[BRTS Evaluation and Design (BEAD) Tool, Interim Report, Oct 2011]
136 SGArchitects
Figure 89: Flowchart for process 69 – Minimum green phase length for pedestrian crossing requirements in seconds.
End
Start
Minimum green
phase length for
pedestrian
crossing
requirement in
seconds
Maximum one way
crossing distance
to access station
on main corridor in
m = A
Process 72
Pedestrian
walking speed
in m/s = B
(A/B)+2
[BRTS Evaluation and Design (BEAD) Tool, Interim Report, Oct 2011]
137 SGArchitects
Figure 90: Flowchart for process 70 – Total time lost (in seconds) in acceleration and deceleration of bus to and from
peak speed
End
Start
Total time lost (in
seconds) in
acceleration and
deceleration of
bus to and from
peak speed
Time lost in
seconds during
acceleration = A
Process 115
A + B
Time lost in
seconds during
deceleration = B
Process 116

[BRTS Evaluation and Design (BEAD) Tool, Interim Report, Oct 2011]
138 SGArchitects
Figure 91: Flowchart for process 71 – Average dwell time for buses in seconds
End
Start
Average dwell time for
buses in seconds
No. of steps inside
the bus 14+(A*2)

[BRTS Evaluation and Design (BEAD) Tool, Interim Report, Oct 2011]
139 SGArchitects
Figure 92: Flowchart for process 72 – Maximum crossing or access distance (in m) for passengers, in order to access the
bus stop
End
Start
Maximum one way main
corridor crossing distance in m
Individual design cross
section element widths and
their arrangement
Max value between A and B
Station is
left or right
side of bus
lane
Station type &
location relative
to bus lane
Left side approach distance - sum of cycle
track, segregator, car lane, segregator, and bus
lane widths in m. on design cross section = B
Process 117
Right side approach distance - sum of cycle
track, segregator, car lane, segregator, and bus
lane widths in m. on design cross section = A
Individual design cross
section element widths
and their arrangement
Process 117
Parallel or
single
stations
Individual design cross
section element widths and
their arrangement
Max value between A and B
Left side approach distance - sum of cycle
track, segregator, car lane, bus stop and bus
lane widths in m. on design cross section = B
Process 117
Right side approach distance - sum of cycle
track, segregator, car lane, segregator, bus
lane, bus lane and bus stop widths in m. on
design cross section = A
Individual design cross
section element widths
and their arrangement
Process 117
Max value between A and B
Right side approach distance -
sum of cycle track, segregator, car
lane, segregator, bus lane, bus
lane and bus stop widths in m. on
design cross section = A
Individual design
cross section
element widths and
their arrangement
Process 117
Left side approach distance -
sum of cycle track, segregator,
car lane and bus stop widths in
m. on design cross section = B
Process 117
Individual design
cross section
element widths and
their arrangement
Right
Left
Parallel Single

[BRTS Evaluation and Design (BEAD) Tool, Interim Report, Oct 2011]
140 SGArchitects
Figure 93: Flow chart for process 73 – Weighted average of straight moving bus delay at bus stop or junction bus stop
signal.
End
Start
Weighted average of
straight moving bus
delay at station or
junction station signal
Use of bus
priority
signal
Bus priority
signal option
Weighted average
of straight bus
delay at bus priority
signal, in sec
Process 118
Weighted average
of straight bus
delay at bus
signal without bus
priority, in sec
Process 119
Yes
No

[BRTS Evaluation and Design (BEAD) Tool, Interim Report, Oct 2011]
141 SGArchitects
Figure 94: Flow chart for process 75 – Weighted average of turning bus delay at bus stop or junction bus stop signal.
End
Start
Weighted average of
turning bus delay at
station or junction
station signal
Use of bus
priority
signal
Bus priority
signal option
Weighted average
of turning bus
delay at bus
priority signal, in
sec
Process 118
Weighted average
of turning bus
delay at bus
signal without bus
priority, in sec
Process 119
Yes
No

[BRTS Evaluation and Design (BEAD) Tool, Interim Report, Oct 2011]
142 SGArchitects
Annexure 6: Methodology for Deriving Weightage for Different
Performance Indicators Used for Determining Overall BRT System
LOS by the Tool
Categorization of Performance Indicators in BEAD Tool
A total of 10 different performance indicators have been selected to contribute to the LOS value of
the BRTS system being evaluated by the tool. These are:
11. Attractiveness for Public Transport Users – This indicator uses the ratio of passenger speed
in the proposed BRTS system and that in the existing bus based or IPT based public
transport. A higher ratio indicates better performance.
12. Passenger Speed – This indicator uses the absolute value of passenger speed (ratio of total
O-D distance by total time spent by the passenger in the journey). A higher passenger speed
indicates better performance
13. Safety – Empirical evidence shows that 1% increase in speed of motorized vehicles results in
4% increase in chances of a fatal accident. This is why the peak cruising speed limit of transit
vehicle plays an important role in ensuring safety of pedestrians and other road users. Thus
a lower peak speed limit for buses using BRTS is considered a better, as an indicator of
safety.
14. Walking Distance – Longer walking or access/egress distances increase inconvenience which
results in a higher perceived time (than actual time), reducing the attractiveness of public
transport. Thus reduced walk distances are considered better in the overall performance of
the BRT system being evaluated.
15. Attractiveness for Private Two Wheelers – Buses and typically BRTS systems present travel
costs similar to the operational cost of motorized two wheelers. Thus a reduced passenger
time in the BRTS than motorized modes is likely to attract mode shift from motorized two
wheelers. Thus the ratio of passenger speed in buses to that of motorized two wheelers is
considered as an indicator of the performance of the BRT system. A higher ratio indicated
better performance.
16. Capacity – BRTS systems improve operational efficiency and attractiveness of bus transport
by allowing a higher capacity than buses moving in mixed condition. Thus higher capacity is
an indicator of better performance of BRT system
17. Total Passenger Delay – Passenger delay in the system directly effects inconvenience
experienced by the user. Hence higher delays leads to lower attractiveness of public
transport.
18. Total Bus Delay (Station + junction time) – Delay of buses in the system increases both
actual and perceived (higher than actual) passenger travel time thereby reducing the
attractiveness of the system. Thus lower average delays of buses are an indicator of better
performance of the system.

[BRTS Evaluation and Design (BEAD) Tool, Interim Report, Oct 2011]
143 SGArchitects
19. Operational Speed – Higher average operational speeds reduce perceived passenger travel
time though its effect on the actual travel time may be limited. Thus higher operational
speeds are indicators of better performance of a BRTS system.
20. Ratio of in-vehicle to access time – Because walking speeds are less longer and effort
involved is considerably higher than the speed of a feeder service in mixed condition which
is considerably lower than the speeds of transit in the BRTS corridor; it is considered that
access time should be comparatively shorter than in vehicle time. Therefore a higher than 1
ration of in-vehicle time to access time is an indicator of better performance by the system.
The above indicators can be broadly divided in to three categories, that is societal indicators, user
indicators and operator indicators. Societal indicators are those where the better performance
results in the benefit to the society on the whole. User and operator indicators are those which
benefit passenger and operators respectively. The above 10 indicators have accordingly been
divided in to the three categories below.
1. Societal Indicators
a. Safety – As road users outside the vehicle stand to gain from reduced risk of
accident
b. Attractiveness for Private two wheelers – As population on the whole will benefit
from reduced, air and noise pollution, reduced sprawl etc.
2. User Indicators
a. Attractiveness for Public Transport Users – As existing public transport users benefit
b. Passenger Speed – As user travel time reduces
c. Walking Distance – As user inconvenience reduces
d. Total Passenger Delay – Reduced delay reduces user perceived journey time
e. Ratio of in vehicle to access time – As a higher ratio increases attractiveness for use
by passengers, due to reduced inconvenience and journey time.
3. Operator Indicators
a. Capacity – Higher capacity will result in reduced fleet size and higher operational
efficiency
b. Total Bus Delay – Reduced delay will reduce fuel consumption, improve driving cycle
and operational efficiency
c. Operational Speed – Higher operational speed will reduce fleet requirement, and
result in higher operational efficiency

[BRTS Evaluation and Design (BEAD) Tool, Interim Report, Oct 2011]
144 SGArchitects
Assigning Weights to Indicators
Weights have been assigned using the Analytical Hierarchy Process (AHP) to by first assigning
relative weights on a scale of 1 to 9 to each category and then using the process to assign the
weights to each indicator within the category. These have been then assimilated using AHP to arrive
at the overall weight for each indicator. The relative scales used are as follows:
1 – Indicates equal weightage
3 – Indicates moderately preferred
5 – Indicates strongly preferred
7 – Indicates Very Strongly Preferred
9 – Indicates Extremely Strongly Preferred
Assigning Weights to Each Category
In assigning weights to each category it is understood that the highest weights should be given to
societal indicators, followed by user indicators and lastly to operator indicators. This is because the
scale and type of benefit follows this trend from the overall population to the bus user set to a few
individuals/companies which gain commercial advantage.
The categories are compared as the following sets and the comparative results presented in a matrix
for each set:
• Societal Indicator – User Indicator
• User Indicator - Operator Indicator
• Societal Indicator – Operator Indicator
Societal Indicators to User Indicators Comparison
Here Societal indicator is moderately preferred to User indicator as when compared in the city the
size of bus user population is substantial ratio of the city population.
User Indicators to Operator Indicator Comparison
Here user indicator is strongly preferred to operator indicator as patronage of a transit system by
the user also has a strong effect on the operational efficiency of the system. Thus patronage of a
public transport system would improve fare box collection and reduce dependence on subsidies.
Societal Indicators to Operator Indicators Comparison
Here Societal indicator is very strongly preferred to operator indicator as when compared in the city
the advantage to the overall population should be considered much higher than the commercial
advantage to a few. It is also important that the advantage toe population also has a relationship to
the performance of the operators, and there dependence on external subsidies.
Using these relative score the weights of each category can be derived using AHP, as following:

[BRTS Evaluation and Design (BEAD) Tool, Interim Report, Oct 2011]
145 SGArchitects
Societal User Operator
Societal 1 2 5
[Categories] User 0.5 1 3
Operator 0.2 0.333333 1
Sum 1.7 3.333333 9
Societal 0.588235 0.6 0.555556 0.581264
[N] User 0.294118 0.3 0.333333 0.30915
Operator 0.117647 0.1 0.111111 0.109586
Assigning Weights to Indicators within Each Category
Societal Indicators
When comparing safety to ‘attractiveness to private motor vehicle users’ safety should get higher
priority as it results in direct impact on fatalities. The impact of shift from private transport is
considered moderately to low to equal weightage as the impact on public health in that case is not
measurable directly and also because the shift is considered from lesser polluting two wheelers and
not private cars (although the overall numbers of two wheeled motorized vehicles is large). Hence
the relative weightage of the two indicators under societal indicators category can be derived as
following:
Safety Shift from Pvt.
2 Wheelers
[Societal] Safety 1 2
Shift from Pvt.
2 Wheelers
0.50 1
Sum 1.5 3
[N] Safety 0.666667 0.666666667 0.666667
Shift from Pvt.
2 Wheelers
0.333333 0.333333333 0.333333
User Indicators
The user indicators have been compared to each other as following:
Attractiveness to Public Transport User to passenger Speed – Though these two indicators are
dependent on the passenger speed the attractiveness to public transport user is dependent on
relative increase in passenger speed on BRTS than the regular transport mode. Thus attractiveness
to public transport user is strongly preferred to passenger speed
Attractiveness to public transport users to walking distances – Walking distances involve physical
effort and thus lead to very high perceived time as compared to actual time saving that may be
achieved by BRTS over regular public transport. Thus walking distances are moderately preferred
over attractiveness to public transport users.

[BRTS Evaluation and Design (BEAD) Tool, Interim Report, Oct 2011]
146 SGArchitects
Attractiveness for Public Transport Users to total passenger delay – Attractiveness to regular public
transport users depend on passenger speed which is dependent on walking distances involved.
Whereas passenger delay is static delay and its impact on attractiveness of public transport is
considered relatively less. Thus attractiveness to public transport is moderate to equally preferred to
passenger delay
Attractiveness for public transport users to ratio of access to in-vehicle time – Attractiveness to
public transport forms a part of a wider goal and intent for developing BRTS. Ratio of access to in
vehicle time also contributes to this attractiveness. Thus attractiveness to public transport is strongly
preferred over ratio of access to in-vehicle time
Passenger Speed to Walking Distances – Walking distances form a major contributor in passenger
speed, and it is not the other way round. Thus walking distances are strongly preferred to the
passenger speed.
Passenger Speed to Total Passenger Delay – Passenger delay is a component or sub set of passenger
speed. Thus passenger speed is moderately preferred to passenger delay
Passenger Speed to ratio of access to in-vehicle time – Overall passenger speed and the ratio of
access to in-vehicle time contribute to the perceived time for the passenger. However Passenger
speed also is an indicator of better actual time. Hence passenger speed is moderate to equally
preferred, to ratio of access to in-vehicle time.
Walking Distance to Total Passenger Delay – Walking distances involve physical effort and hence
are much more critical to the attractiveness of transport than static delays, which may even involve
seated passengers. Also in terms of perceived time, physical effort involved in walking will lead to
much longer perceived time than static waiting at the stations. Thus Walking distances are strongly
preferred to Passenger delays
Walking distance to Ratio of Access to in-vehicle time for passengers – Both these factors are
indicators of perceived time. However because walking distances involve physical effort, it is strongly
to moderately preferred to ratio of access to in-vehicle time.
Passenger Delay to Ratio of access to in-vehicle time – Both passenger delay and ratio of access to
in vehicle time generate perceived time penalty. However the ratio of access to in-vehicle time
relates to walking distance or physical effort while passenger delay contributes to actual journey
time delay. Thus both these indicators are equally preferred.
Using the scores from the above comparison, weights of individual indicators in this category are
determined as following:
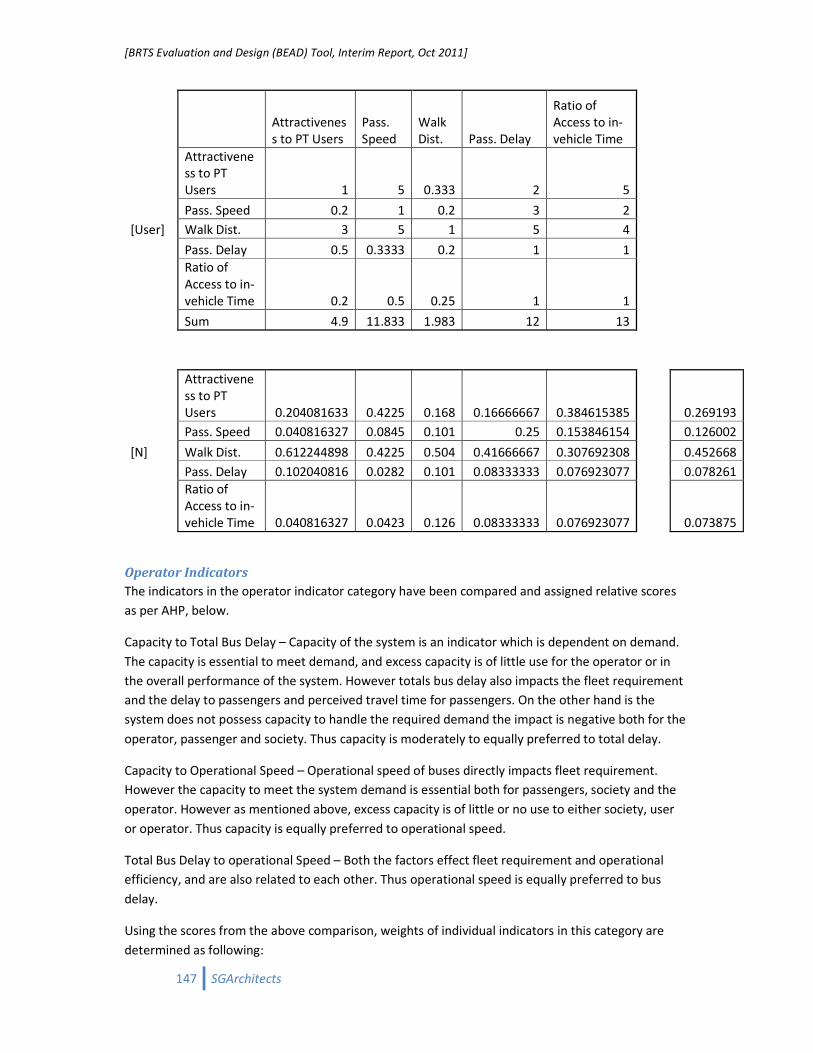
[BRTS Evaluation and Design (BEAD) Tool, Interim Report, Oct 2011]
147 SGArchitects
Attractivenes
s to PT Users
Pass.
Speed
Walk
Dist. Pass. Delay
Ratio of
Access to in-
vehicle Time
Attractivene
ss to PT
Users 1 5 0.333 2 5
Pass. Speed 0.2 1 0.2 3 2
[User] Walk Dist. 3 5 1 5 4
Pass. Delay 0.5 0.3333 0.2 1 1
Ratio of
Access to in-
vehicle Time 0.2 0.5 0.25 1 1
Sum 4.9 11.833 1.983 12 13
Attractivene
ss to PT
Users 0.204081633 0.4225 0.168 0.16666667 0.384615385
0.269193
Pass. Speed 0.040816327 0.0845 0.101 0.25 0.153846154
0.126002
[N] Walk Dist. 0.612244898 0.4225 0.504 0.41666667 0.307692308
0.452668
Pass. Delay 0.102040816 0.0282 0.101 0.08333333 0.076923077
0.078261
Ratio of
Access to in-
vehicle Time 0.040816327 0.0423 0.126 0.08333333 0.076923077
0.073875
Operator Indicators
The indicators in the operator indicator category have been compared and assigned relative scores
as per AHP, below.
Capacity to Total Bus Delay – Capacity of the system is an indicator which is dependent on demand.
The capacity is essential to meet demand, and excess capacity is of little use for the operator or in
the overall performance of the system. However totals bus delay also impacts the fleet requirement
and the delay to passengers and perceived travel time for passengers. On the other hand is the
system does not possess capacity to handle the required demand the impact is negative both for the
operator, passenger and society. Thus capacity is moderately to equally preferred to total delay.
Capacity to Operational Speed – Operational speed of buses directly impacts fleet requirement.
However the capacity to meet the system demand is essential both for passengers, society and the
operator. However as mentioned above, excess capacity is of little or no use to either society, user
or operator. Thus capacity is equally preferred to operational speed.
Total Bus Delay to operational Speed – Both the factors effect fleet requirement and operational
efficiency, and are also related to each other. Thus operational speed is equally preferred to bus
delay.
Using the scores from the above comparison, weights of individual indicators in this category are
determined as following:

[BRTS Evaluation and Design (BEAD) Tool, Interim Report, Oct 2011]
148 SGArchitects
Capacity Operational
Speed
Bus
Delay
Capacity 1 1 2
[Operator] Operational
Speed
1 1 1
Bus Delay 0.5 1 1
Sum 2.5 3 4
Capacity 0.4 0.333333333 0.5 0.4111111
[N] Operational
Speed
0.4 0.333333333 0.25 0.3277778
Bus Delay 0.2 0.333333333 0.25 0.2611111
Determination of Overall Weightage of all Indicators
The weights of each indicator in each category is weighted by the weight of the category to
determine the overall weights of indicators to be used in the BEAD Tool LOS estimator tool. These
weights are listed in the table below.
Safety 0.38750908
Shift from Pvt. 2 Wheelers 0.19375454
Attractiveness to PT Users 0.08322117
Pass. Speed 0.03895355
Walk Dist. 0.13994251
Pass. Delay 0.02419451
Ratio of Access to in-
vehicle Time
0.02283858
Capacity 0.04505205
Operational Speed 0.03591987
Bus Delay 0.02861414
Total 1

[BRTS Evaluation and Design (BEAD) Tool, Interim Report, Oct 2011]
149 SGArchitects
Annexure 7: Comparative graphs using BEAD Tool Generated Results
10
12
14
16
18
20
22
24
26
400 450 500 550 600 650 700 750 800 850 900 950 1000
Op
era
tio
n S
pe
ed
(K
m/h
r)
Average Distance between Stations (m)
Average Distance between Stations Vs. Operation Speed
Junction with overtaking staggered in open system
Junction With Overtaking Staggered in Close system
Junction With Overtaking Island in Open system
Junction With Overtaking Island in Close system
Junction Without Overtaking Staggered in Open system
Junction Without Overtaking Staggered in Closed system
Junction Without Overtaking Island in Open system
Junction Without Overtaking Island in Closed system
Mid-Block With Overtaking Staggered in Open system
Mid-Block With Overtaking Staggered in Closed system
Mid-Block With Overtaking Island in Open system
Mid-Block With Overtaking Island in Closed system
Mid-Block Without Overtaking Staggered in Open system
Mid-Block Without Overtaking Staggered in Closed system
Mid-Block Without Overtaking Island in Open system
Mid-Block Without Overtaking Island in Closed system
16
17
18
19
20
21
22
2500 5000 7500 10000 12500 15000 17500 20000 22500 25000
Op
ara
tio
n S
pe
ed
(K
M/h
r)
Capacity in PPHPD (no.)
Capacity in PPHPD Vs. Operation Speed
Junction With Overtaking Staggered in Open system
Junction With Overtaking Staggered in Closed system
Junction With Overtaking Island in Open system
Junction With Overtaking Island in Closed system
Junction Without Overtaking Staggered in Open system
Junction Without Overtaking Staggered in Closed system
Junction Without Overtaking Island in Open system
Junction Without Overtaking Island in Closed system
Mid-block With Overtaking Staggered in Open system
Mid-block With Overtaking Staggered in Closed system
Mid-block With Overtaking Island in Open system
Mid-block With Overtaking Island in Closed system
Mid-block Without Overtaking Staggered in Open system
Mid-block Without Overtaking Staggered in Closed system
Mid-block Without Overtaking Island in Open system
Mid-block Without Overtaking Island in Closed system

[BRTS Evaluation and Design (BEAD) Tool, Interim Report, Oct 2011]
150 SGArchitects
14
15
16
17
18
19
20
21
0 13 26 39 52 65 78
Op
ara
tio
n S
pe
ed
(K
M/h
r)
Distance of First Stop from Stop Line (m)
Distance of First stop from Stop line Vs. Operation Speed
Junction With Overtaking Staggerd Open system
Junction With Overtaking Staggerd Closed system
Junction With Overtaking Island Open system
Junction With Overtaking Island Closed system
Junction Without Overtaking Staggerd Open system
Junction Without Overtaking Staggerd Closed system
Junction Without Overtaking Island Open system
Junction Without Overtaking Island Closed system
Mid-block With Overtaking Staggerd Open system
Mid-block With Overtaking Staggerd Closed system
Mid-block With Overtaking Island Open system
Mid-block With Overtaking Island Closed system
Mid-block Without Overtaking Staggerd Open system
Mid-block Without Overtaking Staggerd Closed system
Mid-block Without Overtaking Island Open system
Mid-block Without Overtaking Island Closed system
8
10
12
14
16
18
20
22
120 150 180 210 240 270 300
Op
era
tio
n S
pe
ee
d (
Km
/hr)
Signal Cycle Length (sec)
Signal cycle legth Vs. Operation speed
Junction With Overtaking Staggerd Open system
Junction With Overtaking Staggerd Closed system
Junction With Overtaking Island Open system
Junction With Overtaking Island Closed system
Junction Without Overtaking Staggerd Open system
Junction Without Overtaking Staggerd Closed system
Junction Without Overtaking Island Open system
Junction Without Overtaking Island Closed system
Mid-block With Overtaking Staggerd Open system
Mid-block With Overtaking Staggerd Closed system
Mid-block With Overtaking Island Open system
Mid-block With Overtaking Island Closed system
Mid-block Without Overtaking Staggerd Open system
Mid-block Without Overtaking Staggerd Closed system
Mid-block Without Overtaking Island Open system
Mid-block Without Overtaking Island Closed system

[BRTS Evaluation and Design (BEAD) Tool, Interim Report, Oct 2011]
151 SGArchitects
40
42
44
46
48
50
52
54
400 450 500 550 600 650 700 750 800 850 900 950 1000
Tra
ve
l Tim
e (
Min
.)
Average Distance between Stations (m)
Average Distance between Stations Vs. Travel Time
Junction with overtaking staggered in open system
Junction With Overtaking Staggered in Close system
Junction With Overtaking Island in Open system
Junction With Overtaking Island in Close system
Junction Without Overtaking Staggered in Open system
Junction Without Overtaking Staggered in Closed system
Junction Without Overtaking Island in Open system
Junction Without Overtaking Island in Closed system
Mid-Block With Overtaking Staggered in Open system
Mid-Block With Overtaking Staggered in Closed system
Mid-Block With Overtaking Island in Open system
Mid-Block With Overtaking Island in Closed system
Mid-Block Without Overtaking Staggered in Open system
Mid-Block Without Overtaking Staggered in Closed system
Mid-Block Without Overtaking Island in Open system
Mid-Block Without Overtaking Island in Closed system
41
42
43
44
45
46
47
48
49
2500 5000 7500 10000 12500 15000 17500 20000 22500 25000
Tra
ve
l Tim
e (
min
.)
Capacity in PPHPD (no.)
Capacity in PPHPD Vs. Travel Time
Junction With Overtaking Staggered in Open system
Junction With Overtaking Staggered in Closed system
Junction With Overtaking Island in Open system
Junction With Overtaking Island in Closed system
Junction Without Overtaking Staggered in Open system
Junction Without Overtaking Staggered in Closed system
Junction Without Overtaking Island in Open system
Junction Without Overtaking Island in Closed system
Mid-block With Overtaking Staggered in Open system
Mid-block With Overtaking Staggered in Closed system
Mid-block With Overtaking Island in Open system
Mid-block With Overtaking Island in Closed system
Mid-block Without Overtaking Staggered in Open system
Mid-block Without Overtaking Staggered in Closed system
Mid-block Without Overtaking Island in Open system
Mid-block Without Overtaking Island in Closed system

[BRTS Evaluation and Design (BEAD) Tool, Interim Report, Oct 2011]
152 SGArchitects
42
43
44
45
46
47
48
49
50
51
0 13 26 39 52 65 78
Tra
ve
l Tim
e (
min
.)
Distance of First Stop from Stop Line (m)
Distance of First stop from Stop line Vs. Travel Zone
Junction With Overtaking Staggerd Open system
Junction With Overtaking Staggerd Closed system
Junction With Overtaking Island Open system
Junction With Overtaking Island Closed system
Junction Without Overtaking Staggerd Open system
Junction Without Overtaking Staggerd Closed system
Junction Without Overtaking Island Open system
Junction Without Overtaking Island Closed system
Mid-block With Overtaking Staggerd Open system
Mid-block With Overtaking Staggerd Closed system
Mid-block With Overtaking Island Open system
Mid-block With Overtaking Island Closed system
Mid-block Without Overtaking Staggerd Open system
Mid-block Without Overtaking Staggerd Closed system
Mid-block Without Overtaking Island Open system
Mid-block Without Overtaking Island Closed system
42
44
46
48
50
52
54
56
58
60
120 150 180 210 240 270 300
Tra
ve
l Tim
e (
Min
.)
Signal Cycle Length (sec)
Signal cycle legth Vs. Travel Time
Junction With Overtaking Staggerd Open system
Junction With Overtaking Staggerd Closed system
Junction With Overtaking Island Open system
Junction With Overtaking Island Closed system
Junction Without Overtaking Staggerd Open system
Junction Without Overtaking Staggerd Closed system
Junction Without Overtaking Island Open system
Junction Without Overtaking Island Closed system
Mid-block With Overtaking Staggerd Open system
Mid-block With Overtaking Staggerd Closed system
Mid-block With Overtaking Island Open system
Mid-block With Overtaking Island Closed system
Mid-block Without Overtaking Staggerd Open system
Mid-block Without Overtaking Staggerd Closed system
Mid-block Without Overtaking Island Open system
Mid-block Without Overtaking Island Closed system
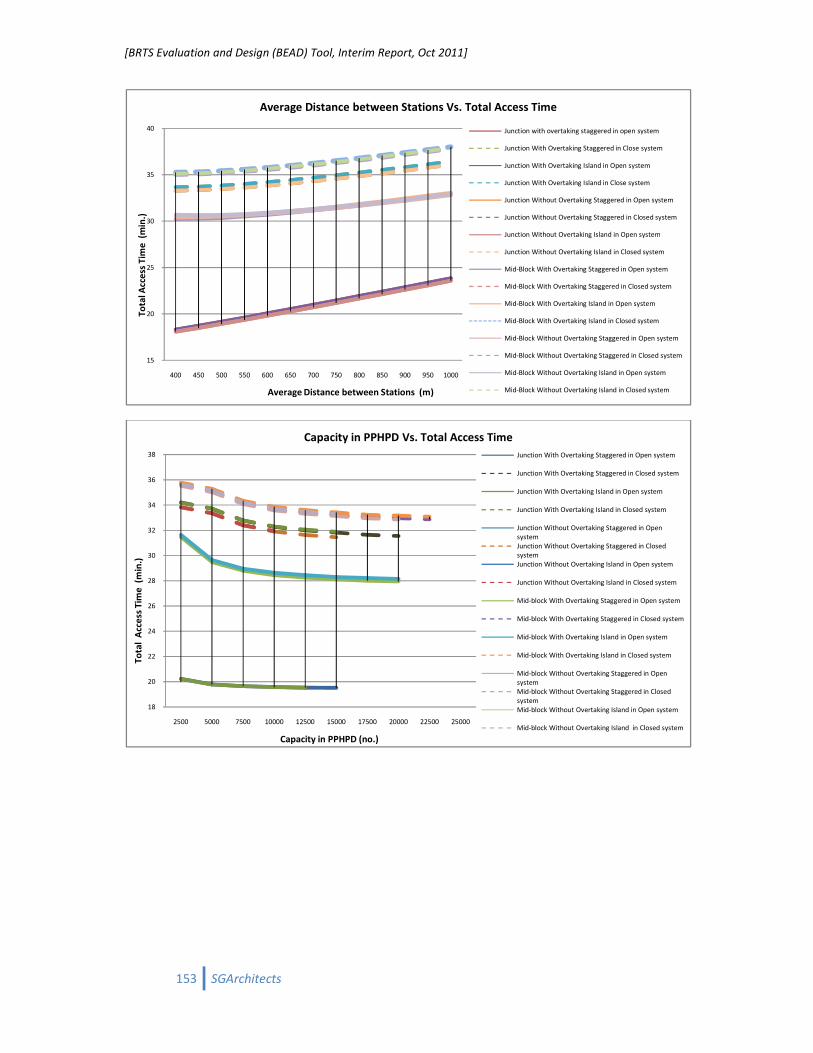
[BRTS Evaluation and Design (BEAD) Tool, Interim Report, Oct 2011]
153 SGArchitects
15
20
25
30
35
40
400 450 500 550 600 650 700 750 800 850 900 950 1000
To
tal A
cce
ss T
ime
(m
in.)
Average Distance between Stations (m)
Average Distance between Stations Vs. Total Access Time
Junction with overtaking staggered in open system
Junction With Overtaking Staggered in Close system
Junction With Overtaking Island in Open system
Junction With Overtaking Island in Close system
Junction Without Overtaking Staggered in Open system
Junction Without Overtaking Staggered in Closed system
Junction Without Overtaking Island in Open system
Junction Without Overtaking Island in Closed system
Mid-Block With Overtaking Staggered in Open system
Mid-Block With Overtaking Staggered in Closed system
Mid-Block With Overtaking Island in Open system
Mid-Block With Overtaking Island in Closed system
Mid-Block Without Overtaking Staggered in Open system
Mid-Block Without Overtaking Staggered in Closed system
Mid-Block Without Overtaking Island in Open system
Mid-Block Without Overtaking Island in Closed system
18
20
22
24
26
28
30
32
34
36
38
2500 5000 7500 10000 12500 15000 17500 20000 22500 25000
To
tal
Acc
ess
Tim
e (
min
.)
Capacity in PPHPD (no.)
Capacity in PPHPD Vs. Total Access Time
Junction With Overtaking Staggered in Open system
Junction With Overtaking Staggered in Closed system
Junction With Overtaking Island in Open system
Junction With Overtaking Island in Closed system
Junction Without Overtaking Staggered in Open
system
Junction Without Overtaking Staggered in Closed
system
Junction Without Overtaking Island in Open system
Junction Without Overtaking Island in Closed system
Mid-block With Overtaking Staggered in Open system
Mid-block With Overtaking Staggered in Closed system
Mid-block With Overtaking Island in Open system
Mid-block With Overtaking Island in Closed system
Mid-block Without Overtaking Staggered in Open
system
Mid-block Without Overtaking Staggered in Closed
system
Mid-block Without Overtaking Island in Open system
Mid-block Without Overtaking Island in Closed system
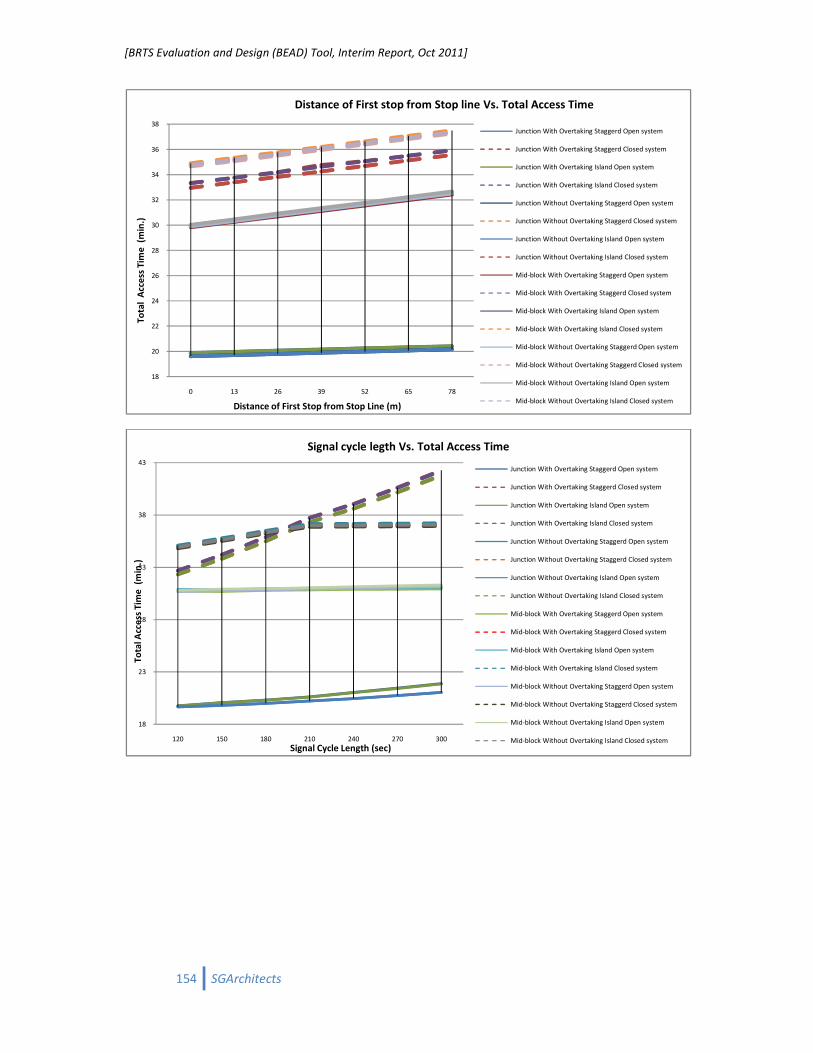
[BRTS Evaluation and Design (BEAD) Tool, Interim Report, Oct 2011]
154 SGArchitects
18
20
22
24
26
28
30
32
34
36
38
0 13 26 39 52 65 78
To
tal
Acc
ess
Tim
e (
min
.)
Distance of First Stop from Stop Line (m)
Distance of First stop from Stop line Vs. Total Access Time
Junction With Overtaking Staggerd Open system
Junction With Overtaking Staggerd Closed system
Junction With Overtaking Island Open system
Junction With Overtaking Island Closed system
Junction Without Overtaking Staggerd Open system
Junction Without Overtaking Staggerd Closed system
Junction Without Overtaking Island Open system
Junction Without Overtaking Island Closed system
Mid-block With Overtaking Staggerd Open system
Mid-block With Overtaking Staggerd Closed system
Mid-block With Overtaking Island Open system
Mid-block With Overtaking Island Closed system
Mid-block Without Overtaking Staggerd Open system
Mid-block Without Overtaking Staggerd Closed system
Mid-block Without Overtaking Island Open system
Mid-block Without Overtaking Island Closed system
18
23
28
33
38
43
120 150 180 210 240 270 300
To
tal A
cce
ss T
ime
(m
in.)
Signal Cycle Length (sec)
Signal cycle legth Vs. Total Access Time
Junction With Overtaking Staggerd Open system
Junction With Overtaking Staggerd Closed system
Junction With Overtaking Island Open system
Junction With Overtaking Island Closed system
Junction Without Overtaking Staggerd Open system
Junction Without Overtaking Staggerd Closed system
Junction Without Overtaking Island Open system
Junction Without Overtaking Island Closed system
Mid-block With Overtaking Staggerd Open system
Mid-block With Overtaking Staggerd Closed system
Mid-block With Overtaking Island Open system
Mid-block With Overtaking Island Closed system
Mid-block Without Overtaking Staggerd Open system
Mid-block Without Overtaking Staggerd Closed system
Mid-block Without Overtaking Island Open system
Mid-block Without Overtaking Island Closed system

[BRTS Evaluation and Design (BEAD) Tool, Interim Report, Oct 2011]
155 SGArchitects
-4
-2
0
2
4
6
8
400 450 500 550 600 650 700 750 800 850 900 950 1000
Tim
e s
av
ed
ov
er
Mix
ed
Co
nd
itio
n (
min
./tr
ip)
Average Distance between Stations (m)
Average Distance between Stations Vs. Time saved over Mixed Condition
Junction with overtaking staggered in open system
Junction With Overtaking Staggered in Close system
Junction With Overtaking Island in Open system
Junction With Overtaking Island in Close system
Junction Without Overtaking Staggered in Open system
Junction Without Overtaking Staggered in Closed system
Junction Without Overtaking Island in Open system
Junction Without Overtaking Island in Closed system
Mid-Block With Overtaking Staggered in Open system
Mid-Block With Overtaking Staggered in Closed system
Mid-Block With Overtaking Island in Open system
Mid-Block With Overtaking Island in Closed system
Mid-Block Without Overtaking Staggered in Open system
Mid-Block Without Overtaking Staggered in Closed system
Mid-Block Without Overtaking Island in Open system
Mid-Block Without Overtaking Island in Closed system
-1
0
1
2
3
4
5
6
2500 5000 7500 10000 12500 15000 17500 20000 22500 25000
Tim
e s
av
ed
ov
er
Mix
ed
Co
nd
itio
n (
min
./tr
ip)
Capacity in PPHPD (no.)
Capacity in PPHPD Vs. Time saved over Mixed Condition
Junction With Overtaking Staggered in Open system
Junction With Overtaking Staggered in Closed system
Junction With Overtaking Island in Open system
Junction With Overtaking Island in Closed system
Junction Without Overtaking Staggered in Open system
Junction Without Overtaking Staggered in Closed system
Junction Without Overtaking Island in Open system
Junction Without Overtaking Island in Closed system
Mid-block With Overtaking Staggered in Open system
Mid-block With Overtaking Staggered in Closed system
Mid-block With Overtaking Island in Open system
Mid-block With Overtaking Island in Closed system
Mid-block Without Overtaking Staggered in Open system
Mid-block Without Overtaking Staggered in Closed system
Mid-block Without Overtaking Island in Open system
Mid-block Without Overtaking Island in Closed system
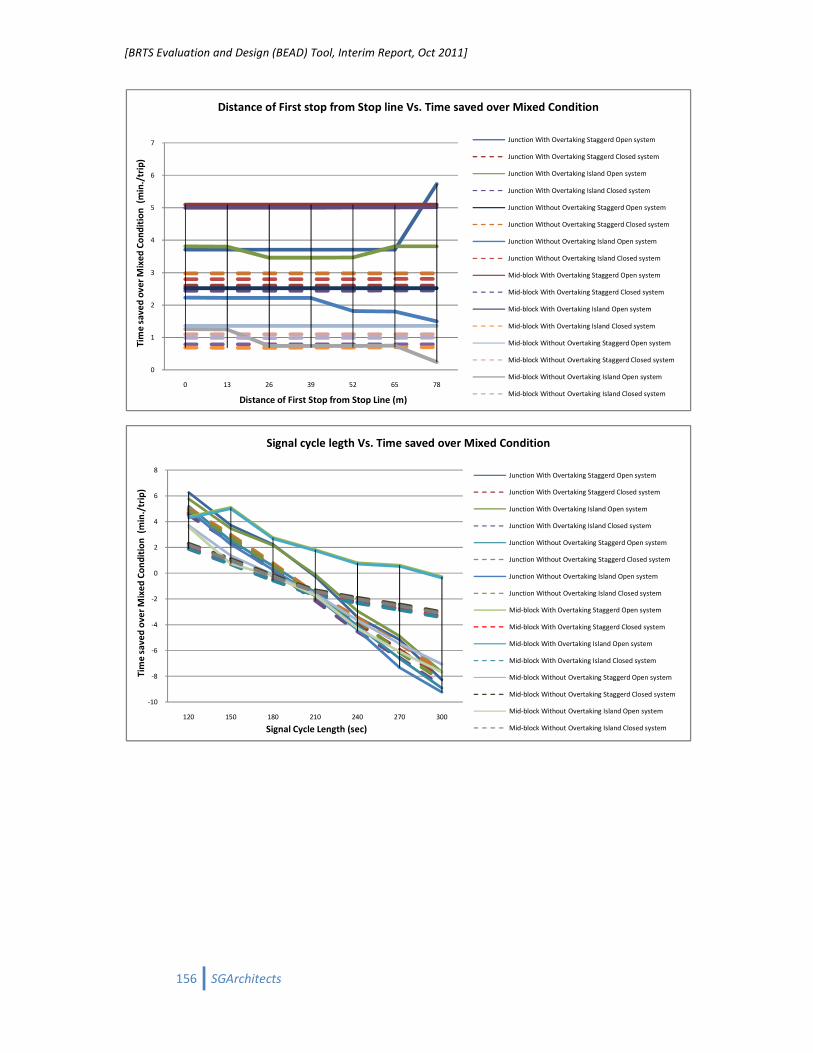
[BRTS Evaluation and Design (BEAD) Tool, Interim Report, Oct 2011]
156 SGArchitects
0
1
2
3
4
5
6
7
0 13 26 39 52 65 78
Tim
e s
av
ed
ov
er
Mix
ed
Co
nd
itio
n (
min
./tr
ip)
Distance of First Stop from Stop Line (m)
Distance of First stop from Stop line Vs. Time saved over Mixed Condition
Junction With Overtaking Staggerd Open system
Junction With Overtaking Staggerd Closed system
Junction With Overtaking Island Open system
Junction With Overtaking Island Closed system
Junction Without Overtaking Staggerd Open system
Junction Without Overtaking Staggerd Closed system
Junction Without Overtaking Island Open system
Junction Without Overtaking Island Closed system
Mid-block With Overtaking Staggerd Open system
Mid-block With Overtaking Staggerd Closed system
Mid-block With Overtaking Island Open system
Mid-block With Overtaking Island Closed system
Mid-block Without Overtaking Staggerd Open system
Mid-block Without Overtaking Staggerd Closed system
Mid-block Without Overtaking Island Open system
Mid-block Without Overtaking Island Closed system
-10
-8
-6
-4
-2
0
2
4
6
8
120 150 180 210 240 270 300
Tim
e s
av
ed
ov
er
Mix
ed
Co
nd
itio
n (
min
./tr
ip)
Signal Cycle Length (sec)
Signal cycle legth Vs. Time saved over Mixed Condition
Junction With Overtaking Staggerd Open system
Junction With Overtaking Staggerd Closed system
Junction With Overtaking Island Open system
Junction With Overtaking Island Closed system
Junction Without Overtaking Staggerd Open system
Junction Without Overtaking Staggerd Closed system
Junction Without Overtaking Island Open system
Junction Without Overtaking Island Closed system
Mid-block With Overtaking Staggerd Open system
Mid-block With Overtaking Staggerd Closed system
Mid-block With Overtaking Island Open system
Mid-block With Overtaking Island Closed system
Mid-block Without Overtaking Staggerd Open system
Mid-block Without Overtaking Staggerd Closed system
Mid-block Without Overtaking Island Open system
Mid-block Without Overtaking Island Closed system
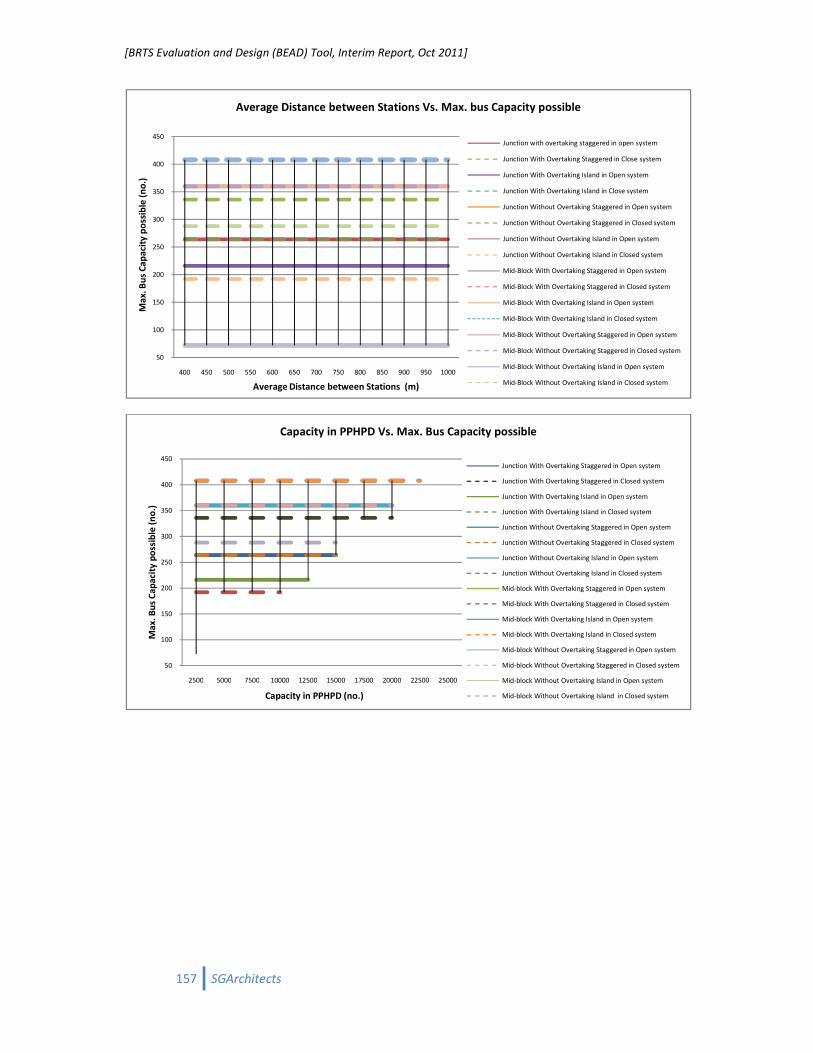
[BRTS Evaluation and Design (BEAD) Tool, Interim Report, Oct 2011]
157 SGArchitects
50
100
150
200
250
300
350
400
450
400 450 500 550 600 650 700 750 800 850 900 950 1000
Ma
x.
Bu
s C
ap
aci
ty p
oss
ible
(n
o.)
Average Distance between Stations (m)
Average Distance between Stations Vs. Max. bus Capacity possible
Junction with overtaking staggered in open system
Junction With Overtaking Staggered in Close system
Junction With Overtaking Island in Open system
Junction With Overtaking Island in Close system
Junction Without Overtaking Staggered in Open system
Junction Without Overtaking Staggered in Closed system
Junction Without Overtaking Island in Open system
Junction Without Overtaking Island in Closed system
Mid-Block With Overtaking Staggered in Open system
Mid-Block With Overtaking Staggered in Closed system
Mid-Block With Overtaking Island in Open system
Mid-Block With Overtaking Island in Closed system
Mid-Block Without Overtaking Staggered in Open system
Mid-Block Without Overtaking Staggered in Closed system
Mid-Block Without Overtaking Island in Open system
Mid-Block Without Overtaking Island in Closed system
50
100
150
200
250
300
350
400
450
2500 5000 7500 10000 12500 15000 17500 20000 22500 25000
Ma
x.
Bu
s C
ap
aci
ty p
oss
ible
(n
o.)
Capacity in PPHPD (no.)
Capacity in PPHPD Vs. Max. Bus Capacity possible
Junction With Overtaking Staggered in Open system
Junction With Overtaking Staggered in Closed system
Junction With Overtaking Island in Open system
Junction With Overtaking Island in Closed system
Junction Without Overtaking Staggered in Open system
Junction Without Overtaking Staggered in Closed system
Junction Without Overtaking Island in Open system
Junction Without Overtaking Island in Closed system
Mid-block With Overtaking Staggered in Open system
Mid-block With Overtaking Staggered in Closed system
Mid-block With Overtaking Island in Open system
Mid-block With Overtaking Island in Closed system
Mid-block Without Overtaking Staggered in Open system
Mid-block Without Overtaking Staggered in Closed system
Mid-block Without Overtaking Island in Open system
Mid-block Without Overtaking Island in Closed system

[BRTS Evaluation and Design (BEAD) Tool, Interim Report, Oct 2011]
158 SGArchitects
0
100
200
300
400
500
600
700
0 13 26 39 52 65 78
Ma
x.
Bu
s C
ap
aci
ty p
oss
ible
(n
o.)
Distance of First Stop from Stop Line (m)
Distance of First stop from Stop line Vs. Max. Bus Capacity possible
Junction With Overtaking Staggerd Open system
Junction With Overtaking Staggerd Closed system
Junction With Overtaking Island Open system
Junction With Overtaking Island Closed system
Junction Without Overtaking Staggerd Open system
Junction Without Overtaking Staggerd Closed system
Junction Without Overtaking Island Open system
Junction Without Overtaking Island Closed system
Mid-block With Overtaking Staggerd Open system
Mid-block With Overtaking Staggerd Closed system
Mid-block With Overtaking Island Open system
Mid-block With Overtaking Island Closed system
Mid-block Without Overtaking Staggerd Open system
Mid-block Without Overtaking Staggerd Closed system
Mid-block Without Overtaking Island Open system
Mid-block Without Overtaking Island Closed system
50
100
150
200
250
300
350
400
450
120 150 180 210 240 270 300
Ma
x.
Bu
s C
ap
aci
ty p
oss
ible
(n
o.)
Signal Cycle Length (sec)
Signal cycle legth Vs. Max. Bus Capacity possible
Junction With Overtaking Staggerd Open system
Junction With Overtaking Staggerd Closed system
Junction With Overtaking Island Open system
Junction With Overtaking Island Closed system
Junction Without Overtaking Staggerd Open system
Junction Without Overtaking Staggerd Closed system
Junction Without Overtaking Island Open system
Junction Without Overtaking Island Closed system
Mid-block With Overtaking Staggerd Open system
Mid-block With Overtaking Staggerd Closed system
Mid-block With Overtaking Island Open system
Mid-block With Overtaking Island Closed system
Mid-block Without Overtaking Staggerd Open system
Mid-block Without Overtaking Staggerd Closed system
Mid-block Without Overtaking Island Open system
Mid-block Without Overtaking Island Closed system

[BRTS Evaluation and Design (BEAD) Tool, Interim Report, Oct 2011]
159 SGArchitects
800
900
1000
1100
1200
1300
1400
1500
400 450 500 550 600 650 700 750 800 850 900 950 1000
Av
era
ge
Wa
lkin
g D
ista
nce
(m
)
Average Distance between Stations (m)
Average Distance between Stations Vs. Average Walking Distance
Junction with overtaking staggered in open system
Junction With Overtaking Staggered in Close system
Junction With Overtaking Island in Open system
Junction With Overtaking Island in Close system
Junction Without Overtaking Staggered in Open system
Junction Without Overtaking Staggered in Closed system
Junction Without Overtaking Island in Open system
Junction Without Overtaking Island in Closed system
Mid-Block With Overtaking Staggered in Open system
Mid-Block With Overtaking Staggered in Closed system
Mid-Block With Overtaking Island in Open system
Mid-Block With Overtaking Island in Closed system
Mid-Block Without Overtaking Staggered in Open system
Mid-Block Without Overtaking Staggered in Closed system
Mid-Block Without Overtaking Island in Open system
Mid-Block Without Overtaking Island in Closed system
900
950
1000
1050
1100
1150
1200
1250
1300
2500 5000 7500 10000 12500 15000 17500 20000 22500 25000
Av
era
ge
Wa
lkin
g D
ista
nce
(m
)
Capacity in PPHPD (no.)
Capacity in PPHPD Vs. Average Walking Distance
Junction With Overtaking Staggered in Open system
Junction With Overtaking Staggered in Closed system
Junction With Overtaking Island in Open system
Junction With Overtaking Island in Closed system
Junction Without Overtaking Staggered in Open system
Junction Without Overtaking Staggered in Closed system
Junction Without Overtaking Island in Open system
Junction Without Overtaking Island in Closed system
Mid-block With Overtaking Staggered in Open system
Mid-block With Overtaking Staggered in Closed system
Mid-block With Overtaking Island in Open system
Mid-block With Overtaking Island in Closed system
Mid-block Without Overtaking Staggered in Open system
Mid-block Without Overtaking Staggered in Closed system
Mid-block Without Overtaking Island in Open system
Mid-block Without Overtaking Island in Closed system

[BRTS Evaluation and Design (BEAD) Tool, Interim Report, Oct 2011]
160 SGArchitects
850
950
1050
1150
1250
1350
1450
0 13 26 39 52 65 78
Av
era
ge
Wa
lkin
g D
ista
nce
(m
)
Distance of First Stop from Stop Line (m)
Distance of First stop from Stop line Vs. Average Walking Distace
Junction With Overtaking Staggerd Open system
Junction With Overtaking Staggerd Closed system
Junction With Overtaking Island Open system
Junction With Overtaking Island Closed system
Junction Without Overtaking Staggerd Open system
Junction Without Overtaking Staggerd Closed system
Junction Without Overtaking Island Open system
Junction Without Overtaking Island Closed system
Mid-block With Overtaking Staggerd Open system
Mid-block With Overtaking Staggerd Closed system
Mid-block With Overtaking Island Open system
Mid-block With Overtaking Island Closed system
Mid-block Without Overtaking Staggerd Open system
Mid-block Without Overtaking Staggerd Closed system
Mid-block Without Overtaking Island Open system
Mid-block Without Overtaking Island Closed system
900
950
1000
1050
1100
1150
1200
1250
1300
1350
1400
120 150 180 210 240 270 300
Av
era
ge
Wa
lkin
g D
ista
nce
(m
)
Signal Cycle Length (sec)
Signal cycle legth Vs. Average Walking Distance
Junction With Overtaking Staggerd Open system
Junction With Overtaking Staggerd Closed system
Junction With Overtaking Island Open system
Junction With Overtaking Island Closed system
Junction Without Overtaking Staggerd Open system
Junction Without Overtaking Staggerd Closed system
Junction Without Overtaking Island Open system
Junction Without Overtaking Island Closed system
Mid-block With Overtaking Staggerd Open system
Mid-block With Overtaking Staggerd Closed system
Mid-block With Overtaking Island Open system
Mid-block With Overtaking Island Closed system
Mid-block Without Overtaking Staggerd Open system
Mid-block Without Overtaking Staggerd Closed system
Mid-block Without Overtaking Island Open system
Mid-block Without Overtaking Island Closed system

[BRTS Evaluation and Design (BEAD) Tool, Interim Report, Oct 2011]
161 SGArchitects
Reference List
Janmarg: BRTS Ahmedabad (8th Month MIS). 2010. Janmarg.
Ref Type: Report
Geetam Tiwari and Deepty Jain. BRTS Projects In Indian Cities, Status Report. TRIPP-RP10-02. 2010.
New Delhi, Transportation Research and Injury Prevention Program (TRIPP), IIT Delhi.
Ref Type: Report
Sergio R.Jara-Diaz. "Allocation and Valuation of Travel Time Svings." Handbook of Transport
Modelling. Ed. David A.Hensher and Kenneth J.Button. Elsevier Science. Pergamon, 2000.
303-19.
Walter Hook. Institutional and Regulatory Options for Bus Rapid Transit in Developing Countries,
Lessons from International Experience. 2005. The Institute of Transportation and
Development Policy (ITDP).
Ref Type: Report