Embed Size (px)
Citation preview
Consumer Pricing Report 2003
A PricewaterhouseCoopers Report to Forfás
May 2003

Table of Contents
Foreword
Executive Summary i
Chapter 1 Introduction 1
Chapter 2 Consumer Prices in EU15 Perspective 2
2.1 Introduction 3
2.2 Eurostat/PPP 4
2.3 Mercer Human Resource Consulting 8
2.4 European Commission 15
Chapter 3 Analysis of National Drivers of Inflation 18 3.1 Introduction 20
3.2 Consumer Price Inflation (CPI), 2000 to 2003 20
Chapter 4 Analysis of COICOP Level 1 Drivers of Inflation 33 4.1 Introduction 34
4.2 Pubs & Restaurants 34
4.3 Alcohol & Tobacco (Off-Licence) 37
4.4 Miscellaneous Goods & Services 39
4.5 Recreation & Culture 43
4.6 Health 45
Annex 1 Methodological Issues 48 Annex 2 European Rates of Consumer Price Inflation 2002 53 Annex 3 Traded and Non-Traded Classification 56 Annex 4 Abbreviations 58
PricewaterhouseCoopers would like to acknowledge the support of Mercer HR Consulting in the preparation of this report.

Foreword
Over the last decade the Irish economy has undergone a rapid transformation, yielding rates of incomes and employment growth that are the envy of many of our European neighbours. The rapid and consistent implementation of pro-competitive economic policies during this period, combined with other favourable economic and social factors, allowed us to rise quickly through global competitiveness rankings. However, our extraordinary recent economic success has resulted in a new set of challenges for policy-makers, and swift and decisive action will once again be necessary if we are to protect our competitive position on the international stage, and ensure that the current economic success story is maintained over the next decade. It is clear given the development of a more open global economy, that reinforcing our competitiveness is the most urgent challenge facing the economy at this time.
A key area of competitiveness is the price environment. This report confirms that rapid price increases across the Irish economy continued in 2002, resulting in further divergence between price levels in Ireland and those of our European trading partners. The report identifies several key areas where both price levels and rates of increase are running well ahead of European average, and reveals the main drivers of current inflation.
Ireland cannot, and should not, attempt to compete in global markets on the basis of low prices and wages. However if the widening gap between prices here and elsewhere in Europe is left unchecked, then our competitive position will be exposed to further risks, particularly across those sectors which are dependent on trade. An overshoot of prices would also threaten our continued ability to attract foreign investment and to develop Ireland as a centre for research and development.
Strengthening Ireland’s competitive advantage requires action to eliminate the inflation and price differential between Ireland and our trading partners, and also improvements to infrastructure, regulation, taxation, education, innovation, entrepreneurship and management development, aimed at raising the productivity of Irish industry.
The key findings of this report have been used by the National Competitiveness Council, whose Secretariat is provided by Forfás, to bring forward a set of recommendations to address the inflation differential between Ireland and the European average. I strongly welcome the NCC Statement on Inflation and support its recommendations.
Achieving an inflation rate equal to or below the European average of two per cent, together with the continuation of other productivity-enhancing policies, will underpin our short-term economic performance and strengthen the competitive foundations on which our future economic success will depend. Martin Cronin Chief Executive Forfás

i
Executive Summary
Introduction This study was commissioned by Forfás in response to growing concern, among policymakers about sustained high rates of consumer price inflation within the Irish economy. The study comprises two main elements: a comparative analysis of consumer prices in Ireland and other EU15 countries; and an analysis of the major product/service drivers of consumer price inflation in Ireland in recent years. It represents a partial update of a study undertaken by PricewaterhouseCoopers (PwC) for Forfás in 2002 on consumer prices in Ireland1.
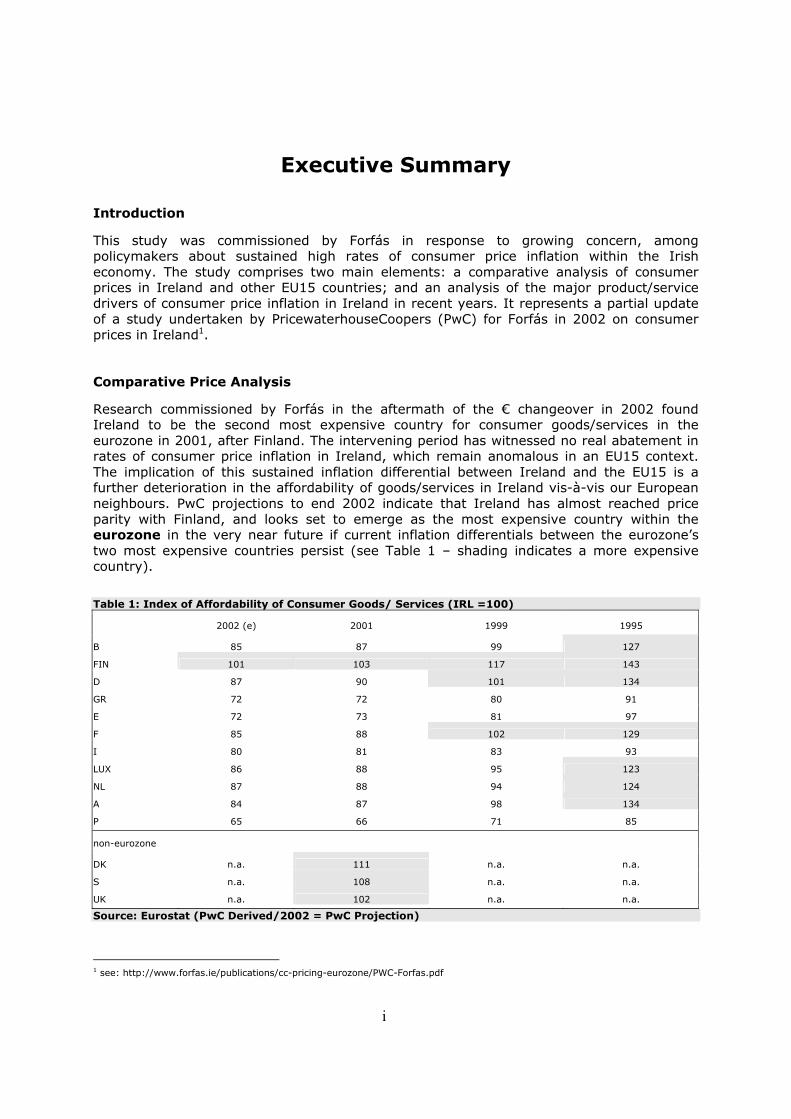
Comparative Price Analysis Research commissioned by Forfás in the aftermath of the € changeover in 2002 found Ireland to be the second most expensive country for consumer goods/services in the eurozone in 2001, after Finland. The intervening period has witnessed no real abatement in rates of consumer price inflation in Ireland, which remain anomalous in an EU15 context. The implication of this sustained inflation differential between Ireland and the EU15 is a further deterioration in the affordability of goods/services in Ireland vis-à-vis our European neighbours. PwC projections to end 2002 indicate that Ireland has almost reached price parity with Finland, and looks set to emerge as the most expensive country within the eurozone in the very near future if current inflation differentials between the eurozone’s two most expensive countries persist (see Table 1 – shading indicates a more expensive country).
Table 1: Index of Affordability of Consumer Goods/ Services (IRL =100)
2002 (e) 2001 1999 1995 B 85 87 99 127
FIN 101 103 117 143
D 87 90 101 134
GR 72 72 80 91
E 72 73 81 97
F 85 88 102 129
I 80 81 83 93
LUX 86 88 95 123
NL 87 88 94 124
A 84 87 98 134
P 65 66 71 85 non-eurozone DK n.a. 111 n.a. n.a.
S n.a. 108 n.a. n.a.
UK n.a. 102 n.a. n.a. Source: Eurostat (PwC Derived/2002 = PwC Projection)
1 see: http://www.forfas.ie/publications/cc-pricing-eurozone/PWC-Forfas.pdf
ii
Widening the net to include the non-eurozone EU15 economies, i.e. Denmark, Sweden and the UK, Ireland is found to be the fifth most expensive country in the EU15 in 2001 – the three Scandinavian countries and the UK being more expensive than Ireland in this year. While this ranking is consistent with the finding for 2000, the large consumer price inflation differential that has existed between the UK and Ireland for some time suggests that consumer prices in Ireland may now be equal to those in the UK. It is therefore likely that by 2003 Ireland will be the 3rd most expensive country in the EU15. An analysis of the relative affordability of product/service groups within the EMU12 in 2002 found Ireland to be particularly expensive for tobacco (1 = 1st most expensive), pubs and restaurants (1), food and non-alcoholic beverages (1), residential rents (1), off-licence alcohol (2), and recreational and cultural services (2). By contrast, Ireland was found to be relatively price competitive for clothing & footwear (11), communications (9) and household utilities (7).
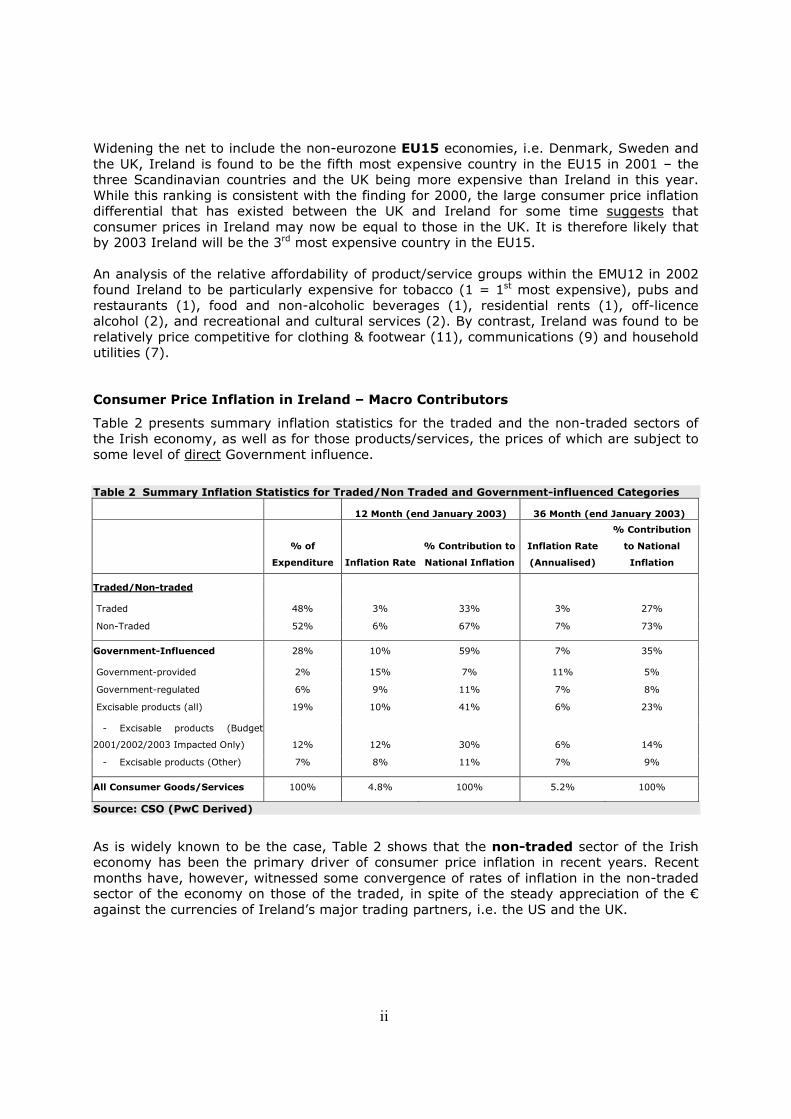
Consumer Price Inflation in Ireland – Macro Contributors Table 2 presents summary inflation statistics for the traded and the non-traded sectors of the Irish economy, as well as for those products/services, the prices of which are subject to some level of direct Government influence.
Table 2 Summary Inflation Statistics for Traded/Non Traded and Government-influenced Categories
12 Month (end January 2003) 36 Month (end January 2003)
% of
Expenditure Inflation Rate
% Contribution to
National Inflation
Inflation Rate
(Annualised)
% Contribution
to National
Inflation
Traded/Non-traded
Traded 48% 3% 33% 3% 27%
Non-Traded 52% 6% 67% 7% 73%
Government-Influenced 28% 10% 59% 7% 35%
Government-provided 2% 15% 7% 11% 5%
Government-regulated 6% 9% 11% 7% 8%
Excisable products (all) 19% 10% 41% 6% 23%
- Excisable products (Budget
2001/2002/2003 Impacted Only) 12% 12% 30% 6% 14%
- Excisable products (Other) 7% 8% 11% 7% 9%
All Consumer Goods/Services 100% 4.8% 100% 5.2% 100%
Source: CSO (PwC Derived)
As is widely known to be the case, Table 2 shows that the non-traded sector of the Irish economy has been the primary driver of consumer price inflation in recent years. Recent months have, however, witnessed some convergence of rates of inflation in the non-traded sector of the economy on those of the traded, in spite of the steady appreciation of the € against the currencies of Ireland’s major trading partners, i.e. the US and the UK.
iii
For the purposes of our analysis, the “government-influenced” category of consumer expenditure was considered to incorporate three primary consumer product/service types, namely:
• services provided directly by the public sector, e.g. refuse/hospital services; • products/services, the price of which is regulated by Government, e.g. certain
utilities; • excisable products, i.e. fuel, alcohol and tobacco.
An analysis of inflation rates within each of these categories of expenditure initially found that “government-influenced” products/services accounted for close to 60% of the increase in consumer prices in the 12 months to end January 2003, compared with an expenditure share of less than 30%, i.e. the rate of inflation in this category of spend was more than twice the national average. However this figure must be used with caution. This summary analysis of the contribution of “government-influenced” products/services to national inflation, however, overstates the role of the Government – to the extent that price developments in excisable products may be market-driven, as opposed to attributable to a change in the excise regulation. This is evidenced in the fact that those products (e.g. beer) that were not subject to any excise increase for the three-year period under review recorded rates of inflation considerably in excess of the national average (see Table 2). Moreover, a detailed analysis of developments in the price of products that have been subject to an excise change in the past three years indicates that, in certain cases, a change in the excise regulation typically coincides with a significant, entirely supplier-determined, price increase, i.e. increase over-and-above impact of excise. In conclusion, the analysis contained in Table 2 lends support to estimates that Government accounted for somewhere between 30% and 40% of consumer price inflation in the year ended January 2003 (Central Bank Spring Bulletin estimate is around 1.5%). The Budget 2003 increase of 50c on the price of packet of 20 cigarettes accounted for approximately 13% of this contribution. Finally, an analysis of the contribution to national inflation made by the 12 major categories of consumer expenditure (i.e. COICOP 12) for the 12 month period to end January 2003 found that four expenditure categories accounted for almost 80% of national inflation. These are: pubs and restaurants (29%); [off-licence] alcoholic beverages and tobacco (19%); transport (16%); and miscellaneous goods and services (15%). The strong role played by the non-traded sector and/or excisable goods, highlighted in Table 2, is apparent. Product/Service-level Drivers of Consumer Price Inflation The terms of reference for this study also required that the consultants identify those product/service categories (COICOP 2, 3 & 4) that have been most noteworthy in inflation terms over the past 12 months. Two measures of inflation were applied in this analysis, namely:
• rate of price inflation in the year to end January 2003;
• contribution to national inflation in the year to end January 2003.
2 The term COICOP (Classification of Individual Consumption by Purpose) refers to categories of consumer goods/expenditure, with the major categories, of which there are twelve, referred to as “COICOP 1” (e.g. food and non-alcoholic beverages). COICOP 2 (e.g. food) is the next level of aggregation, with COICOP 4 (e.g. bread) being the highest level of disaggregation considered for the purposes of this analysis.
iv
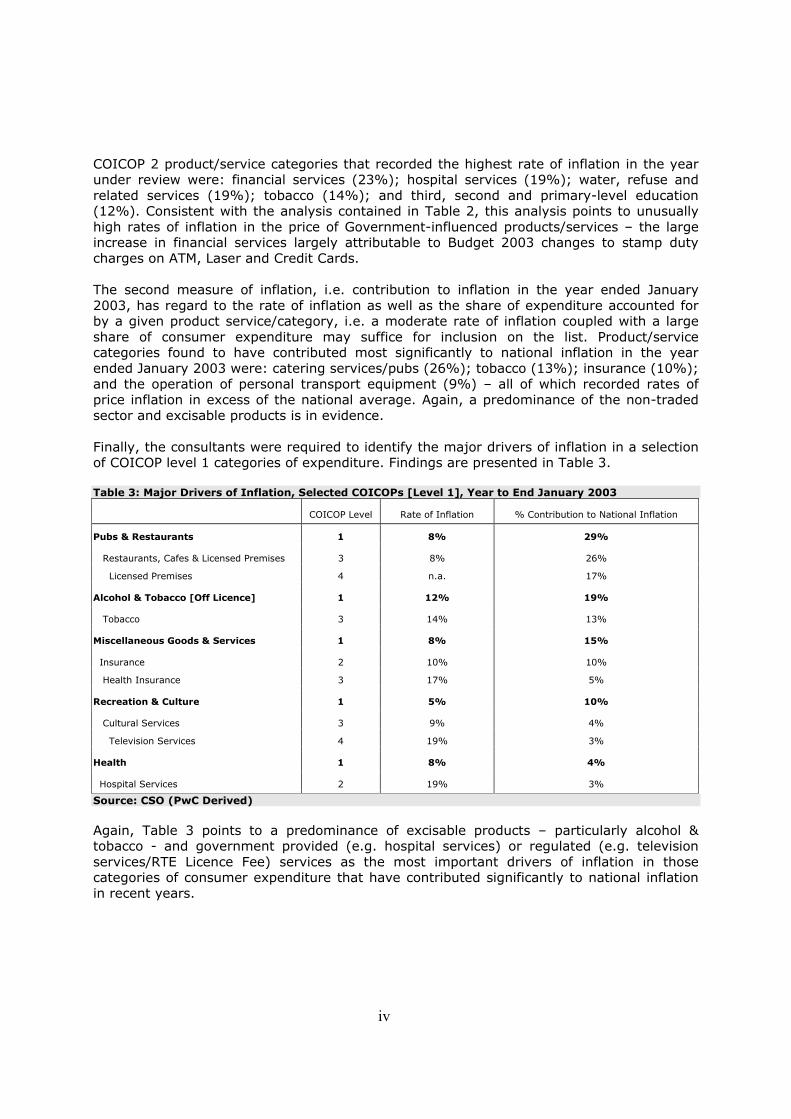
COICOP 2 product/service categories that recorded the highest rate of inflation in the year under review were: financial services (23%); hospital services (19%); water, refuse and related services (19%); tobacco (14%); and third, second and primary-level education (12%). Consistent with the analysis contained in Table 2, this analysis points to unusually high rates of inflation in the price of Government-influenced products/services – the large increase in financial services largely attributable to Budget 2003 changes to stamp duty charges on ATM, Laser and Credit Cards. The second measure of inflation, i.e. contribution to inflation in the year ended January 2003, has regard to the rate of inflation as well as the share of expenditure accounted for by a given product service/category, i.e. a moderate rate of inflation coupled with a large share of consumer expenditure may suffice for inclusion on the list. Product/service categories found to have contributed most significantly to national inflation in the year ended January 2003 were: catering services/pubs (26%); tobacco (13%); insurance (10%); and the operation of personal transport equipment (9%) – all of which recorded rates of price inflation in excess of the national average. Again, a predominance of the non-traded sector and excisable products is in evidence. Finally, the consultants were required to identify the major drivers of inflation in a selection of COICOP level 1 categories of expenditure. Findings are presented in Table 3. Table 3: Major Drivers of Inflation, Selected COICOPs [Level 1], Year to End January 2003
COICOP Level Rate of Inflation % Contribution to National Inflation
Pubs & Restaurants 1 8% 29%
Restaurants, Cafes & Licensed Premises 3 8% 26%
Licensed Premises 4 n.a. 17%
Alcohol & Tobacco [Off Licence] 1 12% 19%
Tobacco 3 14% 13%
Miscellaneous Goods & Services 1 8% 15%
Insurance 2 10% 10%
Health Insurance 3 17% 5%
Recreation & Culture 1 5% 10%
Cultural Services 3 9% 4%
Television Services 4 19% 3%
Health 1 8% 4%
Hospital Services 2 19% 3%
Source: CSO (PwC Derived) Again, Table 3 points to a predominance of excisable products – particularly alcohol & tobacco - and government provided (e.g. hospital services) or regulated (e.g. television services/RTE Licence Fee) services as the most important drivers of inflation in those categories of consumer expenditure that have contributed significantly to national inflation in recent years.
1
Chapter 1 Introduction
This study was commissioned by Forfás following concerns that high price levels and costs
were now posing problems for the competitiveness of Irish industry, particularly in efforts to
develop industry across the island. The report exhibits and analyses key pricing problems
which will lead to a better understanding of this key economic issue.
The purpose of the assignment is two-fold, namely: to determine the implications of
sustained high rates of consumer price inflation in Ireland for the affordability of consumer
goods/services relative to our European neighbours; and to identify the relative
contributions of the various categories of consumer good/service to overall consumer price
inflation in recent years.
The comparative price assessment will provide an indication of the cost, in national
competitiveness terms, of relatively high rates of consumer price inflation, while the
analysis of inflation drivers will provide policymakers with an improved basis for the
development of initiatives aimed at countering high levels of inflation going forward.
This report represents a partial update of a report commissioned by Forfás to
PricewaterhouseCoopers in March 2002i – which assessed the relative affordability of
consumer goods and services in Ireland vis-à-vis other eurozone countries, and examined
the extent to which claims that there were unusual consumer price developments during the
€ changeover period had any basis in reality.
The remainder of this report comprises four chapters.
The next chapter presents secondary research findings regarding the relative price of
consumer goods/services in Ireland, while Chapter 3 presents an analysis of the major
drivers of consumer price inflation in Ireland. Chapter 4 presents national and international
inflation data for a number of consumer good/service categories – selected on the basis of
having made a particularly significant contribution to national inflation in recent years, while
Chapter 5 presents a summary of key report findings.
2
Chapter 2 Consumer Prices in EU15 Perspective
Summary of Chapter Findings
This chapter presents an analysis of secondary research findings on the affordability of consumer goods/services in Ireland relative to a selection of other European countries. Key findings are the following: • Ireland is a relatively expensive country for consumer goods/services – ranking
second most expensive in the eurozone for a nationally representative sample of consumer goods/services in 2002 (PricewaterhouseCoopers estimate) – marginally behind Finland (+ 1% higher);
• this second ranking is consistent with Ireland’s ranking in 2001, although Ireland
is likely to reach price parity in the very near future, if current inflation differentials between the two countries persist. In other words, it is very likely that Ireland will become the most expensive country in the eurozone during 2003;
• in a wider EU15 context, Ireland was found to be the fifth most expensive
country in which to purchase a nationally representative sample of consumer goods/services in 2001 – after the UK (+2% higher), Finland (+3%), Sweden (+8%) and Denmark (+11%);
• Ireland’s fifth ranking in 2001 is consistent with findings for 2000 –
notwithstanding the fact that the rate of consumer price inflation in Ireland was the highest in the EU15 for the period in question;
• this apparent contradiction can be attributed to the fact that Ireland has moved
away from that group of EU15 countries with relatively low consumer price levels, and is playing “catch up” with a small number of countries where price levels have traditionally been high in an EU15 context;
• it is, however, likely that this “catch up” process may be approaching an end –
with Ireland likely to reach consumer price parity with the UK as well as Finland in the near future, if Ireland’s rate of consumer price inflation continues to deviate so sharply from that of the EU15’s traditionally high-price economies;
• in other words, it is likely that Ireland will become the third most expensive
country in the EU15 if current inflation differentials between Ireland and the UK and Finland persist throughout 2003;
• there is a broad consistency in the profile of goods/services found to be
particularly expensive in Ireland in 2001 and 2002 – namely, food and non-food consumables, residential rents, alcohol & tobacco, and pubs & restaurants.
3
2.1 Introduction This chapter presents findings on the cost of consumer goods and services in Ireland
relative to other European countries. Findings presented in this chapter are essentially an
update of those contained in Chapter 3 of the 2002 Forfás study on consumer prices, albeit
extended to incorporate, as possible, non-eurozone economies, i.e. the UK, Sweden and
Denmark. As detailed in the 2002 study, international comparative price studies are subject
to a series of methodological difficulties (see Annex 1).
A general methodological issue that merits re-mention here is the distinction between
representative and non-representative comparative price studies. Representative price
studies seek to mirror the precise consumption patterns of the residents of that country in
which consumer prices are being measured, while non-representative studies seek to
measure the price of replicating a country-specific consumption pattern in another country.
To reflect the fact that both approaches have their respective strengthsii, and in common
with the original study, findings from representative (i.e. Eurostat) and non-representative
(e.g. Mercer) price surveys are presented in the remainder of this chapter. An overview of
the three sources of comparative price data used in this chapter is presented in Box 1.
4
Box 1 Introduction to Sources of Comparative Price Data Eurostat/PPPiii-derived comparative price data is a by-product of an exercise aimed at advancing the traditional measure of welfare across economies, to reflect the fact that national output expressed in a common unit of currency does not provide an adequate reflection of the relative welfare of residents of different countries, i.e. exchange rates do not capture in full the size of the basket of goods/services that may be acquired in return for a given unit of a common currency. In other words, differentials in the cost of goods and services between countries are not fully reflected in exchanges rates. Eurostat/PPP-derived comparative price data are representative of consumption in the country in which prices are measured, i.e. the selection of products/services reflects national preferences, as does the weighting of the different categories of consumer expenditure. Mercer HR Consulting collect international comparative price data on a bi-annual basis to assist clients in setting remuneration levels for employees being relocated overseas. Reflecting this focus, the comparative price data is not representative, i.e. the survey is based on a relatively standard set of goods/services, and weightings to reflect national consumption patterns are typically not applied. This distinguishes this source of comparative price data from the foregoing, i.e. Eurostat PPP, which is nationally representative. For methodological reasons, Mercer comparative price data is presented for eurozone countries only. While the European Commission produces a series of comparative price studies, limited coverage of Ireland and other methodological issues mean that just two are directly relevant to this study. These are the European Commission Annual Cost of Living Survey and DG IV (Competition) data on the comparative price of motor vehicles. The Annual Cost of Living Survey is derived from Eurostat PPP data, but is not nationally representative, i.e. product/service weightings reflect typical consumption patterns of Commission employees, reflecting the purpose of the exercise which is to determine remuneration levels for Commission employees placed outside of Belgium. Moreover, comparative price findings are presented for a selection of cities as opposed to being grossed up to country level. Comparative price data on motor vehicles are produced annually by DG IV.
The remainder of this chapter comprises three sections, which describe comparative price
data from Eurostat (PPP), Mercer HR Consulting and the European Commission respectively.
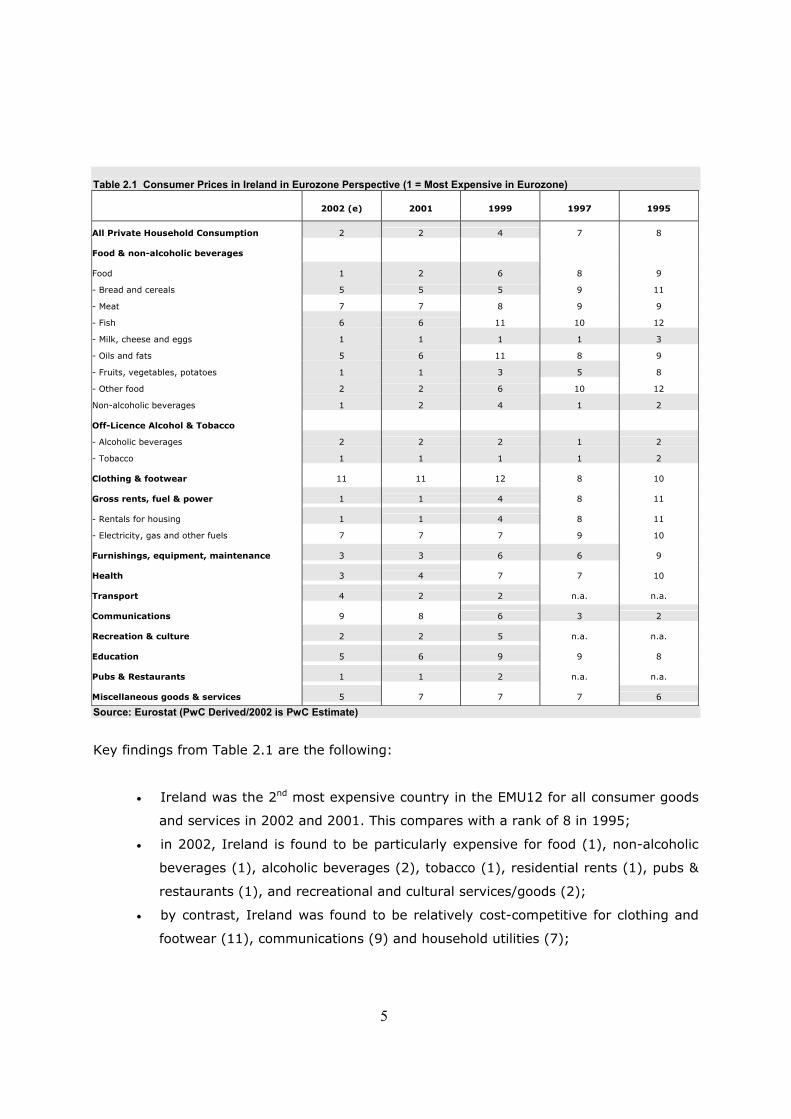
2.2 Eurostat/PPP Table 2.1 shows the development of consumer prices in Ireland relative to the EMU12
between 1995 and 2002 – shading indicating that Ireland is among the six most expensive
countries. It should be noted that rankings for 2002 are PwC estimates – derived from the
application of full-year 2002 rates of consumer price inflation (HICP) for each of the
eurozone countries to 2001 Eurostat/PPP comparative price indices.
5
Table 2.1 Consumer Prices in Ireland in Eurozone Perspective (1 = Most Expensive in Eurozone) 2002 (e) 2001 1999 1997 1995 All Private Household Consumption 2 2 4 7 8 Food & non-alcoholic beverages Food 1 2 6 8 9
- Bread and cereals 5 5 5 9 11
- Meat 7 7 8 9 9
- Fish 6 6 11 10 12
- Milk, cheese and eggs 1 1 1 1 3
- Oils and fats 5 6 11 8 9
- Fruits, vegetables, potatoes 1 1 3 5 8
- Other food 2 2 6 10 12
Non-alcoholic beverages 1 2 4 1 2 Off-Licence Alcohol & Tobacco
- Alcoholic beverages 2 2 2 1 2
- Tobacco 1 1 1 1 2 Clothing & footwear 11 11 12 8 10 Gross rents, fuel & power 1 1 4 8 11 - Rentals for housing 1 1 4 8 11
- Electricity, gas and other fuels 7 7 7 9 10 Furnishings, equipment, maintenance 3 3 6 6 9 Health 3 4 7 7 10 Transport 4 2 2 n.a. n.a. Communications 9 8 6 3 2 Recreation & culture 2 2 5 n.a. n.a. Education 5 6 9 9 8 Pubs & Restaurants 1 1 2 n.a. n.a. Miscellaneous goods & services 5 7 7 7 6 Source: Eurostat (PwC Derived/2002 is PwC Estimate)
Key findings from Table 2.1 are the following:
• Ireland was the 2nd most expensive country in the EMU12 for all consumer goods
and services in 2002 and 2001. This compares with a rank of 8 in 1995;
• in 2002, Ireland is found to be particularly expensive for food (1), non-alcoholic
beverages (1), alcoholic beverages (2), tobacco (1), residential rents (1), pubs &
restaurants (1), and recreational and cultural services/goods (2);
• by contrast, Ireland was found to be relatively cost-competitive for clothing and
footwear (11), communications (9) and household utilities (7);
6
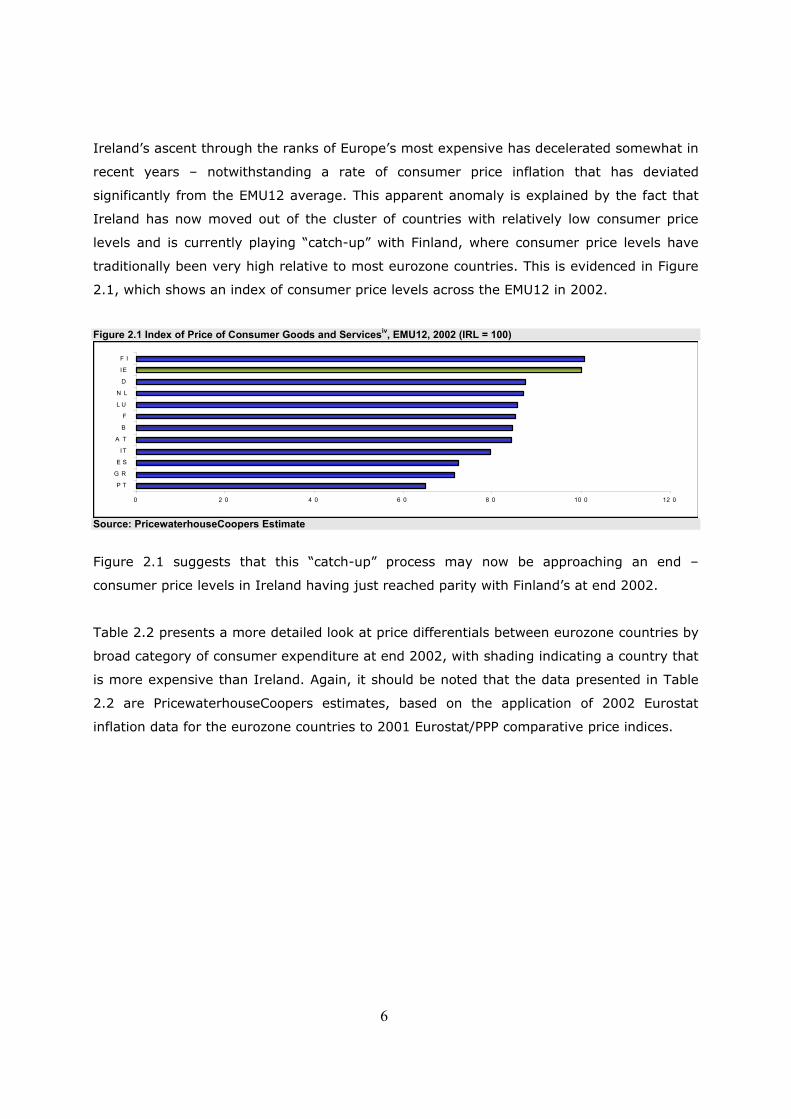
Ireland’s ascent through the ranks of Europe’s most expensive has decelerated somewhat in
recent years – notwithstanding a rate of consumer price inflation that has deviated
significantly from the EMU12 average. This apparent anomaly is explained by the fact that
Ireland has now moved out of the cluster of countries with relatively low consumer price
levels and is currently playing “catch-up” with Finland, where consumer price levels have
traditionally been very high relative to most eurozone countries. This is evidenced in Figure
2.1, which shows an index of consumer price levels across the EMU12 in 2002.
Figure 2.1 Index of Price of Consumer Goods and Servicesiv, EMU12, 2002 (IRL = 100)
Source: PricewaterhouseCoopers Estimate
Figure 2.1 suggests that this “catch-up” process may now be approaching an end –
consumer price levels in Ireland having just reached parity with Finland’s at end 2002.
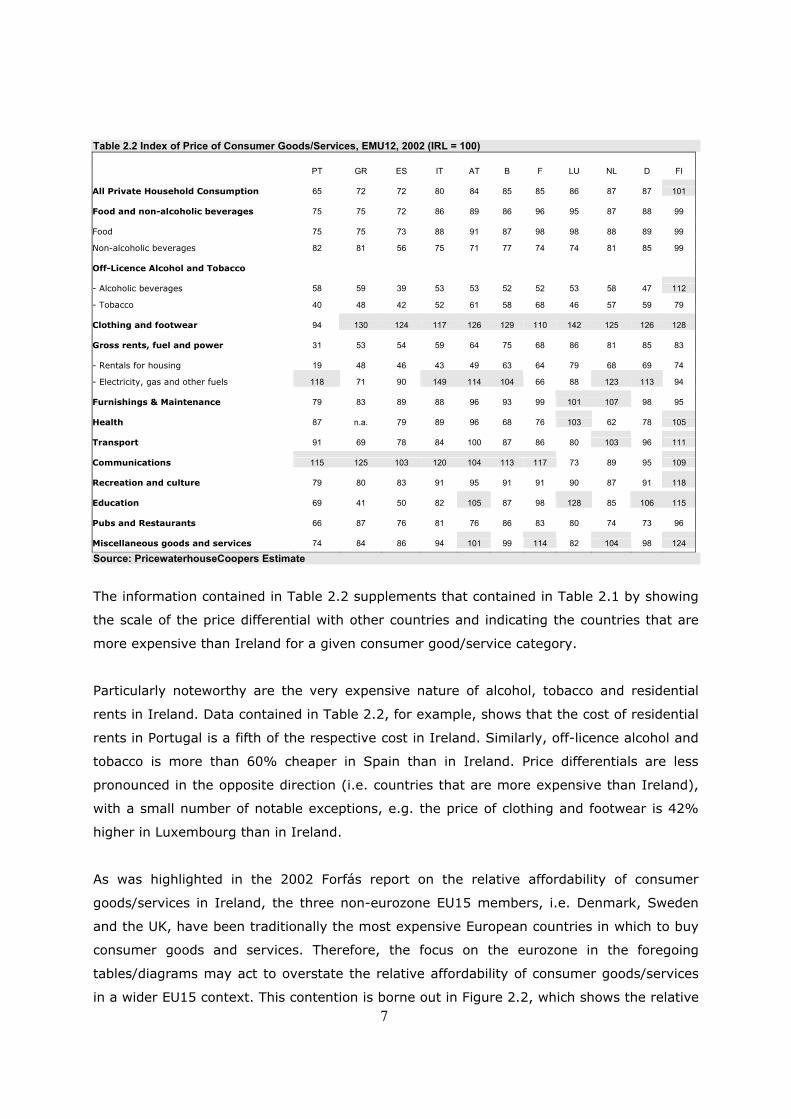
Table 2.2 presents a more detailed look at price differentials between eurozone countries by
broad category of consumer expenditure at end 2002, with shading indicating a country that
is more expensive than Ireland. Again, it should be noted that the data presented in Table
2.2 are PricewaterhouseCoopers estimates, based on the application of 2002 Eurostat
inflation data for the eurozone countries to 2001 Eurostat/PPP comparative price indices.
0 2 0 4 0 6 0 8 0 10 0 12 0
P T
G R
E S
IT
A T
B
F
L U
N L
D
IE
F I
7
Table 2.2 Index of Price of Consumer Goods/Services, EMU12, 2002 (IRL = 100)
PT GR ES IT AT B F LU NL D FI
All Private Household Consumption 65 72 72 80 84 85 85 86 87 87 101
Food and non-alcoholic beverages 75 75 72 86 89 86 96 95 87 88 99
Food 75 75 73 88 91 87 98 98 88 89 99
Non-alcoholic beverages 82 81 56 75 71 77 74 74 81 85 99
Off-Licence Alcohol and Tobacco - Alcoholic beverages 58 59 39 53 53 52 52 53 58 47 112
- Tobacco 40 48 42 52 61 58 68 46 57 59 79
Clothing and footwear 94 130 124 117 126 129 110 142 125 126 128
Gross rents, fuel and power 31 53 54 59 64 75 68 86 81 85 83
- Rentals for housing 19 48 46 43 49 63 64 79 68 69 74
- Electricity, gas and other fuels 118 71 90 149 114 104 66 88 123 113 94
Furnishings & Maintenance 79 83 89 88 96 93 99 101 107 98 95
Health 87 n.a. 79 89 96 68 76 103 62 78 105
Transport 91 69 78 84 100 87 86 80 103 96 111
Communications 115 125 103 120 104 113 117 73 89 95 109
Recreation and culture 79 80 83 91 95 91 91 90 87 91 118
Education 69 41 50 82 105 87 98 128 85 106 115
Pubs and Restaurants 66 87 76 81 76 86 83 80 74 73 96
Miscellaneous goods and services 74 84 86 94 101 99 114 82 104 98 124
Source: PricewaterhouseCoopers Estimate
The information contained in Table 2.2 supplements that contained in Table 2.1 by showing
the scale of the price differential with other countries and indicating the countries that are
more expensive than Ireland for a given consumer good/service category.
Particularly noteworthy are the very expensive nature of alcohol, tobacco and residential
rents in Ireland. Data contained in Table 2.2, for example, shows that the cost of residential
rents in Portugal is a fifth of the respective cost in Ireland. Similarly, off-licence alcohol and
tobacco is more than 60% cheaper in Spain than in Ireland. Price differentials are less
pronounced in the opposite direction (i.e. countries that are more expensive than Ireland),
with a small number of notable exceptions, e.g. the price of clothing and footwear is 42%
higher in Luxembourg than in Ireland.
As was highlighted in the 2002 Forfás report on the relative affordability of consumer
goods/services in Ireland, the three non-eurozone EU15 members, i.e. Denmark, Sweden
and the UK, have been traditionally the most expensive European countries in which to buy
consumer goods and services. Therefore, the focus on the eurozone in the foregoing
tables/diagrams may act to overstate the relative affordability of consumer goods/services
in a wider EU15 context. This contention is borne out in Figure 2.2, which shows the relative
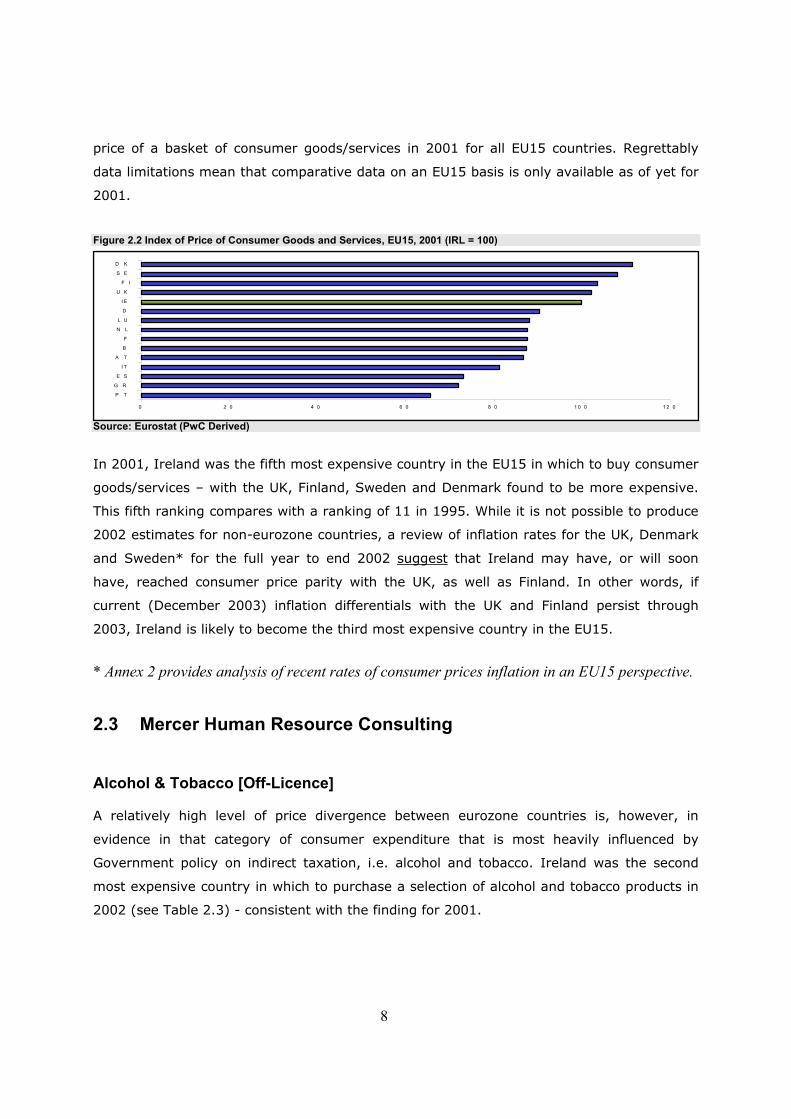
8
price of a basket of consumer goods/services in 2001 for all EU15 countries. Regrettably
data limitations mean that comparative data on an EU15 basis is only available as of yet for
2001.
Figure 2.2 Index of Price of Consumer Goods and Services, EU15, 2001 (IRL = 100)
Source: Eurostat (PwC Derived)
In 2001, Ireland was the fifth most expensive country in the EU15 in which to buy consumer
goods/services – with the UK, Finland, Sweden and Denmark found to be more expensive.
This fifth ranking compares with a ranking of 11 in 1995. While it is not possible to produce
2002 estimates for non-eurozone countries, a review of inflation rates for the UK, Denmark
and Sweden* for the full year to end 2002 suggest that Ireland may have, or will soon
have, reached consumer price parity with the UK, as well as Finland. In other words, if
current (December 2003) inflation differentials with the UK and Finland persist through
2003, Ireland is likely to become the third most expensive country in the EU15.
* Annex 2 provides analysis of recent rates of consumer prices inflation in an EU15 perspective.
2.3 Mercer Human Resource Consulting
Alcohol & Tobacco [Off-Licence] A relatively high level of price divergence between eurozone countries is, however, in
evidence in that category of consumer expenditure that is most heavily influenced by
Government policy on indirect taxation, i.e. alcohol and tobacco. Ireland was the second
most expensive country in which to purchase a selection of alcohol and tobacco products in
2002 (see Table 2.3) - consistent with the finding for 2001.
0 2 0 4 0 6 0 8 0 1 0 0 1 2 0
P T
G R
E S
I T
A T
B
F
N L
L U
D
I E
U K
F I
S E
D K
9
Table 2.3 Relative Cost of Off-Licence Alcohol & Tobacco, 2002 (1 = most expensive in eurozone)
Low-priced Mid-priced High-priced Beer, imported type (0.33 lt) 2 3 3
Wine, good table quality (0.75 lt) 1 1 1
Gin, English imported (0.75 lt) 2 2 2
Cognac, French VSOP (0.75 lt) 3 4 4
Cigarettes (pack of 20 cigarettes) 1 1 1 Total Alcohol and Tobacco 2 2 2 Source: Mercer HR Consulting (PwC Derived)
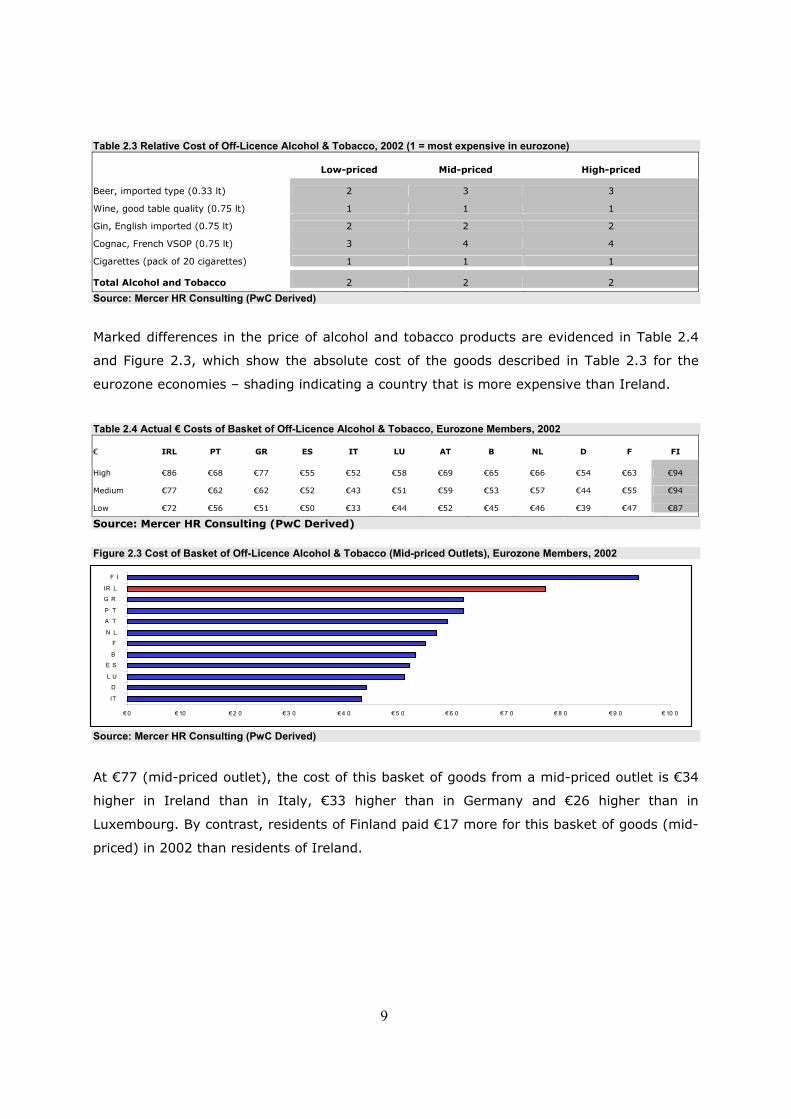
Marked differences in the price of alcohol and tobacco products are evidenced in Table 2.4
and Figure 2.3, which show the absolute cost of the goods described in Table 2.3 for the
eurozone economies – shading indicating a country that is more expensive than Ireland.
Table 2.4 Actual € Costs of Basket of Off-Licence Alcohol & Tobacco, Eurozone Members, 2002
€ IRL PT GR ES IT LU AT B NL D F FI High €86 €68 €77 €55 €52 €58 €69 €65 €66 €54 €63 €94
Medium €77 €62 €62 €52 €43 €51 €59 €53 €57 €44 €55 €94
Low €72 €56 €51 €50 €33 €44 €52 €45 €46 €39 €47 €87 Source: Mercer HR Consulting (PwC Derived)
Figure 2.3 Cost of Basket of Off-Licence Alcohol & Tobacco (Mid-priced Outlets), Eurozone Members, 2002
Source: Mercer HR Consulting (PwC Derived) At €77 (mid-priced outlet), the cost of this basket of goods from a mid-priced outlet is €34
higher in Ireland than in Italy, €33 higher than in Germany and €26 higher than in
Luxembourg. By contrast, residents of Finland paid €17 more for this basket of goods (mid-
priced) in 2002 than residents of Ireland.
€ 0 € 10 € 2 0 € 3 0 € 4 0 € 5 0 € 6 0 € 7 0 € 8 0 € 9 0 € 10 0
IT
D
L U
E S
B
F
N L
A T
P T
G R
IR L
F I
10
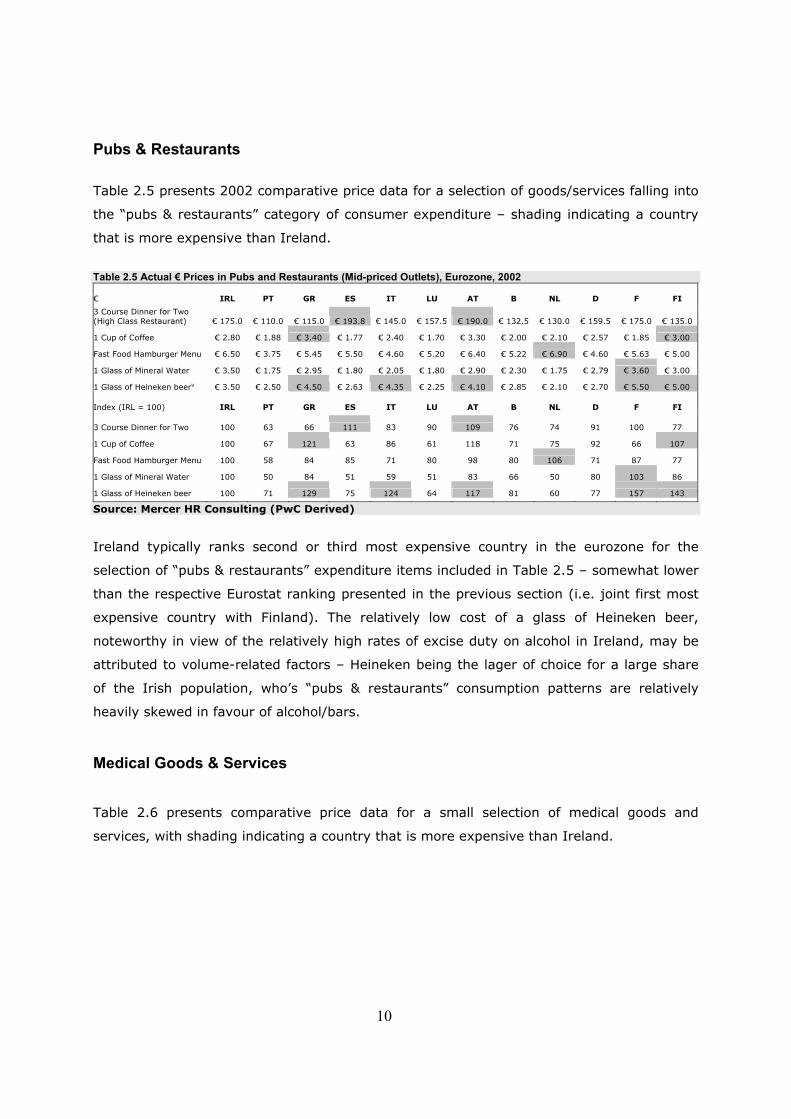
Pubs & Restaurants Table 2.5 presents 2002 comparative price data for a selection of goods/services falling into
the “pubs & restaurants” category of consumer expenditure – shading indicating a country
that is more expensive than Ireland.
Table 2.5 Actual € Prices in Pubs and Restaurants (Mid-priced Outlets), Eurozone, 2002 € IRL PT GR ES IT LU AT B NL D F FI 3 Course Dinner for Two (High Class Restaurant) € 175.0 € 110.0 € 115.0 € 193.8 € 145.0 € 157.5 € 190.0 € 132.5 € 130.0 € 159.5 € 175.0 € 135.0
1 Cup of Coffee € 2.80 € 1.88 € 3.40 € 1.77 € 2.40 € 1.70 € 3.30 € 2.00 € 2.10 € 2.57 € 1.85 € 3.00
Fast Food Hamburger Menu € 6.50 € 3.75 € 5.45 € 5.50 € 4.60 € 5.20 € 6.40 € 5.22 € 6.90 € 4.60 € 5.63 € 5.00
1 Glass of Mineral Water € 3.50 € 1.75 € 2.95 € 1.80 € 2.05 € 1.80 € 2.90 € 2.30 € 1.75 € 2.79 € 3.60 € 3.00
1 Glass of Heineken beerv € 3.50 € 2.50 € 4.50 € 2.63 € 4.35 € 2.25 € 4.10 € 2.85 € 2.10 € 2.70 € 5.50 € 5.00 Index (IRL = 100) IRL PT GR ES IT LU AT B NL D F FI 3 Course Dinner for Two 100 63 66 111 83 90 109 76 74 91 100 77
1 Cup of Coffee 100 67 121 63 86 61 118 71 75 92 66 107
Fast Food Hamburger Menu 100 58 84 85 71 80 98 80 106 71 87 77
1 Glass of Mineral Water 100 50 84 51 59 51 83 66 50 80 103 86
1 Glass of Heineken beer 100 71 129 75 124 64 117 81 60 77 157 143 Source: Mercer HR Consulting (PwC Derived)
Ireland typically ranks second or third most expensive country in the eurozone for the
selection of “pubs & restaurants” expenditure items included in Table 2.5 – somewhat lower
than the respective Eurostat ranking presented in the previous section (i.e. joint first most
expensive country with Finland). The relatively low cost of a glass of Heineken beer,
noteworthy in view of the relatively high rates of excise duty on alcohol in Ireland, may be
attributed to volume-related factors – Heineken being the lager of choice for a large share
of the Irish population, who’s “pubs & restaurants” consumption patterns are relatively
heavily skewed in favour of alcohol/bars.
Medical Goods & Services
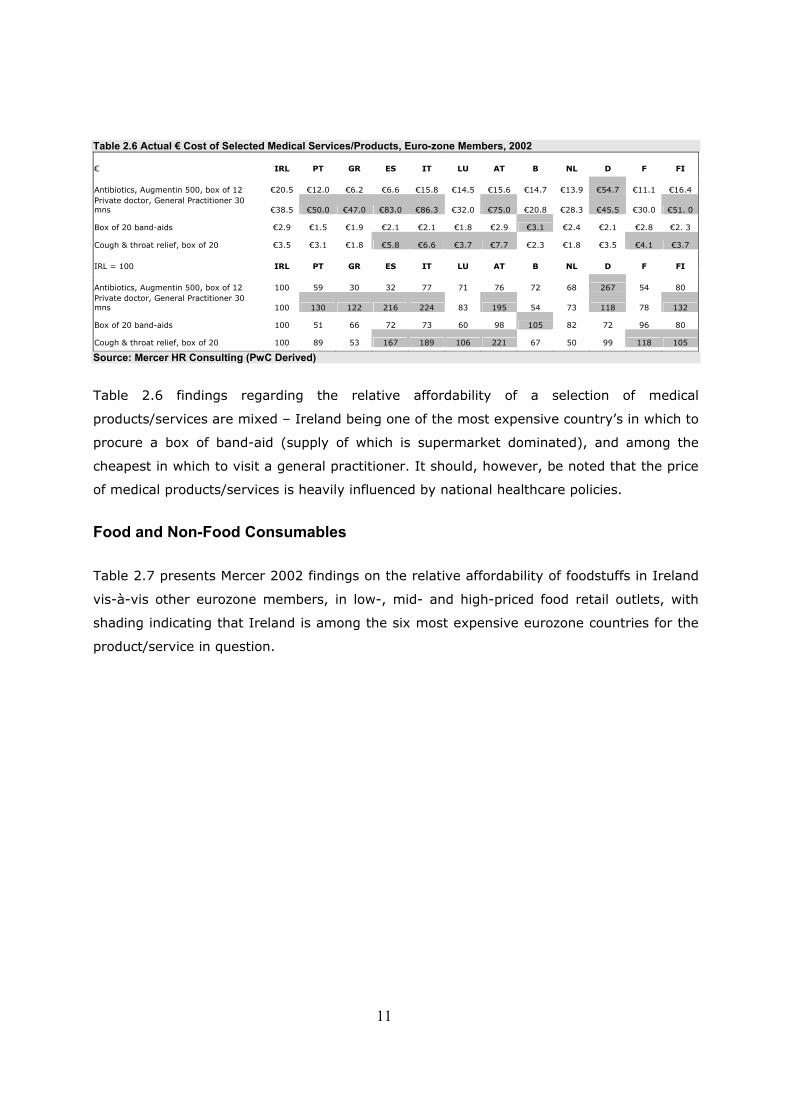
Table 2.6 presents comparative price data for a small selection of medical goods and
services, with shading indicating a country that is more expensive than Ireland.
11
Table 2.6 Actual € Cost of Selected Medical Services/Products, Euro-zone Members, 2002
€ IRL PT GR ES IT LU AT B NL D F FI Antibiotics, Augmentin 500, box of 12 €20.5 €12.0 €6.2 €6.6 €15.8 €14.5 €15.6 €14.7 €13.9 €54.7 €11.1 €16.4 Private doctor, General Practitioner 30 mns €38.5 €50.0 €47.0 €83.0 €86.3 €32.0 €75.0 €20.8 €28.3 €45.5 €30.0 €51. 0
Box of 20 band-aids €2.9 €1.5 €1.9 €2.1 €2.1 €1.8 €2.9 €3.1 €2.4 €2.1 €2.8 €2. 3
Cough & throat relief, box of 20 €3.5 €3.1 €1.8 €5.8 €6.6 €3.7 €7.7 €2.3 €1.8 €3.5 €4.1 €3.7 IRL = 100 IRL PT GR ES IT LU AT B NL D F FI Antibiotics, Augmentin 500, box of 12 100 59 30 32 77 71 76 72 68 267 54 80 Private doctor, General Practitioner 30 mns 100 130 122 216 224 83 195 54 73 118 78 132
Box of 20 band-aids 100 51 66 72 73 60 98 105 82 72 96 80
Cough & throat relief, box of 20 100 89 53 167 189 106 221 67 50 99 118 105 Source: Mercer HR Consulting (PwC Derived)
Table 2.6 findings regarding the relative affordability of a selection of medical
products/services are mixed – Ireland being one of the most expensive country’s in which to
procure a box of band-aid (supply of which is supermarket dominated), and among the
cheapest in which to visit a general practitioner. It should, however, be noted that the price
of medical products/services is heavily influenced by national healthcare policies.
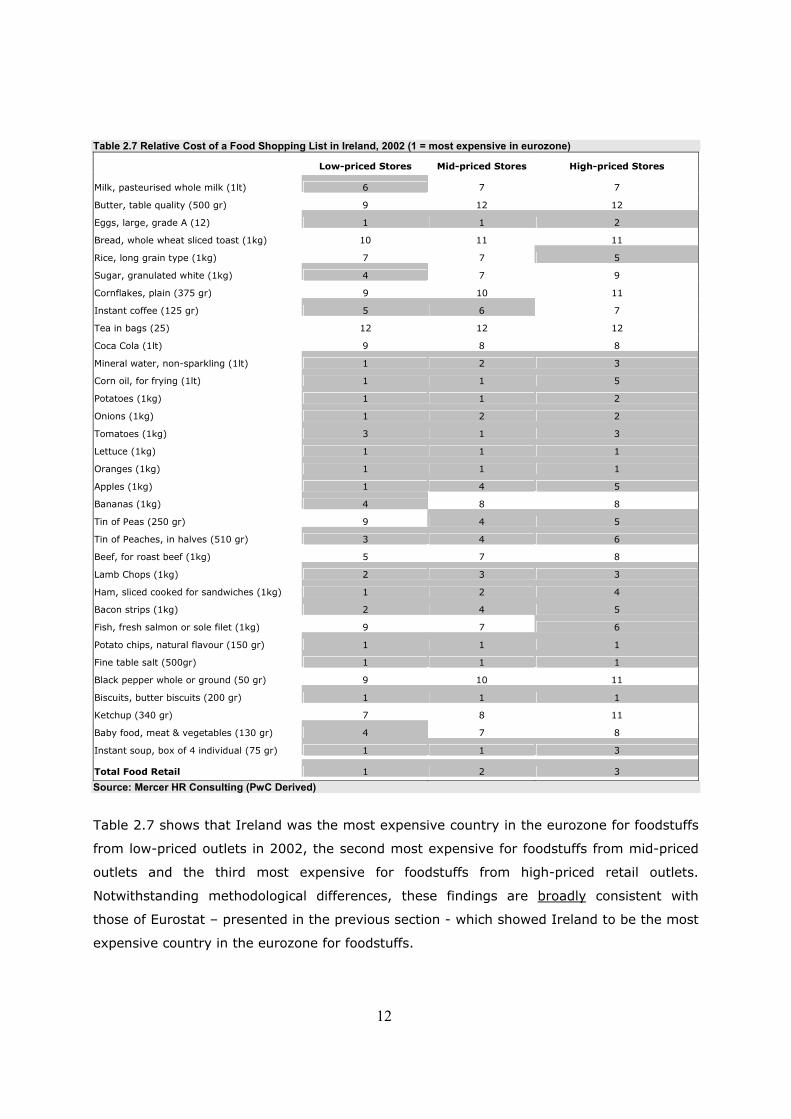
Food and Non-Food Consumables Table 2.7 presents Mercer 2002 findings on the relative affordability of foodstuffs in Ireland
vis-à-vis other eurozone members, in low-, mid- and high-priced food retail outlets, with
shading indicating that Ireland is among the six most expensive eurozone countries for the
product/service in question.
12
Table 2.7 Relative Cost of a Food Shopping List in Ireland, 2002 (1 = most expensive in eurozone)
Low-priced Stores Mid-priced Stores High-priced Stores Milk, pasteurised whole milk (1lt) 6 7 7
Butter, table quality (500 gr) 9 12 12
Eggs, large, grade A (12) 1 1 2
Bread, whole wheat sliced toast (1kg) 10 11 11
Rice, long grain type (1kg) 7 7 5
Sugar, granulated white (1kg) 4 7 9
Cornflakes, plain (375 gr) 9 10 11
Instant coffee (125 gr) 5 6 7
Tea in bags (25) 12 12 12
Coca Cola (1lt) 9 8 8
Mineral water, non-sparkling (1lt) 1 2 3
Corn oil, for frying (1lt) 1 1 5
Potatoes (1kg) 1 1 2
Onions (1kg) 1 2 2
Tomatoes (1kg) 3 1 3
Lettuce (1kg) 1 1 1
Oranges (1kg) 1 1 1
Apples (1kg) 1 4 5
Bananas (1kg) 4 8 8
Tin of Peas (250 gr) 9 4 5
Tin of Peaches, in halves (510 gr) 3 4 6
Beef, for roast beef (1kg) 5 7 8
Lamb Chops (1kg) 2 3 3
Ham, sliced cooked for sandwiches (1kg) 1 2 4
Bacon strips (1kg) 2 4 5
Fish, fresh salmon or sole filet (1kg) 9 7 6
Potato chips, natural flavour (150 gr) 1 1 1
Fine table salt (500gr) 1 1 1
Black pepper whole or ground (50 gr) 9 10 11
Biscuits, butter biscuits (200 gr) 1 1 1
Ketchup (340 gr) 7 8 11
Baby food, meat & vegetables (130 gr) 4 7 8
Instant soup, box of 4 individual (75 gr) 1 1 3 Total Food Retail 1 2 3 Source: Mercer HR Consulting (PwC Derived)
Table 2.7 shows that Ireland was the most expensive country in the eurozone for foodstuffs
from low-priced outlets in 2002, the second most expensive for foodstuffs from mid-priced
outlets and the third most expensive for foodstuffs from high-priced retail outlets.
Notwithstanding methodological differences, these findings are broadly consistent with
those of Eurostat – presented in the previous section - which showed Ireland to be the most
expensive country in the eurozone for foodstuffs.
13
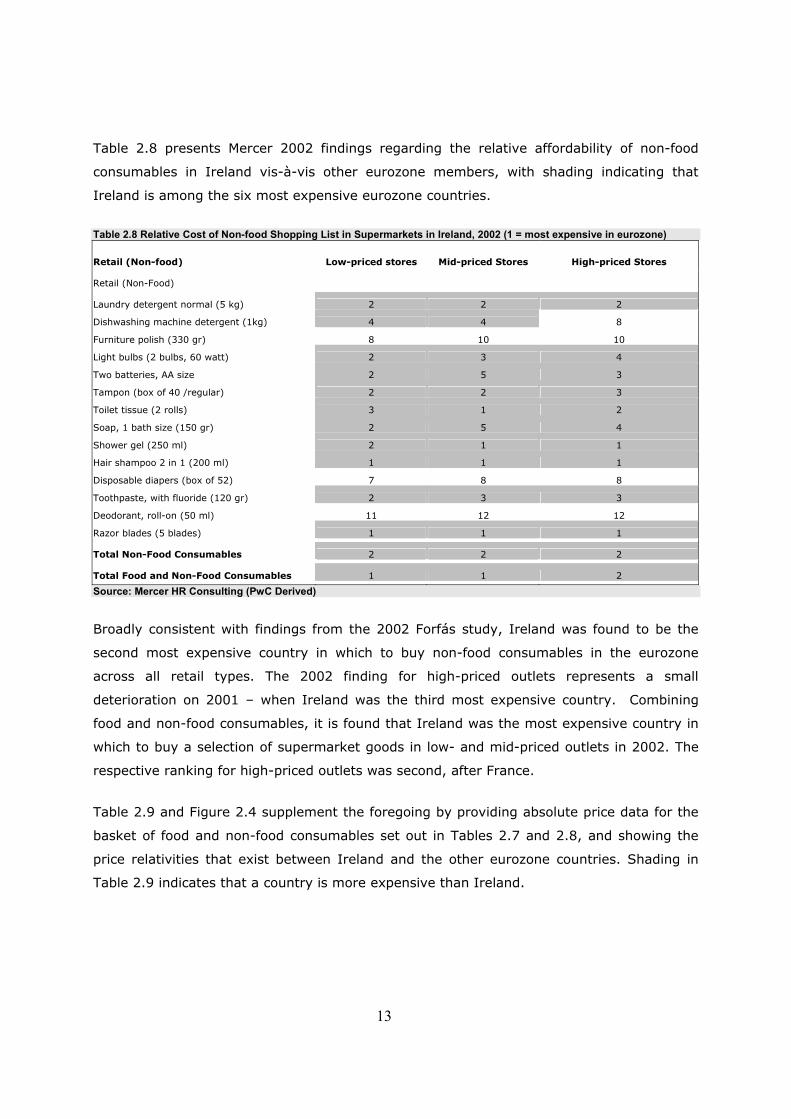
Table 2.8 presents Mercer 2002 findings regarding the relative affordability of non-food
consumables in Ireland vis-à-vis other eurozone members, with shading indicating that
Ireland is among the six most expensive eurozone countries.
Table 2.8 Relative Cost of Non-food Shopping List in Supermarkets in Ireland, 2002 (1 = most expensive in eurozone)
Retail (Non-food) Low-priced stores Mid-priced Stores High-priced Stores Retail (Non-Food) Laundry detergent normal (5 kg) 2 2 2
Dishwashing machine detergent (1kg) 4 4 8
Furniture polish (330 gr) 8 10 10
Light bulbs (2 bulbs, 60 watt) 2 3 4
Two batteries, AA size 2 5 3
Tampon (box of 40 /regular) 2 2 3
Toilet tissue (2 rolls) 3 1 2
Soap, 1 bath size (150 gr) 2 5 4
Shower gel (250 ml) 2 1 1
Hair shampoo 2 in 1 (200 ml) 1 1 1
Disposable diapers (box of 52) 7 8 8
Toothpaste, with fluoride (120 gr) 2 3 3
Deodorant, roll-on (50 ml) 11 12 12
Razor blades (5 blades) 1 1 1 Total Non-Food Consumables 2 2 2 Total Food and Non-Food Consumables 1 1 2 Source: Mercer HR Consulting (PwC Derived)
Broadly consistent with findings from the 2002 Forfás study, Ireland was found to be the
second most expensive country in which to buy non-food consumables in the eurozone
across all retail types. The 2002 finding for high-priced outlets represents a small
deterioration on 2001 – when Ireland was the third most expensive country. Combining
food and non-food consumables, it is found that Ireland was the most expensive country in
which to buy a selection of supermarket goods in low- and mid-priced outlets in 2002. The
respective ranking for high-priced outlets was second, after France.
Table 2.9 and Figure 2.4 supplement the foregoing by providing absolute price data for the
basket of food and non-food consumables set out in Tables 2.7 and 2.8, and showing the
price relativities that exist between Ireland and the other eurozone countries. Shading in
Table 2.9 indicates that a country is more expensive than Ireland.
14
Table 2.9 Prices of a Basket of Supermarket Consumables, Eurozone, 2002
All Food Retail € IRL PT GR ES IT LU AT B NL D F FI High € 162.7 € 122.7 € 112.5 € 126.6 € 139.8 € 165.8 € 154.8 € 161.2 € 139.4 € 155.4 € 175.0 € 116.7
Medium € 137.8 € 102.0 € 95.5 € 117.2 € 119.3 € 134.5 € 124.7 € 127.9 € 117.6 € 120.2 € 146.2 € 105.1
Low € 123.9 € 92.4 € 80.6 € 111.1 € 105.8 € 100.9 € 97.7 € 104.1 € 104.1 € 96.3 € 108.2 € 89.0 IRL = 100 IRL PT GR ES IT LU AT B NL D F FI
High 100 75 69 78 86 102 95 99 86 95 108 72
Medium 100 74 69 85 87 98 90 93 85 87 106 76
Low 100 75 65 90 85 81 79 84 84 78 87 72
All Retail Supermarkets € IRL PT GR ES IT LU AT B NL D F FI
High € 253.9 € 201.7 € 221.8 € 192.3 € 214.4 € 245.3 € 235.5 € 244.1 € 222.8 € 224.0 € 257.6 € 190.0
Medium € 217.6 € 169.1 € 191.4 € 176.6 € 185.7 € 201.2 € 197.0 € 196.5 € 185.5 € 176.6 € 217.3 € 170.7
Low € 190.7 € 148.2 € 161.0 € 165.6 € 161.9 € 158.5 € 155.3 € 162.2 € 156.5 € 145.5 € 163.6 € 148.1 IRL = 100 IRL PT GR ES IT LU AT B NL D F FI
High 100 79 87 76 84 97 93 96 88 88 101 75
Medium 100 78 88 81 85 92 91 90 85 81 100 78
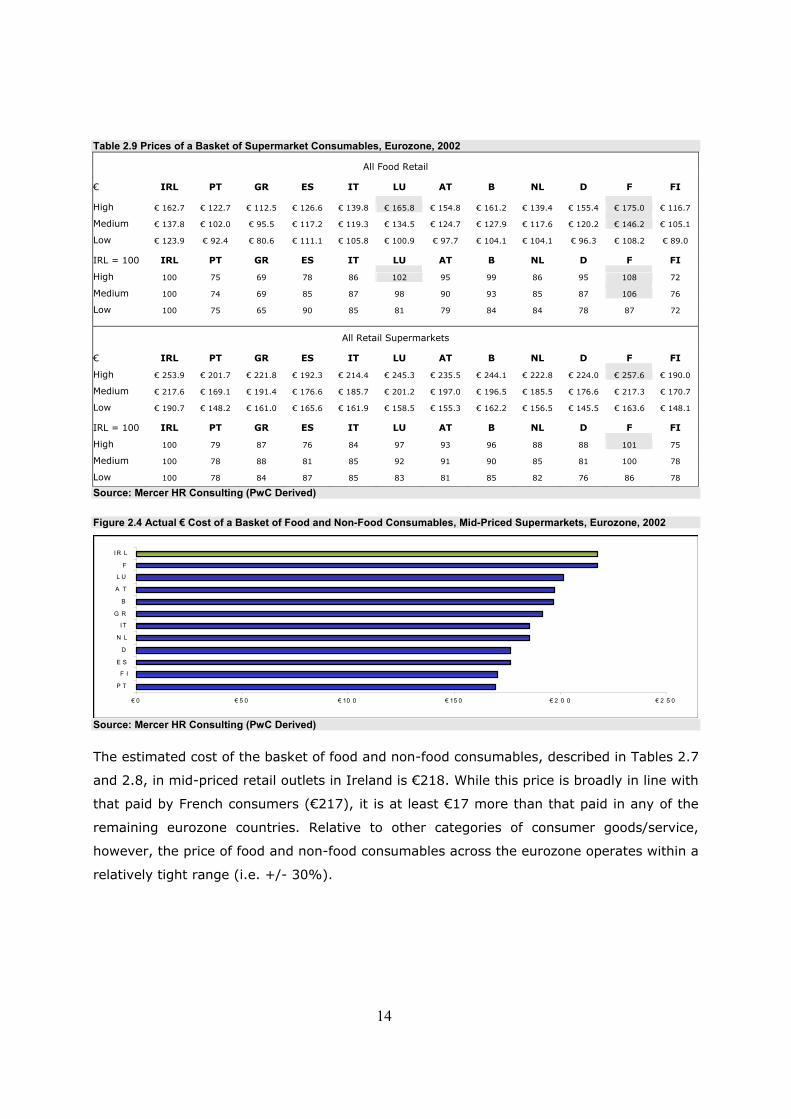
Low 100 78 84 87 85 83 81 85 82 76 86 78 Source: Mercer HR Consulting (PwC Derived) Figure 2.4 Actual € Cost of a Basket of Food and Non-Food Consumables, Mid-Priced Supermarkets, Eurozone, 2002
Source: Mercer HR Consulting (PwC Derived) The estimated cost of the basket of food and non-food consumables, described in Tables 2.7
and 2.8, in mid-priced retail outlets in Ireland is €218. While this price is broadly in line with
that paid by French consumers (€217), it is at least €17 more than that paid in any of the
remaining eurozone countries. Relative to other categories of consumer goods/service,
however, the price of food and non-food consumables across the eurozone operates within a
relatively tight range (i.e. +/- 30%).
€ 0 € 5 0 € 10 0 € 15 0 € 2 0 0 € 2 5 0
P T
F I
E S
D
N L
IT
G R
B
A T
L U
F
IR L
15
2.4 European Commission
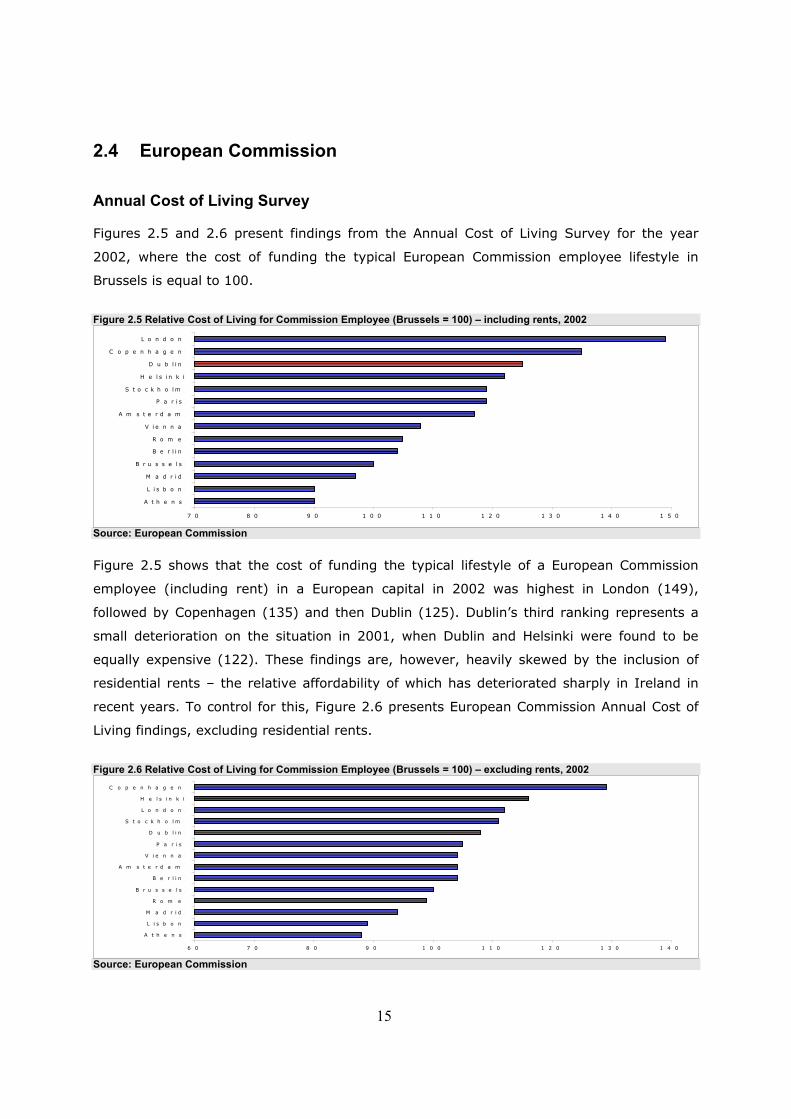
Annual Cost of Living Survey Figures 2.5 and 2.6 present findings from the Annual Cost of Living Survey for the year
2002, where the cost of funding the typical European Commission employee lifestyle in
Brussels is equal to 100.
Figure 2.5 Relative Cost of Living for Commission Employee (Brussels = 100) – including rents, 2002
Source: European Commission Figure 2.5 shows that the cost of funding the typical lifestyle of a European Commission
employee (including rent) in a European capital in 2002 was highest in London (149),
followed by Copenhagen (135) and then Dublin (125). Dublin’s third ranking represents a
small deterioration on the situation in 2001, when Dublin and Helsinki were found to be
equally expensive (122). These findings are, however, heavily skewed by the inclusion of
residential rents – the relative affordability of which has deteriorated sharply in Ireland in
recent years. To control for this, Figure 2.6 presents European Commission Annual Cost of
Living findings, excluding residential rents.
Figure 2.6 Relative Cost of Living for Commission Employee (Brussels = 100) – excluding rents, 2002
Source: European Commission
7 0 8 0 9 0 1 0 0 1 1 0 1 2 0 1 3 0 1 4 0 1 5 0
A t h e n s
L i s b o n
M a d r i d
B r u s s e l s
B e r l i n
R o m e
V i e n n a
A m s t e r d a m
P a r i s
S t o c k h o l m
H e l s i n k i
D u b l i n
C o p e n h a g e n
L o n d o n
6 0 7 0 8 0 9 0 1 0 0 1 1 0 1 2 0 1 3 0 1 4 0
A t h e n s
L i s b o n
M a d r i d
R o m e
B r u s s e l s
B e r l i n
A m s t e r d a m
V i e n n a
P a r i s
D u b l i n
S t o c k h o l m
L o n d o n
H e l s i n k i
C o p e n h a g e n
16
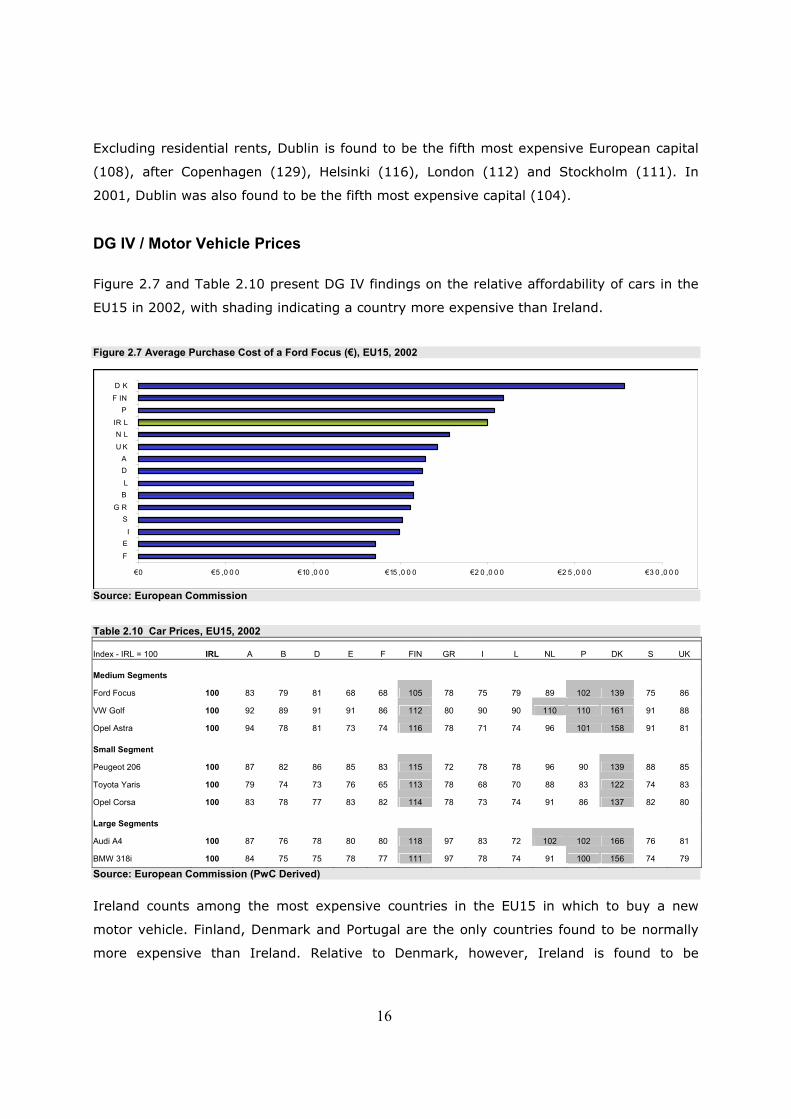
Excluding residential rents, Dublin is found to be the fifth most expensive European capital
(108), after Copenhagen (129), Helsinki (116), London (112) and Stockholm (111). In
2001, Dublin was also found to be the fifth most expensive capital (104).
DG IV / Motor Vehicle Prices
Figure 2.7 and Table 2.10 present DG IV findings on the relative affordability of cars in the
EU15 in 2002, with shading indicating a country more expensive than Ireland.
Figure 2.7 Average Purchase Cost of a Ford Focus (€), EU15, 2002
Source: European Commission
Table 2.10 Car Prices, EU15, 2002
Index - IRL = 100 IRL A B D E F FIN GR I L NL P DK S UK
Medium Segments
Ford Focus 100 83 79 81 68 68 105 78 75 79 89 102 139 75 86
VW Golf 100 92 89 91 91 86 112 80 90 90 110 110 161 91 88
Opel Astra 100 94 78 81 73 74 116 78 71 74 96 101 158 91 81
Small Segment
Peugeot 206 100 87 82 86 85 83 115 72 78 78 96 90 139 88 85
Toyota Yaris 100 79 74 73 76 65 113 78 68 70 88 83 122 74 83
Opel Corsa 100 83 78 77 83 82 114 78 73 74 91 86 137 82 80
Large Segments
Audi A4 100 87 76 78 80 80 118 97 83 72 102 102 166 76 81
BMW 318i 100 84 75 75 78 77 111 97 78 74 91 100 156 74 79
Source: European Commission (PwC Derived) Ireland counts among the most expensive countries in the EU15 in which to buy a new
motor vehicle. Finland, Denmark and Portugal are the only countries found to be normally
more expensive than Ireland. Relative to Denmark, however, Ireland is found to be
€ 0 € 5 ,0 0 0 € 10 ,0 0 0 € 15 ,0 0 0 € 2 0 ,0 0 0 € 2 5 ,0 0 0 € 3 0 ,0 0 0
F
EI
SG R
BL
DA
U KN L
IR LP
F IND K
17
relatively cheap for certain types of car – the Audi A4, for example, costing €56,309 new in
Denmark compared with €33,883 in Ireland.
These findings are consistent with those for 2001, presented in the 2002 Forfás report.
18
Chapter 3 Analysis of National Drivers of Inflation
Summary of Chapter Findings
This chapter presents a high level analysis of the underlying drivers of consumer price inflation in Ireland for the 12 and 36-month periods to end January 2003. Key findings are the following: • an analysis of 12 and 36-month inflation to end January 2003 shows the non-traded
sector to be the primary driver of consumer price inflation in Ireland. The 12-month analysis showed the non-traded sector accounted for 67% of national inflation compared with a national consumer expenditure share of 52%. The respective contribution in the 36-month analysis was 73% - indicating some convergence of rates of inflation in the traded sector on those in the non-traded sector. This, in spite of the fact that the € has been appreciating against Sterling and the US$ in recent months;
• an examination of the products/services driving inflation in the government-influenced
category of spend, found that excisable goods (e.g. alcohol) accounted for the greatest share of the “government-influenced” category’s contribution (i.e. 41% of 59%) to national inflation in the 12 months to end January 2003. However, relatively modest changes in rates of excise in recent budgets – tobacco being the obvious exception – suggested to the consultants that this significantly overstated the role of Government, i.e. market forces were also driving prices;
• this view was confirmed by a closer examination of the excise provisions of Budgets
2001, 2002 and 2003, which showed that certain of the most important excisable products (e.g. beer) had not been subject to any excise change in the 36 month period under review. Excluding these products from the analysis, the contribution of excisable products to “government-influenced” inflation fell from 41% to 30% in the 12 months to end January 2003. Similarly, it was found that, even in the case of excisable products that had been subject to an increase, the excise change rarely accounted for close to the full amount of the inflation contribution, i.e. independent pricing decisions by product suppliers played an important contributory role;
• price increases in state provided services are, however, almost entirely within the
control of the public sector. In the 12 months to end January 2003, the price of state provided services to the final consumer grew by an estimated 15%, compared with national inflation of 4.8%. Increases in the price of hospital services, motor taxation and third-level education were the most significant drivers of inflation in this category, which contributed 7% to national inflation in the 12 month period under review, compared with an expenditure share of just 2%;
19
Summary of Chapter Findings – cont’d • the price of government-regulated services (e.g. rail transport) grew by 7.2%
in the 12-month review period and by 17.4% in the 36-month review period, resulting in contributions to national inflation of 10.6% and 7.8% respectively. The largest share of the 12 month contribution (i.e. 5.4%) was accounted for by Government approval of an 18% increase in the price of VHI health insurance in September 2002;
• all in all, the analysis contained in this chapter lends support estimates that the
Irish public service accounted for between 30% and 40% (equivalent to between 1.4% and 1.9% of total 4.8%) of the increase in consumer prices experienced in the year to end January 2003. The Central Bank in its Spring Bulletin Report 2003 estimates that government added around 1.5% to overall inflation in the period under review.
• an analysis of COICOP 1 level drivers of national inflation found the “pubs &
restaurants” category of expenditure to be consistently the most important driver of national inflation – accounting for nearly 30% of the increase in the price of the standard basket of consumer goods/services in the year to end January 2003.
• combined with alcoholic beverages and tobacco (19%), transport (16%), and
miscellaneous goods & services (15%), these categories of expenditure accounted for 80% of national inflation in the single-year analysis. The respective share for the three-year analysis was lower at 56% - reflecting a slow-down in the rate of inflation in the housing expenditure category in the past 12 months;
• a COICOP 2-level analysis of the top drivers of 12 month inflation supported
COICOP 1 level findings – catering services (i.e. pubs) emerging as the single largest COICOP 2 level contributor (26%), followed by tobacco (13%), insurance (10%) and the operation of personal transport equipment, e.g. petrol (9%);
• similarly, a COICOP 2-level 12 month analysis of the products/services displaying
the highest rates of inflation (which has no regard to expenditure share) found financial services to have experienced the largest price increase in the period (23.3%), followed by hospital services (19.3%), water supply & refuse services (19.3%), tobacco (13.7%) and third-level education (12.1%). A prevalence of government-influenced products/services is evident;
• finally, Irish inflation for the periods under review was the highest of any EU15
country – with an analysis of inflation to year end 2002 showing exceptionally high rates of inflation in the “alcohol & tobacco”, “education”, “pubs & restaurants” and “miscellaneous goods & services” categories of expenditure.

20
3.1 Introduction This chapter presents a detailed analysis of Irish consumer price inflation in the period
January 2000 to January 2003, and places consumer price developments in this period in a
wider EU15 context. The remainder of this chapter comprises two main sections. Section 3.2
presents a detailed analysis of consumer price inflation in Ireland, while Section 3.3 places
this analysis in a wider EU15 context.
3.2 Consumer Price Inflation (CPI), 2000 to 2003 COICOPs Explained This section presents a detailed analysis of consumer price inflation in Ireland in the periods
January 2002 to January 2003 (i.e. 12 month inflation), and January 2000 to January 2003
(i.e. 36 month inflation). In advance of doing so, however, it is worthwhile explaining the
“COICOP” system on which the national system for measuring CPI is based.
The aggregate national rate of consumer price inflation is derived from very detailed price
information at individual product/service level, which is collected monthly by the CSO.
Consumer products and services are organised into COICOPs (Classification of Individual
Consumption by Purpose), which are assigned expenditure weights derived from the CSO’s
Household Budget Survey.
There are five distinct COICOP levels, the highest of which (i.e. COICOP 1) relates to a very
general expenditure category (e.g. “food & non-alcoholic beverages”) and the lowest of
which (i.e. COICOP 5) can pertain to a very precise product/service, e.g. apples. An
example of a CSO COICOP structure is provided in Table 3.1.
21
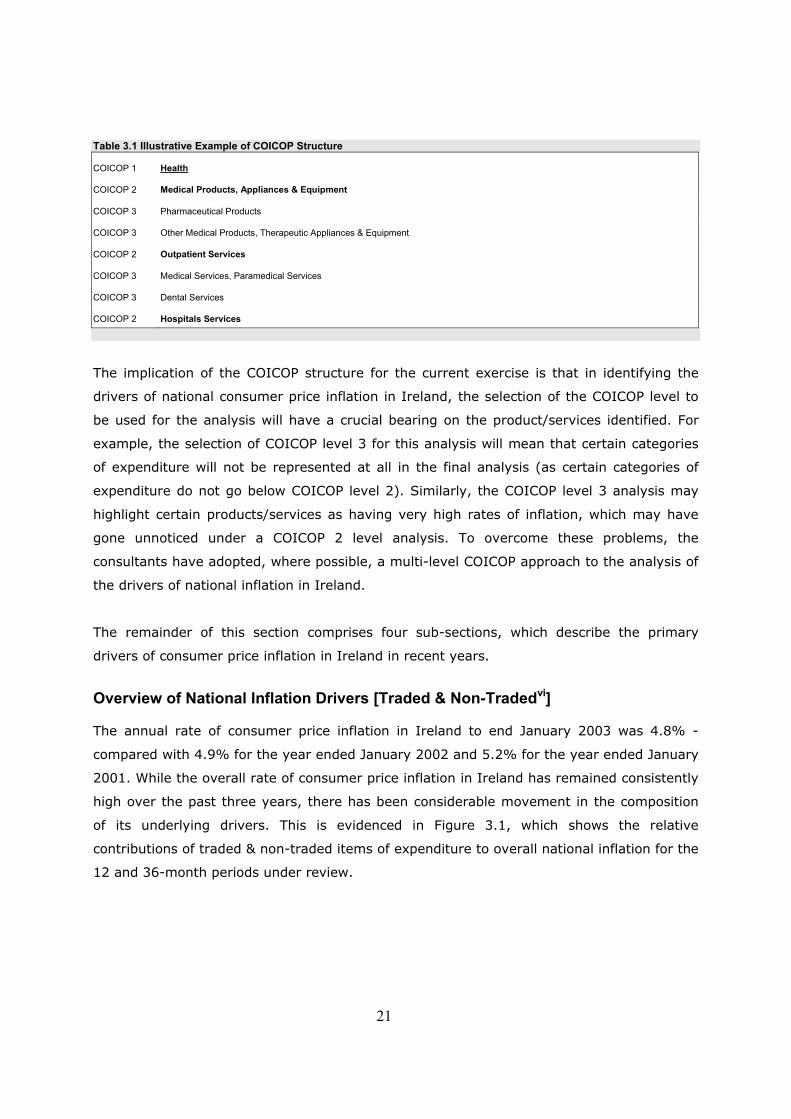
Table 3.1 Illustrative Example of COICOP Structure
COICOP 1 Health
COICOP 2 Medical Products, Appliances & Equipment
COICOP 3 Pharmaceutical Products
COICOP 3 Other Medical Products, Therapeutic Appliances & Equipment
COICOP 2 Outpatient Services
COICOP 3 Medical Services, Paramedical Services
COICOP 3 Dental Services
COICOP 2 Hospitals Services
The implication of the COICOP structure for the current exercise is that in identifying the
drivers of national consumer price inflation in Ireland, the selection of the COICOP level to
be used for the analysis will have a crucial bearing on the product/services identified. For
example, the selection of COICOP level 3 for this analysis will mean that certain categories
of expenditure will not be represented at all in the final analysis (as certain categories of
expenditure do not go below COICOP level 2). Similarly, the COICOP level 3 analysis may
highlight certain products/services as having very high rates of inflation, which may have
gone unnoticed under a COICOP 2 level analysis. To overcome these problems, the
consultants have adopted, where possible, a multi-level COICOP approach to the analysis of
the drivers of national inflation in Ireland.
The remainder of this section comprises four sub-sections, which describe the primary
drivers of consumer price inflation in Ireland in recent years.
Overview of National Inflation Drivers [Traded & Non-Tradedvi] The annual rate of consumer price inflation in Ireland to end January 2003 was 4.8% -
compared with 4.9% for the year ended January 2002 and 5.2% for the year ended January
2001. While the overall rate of consumer price inflation in Ireland has remained consistently
high over the past three years, there has been considerable movement in the composition
of its underlying drivers. This is evidenced in Figure 3.1, which shows the relative
contributions of traded & non-traded items of expenditure to overall national inflation for the
12 and 36-month periods under review.
22
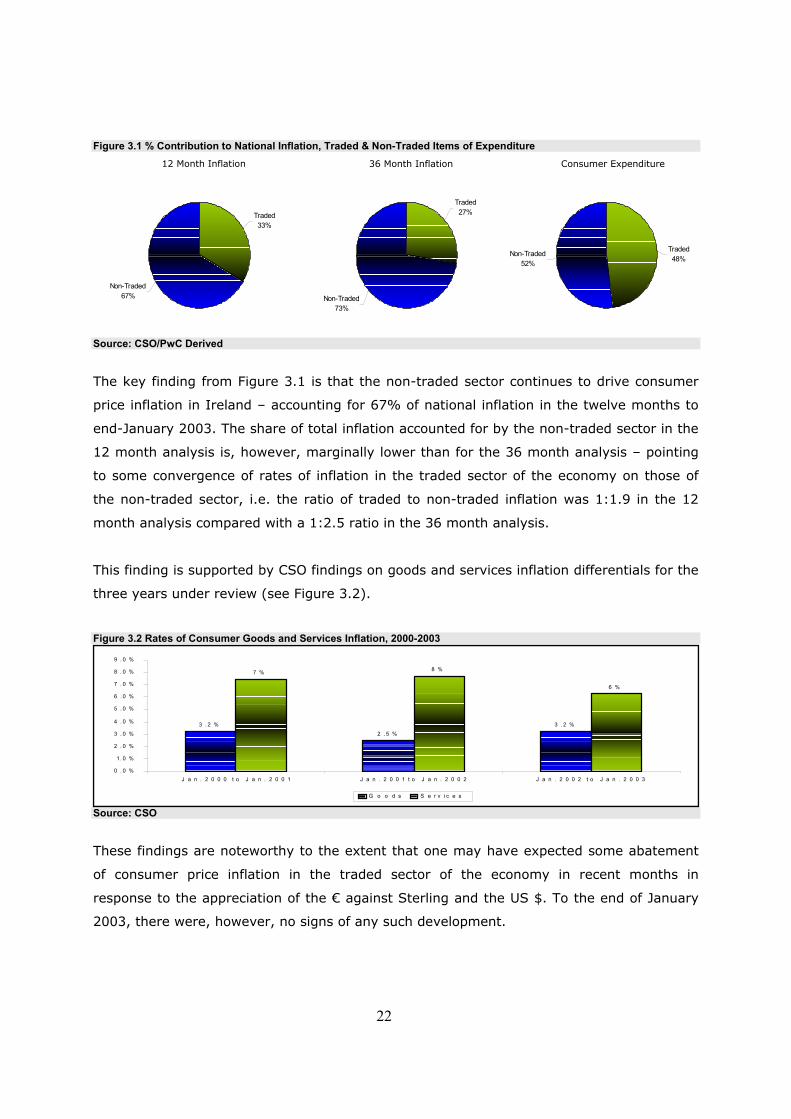
Figure 3.1 % Contribution to National Inflation, Traded & Non-Traded Items of Expenditure
Source: CSO/PwC Derived
The key finding from Figure 3.1 is that the non-traded sector continues to drive consumer
price inflation in Ireland – accounting for 67% of national inflation in the twelve months to
end-January 2003. The share of total inflation accounted for by the non-traded sector in the
12 month analysis is, however, marginally lower than for the 36 month analysis – pointing
to some convergence of rates of inflation in the traded sector of the economy on those of
the non-traded sector, i.e. the ratio of traded to non-traded inflation was 1:1.9 in the 12
month analysis compared with a 1:2.5 ratio in the 36 month analysis.
This finding is supported by CSO findings on goods and services inflation differentials for the
three years under review (see Figure 3.2).
Figure 3.2 Rates of Consumer Goods and Services Inflation, 2000-2003
Source: CSO
These findings are noteworthy to the extent that one may have expected some abatement
of consumer price inflation in the traded sector of the economy in recent months in
response to the appreciation of the € against Sterling and the US $. To the end of January
2003, there were, however, no signs of any such development.
Non-Traded67%
Traded33%
Non-Traded73%
Traded27%
Non-Traded52%
Traded48%
12 Month Inflation 36 Month Inflation Consumer Expenditure
3 . 2 %2 . 5 %
3 . 2 %
7 % 8 %
6 %
0 . 0 %
1. 0 %
2 . 0 %
3 . 0 %
4 . 0 %
5 . 0 %
6 . 0 %
7 . 0 %
8 . 0 %
9 . 0 %
J a n . 2 0 0 0 t o J a n . 2 0 0 1 J a n . 2 0 0 1 t o J a n . 2 0 0 2 J a n . 2 0 0 2 t o J a n . 2 0 0 3
G o o d s S e r v i c e s
23
Overview of National Inflation Drivers [Government-influenced]
This section seeks to determine the relative contributions of government-influenced
categories of consumer expenditure to national inflation in the period 2000-2003.
Determining Government’s influence on the national rate of inflation is not a straightforward
task, to the extent that Government can directly (e.g. VAT) or indirectly (e.g. corporate tax
rates) influence the price of any given consumer product/service. There are, however,
certain products/services where Government can exert a particularly strong influence on
price. Products or services falling into this category include:
• services provided and priced directly by the public sector, e.g. hospital services;
• products/services where Government approval is required if a price increase is to
be effected, e.g. electricity;
• products/services where Government policy in the area of indirect taxation (i.e.
excise duty) has a crucial bearing on the price to the consumer, e.g. tobacco.
Table 3.2 shows the contribution of those categories of consumer good/service, price
developments in which are subject to some level of Government influence, to national
inflation for the 12 and 36 periods under review.
24
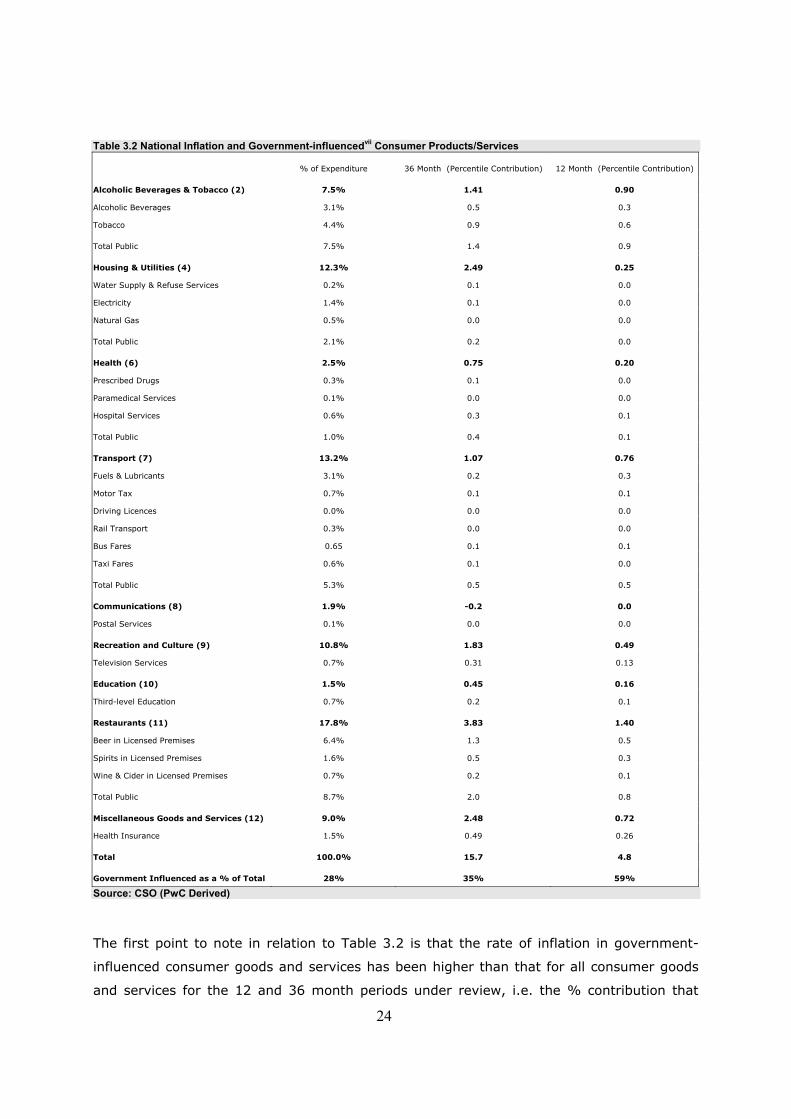
Table 3.2 National Inflation and Government-influencedvii Consumer Products/Services
% of Expenditure 36 Month (Percentile Contribution) 12 Month (Percentile Contribution) Alcoholic Beverages & Tobacco (2) 7.5% 1.41 0.90
Alcoholic Beverages 3.1% 0.5 0.3
Tobacco 4.4% 0.9 0.6 Total Public 7.5% 1.4 0.9 Housing & Utilities (4) 12.3% 2.49 0.25
Water Supply & Refuse Services 0.2% 0.1 0.0
Electricity 1.4% 0.1 0.0
Natural Gas 0.5% 0.0 0.0 Total Public 2.1% 0.2 0.0 Health (6) 2.5% 0.75 0.20
Prescribed Drugs 0.3% 0.1 0.0
Paramedical Services 0.1% 0.0 0.0
Hospital Services 0.6% 0.3 0.1 Total Public 1.0% 0.4 0.1 Transport (7) 13.2% 1.07 0.76
Fuels & Lubricants 3.1% 0.2 0.3
Motor Tax 0.7% 0.1 0.1
Driving Licences 0.0% 0.0 0.0
Rail Transport 0.3% 0.0 0.0
Bus Fares 0.65 0.1 0.1
Taxi Fares 0.6% 0.1 0.0 Total Public 5.3% 0.5 0.5 Communications (8) 1.9% -0.2 0.0
Postal Services 0.1% 0.0 0.0 Recreation and Culture (9) 10.8% 1.83 0.49
Television Services 0.7% 0.31 0.13 Education (10) 1.5% 0.45 0.16
Third-level Education 0.7% 0.2 0.1 Restaurants (11) 17.8% 3.83 1.40
Beer in Licensed Premises 6.4% 1.3 0.5
Spirits in Licensed Premises 1.6% 0.5 0.3
Wine & Cider in Licensed Premises 0.7% 0.2 0.1 Total Public 8.7% 2.0 0.8 Miscellaneous Goods and Services (12) 9.0% 2.48 0.72
Health Insurance 1.5% 0.49 0.26 Total 100.0% 15.7 4.8 Government Influenced as a % of Total 28% 35% 59% Source: CSO (PwC Derived) The first point to note in relation to Table 3.2 is that the rate of inflation in government-
influenced consumer goods and services has been higher than that for all consumer goods
and services for the 12 and 36 month periods under review, i.e. the % contribution that
25
these goods/services have made to national inflation is greater than their share of national
consumer spend. This differential has been particularly pronounced in the past 12 months
with government-influenced goods/services accounting for more than half of national
consumer price inflation (59%), compared with a national expenditure share of just 28%. In
other words, the rate of increase in the price of all government-influenced products/services
over the 12-month period (10%) was more than twice the national average (4.8%).
However this figure needs to be treated with severe caution.
It is, however, important to emphasise that the level of Government influence varies
considerably across the products/services included in Table 3.2. In the case of alcohol and
tobacco, for example, price increases are determined not alone by Government decisions
regarding rates of excise, rather are heavily influenced by the independent pricing
decisions of product suppliers. By contrast, the price of directly provided public services
(e.g. hospital services) is largely within the control of Government. The implication of this
is that the figures presented in Table 3.1 overstate Government’s actual
contribution to national inflation in recent years. To partially compensate for this,
Table 3.3 presents an analysis of the contribution of government-influenced
consumer products/services to national inflation, distinguishing between the
following:
• goods/services where the public sector directly determines price levels;
• goods/services where price changes are subject to Government approval;
• consumer goods which are subject to excise duties;
• consumer goods, levels of excise on which increased in the past 3 years.
Rates of price inflation within these categories of government-influenced expenditure are
compared with national inflation figures in Figure 3.3.
26
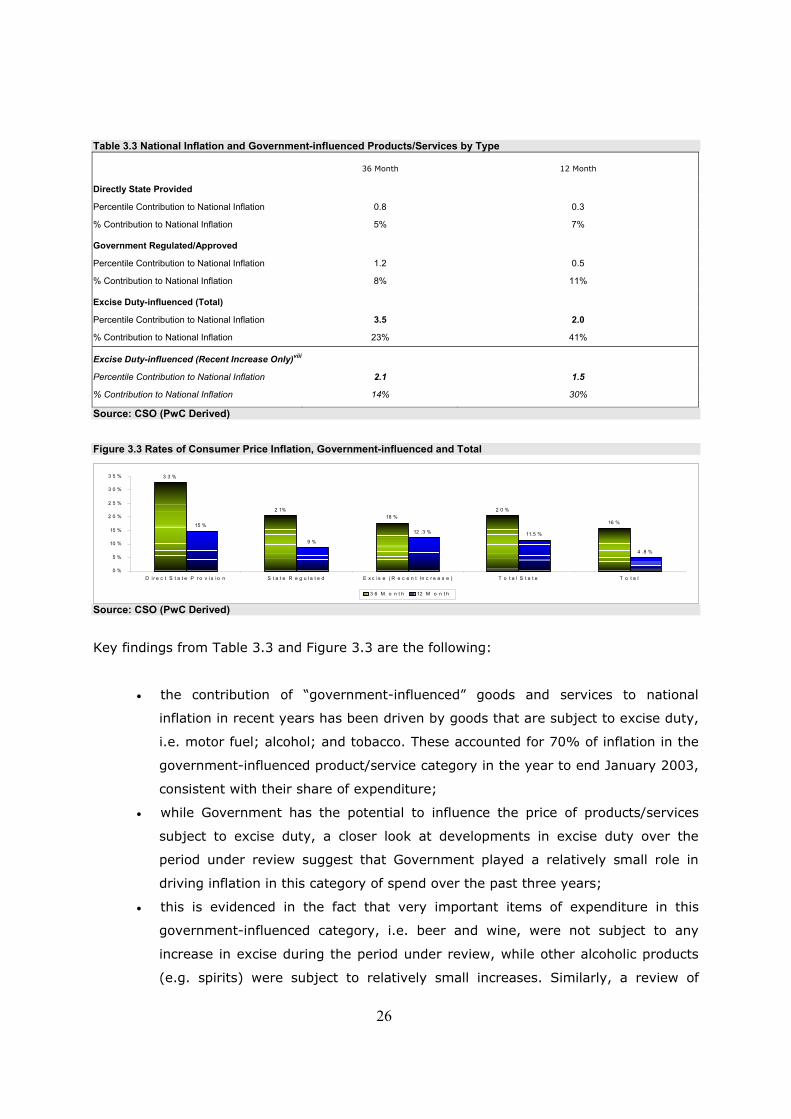
Table 3.3 National Inflation and Government-influenced Products/Services by Type
36 Month 12 Month
Directly State Provided
Percentile Contribution to National Inflation 0.8 0.3
% Contribution to National Inflation 5% 7%
Government Regulated/Approved
Percentile Contribution to National Inflation 1.2 0.5
% Contribution to National Inflation 8% 11%
Excise Duty-influenced (Total)
Percentile Contribution to National Inflation 3.5 2.0
% Contribution to National Inflation 23% 41%
Excise Duty-influenced (Recent Increase Only)viii
Percentile Contribution to National Inflation 2.1 1.5
% Contribution to National Inflation 14% 30%
Source: CSO (PwC Derived)
Figure 3.3 Rates of Consumer Price Inflation, Government-influenced and Total
Source: CSO (PwC Derived)
Key findings from Table 3.3 and Figure 3.3 are the following:
• the contribution of “government-influenced” goods and services to national
inflation in recent years has been driven by goods that are subject to excise duty,
i.e. motor fuel; alcohol; and tobacco. These accounted for 70% of inflation in the
government-influenced product/service category in the year to end January 2003,
consistent with their share of expenditure;
• while Government has the potential to influence the price of products/services
subject to excise duty, a closer look at developments in excise duty over the
period under review suggest that Government played a relatively small role in
driving inflation in this category of spend over the past three years;
• this is evidenced in the fact that very important items of expenditure in this
government-influenced category, i.e. beer and wine, were not subject to any
increase in excise during the period under review, while other alcoholic products
(e.g. spirits) were subject to relatively small increases. Similarly, a review of
3 3 %
2 1%18 %
2 0 %
16 %15 %
9 %
12 .3 % 11.5 %
4 .8 %
0 %
5 %
10 %
15 %
2 0 %
2 5 %
3 0 %
3 5 %
D i r e c t S t a t e P r o v i s io n S t a t e R e g u la t e d E x c i s e ( R e c e n t In c r e a s e ) T o t a l S t a t e T o t a l
3 6 M o n t h 12 M o n t h
27
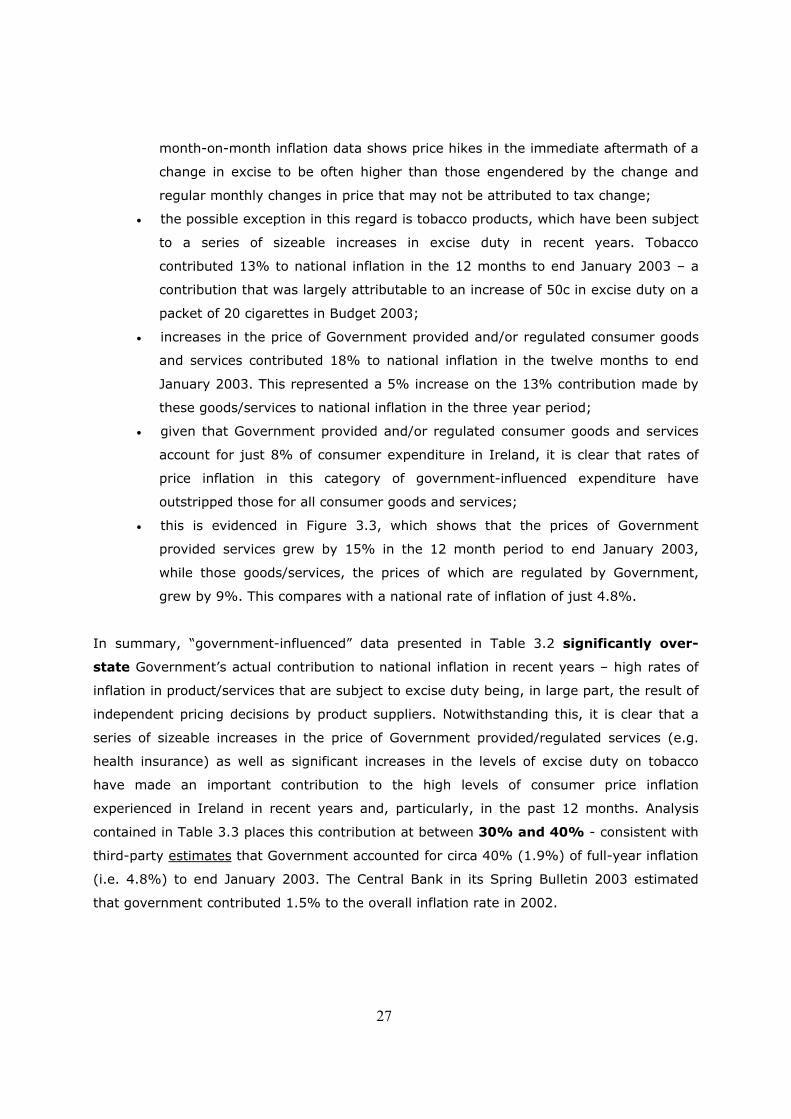
month-on-month inflation data shows price hikes in the immediate aftermath of a
change in excise to be often higher than those engendered by the change and
regular monthly changes in price that may not be attributed to tax change;
• the possible exception in this regard is tobacco products, which have been subject
to a series of sizeable increases in excise duty in recent years. Tobacco
contributed 13% to national inflation in the 12 months to end January 2003 – a
contribution that was largely attributable to an increase of 50c in excise duty on a
packet of 20 cigarettes in Budget 2003;
• increases in the price of Government provided and/or regulated consumer goods
and services contributed 18% to national inflation in the twelve months to end
January 2003. This represented a 5% increase on the 13% contribution made by
these goods/services to national inflation in the three year period;
• given that Government provided and/or regulated consumer goods and services
account for just 8% of consumer expenditure in Ireland, it is clear that rates of
price inflation in this category of government-influenced expenditure have
outstripped those for all consumer goods and services;
• this is evidenced in Figure 3.3, which shows that the prices of Government
provided services grew by 15% in the 12 month period to end January 2003,
while those goods/services, the prices of which are regulated by Government,
grew by 9%. This compares with a national rate of inflation of just 4.8%.
In summary, “government-influenced” data presented in Table 3.2 significantly over-
state Government’s actual contribution to national inflation in recent years – high rates of
inflation in product/services that are subject to excise duty being, in large part, the result of
independent pricing decisions by product suppliers. Notwithstanding this, it is clear that a
series of sizeable increases in the price of Government provided/regulated services (e.g.
health insurance) as well as significant increases in the levels of excise duty on tobacco
have made an important contribution to the high levels of consumer price inflation
experienced in Ireland in recent years and, particularly, in the past 12 months. Analysis
contained in Table 3.3 places this contribution at between 30% and 40% - consistent with
third-party estimates that Government accounted for circa 40% (1.9%) of full-year inflation
(i.e. 4.8%) to end January 2003. The Central Bank in its Spring Bulletin 2003 estimated
that government contributed 1.5% to the overall inflation rate in 2002.
28
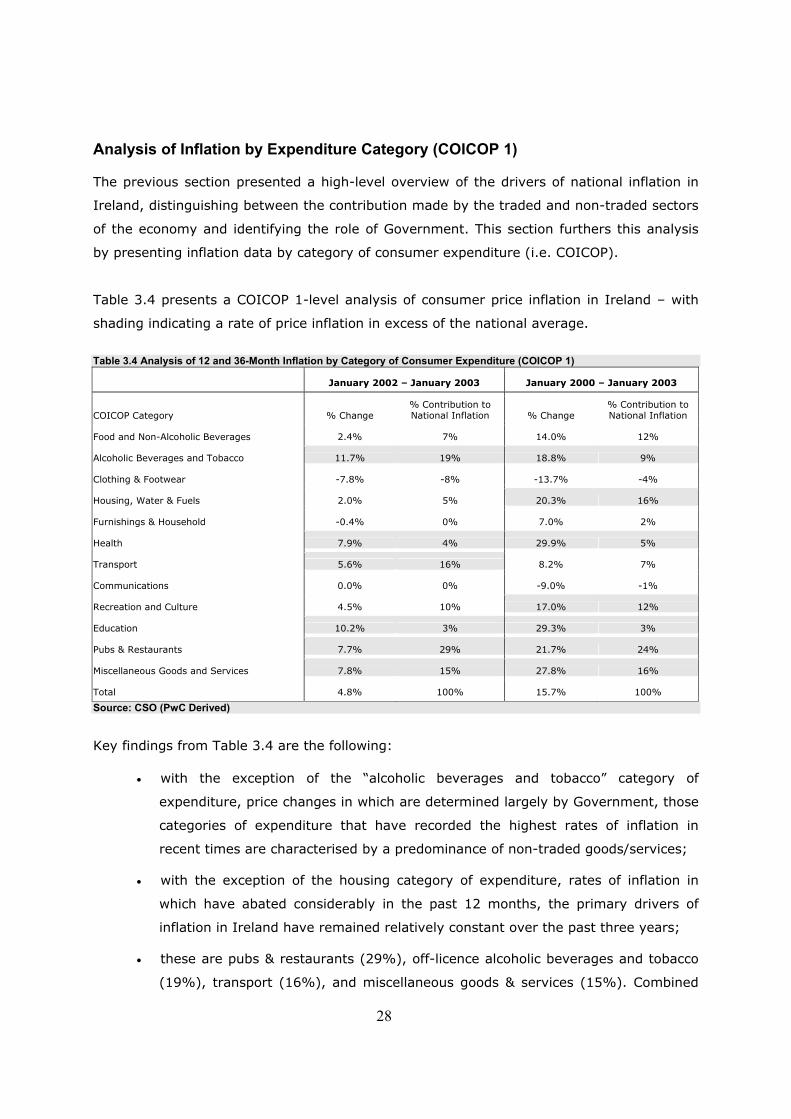
Analysis of Inflation by Expenditure Category (COICOP 1) The previous section presented a high-level overview of the drivers of national inflation in
Ireland, distinguishing between the contribution made by the traded and non-traded sectors
of the economy and identifying the role of Government. This section furthers this analysis
by presenting inflation data by category of consumer expenditure (i.e. COICOP).
Table 3.4 presents a COICOP 1-level analysis of consumer price inflation in Ireland – with
shading indicating a rate of price inflation in excess of the national average.
Table 3.4 Analysis of 12 and 36-Month Inflation by Category of Consumer Expenditure (COICOP 1)
January 2002 – January 2003 January 2000 – January 2003
COICOP Category % Change % Contribution to National Inflation % Change
% Contribution to National Inflation
Food and Non-Alcoholic Beverages 2.4% 7% 14.0% 12% Alcoholic Beverages and Tobacco 11.7% 19% 18.8% 9% Clothing & Footwear -7.8% -8% -13.7% -4% Housing, Water & Fuels 2.0% 5% 20.3% 16% Furnishings & Household -0.4% 0% 7.0% 2% Health 7.9% 4% 29.9% 5% Transport 5.6% 16% 8.2% 7% Communications 0.0% 0% -9.0% -1% Recreation and Culture 4.5% 10% 17.0% 12% Education 10.2% 3% 29.3% 3% Pubs & Restaurants 7.7% 29% 21.7% 24% Miscellaneous Goods and Services 7.8% 15% 27.8% 16% Total 4.8% 100% 15.7% 100% Source: CSO (PwC Derived)
Key findings from Table 3.4 are the following:
• with the exception of the “alcoholic beverages and tobacco” category of
expenditure, price changes in which are determined largely by Government, those
categories of expenditure that have recorded the highest rates of inflation in
recent times are characterised by a predominance of non-traded goods/services; • with the exception of the housing category of expenditure, rates of inflation in
which have abated considerably in the past 12 months, the primary drivers of
inflation in Ireland have remained relatively constant over the past three years;
• these are pubs & restaurants (29%), off-licence alcoholic beverages and tobacco
(19%), transport (16%), and miscellaneous goods & services (15%). Combined
29
these expenditure categories accounted for close to 80% of national inflation in
the year ending January 2003. Reflecting a slow-down in the rate of inflation in
the housing expenditure category in the past 12 months, the respective share
over three years was lower at 56%;
• three categories of expenditure, all traded, recorded insignificant or negative
price change in the past 36 months. These are clothing and footwear (-14%),
communications (-9%), and furnishings and household equipment (+7%).
The analysis presented in Table 3.3 supports findings presented in the earlier section, i.e.
they indicate the strong role of the non-traded sector, and pubs and restaurants in
particular, and Government in driving price inflation.
Analysis of Inflation by Expenditure Category (COICOPs 2 & 3)
This section supplements the foregoing by identifying those precise consumer goods/service
categories, price developments in which have been most noteworthy over the past 12
months. Two measures were used in preparing this analysis, namely:
• % contribution to national inflation (COICOP 2);
• % increase in prices (COICOP 2).
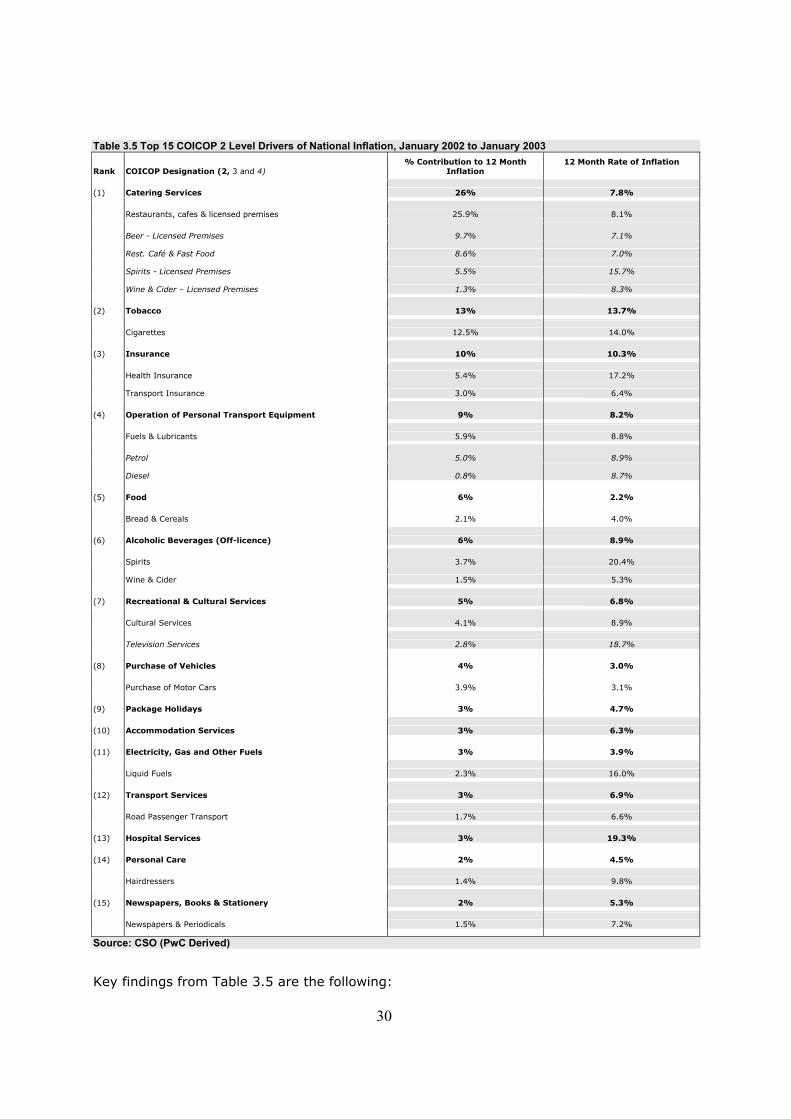
Table 3.5 shows the 15 (COICOP 2) categories of consumer expenditure that contributed
most to national inflation in the 12 months to end January 2003, with shading indicating
that the category in question also recorded a rate of inflation greater than the national
average in the same period, i.e. a product/service can make a significant contribution to
national inflation even at normal rates of inflation, if the product/service in question
accounts for a relatively large share of consumer spend.
30
Table 3.5 Top 15 COICOP 2 Level Drivers of National Inflation, January 2002 to January 2003
Rank COICOP Designation (2, 3 and 4) % Contribution to 12 Month
Inflation 12 Month Rate of Inflation
(1) Catering Services 26% 7.8%
Restaurants, cafes & licensed premises 25.9% 8.1% Beer - Licensed Premises 9.7% 7.1%
Rest. Café & Fast Food 8.6% 7.0%
Spirits - Licensed Premises 5.5% 15.7%
Wine & Cider – Licensed Premises 1.3% 8.3%
(2) Tobacco 13% 13.7% Cigarettes 12.5% 14.0%
(3) Insurance 10% 10.3% Health Insurance 5.4% 17.2%
Transport Insurance 3.0% 6.4%
(4) Operation of Personal Transport Equipment 9% 8.2% Fuels & Lubricants 5.9% 8.8% Petrol 5.0% 8.9%
Diesel 0.8% 8.7%
(5) Food 6% 2.2% Bread & Cereals 2.1% 4.0%
(6) Alcoholic Beverages (Off-licence) 6% 8.9% Spirits 3.7% 20.4%
Wine & Cider 1.5% 5.3%
(7) Recreational & Cultural Services 5% 6.8% Cultural Services 4.1% 8.9% Television Services 2.8% 18.7%
(8) Purchase of Vehicles 4% 3.0% Purchase of Motor Cars 3.9% 3.1%
(9) Package Holidays 3% 4.7%
(10) Accommodation Services 3% 6.3%
(11) Electricity, Gas and Other Fuels 3% 3.9% Liquid Fuels 2.3% 16.0%
(12) Transport Services 3% 6.9% Road Passenger Transport 1.7% 6.6%
(13) Hospital Services 3% 19.3%
(14) Personal Care 2% 4.5% Hairdressers 1.4% 9.8% 1 4%
(15) Newspapers, Books & Stationery 2% 5.3% Newspapers & Periodicals 1.5% 7.2%
Source: CSO (PwC Derived)
Key findings from Table 3.5 are the following:
31
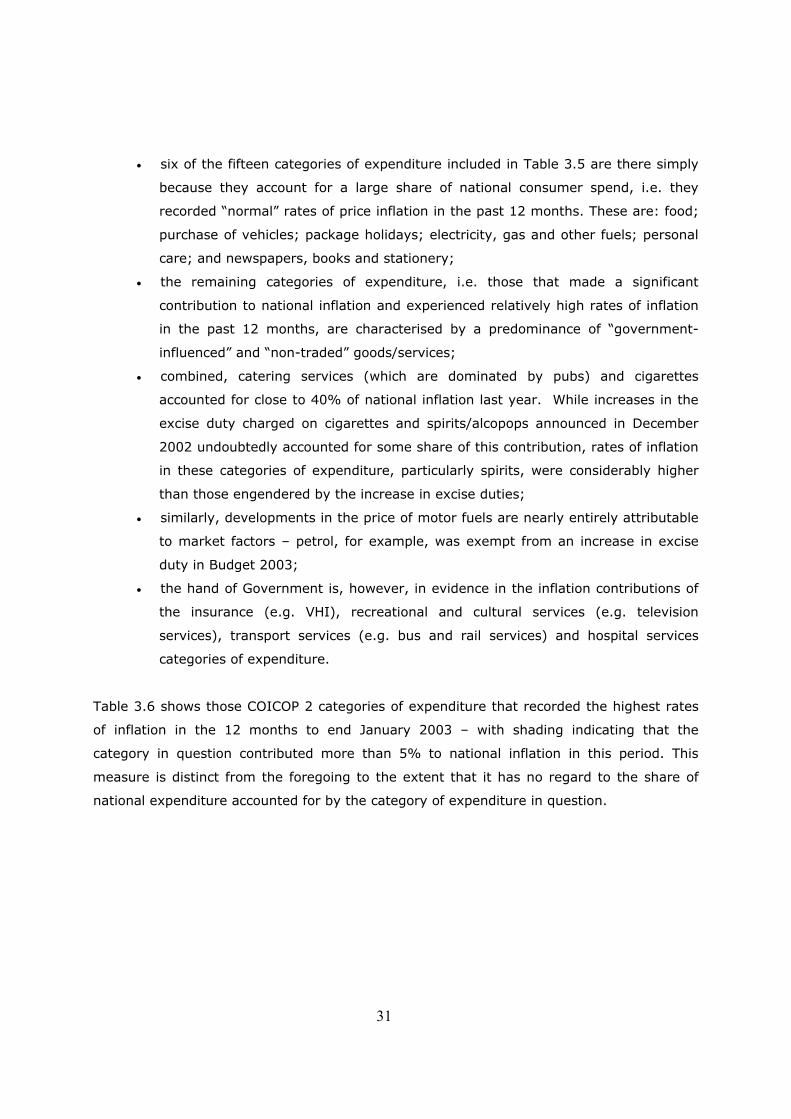
• six of the fifteen categories of expenditure included in Table 3.5 are there simply
because they account for a large share of national consumer spend, i.e. they
recorded “normal” rates of price inflation in the past 12 months. These are: food;
purchase of vehicles; package holidays; electricity, gas and other fuels; personal
care; and newspapers, books and stationery;
• the remaining categories of expenditure, i.e. those that made a significant
contribution to national inflation and experienced relatively high rates of inflation
in the past 12 months, are characterised by a predominance of “government-
influenced” and “non-traded” goods/services;
• combined, catering services (which are dominated by pubs) and cigarettes
accounted for close to 40% of national inflation last year. While increases in the
excise duty charged on cigarettes and spirits/alcopops announced in December
2002 undoubtedly accounted for some share of this contribution, rates of inflation
in these categories of expenditure, particularly spirits, were considerably higher
than those engendered by the increase in excise duties;
• similarly, developments in the price of motor fuels are nearly entirely attributable
to market factors – petrol, for example, was exempt from an increase in excise
duty in Budget 2003;
• the hand of Government is, however, in evidence in the inflation contributions of
the insurance (e.g. VHI), recreational and cultural services (e.g. television
services), transport services (e.g. bus and rail services) and hospital services
categories of expenditure.
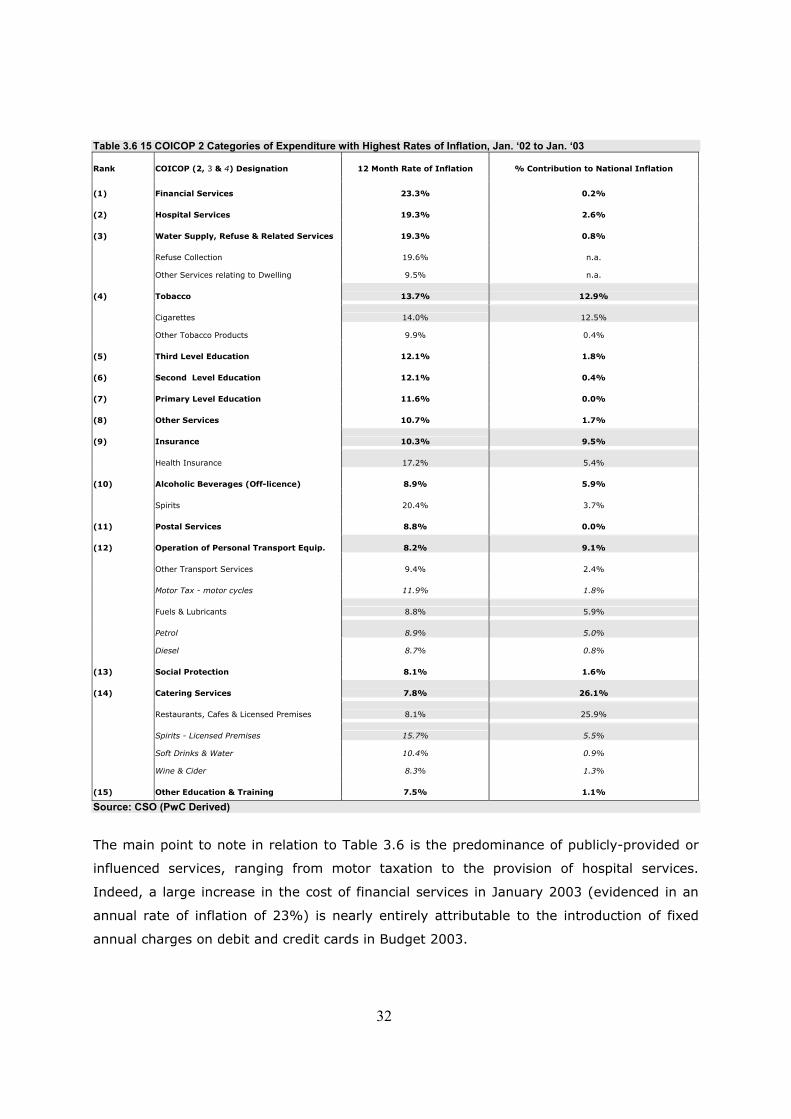
Table 3.6 shows those COICOP 2 categories of expenditure that recorded the highest rates
of inflation in the 12 months to end January 2003 – with shading indicating that the
category in question contributed more than 5% to national inflation in this period. This
measure is distinct from the foregoing to the extent that it has no regard to the share of
national expenditure accounted for by the category of expenditure in question.
32
Table 3.6 15 COICOP 2 Categories of Expenditure with Highest Rates of Inflation, Jan. ‘02 to Jan. ‘03
Rank COICOP (2, 3 & 4) Designation 12 Month Rate of Inflation % Contribution to National Inflation (1) Financial Services 23.3% 0.2% (2) Hospital Services 19.3% 2.6% (3) Water Supply, Refuse & Related Services 19.3% 0.8% Refuse Collection 19.6% n.a.
Other Services relating to Dwelling 9.5% n.a. (4) Tobacco 13.7% 12.9% Cigarettes 14.0% 12.5%
Other Tobacco Products 9.9% 0.4% (5) Third Level Education 12.1% 1.8% (6) Second Level Education 12.1% 0.4% (7) Primary Level Education 11.6% 0.0% (8) Other Services 10.7% 1.7% (9) Insurance 10.3% 9.5% Health Insurance 17.2% 5.4% (10) Alcoholic Beverages (Off-licence) 8.9% 5.9% Spirits 20.4% 3.7% (11) Postal Services 8.8% 0.0% (12) Operation of Personal Transport Equip. 8.2% 9.1% Other Transport Services 9.4% 2.4% Motor Tax - motor cycles 11.9% 1.8% Fuels & Lubricants 8.8% 5.9% Petrol 8.9% 5.0%
Diesel 8.7% 0.8% (13) Social Protection 8.1% 1.6% (14) Catering Services 7.8% 26.1% Restaurants, Cafes & Licensed Premises 8.1% 25.9% Spirits - Licensed Premises 15.7% 5.5%
Soft Drinks & Water 10.4% 0.9%
Wine & Cider 8.3% 1.3% (15) Other Education & Training 7.5% 1.1% Source: CSO (PwC Derived)
The main point to note in relation to Table 3.6 is the predominance of publicly-provided or
influenced services, ranging from motor taxation to the provision of hospital services.
Indeed, a large increase in the cost of financial services in January 2003 (evidenced in an
annual rate of inflation of 23%) is nearly entirely attributable to the introduction of fixed
annual charges on debit and credit cards in Budget 2003.
33
Chapter 4 Analysis of COICOP Level 1 Drivers of Inflation
Summary of Chapter Findings
• this chapter describes the underlying drivers of inflation within those COICOP 1 categories of expenditure that have displayed the highest rates of price inflation in Ireland in recent years. Key findings are as follows:
• pubs & restaurants – an analysis of inflation in this category of expenditure showed a modest increase in the rate of inflation in recent months – largely the result of a significant increase in the rate of inflation in the “spirits in licensed premises” item of expenditure. While spirits and alcopops were subject to an increase in excise in Budget 2003, a more detailed analysis of spirit prices suggests that less than half of the 12 month price increase (i.e. 16%) was attributable to the change in excise regulations. Similarly, relatively large increases in the cost of other beverages in licensed premises (e.g. 7.1% increase in cost of beer) cannot be attributed to excise change. With the exception of restaurants, cafes and pubs, other items of expenditure within this category (i.e. canteens and accommodation services) experienced 12 months rates of inflation that were smaller than the national average (i.e. 4.8%);
• alcohol & tobacco – price developments in this category of expenditure appear to be driven,
largely, by changes in excise regulations, spirits (20.4%) and tobacco (13.7%) recording very high rates of inflation relative to other products in this basket (e.g. beer – 3.4%). A more detailed analysis of monthly developments in the price of twenty cigarettes in the 12 month period under review suggests that the largest share (i.e. 70%) of the price increase effected in this period was attributable to the 50c increase in excise introduced in Budget 2003;
• miscellaneous goods & services – recent months have seen a reduction in the rate of
inflation in this category of expenditure – reflecting abatement in the rate of increase of the cost of transport insurance. At 7.8%, however, inflation in the 12 month period to end January 2003 was considerably in excess of the national average (4.8%). The major driver of inflation in this period was health insurance, price increases in which, by-and-large, negated the inflation benefits associated with more modest rates of increase in transport insurance. Health insurance accounted for 5.4% of the 14.9% contribution this category of expenditure made to national inflation in the 12 month period under review;
• recreation & culture – inflation in this category of expenditure has also abated in recent
months – with the result that the annual rate of inflation to end January 2003 (4.5%) was less than the national average (4.8%). Notwithstanding this, two services within this category of expenditure exhibited significant price increases in recent months, which are worthy of note. The first, and most readily explained, is “television services”, a significant component of which is the RTE Licence Fee. Government approval of a €43 increase (equivalent to 40%) in the cost of the Licence resulted in an 18.7% price increase in this item of expenditure to end 2003. Less easily explained is the 12.5% increase in sports admittances – considerably higher than an average 7% for the 36 month period under review. This development stands in contrast to price changes in other sports-related services, the rate of increase in which has abated in recent months, e.g. sports participation fees and club subscriptions.
• health - health inflation in Ireland has abated in recent months – annual inflation to end
January 2003 standing at 7.9%, compared with 11.8% for the preceding year. This reduction in the rate of inflation is evidenced across all expenditure items – with the exception of hospital services, the price of which are, by-and-large, determined within the public sector. Hospital services were the major driver of health inflation in Ireland in the 12 month period under review, accounting for more than 60% of the health sector’s 4.2% contribution to inflation. The cost of health insurance is, however, not included in this category of spend/COICOP.
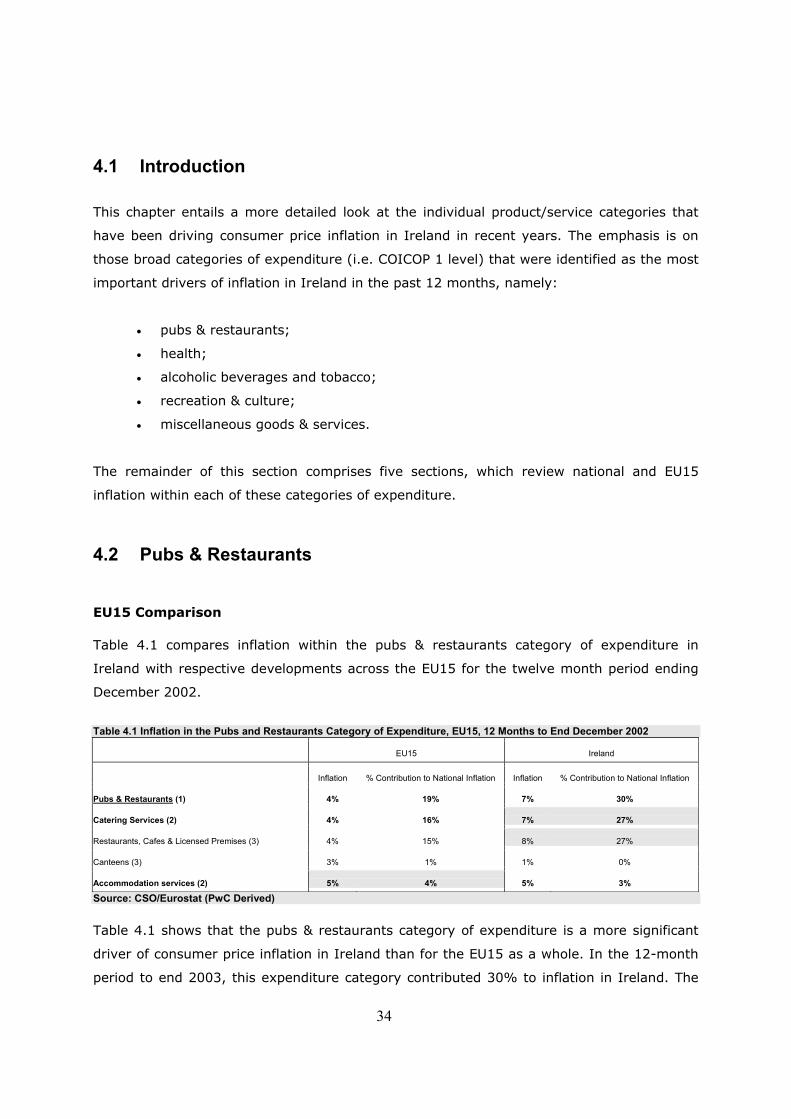
34
4.1 Introduction
This chapter entails a more detailed look at the individual product/service categories that
have been driving consumer price inflation in Ireland in recent years. The emphasis is on
those broad categories of expenditure (i.e. COICOP 1 level) that were identified as the most
important drivers of inflation in Ireland in the past 12 months, namely:
• pubs & restaurants;
• health;
• alcoholic beverages and tobacco;
• recreation & culture;
• miscellaneous goods & services.
The remainder of this section comprises five sections, which review national and EU15
inflation within each of these categories of expenditure.
4.2 Pubs & Restaurants EU15 Comparison Table 4.1 compares inflation within the pubs & restaurants category of expenditure in
Ireland with respective developments across the EU15 for the twelve month period ending
December 2002.
Table 4.1 Inflation in the Pubs and Restaurants Category of Expenditure, EU15, 12 Months to End December 2002
EU15 Ireland
Inflation % Contribution to National Inflation Inflation % Contribution to National Inflation
Pubs & Restaurants (1) 4% 19% 7% 30%
Catering Services (2) 4% 16% 7% 27%
Restaurants, Cafes & Licensed Premises (3) 4% 15% 8% 27%
Canteens (3) 3% 1% 1% 0%
Accommodation services (2) 5% 4% 5% 3%
Source: CSO/Eurostat (PwC Derived) Table 4.1 shows that the pubs & restaurants category of expenditure is a more significant
driver of consumer price inflation in Ireland than for the EU15 as a whole. In the 12-month
period to end 2003, this expenditure category contributed 30% to inflation in Ireland. The
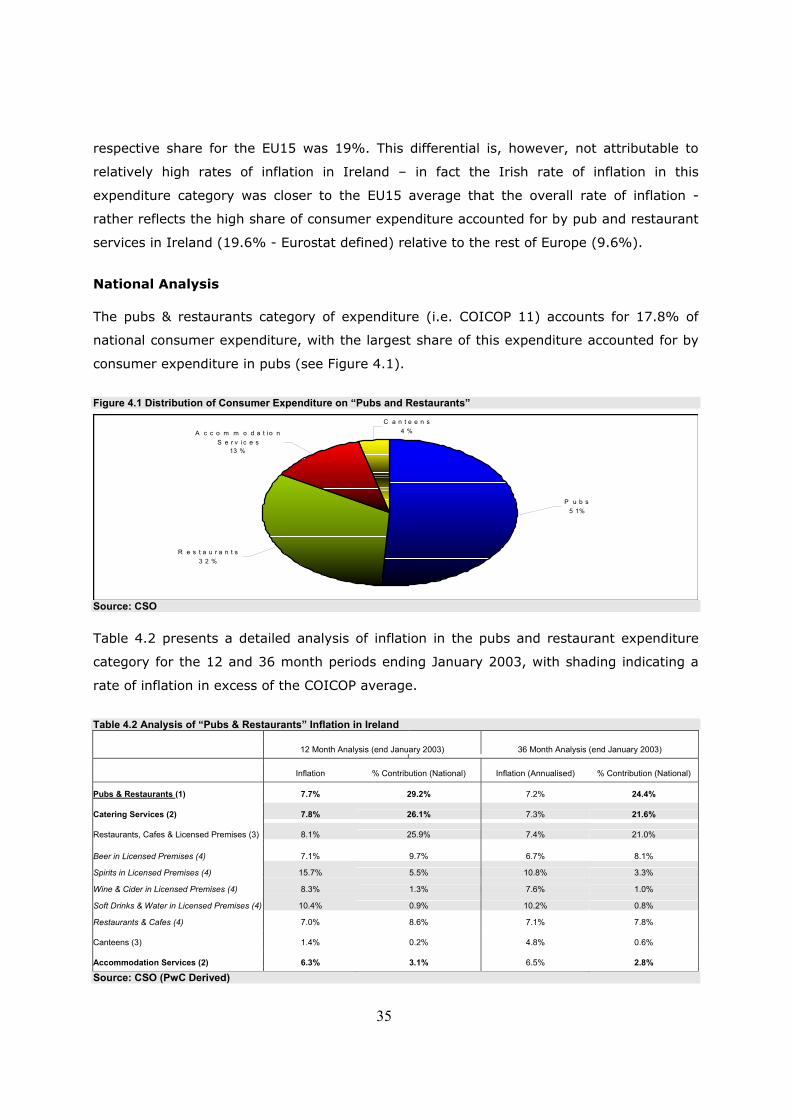
35
respective share for the EU15 was 19%. This differential is, however, not attributable to
relatively high rates of inflation in Ireland – in fact the Irish rate of inflation in this
expenditure category was closer to the EU15 average that the overall rate of inflation -
rather reflects the high share of consumer expenditure accounted for by pub and restaurant
services in Ireland (19.6% - Eurostat defined) relative to the rest of Europe (9.6%).
National Analysis The pubs & restaurants category of expenditure (i.e. COICOP 11) accounts for 17.8% of
national consumer expenditure, with the largest share of this expenditure accounted for by
consumer expenditure in pubs (see Figure 4.1).
Figure 4.1 Distribution of Consumer Expenditure on “Pubs and Restaurants”
Source: CSO Table 4.2 presents a detailed analysis of inflation in the pubs and restaurant expenditure
category for the 12 and 36 month periods ending January 2003, with shading indicating a
rate of inflation in excess of the COICOP average.
Table 4.2 Analysis of “Pubs & Restaurants” Inflation in Ireland
12 Month Analysis (end January 2003) 36 Month Analysis (end January 2003)
Inflation % Contribution (National) Inflation (Annualised) % Contribution (National)
Pubs & Restaurants (1) 7.7% 29.2% 7.2% 24.4%
Catering Services (2) 7.8% 26.1% 7.3% 21.6%
Restaurants, Cafes & Licensed Premises (3) 8.1% 25.9% 7.4% 21.0%
Beer in Licensed Premises (4) 7.1% 9.7% 6.7% 8.1%
Spirits in Licensed Premises (4) 15.7% 5.5% 10.8% 3.3%
Wine & Cider in Licensed Premises (4) 8.3% 1.3% 7.6% 1.0%
Soft Drinks & Water in Licensed Premises (4) 10.4% 0.9% 10.2% 0.8%
Restaurants & Cafes (4) 7.0% 8.6% 7.1% 7.8%
Canteens (3) 1.4% 0.2% 4.8% 0.6%
Accommodation Services (2) 6.3% 3.1% 6.5% 2.8%
Source: CSO (PwC Derived)
C a n t e e n s4 %
R e s t a u r a n t s3 2 %
A c c o m m o d a t i o n S e r v i c e s
13 %
P u b s5 1%
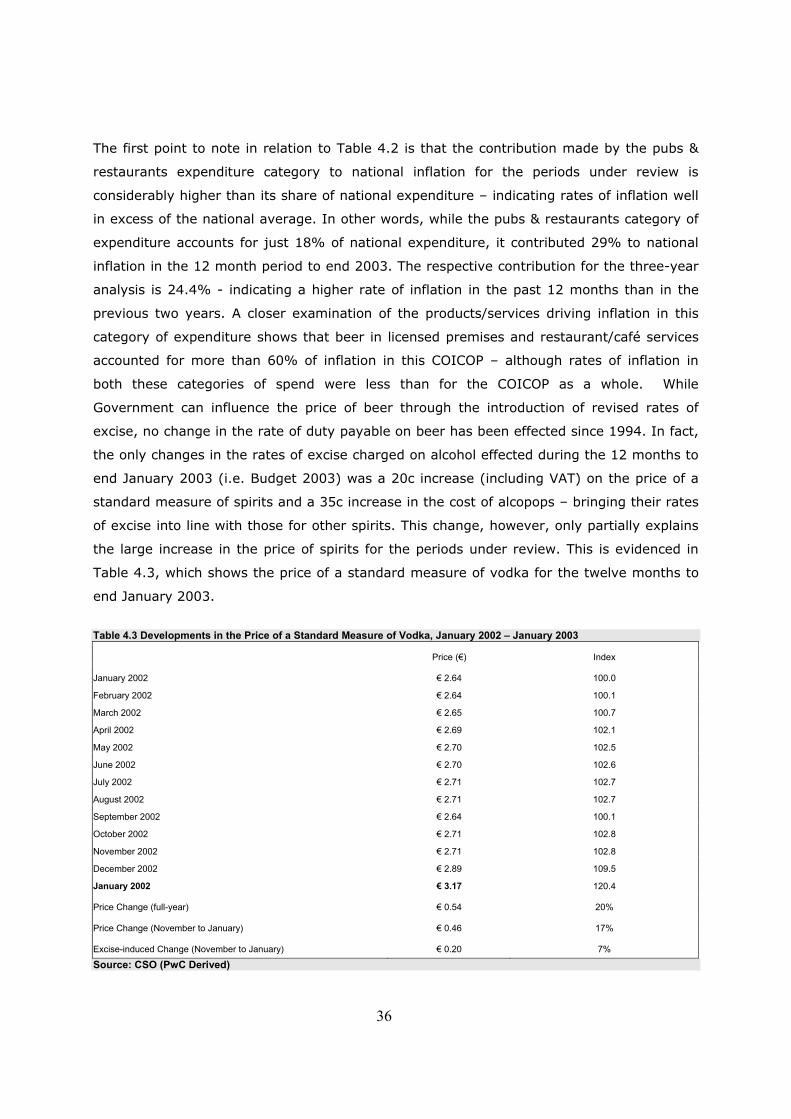
36
The first point to note in relation to Table 4.2 is that the contribution made by the pubs &
restaurants expenditure category to national inflation for the periods under review is
considerably higher than its share of national expenditure – indicating rates of inflation well
in excess of the national average. In other words, while the pubs & restaurants category of
expenditure accounts for just 18% of national expenditure, it contributed 29% to national
inflation in the 12 month period to end 2003. The respective contribution for the three-year
analysis is 24.4% - indicating a higher rate of inflation in the past 12 months than in the
previous two years. A closer examination of the products/services driving inflation in this
category of expenditure shows that beer in licensed premises and restaurant/café services
accounted for more than 60% of inflation in this COICOP – although rates of inflation in
both these categories of spend were less than for the COICOP as a whole. While
Government can influence the price of beer through the introduction of revised rates of
excise, no change in the rate of duty payable on beer has been effected since 1994. In fact,
the only changes in the rates of excise charged on alcohol effected during the 12 months to
end January 2003 (i.e. Budget 2003) was a 20c increase (including VAT) on the price of a
standard measure of spirits and a 35c increase in the cost of alcopops – bringing their rates
of excise into line with those for other spirits. This change, however, only partially explains
the large increase in the price of spirits for the periods under review. This is evidenced in
Table 4.3, which shows the price of a standard measure of vodka for the twelve months to
end January 2003.
Table 4.3 Developments in the Price of a Standard Measure of Vodka, January 2002 – January 2003
Price (€) Index
January 2002 € 2.64 100.0
February 2002 € 2.64 100.1
March 2002 € 2.65 100.7
April 2002 € 2.69 102.1
May 2002 € 2.70 102.5
June 2002 € 2.70 102.6
July 2002 € 2.71 102.7
August 2002 € 2.71 102.7
September 2002 € 2.64 100.1
October 2002 € 2.71 102.8
November 2002 € 2.71 102.8
December 2002 € 2.89 109.5
January 2002 € 3.17 120.4
Price Change (full-year) € 0.54 20%
Price Change (November to January) € 0.46 17%
Excise-induced Change (November to January) € 0.20 7%
Source: CSO (PwC Derived)
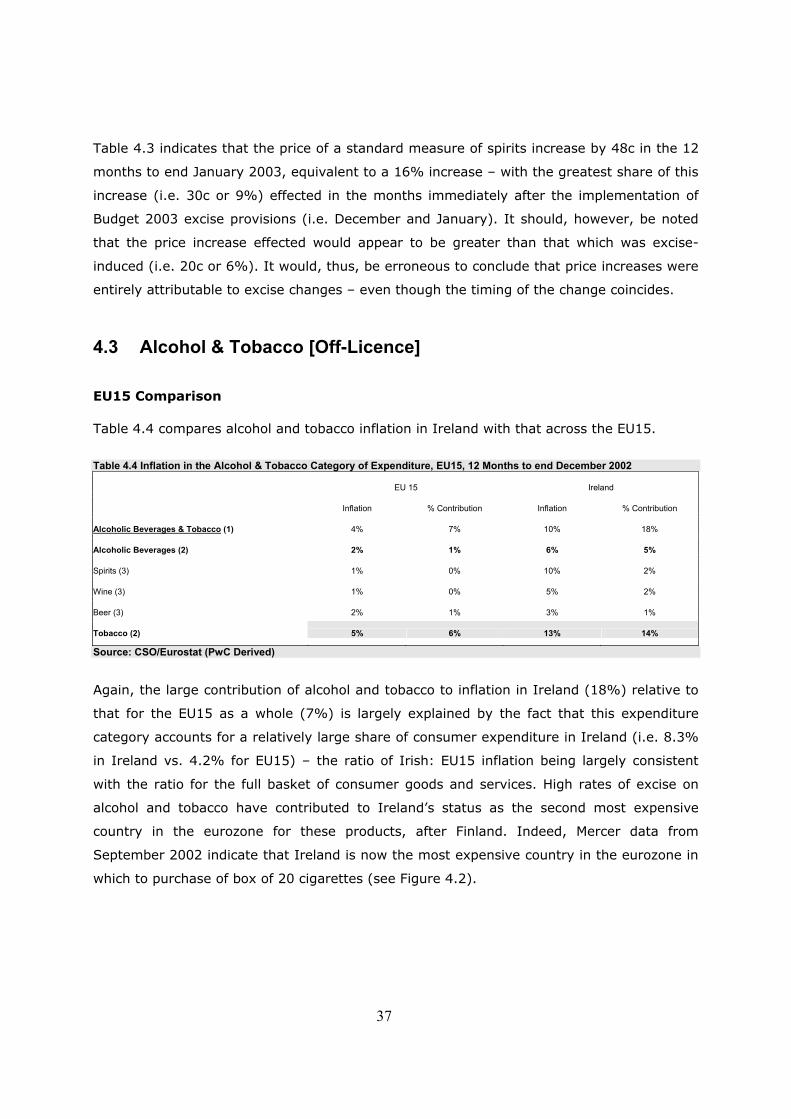
37
Table 4.3 indicates that the price of a standard measure of spirits increase by 48c in the 12
months to end January 2003, equivalent to a 16% increase – with the greatest share of this
increase (i.e. 30c or 9%) effected in the months immediately after the implementation of
Budget 2003 excise provisions (i.e. December and January). It should, however, be noted
that the price increase effected would appear to be greater than that which was excise-
induced (i.e. 20c or 6%). It would, thus, be erroneous to conclude that price increases were
entirely attributable to excise changes – even though the timing of the change coincides.
4.3 Alcohol & Tobacco [Off-Licence] EU15 Comparison Table 4.4 compares alcohol and tobacco inflation in Ireland with that across the EU15.
Table 4.4 Inflation in the Alcohol & Tobacco Category of Expenditure, EU15, 12 Months to end December 2002
EU 15 Ireland
Inflation % Contribution Inflation % Contribution
Alcoholic Beverages & Tobacco (1) 4% 7% 10% 18%
Alcoholic Beverages (2) 2% 1% 6% 5%
Spirits (3) 1% 0% 10% 2%
Wine (3) 1% 0% 5% 2%
Beer (3) 2% 1% 3% 1%
Tobacco (2) 5% 6% 13% 14%
Source: CSO/Eurostat (PwC Derived)
Again, the large contribution of alcohol and tobacco to inflation in Ireland (18%) relative to
that for the EU15 as a whole (7%) is largely explained by the fact that this expenditure
category accounts for a relatively large share of consumer expenditure in Ireland (i.e. 8.3%
in Ireland vs. 4.2% for EU15) – the ratio of Irish: EU15 inflation being largely consistent
with the ratio for the full basket of consumer goods and services. High rates of excise on
alcohol and tobacco have contributed to Ireland’s status as the second most expensive
country in the eurozone for these products, after Finland. Indeed, Mercer data from
September 2002 indicate that Ireland is now the most expensive country in the eurozone in
which to purchase of box of 20 cigarettes (see Figure 4.2).
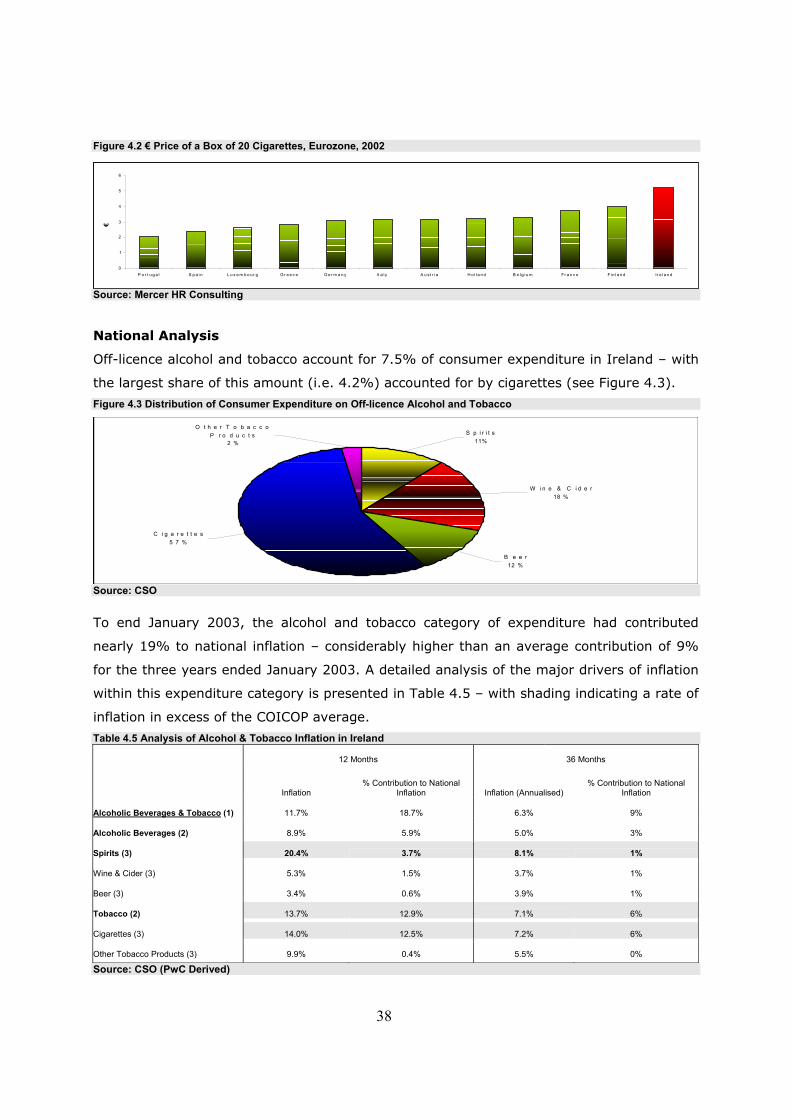
38
Figure 4.2 € Price of a Box of 20 Cigarettes, Eurozone, 2002
Source: Mercer HR Consulting National Analysis
Off-licence alcohol and tobacco account for 7.5% of consumer expenditure in Ireland – with
the largest share of this amount (i.e. 4.2%) accounted for by cigarettes (see Figure 4.3).
Figure 4.3 Distribution of Consumer Expenditure on Off-licence Alcohol and Tobacco
Source: CSO To end January 2003, the alcohol and tobacco category of expenditure had contributed
nearly 19% to national inflation – considerably higher than an average contribution of 9%
for the three years ended January 2003. A detailed analysis of the major drivers of inflation
within this expenditure category is presented in Table 4.5 – with shading indicating a rate of
inflation in excess of the COICOP average.
Table 4.5 Analysis of Alcohol & Tobacco Inflation in Ireland
12 Months 36 Months
Inflation % Contribution to National
Inflation Inflation (Annualised) % Contribution to National
Inflation
Alcoholic Beverages & Tobacco (1) 11.7% 18.7% 6.3% 9%
Alcoholic Beverages (2) 8.9% 5.9% 5.0% 3%
Spirits (3) 20.4% 3.7% 8.1% 1%
Wine & Cider (3) 5.3% 1.5% 3.7% 1%
Beer (3) 3.4% 0.6% 3.9% 1%
Tobacco (2) 13.7% 12.9% 7.1% 6%
Cigarettes (3) 14.0% 12.5% 7.2% 6%
Other Tobacco Products (3) 9.9% 0.4% 5.5% 0%
Source: CSO (PwC Derived)
0
1
2
3
4
5
6
P o r t u g a l S p a i n L u x e m b o u r g G r e e c e G e r m a n y It a l y A u st r i a H o l l a n d B e l g i u m Fr a n c e F i n l a n d Ir e l a n d
€
C i g a r e t t e s5 7 %
B e e r12 %
W i n e & C i d e r18 %
S p i r i t s11%
O t h e r T o b a c c o P r o d u c t s
2 %
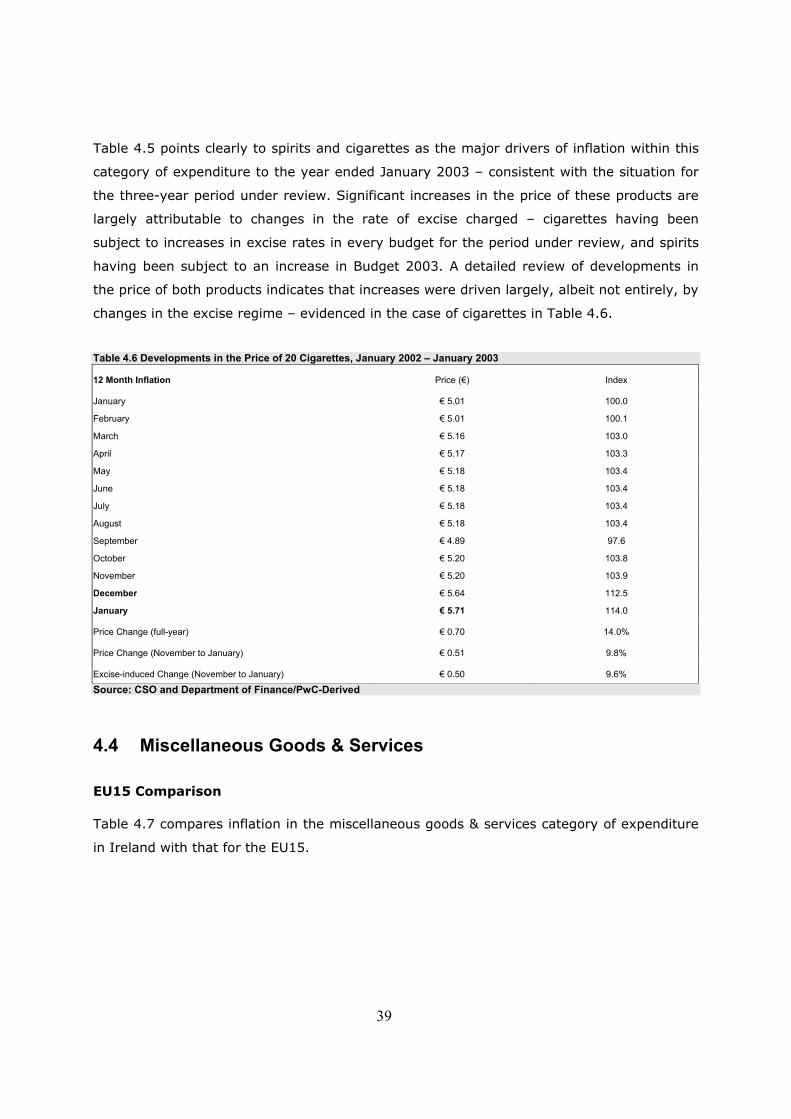
39
Table 4.5 points clearly to spirits and cigarettes as the major drivers of inflation within this
category of expenditure to the year ended January 2003 – consistent with the situation for
the three-year period under review. Significant increases in the price of these products are
largely attributable to changes in the rate of excise charged – cigarettes having been
subject to increases in excise rates in every budget for the period under review, and spirits
having been subject to an increase in Budget 2003. A detailed review of developments in
the price of both products indicates that increases were driven largely, albeit not entirely, by
changes in the excise regime – evidenced in the case of cigarettes in Table 4.6.
Table 4.6 Developments in the Price of 20 Cigarettes, January 2002 – January 2003
12 Month Inflation Price (€) Index
January € 5.01 100.0
February € 5.01 100.1
March € 5.16 103.0
April € 5.17 103.3
May € 5.18 103.4
June € 5.18 103.4
July € 5.18 103.4
August € 5.18 103.4
September € 4.89 97.6
October € 5.20 103.8
November € 5.20 103.9
December € 5.64 112.5
January € 5.71 114.0
Price Change (full-year) € 0.70 14.0%
Price Change (November to January) € 0.51 9.8%
Excise-induced Change (November to January) € 0.50 9.6%
Source: CSO and Department of Finance/PwC-Derived
4.4 Miscellaneous Goods & Services
EU15 Comparison Table 4.7 compares inflation in the miscellaneous goods & services category of expenditure
in Ireland with that for the EU15.
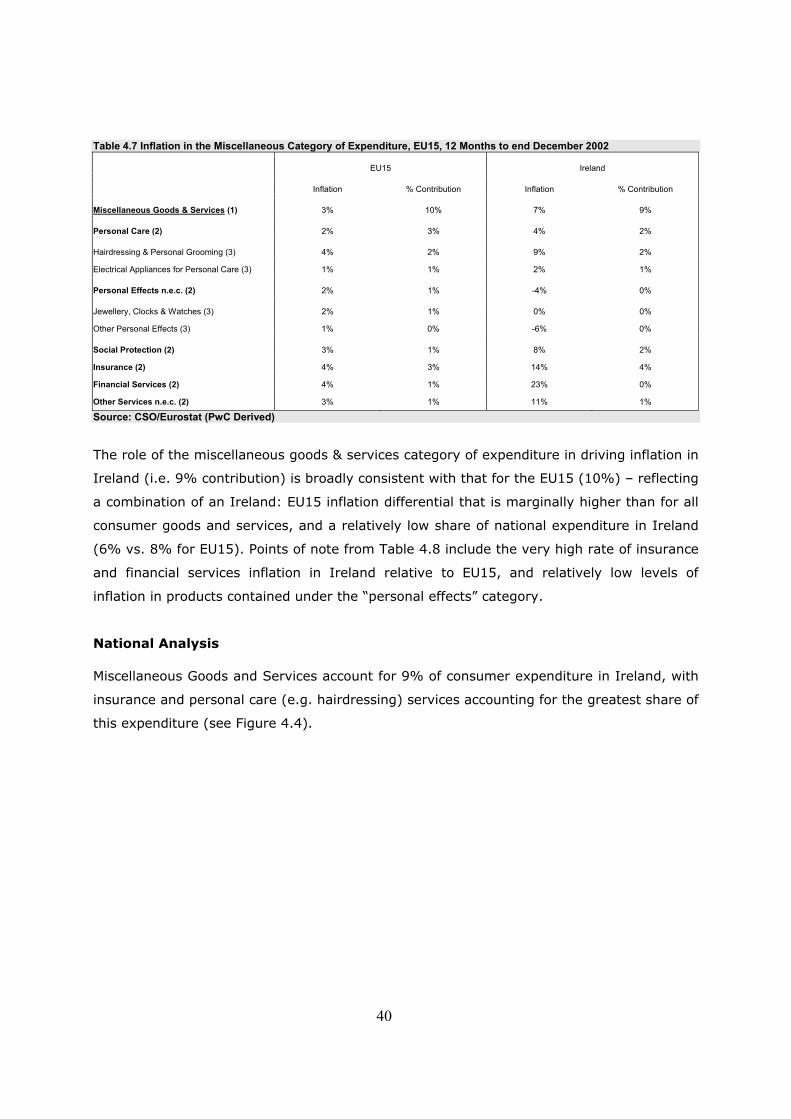
40
Table 4.7 Inflation in the Miscellaneous Category of Expenditure, EU15, 12 Months to end December 2002
EU15 Ireland
Inflation % Contribution Inflation % Contribution
Miscellaneous Goods & Services (1) 3% 10% 7% 9%
Personal Care (2) 2% 3% 4% 2%
Hairdressing & Personal Grooming (3) 4% 2% 9% 2%
Electrical Appliances for Personal Care (3) 1% 1% 2% 1%
Personal Effects n.e.c. (2) 2% 1% -4% 0%
Jewellery, Clocks & Watches (3) 2% 1% 0% 0%
Other Personal Effects (3) 1% 0% -6% 0%
Social Protection (2) 3% 1% 8% 2%
Insurance (2) 4% 3% 14% 4%
Financial Services (2) 4% 1% 23% 0%
Other Services n.e.c. (2) 3% 1% 11% 1%
Source: CSO/Eurostat (PwC Derived)
The role of the miscellaneous goods & services category of expenditure in driving inflation in
Ireland (i.e. 9% contribution) is broadly consistent with that for the EU15 (10%) – reflecting
a combination of an Ireland: EU15 inflation differential that is marginally higher than for all
consumer goods and services, and a relatively low share of national expenditure in Ireland
(6% vs. 8% for EU15). Points of note from Table 4.8 include the very high rate of insurance
and financial services inflation in Ireland relative to EU15, and relatively low levels of
inflation in products contained under the “personal effects” category.
National Analysis Miscellaneous Goods and Services account for 9% of consumer expenditure in Ireland, with
insurance and personal care (e.g. hairdressing) services accounting for the greatest share of
this expenditure (see Figure 4.4).
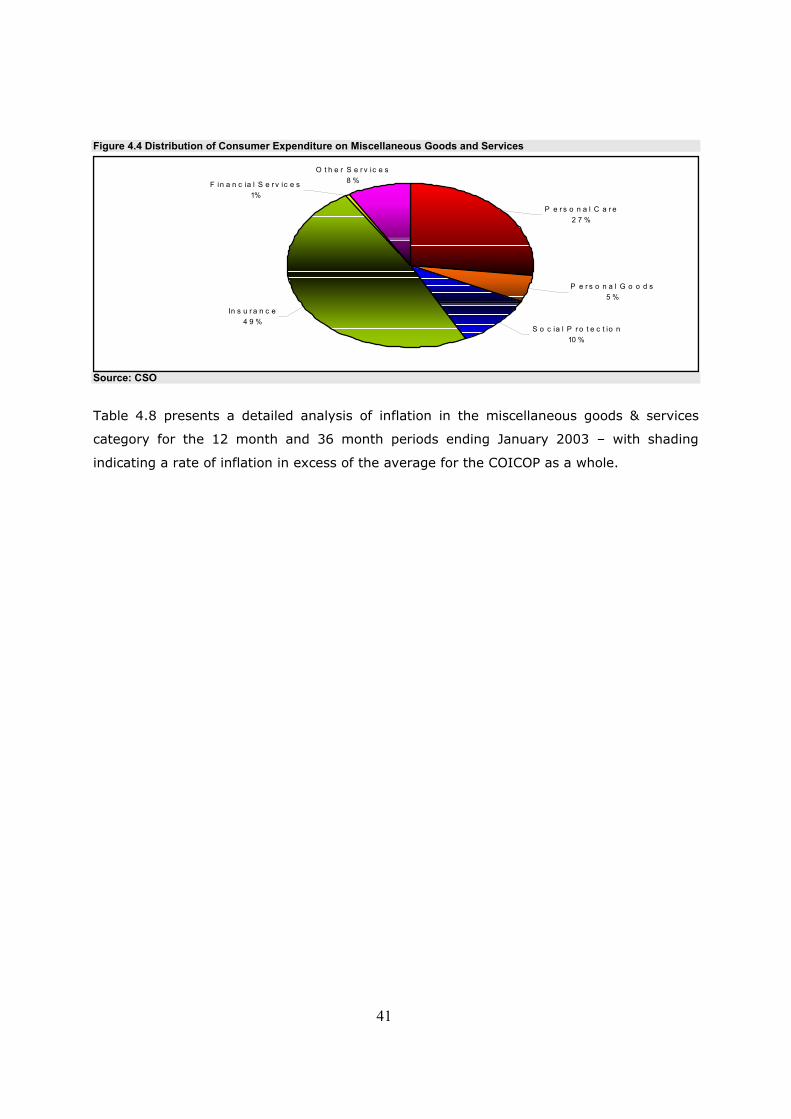
41
Figure 4.4 Distribution of Consumer Expenditure on Miscellaneous Goods and Services
Source: CSO
Table 4.8 presents a detailed analysis of inflation in the miscellaneous goods & services
category for the 12 month and 36 month periods ending January 2003 – with shading
indicating a rate of inflation in excess of the average for the COICOP as a whole.
In s u r a n c e4 9 %
S o c ia l P r o t e c t io n10 %
P e r s o n a l G o o d s5 %
P e r s o n a l C a r e2 7 %
O t h e r S e r v ic e s8 %F in a n c ia l S e r v ic e s
1%
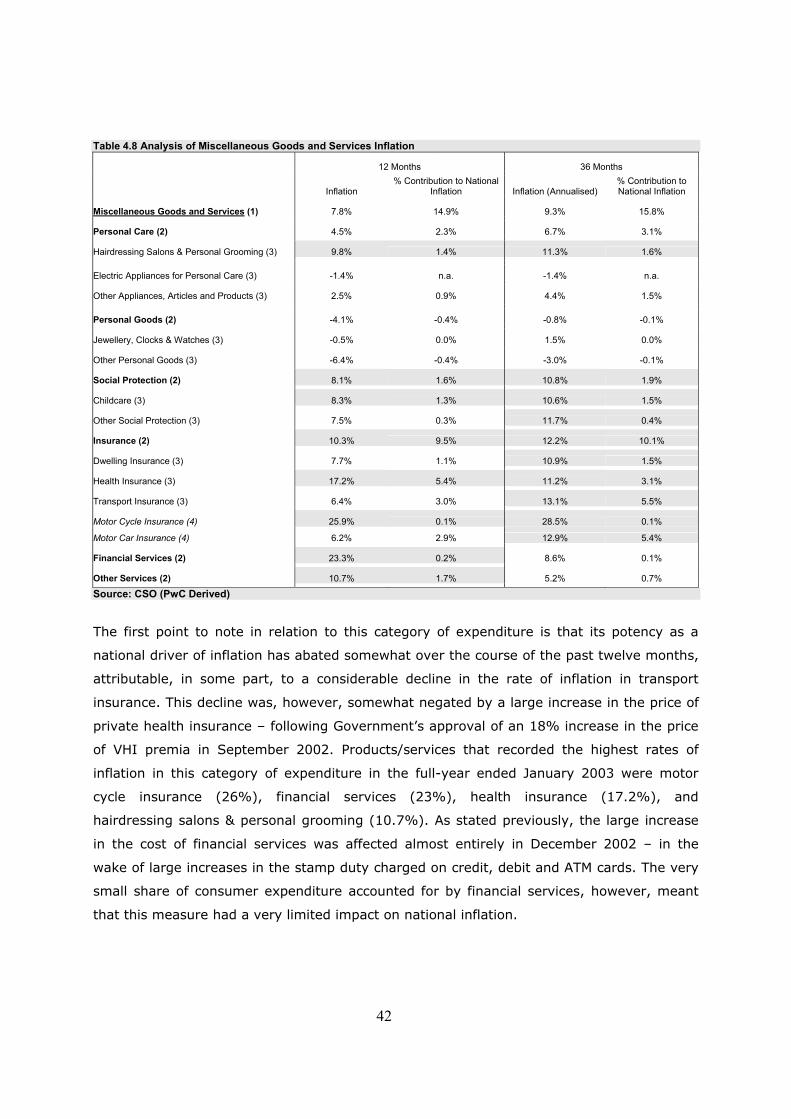
42
Table 4.8 Analysis of Miscellaneous Goods and Services Inflation
12 Months 36 Months
Inflation % Contribution to National
Inflation Inflation (Annualised) % Contribution to National Inflation
Miscellaneous Goods and Services (1) 7.8% 14.9% 9.3% 15.8%
Personal Care (2) 4.5% 2.3% 6.7% 3.1%
Hairdressing Salons & Personal Grooming (3) 9.8% 1.4% 11.3% 1.6%
Electric Appliances for Personal Care (3) -1.4% n.a. -1.4% n.a.
Other Appliances, Articles and Products (3) 2.5% 0.9% 4.4% 1.5%
Personal Goods (2) -4.1% -0.4% -0.8% -0.1%
Jewellery, Clocks & Watches (3) -0.5% 0.0% 1.5% 0.0%
Other Personal Goods (3) -6.4% -0.4% -3.0% -0.1%
Social Protection (2) 8.1% 1.6% 10.8% 1.9%
Childcare (3) 8.3% 1.3% 10.6% 1.5%
Other Social Protection (3) 7.5% 0.3% 11.7% 0.4%
Insurance (2) 10.3% 9.5% 12.2% 10.1%
Dwelling Insurance (3) 7.7% 1.1% 10.9% 1.5%
Health Insurance (3) 17.2% 5.4% 11.2% 3.1%
Transport Insurance (3) 6.4% 3.0% 13.1% 5.5%
Motor Cycle Insurance (4) 25.9% 0.1% 28.5% 0.1%
Motor Car Insurance (4) 6.2% 2.9% 12.9% 5.4%
Financial Services (2) 23.3% 0.2% 8.6% 0.1%
Other Services (2) 10.7% 1.7% 5.2% 0.7%
Source: CSO (PwC Derived)
The first point to note in relation to this category of expenditure is that its potency as a
national driver of inflation has abated somewhat over the course of the past twelve months,
attributable, in some part, to a considerable decline in the rate of inflation in transport
insurance. This decline was, however, somewhat negated by a large increase in the price of
private health insurance – following Government’s approval of an 18% increase in the price
of VHI premia in September 2002. Products/services that recorded the highest rates of
inflation in this category of expenditure in the full-year ended January 2003 were motor
cycle insurance (26%), financial services (23%), health insurance (17.2%), and
hairdressing salons & personal grooming (10.7%). As stated previously, the large increase
in the cost of financial services was affected almost entirely in December 2002 – in the
wake of large increases in the stamp duty charged on credit, debit and ATM cards. The very
small share of consumer expenditure accounted for by financial services, however, meant
that this measure had a very limited impact on national inflation.
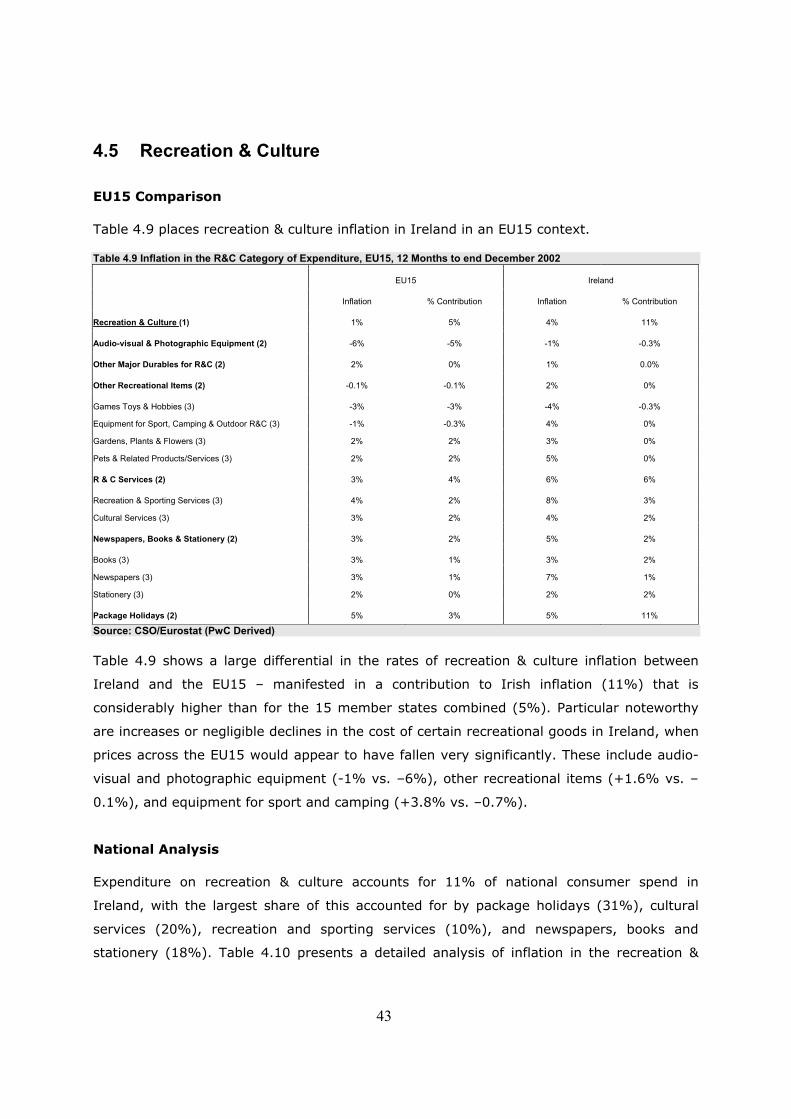
43
4.5 Recreation & Culture
EU15 Comparison Table 4.9 places recreation & culture inflation in Ireland in an EU15 context. Table 4.9 Inflation in the R&C Category of Expenditure, EU15, 12 Months to end December 2002
EU15 Ireland
Inflation % Contribution Inflation % Contribution
Recreation & Culture (1) 1% 5% 4% 11%
Audio-visual & Photographic Equipment (2) -6% -5% -1% -0.3%
Other Major Durables for R&C (2) 2% 0% 1% 0.0%
Other Recreational Items (2) -0.1% -0.1% 2% 0%
Games Toys & Hobbies (3) -3% -3% -4% -0.3%
Equipment for Sport, Camping & Outdoor R&C (3) -1% -0.3% 4% 0%
Gardens, Plants & Flowers (3) 2% 2% 3% 0%
Pets & Related Products/Services (3) 2% 2% 5% 0%
R & C Services (2) 3% 4% 6% 6%
Recreation & Sporting Services (3) 4% 2% 8% 3%
Cultural Services (3) 3% 2% 4% 2%
Newspapers, Books & Stationery (2) 3% 2% 5% 2%
Books (3) 3% 1% 3% 2%
Newspapers (3) 3% 1% 7% 1%
Stationery (3) 2% 0% 2% 2%
Package Holidays (2) 5% 3% 5% 11%
Source: CSO/Eurostat (PwC Derived) Table 4.9 shows a large differential in the rates of recreation & culture inflation between
Ireland and the EU15 – manifested in a contribution to Irish inflation (11%) that is
considerably higher than for the 15 member states combined (5%). Particular noteworthy
are increases or negligible declines in the cost of certain recreational goods in Ireland, when
prices across the EU15 would appear to have fallen very significantly. These include audio-
visual and photographic equipment (-1% vs. –6%), other recreational items (+1.6% vs. –
0.1%), and equipment for sport and camping (+3.8% vs. –0.7%).
National Analysis Expenditure on recreation & culture accounts for 11% of national consumer spend in
Ireland, with the largest share of this accounted for by package holidays (31%), cultural
services (20%), recreation and sporting services (10%), and newspapers, books and
stationery (18%). Table 4.10 presents a detailed analysis of inflation in the recreation &
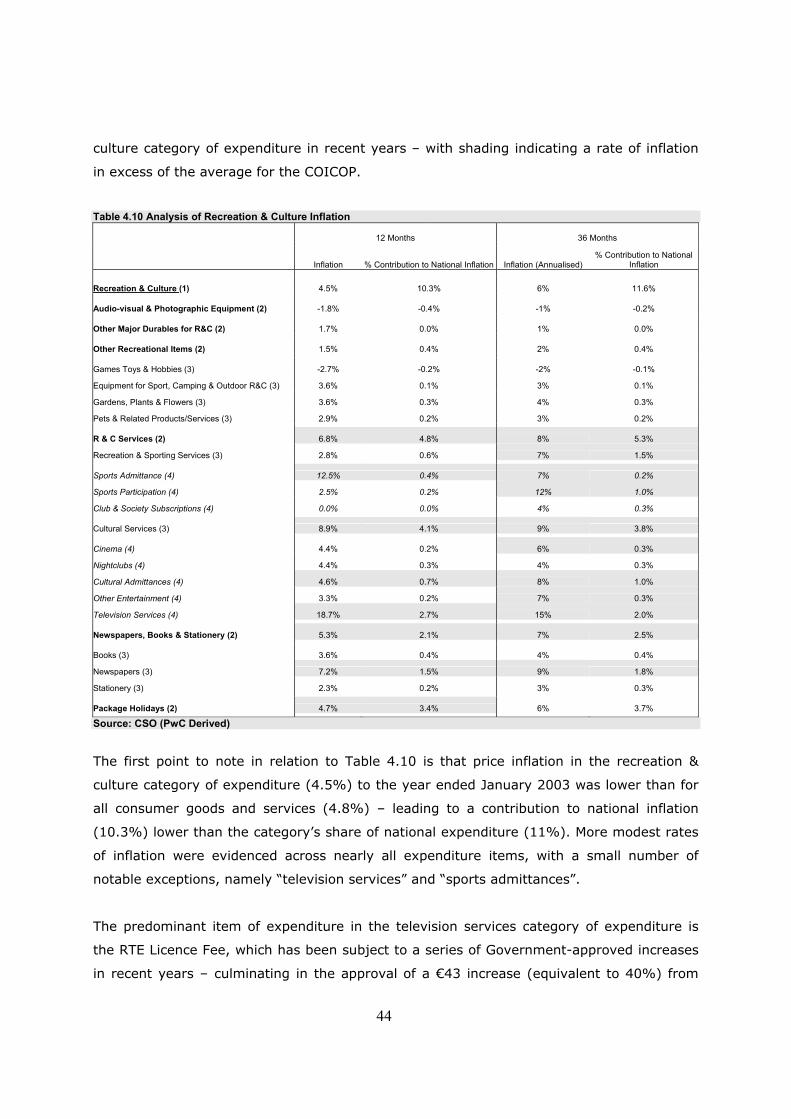
44
culture category of expenditure in recent years – with shading indicating a rate of inflation
in excess of the average for the COICOP.
Table 4.10 Analysis of Recreation & Culture Inflation
12 Months 36 Months
Inflation % Contribution to National Inflation Inflation (Annualised) % Contribution to National
Inflation
Recreation & Culture (1) 4.5% 10.3% 6% 11.6%
Audio-visual & Photographic Equipment (2) -1.8% -0.4% -1% -0.2%
Other Major Durables for R&C (2) 1.7% 0.0% 1% 0.0%
Other Recreational Items (2) 1.5% 0.4% 2% 0.4%
Games Toys & Hobbies (3) -2.7% -0.2% -2% -0.1%
Equipment for Sport, Camping & Outdoor R&C (3) 3.6% 0.1% 3% 0.1%
Gardens, Plants & Flowers (3) 3.6% 0.3% 4% 0.3%
Pets & Related Products/Services (3) 2.9% 0.2% 3% 0.2%
R & C Services (2) 6.8% 4.8% 8% 5.3%
Recreation & Sporting Services (3) 2.8% 0.6% 7% 1.5%
Sports Admittance (4) 12.5% 0.4% 7% 0.2%
Sports Participation (4) 2.5% 0.2% 12% 1.0%
Club & Society Subscriptions (4) 0.0% 0.0% 4% 0.3%
Cultural Services (3) 8.9% 4.1% 9% 3.8%
Cinema (4) 4.4% 0.2% 6% 0.3%
Nightclubs (4) 4.4% 0.3% 4% 0.3%
Cultural Admittances (4) 4.6% 0.7% 8% 1.0%
Other Entertainment (4) 3.3% 0.2% 7% 0.3%
Television Services (4) 18.7% 2.7% 15% 2.0%
Newspapers, Books & Stationery (2) 5.3% 2.1% 7% 2.5%
Books (3) 3.6% 0.4% 4% 0.4%
Newspapers (3) 7.2% 1.5% 9% 1.8%
Stationery (3) 2.3% 0.2% 3% 0.3%
Package Holidays (2) 4.7% 3.4% 6% 3.7%
Source: CSO (PwC Derived)
The first point to note in relation to Table 4.10 is that price inflation in the recreation &
culture category of expenditure (4.5%) to the year ended January 2003 was lower than for
all consumer goods and services (4.8%) – leading to a contribution to national inflation
(10.3%) lower than the category’s share of national expenditure (11%). More modest rates
of inflation were evidenced across nearly all expenditure items, with a small number of
notable exceptions, namely “television services” and “sports admittances”.
The predominant item of expenditure in the television services category of expenditure is
the RTE Licence Fee, which has been subject to a series of Government-approved increases
in recent years – culminating in the approval of a €43 increase (equivalent to 40%) from

45
January 2003. This increase explains the unusually high rate of inflation in the television
services expenditure item.
The second item of expenditure to record a higher rate of price inflation in the very recent
past than the in the three years to end January 2003 is “sports admittances”. The price of
sports admittances grew by 12.5% in the 12 month period under review, compared with an
average inflation rate of just 7% in the three year period. The anomalous nature of these
price increases is evidenced in the fact that inflation in all other expenditure items within
the “recreational and sport services” category has abated in recent times. There is no
apparent explanation for this development.
4.6 Health
EU15 Comparison Table 4.11 compares health inflation in Ireland with the EU15.
Table 4.11 Inflation in the Health Category of Expenditure, EU15, 12 Months to end December 2002
EU15 Ireland
Inflation % Contribution to National Inflation Inflation
% Contribution to National Inflation
Health (1) 3% 5% 8% 5%
Medical Products, Appliances & Equipment (2) 1% 1% 4% 1%
Pharmaceutical Products (3) 1% 1% 5% 1%
Other Medical Products, Therapeutic Appliances & Equipment (3) 2% 0% 3% 0%
Outpatient Services (2) 4% 3% 6% 1%
Medical Services, Paramedical Services (3) 5% 2% 5% 1%
Dental Services (3) 4% 1% 9% 1%
Hospitals Services (2) 4% 1% 16% 2%
Source: CSO/Eurostat (PwC Derived) Table 4.11 shows that the contribution of health-related items of consumer expenditure to
national inflation in Ireland in the 12 months to end December 2002 was consistent with the
experience for the EU15 as a whole – although rates of inflation were clearly much higher.
Health-related items of expenditure that experienced rates of inflation that were particularly
anomalous in an EU15 context are hospital services (16% vs. 4%) and pharmaceutical
products (1% vs. 5%).
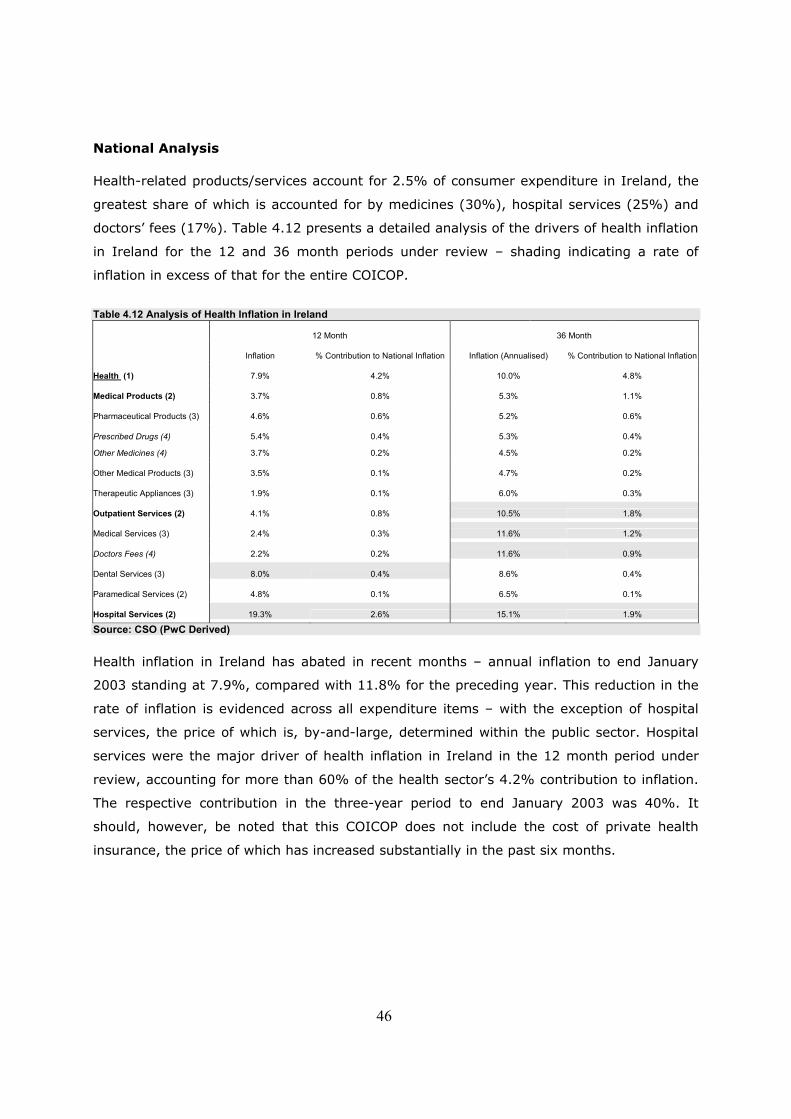
46
National Analysis Health-related products/services account for 2.5% of consumer expenditure in Ireland, the
greatest share of which is accounted for by medicines (30%), hospital services (25%) and
doctors’ fees (17%). Table 4.12 presents a detailed analysis of the drivers of health inflation
in Ireland for the 12 and 36 month periods under review – shading indicating a rate of
inflation in excess of that for the entire COICOP.
Table 4.12 Analysis of Health Inflation in Ireland
12 Month 36 Month
Inflation % Contribution to National Inflation Inflation (Annualised) % Contribution to National Inflation
Health (1) 7.9% 4.2% 10.0% 4.8%
Medical Products (2) 3.7% 0.8% 5.3% 1.1%
Pharmaceutical Products (3) 4.6% 0.6% 5.2% 0.6%
Prescribed Drugs (4) 5.4% 0.4% 5.3% 0.4%
Other Medicines (4) 3.7% 0.2% 4.5% 0.2%
Other Medical Products (3) 3.5% 0.1% 4.7% 0.2%
Therapeutic Appliances (3) 1.9% 0.1% 6.0% 0.3%
Outpatient Services (2) 4.1% 0.8% 10.5% 1.8%
Medical Services (3) 2.4% 0.3% 11.6% 1.2%
Doctors Fees (4) 2.2% 0.2% 11.6% 0.9%
Dental Services (3) 8.0% 0.4% 8.6% 0.4%
Paramedical Services (2) 4.8% 0.1% 6.5% 0.1%
Hospital Services (2) 19.3% 2.6% 15.1% 1.9%
Source: CSO (PwC Derived) Health inflation in Ireland has abated in recent months – annual inflation to end January
2003 standing at 7.9%, compared with 11.8% for the preceding year. This reduction in the
rate of inflation is evidenced across all expenditure items – with the exception of hospital
services, the price of which is, by-and-large, determined within the public sector. Hospital
services were the major driver of health inflation in Ireland in the 12 month period under
review, accounting for more than 60% of the health sector’s 4.2% contribution to inflation.
The respective contribution in the three-year period to end January 2003 was 40%. It
should, however, be noted that this COICOP does not include the cost of private health
insurance, the price of which has increased substantially in the past six months.
47
i see http://www.forfas.ie/publications/cc-pricing-eurozone/PWC-Forfas.pdf ii The strengths of a nationally representative approach are that it provides a truer reflection of the comparative cost of consumer goods/services for residents of particular countries, and controls for the fact that the price of consumer goods/services is determined to a large extent by consumption volumes/the extensiveness of distribution networks. The weakness is that it, at disaggregated level, means that price comparisons are drawn between products/services that may have fundamentally different production/packaging costs. Policy-advisory bodies (e.g. Eurostat) typically used a nationally representative approach, while the non-nationally representative approach characterises price comparisons aimed at advising organisations on the cost of remuneration levels for employees to be placed in overseas countries, e.g. Mercer Human Resource Consulting. iii Purchasing Power Parity iv The ranking of countries below Ireland is worthy of note to the extent that in 1999 France and Germany were the countries found to be marginally more expensive than Ireland. Figure 2.1, however, shows France to have slipped behind Luxembourg and the Netherlands in terms of the relative affordability of consumer goods/services in the intervening years. While much of this decline can be attributed to differentials in the rates of consumer price inflation between the countries, this development is partially attributable to the fact that PPP comparative price data is not specifically designed to show price developments over time (i.e. temporal comparison). This design limitation does not, however, affect Ireland’s ranking – which remains at two regardless of the methodology applied to update the 1999 data (i.e. application of inflation data vs. acceptance of updated Eurostat price data). The issue arises primarily when a group of countries are tightly grouped in terms of relatively affordability. v It should be noted that this price pertains to restaurants as opposed to bars. The price of a glass of Heineken in a bar is likely to be significantly less. vi See Annex 3 for full listing of traded and non-traded products/services. vii It should be noted that this analysis was carried out to COICOP 4 level, with the implication that certain of the product/service categories included in the “government-influenced” analysis are not subject to any Government influence. “Television services”, for example, incorporates the cost of privately-provided services such as NTL. Similarly, “third-level education” includes not just student registration fees, rather also the cost of maintaining a student away from home. viii i.e. those excisable products that were subject to an excise increase in Budgets 2003, 2002 and 2001.

48
Annex 1: Methodological Issues with Comparative
Price Surveys
Information Sources and Research Limitations
Introduction
This chapter describes the information sources used in meeting the core requirements of the Terms of
Reference for this study, and their respective strengths and weaknesses. In view of the considerable
difficulties inherent to any international study of comparative consumer prices, the focus here is on
sources of comparative price data across the eurozone. The remainder of this chapter comprises the
following sections.
• General issues that beset comparative price surveys.
• Description of methodology underpinning the computation of Eurostat PPP-derived comparative
price data.
• Strengths and weaknesses of Mercer Human Resource Consulting comparative price data as
used in this study,
• Description of comparative price data available from the European Commission.
General Limitations of Comparative Price Data
At overall level, limitations/issues inherent common to all/most sources of comparative price data for eurozone
countries are the following:
• National representativeness: the “national representativeness” of a comparative international
price survey refers to the extent to which the profile of goods/services priced seeks to mirror the
consumption patterns of residents of the country in questionviii. The strengths of a nationally
representative approach are that it provides a truer reflection of the comparative cost of consumer
goods/services for residents of particular countries, and controls for the fact that the price of
consumer goods/services is determined to a large extent by consumption volumes/the
extensiveness of distribution networks. The weakness is that it, at disaggregated level, means
that price comparisons are drawn between products/services that may have fundamentally
different production/packaging costs. Policy-advisory bodies (e.g. Eurostat) typically used a
nationally representative approach, while the non-nationally representative approach
characterises price comparisons aimed at advising organisations on the cost of remuneration
levels for employees to be placed in overseas countries, e.g. Mercer Human Resource
49
Consulting. To compensate for the weaknesses inherent to either approach, research findings
presented in Chapter 3 present findings from price comparison surveys using both;
• product/service weightings: related to the foregoing, nationally and non-nationally
representative comparative price surveys typically apply weightings to consumer goods/services
to reflect: a) divergent consumption patterns of eurozone nationalities or; b) the consumption
patterns of employees likely to be placed abroad. Again, a weakness of the weighted approach
(based on local consumption patterns) is that, at product/service category level (e.g. “off-licence
alcohol and tobacco”), one is frequently not comparing like with like. The alternative approach is
to rely solely on: a) unweighted baskets of goods/services; b) individual product or service price
comparisons. Again, Chapter 3 presents findings which are based on weighted and unweighted
samples of goods/services to overcome limitations inherent to each approach;
• comparability of products/services: the non-nationally representative approach seeks to
compare identical products across national boundaries. A major difficulty in doing so is the ability
to identify identical products/services. While there are a small number of products/services that
are truly global in nature, e.g. Big Mac ©, these are the exception. Even in the case of identically
branded products, local preferences and related product adjustments (e.g. distinct formulation of
Persil washing powder in Southern European economies), may mean that price differentials are
explained by product differences alone, as opposed to providing any indication of the relative
competitiveness of supply;
• city bias: finally, all of the comparative price data used in the preparation of this report are based
on price surveys carried out in the major urban areas/cities of the countries reviewed. The extent
to which this bias impairs the international comparability of price data depends on a number of
factors, most notably: a) the share of the national population accounted for by the major urban
centres; b) the representativeness of the city/cities chosen for examination and; c) the
consistency with which research findings are adjusted to account for a city bias.
As is clear from the foregoing, there are a series of issues associated with the collection of internationally
comparable consumer price data. While the consultants have sought, through the selection and use of
various data sources, to minimise these limitations – the data presented in Chapter 3 should be read as
indicative of Ireland’s relative standing in the eurozone only.
An issue also arose in relation to the consumer price inflation data provided by the CSO for the period
January 1997 to March 2002. The weightings assigned to the various categories of consumer expenditure
and their constituent goods/services were revised in December 2001. The nature of the data required for
the purpose of this exercise was of so detailed a nature as to make it not feasible to rebase the full
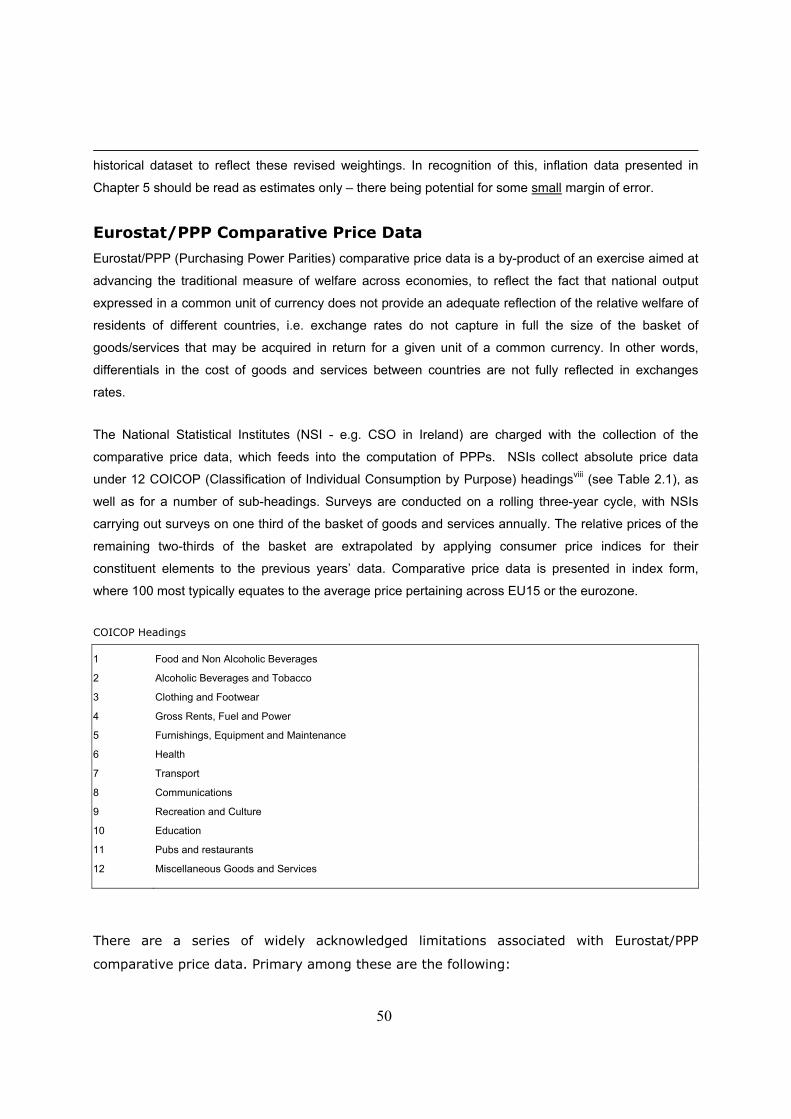
50
historical dataset to reflect these revised weightings. In recognition of this, inflation data presented in
Chapter 5 should be read as estimates only – there being potential for some small margin of error.
Eurostat/PPP Comparative Price Data
Eurostat/PPP (Purchasing Power Parities) comparative price data is a by-product of an exercise aimed at
advancing the traditional measure of welfare across economies, to reflect the fact that national output
expressed in a common unit of currency does not provide an adequate reflection of the relative welfare of
residents of different countries, i.e. exchange rates do not capture in full the size of the basket of
goods/services that may be acquired in return for a given unit of a common currency. In other words,
differentials in the cost of goods and services between countries are not fully reflected in exchanges
rates.
The National Statistical Institutes (NSI - e.g. CSO in Ireland) are charged with the collection of the
comparative price data, which feeds into the computation of PPPs. NSIs collect absolute price data
under 12 COICOP (Classification of Individual Consumption by Purpose) headingsviii (see Table 2.1), as
well as for a number of sub-headings. Surveys are conducted on a rolling three-year cycle, with NSIs
carrying out surveys on one third of the basket of goods and services annually. The relative prices of the
remaining two-thirds of the basket are extrapolated by applying consumer price indices for their
constituent elements to the previous years’ data. Comparative price data is presented in index form,
where 100 most typically equates to the average price pertaining across EU15 or the eurozone. COICOP Headings
1 Food and Non Alcoholic Beverages
2 Alcoholic Beverages and Tobacco
3 Clothing and Footwear
4 Gross Rents, Fuel and Power
5 Furnishings, Equipment and Maintenance
6 Health
7 Transport
8 Communications
9 Recreation and Culture
10 Education
11 Pubs and restaurants
12 Miscellaneous Goods and Services
There are a series of widely acknowledged limitations associated with Eurostat/PPP
comparative price data. Primary among these are the following:
51
• city bias – in common with other sources of information on comparative consumer
prices, Eurostat/PPP price surveys are carried out exclusively in capital cities.
Eurostat requires that NSIs provide “spatial adjustment factors”, to allow for the
adjustment of these prices to prices that are nationally representative, but the basis
on which such adjustment factors are computed can vary somewhat between
countries;
• consumption “representativeness”viii – there is a strong correlation between the
price of goods/services and volumes of consumption within a given country, i.e.
products/services that are in large demand tend to be relatively low-cost owing to
the potential for efficiencies. Thus, the baskets of goods/services selected must be
equally representative of consumption across country if comparability is to be
ensured. “Equi-characteristicity”, as this is termed, is, however, very difficult to
achieve in reality and the potential for some unquantifiable bias remains;
• disaggregated findings – as previously mentioned, Eurostat/PPP comparative price
data is a by-product of an exercise aimed at converting the national outputs of
different countries (as expressed in units for a common currency) into a measure,
that has some regard to the fact that exchange rates do not fully reflect price
differentials between different countries. Thus, the focus of the methodology used to
prepare PPPs focuses on ensuring reliability at the aggregate level, as opposed to
ensuring reliability at more disaggregated level, i.e. COICOP headings.
Notwithstanding this, every effort is made to ensure comparability of product/service
and reliability of price data at the level of the 12 COICOP headings at a minimum –
this being crucial to the ultimate accuracy of the aggregate outcome;
• temporal comparisons – similarly, PPPs are designed to give the best possible
estimate of country price relativities in a particular year, and are not ideally suited to
time series linking/comparison. This is because ongoing changes in data and
methods used in computing PPPs may affect the strict comparability of the data, year
on year. However, in spite of this limitation Eurostat/PPP comparative price data
remains the primary source of data used for price convergence/divergence analysis
within Europe.
Thus, in conclusion, there is some level of uncertainty associated with Eurostat/PPP comparative price
data, which means that it may be somewhat misleading to establish a strict order of ranking when
countries are clustered around a very narrow range of outcomes. This point should be borne in mind in
reviewing Sections 3.2 and 3.4.1 of the next Chapter, which present nationally-representative and non-nationally representative eurozone price comparisons based on Eurostat/PPP data respectively.
52
Mercer Human Resource Consulting
Mercer Human Resource Consulting is a global HR consultancy practice. The company has a
long-established tradition in advising large corporates on expatriate remuneration packages,
based largely on its bi-annual, and highly-regarded, survey of the cost of living in more than
200 cities world-wide. The surveys are conducted in March and September of each year and
cover a range of headings, not entirely dissimilar to those presented in Table 2.1. Absolute
€ price data is provided for more than 200 products/services, distinguishing between prices
in low -, medium - and high-priced retail outlets/service providers. The survey is non-
nationally representative, i.e. the same products/services are priced in all cities, although
findings may be weighted to reflect a) local consumption patterns; or b) the consumption
patterns of residents of a defined country of origin. In contrast to the approach taken to the
city data compiled for the purposes of Eurostat PPPs, city data is not adjusted to make it
nationally representative – reflecting the fact that expatriates are most commonly located in
major cities. To compensate for this, and to reflect the fact that Dublin counts among the
smallest capital cities in Europe, the consultants aggregated prices across two cities in the
case of the larger eurozone countries, namely Italy (Rome and Milan), France (Paris and
Lyons), Germany (Frankfurt and Hamburg) and Spain (Barcelona and Madrid). Prices in the
remainder of the eurozone countries are assumed to be as per the capital city. This is a
limitation of this data source. Further limitations are the fact that the price data does not
lend itself very well to aggregation (i.e. a basket of goods) and is not nationally
representative, although a non-nationally representative approach provides a useful context
to the nationally representative findings of Eurostat/PPP data.
European Commission
DGs Internal Market and Competition of the European Commission have prepared/commissioned a
number of international price comparison studies within Europe. These include studies on the relative
price of electronic consumer goods, selected fresh food items, various groceries including food, bank charges and motor vehicles. Some combination of factors, most notably the definition of service
included, the level of disaggregation of price data by country and the exclusion of Ireland, meant that only
one of these studies had a particular relevance to this exercise. This was the motor vehicle study, findings
from which are presented in Section 3.4. The European Commission also uses Eurostat/PPP data to
prepare an annual city cost of living study (aimed at determining the remuneration packages of
Commission officials seconded outside of Brussels), findings from which are also presented in the next
chapter.
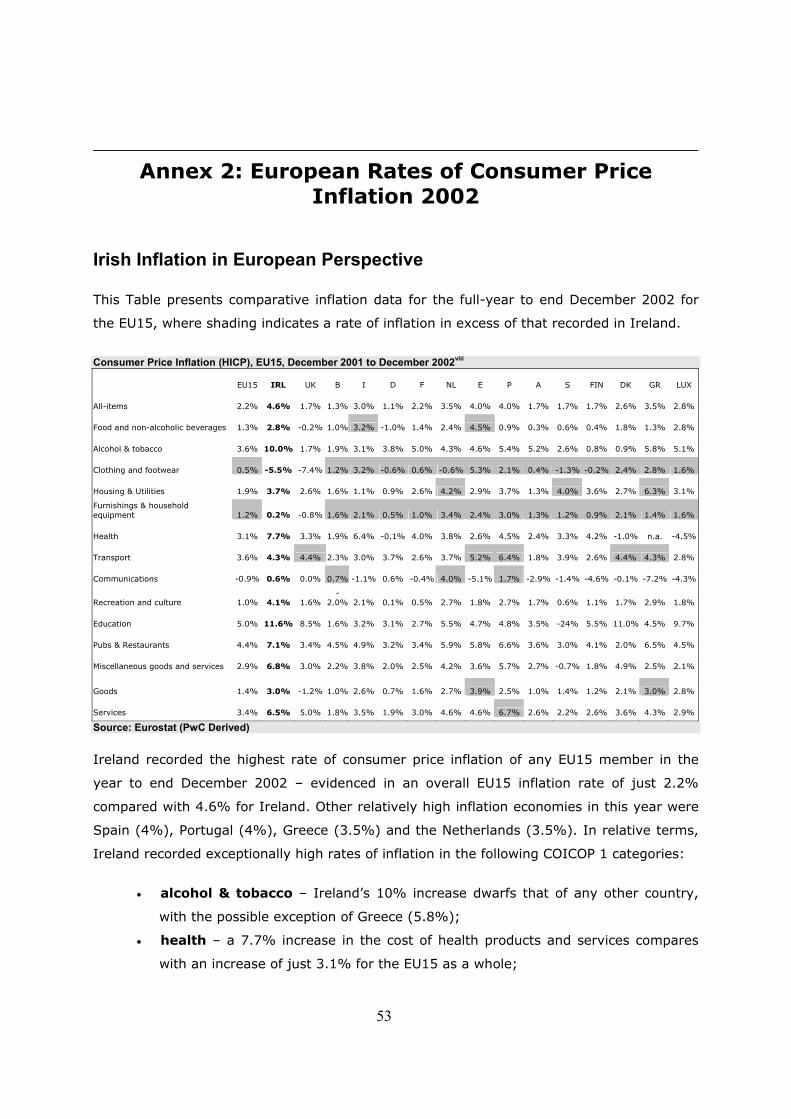
53
Annex 2: European Rates of Consumer Price
Inflation 2002
Irish Inflation in European Perspective This Table presents comparative inflation data for the full-year to end December 2002 for
the EU15, where shading indicates a rate of inflation in excess of that recorded in Ireland.
Consumer Price Inflation (HICP), EU15, December 2001 to December 2002viii
EU15 IRL UK B I D F NL E P A S FIN DK GR LUX All-items 2.2% 4.6% 1.7% 1.3% 3.0% 1.1% 2.2% 3.5% 4.0% 4.0% 1.7% 1.7% 1.7% 2.6% 3.5% 2.8% Food and non-alcoholic beverages 1.3% 2.8% -0.2% 1.0% 3.2% -1.0% 1.4% 2.4% 4.5% 0.9% 0.3% 0.6% 0.4% 1.8% 1.3% 2.8% Alcohol & tobacco 3.6% 10.0% 1.7% 1.9% 3.1% 3.8% 5.0% 4.3% 4.6% 5.4% 5.2% 2.6% 0.8% 0.9% 5.8% 5.1% Clothing and footwear 0.5% -5.5% -7.4% 1.2% 3.2% -0.6% 0.6% -0.6% 5.3% 2.1% 0.4% -1.3% -0.2% 2.4% 2.8% 1.6% Housing & Utilities 1.9% 3.7% 2.6% 1.6% 1.1% 0.9% 2.6% 4.2% 2.9% 3.7% 1.3% 4.0% 3.6% 2.7% 6.3% 3.1% Furnishings & household equipment 1.2% 0.2% -0.8% 1.6% 2.1% 0.5% 1.0% 3.4% 2.4% 3.0% 1.3% 1.2% 0.9% 2.1% 1.4% 1.6% Health 3.1% 7.7% 3.3% 1.9% 6.4% -0.1% 4.0% 3.8% 2.6% 4.5% 2.4% 3.3% 4.2% -1.0% n.a. -4.5% Transport 3.6% 4.3% 4.4% 2.3% 3.0% 3.7% 2.6% 3.7% 5.2% 6.4% 1.8% 3.9% 2.6% 4.4% 4.3% 2.8% Communications -0.9% 0.6% 0.0% 0.7% -1.1% 0.6% -0.4% 4.0% -5.1% 1.7% -2.9% -1.4% -4.6% -0.1% -7.2% -4.3%
Recreation and culture 1.0% 4.1% 1.6% -
2.0% 2.1% 0.1% 0.5% 2.7% 1.8% 2.7% 1.7% 0.6% 1.1% 1.7% 2.9% 1.8% Education 5.0% 11.6% 8.5% 1.6% 3.2% 3.1% 2.7% 5.5% 4.7% 4.8% 3.5% -24% 5.5% 11.0% 4.5% 9.7% Pubs & Restaurants 4.4% 7.1% 3.4% 4.5% 4.9% 3.2% 3.4% 5.9% 5.8% 6.6% 3.6% 3.0% 4.1% 2.0% 6.5% 4.5% Miscellaneous goods and services 2.9% 6.8% 3.0% 2.2% 3.8% 2.0% 2.5% 4.2% 3.6% 5.7% 2.7% -0.7% 1.8% 4.9% 2.5% 2.1% Goods 1.4% 3.0% -1.2% 1.0% 2.6% 0.7% 1.6% 2.7% 3.9% 2.5% 1.0% 1.4% 1.2% 2.1% 3.0% 2.8% Services 3.4% 6.5% 5.0% 1.8% 3.5% 1.9% 3.0% 4.6% 4.6% 6.7% 2.6% 2.2% 2.6% 3.6% 4.3% 2.9% Source: Eurostat (PwC Derived) Ireland recorded the highest rate of consumer price inflation of any EU15 member in the
year to end December 2002 – evidenced in an overall EU15 inflation rate of just 2.2%
compared with 4.6% for Ireland. Other relatively high inflation economies in this year were
Spain (4%), Portugal (4%), Greece (3.5%) and the Netherlands (3.5%). In relative terms,
Ireland recorded exceptionally high rates of inflation in the following COICOP 1 categories:
• alcohol & tobacco – Ireland’s 10% increase dwarfs that of any other country,
with the possible exception of Greece (5.8%);
• health – a 7.7% increase in the cost of health products and services compares
with an increase of just 3.1% for the EU15 as a whole;
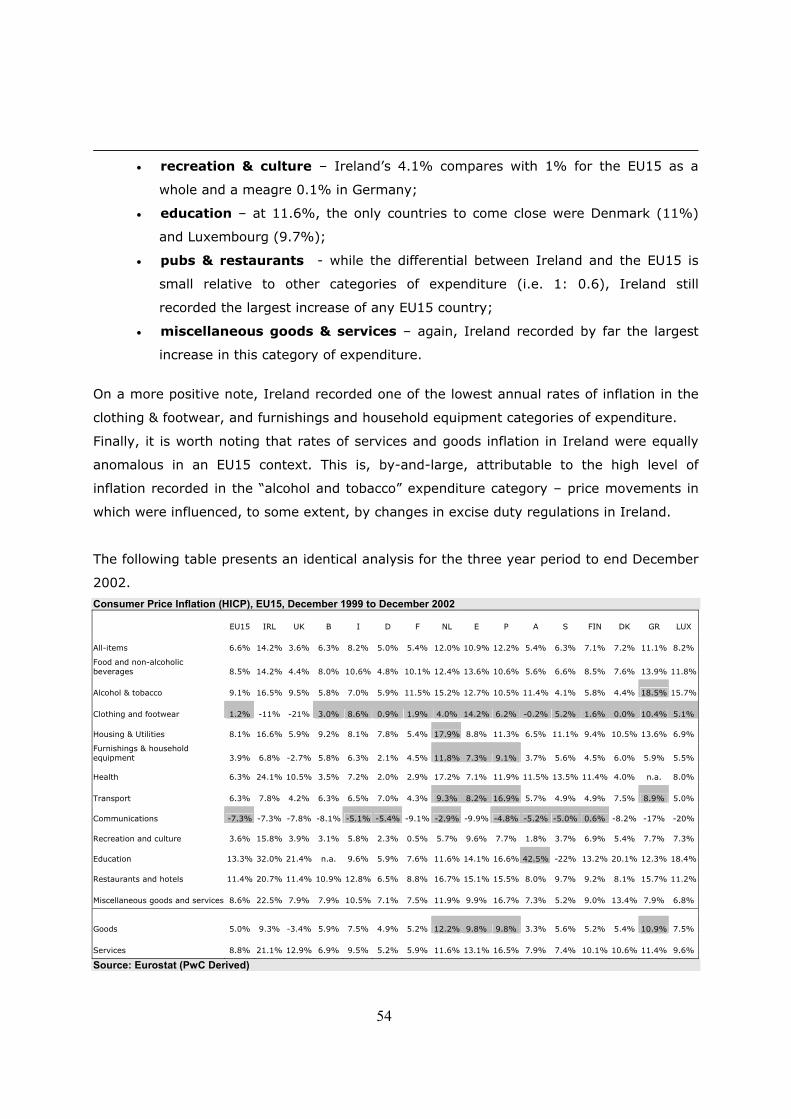
54
• recreation & culture – Ireland’s 4.1% compares with 1% for the EU15 as a
whole and a meagre 0.1% in Germany;
• education – at 11.6%, the only countries to come close were Denmark (11%)
and Luxembourg (9.7%);
• pubs & restaurants - while the differential between Ireland and the EU15 is
small relative to other categories of expenditure (i.e. 1: 0.6), Ireland still
recorded the largest increase of any EU15 country;
• miscellaneous goods & services – again, Ireland recorded by far the largest
increase in this category of expenditure.
On a more positive note, Ireland recorded one of the lowest annual rates of inflation in the
clothing & footwear, and furnishings and household equipment categories of expenditure.
Finally, it is worth noting that rates of services and goods inflation in Ireland were equally
anomalous in an EU15 context. This is, by-and-large, attributable to the high level of
inflation recorded in the “alcohol and tobacco” expenditure category – price movements in
which were influenced, to some extent, by changes in excise duty regulations in Ireland.
The following table presents an identical analysis for the three year period to end December
2002.
Consumer Price Inflation (HICP), EU15, December 1999 to December 2002
EU15 IRL UK B I D F NL E P A S FIN DK GR LUX All-items 6.6% 14.2% 3.6% 6.3% 8.2% 5.0% 5.4% 12.0% 10.9% 12.2% 5.4% 6.3% 7.1% 7.2% 11.1% 8.2% Food and non-alcoholic beverages 8.5% 14.2% 4.4% 8.0% 10.6% 4.8% 10.1% 12.4% 13.6% 10.6% 5.6% 6.6% 8.5% 7.6% 13.9% 11.8% Alcohol & tobacco 9.1% 16.5% 9.5% 5.8% 7.0% 5.9% 11.5% 15.2% 12.7% 10.5% 11.4% 4.1% 5.8% 4.4% 18.5% 15.7% Clothing and footwear 1.2% -11% -21% 3.0% 8.6% 0.9% 1.9% 4.0% 14.2% 6.2% -0.2% 5.2% 1.6% 0.0% 10.4% 5.1% Housing & Utilities 8.1% 16.6% 5.9% 9.2% 8.1% 7.8% 5.4% 17.9% 8.8% 11.3% 6.5% 11.1% 9.4% 10.5% 13.6% 6.9% Furnishings & household equipment 3.9% 6.8% -2.7% 5.8% 6.3% 2.1% 4.5% 11.8% 7.3% 9.1% 3.7% 5.6% 4.5% 6.0% 5.9% 5.5% Health 6.3% 24.1% 10.5% 3.5% 7.2% 2.0% 2.9% 17.2% 7.1% 11.9% 11.5% 13.5% 11.4% 4.0% n.a. 8.0% Transport 6.3% 7.8% 4.2% 6.3% 6.5% 7.0% 4.3% 9.3% 8.2% 16.9% 5.7% 4.9% 4.9% 7.5% 8.9% 5.0% Communications -7.3% -7.3% -7.8% -8.1% -5.1% -5.4% -9.1% -2.9% -9.9% -4.8% -5.2% -5.0% 0.6% -8.2% -17% -20% Recreation and culture 3.6% 15.8% 3.9% 3.1% 5.8% 2.3% 0.5% 5.7% 9.6% 7.7% 1.8% 3.7% 6.9% 5.4% 7.7% 7.3% Education 13.3% 32.0% 21.4% n.a. 9.6% 5.9% 7.6% 11.6% 14.1% 16.6% 42.5% -22% 13.2% 20.1% 12.3% 18.4% Restaurants and hotels 11.4% 20.7% 11.4% 10.9% 12.8% 6.5% 8.8% 16.7% 15.1% 15.5% 8.0% 9.7% 9.2% 8.1% 15.7% 11.2% Miscellaneous goods and services 8.6% 22.5% 7.9% 7.9% 10.5% 7.1% 7.5% 11.9% 9.9% 16.7% 7.3% 5.2% 9.0% 13.4% 7.9% 6.8% Goods 5.0% 9.3% -3.4% 5.9% 7.5% 4.9% 5.2% 12.2% 9.8% 9.8% 3.3% 5.6% 5.2% 5.4% 10.9% 7.5% Services 8.8% 21.1% 12.9% 6.9% 9.5% 5.2% 5.9% 11.6% 13.1% 16.5% 7.9% 7.4% 10.1% 10.6% 11.4% 9.6% Source: Eurostat (PwC Derived)
55
Key messages emerging from the three year analysis are broadly consistent with those from
the 12 month analysis. There are, however, a number of noteworthy distinctions, namely:
• three year inflation in the food and non-alcoholic beverages category of
expenditure in Ireland was higher than in any other EU15 country – although the
ratio of Irish inflation to EU15 inflation was as per the single year analysis;
• a review of rates of services inflation in Ireland and across the EU15 indicates
some level of normalisation of Irish rates in recent months – the Ireland: EU15
ratio of services inflation standing at 1:2.4 in the three year period to end
December 2002, compared with 1:1.9 in the 12 month analysis;
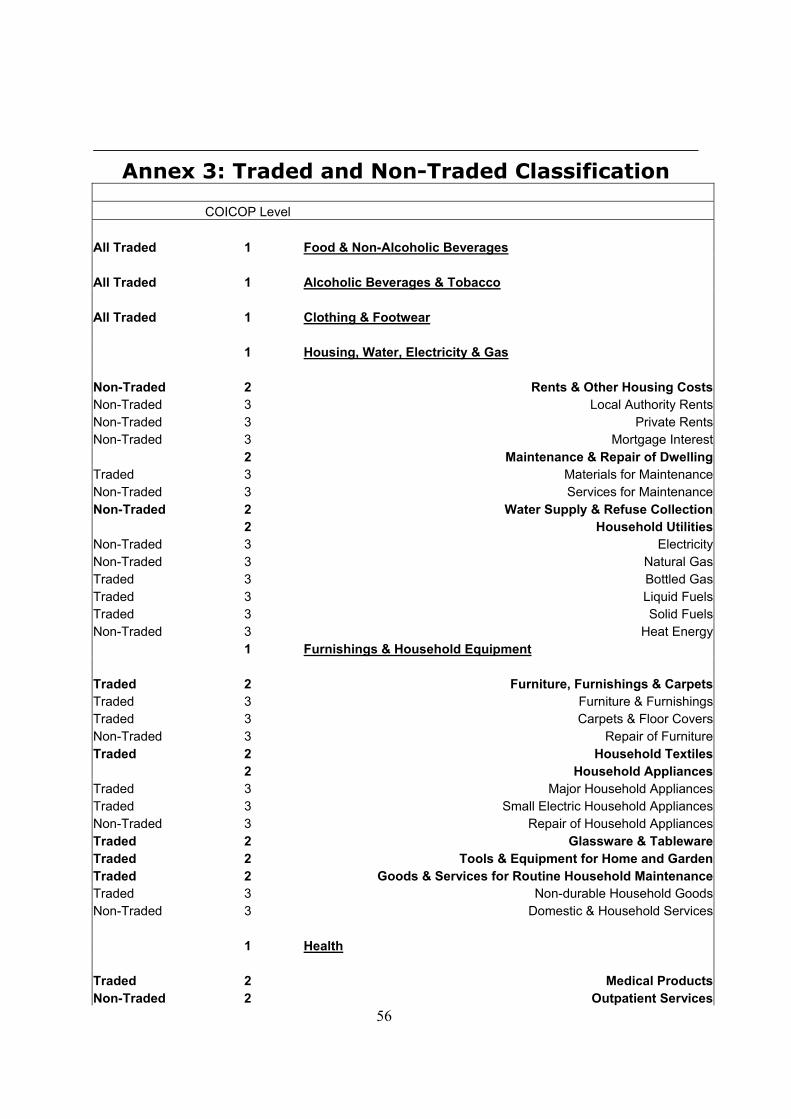
56
Annex 3: Traded and Non-Traded Classification
COICOP Level All Traded 1 Food & Non-Alcoholic Beverages All Traded 1 Alcoholic Beverages & Tobacco All Traded 1 Clothing & Footwear 1 Housing, Water, Electricity & Gas Non-Traded 2 Rents & Other Housing CostsNon-Traded 3 Local Authority Rents Non-Traded 3 Private RentsNon-Traded 3 Mortgage Interest 2 Maintenance & Repair of DwellingTraded 3 Materials for MaintenanceNon-Traded 3 Services for MaintenanceNon-Traded 2 Water Supply & Refuse Collection 2 Household UtilitiesNon-Traded 3 ElectricityNon-Traded 3 Natural GasTraded 3 Bottled GasTraded 3 Liquid FuelsTraded 3 Solid FuelsNon-Traded 3 Heat Energy 1 Furnishings & Household Equipment Traded 2 Furniture, Furnishings & CarpetsTraded 3 Furniture & FurnishingsTraded 3 Carpets & Floor CoversNon-Traded 3 Repair of FurnitureTraded 2 Household Textiles 2 Household AppliancesTraded 3 Major Household AppliancesTraded 3 Small Electric Household AppliancesNon-Traded 3 Repair of Household AppliancesTraded 2 Glassware & TablewareTraded 2 Tools & Equipment for Home and GardenTraded 2 Goods & Services for Routine Household MaintenanceTraded 3 Non-durable Household GoodsNon-Traded 3 Domestic & Household Services 1 Health Traded 2 Medical ProductsNon-Traded 2 Outpatient Services
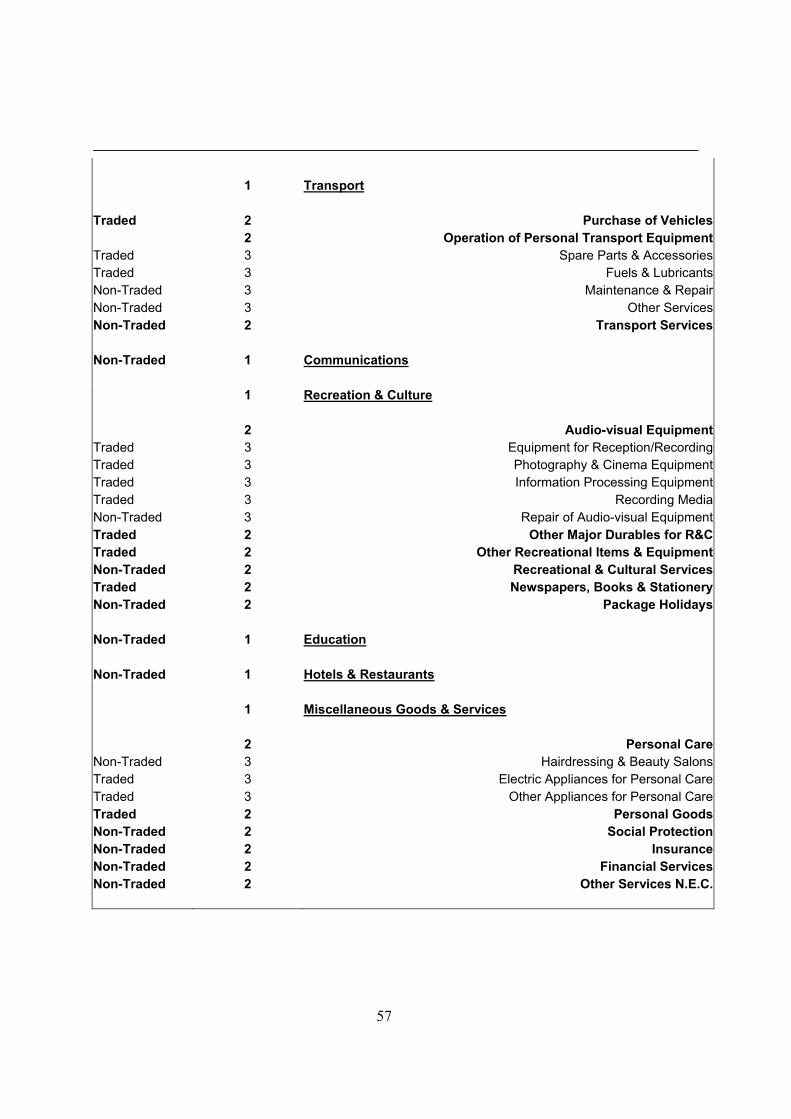
57
1 Transport Traded 2 Purchase of Vehicles 2 Operation of Personal Transport EquipmentTraded 3 Spare Parts & AccessoriesTraded 3 Fuels & LubricantsNon-Traded 3 Maintenance & RepairNon-Traded 3 Other ServicesNon-Traded 2 Transport Services Non-Traded 1 Communications 1 Recreation & Culture 2 Audio-visual EquipmentTraded 3 Equipment for Reception/RecordingTraded 3 Photography & Cinema EquipmentTraded 3 Information Processing EquipmentTraded 3 Recording MediaNon-Traded 3 Repair of Audio-visual EquipmentTraded 2 Other Major Durables for R&CTraded 2 Other Recreational Items & EquipmentNon-Traded 2 Recreational & Cultural ServicesTraded 2 Newspapers, Books & StationeryNon-Traded 2 Package Holidays Non-Traded 1 Education Non-Traded 1 Hotels & Restaurants 1 Miscellaneous Goods & Services 2 Personal CareNon-Traded 3 Hairdressing & Beauty SalonsTraded 3 Electric Appliances for Personal CareTraded 3 Other Appliances for Personal CareTraded 2 Personal GoodsNon-Traded 2 Social ProtectionNon-Traded 2 InsuranceNon-Traded 2 Financial ServicesNon-Traded 2 Other Services N.E.C.
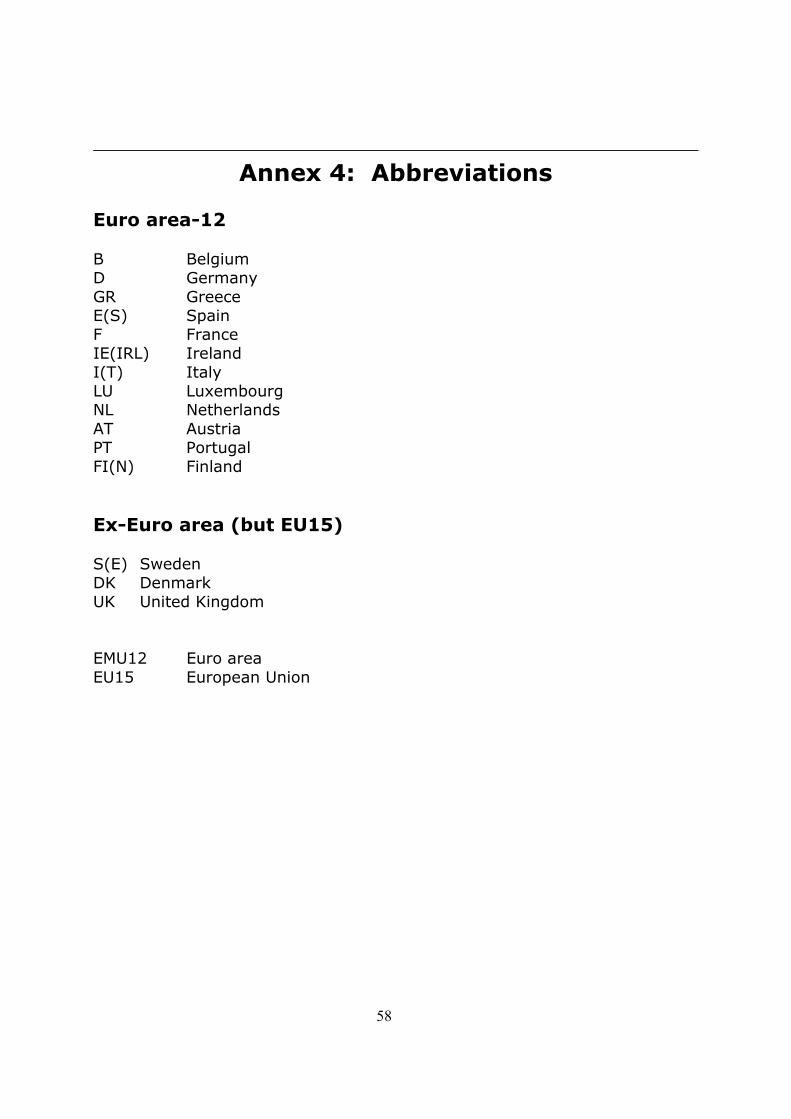
58
Annex 4: Abbreviations Euro area-12 B Belgium D Germany GR Greece E(S) Spain F France IE(IRL) Ireland I(T) Italy LU Luxembourg NL Netherlands AT Austria PT Portugal FI(N) Finland Ex-Euro area (but EU15) S(E) Sweden DK Denmark UK United Kingdom EMU12 Euro area EU15 European Union