Embed Size (px)
Citation preview

1
NCAP Annual Report 2013-14
© 2014 National Centre for Agricultural Economics and Policy Research
Published
April 2014
Editorial Team
Usha Ahuja
Viswanatha Reddy K.
Deepak Tanwar
Published By
Ramesh Chand
Director
NCAP, New Delhi- 110 012
Printed at
Venus Printers
Naraina Industrial Area
Phase- 1, New Delhi- 110 028

2
PREFACE
Agriculture sector has recorded 3.80 per cent annual growth during
last 10 years ending with 2013-14, which is the highest growth recorded
in any decade since 1950-51. The growth has been broad based,
productivity driven and also more favourable for less developed states.
These achievements have come with new challenges. The biggest
challenge is high rate of food inflation. The factors on demand side are
likely to keep pressure on food prices. Therefore the focus has to be on
supply side factors – involving production and marketing. On
production side, reduction in average cost of production and on
marketing side reduction in price spread between farm and consumers are the two routes to
influence prices. This, in turn, involves, improvement in efficiency at all levels from sowing
to harvest and harvest to market and market to consumers. It is not a simple task but it is not
impossible. It requires concerted efforts on several fronts including agricultural R&D and
technology, taking technology to field, and appropriate policies and favourable interactions
between different aspects.
Experience of last two decades shows that close coordination between technology
aspects, extension aspects, non-price variables and price variables is crucial determinant of
desired outcomes. Enough evidence on this is available from state level experience. Close to
half of the major states in India achieved more than 4 per cent growth in agricultural
production in recent period which enabled the country as a whole to move closer to 4 per cent
growth at national level. The state level experiences also indicate that these achievements are
the result of incentives for producers, spread of technology, strong support system for
enhancing production, and in some cases institutional factors. Such experiences underline in-
depth understanding of role of different types of factors in affecting agricultural performance
and how interactions among different factors aid and abet various outcomes. Role of
agricultural economics and policy research is crucial in this as this type of research alone can
understand interactions among policy, technology, institutions, and infrastructure and
envisage their collaborative role. NCAP has played important role in diagnosis of low
performance of agriculture in some phases and it was actively involved in framing policies
for putting agriculture sector on higher growth trajectory. The Centre is providing policy
input on regular basis to top leadership of ICAR and to various ministries at Centre and in
some states. NCAP is also heading important committees to address issues related to farmers
and macro economy. Centre’s input is well recognized and sought after by various
stakeholders. The Centre is also involved in internal assessment of performance of ICAR
institutes. All this could be possible due to focused and purpose oriented research undertaken
at NCAP and strong support from ICAR. I hope NCAP will soon come with research based
solution to sustain agriculture growth and contain food inflation.
Besides research and policy inputs NCAP has also made significant contributions in capacity
development and in expanding research under network mode. NCAP is now undertaking
research in collaboration with 23 institutions in the country and addressing state and regional
level issues. Director NCAP has been a resource person for SAARC, G-20 and couple of
other international bodies besides responding to needs of Department of Agriculture and
Cooperation (DAC), Ministry of Finance and Ministry of Commerce and Planning
Commission.

3
The Centre continues to receive overwhelming support from the ICAR in terms of resources,
guidance and various other facilities. We are grateful to Dr. S. Ayyappan, Director General,
Indian Council of Agriculture Research (ICAR) and Secretary, Department of Agriculture
Research and Education (DARE), Government of India for increased involvement of NCAP
in strategic matters related to agriculture R&D and development. We offer our gratitude to
Dr. Arvind Kumar, Deputy Director General (Education), for his strong support to NCAP in
achieving mandate of the Centre.
My colleague Dr. Usha Ahuja, Principal Scientist, assisted by Viswanatha Reddy, K.
compiled and edited the material presented in the report. I appreciate their dedication and
hard work in preparing the manuscript. The document was arranged and formatted and
systematically organized by Mr. Deepak Tanwar. I also acknowledge the contribution of all
the scientists and other staff for various achievements of NCAP during the year 2013-14. I
thank all of them and others who have helped directly or indirectly in bringing out this report.
Ramesh Chand
Director
4
LIST OF ACRONYMS
ABARES Australian Bureau of Agricultural and Resource Economics and Sciences
ADB Asian Development Bank
AERA Agricultural Economics Research Association
AICIL Agriculture Insurance Company of India Limited
AKMU Agricultural Knowledge Management Unit
AMIS Agricultural Market Information System
ANGRAU Acharya N G Ranga Agricultural University
APAARI Asia Pacific Association of Agricultural Research Institutions
ARIS Agricultural Research Information System
ASEAN Association of South-East Asian Nations
ASRB Agricultural Scientist Recruitment Board
BCR Benefit-Cost Ratio
BE Biennium Ending
BHU Banaras Hindu University
BMGF Bill & Melinda Gates Foundation
CACP Commission on Agricultural Cost and Prices
CCOS Coordination Committee for Organization of Studies
CeRA Consortium for e-Resources in Agriculture
CES Consumer Expenditure Survey
CGIAR Consultative Group on International Agricultural Research
CMIE Centre for Monitoring Indian Economy
CP Control Programme
CPF Country Programming Framework
CRIDA Central Research Institute for Dryland Agriculture
CRS Constant Return to Scale
CSO Central Statistical Organisation
DAC Department of Agriculture and Cooperation
DARE Department of Agricultural Research and Education
DMU Decision Making Units
DPSIR Driving Force _ Pressure _ State _ Impact_ Response
DWR Directorate of Wheat Research
EPW Economic and Political Weekly
ERNET Education and Research Network
ESCAP Economic and Social Commission for Asia
ESI Environmental Sustainability Index

5
ETL Extraction, Transformation, Loading
FAO Food and Agriculture Organization of United Nations
FMD Foot and Mouth Disease
GCA Gross Cropped Area
GDP Gross Domestic Product
GIDR Gujarat Institute of Development Research
GoI Government of India
GUI Graphic Use Interface
HRD Human resource development
IARI Indian Agricultural Research Institute
IASRI Indian Agricultural Statistics Research Institute
ICAR Indian Council of Agricultural Research
ICMR Indian Council of Medical Research
ICRIER Indian Council for Research on International Economic Relationships
ICRISAT International Crops Research Institute for the Semi_Arid Tropics
ICT Information and Communication Technology
IDS Institute of Development Studies
IES Indian Economic Service
IFPRI International Food Policy Research Institute
IGIDR Indira Gandhi Institute of Development Research
IIPR Indian Institute of Pulse Research
IMC Institute Management Committee
IP Intellectual Property
IPM Integrated Pest Management
IPR Intellectual Property Rights
IRC Institute Research Council
ISAE Indian Society of Agricultural Economics
ISEC Institute for Social and Economic Change
IWMI International Water Management Institute
JICA Japan International Cooperation Agency
JNU Jawaharlal Nehru University
JSC Joint Staff Council
KCC Kisan Credit Card
KSAMB Karnataka State Agricultural Marketing Board
MAFSU Maharashtra Animal and Fishery Sciences University
MC Management Committee
MGNREGS Mahatma Gandhi National Rural Employment Guarantee Scheme

6
MSP Minimum Support Price
MULLaRP Mungbean, Urdbean, Lentil, Lathyrus, Rajmash and Field Pea
NAAS National Academy of Agricultural Sciences
NAIP National Agricultural Innovation Project
NARS National Agricultural Research System
NASC National Agricultural Science Centre
NCAER National Council for Applied Economic Research
NDRI National Diary Research Institute
NIC National Informatics Centre
NICRA National Initiative for Climate Resilient Agriculture
NIN National Institute of Nutrition
NIPFP National Institute of Public Finance and Policy
NISCAIR National Institute of Science, Communication and Information Resources
NISTADS National Institute of Science, Technology and Development Studies
NPL National Physical Laboratory
NPS National pension System
NPV Net Present Value
NSA Net Sown Area
NSDP Net State Domestic Product
NSSO National Sample Survey Organisation
OTA Over time allowance
PAU Punjab Agricultural University
PDS Public Distribution System
PME Prioritization, Monitoring and Evaluation
QRT Quinquennial Review Team
R & D Research and Development
RAC Research Advisory Committee
RFD Results Framework Documents
S&T Science & Technology
SAARC South Asian Association for Regional Co-operation
SAC SAARC Agriculture Centre
SACs South Asian Countries
SAUs State Agricultural Universities
SCI Science Citation Index
SHGs Self Help Groups
SMS Short Message Service
SPIA Standing Panel on Impact Assessment

7
SRI System of Rice Intensification
SRR Seed Replacement Ratio
TCARD Technical Committee on Agricultural and Rural Development
TE Triennium Ending
TECHEF Technical Efficiency
TFP Total Factor Productivity
TNAU Tamil Nadu Agricultural University
UNCTAD United Nations Conference on Trade and Development
VDSA Village Dynamics in South Asia
VOC Value of Crop Output
V-PAGe Visioning, Policy Analysis and Gender
VRS Variable Returns to Scale
WBSTFP Web Based Software for Computation of Total Factor Productivity
WDPs Watershed Development Programmes
WEF World Economic Forum
WIGISAT Wine Grape Insurance Structuring Automation Tool
WSTs Water-Saving Technologies

8
CONTENTS
Preface
List of Tables
List of Figures
Executive Summary
I Profile of NCAP
II Research Achievements
Technology Policy
Sustainable Agricultural Systems
Markets and Trade
Institutional Change
Agricultural Growth and Modeling
III Policy Interactions and Advocacy
IV Awards/ Recognitions
V Publications
VI On-going Research Projects
VII Consultancy Research
VII Research Advisory Committee
IX Management Committee
X NCAP Committees
XI Participation in Scientific Activities
XII Visits Abroad
XIII Capacity Building Activities
XIV Lectures Delivered by NCAP Scientists
XV Distinguished Visitors
XVI Personnel
XVII Trainings Attended
XVIII Other Information

9
List of Tables
Sl. No Title Page No
Table 1 Some performance parameters of NCAP website
Table 2 Expenditure during 2013-14
Table 3 Staff position during 2013-14
Table 4 The trend in technical change, efficiency change and total factor
productivity change during two periods, across selected states
Table 5 Distribution of VOP, MEC, research domain size, and their impact on
overall allocation
Table 6 Surplus or Deficit Use of Fertilizers in India (2009-2010)
Table 7 Comparison of Normative and Actual Ratio of NPK Use in India (2007-
2009).
Table 8 Incidence and intensity of droughts in India
Table 9 Rice yield loss at different drought intensities
Table 10 Marginal effect of rise temperature and rainfall on agricultural productivity
Table 11 Projected change in agricultural productivity (%) due to climate change
Table 12 Net income from different crops using various approaches of valuation
Table 13 Growth and instability in different land-use categories in Bihar
Table 14 Crop wise energy productivity (kg/MJ) for major states in India, BE 2009-
10
Table 15 Total and agricultural trade between India and Pakistan before and after
SAFTA implementation
Table 16 Nominal protection coefficients for Export competitiveness of Indian
vegetables
Table 17 The share of different sectors in total rural employment
Table 18 Income sources of farm households in India
Table 19 Contribution of income sources to inequality in total income
Table 20 Women Empowerment in Agriculture Index
Table 21 State wise instability in food grains production during 1968-2011
Table 22 Trend growth rate in output of various sub sectors of agriculture: Per cent
Table 23 Trend growth rate in physical output of selected crops/groups: Per cent
Table 24 All India productivity of various crop groups

10
Table 25 Trend in real farm income: nominal series deflated by Consumer Price
index for Agricultural Labour with base 2004-5
Table 26 Various dimensions of growth in farm income
Table 27 Inflation forecast for food commodities using alternative models for June
2014

11
LIST OF FIGURES
Figure 1 Organogram of NCAP
Figure 2 Home page of NCAP website at www.ncap.res.in
Figure 3 Distribution of visitors across major countries in the world
Figure 4 Average annual TFP growth using moving base years
Figure 5 Efficiency, Technical and TFP Changes in districts of Bihar during years
2001-2009
Figure 6 Movement of technical efficiency, technical change and TFP change indices
of paddy cultivation: 1980-81 to 2009- 2010
Figure 7 Access to Radio, TV and Mobile across different land size categories
Figure 8 Year-wise incidence and intensity of droughts
Figure 9 Contribution of various sources of energy to total energy use in agriculture
Figure 10 Trade Complementarity Index for agricultural trade between India and
Pakistan
Figure 11 Trends in area, production and productivity of onion in India
Figure 12 Arrival and price pattern in Maharashtra
Figure 13 Contracting Arrangements in Mango Cultivation
Figure 14 Growth rate in GDP agriculture and allied sector at 2004-05 prices
Figure 15 Terms of trade between agriculture and non-agriculture
Figure 16 Prevalence of undernutrition and malnutrition and income poverty in rural
areas of major Indian states
Figure 17 Prevalence of undernutrition and malnutrition and income poverty in
urban areas of major Indian states
Figure 18 Long Run Trend in Inflation in India
Figure 19 Contribution of food commodities in total food inflation
LIST OF BOXES
Box 1 Collaborating Centers and selected commodities

12
EXECUTIVE SUMMARY
The National Centre for Agricultural Economics and Policy Research (NCAP) is
making persistent efforts to sustain excellence in agricultural economics and policy
research in the country. The Centre serves as a policy think tank and helps the ICAR
through credible research to actively participate in policy debates and decisions and in
monitoring and interpreting the research impacts at various levels. The Centre sensitizes
policy planners in the country and ICAR about the emerging changes and concerns
related to agriculture and farmers. Beside helping ICAR, the Centre also provides
policy inputs to several other public sector organizations, Departments, Ministries and
various state governments.
The staff of the Centre included 17 scientists, 17 other staff members and the research
project staff. The total expenditure of the Centre, including externally funded projects,
during the year was Rs 864.35 lakh.
A Research Advisory Committee chaired by Prof. V S Vyas, distinguished economist
and member, Prime Minister's Economic Advisory Council, guides the Centre in its
research programmes, and a Management Committee guides its overall functioning.
Besides, a number of committees facilitate decentralized management of the Centre.
Research is conducted at the Centre under five broad themes, viz. technology policy,
sustainable agricultural systems, markets and trade, institutional change and agricultural
growth and modelling. During the year 2013-14, the Centre undertook 17 research
studies and completed five consultancy research studies. It has not only maintained but
also increased the linkages and collaborations with many institutions in India and
abroad. Besides, it organized a number of workshops, trainings, brainstorming sessions
and policy discussions. A brief account of research and other activities undertaken by
the Centre during 2013-14 is given below.
The study on TFP reports that choice of the base year in computing TFP leads to
different TFP measure for the country. TFP growth was lowest at -0.74 during 1988-97.
The country recorded average annual TFP growth as high as 1.81% during the decade
1993-2002 followed by a decline. As the output growth improved after 2004-5 the TFP
growth rate also improved. The rising trend in TFP suggests that the recent growth in
agriculture is sustainable and is based on improved technology and efficiency.
Analysis of total factor productivity change, technical efficiency change and
technological change across districts of Bihar state revealed that the overall agriculture
in Bihar state has improved during 2001-2009 as average total factor productivity
increased at the rate of 3.04 per cent. The technical efficiency has increased at the rate
of 2.24% and technological change at the rate of 0.63% and change in technical
efficiency was positive in 30 districts while technological change was positive only in
21 districts out of total 37 districts.

13
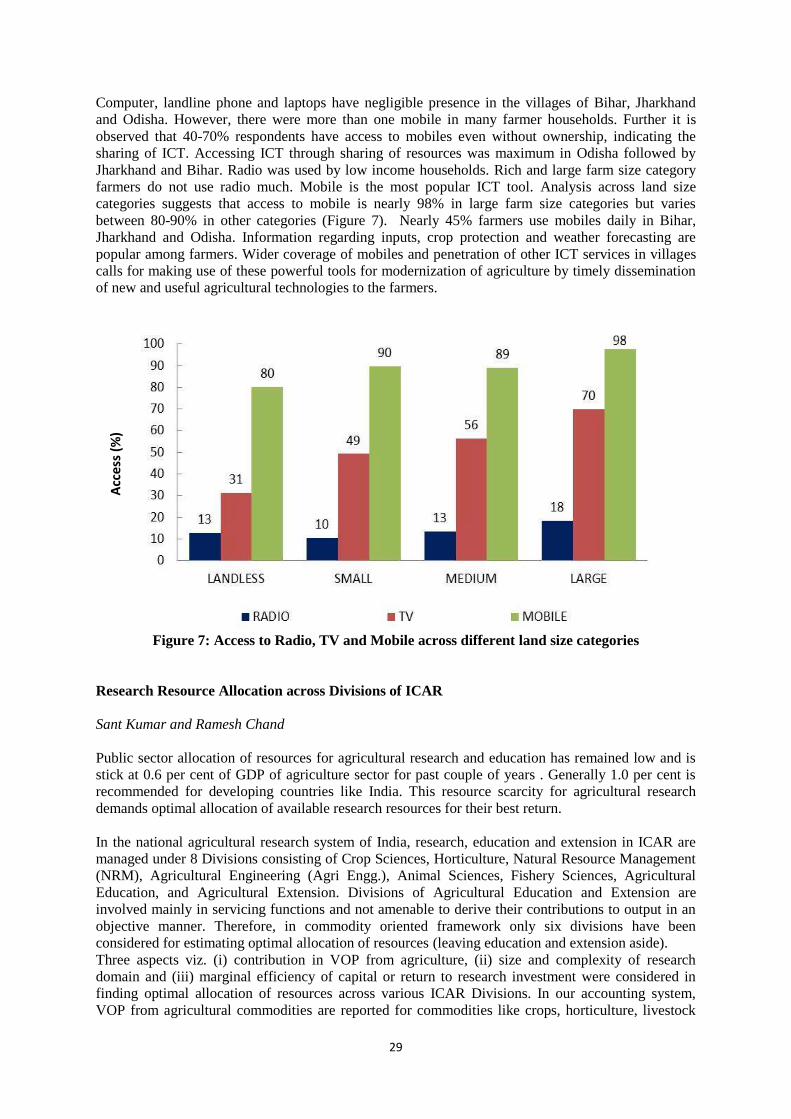
Study on ICT at sample farm households in Eastern India revealed that mobile was the
most popular ICT tool; nearly 45% farmers used mobiles daily in Bihar, Jharkhand and
Odisha. Email, Computer, landline phone and laptops have negligible presence in the
villages of Bihar, Jharkhand and Odisha. Wider coverage of mobiles and penetration of
other ICT services in villages calls for making use of these powerful tools for
modernization of agriculture by timely dissemination of new and useful agricultural
technologies to the farmers.
Public spending on agricultural research and education is stuck at 0.6 per cent for past
several years as compared to generally recommended level of 1.0 per cent for
developing countries. This resource scarcity for agricultural research demands optimal
allocation of available research resources for their optimum use.
A State wise analysis of fertilizer use in India was carried out to compare actual use of
fertilizer against optimum level, estimate imbalance in the fertilizer use and to examine
the relevance of the existing norm of 4:2:1 for mix of NP and K. Huge deficit in the use
of N, P and K nutrients was observed in Himachal Pradesh, Chhattisgarh, Jammu
Kashmir, Kerala, Madhya Pradesh, and Rajasthan. The study pointed out that optimum
proportion of NPK for the current crop pattern is 2.58:1.44:1 the country as a whole and
it varies across states. The study demonstrated that imbalance should matter only when
actual use exceeds recommended level.
Impact of climate change on agriculture revealed that there is a negative relationship
between rice yield and magnitude of drought, and a direct relationship between yield
loss and magnitude of drought, and both the relationships weakened over time despite
improvements in yield. At high intensity drought the yield loss declined from 24 per
cent during 1969-1988 to about 9 per cent of the mean yield. In absolute terms it
declined by about 39 per cent. The decline in yield loss was relatively less at moderate
droughts. In general the conclusion is that rice has become more resilient to droughts,
which can be attributed to crop breeding for drought-tolerance, improvement in
agronomy and water management. Impacts of climate change was also estimated on
aggregate productivity of Indian agriculture using panel data on 19 major crops for 200
districts (at 1970 base) for the period 1969-2005. Impacts are not uniform across
regions. By 2100, with significant changes in climate, losses in the gross revenue per
hectare in the arid-semi-arid tropics are projected close to one-third of the output. If the
changes in climate are slow, losses will be reduced to about half. The semi-arid
temperate and humid regions, in contrast, will be the less impacted by the climate
change because of better availability of irrigation.
A study on regional crop planning for improving resource use efficiency and
sustainability has been initiated in network mode. Result oriented strategy to achieve
quick growth in production has been the guiding principle and got precedence over
suitability in terms of agro economic factors and natural resource endowments. As a
result, crop shifts and crop pattern since early 1970s could not be guided by sound

14
principle of efficiency and comparative advantage. Rice has spread in those areas where
it was never grown before. Sugarcane has shifted from water abundant region to water
stressed region.
Performance of pulses and competing crops was assessed based on market prices,
natural resource valuation and economic prices net of subsidies. Pulses are found to be
more paying than the competing crops on overall basis though they generate lower
income at market prices.
Estimation of energy input in agriculture shows fast growing demand for in animate
energy sources like diesel, electricity, fertilizers, etc. in the recent years. The existing
energy productivity levels in several major crops raises questions about their long-term
sustainability.
The agricultural trade trends between India and Pakistan reveals a clear but one time
increase in year 2006-7 and after that, agricultural exports from India remained higher
in all the years compared to pre 2006-7 periods but show a lot of variability. The
agricultural imports from Pakistan, though small, did not fluctuate as much as exports to
Pakistan. The study identifies opportunities for promoting bilateral agricultural trade.
Onion price volatility has turned high despite sharp increase in its production. An
analysis of onion price rise in year 2013 reveals that signals were available in the month
of May-June about the impending price shock and these have been exploited by onion
traders under a clear strategy. The study suggests two ways to stabilise supply and
prices. One, stabilization through stock, two, and stabilization through regional or
temporal spread of onion cultivation. Stabilization through stock requires market
intervention in onion by public sector parastatals like NAFED. The second measure
relates to cultivation and technology. Instability in production can be reduced by
diluting regional concentration of onion production and by extending its cultivation
beyond present seasons. Both these options require technological interventions.
The trend in sectoral employment showed that the rural labour market is undergoing
profound changes with labour moving from agriculture towards non-farm sectors. The
output growth in non-farm sectors in rural areas outpaced growth in the agriculture
sector during the last 16 years. Similarly, higher wage rate and worker productivity in
non-farm sectors were also found to be the driving forces for such changes. MGNREGS
has broken the long stagnation in real wage rates in rural India. The expansion of
MGNREGS is bound to cause a reduction in the availability of rural labour for other
activities. A changing work culture and the emerging contractual arrangement between
labour and labour-hiring farm households are also affecting the rural labour market. The
improvement in education and skills of the largely uneducated and unskilled rural
labour will accelerate changes in the structure of the rural workforce. Agriculture R&D
has to play a vital role in terms of offering a substitute for labour in farm operations and
in terms of offsetting cost-push inflation resulting from the structural shift in labour
employment and rise in wages.

15
Farm households’ access to different income-generating activities and their impact on
income distribution showed that these households earn close to half of their income
from non-farm activities. The non-farm income was more important to the households
at lower end of land distribution. The poor households diversified more toward low-
paid, low-return non-farm activities. The non-farm income sources were accessible to a
small proportion of farm households and have un-equalizing effect on income
distribution. Nevertheless, non-farm sources were positively correlated with total
income. This contrast in income sources between income level and farm size suggests
that non-farm sector can serve as potential entry points for land-constrained farm
households to enhance their income level.
The extent of access and utilization of resources and participation in decision making by
farm women in East India reveal that less than five percent women have access to these
resources in spite of their significant contribution in farm activities. With regard to
ownership of assets and resources, situation was relatively better. In case of
participation in decision making, most of the decisions are being taken by males alone
(85-90%). It is recommended that rural women should be given the opportunity to have
more access and some degree of control over use of resources in order to alleviate
poverty.
Women Empowerment in Agriculture Index (WEAI) was constructed for sample
households from Eastern India. Jharkhand account for highest number of empowered
females (13.8%) followed by Odisha (11.3%) and Bihar (10). It has been observed that
about 20 per cent women fall in the range of marginally or less disempowered, who can
become empowered with implementation of some better policies or few interventions.
Maximum percentage of women is moderately disempowered (40 per cent) need some
serious government interventions and policy implementations to make them empowered
which can lead them towards better livelihood.
An inter-state analysis of instability in agricultural production has attracted renewed
attention due to change in factors that affect instability positively as well as negatively.
There is considerable concern about effect of climate change on production trend. In
this study instability analysis is extended to year 2010-11 to capture recent
developments. The analysis reveals that the instability in food grains production in India
has undergone substantial decline whereas oilseeds production showed significant
increase over time.
A study on agricultural performance since mid-1990s provides proper understanding of
the decline and improvement in performance of agriculture sector since the mid-1990s.
It compares the performance of agriculture in the recent years with the preceding
decade and provides an update on the achievements of the agriculture sector in recent
10 years or so. The study revealed that Indian agriculture experienced two structural
breaks in its GDP in the last two decades – one in year 1996-97 which took growth
trajectory downward and another in year 2004-5 which moved growth trajectory
upward. Indian agriculture moved on a growth trajectory of 3.15 per cent per annum
during 1988-89 to 1996-97 which plummeted to 1.92 per cent in the next nine years.
The growth rate reached 3.75 per cent after 2004-5, which is historical. The study

16
identified major contributing factors for growth revival such as improvement in terms
of trade for agriculture and remunerative prices, higher use of productivity enhancing
inputs, expansion of irrigation and increase in agricultural investments, increase in the
supply of institutional credit, achievements in technology and strengthening of
extension initiatives. The most important factor underlying acceleration in agriculture
growth after 2004-5 has been the improvement in terms of trade in favour of
agriculture. Agricultural development strategy should be expanded to bring marketing
in its fold to improve competition, reduce efficiency and harness market innovations.
A study on agriculture diversification towards horticulture indicates that Indian
agriculture is diversifying towards horticultural crops. The pace of diversification
slowed down after 2005-06 as Government initiatives strongly pushed cultivation of
pulses and cereals. Annual growth rate in horticulture output showed twice the growth
rate of non-horticultural crops. This could happen due to very high differentials in
productivity of horticulture crops relative to non-horticultural crops and strong demand
for the former. It is evident from price trend that prospects of demand led growth of
horticultural crops are very high.
Series on credible and comprehensive estimates of farmers’ income is prepared for first
time in the country. Between 1974-75 and 2011-12, the farm income per cultivator in
real terms (with price base 2004-5) has increased by close to three times, from Rs
17998 to Rs 55527. Similarly, the farm income per hectare of net sown area also
increased by more than four times in the last 37 years. In the same period the farm
income per holding grew from Rs 19042 to Rs 47084. During the year 2011-12 average
farm income accruing to farmers from crops, livestock and allied activities was Rs.
101583 per cultivator and Rs. 85144 per hectare at current prices.
High growth in per cultivator income has been possible due to decline in the number of
cultivators. Thus, it is clear that sizable increase in income of our farmers can be
achieved only when the two things, namely, modest increase in sectoral output and
decline in number of cultivators happen together. To sustain growth in per farmer
income in future it need to be ensured that the process of shift of cultivators from
farming to non-farming occupation is intensified and growth in farm output is
maintained above 3 per cent. It is also important to mention that while decline in
number of cultivators is crucial, those who move out of farming must be employed
elsewhere where they earn more income than what is per cultivator income in farming.
A study on food security and undernourishment was extended to the state-level. Jammu
& Kashmir is found to be the best performing state in both rural as well as urban areas
in nutrition and Karnataka for rural and Madhya Pradesh for urban population are the
worst performing states as per the FAO norm of 1800Kcl/person/day. As per the ICMR-
NIN norm, rural population in Himachal Pradesh and urban households in Jammu &
Kashmir showed good performance while rural Karnataka and urban West Bengal are
worst performers.
A study on long run trend in food inflation and its forecast found food inflation to be
much more volatile than non-food inflation. Both food and non-food inflation witnessed
cyclical trend in long run. Among the disaggregated food products, non-vegetarian
products will have highest inflation followed by pulses and milk. The expected value of

17
inflation in near future will help policy makers to take corrective measures to augment
food supply or manage demand to control the prices.
The Centre organised one summer school and one workshop in collaboration with
IFPRI, Washington DC, to achieve the objective of capacity development. The
Centre also organised ICAR Directors meeting on Perfomance Indicators. Besides
NCAP conducted two one-week training programme on ‘core issues in the agricultural
sector’ for the officers of the Indian Economic Service’ funded by the Ministry of
Finance, Government of India. The centre also conducted a training programme on
Field Survey, Electronic Compilation and Analysis of Data for the field staff of ICAR-
ICRISAT project on Tracking Change in Rural Poverty in Household and Village
Economies in South Asia at RCER Patna. Several theme/project-wise trainings,
interaction meetings, workshops, etc. were also organised which helped in capacity
building of the project partners.
As part of the dissemination of research output, the Centre published one policy brief
during the year under report. The staff of the Centre published 38 research papers in
leading journals of national and international repute and contributed 3 book chapters/
popular articles. More than 15 presentations were made in national and international
conferences. The scientists of the Centre were involved in a number of professional and
policy interactions and projects. The website of NCAP (www.ncap.res.in) was regularly
updated and all the publications of the Centre were uploaded on the website.
Faculty of the Centre participated in several policy debates and discourses and also
undertook research based policy advocacy. NCAP faculty has played a leading role in
creating proper understanding and awareness among public on various agricultural
issues through participation in T.V. debates and newspaper reporting. NCAP is actively
engaged in providing policy input and in research based policy advocacy. In total 12
policy inputs were provided to various Ministries at the Centre. Director NCAP chaired
important high level committees constituted by Government of India on price policy,
WTO and Trade and related issues during the reported period

18
I. PROFILE OF NCAP
The National Centre for Agricultural Economics and Policy Research (NCAP) was established to
strengthen agricultural economics and policy research in the National Agricultural Research System
(NARS) of the country. The Centre acts as a think tank of the ICAR and helps the Council through
credible research to actively participate in policy dialogues and decision making. It serves as the nodal
agency of the ICAR in monitoring and interpreting the research implications of changes at grassroots
level, and macroeconomic environments at national and international levels.
Location
The Centre is located in the Pusa campus in New Delhi. It has in its close vicinity several institutes of
ICAR and of other orgainsations; these include Indian Agricultural Research Institute (IARI), Indian
Agricultural Statistics Research Institute (IASRI), National Physical Laboratory (NPL), National
Institute of Science, Technology and Development Studies (NISTADS), and National Institute of
Science, Communication and Information Resources (NISCAIR). The Centre is very close to the
National Agricultural Science Centre (NASC) Complex which houses National Academy of
Agricultural Sciences (NAAS), regional offices of nine Consultative Groups of International
Agricultural Research (CGIAR) Centers and offices of many professional societies. The Centre thus
has the locational advantage in terms of multidisciplinary studies, inter-institutional interactions and
research linkages, library facilities, etc.
Vision
Leveraging innovations for attaining efficient, inclusive and eco-friendly agricultural growth through
agricultural economics and policy research.
Mission
To strengthen agricultural economics and policy research for providing economically-viable, socially-
acceptable and environmentally-feasible policy options for science-led agricultural growth.
Mandate
The mandate of the Centre is:
(1) To conduct policy-oriented research in network mode on:
(a) Technology generation, diffusion and impact assessment,
(b) Sustainable agricultural production systems,
(c) Interaction between technology and other policy instruments like incentives, investments,
institutions and trade, and
(d) Agricultural growth and modelling with focus on role of technology;
(2) To strengthen agricultural economics and policy research in the NARS; and
(3) To enhance participation of ICAR in agricultural policy debates and decisions through policy-
oriented research and professional interactions.
Research Activities
Research activities of NCAP are broadly covered under the following five major themes:
Technology policy
Sustainable agricultural systems
Markets and trade

19
Institutional change
Agricultural growth and modelling
As a part of policy advocacy, the Centre organises workshops and participates actively in policy
debates and interactions where issues of major policy interests are discussed by the policymakers,
academicians, etc. The Centre also organises events where distinguished scholars and policymakers
debate policy issues for developing a deeper understanding of various developments. Trainings and
capacity building in frontier areas of agricultural economics are accorded high priorities by the
Centre.
The Centre maintains close linkages with several national and international organisations involved in
agricultural economics research, development and policy issues. Collaborative research projects,
seminars, workshops, publications and participations in policymaking bodies are the usual modes of
policy interface which help improve the outreach of the Centre. The Centre regularly brings out
publications like Policy Papers, Policy Briefs, Conference Proceedings, and Working papers, besides
publishing in journals. These serve as the main agents for dissemination of its research findings.
Management
A Research Advisory Committee (RAC) comprising eminent professionals, mostly from outside the
ICAR system, guides the Centre on its research activities. Prof. V S Vyas, Member, Prime Minister’s
Economic Advisory Council, was the Chair of previous RAC. The functioning of the Centre is
supervised by a Management Committee (MC), which is constituted and mandated by the ICAR.
Besides, a number of internal committees and cells, including those mandated by ICAR, are operating
for an efficient and decentralised management of the Centre. The Joint Staff Council (JSC) promotes
healthy interaction and congenial work environment at the Centre. Director conducts regular meetings
with staff, mostly every month, to discuss problems and difficulties, if any, faced by the staff and to
elicit their suggestions for the cordial functioning of the Centre. The organogram of the Centre is
illustrated in Figure 1.

20
Figure 1: Organogram of NCAP
Library services
Databases
AKMU
Research Advisory
Committee
Director Management
Committee
Policy
Research Administration
& Accounts
Information
Services
ICAR Mandated
Institute Research
Council
PME Cell (RPF & PIMS)
Budget & RFD Committee
Purchase Committee
Official Language Committee
Deputation abroad
committee
Institute Joint Staff Council
Women Cell
Grievance Cell
Consultancy
Processing Cell
IPR & Technology
Commercialization
Technology Policy
Sustainable Agricultural Systems
Markets and Trade
Institutional Change
Agricultural Growth and Modeling
Facilitating & Advisory
Committees
Facilitating
Committees
Academic Planning and Policy Committee
Publications Committee
Transport Committee
Maintenance & Landscape
Committee
Library Committee
Security Committee
Annual Report Committee
Staff Recreation Committee
Office Services Committee
Capacity
Building
Policy Sensitisation
and Advocacy
Policy Analysis Quantitative
Tools Impact
Assessment Priority Setting
& Monitoring Growth and
development
Policy Dialogues
Policy Interfaces Outreach Publications Mass media
reporting
Participation in policy committees

21
The achievements and functioning of the Centre are periodically evaluated by the Quinquennial
Review Team (QRT), constituted by ICAR. The last QRT for the evaluation of Centre for the period
2006-2010 was chaired by Dr. S. S. Acharya, Hon. Professor, Institute of Development Studies,
Jaipur. The Team submitted its report to the Council in January 2012.
Infrastructural Facilities
NCAP Website
The NCAP website (http://www.ncap.res.in) provides a strong and clear impression of the
organization with all the latest information about activities of the Centre, particularly about its staff,
infrastructure, research projects, research publications, jobs, tender, RTI information and linkages
(Figure 2). The navigation is clear and quick for most of the pages. The Centre’s website is hosted
through ERNET, New Delhi and is being updated regularly. All NCAP publications like policy
papers, policy briefs, working papers, PME notes, workshop proceedings, etc. are available on the
website in the form of PDF files.
Figure 2: Home page of NCAP website at www.ncap.res.in
Analysis of weblog data during the last quarter of the year 2013-14 shows that more than 37 per cent
of the visitors are Indian researchers (Figure 3). Nearly one-fourth visitors to the website are from US
and one-seventh visitors are from China. Measures of some important performance parameters of the
NCAP website are presented as follows:

22
Table 1: Some performance parameters of NCAP Website
Parameters Unit Mean Value for 2013-14
Sessions/Day number 533
Hits/Day number 3124
Pages/session number 235
Time/Session seconds 1.4
Figure 3. Distribution of visitors to NCAP website by country, 2013-14
Agricultural Knowledge Management Unit
Quick access to information at global level through electronic media has opened new options to tackle
future challenges of Indian Agriculture in an effective and efficient way. The Agricultural Knowledge
Management Unit (AKMU), based on Agricultural Research Information System (ARIS), serves these
useful purposes. The goal of the AKMU is to strengthen information management using modern
technologies within the NARS. The major objectives of this unit are:
1. To put information close to managers and scientists
2. To build capacity to organise, store, retrieve and use the relevant information
3. To share the information over NARS using NCAP website
4. To improve the capacity to plan, execute, monitor and evaluate research programmes
To attain these objectives, the AKMU at NCAP is well equipped with latest computers, servers,
firewall (Fort iGATE 80c), centralized antivirus server and analytical software like SPSS 20, STATA
12, LIMDEP 9.0, GIS, GAMS, Stella and SAS 9.3. For data management and in-house software

23
development, SQL server 2008 and Visual Studio facilities have been installed. Online data bases (of
CMIE data and other reputed databanks) are accessible through LAN. Under NAIP, 25 new
computers, 5 printers, 5 ups and 1 high end server have been purchased. NKN leased line of 100 mbps
has been installed to enhance the research work and fast internet access. Each individual staff member
has been provided latest computer and software, LAN, email account, internet facilities and required
computational facilities. AKMU has been instrumental in providing access to NCAP researchers to
various publications in the world via email system.
Agricultural Knowledge and Management Unit
Library
NCAP has a specialized collection of print and electronic databases like Statistical Abstracts, National
Accounts Statistics, Economic Survey, Agricultural census, Input surveys, Livestock census, NSSO
CD ROM, CSO Publications and other Government of India publications and some state Government
Publications also. The library facility of Centre is being developed as an efficient information service
unit. At present library houses a total of 6631 publications, comprised of 3279 reference books, 121
CD ROM’s, 2316 database publications, 812 reports, 103 SAARC publications and other references
materials. Library references are computerized using library software package with quick search
facility. The library has subscription to 11 national journals, 17 international journals and online
subscription to Centre for Monitoring Indian Economy Pvt. Ltd. (CMIE) modules, States of India and
Commodities, Economic & Political Weekly (EPW) print + digital archives and Economic and
Political Weekly Research Foundation (Indian Times Series) modules. It also has a depository of
FAO, CGPRT, and CGIAR reports. Library has separate section of Hindi books. NCAP Researchers
has access to many journals through CeRA (Consortium for e-Resources in Agriculture) website
created by IARI under NAIP project.
The library is playing active role in timely dissemination of scientific and technical information for
research via Current Awareness Service and Newspaper Clipping Service also. Further three
computers; one printer and one scanner are placed in library with connectivity to internet for library
user’s convenience.

24
Exhibition and Record Room It has been observed and recommended by the QRT that to showcase the accomplishments of the
center an exhibition cum record room should be created. Record room should display all the
significant NCAP achievements since beginning. Accordingly, the Record room facility has been
created at the centre. It showcases research and other achievements and activities of NCAP. Record
room displays all NCAP publications, annual reports, publications of individual scientists,
recognitions and awards received by the Centre and by individual scientists. A photo gallery displays
memories of all important events organised by the Centre.
Budget
The expenditure of NCAP for the year 2013-2014 is presented in Table 2 and its staff position is
depicted in Table 3.
Table 2: Expenditure during 2013-14
(in lakh Rs)
Head of Account Plan Non-Plan Total
Pay and allowances - 321.73 321.73
Over time allowance (OTA) - 0.16 0.16
Travelling expenses
Domestic TA 3.91 0.98 4.89
Foreign TA 1.51 - 1.51
Office Equipment 1.82 - 1.82
Library 5.57 5.87 11.44
Furniture 0.45 - 0.45
Other charges including equipment 130.06 - 130.06
Human resource development (HRD) 0.47 - 0.47
Network Project 206.21 - 206.21
Pension/Retirement benefits - - -
Loans & Advances - 0.11 0.11
Sub-Total 350.00 328.85 678.85
National Agricultural Innovation Projects 25.53 - 25.53
Other projects 18.51 141.46 159.97
Grand Total 394.04 470.31 864.35
Table 3: Staff position as on 1.1.2014
S.No. Name of the Post Sanctioned Filled Vacant
1. R.M.P 1 1 -
2. Principal Scientist 6 2 4
3. Sr. Scientist 6 2 4
4. Scientist 13 12 1

25
5. Technical Assistant/Officer 4 4 -
6. Technician (T-1) 1 1 -
7. Administrative Officer 1 1 -
8. Asstt. Admn. Officer 1 1 -
9. Asstt. Finance & Accounts Officer 1 1 -
10. Private Secretary 1 1 -
11. Assistant 4 4 -
12. Stenographer 1 1 -
13. Upper Division Clerk 1 - 1
14. Lower Division Clerk 2 1 1
15. Skilled Supporting Staff 2 2 -

26
II RESEARCH ACHIEVEMENTS
TECHNOLOGY POLICY
TFP Trends in Indian Agriculture
Rajni Jain, Ramesh Chand and Amarjeet Singh
TFP is a measure of an economy’s long-term technological dynamism and an important indicator of
sustainability of a growth process. TFP growth indicates technical progress, which represents shifts in
the production function over time. A review of literature on TFP at macro level shows that studies
often miss important variables on which data is not readily available like use of labour, use of diesel,
use of farm machinery. The present study incorporates all inputs used in agricultural production in
estimation of TFP. The study uses Tornquist index method for computing TFP. It is observed that the
choice of base year and choice of period in computing TFP leads to different estimates of TFP as can
be seen from the Figure below which plots TFP growth trends for decadal period. The figure shows
that TFP growth has experienced large variation over time and it was negative for some period after
mid 1980s. TFP growth accelerated sharply during the initial period of economic reforms followed a
downward trend after mid 1990s. TFP in Indian agriculture has been rising at a faster rate after mid
2000s. It is interesting to point out that TFP growth has moved in tandem with the growth in
agricultural output.
Figure 4: Average annual TFP growth using moving base years
The rising trend in TFP growth after 2004-5 suggests that the recent growth in agriculture is
accompanied with improved technology and efficiency and is thus sustainable.
Efficiency change, Technological change and TFP trends in Bihar Agriculture
Rajni Jain, Ramesh Chand, Usha Ahuja and Ashok Mittal
Data Envelop Analysis approach was applied to estimate the total factor productivity change,
technical efficiency change and technological change in districts of Bihar state for the period 2001-
-1
-0.5
0
0.5
1
1.5
2

27
2009 using the Malmquist productivity index. It was found that the overall agriculture in Bihar state
has improved during 2001-2009 as average total factor productivity increased at the rate of 3.04
percent during this period. The technical efficiency has increased at the rate of 2.24% and
technological change at the rate of 0.63%. It is also observed from the analysis that change in
technical efficiency was positive in 30 districts while technological change was positive only in 21
districts out of total 37 districts. Thus the contribution of technical efficiency change was higher in the
improvement of TFP change in the state. The results show that the efficiency of farmers regarding
input mix is getting better while the improvement in technological adoption is slow in most of the
districts (Figure 5).
Analysis of TFP and the contributing inputs suggests that the mean difference of inputs like
irrigation, fertilizer and credit between the districts having above average TFP and below
average TFP were significant. It is inferred that the districts where TFP was below average
need to increase irrigation facilities, fertilizer use and credit availability to improve the TFP.
The study also suggests that emphasis must be laid on technological adoption at district level
in Bihar state.
Figure 5: Efficiency, Technical and TFP Changes in districts of Bihar during years 2001-2009
Technical Change and Efficiency of Rice in India: A Malmquist Total Factor
Productivity Approach
Suresh A
The study has analysed the trends in the total factor productivity (TFP) growth of rice in India
for the period 1980-81 to 2009-10 and has decomposed the TFP growth into its components,
viz. change in technical progress and technical efficiency. The study has used Malmquist
Productivity Index approach through data envelopment analysis to estimate the TFP. The
analysis has also been carried out for two sub-periods, viz. 1980-81 to 1994-95 (period I) and
1995-96 to 2009-10 (period II). For the overall period, the TFP has grown at a moderate rate
of 0.2 per cent per year (Figure 6), with large inter-state variations. The positive TFP growth
has been associated with a mean technical progress of 0.3 per cent and a deterioration of the
mean technical efficiency by -0.1 per cent per year. Across the states Andhra Pradesh,
Punjab, Tamil Nadu and Uttar Pradesh have exhibited positive TFP growths during the
overall period. The revival of the mean TFP to the level of 1.8 per cent per year during period
0
5
10
15
20
25
30
Efficiency Change Technical Change TFP Change
No
of
dis
tric
ts
Efficiency, Technical and TFP Changes in districts of Bihar during years 2001-2009
<1.0
1 to1.1
> 1.1

28
II has mainly been effected by positive technical change during this period. However, a
matter of concern is the decline in technical efficiency. It is also observed that over years the
less progressive states with respect to TFP growth during the Period I have caught up with the
progressive states, mainly propelled by high rate of technical progress (Table 4).
Figure 6: Movement of technical efficiency, technical change and TFP change indices of
paddy cultivation: 1980-81 to 2009- 2010
Table 4The trend in technical change, efficiency change and total factor productivity
change during two periods, across selected states
State Efficiency change Technical change TFP change
Period I
Period
II
Period I Period II
Period I
Period
II
Andhra Pradesh 101.5 100.8 102.5 106.6 104.0 107.5
Bihar 100.0 100.0 99.3 95.6 99.3 95.6
Karnataka 100.0 100.3 95.3 102.1 95.3 102.4
Madhya Pradesh 99.7 98.8 91.4 101.8 91.2 100.6
Odisha 100.0 100.0 90.0 102.2 90.0 102.2
Punjab 100.0 100.0 105.6 104.0 105.6 104.0
Tamil Nadu 100.0 98.0 103.6 102.3 103.6 100.3
Uttar Pradesh 101.1 100.0 103.4 103.2 104.6 103.2
West Bengal 100.0 100.0 96.0 101.1 96.0 101.1
Mean 100.3 99.8 98.4 102.1 98.7 101.8
ICT Status and Usage at Farm level in Eastern India
Rajni Jain and Usha Ahuja,
A study was conducted to understand the status of ICT at farm level in Eastern India. It used farm
level primary data collected from selected villages of Bihar, Jharkhand and Odisha. From each sample
households data were collected from one male and one female member. It was observed that Email,
90
92
94
96
98
100
102
104
106
108
110
19
83
19
84
19
85
19
86
19
87
19
88
19
89
19
90
19
91
19
92
19
93
19
94
19
95
19
96
19
97
19
98
19
99
20
00
20
01
20
02
20
03
20
04
20
05
20
06
20
07
20
08
20
09
Pe
r C
en
t
Technical efficiency Technical change TFP change
29
Computer, landline phone and laptops have negligible presence in the villages of Bihar, Jharkhand
and Odisha. However, there were more than one mobile in many farmer households. Further it is
observed that 40-70% respondents have access to mobiles even without ownership, indicating the
sharing of ICT. Accessing ICT through sharing of resources was maximum in Odisha followed by
Jharkhand and Bihar. Radio was used by low income households. Rich and large farm size category
farmers do not use radio much. Mobile is the most popular ICT tool. Analysis across land size
categories suggests that access to mobile is nearly 98% in large farm size categories but varies
between 80-90% in other categories (Figure 7). Nearly 45% farmers use mobiles daily in Bihar,
Jharkhand and Odisha. Information regarding inputs, crop protection and weather forecasting are
popular among farmers. Wider coverage of mobiles and penetration of other ICT services in villages
calls for making use of these powerful tools for modernization of agriculture by timely dissemination
of new and useful agricultural technologies to the farmers.
Figure 7: Access to Radio, TV and Mobile across different land size categories
Research Resource Allocation across Divisions of ICAR
Sant Kumar and Ramesh Chand
Public sector allocation of resources for agricultural research and education has remained low and is
stick at 0.6 per cent of GDP of agriculture sector for past couple of years . Generally 1.0 per cent is
recommended for developing countries like India. This resource scarcity for agricultural research
demands optimal allocation of available research resources for their best return.
In the national agricultural research system of India, research, education and extension in ICAR are
managed under 8 Divisions consisting of Crop Sciences, Horticulture, Natural Resource Management
(NRM), Agricultural Engineering (Agri Engg.), Animal Sciences, Fishery Sciences, Agricultural
Education, and Agricultural Extension. Divisions of Agricultural Education and Extension are
involved mainly in servicing functions and not amenable to derive their contributions to output in an
objective manner. Therefore, in commodity oriented framework only six divisions have been
considered for estimating optimal allocation of resources (leaving education and extension aside).
Three aspects viz. (i) contribution in VOP from agriculture, (ii) size and complexity of research
domain and (iii) marginal efficiency of capital or return to research investment were considered in
finding optimal allocation of resources across various ICAR Divisions. In our accounting system,
VOP from agricultural commodities are reported for commodities like crops, horticulture, livestock
Acc
ess
(%
)

30
and fisheries. To distribute VOP from agriculture among above noted six Divisions, it is necessary to
have shares of Agri Engg, and NRM divisions in VOP derived from agriculture. The shares for Agri
Engg, and NRM divisions were assessed using cost of cultivation data published by CACP. The share
of water/irrigation and land and share of farm machinery in cost of production were taken as share of
NRM and Agri Engg Divisions in VOP. The share of other four Divisions namely crops, horticulture,
animal sciences and fishery in VOP were adjusted accordingly.
The other data on total public expenditure on agricultural research and education (under Plan and
Non-Plan heads) was taken from the ICAR records.
Divisional Allocation of Research Resources
Crop sciences occupy number one position both in terms of output as well as domain complexity
(Table 5). This division accounts for 41 per cent of the value of production from agriculture and
covers 32 per cent research domain size of ICAR. Animal sciences rank second position, though it is
far behind crops in terms of output share. Horticulture ranks second in research domain size with a
little more than one fourth share in output. Share of animal sciences in research domain is just half of
share of horticulture, though marginal return to research investments or MEC was highest in animal
sciences. More than one fifth of returns to research investment in agriculture come from this Division.
Crops and horticulture closely follow animal science in rate of return to investments. NRM
contributes 11.9 per cent of output and 14 per cent to return to R&D investments. It covers 11 per cent
of total research domain of ICAR. Fishery sector shows least return to research investments. Its share
in output is also least, less than 4 per cent and share in research domain of ICAR is 9 per cent. If
research resources are distributed based on above mentioned three criteria, then it will require shift in
resources towards Horticulture and Agri Engg Divisions of ICAR as indicated in Table 5. Table 5: Distribution of VOP, MEC, research domain size, and their impact on overall
allocation (Per cent)
Division
Share based on Overall
(average)
Existing
allocation1
(2012-13)
Shift in
resourc
es, %
MEC (`)
(2007-08
to 2011-
12)
VOP MEC Domain
size
Crop sciences 41.1 20.4 32.1 32.1 34.8 - 2.7 94.7
Horticulture 16.1 20.3 25.7 20.7 13.2 + 7.5 94.1
Animal
sciences
22.6 22.1 11.9 18.9 21.2 - 2.3 102.1
Fishery
sciences
3.8 6.3 9.2 6.4 10.1 - 3.7 29.3
Agri-
engineering
4.5 16.8 10.1 10.5 4.4 + 6.1 78.0
Natural
resource
management
11.9 14.1 11.0 12.3 16.3 - 4.0 65.3
Total 100.0 100.0 100.0 100.0 100.0 84.3
Note: VOP = value of production; and MEC = marginal efficiency of capital
Impact of sprinkler irrigation technology on adopter farms against non-adopter farms in
Haryana

31
Usha Ahuja and Santosh Kumar
With competitive use of water and its increasing scarcity, it has become imperative to economize
water use for optimum productivity. This is possible only through improved water management and
adopting advanced techniques of irrigation. One such method of modern irrigation is sprinkler
irrigation system which saves upto 50 per cent of water compared to surface irrigation method and
increases productivity by about 15-25 per cent and is becoming more and more popular among the
farmers across the country. So this study is aimed to see the impact of sprinkler irrigation technology
in crop cultivation in Haryana state. Three districts namely Bhiwani, Rewari and Mohindergarh have
been purposively selected having maximum area under sprinkler irrigation. A sample of 220
farmers (110 adopters of technology and 110 non adopters of technology) has been selected from11
villages of three districts of Haryana state. In this paper, we have used the standard cost concepts and
paired’ statistics technique for economic analysis and the impact assessment of sprinkler irrigation
technology on adopters farms against non-adopters farms. Economic analysis of the data revealed that
due to technological adoption increase in yield and reduction in cost of production were noticed on
sprinkler irrigated farms as against the conventional farms. It has been observed that sprinkler
irrigation system for wheat, mustard and pearl millet cultivation is most remunerative and attractive
option for farming community in the study area as it increased net returns from wheat, mustard and
pearl millet by 33 prcent,86 per cent and 249 per cent respectively. So the study concluded that the
adoption of sprinkler irrigation technology improves farmer’s profits by increasing yield and reducing
the input cost. The major constraint in adoption of this technology is more time and effort required to
irrigate the field.
Fertilizer Use in India- A State wise Analysis
Pavitra.S
This study compared the actual fertilizer use in various states with recommended level of N, P and K
and estimates imbalance in the fertilizer use. The study also looked into relevance of prevalent norm
of 4:2:1 for N, P and K and prepare fresh estimates of optimal mix of various nutrients based on
current cropping pattern and recommended doses of NPK. Data on rain fed and irrigated area under
all the crops and states was collected along with the information on recommended doses of N, P, K
taken from the ‘Package of practices for Various Crops’ prepared by states agricultural universities of
the respective states. Actual quantity of fertilizer used in various states was compared against the
recommended norms to estimate the surplus or deficit and imbalance in use of fertilizer nutrients.
During the year 2009-10, Andhra Pradesh and Tamil Nadu showed surplus use of all three nutrients.
All the other states, showed deficit use of one or more elements (Table 6).
Table 6. Surplus or Deficit Use of Fertilizers in India (2009-2010)
State N P K State N P K
Andhra Pradesh 63.93 37.83 8.77 Madhya Pradesh -7.71 -46.79 -73.24
Assam 2.31 -45.52 -23.25 Maharashtra -11.53 -10.87 -6.64
Bihar 31.34 -32.39 -31.37 Orissa -52.31 -57.02 -76.8
Chhattisgarh -35.26 -44.46 -71.03 Punjab 43.12 16.17 -68.55
Gujarat -1.60 22.10 -50.80 Rajasthan -41.06 -51.21 -69.14
Haryana 18.85 0.36 -70.04 Tamil Nadu 4.86 17.75 29.85
Himachal Pradesh -60.79 -73.83 -66.06 Uttarakhand 15.89 -36.59 -66.74
Jharkhand 35.69 39.05 -44.37 Uttar Pradesh -7.12 -25.34 -69.09
J & K -21.55 -57.82 -55.42 West Bengal -7.73 13.66 8.51
Karnataka -6.32 -2.52 -29.54 Others -76.67 -87.12 -90.51
Kerala -45.04 -63.45 -72.23 All India -1.01 -16.98 -40.50

32
Given the concern related to adverse effects of imbalanced fertilizer use, our contention is that the
imbalance is adverse only when use of some input exceeds optimal level. If its use is below the
optimal level it may not be adverse. The formula used to calculate the imbalance does not take
cognizance of this aspect as, it is based on squared deviation between actual and normative quantity of
fertilizes. That is why though the relative use of inputs is more distorted in Punjab, the highest index
of imbalance was noticed for Madhya Pradesh. Therefore, the imbalance index calculated by some
studies at state level suffers from this limitation. Based on this it is suggested that imbalance need to
be seen and addressed when it meets two conditions:
1. There is disproportionate use of NPK
2. There is excessive use of one or more nutrients.
Among Indian states based on this criterion, imbalance needs to be addressed in Punjab, West Bengal,
Haryana, Gujarat, Bihar and Assam. While in the case of Andhra Pradesh and Tamil Nadu all the
nutrients are used in excess.
The actual use of NPK nutrients showed wide deviations from the state specific normative quantities
(Table 7). The optimal ratio of NPK use for India was found to be 2.58:1.44:1. The study indicates
that the existing fertilizer use norm of 4:2:1 cannot be generalized for the country however; it was
closer to the normative ratio for Punjab and Haryana. The huge deficits in the use of fertilizer
nutrients and the imbalance in fertilizer application in terms of relative use of the NPK nutrients needs
immediate attention of the policy makers.
Table 7: Comparison of Normative and Actual Ratio of NPK Use in India (2007-2009).
State Normative Ratio Actual Ratio
N P K N P K
Andhra Pradesh 2.38 1.45 1.00 3.59 1.75 1.00
Assam 1.79 1.27 1.00 1.93 0.84 1.00
Bihar 2.79 1.50 1.00 6.62 1.66 1.00
Chhattisgarh 2.40 1.43 1.00 5.21 2.52 1.00
Gujarat 2.78 1.03 1.00 6.02 2.58 1.00
Haryana 4.07 1.70 1.00 25.07 7.96 1.00
Himachal Pradesh 2.47 1.29 1.00 3.21 0.99 1.00
Jharkhand 2.00 1.17 1.00 6.48 3.47 1.00
Jammu and Kashmir 3.27 1.97 1.00 7.59 2.63 1.00
Karnataka 1.57 0.99 1.00 2.17 1.31 1.00
Kerala 0.61 0.47 1.00 9.09 5.60 1.00
Madhya Pradesh 2.37 2.66 1.00 9.09 5.60 1.00
Maharashtra 2.73 1.86 1.00 2.78 1.64 1.00
Orissa 1.80 1.02 1.00 3.74 1.79 1.00
Punjab 4.07 1.62 1.00 23.74 6.86 1.00
Rajasthan 11.52 6.24 1.00 27.00 11.32 1.00
Tamil Nadu 2.30 0.88 1.00 1.81 0.75 1.00
Uttarakhand 3.24 1.52 1.00 10.37 2.55 1.00
Uttar Pradesh 2.97 1.33 1.00 11.29 3.65 1.00
West Bengal 1.92 1.00 1.00 1.83 1.10 1.00
Others 1.55 1.10 1.00 2.70 1.01 1.00
All India 2.58 1.44 1.00 4.71 2.02 1.00
SUSTAINABLE AGRICULTURAL SYSTEMS
Is Indian agriculture becoming resilient to droughts?

33
P S Birthal
More than two-thirds of India’s agricultural land is vulnerable to droughts, and the country faces
drought almost every third year. This study identified intensity, frequency and regional spread of
droughts and assessed their impacts on rice yield. The study test the hypothesis that developments in
agricultural technologies, agronomy and water management have imparted resilience to agriculture.
District-level data on rainfall and temperature for the kharif season (June to September and for the
period from 1969/70 to 2004/05) was used to construct a drought index that summarizes both degree
of hotness (temperature above normal) and degree of dryness (rainfall below normal), and to examine
its relationship with rice yield.
Table 8 presents distribution of droughts of different intensity over districts and time. The drought
index ranges from zero to eight, with zero implying seasonal rainfall being greater than normal and
seasonal monthly temperature being less than normal. Abnormally low values of drought index can be
considered to be representative of the normal weather; we have considered lower bound of drought
index at 0.1. The index is skewed towards its lower bound, indicating most of the drought incidences
were of low intensity. Nonetheless, over time the incidence of low intensity droughts has increased; of
the total droughts occurred during 1988-89 to 2004-05 close to 50 per cent had a drought index of less
than 0.5 as compared to 40 per cent in the preceding period i.e. 1969-70 to 1987-88. The incidence of
droughts with drought index between 0.5-1.0 also increased from 23 per cent to 26 per cent. In
general the incidence of severe droughts has declined during the 1990s and 2000s. The incidence of
droughts with drought index above 1.5 was 21 per cent during 1970s and 29 per cent during 1980s,
which declined drastically to 9 per cent during 1990s.
Table 8 : Incidence and intensity of droughts in India
1969-1987 1988-2005 1969-2005
Drought intensity
Mean
DI
Median
DI
Standard
deviation
% of
total
events
% of
total
area
affected
% of
total
events
% of
total
area
affected
% of
total
events
% of
total
area
affected
Low (0<DI<0.5) 0.189 0.158 0.148 50.2 48.8 61.2 62.1 55.8 55.5
Medium (0.5<DI<1.5) 0.894 0.835 0.282 27.9 28.8 30.7 27.9 29.3 28.3
High (1.5<DI) 2.685 2.300 1.146 21.9 22.5 8.1 10.0 14.9 16.1
Total 0.767 0.420 0.985 100 100 100 100 100 100
To have a further insight into regional spread and intensity of droughts figure 8 plots year-wise
drought events, and this confirms that droughts have become more frequent in the 1990s and 2000s
relative to those in 1970s and 1980s. In the 1970s and 1980s when there was drought it used to be
widespread and intense but afterwards these appear to have become localized and less intense. For
example, droughts of 1972, 1979, 1982 and 1987 were of medium to high-intensity and were spread
over more than 60 per cent of the districts in the country. In the latter years it was only 2002 drought
that was widespread.

34
Figure 8: Year-wise incidence and intensity of droughts
To see whether rice has become more tolerant to drought over time we compare mean yield loss at a
similar intensity of drought during 1969/88 -1989/2005 (Table 9). As expected, there is a negative
relationship between rice yield and magnitude of drought, and a direct relationship between yield loss
and magnitude of drought, and both the relationships weakened over time despite improvements in
yield. Loss measured both in kilograms per hectare and as percentage of mean yield increase with
magnitude of drought. On average, a low intensity drought did not cause much loss in rice yield
(1.9%) in the past four decades or so, but loss was significant, as much as 18 per cent, at a high
intensity drought. Nevertheless, the yield loss in absolute and relative terms has declined
considerably at every level of drought intensity. The decline was significant at low and high intensity
droughts. At low intensity drought, the rice yield loss that was about 4.5 per cent of the mean yield
during 1969-1988 became almost negligible during 1989-2005. Likewise, at high intensity drought
the yield loss declined from 24 per cent during 1969-1988 to about 9 per cent of the mean yield during
the latter period. In absolute terms it declined by about 39 per cent. The decline in yield loss was
relatively less at moderate droughts. But in general the conclusion is that rice has become more
resilient to droughts, which can be attributed to crop breeding for drought-tolerance, improvement
agronomy and water management.
Table 9: Rice yield loss at different drought intensities
Low intensity Medium intensity High intensity
Period (1969-1987)
Average yield (Kg/ha) 1303.56 1145.75 984.17
Yield loss (Kg/ha) -57.84 -113.48 -234.01
Yield loss (%) -4.44 -9.90 -23.78
Period (1988-2005)
Average yield (Kg/ha) 1801.87 1633.31 1627.64
Yield loss (Kg/ha) -8.94 -93.21 -143.30
Yield loss (%) -0.50 -5.71 -8.80
Overall (1969-2005)
Average yield (Kg/ha) 1581.41 1405.19 1161.75
Yield loss (Kg/ha) -30.58 -102.69 -208.97
Yield loss (%) -1.93 -7.31 -17.99
0
10
20
30
40
50
60
70
80
19
691
970
19
711
972
19
731
974
19
751
976
19
771
978
19
791
980
19
811
982
19
831
984
19
851
986
19
871
988
19
891
990
19
911
992
19
931
994
19
951
996
19
971
998
19
992
000
20
012
002
20
032
004
20
05
pe
r ce
nt
Low Medium High

35
Projected Impacts of Climate Change on Indian Agriculture
P S Birthal
This study estimates impacts of climate change on aggregate productivity of Indian agriculture using
panel data on 19 major crops for 200 districts (at 1970 base) for the period 1969-2005. Aggregate
productivity or gross revenue per unit of cropped area was estimated as sum of value of output of
crops (at 2004-05 prices) divided by total area under these crops. A log-linear model with gross
revenue per hectare was regressed on growing period rainfall and temperature, their quadratic and
interactions terms and proportion of area under irrigation.
The average marginal effects of seasonal temperature and rainfall estimated at their long-term means
are shown in Table 10. Marginal effects are statistically significant at all India level. A 1°C rise in
rabi temperature reduces gross revenue per hectare by 4.0 per cent, and a similar increase in kharif
season reduces it by 5.4 per cent. Irrigation reduces harmful effects of warmer climate on the
agricultural productivity by 21 per cent in rabi season and 17 per cent in kharif season. Marginal
effect of increase in seasonal rainfall (by 1mm) is positive, but is much smaller than the effect of
temperature, implying that climate change in India will influence agriculture largely through changes
in temperature. Across agro-climatic regions, marginal effects of weather variables vary in their
magnitude as well as direction. Arid-semi-arid tropical region is most vulnerable to climate change.
The damages due to rise in temperature are partially offset by irrigation.
Table 10: Marginal effect of rise temperature and rainfall on agricultural productivity Season All India Humid Semi-arid temperate Arid-Semi-arid tropics
Without
irrigation
With
irrigation
Without
irrigation
With
irrigation
Without
irrigation
With
irrigation
Without
irrigation
With
irrigation
Kharif
Rabi -0.0395 -0.0313 -0.037 -0.0311 -0.02178 -0.0194 -0.0368 -0.0276
Kharif -0.0545** -0.0452** 0.0159 0.0156 0.0138 0.0116 -0.0883** -0.0749**
Rainfall
Rabi 0.00019** 0.00025** -0.00003 -0.00001 0.00015 0.00017** 0.00043** 0.00048**
Kharif 0.00018** 0.00018** 0.00009** 0.00009** 0.00005** 0.00006** 0.00025** 0.00024**
We simulated climate impacts using seasonal changes in the surface air temperature and rainfall as
predicted by IPCC (2007) for the South Asia and for three time slices 2010-39, 2040-69 and 2070-99
under two climate change scenarios; one with a high future greenhouse gas emission trajectory
(A1F1) and, another with the lowest future emission trajectory (B1). Table 11 presents changes in
gross revenue per hectare under these scenarios. In short-run, agriculture is not much sensitive to
climate change in any of the climate change scenario. However, with progression of time the losses in
gross revenue per hectare become larger. In medium-run (2040-69), losses rise to 14 per cent in A1F1
and 8 per cent in B1. By 2100 the damages would increase to 25 per cent in A1F1 and 13 per cent in
B1. Without adaptation (irrigation) losses would be higher. Impacts are not uniform across regions.
By 2100, with significant changes in climate (A1F1), losses in the gross revenue per hectare in the
arid-semi-arid tropics are projected close to one-third of the output. If the changes in climate are slow
(B1), losses will be reduced to about half. The semi-arid temperate and humid regions, in contrast,
will be the less impacted by the climate change because of better availability of irrigation.

36
Table 11: Projected change in agricultural productivity (%) due to climate change
Climate scenario and time slice
Zone A1F1 B1
2010-39 2040-69 2070-99 2010-39 2040-69 2070-99
All India -4.76 -14.31 -25.11 -4.33 -7.61 -12.67
Humid -1.57 -4.41 -6.9 -1.31 -2.67 -3.66
Semi-arid temperate -1.03 -2.73 -4.37 -0.86 -1.76 -2.38
Arid-semi-arid
tropics
-6.01 -18.21 -32.43 -5.49 -9.46 -16.25
Regional Crop Planning for Improving Resource Use Efficiency and Sustainability
S S Raju, Ramesh Chand and S K Srivastava
In the wake of food shortages India had emphasized increase in food production wherever it could be
attained. Result oriented strategy to achieve quick growth in production has been the guiding principle
and got precedence over suitability in terms of agro economic factors and natural resource
endowments. As a result, crop shifts and crop pattern since early 1970s could not be guided by sound
principle of efficiency and comparative advantage. Rice has spread in those areas where it was never
grown before. Sugarcane has shifted from water abundant region to water stressed region. Price and
marketing policies and input subsidies have created artificial relative advantages for various crops in
various regions over the crops which have been the natural choices. A stage has been reached where it
has become very costly to sustain current crop choices and practices such as paddy cultivation in
Punjab, sugarcane cultivation in many parts of Maharashtra. Consequently, policy options available
for optimizing profitability of farmers have lacked objectivity and precision. Due to lack of proper
crop planning, problems of soil and water degradation are aggravating. So, the need is felt to guide
crop planning in the country so that it is consistent with natural endowment and resources use
efficiency.
The present study propose to develop regional crop plans for better resource use efficiency and
improving natural resource sustainability across production environments.
It will compare net income from different crops at market prices, economic prices net of
subsidies on inputs and net income based on natural resource valuation that takes into account
effect on natural resources and environment.
The study is carried out in 7 states in collaboration with state agricultural universities which are
collecting farm level data under “Comprehensive Scheme for Estimation of Cost of Cultivation of
Various Crops” implemented by Ministry of Agriculture, Government of India.
Assessing Performance of Pulses and Competing Crops Based on Market Prices and Natural
Resource Valuation
Ramesh Chand and S S Raju
Contribution of pulses to society is not appropriately assessed if it is based solely on market prices of
input and outputs. Pulses contribute to society and environment through various means. In the
production process, pulses improve soil fertility by fixing the atmospheric nitrogen into the soil. They
reduce the need for fertilizers and enhance the arable quality of the soil. The study compares net
income from pulses and other crops at existing market price, economic prices which net out effect of
subsidies and in terms of natural resource valuation which take into account effect on natural
resources. Pulses are found to be more paying than the competing crops on overall basis though they

37
generate lower income at market prices. Crop shifts in favor of pulses is found to be environment
friendly as pulses cultivation involves much lower emission of Green House gases compared to other
competing crops.
Table 12: Net income from different crops using various approaches of valuation
(Rs/ha), TE 2009-10
State/ Crop Based on
market prices
(1)
Based on
economic prices
(2)
(2)+Value of
nitrogen
(3)
Maharashtra
Red gram 19960 17056 20761
Cotton 11918 6486 6486
Andhra Pradesh
Green gram 10679 9241 11348
Black gram 19799 19249 23971
Maize 11441 4550 4550
Madhya Pradesh
Chickpea 13270 10724 12903
Wheat 20031 12871 12871
Uttar Pradesh
Lentil 17223 16207 18568
Rapeseed &
Mustard
21119 14878 14878
Growth of Area under different land-use categories in Bihar
Rajni Jain, Usha Ahuja, Anjani Kumar and Basant Sharma
Trends in different land-use categories in Bihar were analyzed at state and district level. The changes
were studied for two periods viz. 1987-2000 and 2001 to 2010. There was lot of variation in rate of
change in area under various land use category (Table13). Barren and uncultivable land followed a
small decline in both the periods. Area under cultivable waste land and fallow land declined sharply
during 1987 to 2000. The rate of decline has been slow thereafter. During 2001-2010 net sown area
followed a significant decline whereas current fallow land in the state of Bihar expanded rapidly. The
study also noticed large year to year fluctuation in area under some of the land use category.
Table 13: Growth and instability in different land-use categories in Bihar
(Percent)
Land-use categories 1987-2000 2001-2010
Growth Instability Growth Instability
Forest Area 0.08 0.62 0.00 0.00
Barren & uncultivable land -0.11 0.75 -0.15 0.46
Area under non-agril. uses 1.13 3.15 0.36 1.19
Cultivable waste land -3.35 15.31 -0.11 0.84
Permanent pastures & grazing -1.62 31.44 -1.55 3.26
Other fallow land -3.49 4.09 -1.34 4.57
Current fallow land -2.30 24.40 5.50 25.0
Land under misc. tree crops 1.73 6.05 0.42 0.48
Net area sown (NSA) 0.10 3.30 -0.80 3.30

38
Energy and Agriculture in India
Shinoj Parappurathu, Raju S. S., Ramesh Chand, Sivendra Srivastava and Siwa Msangi
Over the recent past, productivity enhancements in most of the crops were achieved through a
combination of technology up-gradation and intensive use of modern inputs. This has resulted in
manifold increase in demand for commercial forms of energy in agriculture sector. There has been a
marked shift from animate sources of energy to commercial sources such as fertilizers, pesticides,
diesel, electricity, etc. Such transformation has implications not only at the farm level but at the
aggregate level as well. The fact that a significant proportion of the commercial energy sources being
non-renewable put forth serious policy questions particularly when the stock of such resources are
limited. This study attempted to assess the changing face of Indian agriculture in the backdrop of fast
increasing demand for energy intensive inputs. A perusal at the composition of agricultural input
basket vividly showed the increasing orientation of the sector towards commercial energy inputs.
Further, crop-wise as well as state-wise pattern of input use was also assessed to understand the
sources of demand for these inputs. The study went on to estimate the aggregate energy requirements
of the sector for various periods in the recent past.. Differential rates of demand growth in different
inputs also resulted in significant compositional changes in energy use (Fig.9 ).
Figure 9: Contribution of various sources of energy to total energy use in agriculture
The crop-wise energy consumption revealed interesting patterns. It was found that, among the various
food crops, paddy and wheat were the most energy intensive crops followed by oilseeds, and
commercial crops such as cotton and sugarcane. Pulses were least energy intensive among all the
major ones considered in the analysis. State-wise examination of the energy consumption pattern of
major crops was also quite revealing. Within a particular crop itself, considerable variations have been
noticed across states on account of differentials in their resource allocation pattern. Based on the
estimated energy consumption figures and average yield levels, energy productivity of the crops were
also estimated and compared across states (Table 14).
Table 14: Crop wise energy productivity (kg/MJ) for major states in India, BE 2009-10
State Paddy Wheat Maize Chick-
pea
Pigeon-
pea
Groun
dnut
Rape &
Mustard
Cotton Sugarca
ne
Andhra Pradesh 0.19 0.23 0.18 0.09 0.07
Assam 0.29 0.09
Bihar 0.23 0.16 0.24 0.21 0.38
Chhattisgarh 0.11 0.06 0.3 0.16
Human labor15%
Animal labor78%
Machine labor
2%Diesel pumps
3%
Electric pumps
2%
1960-61
Human labor5%
Animal labor8%
Machine labor42%
Diesel pumps
20%
Electric pumps
25%
2009-10

39
Gujarat 0.16 0.12 0.05 0.06 0.06
Haryana 0.11 0.16 0.17 0.11
Himachal Pradesh 0.21 0.09 0.18
Jharkhand 0.26 0.1 0.26
Karnataka 0.28 0.24 0.10 0.03
Kerala 0.33
Madhya Pradesh 0.25 0.13 0.19 0.13 0.16 0.11
Maharashtra 0.18 0.07 0.08 0.12 0.09 0.02 2.23
Odisha 0.30 0.18 0.11
Punjab 0.13 0.29
Rajasthan 0.03 0.15 0.2 0.13
Tamil Nadu 0.12 0.08 0.07
Uttar Pradesh 0.17 0.14 0.11 0.12 0.14 0.11
Uttarakhand 0.34 0.20
West Bengal 0.17 0.10 0.07
As in the case of average energy consumption levels, energy productivity also varied across crops and
regions. Many major producing states of important crops were found to be operating at poor levels of
energy productivity. On the contrary, many states that produced crops at marginal levels of input use
were found to be able to derive more than commensurate levels of crop yields so that their energy
productivity remained impressive. The study results therefore bring about insights on the aggregate as
well as disaggregate pattern of energy use in Indian agriculture. The existing energy productivity
levels in several major crops raises questions about their long-term sustainability. The future planning
on energy and agriculture in the country should therefore draw lessons from the relevant findings the
study brings forth.
Markets and Trade
Bilateral India-Pakistan Agricultural Trade: Trends, Composition and Opportunities
Ramesh Chand and Raka Saxena
The study examines the trends, composition and opportunities for trade between India and Pakistan.
Broad picture of total and agricultural trade between India and Pakistan during recent 15 years or so,
from 1996-97 to 2012-13, is presented in Table 15. It shows the trade trend during 7 years before and
after implementation of SAFTA Agreement in year 2005-6. Total trade between Indian and Pakistan
was $ 234 million during late 1990s. It increased to $ 610 million by TE 2005-06. The next 7 years
witnessed close to 300% growth in bilateral trade which reached $ 2.3 billion in the recent years.
Trade flows between the two countries show that India’s export to Pakistan remained far above
Pakistan’s export to India. In 7 year following SAFTA Pakistan export to India rose almost 4 times.
India’s export to Pakistan, post SAFTA showed only slightly lower growth than its imports for
Pakistan.
Table 15. Total and agricultural trade between India and Pakistan before and after SAFTA
implementation (Million $)
Trade TE 1998/99 TE 2005/06 TE 2012/13
Total exports from India to Pakistan 135.5 499.1 1882.0
Total exports from Pakistan to India 98.4 110.7 424.0

40
Total trade 233.8 609.8 2306.0
Net Trade 37.1 388.3 1458.0
Agricultural Exports (India to Pakistan) 69.4 133.2 842.7
Agricultural Exports (Pakistan to India) 93.7 88.6 162.7
Total agricultural trade 163.1 221.8 1005.4
Net agricultural trade -24.3 44.6 680.0
Share of agricultural trade in total trade 69.8 36.4 43.6
Source: EXIM databank, Ministry of Commerce, Government of India.
The composition of India’s agricultural exports has undergone significant change overtime as exports
have diversified. During TE 1998-99, sugar and confectionary accounted for more than half of total
agricultural exports from India and close to one fifth export consisted of coffee, tea, mate and spices.
In next 7 years sugar and sugar confectionary was relegated to 5th position and its share declined to
less than 10%. The recent trade data reveals that cotton is now the dominant export item from India to
Pakistan. Edible fruits and nuts have emerged as largest import item from Pakistan to India which
constitutes 48.4% of total agricultural imports. This import mainly consists of dates. The second most
important item in the recent years is cotton fabric and textiles with 30% share in total agricultural
imports.
Figure 10: Trade Complementarity Index for agricultural trade between India and Pakistan
The trend in trade complementarity index explains why India’s exports to Pakistan have seen higher
growth than export from Pakistan to India. Import demand in Pakistan matches largely with export
supply from India, whereas, import demand in India matches very less with availability of agri
products for export from Pakistan. The trade pattern of past 15 years indicates that Indo-Pak
agriculture trade can be classified in three categories. One, trade for domestic stabilization; two, trade
based on comparative advantage of more or less permanent nature, and three, trade in specialized
products. All the three groups serve important purpose and their benefit can be enhanced through
trade facilitation and liberal trade policy. Some of India’s major exports like sugar, onion and even
cotton are meant largely for augmenting domestic supply due to production shocks in Pakistan.
Experience shows that there is considerable delay in arranging import on both sides to address
domestic shortages. Suitable mechanisms need to be developed for liberalized trade in such
commodities to address price shocks that hurt consumers and also put adverse effect on economy.
Bilateral trade is most cost effective and efficient instrument to address price and market volatility in
the two countries.
45.68
59.12
52.94 52.48
57.0360.31
53.8350.74
49.91
44.16
19.22 18.51 19.3722.13
30.30
20.7117.49 16.05 16.64
19.23
0.00
10.00
20.00
30.00
40.00
50.00
60.00
70.00
2003 2004 2005 2006 2007 2008 2009 2010 2011 2012
For Indian ag exports to Pakistan For Indian ag imports from Pakistan

41
Both countries have comparative advantage in export of some commodities to each other. These
include tomato, cane sugar, onion, fresh vegetables, cotton (carded and combed), and groundnut,
coarse cereals as feed and dairy products for exports from India to Pakistan. Similarly, Pakistan has
comparative advantage in exporting dates, leather, hides and skins and woven fabrics to India. There
is considerable scope for promoting export of specialized items whose trade is stable and growing.
These include products with unique attributes like herbs, medicinal and aromatic plants and some
cereals. Buckwheat (kuttu) and Psyllium (Isabgol) can be cited as specific examples here.
Onion Production and Price Volatility: Implications for Technology and Policy
Ramesh Chand, Raka Saxena and Sanjay Chayal
The onion production in India In last 30 years can be divided in two phases. In, first phase from 1980-
81 to 2003-4 area under onion cultivation doubled, from 0.25 million hectare to 0.5 million hectare
and production more than doubled in 23 years period. After this, area under onion cultivation doubled
in a decade, productivity increased by about 50 per cent and production almost tripled. Netting out for
population growth, India’s onion production has increased from 4.56 kg/person/year during biennium
2000-02 to 13.97 kg/person/year in years 2011-13. Onion export increased from India from 330
thousand metric tonnes in 2000 to 1822 thousand metric tonnes in 2012-13. However, onion
production in the country faced sharp year to year deviation from trend or normal production.
Figure 11: Trends in area, production and productivity of onion in India
Currently, close to 70 per cent of the total onion produced in the country comes from Maharashtra,
Karnataka, Madhya Pradesh, Gujarat and Bihar. Maharashtra is the highest onion producing state in
India contributing to approximately 30% share in total production.
Onion Price Crisis
Onion prices show high level of volatility; much higher than volatility in wholesale price index (WPI)
of food and non-food articles. In recent times onion price volatility has become more severe and is
getting explosive. This can be seen from Fig 3 which shows the arrival and price pattern of onion in
major markets of the state of Maharashtra. The pattern for year 2013, when onion prices skyrocketed
in the country, shows that market arrival of onion started declining from the month of January 2013
and the declining trend continued (except April 2013) and the gap widened to a great extent in August
8000
9000
10000
11000
12000
13000
14000
15000
16000
17000
0
2
4
6
8
10
12
14
16
18
Area (Million ha) Production (Million tonnes) Yield (kg per ha)

42
2013 as compared to previous year. Further, a sharp decline in market arrivals in September 2013
added to the crisis and its impact on prices became significantly evident.
Figure 12: Arrival and price pattern in Maharashtra
A peek into the onion crisis (2013) reveals that signals were available in the month of May-June about
the impending price shock and these have been exploited by onion traders under a clear strategy.
Market arrivals of onion in three post-harvest months of rabi crop (April to June 2013) in 32 markets
of the country including those in Maharashtra was in fact 24 per cent higher than the previous year.
As the supply from farmers dried up, the market arrivals beyond June were to be determined by the
stock released by onion traders. Market arrivals in July and August were lower by 17 and 22 per cent
compared to the previous year. This reduced supply, raised year on year market prices in the 32
markets in the months of July and August by 186% and 293% respectively compared to year 2012.
Then, it completely came in the hands of traders to dictate prices by calibrated release of stock with
them. There are two ways to stabilise supply and prices. One, stabilization through stock, two, and
stabilization through regional or temporal spread of onion cultivation. Stabilization through stock
requires market intervention in onion by public sector parastatals like NAFED. The second measure
relates to cultivation and technology. Instability in production can be reduced by diluting regional
concentration of onion production and by extending its cultivation beyond present seasons. Both these
options require technological interventions.
Network Project on Market Intelligence
Ramesh Chand, Raka Saxena, Pavithra S, Ranjeet Paul, Kavita Pal and Sanjay Chayal
The Network Project on Market Intelligence is engaged in preparing price forecasts for important
commodities and their dissemination to the farmers before sowing and during harvest time so that
informed and intelligent decisions can be taken by the farmers about area allocation and marketing of
produce. The study is implemented across 16 networking partners throughout the country with NCAP
as the lead centre (Box 1).
0
500
1000
1500
2000
2500
3000
3500
4000
0
100000
200000
300000
400000
500000
600000Ja
n/0
7
May
/07
Sep
/07
Jan
/08
May
/08
Sep
/08
Jan
/09
May
/09
Sep
/09
Jan
/10
May
/10
Sep
/10
Jan
/11
May
/11
Sep
/11
Jan
/12
May
/12
Sep
/12
Jan
/13
May
/13
Sep
/13
WSP
(R
s p
er
qu
inta
l)
Arr
ival
s (T
on
ne
s)
Arrivals Price

43
Box 1: Collaborating Centres and selected commodities
Sr. No. Collaborating Centre Commodities
1 Acharya N.G. Ranga Agricultural University,
Andhra Pradesh
Chickpea, Maize, Groundnut,
Cotton, Chilies
2 Banaras Hindu University, Uttar Pradesh Tomato, Potato, Mango,
Maize, Rapeseed
3 Central Potato Research Institute, Himachal
Pradesh
Potato
4 Dr. Panjabrao Deshmukh Krishi Vidyapeeth,
Maharashtra
Green gram, Pigeon pea,
Onion, Maize, Soybean
5 G.B. Pant University of Agriculture & Technology,
Pantnagar, Uttarakhand
Potato, Tomato, Cabbage,
Veg. Pea, Fine Paddy
6 Indian Institute of Horticulture Research,
Hessaraghatta Lake Post, Bangalore, Karnataka
Onion, Tomato, Mango,
Banana, Grapes
7 Indian Institute of Pulses Research, Uttar Pradesh Chickpea, Lentil, Green gram,
Pigeon pea, Black gram
8 Institute of Agri Business Management, Swami
Keshwanand Rajasthan Agricultural University,
Rajasthan
Cumin, Chickpea, Pearl
millet, Cluster bean,
Coriander
9 Jawaharlal Nehru Krishi Vishwa Vidyalaya,
Madhya Pradesh
Soybean, Chickpea, Maize,
Mustered &Rapeseed , Cotton
10 Junagarh Agricultural University, Gujarat Cotton, Groundnut, Maize,
Castor, Pigeonpea, Potato
11 Kerala Agricultural University, Thrissur, Kerala Pepper, Tapioca, Coconut
12 Orissa University of Agriculture & Technology,
Orissa
Coconut, Cotton, Turmeric,
Zinger, Groundnut, Maize,
Green gram
13 Sher-E-Kashmir University of Agricultural
Sciences & Technology, Shrinagar, Jammu &
Kashmir
Apple, Pear, Cherry, Walnut
14 University of Agricultural Sciences, GKVK,
Karnataka
Maize, Ragi, Red gram,
Potato, Banana

44
15 YS Parmar University of Horticulture & Forestry,
Himachal Pradesh
Apple, Tomato, Peas, Ginger,
Maize
16 ICAR-NEH, Meghalaya Tomato, Ginger, Turmeric,
Potato, Pineapple
The centers are required to provide reliable forecasts using scientific analysis to allow
producers to make better informed decisions and manage price risk. The price forecasts for
selected commodities are being made after complete understanding of the global, national
and regional environment along with application of scientific methodology. The forecasts are
also validated with farmers’ and traders’ perception regarding the price expectations in
future.
Indian Vegetables Export potential and Competitiveness
M.B. Dastagiri, T.K. Immanuelraj, C.V. Hanumanthaiah, P. Paramsivam, R.S. Sidhu, M.
Sudha, SubhasisMandal, Basantha Singh, Khem Chand, B. Ganesh Kumar
This study estimates export competitiveness of vegetables in India during 1991-2011 using the nominal protection coefficients (ratio of domestic to export price) as indicator of export competitiveness. The results show that NPC for all selected vegetables was less than 1 throughout as domestic prices ruled lower than export price (table 16). In some crops like tomoto and onion export fetches 3-5 times the domestic price. The results show that Indian vegetables have huge potential for exports.
Table 16: Nominal protection coefficients for Export competitiveness of Indian vegetables
Vegetable TE 1992-93 TE 2000-01 TE 2010-11
Potato 0.8 1.0 0.7
Tomato 0.5 0.3 0.5
Onion 0.3 0.2 0.3
Cucumber & gherkin 1.0 0.9 1.0
Structure, Conduct and Performance of Live animal markets: The case of small
ruminant market in Rajasthan
A. Suresh
Livestock markets in general and small ruminant markets in particular are traditional in
nature and are inflicted by various imperfections. In this context the study examined the
performance of the small ruminant market and discuss at the reforms required for increase in
market efficiency through structure, conduct and performance analysis of Ajmer market of
Rajasthan, one among the foremost live animal trade centres in India. The study revealed that

45
the market suffers from imperfection arising out of restriction to participate in the market.
Commission agents through informal understanding put stringent conditions for new
enterants. The undercover method of pricing the animals along with lack of options for open
quotation; pricing animals on flock basis rather than on individual basis; reliance of visual
observation for pricing rather than weighing method makes the small traders and farmers who
bring their animal in a disadvantageous position. Market also lack facilities for veterinary
care; provision of feed and fodder and for addressing food safety concerns. The market
charges including commission agents’ charges is to the tune of 4-5% of the value of the
animals, rather a high level. Farmers in general realise about 60-65 per cent of the value of
the animals. The study indicated that the edge brought out through technologies and better
management is drained at the marketing level. Therefore, livestock markets needs
intervention to regulate the market operations so as to address the concerns of the farmers and
consumers
INSTITUTIONAL CHANGE
Changes in rural labor market and their implications on Agriculture
Ramesh Chand and S.K. Srivastava
The study examined the long run changes in rural labour market and their implication for
Indian agriculture. During the 16 years between 1993-94 and 2009-10, the rural workforce
has increased by about 44 million mainly on account of the increase in the male workers. The
number of female workers did not increase at all despite a 25% increase in their population.
The trend in sectoral employment showed that the rural labour market is undergoing
profound changes with labour moving from agriculture towards non-farm sectors. The share
of agriculture in total rural employment declined by 10.47 percentage points (11.30
percentage points for male and 6.80 percentage points for female) between 1993-94 and 2010
(Table 17). On the other hand, industry, construction and services sectors witnessed an
increase in share though at varying levels.
Table 17: The share of different sectors in total rural employment
(per cent)
Sector Male Female Persons
1993-94 2009-10 Change 1993-94 2009-10 Change 1993-94 2009-10 Change
Agriculture 74.10 62.80 -11.30 86.20 79.40 -6.80 78.43 67.96 -10.47
Industry 7.00 7.00 0.00 7.00 7.50 0.50 7.00 7.16 0.16
Construction 3.20 11.30 8.10 0.90 5.20 4.30 2.38 9.40 7.03
Services 14.70 17.90 3.20 5.60 7.60 2.00 11.44 14.70 3.26
Total 100 100 - 100 100 - 100 100 -
(187.8) (231.9) (104.8) (104.6) (292.5) (336.5) Figures within parentheses refer to total workforce (million) in rural sector
The diversification of the rural labour market is influenced by a set of complex factors such as the
pattern of economic growth, inter-sectoral wage rate and worker productivity differentials, education,
MGNREGS and sociocultural factors. The output growth in non-farm sectors outpaced growth in the
agriculture sector during the last 16 years. This prompted workers to move towards non-farm sectors
to fetch a higher income. Similarly, higher wage rate and worker productivity in non-farm sectors
were also found to be the driving forces for such changes. MGNREGS has broken the long stagnation

46
in real wage rates in rural India and is contributing towards the goal of inclusive growth. MGNREGS
was found to provide work for about 2% of total rural labour supply and about 3% of labour supply
from rural labour households. Further if a labour household, which got work under MGNREGS, was
employed for 100 days, as envisaged in the scheme, then MGNREGS share in labour supply increases
to 5.2% for all rural households and 8% for rural labour households. The expansion of MGNREGS is
bound to cause a reduction in the availability of rural labour for other activities. A changing work
culture and the emerging contractual arrangement between labour and labour-hiring farm households
are also affecting the rural labour market. The improvement in education and skills of the largely
uneducated and unskilled rural labour will accelerate changes in the structure of the rural workforce.
Though the movement of labour out of agriculture is a welcome development from the economic
growth and development point of view, there is a strong need to develop an effective strategy to face
the decline in labourforce in agriculture and the wage rate increase, which subsequently increases the
cost of production and prices. This should include a strategy for the farm sector in the form of
appropriate mechanisation, farm practices and custom hiring arrangements. Agriculture R&D has to
play a vital role in terms of offering a substitute for labour in farm operations and in terms of
offsetting cost-push inflation resulting from the structural shift in labour employment and rise in
wages.
Contractual arrangements and financial pattern of mango growers in Uttar Pradesh
Raka Saxena, P S Birthal, Ramesh Chand, P K Joshi, Pallavi Rajkhowa, K R Chaudhary, Mohd
Arshad and Zeeshan
The study examines the financial arrangements at different stages of mango (table purpose) value
chain in Uttar Pradesh. The contracting arrangements in mango cultivation and marketing are made to
mitigate the risk and shifting the cultivation and marketing activities to contractors due to obvious
reasons. Fig 13 provides the details of contracting arrangements in mango cultivation in UP. All these
contracts are oral and, therefore, informal in nature with no legal framework. These contracts are
performed under mutually appropriate terms and conditions suited to both the orchard owners and
mango contractors. Two third of the contracts are made before flowering and one fourth at the time of
flowering. Contractors visit the villages to survey the mango orchards at the end of season i.e. from
the month of September to November and after this enter into fresh contract. About 80 % of the pre-
harvest contract arrangements are finalized between the months of December to March.
Understanding the financial structures both for mango growers and associated actors in the value
chain is necessary for upgrading the strategies that can help in mango business (Fig 13). Finance in
mango value chain is of two types. First includes informal finance obtained through mutual
relationship between two or more actors in the value chain. Second, includes approaching finance
from formal financial institutions such as commercial banks.
It has been revealed that only 27 per cent of the mango growers avail formal financial support through
financial organizations, whereas 73 per cent manage through informal sources of finance. Majority of
the mango growers take credit between 1 lakh to 5 lakhs to meet various operational requirements in
mango cultivation. The studies have reported that the process in the formal financial institutions take a
long time to get financial assistant, requires a large set of documents in the screening phase that are
difficult to be fulfilled by mango growers in the rural areas, it puts the finance product away from the
potential clients. Thus, the informal finance mechanism is often the only options left for mango
growers and other associated actors in mango value chain.
Majority of the mango growers, among those, who had taken credit are bank beneficiaries, get short
term finance from input suppliers, traders and others. The mango traders provide finance to mango
growers to ensure a smooth flow of mango business, keep mango chain running, and maintain long-
term relationships between two or more mango value chain actors. These informal sources work only
in long standing relationships and these relationships build on trust only. The finance provided is short

47
term in nature and relatively small in amount, lacks in transparency and they don’t maintain any legal
paper work for these transactions.
Fig 13. Contracting Arrangements in Mango Cultivation
Contract Design
Orchard Characteristics
Density of the orchard
Age of the trees
Area of the orchard
Condition of the orchard
Distance of the orchard
from the nearby road/market
Irrigation facility in the orchard
Variety of mango
Yield history
Contract Attributes
Expected price of Mango
Expected supply
Past experience with that mango orchard
Market potential
Financial settlement with orchard owner
Orchard Owners' Attributes
leading to Contract
Lack of Entrepreneurship
skills of the owner
Risk Sharing
Bad past experience with the
mango cultivation and
marketing
Lack of physical and
financial resources for
cultivation
Lack of technical knowledge
in mango cultivation
Contract Management
Payment made in terms of lump sum or installments
Contract made in terms of cash payment or share-cropping
Verbal contract
Settlement procedures being followed mutually if any change take place
Cost sharing contracts
Type I
Contractor covers whole cost
Material Cost
Operational Labour
Cost
Marketing Labour
Cost
Transportation Cost
Mandi Charges
Commission paid to
commission agents
Type II
Cost Sharing by Owner and
Contractor
Material Cost
Operational Labour
Cost
Marketing Labour Cost
Transportation Cost
Mandi Charges
Commission paid

48
Income Sources of Farm Households in India: Determinants, Distributional Consequences and
Policy Implications
P S Birthal, Digvijay S. Negi, Awadesh K. Jha and Dhiraj Singh
This paper has examined farm households’ access to different income-generating activities, and their
impact on income distribution using data from a nationally representative large-scale survey on
Situation Assessment in Agriculture with reference to year 2002-03. The analysis has shown that, as
against the common perception of agriculture as the dominant source of income for farm households,
these households earned close to half of their income from non-farm activities (Table 18)The non-
farm income was more important to the households at lower end of land distribution. The poor
households diversified more toward low-paid, low-return non-farm activities. The non-farm income
sources were accessible to a small proportion of farm households and had un-equalizing effect on
income distribution.
A number of push and pull factors determine the extent of non-farm diversification. Small
landholdings, lower farm profits and surplus labour tend to push farm households out of agriculture,
while education and access to credit facilitate this transition.
Agriculture being the largest income source contributed most to the income inequality. But because of
its wider spread, any change in agricultural income was unlikely to have a significant effect on
income distribution (Table 19). The distribution of wages and salaries, and livestock is skewed toward
the poor, and an increase in income from these sources has an equalizing effect on income
distribution. On the other hand, the distribution of non-farm business income is highly unequal and
any increase in it would lead to deterioration in income distribution.
Table 18: Income sources of farm households in India
Crops
Livestock
Wages and salaries
Non-farm business
Particip
ation
rate (%)
Share in
income
(%)
Participat
ion rate
(%)
Share in
income
(%)
Participat
ion rate
(%)
Share in
income
(%)
Participat
ion rate
(%)
Share in
income
(%)
By income quintile
Lowest 89.8 49.2 54.6 18.7 42.2 28.4 6.6 3.7
Second 90.2 45.2 61.1 19.2 50.4 31.2 8 4.4
Third 90.1 43.8 66.2 19.6 51 30.1 10 6.4
Fourth 90.8 45.3 70.4 19.2 48 25.2 16.1 10.3
Highest 93.5 38.4 72.3 10.7 36.8 13.5 30.4 37.4
All 90.9 41.4 64.9 14.4 45.7 19.8 14.2 24.4
By farm size
Sub-marginal
(0.002-0.5ha)
83.1 16.2 61.6 14.8 63.9 36.1 19.5 32.9
Marginal
(0.5-1.0 ha)
96.7 36.3 63.8 15 40.1 21.4 12.5 27.4
Small
(1.0-2.0 ha)
97.2 49.6 65.8 15.7 34.3 15.4 10.4 19.3
Medium (2.0-
4.0 ha)
95.8 56.6 70.3 13.8 27 9.7 7.8 19.9
Large (>4.0
ha)
91.6 67 78.1 12.2 18.8 4.4 9.8 16.4
All 90.9 41.4 64.9 14.4 45.7 19.8 14.2 24.4

49
Table 19: Contribution of income sources to inequality in total income
Income source Share in total
income
Gini coefficient
for source
income
Proportion
contribution of
source income to
total inequality
Marginal effect
of a 1 per cent
change
in source income
Agriculture 0.414 0.684 0.394 -0.020
Livestock 0.144 0.745 0.106 -0.038
Wages and salaries 0.198 0.834 0.132 -0.066
Non-farm business 0.244 0.958 0.367 0.123
Total 1.000 0.584 1.000 0.00
Access and utilization of resources and decision making by farm women in East India
Usha Ahuja, Rajni Jain, Dharminder Choudhary and Amarjeet Singh
The study examines the extent of ownership and accessibility of rural women to productive resources
and their participation in decision making in farm and household activities in Bihar, Jharkhand and
Odisha. Quantitative and qualitative data was collected from 480 households by conducting survey in
12 selected villages of these states. The findings show that less than five percent women have access
to these resources in spite of their significant contribution in farm activities. With regard to ownership
of assets and resources, situation was relatively better. In case of participation in decision making,
role of women is not very promising. Most of the decisions are being taken by males alone (85-90%).
Only in 10-15% cases, women were observed to have any say in the decision making. Further, the
role of women was confined to the activities which have less financial implications. Since, majority
of the women are involved in the agricultural operations, women’s access to resources and their
participation in decision making would be crucial to boost the agricultural production and productivity
in the study area. It is recommended that rural women should be given the opportunity to have more
access and some degree of control over use of resources in order to alleviate poverty.
Women Empowerment in Agriculture Index (WEAI) for Eastern India
Usha Ahuja, Rajni Jain, Dharminder Choudhary and Amarjeet Singh
The present study measured the status of empowerment of farm women of east India by using the
methodology of the Women’s Empowerment in Agriculture Index (WEAI) developed by IFPRI with
the association of USAID and OPHI. The WEAI is a composite measurement tool that allows
researchers to identify women who are disempowered and understand how to increase autonomy and
decision-making in key domain The WEAI comprises two Sub indexes. The first assesses the degree
to which women are empowered in five domains of empowerment (5DE) in agriculture. It reflects the
percentage of women who are empowered and, among those who are not, the percentage of domains
in which women enjoy adequate achievements. These Domains are (1) decisions about agricultural
production, (2) access to and decision making power about Productive resources, (3) control of use of
income, (4) leadership in the community, and (5) time Allocation. Women are considered to be
empowered if they have adequate achievements in four of the five areas. The second sub index (the
Gender Parity Index [GPI]) measures gender parity. The GPI reflects the percentage of women who
are empowered or whose achievements are at least as high as the men in their households. For those
households that have not achieved gender parity, the GPI shows the empowerment gap that needs to
be closed for women to reach the same level of empowerment as men. Results pertain to above
mentioned two sub-indexes for the three selected districts of east India are presented in Table20.
WEAI is highest for Jharkhand (0.73), followed by Bihar (0.65) and Odisha (0.63). It can be inferred
on the basis of these results that Jharkhand women tend to influence and exert more in making
decisions of utmost importance having long term implications for the family and household compared
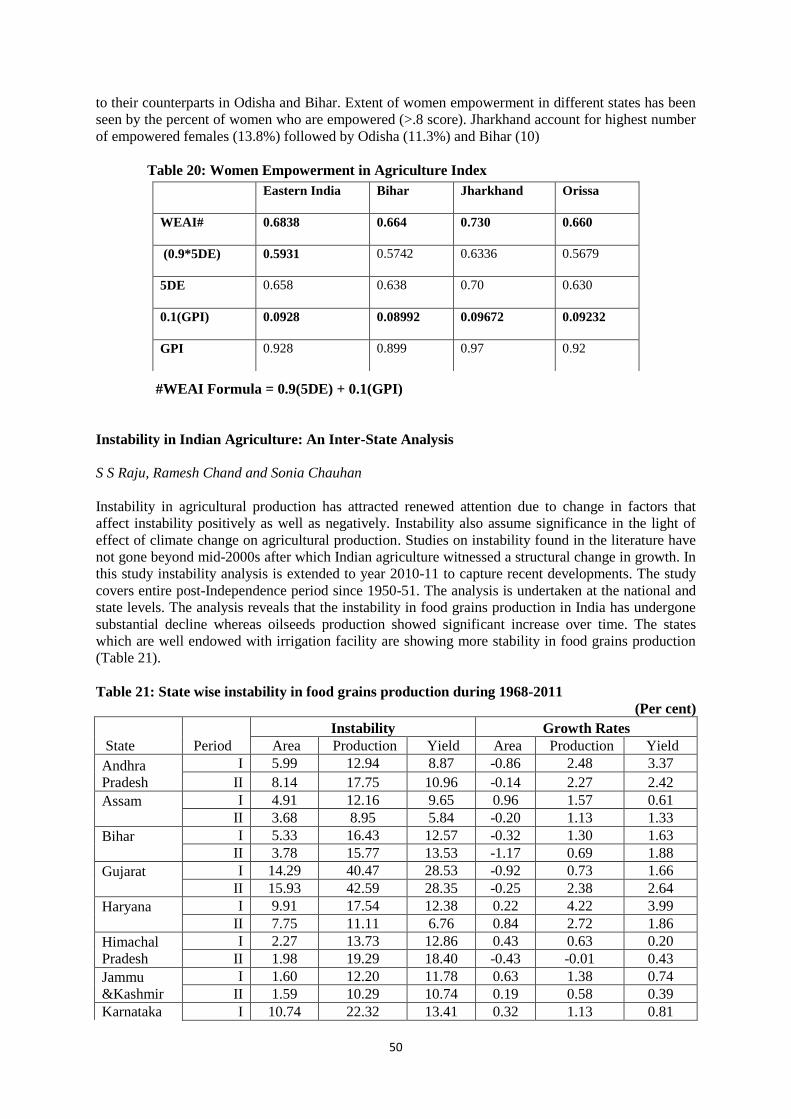
50
to their counterparts in Odisha and Bihar. Extent of women empowerment in different states has been
seen by the percent of women who are empowered (>.8 score). Jharkhand account for highest number
of empowered females (13.8%) followed by Odisha (11.3%) and Bihar (10)
Table 20: Women Empowerment in Agriculture Index
#WEAI Formula = 0.9(5DE) + 0.1(GPI)
Instability in Indian Agriculture: An Inter-State Analysis
S S Raju, Ramesh Chand and Sonia Chauhan
Instability in agricultural production has attracted renewed attention due to change in factors that
affect instability positively as well as negatively. Instability also assume significance in the light of
effect of climate change on agricultural production. Studies on instability found in the literature have
not gone beyond mid-2000s after which Indian agriculture witnessed a structural change in growth. In
this study instability analysis is extended to year 2010-11 to capture recent developments. The study
covers entire post-Independence period since 1950-51. The analysis is undertaken at the national and
state levels. The analysis reveals that the instability in food grains production in India has undergone
substantial decline whereas oilseeds production showed significant increase over time. The states
which are well endowed with irrigation facility are showing more stability in food grains production
(Table 21).
Table 21: State wise instability in food grains production during 1968-2011
(Per cent)
State
Period
Instability Growth Rates
Area Production Yield Area Production Yield
Andhra
Pradesh
I 5.99 12.94 8.87 -0.86 2.48 3.37
II 8.14 17.75 10.96 -0.14 2.27 2.42
Assam
I 4.91 12.16 9.65 0.96 1.57 0.61
II 3.68 8.95 5.84 -0.20 1.13 1.33
Bihar
I 5.33 16.43 12.57 -0.32 1.30 1.63
II 3.78 15.77 13.53 -1.17 0.69 1.88
Gujarat
I 14.29 40.47 28.53 -0.92 0.73 1.66
II 15.93 42.59 28.35 -0.25 2.38 2.64
Haryana
I 9.91 17.54 12.38 0.22 4.22 3.99
II 7.75 11.11 6.76 0.84 2.72 1.86
Himachal
Pradesh
I 2.27 13.73 12.86 0.43 0.63 0.20
II 1.98 19.29 18.40 -0.43 -0.01 0.43
Jammu
&Kashmir
I 1.60 12.20 11.78 0.63 1.38 0.74
II 1.59 10.29 10.74 0.19 0.58 0.39
Karnataka I 10.74 22.32 13.41 0.32 1.13 0.81
Eastern India Bihar Jharkhand Orissa
WEAI# 0.6838 0.664 0.730 0.660
(0.9*5DE) 0.5931 0.5742 0.6336 0.5679
5DE 0.658 0.638 0.70 0.630
0.1(GPI) 0.0928 0.08992 0.09672 0.09232
GPI 0.928 0.899 0.97 0.92

51
II 4.82 18.83 16.11 0.44 2.33 1.88
Kerala
I 3.28 6.07 4.39 -1.96 -0.91 1.07
II 3.82 8.15 5.48 -4.98 -3.65 1.40
Madhya
Pradesh
I 2.49 19.84 18.55 0.42 2.21 1.79
II 4.59 20.17 16.27 -0.12 0.80 0.92
Maharashtra
I 8.18 27.44 20.08 0.62 3.28 2.64
II 5.38 21.60 18.65 -0.66 0.37 1.03
Odisha
I 4.50 21.92 18.14 1.11 1.40 0.29
II 6.66 28.82 24.73 -0.99 0.27 1.28
Punjab
I 3.58 5.00 5.11 2.16 5.59 3.35
II 1.81 4.92 4.10 0.75 1.83 1.07
Rajasthan
I 10.92 27.89 21.34 -0.08 2.00 2.08
II 17.54 38.88 23.88 0.50 2.69 2.18
Tamil Nadu
I 10.17 22.76 15.03 -1.17 -0.32 0.86
II 7.70 18.98 14.24 -1.48 -1.02 0.47
Uttar
Pradesh
I 2.18 14.78 13.73 0.34 3.78 3.42
II 2.84 8.34 6.59 0.08 1.38 1.30
West
Bengal
I 4.69 15.83 12.94 -0.08 1.49 1.58
II 4.44 6.51 5.21 -0.18 1.51 1.69
India
I 3.49 9.90 7.56 0.19 2.57 2.38
II 3.30 8.80 5.83 -0.08 1.42 1.50 Note: Period I is 1968-88 and Period II is 1989-2011
AGRICULTURAL GROWTH AND MODELLING
Dissecting Agricultural Performance since Mid-1990s
Ramesh Chand
Agriculture sector in India and in many other countries faced several tough challenges for
couple of years after implementation of the WTO agreement on agriculture in year 1995,
primarily due to sharp fall in prices of agricultural commodities. The fall in prices led to
perceptible decline in growth of agricultural output after the mid 1990’s which had several
consequences including widespread agrarian distress. The last nine years (2004-05 to 2012-
13) have witnessed impressive revival of agriculture growth rate even though growth rate of
non-agriculture sector decelerated in recent years. Besides growth per se the quality of
growth has also seen considerable improvement and there has been progress relating to
inclusiveness, regional equity, and nutrition security. Though these achievements are highly
significant and unique in many respects, there is not adequate appreciation or realization
about these in the country. The study provides proper understanding of the decline and
improvement in performance of agriculture since the mid-1990s. It compares the
performance of agriculture in the recent years with the preceding decade and provides an
update on the achievements of the agriculture sector in recent 10 years or so. It also discusses,
with evidence, how and when the turnaround in agriculture took place, for developing proper
understanding of India’s agriculture growth story.

52
Growth Trend and Composition
The study revealed that India agriculture experienced two structural breaks in its GDP in the
last two decades – one in year 1996-97 which took growth trajectory downward and another
in year 2004-5 which moved growth trajectory upward. Indian agriculture moved on a growth
trajectory of 3.15 per cent per annum during 1988-89 to 1996-97 which plummeted to 1.92
per cent in the next nine years. This was a very low growth having several adverse effects on
farm economy and livelihood of farming community and posed a serious threat to the
national food security.
Fig 14: Growth rate in GDP agriculture and allied sector at 2004-05 prices
Some initiatives were taken towards the end of 10th Plan and during 11th Plan to revive the
sector. Consequently, the growth rate accelerated to 3.75 per cent during 2004-05 to 2012-13.
The agriculture sector moved back on long term growth trajectory and now approaching
targeted growth rate of 4 per cent.
Broad based Growth
The increase in growth rate of agricultural output was not confined to a few segments or
commodity groups or to dominant products. Rather, the growth has been experienced across
the board. Within the subsectors, crop sector recorded 3.3% and fruits and vegetables
recorded 5.3% annual rate of growth. Livestock output increased at 4.8 per cent per annum
while fishery sector recorded 4.5% growth rate. The rate of growth in the recent decade has
been historical in most cases. Growth rate of crop sector in recent nine years (2003-04 to
2011-12) has been 75 per cent higher than the previous decade (Table 1). The growth rate in
livestock and horticulture growth was higher by 41 per cent and fisheries by 48 per cent over
the preceding nine years period.
0
0.5
1
1.5
2
2.5
3
3.5
4
1988-89 to1996-97
1996-97 to2004-05
2004-05 to2012-13
3.15
1.92
3.75
Tre
nd
gro
wth
rat
e:
%/y
ear

53
Table 22: Trend growth rate in output of various sub sectors of agriculture: Per cent
Sub sector
1987-88
to
1995-96
1995-96
to
2003-04
2003-04
to
2011-12
Crop sector 2.97 1.87 3.28
Livestock 4.10 3.43 4.84
Fruits and vegetables 4.29 3.79 5.33
Fishery sector 7.22 3.02 4.48
Performance of Various Crops
Trend growth rates in production of various crops are presented in table 2. The growth rate in
many crops was negative during 1994-95 to 2003-04, which has been reversed in the recent
decade. In other cases there has been sharp acceleration. It is worth mentioning that cotton
production followed double digit growth in last 10 years while soybean, maize and gram
experienced more than 5 per cent annual growth. Output of pulses, which was stagnating for
quite some time, also moved on a rising trend with growth rate of more than 3 per cent.
Table 23: Trend growth rate in physical output of selected crops/groups: Per cent
Crop/ group 1994-95 to 2003-04 2003-04 to 2012-13
Foodgrains 0.71 2.66
Cereals 0.81 2.61
Pulses -0.64 3.31
Rice 0.62 1.99
Wheat 1.03 3.60
Maize 4.43 5.51
Gram -2.37 5.59
Pigeonpea 0.14 2.05
Oilseeds -1.65 2.47
Soybean 3.35 7.61
Sugarcane -0.47 4.01
Cotton -2.23 10.46
Fruits and vegetables 2.64 6.26
Vegetables 3.24 6.37
Fruits 1.53 6.04
Banana 0.92 7.57
Mango 0.96 4.44
Citrus 4.50 5.34
Onion 3.07 12.98
Potato 2.90 8.94
The growth rates in output of horticultural crops during the decade 1994-95 to 2003-04 and
2003-04 to 2012-13 reveal grand success of the horticulture in the second decade. Growth
rate in fruits as well as vegetables accelerated from 2.64% during 1994-95 and 2003-04 to
6.26% during 2003-04 to 2012-13. Among vegetables, onion production recorded 13%

54
annual growth while potato production increased by 8.9% per year. Among various fruits,
highest growth is observed in banana, 7.57%.
Initiatives and Factors underlying the Growth Revival
The study identified major contributing factors for growth revival as under:
Improvement in terms of trade for agriculture in the last 10 years and remunerative
prices for farm produce.
Higher use of productivity enhancing inputs like fertilizer and quality seed
Expansion of irrigation and increase in agricultural investments supported by public
sector capital formation
Substantial increase in the supply of institutional credit to agriculture.
Achievements in technology and strengthening of extension
Initiatives like NFSM, RKVY and BGREI and other missions and programmes.
The most important factor underlying acceleration in agriculture growth after 2004-5
has been the improvement in terms of trade in favour of agriculture. Agricultural prices
relative to non agricultural prices followed a decline of 7 per cent between 1997-98 and
2004-05. Thereafter, agricultural prices received by farmers relative to non-agricultural prices
have risen by about 30 percent (Fig. 2). Thus, better pricing environment provided incentive
to farmers to use more and better input and adopt modern technology.
Fig. 15: Terms of trade between agriculture and non-agriculture
It is a challenge to maintain the growth tempo achieved during 2004-05 to 2013-14. As no
country can afford to keep real agricultural prices rising for a very long time, therefore, ways
and means have to be devised to sustain profitability incentive. One way to maintain price or
profitability incentive for farmers is to increase their share in final prices paid by consumers
and other end users. The second source is technology either through resource saving or
through increase in productivity. The agricultural development strategy in the last ten years
has focused on production and MSPs. For a long time, significant progress has not been
made in agricultural markets like reforms in market regulation, development of infrastructure,
entry of modern capital, and development of new models of marketing. Agricultural
development strategy should be expanded to bring marketing in its fold to improve
competition, reduce efficiency and harness market innovations.
107.8
100.0
129.8
90
95
100
105
110
115
120
125
130
135
Term
s o
f tr
ade

55
Agriculture Diversification towards Horticulture: Trends and Prospects
Ramesh Chand, S S Raju and Sonia Chauhan
Indian agriculture is diversifying towards horticultural crops but at a slow rate. The pace of
diversification slowed down after 2005-06 as Government initiatives like National Food
Security Mission and other public policies strongly pushed cultivation of pulses and cereals
during 11th five year plan. Despite stagnation in area after 2005-06 growth rate in production
of fruits and vegetables and condiment and spices witnessed sharp acceleration. Annual
growth rate in horticulture output showed twice the growth rate of non-horticultural crops.
This could happen due to very high differentials in productivity of horticulture crops relative
to non-horticultural crops and strong demand for the former (Table 24).
Table 24 : All India productivity of various crop groups
(Rs/ha)
Crop group At 2004-05 prices At current prices
1995-96 2005-06 2010-11 2010-11
Cereals 13194 14623 16557 29471
Total pulses 7763 9212 9958 19209
Total oilseeds 16342 18945 22128 36807
Sugar cane 80854 74420 75344 140045
Cotton 15117 21793 25110 57713
Horticulture 88694 108118 137833 166816
Fruits & Vegetables 106786 123002 161865 168725
Condiments & Spices 37351 57150 67332 157156
All crops 19976 25142 28956 52867
Price trends for various commodities indicate that prospects of demand led growth of
horticultural crops are very high. Despite double the growth rate in its output, horticulture
group witnessed much higher increase in prices compared to non-horticultural crops. High
potential for expansion of horticulture particularly fruits is also evident from a very sharp
increase in their imports. Similarly, overseas demand for India’s horticultural products also
shows spectacular growth. Both domestic as well as overseas demand strongly favors
diversification towards horticulture in India.
Area under horticulture in some states is awfully low - less than 1.5 per cent. A small shift in
crop pattern towards horticulture crops will bring large increase in production which will
contribute to increase in agriculture productivity and higher growth in output.

56
Farm Income in India: Estimation and Major Concerns
Ramesh Chand, Raka Saxena and Simmi Rana
There are large number of studies on agricultural income but few attempts have been made to
estimate share and level of agriculture income that accrues to farmers. This study fills this
important gap by constructing proper series of farm income which can be taken as a true
indicator of income accruing to farmers from undertaking agricultural production. The farm
income was estimated from the GDP agriculture at factor cost by deducting the capital
consumption and cost of hired labour i.e. wage bill paid by farmers to agricultural labour.
Over time, number of farmers, number of holdings, number of cultivators and population of
farm families dependent on farm income has also changed. Therefore, a clear idea about level
and increase in income of farmers can be obtained by looking at changes in farm income per
cultivator and per farm holding. These results corresponding to the rounds of Rural labour
Enquiry, from where labour data was taken, are presented in Table 25. The table also reports
farm income at current prices and farm income per hectare of area.
Table 25: Trend in real farm income: nominal series deflated by Consumer Price index
for Agricultural Labour with base 2004-5
Farm income per
Cultivator
Farm income
per holding
Farmers' income per
hectare of NCA
1974-75 17998 19042 10737
1977-78 21613 22430 13168
1983-84 24227 24776 16220
1987-88 24021 24541 18457
1993-94 28764 29258 23005
1999-00 32535 33831 28551
2004-05 35813 35067 31624
2011-12 55527 47084 46544
Income at current
prices in 2011-12
101583
86136
85149
Between 1974-75 and 2011-12, the farm income per cultivator in real terms has increased by
close to three times, from Rs 17998 to Rs 55527. Similarly, the farm income per hectare of
net sown area also increased by more than four times in the last 37 years. In the same period
the farm income per holding grew from Rs 19042 to Rs 47084, per holding farm income was
higher than income per cultivator before 2004-05. In the next seven years, there has been a
significant drop in the number of cultivators while number of holdings continued to increase
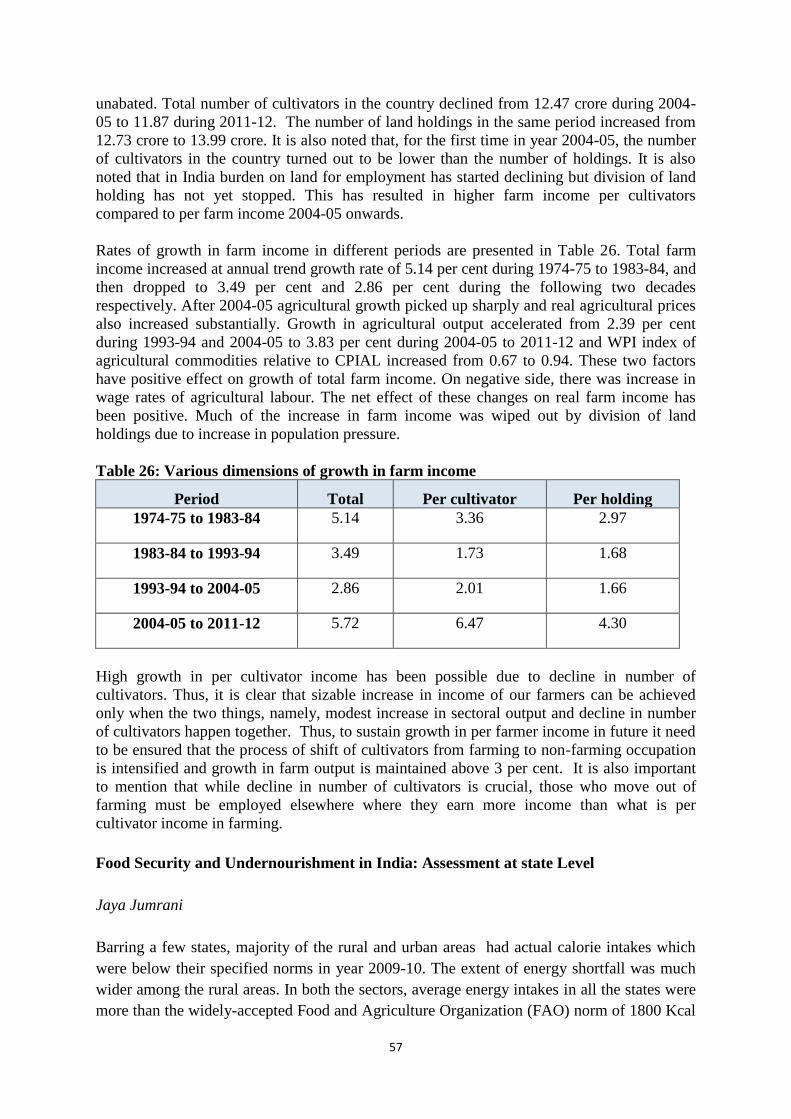
57
unabated. Total number of cultivators in the country declined from 12.47 crore during 2004-
05 to 11.87 during 2011-12. The number of land holdings in the same period increased from
12.73 crore to 13.99 crore. It is also noted that, for the first time in year 2004-05, the number
of cultivators in the country turned out to be lower than the number of holdings. It is also
noted that in India burden on land for employment has started declining but division of land
holding has not yet stopped. This has resulted in higher farm income per cultivators
compared to per farm income 2004-05 onwards.
Rates of growth in farm income in different periods are presented in Table 26. Total farm
income increased at annual trend growth rate of 5.14 per cent during 1974-75 to 1983-84, and
then dropped to 3.49 per cent and 2.86 per cent during the following two decades
respectively. After 2004-05 agricultural growth picked up sharply and real agricultural prices
also increased substantially. Growth in agricultural output accelerated from 2.39 per cent
during 1993-94 and 2004-05 to 3.83 per cent during 2004-05 to 2011-12 and WPI index of
agricultural commodities relative to CPIAL increased from 0.67 to 0.94. These two factors
have positive effect on growth of total farm income. On negative side, there was increase in
wage rates of agricultural labour. The net effect of these changes on real farm income has
been positive. Much of the increase in farm income was wiped out by division of land
holdings due to increase in population pressure.
Table 26: Various dimensions of growth in farm income
Period Total Per cultivator Per holding
1974-75 to 1983-84 5.14 3.36 2.97
1983-84 to 1993-94 3.49 1.73 1.68
1993-94 to 2004-05 2.86 2.01 1.66
2004-05 to 2011-12 5.72 6.47 4.30
High growth in per cultivator income has been possible due to decline in number of
cultivators. Thus, it is clear that sizable increase in income of our farmers can be achieved
only when the two things, namely, modest increase in sectoral output and decline in number
of cultivators happen together. Thus, to sustain growth in per farmer income in future it need
to be ensured that the process of shift of cultivators from farming to non-farming occupation
is intensified and growth in farm output is maintained above 3 per cent. It is also important
to mention that while decline in number of cultivators is crucial, those who move out of
farming must be employed elsewhere where they earn more income than what is per
cultivator income in farming.
Food Security and Undernourishment in India: Assessment at state Level
Jaya Jumrani
Barring a few states, majority of the rural and urban areas had actual calorie intakes which
were below their specified norms in year 2009-10. The extent of energy shortfall was much
wider among the rural areas. In both the sectors, average energy intakes in all the states were
more than the widely-accepted Food and Agriculture Organization (FAO) norm of 1800 Kcal
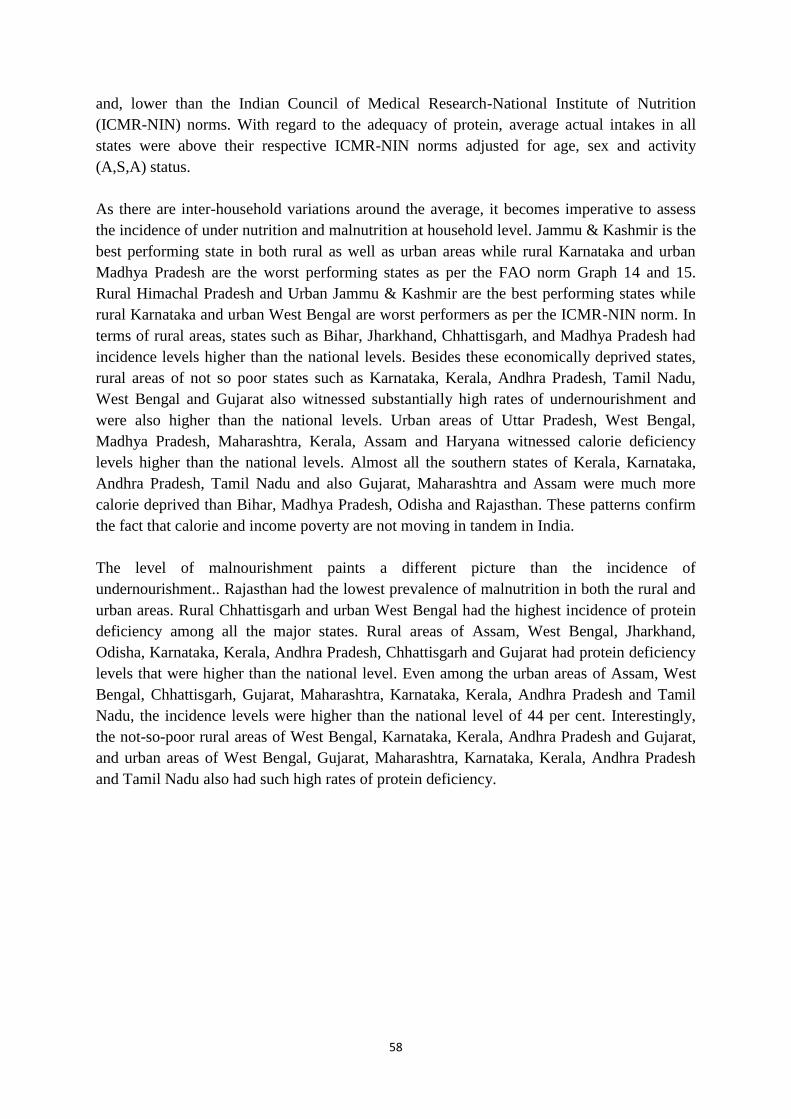
58
and, lower than the Indian Council of Medical Research-National Institute of Nutrition
(ICMR-NIN) norms. With regard to the adequacy of protein, average actual intakes in all
states were above their respective ICMR-NIN norms adjusted for age, sex and activity
(A,S,A) status.
As there are inter-household variations around the average, it becomes imperative to assess
the incidence of under nutrition and malnutrition at household level. Jammu & Kashmir is the
best performing state in both rural as well as urban areas while rural Karnataka and urban
Madhya Pradesh are the worst performing states as per the FAO norm Graph 14 and 15.
Rural Himachal Pradesh and Urban Jammu & Kashmir are the best performing states while
rural Karnataka and urban West Bengal are worst performers as per the ICMR-NIN norm. In
terms of rural areas, states such as Bihar, Jharkhand, Chhattisgarh, and Madhya Pradesh had
incidence levels higher than the national levels. Besides these economically deprived states,
rural areas of not so poor states such as Karnataka, Kerala, Andhra Pradesh, Tamil Nadu,
West Bengal and Gujarat also witnessed substantially high rates of undernourishment and
were also higher than the national levels. Urban areas of Uttar Pradesh, West Bengal,
Madhya Pradesh, Maharashtra, Kerala, Assam and Haryana witnessed calorie deficiency
levels higher than the national levels. Almost all the southern states of Kerala, Karnataka,
Andhra Pradesh, Tamil Nadu and also Gujarat, Maharashtra and Assam were much more
calorie deprived than Bihar, Madhya Pradesh, Odisha and Rajasthan. These patterns confirm
the fact that calorie and income poverty are not moving in tandem in India.
The level of malnourishment paints a different picture than the incidence of
undernourishment.. Rajasthan had the lowest prevalence of malnutrition in both the rural and
urban areas. Rural Chhattisgarh and urban West Bengal had the highest incidence of protein
deficiency among all the major states. Rural areas of Assam, West Bengal, Jharkhand,
Odisha, Karnataka, Kerala, Andhra Pradesh, Chhattisgarh and Gujarat had protein deficiency
levels that were higher than the national level. Even among the urban areas of Assam, West
Bengal, Chhattisgarh, Gujarat, Maharashtra, Karnataka, Kerala, Andhra Pradesh and Tamil
Nadu, the incidence levels were higher than the national level of 44 per cent. Interestingly,
the not-so-poor rural areas of West Bengal, Karnataka, Kerala, Andhra Pradesh and Gujarat,
and urban areas of West Bengal, Gujarat, Maharashtra, Karnataka, Kerala, Andhra Pradesh
and Tamil Nadu also had such high rates of protein deficiency.

59
Figure 14: Prevalence of under nutrition and malnutrition and income poverty in rural
areas of major Indian states
Figure 15: Prevalence of undernutrition and malnutrition and income poverty in urban
areas of major Indian states
Long run trend in food inflation and its forecast
S.K. Srivastava and Miguel Gomez
The estimated year-on-year inflation based on WPI showed that food inflation is more
volatile than non-food inflation (Figure 16) though both food and non-food inflation
witnessed cyclical trend in long run. The increasing trend in inflation before 1990 was
followed by almost a decade of declining inflation particularly which was more pronounced
in food commodities. The food inflation reached at its lowest level of less than 2 per cent in
2000. But, afterwards food prices kept soaring till July 2010 and reached double digit mark.
0
10
20
30
40
50
60
70
80
90
Undernourishment - FAO Norm (%) Undernourishment - ICMR-NIN Norm (%)
Malnourishment - ICMR-NIN Norm (%) HCR (%)
0
10
20
30
40
50
60
70
Undernourishment - FAO Norm (%) Undernourishment - ICMR-NIN Norm (%)
Malnourishment - ICMR-NIN Norm (%) HCR (%)

60
Figure 16: Long Run Trend in Inflation in India
Different commodities have differential contribution in overall food inflation depending upon
its weight in inflation and extent of price rise of respective food commodities. During 1990s,
cereals contributed higher than its weight in total food inflation which has dropped to 11per
cent (lower than its weight) in the subsequent decade (Figure 17). On the other hand, the
contribution of high value agricultural commodities (HVAC) such as fruits and vegetables,
milk, eggs, meat and fish increased substantially in the recent decade. This might be due to
substantial rise in prices of these HVACs due to demand rise and supply bottlenecks. The
improvement in supply side management of HVACs will go a long way to reduce the overall
food inflation in India.
Figure 17: Contribution of food commodities in total food inflation
Three model formulation viz. aggregate model, GROUP1 (Primary food articles and
Manufactured food products components) and GROUP2 model (Cereals, Pulses, Fruits &
Vegetables, Milk, Non-veg, Manufactured and Other food products), were developed(Table
27) using Box-Jenkins approach (ARIMA) to provide a reliable estimate of short run inflation
0
2
4
6
8
10
12
14
Ap
r-8
3
Ap
r-8
4
Ap
r-8
5
Ap
r-8
6
Ap
r-8
7
Ap
r-8
8
Ap
r-8
9
Ap
r-9
0
Ap
r-9
1
Ap
r-9
2
Ap
r-9
3
Ap
r-9
4
Ap
r-9
5
Ap
r-9
6
Ap
r-9
7
Ap
r-9
8
Ap
r-9
9
Ap
r-0
0
Ap
r-0
1
Ap
r-0
2
Ap
r-0
3
Ap
r-0
4
Ap
r-0
5
Ap
r-0
6
Ap
r-0
7
Ap
r-0
8
Ap
r-0
9
Ap
r-1
0
Ap
r-1
1
Ap
r-1
2
Ap
r-1
3
Infl
atio
n r
ate
Trend in inflation (HP filter:=14400)
FoodNon-foodOverall
Cereals PulsesFruits &
VegMilk
Eggs,meatfish
Manufactured
Others
1990-99 20 3 14 11 11 36 4
2000-13 11 4 31 25 14 17 -2
weight_share 14 3 16 13 10 41 3
-505
1015202530354045
Per
ce
nt

61
forecast. The food inflation, based on best fitted GROUP2 model, will be about 7 per cent in
June 2014 (over June 2013). The forecasted value of food inflation using Aggregate model
and GROUP1 model in June 2014 will be 6.8 per cent and 5.8 per cent, respectively. Among
the disaggregated food products, non-vegetarian products will have highest inflation followed
by pulses and milk. The expected value of inflation in near future will help policy makers to
take corrective measures to augment food supply or manage demand to control the prices.
Table 27. Inflation forecast for food commodities using alternative models for June 2014
Commodity Inflation forecast
Primary food articles 8.70
Manufactured food 4.77
Cereals 6.96
Pulses 8.41
Fruits and Vegetables 2.14
Milk 8.40
Eggs, meat and fish 9.79
Others 7.61
Total food
Aggregate model 6.81
GROUP1 Model 5.84
GROUP2 Model 7.08

62
III. POLICY INTERACTIONS AND ADVOCACY
Policy input based on in-house research to ICAR, various Ministries, Planning
Commission, Public Organisations, and State Governments.
1. Provided policy input as Member and Chairperson of several high level policy
committees as under:
Advice to Chief Economic Advisor on Controlling Food Inflation
Provided policy input on Food Safety Net and Food Security for DWG Meeting of
G-20 through Ministry of Finance
Provided notation to DAC for implementing Agriculture Diversification
programme in N-W India
Policy input to “Revitalizing Rainfed Agriculture Network” for future research and
development (25 July, 2013 Planning commission)
Input on agenda for Australian Presidency for G-20 through Ministry of Finance on
22 July, 2013
Onion Price Crisis to Department of Agriculture and Cooperation
Input on Buffer Stock to GoM
Interview to Financial Express on Alternative Marketing Options
Input of Agriculture Performance in recent period at national and state level
T.V. Discussion on “Freak Weather and Agriculture” CNBC-IBN (12th March,
2014.
Advice to Chief Economic Advisor on Controlling Food Inflation
2. Monitor national and international agriculture situation.
3. Regularly report views on TV channels and Newspapers.

63
Release of Working Paper “From Slowdown to Fast Track: Indian Agriculture since 1995”
ICAR Directors Meeting on “Performance Indicators” 15-17 July, 2013
64
IV. AWARDS/ RECOGNITIONS
Ramesh Chand
Member of Governing Body of the ICAR Society.
Chairman of the Committee to examine Methodological issues in Fixing Minimum
Support Prices, Department of Agricultural and Cooperation, New Delhi.
Chairman of the Committee to look into various aspects of India’s agricultural policy in
the context of the requirements under WTO rules including India’s notification obligation
constituted by Ministry of Commerce and Industry constituted a Committee.
Member Advisory Group of eminent persons to help advise the Finance Minister on G20
issues.
Member of the Editorial Board of The Indian Journal of Animal Sciences for 3 years from
1st August 2013.
Core Member of Governance Board (GB) of Revitalising Rainfed Agriculture (RRA)
Network
Member of Research Advisory Committee in respect of Central Institute of Sub-Tropical
Horticulture, Lucknow.
Member Board of Studies, South Asian University, New Delhi.
P. S. Birthal
RT Doshi Award by Agricultural Economics Research Association
Member, Research Committee, Indian Society of Agricultural Economics
Managing Editor: Agricultural Economics Research Review.
Member, Quinquennial Review Team for the Indian Institute of Soil Science, Bhopal.
Member, Quinquennial Review Team for the AICRP on Nematodes; Indian Agricultural
Research Institute, New Delhi.
Member, Research Advisory Committee of the National Centre for Integrated Pest
Management, New Delhi
Member, Planning Board of the Tamil Nadu Veterinary and Animal Science University,
Chennai.
Member, Institute Management Committee, National Bureau of Plant Genetic Resources
since 2013.

65
Member, Sub-group on Linking farmers to markets in Haryana, Haryana Kisan Ayog.
S. S. Raju
Member, Quinquennial Review Team (QRT), National Research Centre for Agro-
forestry, Jhansi and AICRP on Agro-forestry.
Member, Research Advisory Committee (RAC), National Institute of Animal Nutrition
and Physiology, Bangalore
Member, Editorial Board, SAARC Journal of Agriculture, Dhaka, Bangladesh
Rajni Jain
Guest Editor, Journal of Indian society of Agricultural Statistics, Special Issue on
Artificial Intelligence in Agriculture, Volume 67 (1): 1-137

66
V. PUBLICATIONS
A. Policy Brief
Chand Ramesh and Jumrani Jaya (2013). Food Security and Undernourishment in India:
Assessment of Alternative Norms and the Income Effect, Policy Brief 38, NCAP Publication
B. Research Papers
Arya, Prawin, Kumar, Shiv, Singh, D.R., Kumar, Anil, and Sivaramne N.,(2013) Market
Integration in Mustard Commodities in India, Global Journal of Finance and Management, 5
(12): 44-48.
Birthal, P.S., 2013 Frontier technologies for agricultural development. Indian Journal of
Agricultural Economics, 68(1):20-38.
Birthal, P.S., Digvijay S. Negi, Awadesh, K., Jha and Singh, Dhiraj, (2014) Income Sources
of Farm Households in India: Determinants, Distributional Consequences and Policy
Implications, Agricultural Economics Research Review, 27(1): 37-48.
Chand, Ramesh and Srivastava, S. K., (2014) Changes in the rural Labour Market and their
implications for agriculture, Economic & Political Weekly, 49(10): 47-54.
Chand, Ramesh, and Jumrani, Jaya, (2013) Food security and under nutrition in India:
Assessment of Alternative Norms and the Income Effect, Indian Journal of Agricultural
Economics, 69(1): 39-53.
Dastagiri, M B (2013) New Economics: Nature’s Laws. 2:672. doi: 10.4172/ OMICS
scientific reports.672, USA: 1-5.
Dastagiri, M. B. Ramesh Chand, T. K. Immanuelraj, C. V. Hanumanthaiah, P. Paramsivam,
R. S. Sidhu, M. Sudha, Subhasis Mandal, Basantha Singh, Khem Chand, B. Ganesh Kumar.(
2013) Indian Vegetables: Production Trends, Marketing Efficiency and Export
Competitiveness. American Journal of Agriculture and Forestry, 1(1):1-11.
Dastagiri, M. B., Immanuelraj, T. K, Patil, Ganesh Gouda I, (2013), India’s Self, Cross &
Often Cross Pollinated Crops İn The Global Crop Production: Mendelian Variation
Perspectives. Science Discovery, USA 1(3):16-27.
Dastagiri, M.B. et al., (2013) “Global Agricultural Policies: Reforms and Future Agriculture”
Journal of Agriculture, Forestry and Fisheries, Science PG, USA, 2(1):11-22.
Dikshit, A.K. and Birthal, P.S., (2013) Positive environmental externalities of livestock in
mixed framing systems of India, Agricultural Economics Research Review, 26(1): 21-30.
Immanuelraj, T.K., Dastagiri, M.B., and Sajesh V.K. “Growth and Instability in Onion
Production in Maharashtra, Journal of Global Economics, USA, 2(1):1-4.

67
Jain, Rajni, Alam, Samimul, A. K. M., and Arora, Alka, (2013) WBSTFP: Software for TFP
Computation in Agriculture, Journal of the Indian Society of Agricultural Statistics 67(3):
381-391.
Jain, Rajni, and Arora, Alka, (2013) Approach for mining multiple patterns from Clusters,
Journal of Indian Society of Agricultural Statistics, 67(1):33-42.
Jain, Rajni, Satma, M. C., Arora, Alka, Marwaha, Sudeep, and Goyal, R. C., (2013) Online
Rule Generation Software Process Model. BIJIT - BVICAM’s International Journal of
Information Technology, 5(1):505-511.
Jhajhria, A., Kar, A., Pal, S., Kumar, Shiv, and Jha, G.K., (2013) Price Volatility in the
Rajasthan Coriander Markets: An Empirical Analysis, BIOINFLOLET, 10(2A): 547-549.
Kumar, Anjani and Jain, Rajni, (2013) Growth and Instability in Agricultural Productivity: A
District Level Analysis. Agricultural Economics Research Review, 26 (Conference
Number):31-42.
Kumar, Anjani and Parappurathu, Shinoj (2014) The economics of dairy farming and
marketing: Micro-level perspectives from three major milk producing states of India, Indian
Journal of Animal Sciences, 84(2): 204-209.
Kumar, Anjani, Parappurathu, Shinoj and Joshi, P.K. (2013) Structural transformation in
dairy sector of India, Agricultural Economics Research Review, 26 (2): 209-220.
Kumar, Anjani, Parappurathu, Shinoj and Shiv Jee (2013) Do dairy co-operatives enhance
milk production, productivity and quality? Evidences from the Indo-Gangetic plain of India,
Indian Journal of Agricultural Economics, 68(3):457-468
Kumar, Sant, Maredia, Mywish, and Chauhan, Sonia, (2013). Research priorities for faster,
sustainable and inclusive growth in Indian agriculture, Indian Journal of Agricultural
Economics (Conference Issue), 68(3): 373- 388.
Kumar, Shiv, Chandra, Subhash, Singh D.R. and Chaudhary, K R, (2013) Contractual
Arrangements and Enforcement in India: The Case of Organic Basmati Paddy Farming,
Indian Journal of Agricultural Economics, Conference Number, 68 (3): 449-456.
Kumar, Shiv, Chandra, Subhash, Singh D.R., and Chudhary, K.R., (2013) Contractual
Arrangements and Enforcement in India: A Case of Organic Basmati Paddy Farming, Indian
Journal of Agricultural Economics, (73rd Conference Issue): 56-63.
Kumar, Shiv, Dabas, J.P.S., Kumar, S. and Kanika (2013) Potential of Water Management
Technologies for Sustainable Agriculture in India: Evidences from Farmers' Participatory
Action Research. International Journal of Engineering and Management Sciences, 4(4):437-
444. Available at: www.scienceand nature.org.
Kumar, Shiv, Kumar, R., Singh, D.R., Kumar, A., Arya, P. and Chudhary, K.R. (2013)
Equity, Efficiency and Profitability of Migratory Sheep Production System in Rajasthan,
Indian Journal of Animal Sciences 83(9):976-982.

68
Manjunatha, B. L., Rao, D.U.M., Dastagiri, M. B., Sharma, J. P., and Burman, Roy, R.,
(2013), “The Legal Protection of Public and Private Plant Varieties in India: A Comparative
Analysis, Journal of Bioremediation and Biodegradation, USA: 4-7.
Manjunatha, B.L., Rao, D.U.M., Dastagiri, M.B., (2013) “Trends in seed production, growth
drivers and present market status of Indian Seed Industry: An analytical study” Indian
Journal of Agricultural Sciences, 83(3): 75-80.
Massoumeh N Zadeh, Sirohi, Smita, Mondal, Bitan and Saxena, Raka, (2013) Strengthening
Bilateral Trade Relations between India and Iran: Opportunities in Livestock Sector, Journal
of Resources, Energy, and Development, 10(1).
Pandey, L. P Rao, Parthasarathy, Birthal, P.S., Bantilan, M.C.S., and Binswanger, Hans,
(2012) Supply response and investment in agriculture in Andhra Pradesh, Asian Journal of
Agriculture and Development, 9(2):31-46.
Pavithra, S. and Vatta, K., (2013) Role of Non-Farm Sector in Sustaining Rural Livelihoods
in Punjab, Agricultural Economics Research Review, 26(2): 257-265.
Prasad, Venu H.D., Singh, P., Kumar, Shiv and Singh, B.K.(2013) Performance and
Constraints of Gherkin Contract Farming, Indian Res. J. Ext. Edu. 13 (1):112-116.
Prasanna, Lakshmi, P. A., (2013) “ Changes in landholding structure in Indian Agriculture:
implications for input use, cropping pattern and productivity” in Agrarian Crisis in India –the
way out (edited) by K.Suman Chandra, V. Suresh Babu and Pradip Kumar Nath, Academic
Foundation, New Delhi :47-64.
Prasanna, Lakshmi, P. A., (2013) “Farm-size productivity-viability in Indian Agriculture-
policy implications”, African-Asian Journal of Rural Development, 46(2): 75-90.
Praveen, K.V., Kumar, Shiv, Singh, D.R., Kumar, Anil, Arya, Prawin, and Chaudhary, K.R.,
(2013) An analysis of price levels of selected food commodities under and traditional
retailing formats in Kochi. Global Journal of Finance and Management, 5 (10): 76-84.
Praveen, K.V., Kumar, Shiv, Singh, D.R., Kumar, Anil, Arya, Prawin, and Chaudhary, K.R.,
(2013) A Study on Economic Behaviour, Perception and Attitude of Households Towards
Traditional and Modern Food Retailing Formats in Kochi. Indian Journal of Agricultural
Marketing, 27 (2): 142-151.
Raju S.S. (2013) Assessment of Feed Resources and its impact on livestock output in India,
Agricultural Situation in India, 69(12): 5-11.
Sarungbam, Diana, Raju S. S, Rao, K. N., and Kaur, Amrit Pal, (2013) Performance of
National insurance in India, Agricultural Situation in India, 69(10):17-27.
Saxena, Raka, and Srivastava, A.K., (2012) Livestock Sector in India: Strategies for
Enhancing Small holders’ Income, Agricultural Situation in India, 69(9): 505-512.
Sharma, Sonal, and Jain, Rajni, (2014) Enhancing Business Intelligence using Data
Warehousing: A Multi Case Analysis, International Journal of Advance Research in
Computer Science and Management Studies, 1(7):2321-7782 (online at www.ijarcsms.com).

69
C. Book Chapters/Popular Articles
Chand, Ramesh, and Parappurathu, Shinoj, (2013) Temporal and spatial variations in
agricultural growth and its determinants, In Uma Kapila (Ed.) Indian Economy since
Independence, 24th Edition, Academic Foundation, New Delhi
Jain, Rajni, Kumari, Sarita, Arora Alka and Sudeep, (2014) Malmsoft: An online Software
for Computing Total Factor Productivity using Malmquist Index. In Proceedings of the
International Conference on Computing for Sustainable Global Development” 5-7 March,
2014, Published by India Com 2014; ISSN 0973-7529; ISBN 978-93-80544-10-6:539-544.
Rajni Jain and Mishra, Amarendra Kumar (2013) Decision Tree and its Application in
Bioinformatics: Bioinformatics in Agriculture, Tools and Application. Eds M Balakrishnan S
Dam Rao: 131-141.
D. Research Reports/ Working Papers
Birthal, P.S., Joshi, P.K., D.S. Negi and Agarwal, Shaily, (2014) Changing sources of
growth in Indian agriculture: Implications for Regional Priorities for accelerating agricultural
growth, Discussion paper 01325, International Food Policy Research Institute, Washington
DC, USA.
Chand, Ramesh and Raju, S S. 2013 . Incentivising Pulses Production in India, Submitted to
National Centre for Applied Economic Research, New Delhi.
Chand, Ramesh (2014). From Slowdown to Fast Track: Indian Agriculture since 1995.
National Centre for Agricultural Economics and Policy Research (NCAP) Working Paper
01/2014.
Chand, Ramesh, Birthal, P. S., Ahuja, Usha Rani, Ramasundaram, P., Sajesh, V. K., and
Chaudhary, K. R., (2013) Assessment of adoption of modern chickpea varieties in Madhya
Pradesh Report submitted to SPIA Food and Agriculture Organization of United nations
Raju, S S, Shinoj P, Srivastava, S K and Chand, Ramesh (2013) Energy and Agriculture in
India, Submitted to IFPRI, Washington D C.
E. TV Talks/Radio Talks
Discussion on Agricultural Export Restriction in Samachar Plus, DD News, April 30, 2012.
Programme Hot commodities, ET now channel, on August 16, 2013 National Food Security
Bill – Food Inflation.
F. Presentations in Conferences/Workshops/Symposia
Ahuja, Usha Rani, Jain, Rajni Kumar, Anjani, Choudhary, Dharminder, and Singh,
Amarjeet,(2013) Micro-level Evidences on Women’s Access to Resources and Decision-

70
making — Insights from Eastern India Presented in 21st Annual Conference of Agricultural
Economics Research Association (India), held at Sher-e-Kashmir University of Agricultural
Sciences & Technology of Kashmir, Srinagar (J&K) on 10-12 September, 2013.
Ahuja, Usha Rani, Jain, Rajni, Kumar, Anjani, Choudhary, Dharminder, and Singh,
Amarjeet, (2013) Measurement of Women Empowerment in Agriculture in East India-
Computation of Women Empowerment in Agriculture Index (WEAI) proceedings of
Sixteenth Annual Conference of the Society of Statistics, Computer and Applications 24 – 26
February 2014 held at Bhagat Phool Singh Mahila Vishwavidyalaya Khanpur Kalan,
Sonepat, Haryana-131305
Arya, Prawin, Kumar, Shiv Singh, D. R., Kumar, Anil, and Sivaramane, N.(2013) Market
Integration in Mustard Commodities in India, at World Congress on “Business, Finance,
Marketing and Industrial Management for Sustainable Development” (BFMIMSD - 2013) at
J.N.U. during 25-26, May, 2013.
Chhillar, R.S., Dabas, J.P.S., Parihar, Indramani, S.S., and Kumar, Shiv (2012) Farmers'
Participatory Action Research Programme on Water Management Technologies for
Sustainable Agriculture, 4th National Groundwater Congress held at New Delhi during April
10-13, 2012, Ministry of Water Resources, GOI.
Jain, Rajni, Malmsoft: An online Software for Computing Total Factor Productivity using
Malmquist Index, A research paper presented on 6 March 2014, in 8th IndiaCom conference
during 5-7 February, 2014 at BVICAM, Paschim Vihar, New Delhi
Kumar, Anjani, Shinoj P. and Jee, Shiv (2013) Do dairy co-operatives enhance milk
production, productivity and quality? Evidences from the Indo-Gangetic plain of India. Paper
presented in 73rd Annual Conference of the Indian Society of Agricultural Economics,
Organized at NAARM, Hyderabad during 18-20, December, 2013
Kumar, Sant; Maredia, Mywish and Chauhan, Sonia, (2013) Research priorities for faster,
sustainable and inclusive growth in Indian agriculture, presented in the 73rd Annual
Conference of the Indian Society of Agricultural Economics (ISAE) under sub-theme on
‘Agricultural research and extension in India-Achievements and failure and direction for the
future’ held at National Academy of Agricultural Research and Management, Hyderabad, 18-
20 December 2013.
Kumar Shiv (2013) An Econometric Analysis of Structural Factors of Pulse Production in
India: A Case of Gram in Maharashtra," in Agro – Summit- 2013” (September 1st & 2nd )
with central theme “Changing Scenario of Agriculture in Madhya Pradesh : Prospects and
Challenges” at Bhopal
Kumar, Shiv, Chandra, Subhash, Singh, D.R. Chaudhary, K. R.,and Kumar, Sandeep, ( 2013)
Transition Economics of Conventional to Organic Farming: A Case Study of Basmati Paddy
Farming in Haryana State of India “in 21st AERA Conference at SKUAST, Sri Nagar (10-12
September 2013).
Kumar, Shiv, Chandra, Subhash, Singh,D.R. and Chaudhary, K. R., , ( 2013) Contractual
Arrangements and Enforcement in India: A Case of Organic Basmati Paddy Farming for

71
discussion at the 73rd Annual Conference of our Society at National Academy of
Agricultural Research Management, Hyderabad (Andhra Pradesh)
Krishnan, Vijith K, Kumar, Shiv, Singh D.R., Aarthi, L.R., Kumar, Anil, Arya, Prawin
Lohcab, Saloo and Chaudhary, K. R(2013) Prevailing Practices of Paddy Collective
Farming under Kudumbashree Mission in Kerala: An Economic Investigation" written by.,
at International Conference on Microfinance and Micro-entrepreneurship: Issues and
challenges (August 8-9, 2013) at BPS Mahila Vishwavidyalya, Khanpura Kalan, Sonepat,
India
Praveen, K.V., Kumar, Shiv, Singh, D. R., Anil Kumar, Prawin Arya and Chaudhary, K. R
(2013)An Analysis of Price Levels of Selected Food Commodities under Modern and
Traditional Retailing Formats in Kochi” written by ., at World Congress on “Business,
Finance, Marketing and Industrial Management for Sustainable Development” (BFMIMSD -
2013) at J.N.U. during 25-26, May, 2013.
Raju, S S and Shinoj P. (2013) Energy and Agriculture in India: Discussion Meeting on
Energy and Agriculture in India, at IFPRI, Washington D.C. 28 October to 1 November,
2013.
Raju, S S. (2013). Agricultural Marketing in India. In: Workshop on Agricultural Marketing,
organized at International Cooperation Development Fund, Taipei, Taiwan. 24 September to
5 October, 2013.
F. Abstract
Ahuja Usha Rani, Jain, Rajni, Kumar, Anjani, Choudhary, Dharminder, and Singh,
Amarjeet, (2013) Micro-level Evidences on Women’s Access to Resources and Decision-
making — Insights from Eastern India. Agricultural Economics Research Review,
Conference Number 26:246-247.
Ahuja, Usha Rani, Jain, Rajni Kumar, Anjani, Choudhary, Dharminder, and Singh, Amarjeet,
(2013) Measurement of Women Empowerment in Agriculture in East India- Computation of
Women Empowerment in Agriculture Index (WEAI) proceedings of Sixteenth Annual
Conference of the Society of Statistics, Computer and Applications 24 – 26 February 2014
held at Bhagat Phool Singh Mahila Vishwavidyalaya Khanpur Kalan, Sonepat, Haryana-
131305
Ahuja, Usha Rani, Singh, Ram, Kumar, Santosh and Chouhan, Sonia, (2013) “Impact of
Sprinkler Irrigation Technology on Adopter Farms against Non-adopter Farms in Haryana”
in the proceedings of National Conference on Farmers First for Conserving Soil and Water
Resources in Southern Region (FFCSWR- 2014), Dehradun during 24-26 March 2014.
Arora, Alka, and Jain, Rajni, (2014) Machine Learning for Diagnosis of Soybean disease, In:
Proceedings of Soycon, International Soybean Research Conference during 22-24 February
2014, organised by Society for Soybean Research and Development, Indore, India
Kumar, Shiv, Chandra, Subhash, Singh,D.R. Chaudhary, K. R.,and Kumar, Sandeep, ( 2013)
Transition Economics of Convention to Organic farming: A case Study of Organic Basmati

72
Paddy farming in Haryana. Agricultural Economics Research Review, 26 (Conference
Issue):234.
Vembu, S. M., Immanuelraj, T. K., (2013) Spatial integration of gram and arhar markets in
India, Indian Journal of Agricultural Economics, 68(3):485.
Vembu, S. M., Immanuelraj, T. K., (2013) Supply response analysis of major pulse crop in
India, Indian Journal of Agricultural Economics, 68(3):372.

73
VI. ON-GOING RESEARCH PROJECTS
Sl. No. Title of Research Project PI / Co-PI
Institute Funded
1. Total Factor Productivity and its Determinant in Indian
Agriculture Rajni Jain
Ramesh Chand
2. India’s Export Horticulture Markets in Multispeed World:
Effects on production, prices, poverty and trade
M. B. Dastagiri
3. Performance Assessment of Krishi Vigyan Kendras Sajesh V. K.
4. Terms of trade, agricultural growth and farm income in India Raka Saxena
Ramesh Chand
5. Seed sector in India- Emerging Scenario- Policy implications
for enhancing quality seed use
P.A. Lakshmi
Prasanna
6. Under nourishment in India: Comparing Alternative Norms
and Assessing the Income Effect
Jaya Jumrani
Ramesh Chand
NAIP Funded
7. Achieving Improved Livelihood Security through Resource
Conservation and Diversified Farming Systems in Mewat
Usha Rani Ahuja
Other Projects
8. Enhancing Resilience of Agriculture to Climate Change
through Technologies, Institutions and Policies (Funded by
National Initiatives on Climate Resilient Agriculture)
P. S. Birthal
Suresh A. Kurup
Shiv Kumar
G P Reddy
Ranjit Paul
9. Tracking Change in Rural Poverty in Household and Village
Economies in South Asia (funded by ICRISAT)
Ramesh Chand
Usha Rani Ahuja
Rajni Jain
P. Shinoj
10. Assessing Impact of Bringing Green Revolution in
Eastern India (BGREI) - A Case Study of Stress Tolerant
Rice Varieties
Sant Kumar
Pratap S. Birthal
11. Agricultural Value Chain Financing in India Ramesh Chand
P. S. Birthal
Raka Saxena
12. ICAR SSN Project on Regional crop planning for
improving resource use efficiency and sustainability
S S Raju
S K Srivastava
Rajni Jain
Kingsly Imanyel
Raj T
13. Intellectual Property Management and Transfer/
Commercialization of Agriculture Technology Scheme
(Up-coming of Existing Components i.e. Intellectual
Property Right under ICAR Headquarter Scheme on
Management on Information Services
Sant Kumar
14. Network Project on Market Intelligence Raka Saxena
S. Pavithra

74
15. Cost and Returns in Milk Production: Developing
Standardized Methodology and Estimates for Various
Production System
Smita Sirohi
Raka Saxena
VII. CONSULTANCY/CONTRACT RESEARCH PROJECTS
Name of scientist Institution to which consultancy is
provided
Area of consultancy / contract
research
S S Raju, Ramesh
Chand, P Shinoj and
S K Srivastava
IFPRI, Washington D C Energy and Agriculture in
India
Ramesh Chand and
S S Raju
NCAEPR, New Delhi Incentivizing Pulses
Production in India
Ramesh Chand
P. S. Birthal
Usha Rani Ahuja
Sajesh V. K.
Standing Panel on Impact
Assessment (SPIA) of the CGIAR
Independent Science and
Partnership Council, FAO,
Vialeterme di Caracalla, Rome,
ITALY
Assessing the adoption pattern
of chick pea (Cicerarietinum
L.) varieties in Madhya
Pradesh
Rajni Jain
Raka Saxena
Shivendera Kumar
Srivastava
ABARES Managing Agricultural Price
Risk: Implications for India
P. S. Birthal
Raka Saxena
Ramesh Chand
IFPRI Mango Value Chain Finance in
Uttar Pradesh and Dairy Value
Chain Finance in Punjab

75
VIII. RESEARCH ADVISORY COMMITTEE (RAC)
The Research Advisory Committee (RAC) of the National Centre for Agricultural Economics
and Policy Research (NCAP) was constituted for a period of three years w.e.f. 3rd February,
2014. The composition of RAC is as follows:
Prof. S. Mahendra Dev (Chairman)
Director
Indira Gandhi Institute of Development
Research
Gen. A. K. Vaidya Marg, Goregaon (E)
Mumbai - 400065
Sh. Viswasrao Anandrao Patil
P.O. Lohara, Taluq Pachora
Distt. Jalgaon
Maharashtra
Dr. H. K. Srikanta
59/1, 8th Cross, 5th Main
R.K. Layout, Padmanabhanagar
Bangalore, Karnataka
Dr. Ramesh Chand (Ex-officio)
Director
National Center for Agricultural Economics and
Policy Research (NCAP), ICAR
DPS Marg, Pusa, New Delhi - 110012
Assistant Director General (EQR)
Education Division
ICAR, Krishi Anusandhan Bhawan-II
New Delhi-110 012
Dr. P. S. Birthal (Member Secretary)
Principal Scientist
National Centre for Agricultural Economics and
Policy Research
Pusa, New Delhi-110 012
Dr. Rajinder S. Sidhu
Dean
College of Basic Sciences
Punjab Agricultural University (PAU)
Ludhiana, Punjab
Dr. B. Gangiah
Economic and Statistical Adviser
Directorate of Economics and Statistics
Ministry of Agriculture
Department of Agriculture and Cooperation
Shastri Bhawan, New Delhi
Dr. Bharat Ramaswami
Professor
Planning Unit, Indian Statistical Institute
7, SJS Marg, New Delhi – 1100106
Dr. K. Palanisami
Prinicipal Researcher
International Water Management Institute
2nd Floor, CG Block C, NASC Complex
DPS Marg, Pusa, Opp Todapur
New Delhi - 110012
Meetings of the Institute Research Council (IRC)
Six meetings of the IRC were held during 2013-14 (April-March). In the IRC meetings,
deliberations were made on the progress of on-going projects, new research proposals and
deputations to foreign countries.

76
IX. MANAGEMENT COMMITTEE
Dr. Ramesh Chand
Director
National Centre for Agricultural Economics
and Policy Research (NCAP)
New Delhi – 110 012
Dr. N. H. Rao
Joint Director
National Academy of Agricultural Research
Management, Hyderabad
Andhra Pradesh
Director
Directorate of Economics & Statistics
Delhi State, Old Secretariat
Delhi-110 054
Dr. (Ms.) Sudha Mysore
Principal Scientist (Agril. Economics)
Indian Institute of Horticultural Research
Hessaraghatta Lake Post
Bangluru, Karnataka- 560 089
Economic Advisor
Economic & Statistical Organization
Govt. of Punjab, Chandigarh- 160 017
Dr. A. K. Vashist
Assistant Director General, PIM
ICAR, Krishi Bhawan
New Delhi – 110 001
Dr. R. K. Khatkar
Head, Department of Agriculture Economics
Haryana Agricultural University
Hissar, Haryana- 125 004
Assistant Director General (EQR)
Indian Council of Agricultural Research
Krishi Anusandhan Bhawan-II
Pusa, New Delhi-110 012
Sh. Viswasrao Anandrao Patil
P.O. Lohara, Taluq Pachora
Distt. Jalgaon
Maharashtra
Sr. Finance and Accounts Officer
National Bureau of Plant Genetic Resources
Pusa, New Delhi-110012
Dr. H. K. Srikanta
59/1, 8th Cross, 5th Main
R.K. Layout, Padmanabhanagar
Bangalore, Karnataka
Administrative Officer (Member Secretary)
National Centre for Agricultural Economics
and Policy Research,
DPS Marg, Pusa, New Delhi-110012.
Dr. S. L. Goswami
Director
National Academy of Agricultural Research
Management
Rajendra Nagar
Hyderabad – 500 030
Andhra Pradesh

77
X. PARTICIPATION IN SCIENTIFIC ACTIVITIES
Ramesh Chand
Attended meeting of Expert Group with the Chief Economic Adviser, Ministry of
Finance, GOI, to discuss food price situation, on April 4, 2013.
Presented a paper in Technical Session on ‘“Agricultural Investment and Output
Markets and Agricultural Policies – Ensuring the Short-term does not Derail the Long
Term”, Indira Gandhi Institute of Development Research (IGIDR), Mumbai in its
Silver Jubilee Celebrations Conference on “The State, the Market and the
Agripreneurs” April 4-5, 2013.
Participated in International Symposium on Frontier Research Themes on Service
Sector Support for Food Value Chain Development in Developing Countries, co-
organized by Renmin University and IFPRI, during April 10-12, 2013, Beijing China.
Participated in a dialogue on “Agricultural Trade Policy and Sustainable
Development: Experience from India and Other Countries” jointly organized by the
International Centre for Trade and Sustainable Development and the Indian Council
for Research on International Economic Relations, April 17, 2013 at New Delhi.
Chaired session on General introduction to AGLINK-COSIMO in Workshop on
“OECD-FAO Agricultural Outlook Processes, Methods and Results, organized by
NCAER on April 30, 2013
India’s delegation for G20. Made presentation on Food Security issues. Prepared
reply and answers to questions raised in G20 Meeting relating to agriculture and food
security. Submitted note on India’s viewpoints and concerns relating to food security
and agriculture, Moscow, Russia, May 14-17, 2013
Participated in Joint ICAR – ICRISAT Partnership Projects Review and Planning
Meeting, ICRISAT, Hyderabad, May 10, 2013
Attended seminar on “The Emerging Challenges of Indian Agriculture” organized by
the Council for Social Development (CSD) and Bharat Krishak Samaj on June 6-7,
2013 at the India International Centre, New Delhi.
Discussant, International Conference on Policies for Water and Food Security in the
Dry Areas, ICARDA and result in flagging issues of interest to India in the
international Conference, June 24-26, 2013, Cairo Egypt.
Delivered special lecture on the broader theme of “Food Security and Environment”
in the workshop organized by Department of Economics and Sociology, Punjab
Agricultural University, Ludhiana, July 4, 2013.
Chaired Advisory Committee Meeting of Project n “Tracking Change in Rural
Poverty in Household and Village Economies in South Asia” July 9, 2013 at ICAR-
Research Complex for Eastern Region (ICAR-RECER), Patna.

78
Delivered special remarks during SAARC Agriculture Centre (SAC), Dhaka and
Indian Council of Agricultural Research inaugural Function of Inception meeting on
“Regional Initiation on Improvement of Pulses and Adaptive Trial in SAARC
Countries” on July 12, 2013 at New Delhi.
Organized and hosted Meeting of Directors of ICAR Institutes under Crop Science
and Horticulture Divisions for discussion on Performance Indicators on July 15, 2013
at NCAP, New Delhi.
Organized and hosted Meeting of Directors of ICAR Institutes under under Animal
Science, Fisheries, Agricultural Education and Agricultural Extension Divisions for
discussion on Performance Indicators on July 17, 2013 at NCAP, New Delhi
Meeting with the G20 Australian Sherpa Dr. Gordon de Brouwer to discuss India’s
views on the ongoing issues in the G20 as well as India’s priorities for the future G20
agenda on July 22, 2013 at New Delhi.
Presentation on Balancing Role of Market and Price Intervention for Improving
Profitability of Agriculture in programme of the 50 PACT organized by CIMMY and
BISA on August 17, 2013 at New Delhi.
Presenter on the topic Agriculture, natural resource management, energy and the
environment, in NCAER Research Workshop on India in the Asian Century, August
27, 2013, New Delhi.
Attended Workshop on "Repeat Study on Assessment of Post Harvest Losses of
Major Horticultural Crops, Animal and Fishery Products in India" organized by
Horticulture Division of ICAR on 29th August, 2013, New Delhi.
Presented on Pricing Policy, Support Prices and Other Policy Measures in Session on
Ensuring Remunerative Prices to Farmers in National Workshop on Rethinking
Economic Policies for Income Security in Agriculture by ASHA and CSA at JNU,
New Delhi
Chaired the session on Agricultural Growth and Inclusiveness, in Annual Conference
of Agricultural Economics Research Association, India, Sher-e-Kashmir University of
Agricultural Sciences and Technology, Srinagar, 10-12 September 2013.
Attended meeting of advisory committee of research project on “The Agriculture
Nutrition Disconnect in India” at Indira Gandhi Institute of Development Research
(IGIDR), Mumbai, on October 1, 2013.
Participated in Discussion on Challenges of Poverty and Food Insecurity in SAARC
Countries : RPP – 2010-11 On October 7, 2013 at New Delhi.
Chief Guest, Annual Function, Bal Bharati Public School, Ghaziabad, November 15,
2013.

79
Delivered inaugural address in the inaugural session and made a presentation in the
session in a training program on “Adoption and Impact Assessment of Research and
Development Projects” November 27, 2013, ICRISAT, Hyderabad.
Attended the “Expert Consultation on Strengthening Linkage between Research and
Extension to Promote Food and Nutrition Security” from December 11-12, 2013
organized by FAO, CAPSA and APAARI. Presented paper on India, chaired a
session.
Attended “Tenth Session of the Governing Council of the Centre for the Alleviation
of Poverty through Sustainable Agriculture (CAPSA), Bogor, on December 13, 2013
at Bangkok, Thailand.
Chaired Meeting of Working Group on Linking Farmers to Market set up by Haryana
Kisan Ayog on December 24, 2013 at Panchkula.
Chaired the Technical Session on Prices, Trade and Processing of Pulses in Workshop
on “Pulses for Nutrition in India: Changing Patterns from Farm-to-Fork” organized by
IFPRI on January 14, 2014 at New Delhi.
Made a presentation on Resource Generation for Research and Extension in NARES,
Meeting of Directors of ICAR Institutes, 20 January, 2014, Pune.
Speaker in the session Trade in Agriculture in Annual Conference of ICRIER on
"Normalizing India-Pakistan Trade" 21-22 January 2014 at India Habitat Centre, New
Delhi.
Keynote Speaker in Economics Conclave 2014 “Indian Economy: Performance and
Challenges Ahead” at Gokhale Institute of Politics and Economics, Pune on February
14, 2014.
Gave presentations on Agriculture Markets and Risk: Need for a Paradigm Shift, in
“Progressive Punjab Agriculture Summit- 2014” February 18-19, 2014, Mohali,
Punjab.
Chaired Technical Session on Market led solutions to agriculture marketing at
National Conference on New Age Agri-Marketing Solutions, Organised by FICCI and
Small Farmers Agri-business Consortium, February 25, 2014.
P. S. Birthal
Participated in International Symposium on Frontier Research Themes on Service
Sector support for Food Value Chain Development in Developing Countries,
organized by the Renmin University and International Food Policy Research Institute
at Beijing, China on April 10, 2013.
Participated in RETA14 Workshop on Rice Value Chain Development in China,
India, Laos, and Viet Nam organized by the Renmin University and International
Food Policy Research Institute at Beijing, China on April 11-12, 2013.

80
Participated in The Workshop on Agri-food Value Chain Financing and Energy in
Bangladesh, Brazil, China, India, and Cambodia, organized by the Renmin University
and International Food Policy Research Institute at Beijing, China on April 11-12,
2013.
Participated in Brainstorming on “Achieving Inclusive Growth by Linking Farmers
to Markets” organized by Trust for Advancement of Agricultural Sciences, IFPRI
and NCAP at new Delhi on June 24, 2013
Participated in the 21th Annual Conference of the Agricultural Economics Research
Association held at SKAUST Srinagar, September 10-12, 2013.
Participated in Workshop on Food Security in India: the Interactions of Climate
Change, Economics, Politics and Trade organized by International Food Policy
Research Institute (IFPRI, India), CUTS International, National Institute for
Consumer Research (SIFO, Norway), and Norwegian Institute of International Affairs
(NUPI, Norway) at New Delhi on March 11, 2014.
Usha Rani Ahuja
Participated in Brainstorming Session on “Achieving Inclusive Growth by Linking
Farmers to Markets”, organized by Trust for Advancement of Agricultural Sciences,
IFPRI and NCAP at new Delhi on June 24,
Participated in Project Advisory Committee(PAC) meeting of VDSA at RCER Patna
on 09 July, 2013
Participated in 3rd Annual Review Meeting of VDSA at ICRISAT, Hyderabad. 17-19
September, 2013
Participated in the 21th Annual Conference of the Agricultural Economics Research
Association held at SKAUST Srinagar, September 10-12, 2013
S. S. Raju
Attended Estimate Committee (2013-14), Meeting on Agricultural Insurance at Lok
Sabha Secretariat, Committee Room B, Parliament House, Annexe, New Delhi.
M. B. Dastagiri
Attended International Conference on “Governance and Development: Views
from G20 countries” organized by ICRIER, TAAS, ADB, World Bank, , KAS,
The Stanely Foundation on Sept 17-19, 2013.
Rajni Jain
Participated in Field Investigators Training at RCER Patna as resource person during
2-3 July 2013.

81
Participated in Project Advisory Committee meeting at RCER Patna on 10 July 2013
Sant Kumar
ISCB phase IV workshop on Socioeconomic Research Agenda, at Embassy of
Switzerland, New Delhi, 1 August, 2013
73rd Annual Conference of the Indian Society of Agricultural Economics at NAARM,
Hyderabad, 18-20 December 2013
A Suresh
Participated in 21st Annual Conference of Agricultural Economics Research
Association (AERA), at Sher- e- Kashmir University of Agricultural Sciences and
Technology, Srinagar, Kashmir
Participated in the brain storming session on ‘’Achieving inclusive growth by linking
farmers to markets’’, 24 June 2013, organised by trust for advancement of agricultural
sciences, ICAR and ICRISAT at IARI, New Delhi.
Participated in the workshop on ‘’Indo-Swiss collaboration on biotechnology’’,
Embassy of Switzerland, New Delhi, Ist August 2013
Raka Saxena
Presented paper in Second Annual Conference on Normalizing India-Pakistan Trade
on January 21-22, 2014 organized by ICRIER, New Delhi
Participated in 21st Annual Conference of Agricultural Economics Research
Association (India), held at Sher-e-Kashmir University of Agricultural Sciences &
Technology of Kashmir, Srinagar (J&K) on 10-12 September, 2013.
Participated in International Symposium and Workshops on Frontier Research
Themes for Food Value Chain Development in Developing Countries, Beijing, China,
April 10-12, 2013, Organized by Renmin University and International Food Policy
Research Institute, Washington DC.
Shinoj Parappurathu
International Conference on ‘Benefits and Challenges arising out of India’s FTAs’ on
4th June, 2013 at Hotel Le Meridian, New Delhi.
ICAR-ICRISAT collaborative training programme on ‘Field Survey and Electronic
Compilation of Data’ organized at ICAR RC for Eastern Region, Patna during 1-7
July, 2013 (As resource person).
Workshop on ‘Sensitization on Internet Protocol Version 6 (IPv6) in DARE/ICAR’
organized by ICAR at NASC, Pusa, New Delhi on 27th February, 2014
82
Khyali Ram Chaudhary
21st Annual AERA conference at Sher-e-Kashmir University of Agricultural Sciences
on 10 - 12 September, 2013
73rd Annual Conference of the Indian Society of Agricultural Economics at NAARM,
Hyderabad, on 18-20 December 2013
National Conference of Agricultural Librarian & User Community (NCALUC –
2014) on “Agricultural Information in Digital Era” at Indira Gandhi Krishi
Vishwavidyalaya, Raipur, on 4-5 February 2014

83
XI. VISITS ABROAD
Name of
Scientist
Purpose Place Duration
Ramesh Chand Participated in International
Symposium on Frontier Research
Themes on Service Sector Support
for Food Value Chain Development in
Developing Countries co-organized
by Renmin University and IFPRI,
during April 10-12, 2013, Beijing
China.
Beijing, China 10-12 April,
2013
India’s delegation for G20.
Moscow, Russia
May 14-17, 2013
International Conference on Policies for Water and Food Security in the Dry Areas, Discussant.
Cairo, Egypt. June 24-26, 2013
Participated in the Executive Training programme in the area of “Authentic Leadership Development” organized by Harvard Business School, Harvard University.
Boston, USA, December 02 – 07, 2013.
Expert Consultation on Strengthening Linkage between Research and Extension to Promote Food and Nutrition Security
Tenth Session of the Governing Council of the Centre for the Alleviation of Poverty through Sustainable Agriculture (CAPSA)
Bangkok, Thailand
11-12 December, 2013
13 December,
2013
P. S. Birthal Visited China to attend a series of
workshops related to the Food Value
Chains in Developing Countries,
organized by the Renmin University
and International Food Policy Research
Institute.
Beijing, China 10-12 April,
2013
S. S. Raju Participated in Workshop on
“Agricultural Marketing”
ICDF, Taipei 24 September to
5 October, 2013
Discussion Meeting on “Energy and
Agriculture in India”
IFPRI,
Washington D
C
28 October to 1
November,
2013.
Rajni Jain Participated in training program on
developing commodity outlook models
Canberra,
Australia
6-10 May, 2013

84
under the project on ‘Managing
agricultural price risk: Implications for
India’, Australian Bureau of
Agricultural and Resource Economics
and Sciences
Raka Saxena Visited China to participate in the
International Symposium and
Workshops on Frontier Research
Themes for Food Value Chain
Development in Developing Countries,
Organized by Renmin University and
International Food Policy Research
Institute, Washington DC.
Beijing, China 10-12 April,
2013
Visited Australia to participate in a
training on GAMS at Australian
Bureau of Agricultural and Resource
Economics and Sciences (ABARES),
Department of Agriculture, Fisheries
and Forestry
Canberra,
Australia
6-10 May, 2013
Shinoj
Parappurathu
Deputed to International Food Policy
Research Institute (IFPRI),
Washington, D.C. to attend the Meeting
on ‘Energy and Agriculture in India’
Washington,
D.C.
27 October - 3
November, 2013
Pavithra.S Visited Thailand for attending the
‘SIAC Objective 2.1: Planning and
Inception Meeting’,
Bangkok,
Thailand
14 -17 January
2014.

85
XII. CAPACITY BUILDING ACTIVITIES
Other Meetings/ Trainings Organised
6th Prof. Dayanatha Jha Memorial Lecture “Inclusive Growth :
Reflection on Concept and Indian Experiences” by Prof. Sukhadeo
Thorat, Chairman, Indian Council of Social Science Research, New Delhi
2 May, 2013
NCAP, New Delhi
Brain storming session on “Regional crop planning for improving
resource use efficiency and sustainability”
16 June, 2013.
NCAP, New Delhi
ICAR Directors Meeting on “Performance Indicators”
15-17 July, 2013.
NCAP, New Delhi
Organized a one-week training program ‘core issues in the agricultural
sector’ for the officers of the Indian Economic Service’ funded by the
Ministry of Finance, Government of India
October 28-November 1, 2013
NCAP, New Delhi
Workshop on “Regional crop planning for improving resource use
efficiency and sustainability”
20 December, 2013
NCAP, New Delhi
Organized a one-week training program ‘core issues in the agricultural
sector’ for the probationers of the Indian Economic Service’ funded by
the Ministry of Finance, Government of India
December 23-27, 2013
NCAP, New Delhi
Training programme on “Extraction and Retrieval of Data from Cost of
Cultivation questionnaires” from 25-26 February, 2014 NCAP, New Delhi
Training programme on Field Survey, Electronic Compilation and
Analysis of Data, NCAP, New Delhi
ICAR-ICRISAT project, Tracking Change in Rural Poverty in Household
and Village Economies in South Asia
1-7 July, 2013
RCER, Patna
Project Advisory Committee Meeting under VDSA
10 July 2013
RCER, Patna
Farmers’ day in VDSA village Durgapur (Dumka) in which 500 farmers
participated
18 October 2013
Durgapur, Bihar
Farmers’ day in VDSA village Dumariya (Dumka) in which 450 farmers
participated
19 October 2013
Dumariya,
Jharkhand
Market Intelligence Project Workshop
7 June 2013
NCAP, New Delhi
Workshop with Project partners on Methodology for Price Forecasting
and its Dissemination for the Network Project on Market Intelligence
17-18 October 2013
NCAP, New Delhi

86
XIII. LECTURES DELIVERED BY NCAP SCIENTISTS
Name of Scientist Topic and Date Venue
Ramesh Chand Delivered lecture on “Agri-food demand towards
2050” in Training programme on “Core Issues in the
Agricultural Sector” organized by NCAP
October 28, 2013,
Delivered lecture on “Agricultural Markets and Price
Policy : Need for Paradigm Shift” in Training
programme on “Core Issues in the Agricultural
Sector” organized by NCAP
October 30, 2013
Delivered lecture on “Rural Labour Markets in India”
in Training programme on “Core Issues in the
Agricultural Sector” organized by NCAP
November 1, 2013
Delivered lecture on “Agricultural Issues and
concerns for the XIIth Five Year Plan and Beyond” in
Training programme on “Core Issues in the
Agricultural Sector” organized by NCAP
December 23, 2013
Delivered lecture on “Agri-food demand towards
2050” in Training programme on “Core Issues in the
Agricultural Sector” organized by NCAP
December 26, 2013
Delivered lecture on “Agricultural markets and price
policy : need for paradigm shift” in Training
programme on “Core Issues in the Agricultural
Sector” organized by NCAP
December 26, 2013
Delivered Inaugural Address on “Concept of Food
Security; National and International Perspective and
Overview of NFSA, 2013” in Institute of Food
Security, Food Corporation of India, Gurgaon
March 3, 2014
NCAP, New Delhi
NCAP, New Delhi
NCAP, New Delhi
NCAP, New Delhi
NCAP, New Delhi
NCAP, New Delhi
FCI, Gurgaon

87
P. S. Birthal Financing Value Chain for Smallholder
Empowerment in the Brainstorming on “Achieving
Inclusive Growth by Linking Farmers to Markets”
organized by Trust for Advancement of Agricultural
Sciences, ICRISAT and NCAP
June 24, 2013
‘Consultancy projects management’ in the
Management Development Programe
August 1-6, 2013.
“Agricultural diversification” at the Summer School
on Decision support system in agriculture using
quantitative techniques
August 2-22, 2013
“Impact of climate change” at the Summer School on
Decision support system in agriculture using
quantitative techniques
August 2-22, 2013
‘Strengthening Agricultural Policy Research’ at the
21st Annual Conference of the Agricultural
Economics Research Association
September 10-12, 2013
‘Source of growth in Indian agriculture and its
implications on market, trade and institutions’, at the
training programme on "Markets, Trade and
Institutions for Agricultural Development"
February 3, 2014.
Climate change and food security in India in the
workshop on Food Security in India: the Interactions
of Climate Change, Economics, Politics and Trade
organized by International Food Policy Research
Institute (IFPRI, India), CUTS International, National
Institute for Consumer Research (SIFO, Norway), and
Norwegian Institute of International Affairs (NUPI,
Norway)
March 11, 2014.
NCAP, New Delhi
NAARM,
Hyderabad
NCAP, New Delhi
NCAP, New Delhi
SKUAST, Srinagar
IARI, New Delhi
IFPRI, New Delhi
Usha Rani Ahuja Two lecturers were delivered to the field Investigators
of VDSA project in the training programe held at
Patna
1st July2013 to 8th July 2013
A lecture on Gender Sensitive Impact indicators was
delivered in 21 days training program during 2-22
August 2013 for the faculty of National Agricultural
Research System
RCER, Patna
NCAP, New Delhi
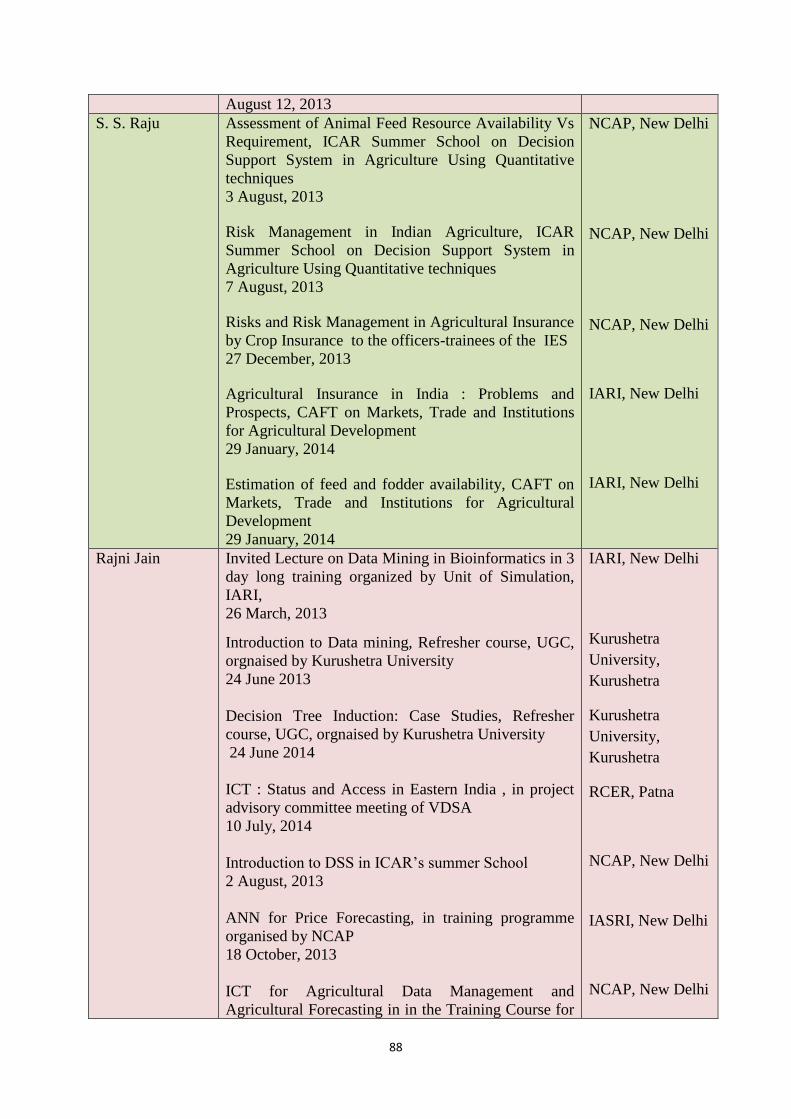
88
August 12, 2013
S. S. Raju Assessment of Animal Feed Resource Availability Vs
Requirement, ICAR Summer School on Decision
Support System in Agriculture Using Quantitative
techniques
3 August, 2013
Risk Management in Indian Agriculture, ICAR
Summer School on Decision Support System in
Agriculture Using Quantitative techniques
7 August, 2013
Risks and Risk Management in Agricultural Insurance
by Crop Insurance to the officers-trainees of the IES
27 December, 2013
Agricultural Insurance in India : Problems and
Prospects, CAFT on Markets, Trade and Institutions
for Agricultural Development
29 January, 2014
Estimation of feed and fodder availability, CAFT on
Markets, Trade and Institutions for Agricultural
Development
29 January, 2014
NCAP, New Delhi
NCAP, New Delhi
NCAP, New Delhi
IARI, New Delhi
IARI, New Delhi
Rajni Jain Invited Lecture on Data Mining in Bioinformatics in 3
day long training organized by Unit of Simulation,
IARI,
26 March, 2013
Introduction to Data mining, Refresher course, UGC,
orgnaised by Kurushetra University
24 June 2013
Decision Tree Induction: Case Studies, Refresher
course, UGC, orgnaised by Kurushetra University
24 June 2014
ICT : Status and Access in Eastern India , in project
advisory committee meeting of VDSA
10 July, 2014
Introduction to DSS in ICAR’s summer School
2 August, 2013
ANN for Price Forecasting, in training programme
organised by NCAP
18 October, 2013
ICT for Agricultural Data Management and
Agricultural Forecasting in in the Training Course for
IARI, New Delhi
Kurushetra
University,
Kurushetra
Kurushetra
University,
Kurushetra
RCER, Patna
NCAP, New Delhi
IASRI, New Delhi
NCAP, New Delhi

89
Officer Trainees of the Indian Economic Services
(IES), on Core Issues Related to Agricultural Sector
29 October, 2013
Design of databases through MS-Access in Winter
School
26 November, 2013
Invited Lecture in Technical Session on Priorities for
human resource development in Agricultural Statistics
and informatics
27 November, 2013
Invited Lecture in Technical Session on Priorities for
research in Informatics: Current status and future
challenges
28 November 2013
Preliminary results pf Project on TFP in Indian
Agriculture
22 February, 2014
IASRI, New Delhi
NDRI, Karnal
NDRI, Karnal
IRC, NCAP, New
Delhi
Shiv Kumar Delivered lecture on “Contract and Corporate
Farming in India” to scientists and researchers of
NARS.
December 9, 2013
Delivered lecture on “Linking Farmers via Contract
farming to Export Markets: A Case of Organic
Basmati” to scientists and researchers of NARS
December 21, 2013
Delivered lecture on “Market Integration" in training
program " Decision Support Systems in Agriculture
using Quantitative Techniques' to scientists and
researchers of NARS at. (21 August, 2013)
IARI, New Delhi
IARI, New Delhi
NCAP, New Delhi
Raka Saxena Delivered a lecture to IES Probationers on Market
Intelligence in Agriculture in the training programme
organized
28 October to November 1, 2013
Delivered a lecture to IES Probationers on Market
Intelligence in Agriculture and farm Income in India
in the training programme organized on
24-28 December 2013
Delivered a lecture on Price Forecasting Techniques
in the Summer School on Decision Support Systems
in Agriculture using Quantitative Techniques held on
2 - 22 August, 2013
NCAP, New Delhi
NCAP, New Delhi
NCAP, New Delhi

90
Shinoj
Parappurathu
Lecture on ‘Cereal Outlook Model for India’
delivered to participants of summer school on
‘Decision Support Systems in Agriculture Using
Quantitative Techniques’ on
3 August, 2013
Lecture on ‘Structural Break Analysis using Time
series Data’ delivered to the participants of summer
school on ‘Decision Support Systems in Agriculture
Using Quantitative Techniques’
7 August, 2013
Offered a course on ‘Agricultural Price Analysis’ for the MSc and PhD Students at the Division of Agricultural Economics, Indian Agricultural Research Institute, Pusa, New Delhi, during August-November, 2013
Lecture on ‘Agricultural Outlook Models for
Medium- and Long-term Projections’ delivered in 21-
day Training programme on "Markets, Trade and
Institutions for Agricultural Development"
11 February, 2014
NCAP,
New Delhi
NCAP,
New Delhi
Division of
Agricultural
Economics, IARI,
New Delhi
Division of
Agricultural
Economics, IARI,
New Delhi
Jaya Jumrani “Food and Nutrition Security” in the Training Course
for Officer Trainees (Promotees/ Cadre Officers
(Junior Time Scale) of the Indian Economic Services
(IES) on Core Issues Related to Agricultural Sector,
October 30, 2013.
“Food and Nutrition Security” in the Training Course
for Officer Trainees of the Indian Economic Services
(IES) on Core Issues Related to Agricultural Sector,
December 26, 2013.
NCAP,
New Delhi
NCAP,
New Delhi
Pavithra S. Delivered a lecture on ‘Fertilizer Use and Imbalance
in India-A State wise Analysis’, in the training
programme for officer trainees of the Indian
Economic Service (IES), on Core Issues Related to
Agriculture
1 November 2013.
Delivered a lecture on ‘Fertilizer Use and Imbalance
in India-A State wise Analysis’ in the training
programme for officer trainees of the Indian
Economic Service (IES), on Core Issues Related to
Agriculture
27 December 2014
NCAP,
New Delhi
NCAP,
New Delhi

91
XIV. PERSONNEL
Scientific
Name Designation Area(s) of research
Ramesh Chand Director Agricultural Growth and Modelling
Markets and Trade
P. Ramasundaram Principal Scientist Technology Policy
P. S. Birthal Principal Scientist
Institutional Change
Technology Policy
Sustainable Agricultural Systems
Markets and Trade
Usha Rani Ahuja Principal Scientist Institutional Change
Technology Policy
S. S. Raju Principal Scientist Sustainable Agricultural Systems
Institutional Change
Anjani Kumar Principal Scientist Markets and Trade
Agricultural Growth and Modelling
Institutional Change
M. B. Dastagiri Senior Scientist Markets and Trade
Rajni Jain Senior Scientist Agricultural Growth and Modelling
Technology Policy
Sant Kumar Senior Scientist Technology Policy
Agricultural Growth and Modelling
Shiv Kumar Senior Scientist Markets and Trade
Institutional Change
P. A. Lakshmi Prasanna Senior Scientist Institutional Change
Suresh A Kurup Senior Scientist Sustainable Agricultural Systems
Raka Saxena Senior Scientist Markets and Trade
Shinoj Parappurathu Scientist Markets and Trade
Diana S. Scientist Sustainable Agricultural Systems
Sajesh V. K. Scientist Institutional Change
Kingsly Immanuel Raj T. Scientist Agriculture Growth and Modeling
S. K. Srivastava Scientist Agriculture Growth and Modeling
Jaya Jumrani Scientist Institutional Change
Pavithra S. Scientist Market and Trade
Technical
Name Designation
Prem Narayan Technical Officer (T 7-8)
Khyali Ram Chaudhary Technical Officer (T-6)
Mangal Singh Chauhan Technical Officer (T-6)
Sonia Chauhan Technical Officer (T-6)
Satinder Singh Driver (T-4)

92
Administrative
Name Designation
Monisha Banerjee (Till 31-08-2013) Administrative Officer
A K Manchanda (from 01-10-2013) Administrative Officer
S K Yadav Assistant Administrative Officer
T A Vishwanath (Till 25-1-2014) Assistant Finance & Accounts Officer
Umeeta Ahuja Private Secretary
Inderjeet Sachdeva Assistant
Yatin Kohli Assistant
Lalit Sharma Assistant
Sandeep Mathur Assistant
Deepak Tanwar Junior Stenographer
Ajay Tanwar Lower Division Clerk
Sanjay Kumar (Till 1-7-2013) Skilled Supporting Staff
Mahesh Kumar S. S. Gr II
Mahesh Pal S. S. Gr I

93
XV. TRAININGS ATTENDED
Name Topic Duration Institution
S S Raju Project MIS and FMS in ICAR 25-26
November, 2013
IARI, New Delhi
Rajni Jain
Participation in training under the
project Managing Agricultural
Price Risk: Implications for India,
sponsored by ABARES,
Department of Agriculture,
Fisheries and Forestry
Participated in training
programme on ‘ Qualtitative
methods for policy analysis using
GAMS’, organized by NCAP-
IFPRI during 18 -22 November,
2013 at NCAP
Participated in Finance
Management System training at
IARI during 9-10 December 2013
6-10 May, 2013 Canberra, Australia
Raka Saxena Participation in training under the
project Managing Agricultural
Price Risk: Implications for India,
sponsored by ABARES,
Department of Agriculture,
Fisheries and Forestry
6-10 May, 2013 Canberra, Australia
Shivender
Kumar
Srivastava
Participation in training under the
project Managing Agricultural
Price Risk: Implications for India,
sponsored by ABARES,
Department of Agriculture,
Fisheries and Forestry
3-12 May 2013 Canberra, Australia
90 days training programme
under NAIP
August 1, 2013
to October 30,
2013
Cornell University,
USA
Quantitative methods for policy
Analysis using GAMS
18-22
November, 2013
NCAP, New Delhi

94
Jaya Jumrani
ICAR Summer School on
‘Decision Support System in
Agriculture using Quantitative
Techniques’ held at NCAP, New
Delhi during.
Training programme on
‘Quantitative Methods for Policy
Analysis’ organized by
International Food Policy
Research Institute, Washington
D.C.
August 2-22,
2013
18-22
November, 2013
NCAP, New Delhi
NCAP, New Delhi
Kingsly
Immanuelraj T.
Participated in Quantitative
Methods for Policy Analysis
Using GAMS” conducted by
NCAP-IFPRI
Participated in Impact assessment
of research and development
projects for up-scaling and higher
impacts by ICAR-ICRISAT
18-22 Nov 2013
27-30 Nov 2013
NCAP, New Delhi
ICRISAT,
Hyderabad
Pavithra S. Participated in the ICAR summer
school on “Decision Support
Systems in Agriculture using
Quantitative Techniques”
Participated in the NCAP-IFPRI
Training programme on
“Quantitative Methods for Policy
Analysis Using GAMS”
Participated in the training
programme on “Adoption &
Impact Assessment”, organized by
ICAR-ICRISAT, Patancheru
Andhra Pradesh.
Participated in the training
programme on “Small Farmers
Value Chains and Markets
linkages” organized by ICAR-
ICRISAT, , ICRISAT,
Patancheru, Andhra Pradesh
2-22 August,
2013
18-22
November, 2013
27-30 November
2013
2-4 Dec 2013
NCAP, New Delhi
NCAP, New Delhi
ICRISAT,
Hyderabad
Khyali Ram
Chaudhary
Library and Information
Professionals Summit (LIPS)
2014 on “From Brick to Click:
Transforming Libraries into
Social Sciences”
7-8 February
2014
University of Delhi
South Campus, New
Delhi

95
XVI. OTHER INFORMATION
NCAP Annual Day
The Centre celebrated its 21st Annual Day on 2 May, 2013. At this occasion, the 6th Prof.
Dayanatha Jha Memorial Lecture “Inclusive Growth : Reflection on Concept and Indian
Experiences” by Prof. Sukhadeo Thorat, Chairman, Indian Council of Social Science
Research, New Delhi
Sh. Ashish Bahuguna, Secretary (A&C), Department of Agriculture & Cooperation (DAC) addressing the
audience along with Prof. Ramesh Chand and Dr. Sukhdeo Thorat on the occasion of the 6th Dayanatha Jha
Memorial Lecture, at NCAP on 2 May 2013
Promotion of Official Language 2013-14
For the implementation and extensive use of Rajbhasha among the staff of the Centre, a
committee on Hindi official language (Hindi) was established by Central Rajbhasha
Department. The committee monitors the progress of various actions being taken and
suggests measures for implementation of official language. It coordinates and helps in
executing the council orders and circulars Central Rajbhasha Department Annual program
guidelines and submitted the progress reports timely. This Centre has organized the monthly
staff and quarterly meeting of Rajbhasha and Hindi workshop regularly.

96
The Centre Rajbhasha
Sumiti implemented all the
guidelines, circulars and
instructions issued by
Council and Central
Rajbhasha Department,
Government of India. The
more than 76 percent noting
and drafting were made in
all administrative files and
70 to 75 percent letters were
dispatched to outside all the
regions. The Centre
published 4 popular research articles and 3 village profiles of Bihar i.e. Baghakol, Inai and
Susari under VDSA project and annual report summary in Hindi which are useful to farmers.
In addition to Rajbhasha Samiti organized Hindi workshops for better awareness of
computerization, translation and Unicode typing during the year.
The Official language committee of NCAP
organized a series of events to celebrate
“Hindi Weak” during14-21 September,
2013 to generate more awareness among the
staff about the use of Hindi. The activities
which were organized during the ‘Hindi
weak ’ included. First important event
essay competition to develop creative
writing skill on topics i.e. “lekt esa efgykvksa
ij c<rsa vR;kpkj ” ] “ [kk| lqj{kk fcy ls xjhcksa dks
jkgr ” and debate in Hindi on live
discussion on burning topics “Hkkjrh; vFkZ O;oLFkk esa eanh dk nkSj dkj.k ,oa fuokj.k” was also
conducted .The opportunity was given to non-Hindi speakers also to present their views in
Hindi on any topic of their interest. Dictations of administrative word in Hindi, translation
from English to Hindi and extempore activities were also organized to improve the
vocabulary in Hindi and English. The quiz competition and Antakachhari were arranged for
general awareness in Rajbhasha. The participation and competitions in these events was
overwhelmingly more than ninety per cent. Hindi Week ended with poem recitation
completion on 21.09.2013.
Dr. Ramesh Chand, Director, NCAP, chaired the session, Shri H.C. Joshi, Director
(Rajbhasha), Indian Council of Agricultural Research, Krishi Bhawan, New Delhi was chief
guest. All the participants recited their poem very nicely. The chief guest was appreciated all
the poets and he told the level of poems is very good in small group of staff and asked to do
more work in Hindi without hesitation. Dr. Susheela Koal , Head , Agricultural Museum
NASC, New Delhi and Shri Kanaiya Chaudhary, Deputy Secretary , Krishi Bhawan II , Pusa

97
New Delhi served as crucial role of Judges to decide the winners in poem recitation . In last
Dr. Ramesh Chand, Director, and Chief guest distributed the prize to winners. All the
program of Rajbhasha arranged by Mr Prem Narayan, Sachiv Rajbhasha and also delivered a
brief summary of Rajbhasha progress at Centre.
List of Publications in Hindi
izse ukjk;.k ] [kjhQ esa e¡wxQyh dh Qly esa [kjirokj fu;a=.k] 2013
iwlk lqjfHk] vad 2012&13 ist la- 105&109 A
izse ukjk;.k ,o lanhi dqekj] 2013] ns’k gfjr dzkfUr ds c<+rs pj.k ,oa mRrj iwohZ
jkT;ksa ds fy;s uhfrxr fu.kZ;] Hkkjrh; df̀”k vuqla/kku if=dk] flRkEcj 2013] [k.M 28 vad 3] ist la- 162
& 171 A
izse ukjk;.k] ,o lanhi dqekj] 2013] Hkkjr esa nygu ds cnyrs ifjn`’; & ,d
fo’ys”k.kkRed n`f”Vdks.k] Hkkjrh; df̀”k vuqla/kku if=dk] fnlEcj 2013] [k.M 28 vad 4] ist la- 192 & 199 A
Prem Narayan and Sandeep Kumar , 2013, Changing Scenario of pulses In India- An
Analytical View, Research Journal Of Agricultural & Animal Sciences, paper accepted.
ch-Mh- ,l- ,- izkstsDV ds varxZr fcgkj ds rhu c/kkdksyh ] lqlsjh ,oa bukbZ xk¡oksa dh izksQkby dk fgUnh vuqokn
okf”kZd izfrosnu] 2012 jk”Vªh; —f”k vfFkZd ,ao uhfr vuqla/kku dsUnz] ubZ fnYyh A

98
Sports Report
A contingent of 6 sportspersons comprising Sh. Khyali Ram Chaudhary, Sh. Inder Jeet
Sachdeva, Sh. Yatin Kohli, Sh. Deepak Tanwar, Sh. Ajay Tanwar and Sh. Mahesh Kumar
participated in the Central Zone ICAR Sports Meet 2013 held at Central Institute of
Agricultural Engineering, Bhopal during 24-28, September, 2013. The team participated in
Badminton, Table Tennis, Chess and Athletics events.
Promotions
Dr. Sant Kumar, Senior Scientist (Agricultural Economics) promoted to the next higher
grade of Principal Scientist w.e.f. 22-8-2012 under the revised Career Advancements
Scheme.
Dr. Subhash Chand, Senior Scientist (Agricultural Economics) promoted to the next
higher grade of Principal Scientist w.e.f.1-5-2012 under the revised Career
Advancements Scheme.
Dr. Suresh A., Senior Scientist (Agricultural Economics) promoted and designated
Senior Scientist in the next higher grade w.e.f. 24-12-2012 under the revised Career
Advancements Scheme.
Dr. (Ms.) Raka Saxena, Senior Scientist (Agricultural Economics) promoted and
designated Senior Scientist in the next higher grade w.e.f. 9-3-2013 under the revised
Career Advancements Scheme
New Joining
Sh. Vishwanatha Reddy, K., joined as Scientist (Agricultural Economics) on 12-04-
2013
Dr. Subhash Chand joined as Senior Scientist (Agricultural Economics) on 03-01-2014
Sh. A.K. Manchanda joined as Administrative Officer on 01-10-2013
Transfers
Dr. Suresh A, Senior Scientist (Agricultural Economics) transferred to Indian
Agricultural Research Institute, New Delhi on 18-10-2013
Dr. Shiv Kumar Senior Scientist (Agricultural Economics) transferred to Indian
Agricultural Research Institute, New Delhi on 22-10-2013
Sh. T.A. Vishwanth, Assistant Finance and Accounts promoted to the post of Finance
and Accounts Officer, at National Bureau of Agriculturally Important Insects
Bangalore & relieved from NCAP on 25-1-2014
Retirement
Ms. Monisha Banerjee, Administrative Officer tendered technical resignation w.e.f. 31-
08-2013.

99
Sh. Ganeshgouda I. Patil, Scientist (Agricultural Economics) tendered technical
resignation w.e.f. 3-10-2013
Sh. Sanjay Kumar, Skilled Supporting Staff compulsory retired from the Services w.e.f.
1-7-2013.