Embed Size (px)
Citation preview

NC Community College System: Budget Overview
Presentation to the Joint Appropriations Committee on Education Brett Altman
Fiscal Research Division March 8, 2017

Presentation Agenda
1. NCCCS Background 2. Enrollment 3. Budget Overview 4. Budget Allocations 5. Recent Legislative Actions 6. Questions
03/08/2017 2

NCCCS Background
03/08/2017 3

Locations • 58 colleges, 3rd most in the nation. • 36 additional campuses
03/08/2017 4

Governance
State Board of Community Colleges
Serves as the governing authority for NCCCS
21 members – 18 are appointed by Governor (10), House(4), and Senate (4); 3 serve ex-officio
Elects the System President and sets system policies and regulations
Local Boards of Trustees
Serve as the governing authority for each of the 58 colleges
At least 13 members – 12 appointed by local Board of Ed, county commissioners, and Governor; 1 ex-officio
Elect college presidents
03/08/2017 5

03/08/2017 6
Major Program Areas
Curriculum
Credit courses that lead to certificates,
diplomas, or associate degrees.
Includes Career &College Promise
(high school students earning
college credit)
Occupational Continuing Education
Non-credit courses that provide job
training opportunities to
individuals.
Basic Skills
Includes Adult Basic Education, GED, Adult High
School, English as a Second
Language (ESL), and
Compensatory Education.
Economic Development
Programs
Job training programs
targeted to specific types of
companies or populations.

Faculty 6,866 43%
Senior Administration
322 2% Service
Maintenance 1,100
7%
Staff 3,929 24%
Support 1,544 10%
Technical Paraprofessional
2,234 14%
Full-Time College Staff: FY 2016-17
03/08/2017
College Faculty and Staff
Total: 15,965 FT Staff
Note: This does not include positions in the NCCCS System Office; Source: NCCCS System Office
7
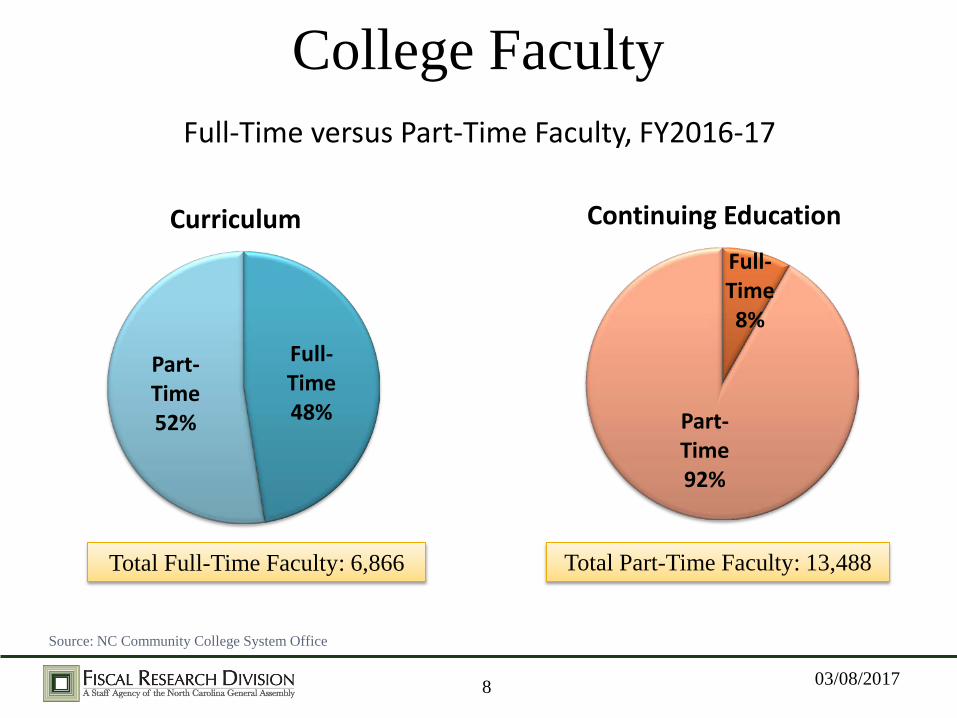
Full-Time 48%
Part-Time 52%
Curriculum
03/08/2017
College Faculty
Source: NC Community College System Office
Full-Time versus Part-Time Faculty, FY2016-17
Full-Time 8%
Part-Time 92%
Continuing Education
8
Total Part-Time Faculty: 13,488 Total Full-Time Faculty: 6,866

Enrollment
03/08/2017 9

809,091
829,146
859,419 847,165 844,692
826,471 824,945
780,146
733,855
710,013
600,000
650,000
700,000
750,000
800,000
850,000
900,000
2006-07 2007-08 2008-09 2009-10 2010-11 2011-12 2012-13 2013-14 2014-15 2015-16
03/08/2017
Headcount: FY 2007-2016
Source: NCCCS Statistical Reports for FY 2006-07 to FY 2015-16
Headcount = # of students that enroll and take at least 1 course
10

272,244 287,215 310,985
334,879 338,431 329,713 326,171 321,158 309,297 298,873
578,545 584,064 595,051 560,434 552,554 540,669 540,854
497,732 457,649 442,270
0
100,000
200,000
300,000
400,000
500,000
600,000
700,000
2006-07 2007-08 2008-09 2009-10 2010-11 2011-12 2012-13 2013-14 2014-15 2015-16
Curriculum Non-Curriculum
Curriculum and Non-Curriculum Headcount FY 2007-2016
Source: NCCCS Statistical Reports for FY 2006-07 to FY 2015-16
03/08/2017 11

205,804
221,096
250,096 253,286
244,068 241,513
233,459
228,724
220,312 223,772*
195,000
205,000
215,000
225,000
235,000
245,000
255,000
265,000
2007-08 2008-09 2009-10 2010-11 2011-12 2012-13 2013-14 2014-15 2015-16 2016-17
Actual FTE: FY 2008-2017*
Source: NCCCS Statistical Reports for FY 2007-08 to FY 2015-16; *NCCCS System Office for 2016-17 estimate
FTE = # of full-time equivalent students
03/08/2017 12

Curriculum 79%
Continuing Education
12%
Basic Skills 8%
Other* 1%
Actual FTE by Program Area FY 2015-16
Total FTE: 220,312
Source: NCCCS 2015-16 Statistical Report
*“Other” includes Customized Training FTE, Small Business Center FTE, self-supporting continuing education FTE, and other non-budget FTE.
03/08/2017 13
03/08/2017
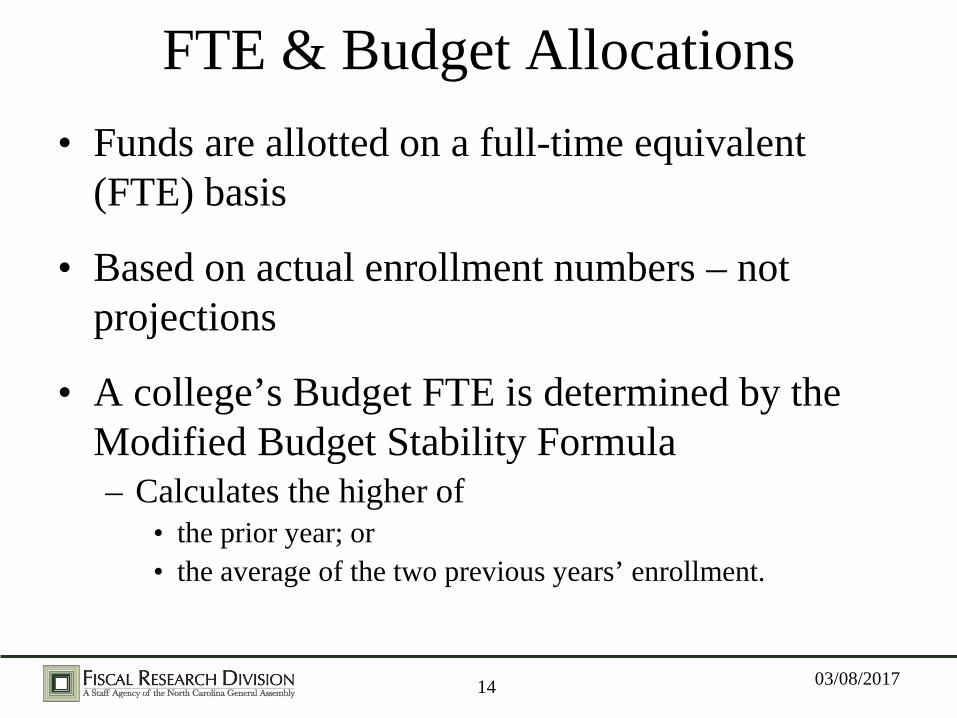
FTE & Budget Allocations • Funds are allotted on a full-time equivalent
(FTE) basis
• Based on actual enrollment numbers – not projections
• A college’s Budget FTE is determined by the Modified Budget Stability Formula – Calculates the higher of
• the prior year; or • the average of the two previous years’ enrollment.
14

205,804
221,096
250,096 253,286
244,068 241,513
233,459 228,724
220,312 223,772*
195,375
201,625
216,472
243,854
251,017
247,937
241,776
235,163 229,614
224,092
225,933*
190,000
200,000
210,000
220,000
230,000
240,000
250,000
260,000
2007-08 2008-09 2009-10 2010-11 2011-12 2012-13 2013-14 2014-15 2015-16 2016-17 2017-18
Actual FTE Budget FTE
Actual vs Budget FTE: FY 2008-2018*
Source: NCCCS Statistical Reports for FY 2007-08 to FY 2015-16; *NCCCS System Office for 2016-17 and 2017-18 estimates
Budget FTE = # of full-time equivalent students counted for budget purposes through
budget stability formula
03/08/2017 15

Budget Overview
03/08/2017 16

State G.S. 115D-31
• Operating costs for instruction, administration, and support services
Local G.S. 115D-32
• Operation and maintenance of plant
Financial Support of Institutions
Per G.S. 115D-32, capital construction is the legal responsibility of the county. However, G.S. 115D-31 authorizes the State to provide capital funding to local institutions, provided that it is matched on a dollar-for-dollar basis.
03/08/2017 17

FY 2016-17 Sources of Operational Funding
State Appropriation
$1,101,604,738 62%
Tuition and Fees $341,978,024
19% Local
$250,149,733 14%
Federal $34,094,930
2%
Carryforward from Prior Year
38,052,084 2%
Other Receipts and Transfers 21,825,046
1% Sources: FY 2016-17 Authorized Budget as of Jan. 2017, NCCCS College Budget Summary (2-1)
Total: $1.79 billion
03/08/2017 18
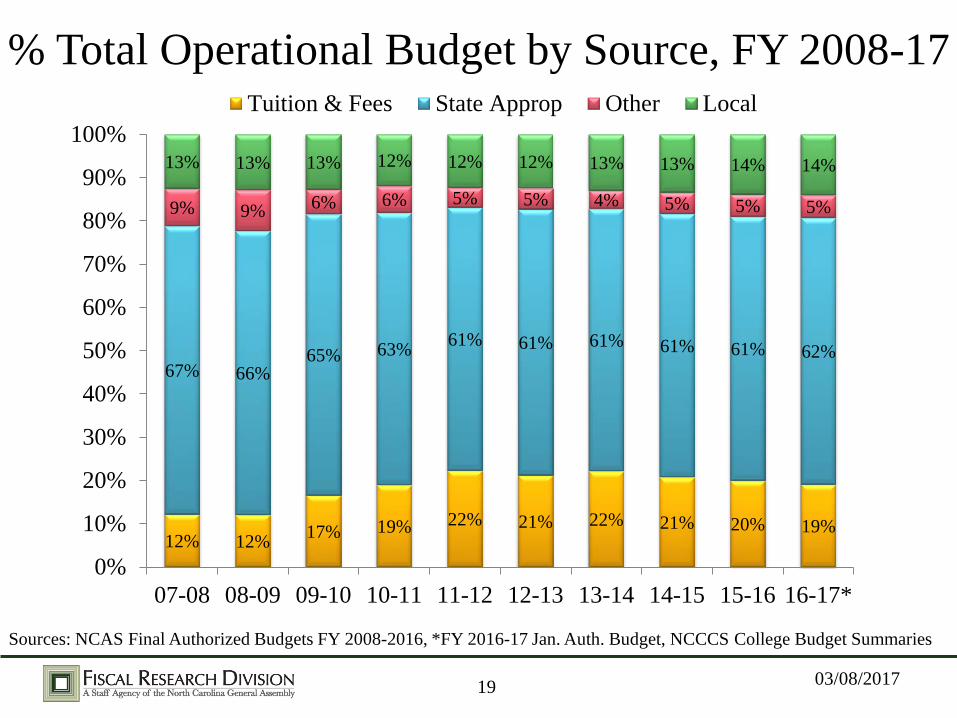
% Total Operational Budget by Source, FY 2008-17
12% 12% 17% 19% 22% 21% 22% 21% 20% 19%
67% 66% 65% 63% 61% 61% 61% 61% 61% 62%
9% 9% 6% 6% 5% 5% 4% 5% 5% 5%
13% 13% 13% 12% 12% 12% 13% 13% 14% 14%
0%
10%
20%
30%
40%
50%
60%
70%
80%
90%
100%
07-08 08-09 09-10 10-11 11-12 12-13 13-14 14-15 15-16 16-17*
Tuition & Fees State Approp Other Local
Sources: NCAS Final Authorized Budgets FY 2008-2016, *FY 2016-17 Jan. Auth. Budget, NCCCS College Budget Summaries
03/08/2017 19

Tuition: FY 2016-17
$76
$268
$70
$125
$180
$0
$50
$100
$150
$200
$250
$300
In-state Out-of-State 0-24 hours 25-50 hours 51+ hours
Max. $2,432 per year
Max. $8,576 per year
Curriculum Tuition per Credit Hour Continuing Education Fees
03/08/2017 20
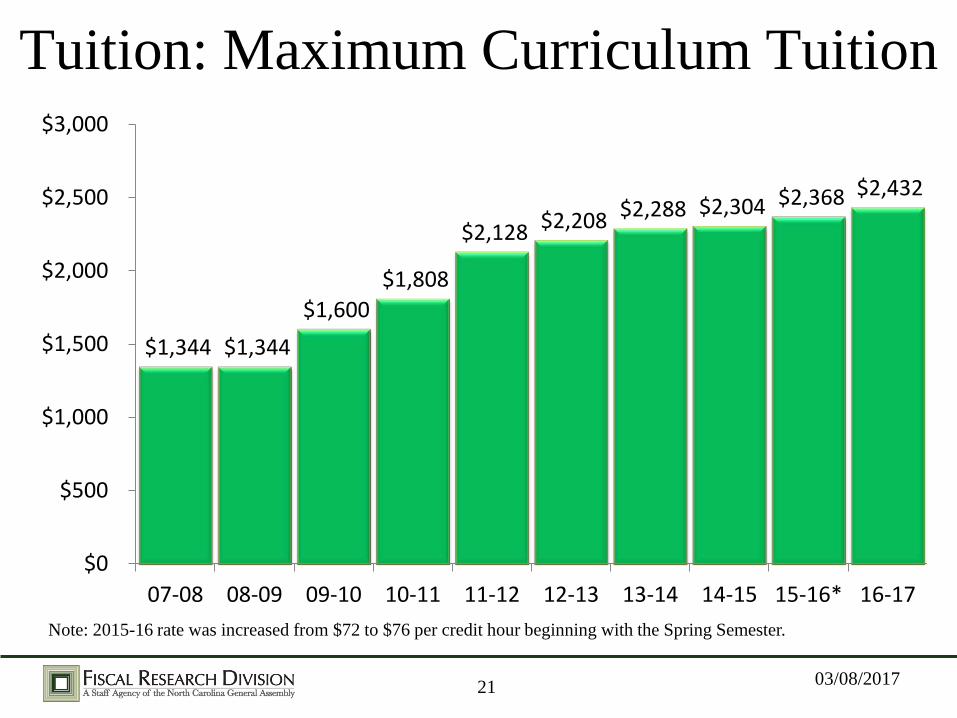
$1,344 $1,344 $1,600
$1,808
$2,128 $2,208 $2,288 $2,304 $2,368 $2,432
$0
$500
$1,000
$1,500
$2,000
$2,500
$3,000
07-08 08-09 09-10 10-11 11-12 12-13 13-14 14-15 15-16* 16-17Note: 2015-16 rate was increased from $72 to $76 per credit hour beginning with the Spring Semester.
Tuition: Maximum Curriculum Tuition
03/08/2017 21

$2,4
09
$2,4
32
$2,7
73
$3,2
42
$3,5
97
$3,6
64
$3,7
02
$3,7
88
$3,8
68
$3,9
48
$4,0
93
$4,1
40
$4,2
82
$4,3
88
$4,4
17
$4,9
13
$4,9
38
$4,9
48
$0
$1,000
$2,000
$3,000
$4,000
$5,000
$6,000
TX NC MS FL AR DE GA OK SREB WV LA US TN AL MD KY SC VA
Resident Tuition & Fees for Public 2-Year Colleges
Tuition: SREB States FY 2016-17
Source: The College Board, NC Community College System
03/08/2017 22
Median Median
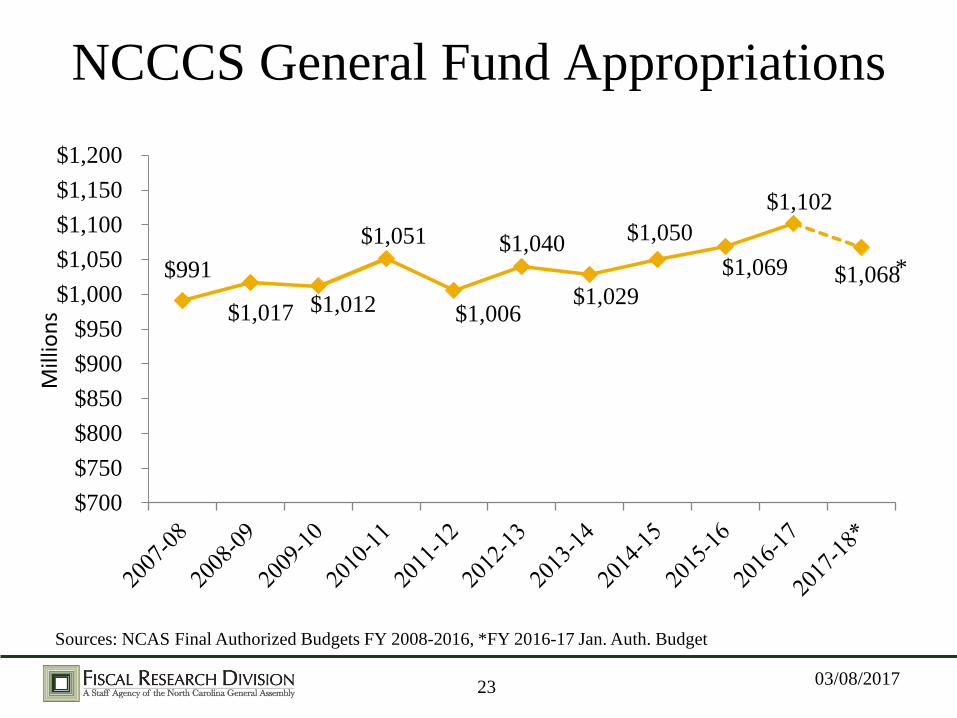
NCCCS General Fund Appropriations
$991
$1,017 $1,012
$1,051
$1,006
$1,040
$1,029
$1,050 $1,069
$1,102
$1,068
$700$750$800$850$900$950
$1,000$1,050$1,100$1,150$1,200
*
03/08/2017 23
Mill
ions
Sources: NCAS Final Authorized Budgets FY 2008-2016, *FY 2016-17 Jan. Auth. Budget

General Fund Appropriations per BFTE
$5,070 $5,042 $4,674
$4,310 $4,010 $4,196 $4,256 $4,465 $4,655 $4,916
$0
$1,000
$2,000
$3,000
$4,000
$5,000
$6,000
03/08/2017
Sources: NCAS Final Authorized Budgets FY 2008-2016, *FY 2016-17 Jan. Auth. Budget, NCCCS System Office
24

State Aid Allocation
03/08/2017 25
26
State Aid Allocations • Formula Budget:
– Base allocation to provide a standard amount of support regardless of size
– Enrollment allocation driven by tier classification of a college’s Budget FTE
– Performance-based allocation determined by student success on 6 performance measures and Basic Skills.
• Categorical Allocations • Specific Program Categorical Allocations
03/08/2017

27
Formula Allocation of Funds: FY 2016-17
Base $190,166,195
14%
Performance-Based
$28,771,824 2%
Enrollment Formula
$1,096,341,491 78%
Categorical $86,176,420
6%
Source: FY 2016-17 NCCCS State Aid Allocations and Budget Policies
Total: $1.40 billion
03/08/2017

28
Funding Flexibility • The General Assembly has allowed colleges to
have flexibility in order to meet individual college needs.
• Formulas are for allocation purposes only.
• Colleges can spend the formula allocations however they choose, except: – Literacy (Basic Skills) funds and Customized
Training funds must be used for those specific purposes.
03/08/2017

29
Allocation of Funds: FY 2017-18
$863.5
$517.8
$36.4 $53.7 $30.1 $16.5
($53.2) -$100$0
$100$200$300$400$500$600$700$800$900
$1,000
Instruction InstitutionalSupport
CategoricalAid &Other
Supportto Colleges
Equipment &Instructional
Resources
SystemOffice
StudentFinancial
Aid
ManagementFlexibility
Source: FY 2017-18 Base Budget
Total: $1.47 billion
Mill
ions
03/08/2017

30
Instruction $863.5
$517.8
$36.4 $53.7 $0
$100$200$300$400$500$600$700$800$900
$1,000
Instruction InstitutionalSupport
Categorical Aid Equipment &Instructional
Resources
59% of Base Budget
Mill
ions
03/08/2017
What it is: • Curriculum • Continuing Education • Basic Skills
What it pays for: • Faculty Salaries • Instructional Supplies
Source: FY 2017-18 Base Budget

31
Institutional & Academic Support $863.5
$517.8
$36.4 $53.7 $0
$100$200$300$400$500$600$700$800$900
$1,000
Instruction InstitutionalSupport
Categorical Aid Equipment &Instructional
Resources
35% of Base Budget
Mill
ions
03/08/2017
What it is: • Academic & Student Support • General College
Administration • Multi-campus college (MCC)
funding
What it pays for: •President & Senior Administrators •Guidance Counselors & Financial
Aid Officers •Librarians & IT Staff •Paraprofessionals & Clerical Staff •Salary & Benefit-related items
Source: FY 2017-18 Base Budget

32
Categorical Aid & Other Support $863.5
$517.8
$36.4 $53.7 $0
$100$200$300$400$500$600$700$800$900
$1,000
Instruction InstitutionalSupport
Categorical Aid Equipment &Instructional
Resources
2.5% of Base Budget
Mill
ions
03/08/2017
What it is:
• Funding provided to colleges outside the regular allotments
What it pays for: •Items outside of Instruction,
Institutional Support, Equipment, and other formula driven items
•Specific campus initiatives •Specific programs Source: FY 2017-18 Base Budget
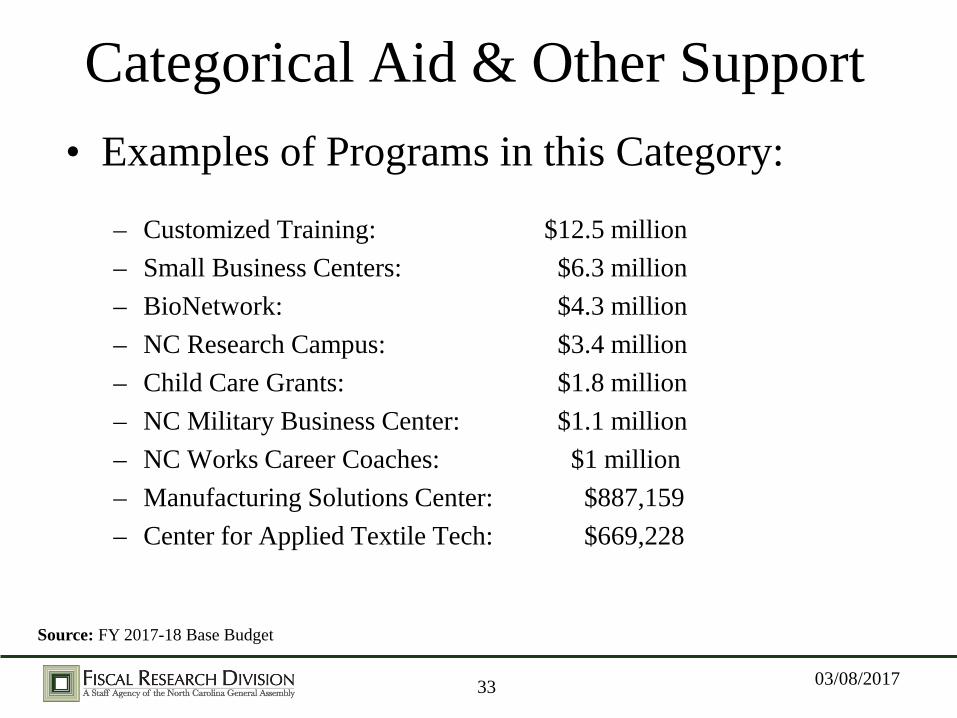
Categorical Aid & Other Support • Examples of Programs in this Category:
– Customized Training: $12.5 million – Small Business Centers: $6.3 million – BioNetwork: $4.3 million – NC Research Campus: $3.4 million – Child Care Grants: $1.8 million – NC Military Business Center: $1.1 million – NC Works Career Coaches: $1 million – Manufacturing Solutions Center: $887,159 – Center for Applied Textile Tech: $669,228
03/08/2017 33
Source: FY 2017-18 Base Budget

34
Equipment & Instructional Resources $863.5
$517.8
$36.4 $53.7 $0
$100$200$300$400$500$600$700$800$900
$1,000
Instruction InstitutionalSupport
Categorical Aid Equipment &Instructional
Resources
3.6% of Base Budget
Mill
ions
03/08/2017
What it is: • Equipment
• Instructional Resources
What it pays for: • Computers • Instructional equipment • Books and other library resources
Source: FY 2017-18 Base Budget

35
Allocation of Funds: FY 2017-18
$30.1 $16.5
($53.2) -$60
-$40
-$20
$0
$20
$40
$60
$80
$100
SystemOffice
StudentFinancial
AidManagement Flexibility
Reduction
Mill
ions
03/08/2017
Source: FY 2017-18 Base Budget

Community Colleges System Office Budget
$4.3
$16.2
$3.3
$7.1
$0
$5
$10
$15
$20
ExecutiveDivision(1100)
Technology Solutions& Distance Learning
(1200)
Finance &Operations
(1300)
Academic &Student
Services (1400)
Mill
ions
Requirements: $30.5 million 2.1% of NCCCS Base Budget Total Positions: 198.5 FTE General Fund Positions: 168.8 FTE
35.5 FTE
80 FTE
35 FTE
48 FTE
03/08/2017 36
Source: FY 2017-18 Base Budget

Student Financial Aid • NC Community College Grant $16.5 million from Escheats budgeted in NCCCS
• Education Lottery Scholarship • Tuition Waivers $93.8 million in waived tuition in 2016 Waivers for particular instruction are authorized in
statute
03/08/2017 37

38
Tuition Waived by Category
$40.3 $42.4 $43.0
$27.3 $31.2
$39.4
$14.8 $12.7
$11.4
$0$10$20$30$40$50$60$70$80$90
$100
2014 2015 2016
Mill
ions
Human Resources Development
High School Students (CCP)
Fire, EMS, Law Enforcement, Public SafetySource: NC Community College System Office
03/08/2017

39
Management Flexibility Reserve
• Management flexibility reduction is a budget cut that is not specifically prescribed.
• Colleges have the flexibility to determine which budget line items to cut, within certain parameters.
• Allocated on a pro-rata basis based on each colleges’ estimated General Fund appropriation.
FY 2017-18 Base Management Flexibility Reduction: $53.2 million
03/08/2017

Recent Legislative Actions • Weighted FTE Tier System Instituted 2011, additional tier added 2014
• FTE rolling average reduced From 3 years to 2 years in 2013
• Summer curriculum instruction counted for Budget FTE purposes Partial 2014, extended to all curr. courses in 2015
03/08/2017 40