Embed Size (px)
DESCRIPTION
Corporate & Sovereign Credit Market Outlook. Dr. Edward Altman. NYU Stern School of Business. 2014 Luncheon Conference TMA, NY Chapter New York January 27, 2014. 1. 1. 1. Summary of Recent High-Yield Bond Activity & Outlook. - PowerPoint PPT Presentation
Citation preview

1111
Dr. Edward AltmanNYU Stern School of Business
Corporate & Sovereign Credit Market Outlook
2014 Luncheon ConferenceTMA, NY ChapterNew YorkJanuary 27, 2014

Summary of Recent High-Yield Bond Activity & Outlook
2
• Continued Low Default Rates and Bankruptcies (Chapter 11 Filings) and High Recovery Rates Since 2010
- Outlook is for Default Rates in the U.S. H.Y. Market to Remain Below Average, but for European Default Rates to Increase- Decreasing Chapter 11 Filings and Time to Emergences since 2009- Current Levels of Filings about Equal to Historic Median
• Record New Issuance of H.Y. Bonds in the U.S. and Europe Since 2010- Outlook is for Record or Near-Record Continued New Issuance as Interest Rates Remain at Near Record Low Levels- Increase in High-Yield New Issues at CCC Level Implying Higher Risk of Future Defaults- Asian High-Yield Bond Market Size about 1/3 of Europe and Less than 1/10 of U.S. (but Growing)
• Credit Quality of U.S. H.Y. and I.G. Market Now No Better than, and Probably Worse than, Prior to the Financial Crisis (2007)- Z-Score Model Results- Liquidity/Debt Comparisons
• Moderate Risk-Adjusted Returns for High-Yield and Distressed Debt Markets, Despite Elevated Price Levels
- Outlook is for Mid-High Single-Digit Returns in 2014
• Quality Junk Strategy- Buy Quality Junk and Sell Junk Quality
• A Novel Approach To Assessing Sovereign Debt Default Risk- Bottom-Up Approach for Private Firms and Banks in Europe and Asia
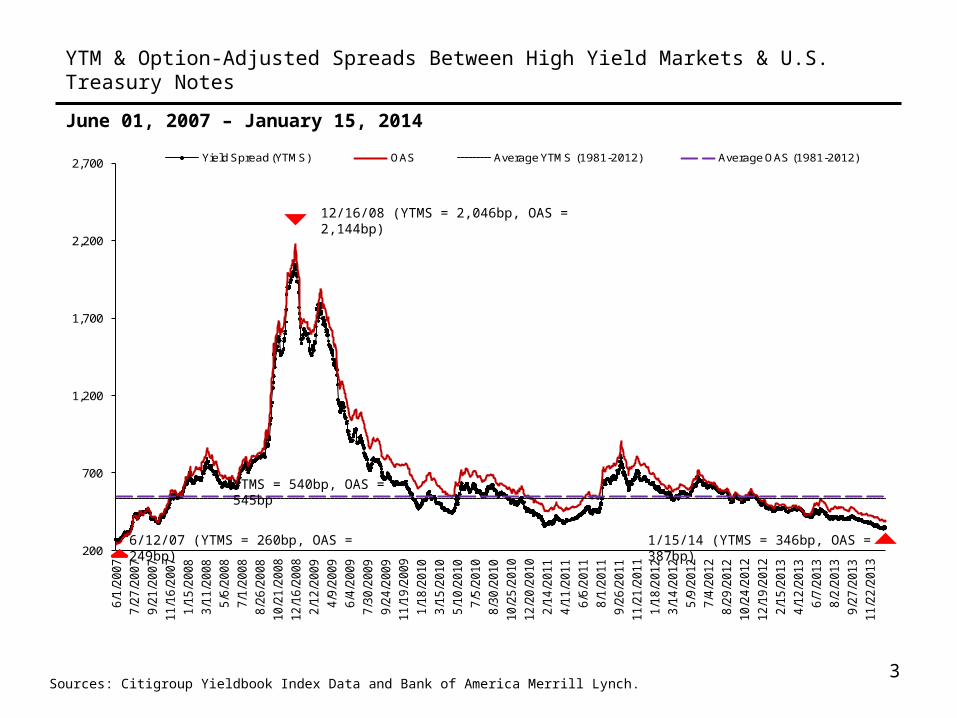
June 01, 2007 – January 15, 2014
Sources: Citigroup Yieldbook Index Data and Bank of America Merrill Lynch.3
YTM & Option-Adjusted Spreads Between High Yield Markets & U.S. Treasury Notes
200
700
1,200
1,700
2,200
2,700
6/1
/2007
7/2
7/2
007
9/2
1/2
007
11/1
6/2
007
1/1
5/2
008
3/1
1/2
008
5/6
/2008
7/1
/2008
8/2
6/2
008
10/2
1/2
008
12/1
6/2
008
2/1
2/2
009
4/9
/2009
6/4
/2009
7/3
0/2
009
9/2
4/2
009
11/1
9/2
009
1/1
8/2
010
3/1
5/2
010
5/1
0/2
010
7/5
/2010
8/3
0/2
010
10/2
5/2
010
12/2
0/2
010
2/1
4/2
011
4/1
1/2
011
6/6
/2011
8/1
/2011
9/2
6/2
011
11/2
1/2
011
1/1
8/2
012
3/1
4/2
012
5/9
/2012
7/4
/2012
8/2
9/2
012
10/2
4/2
012
12/1
9/2
012
2/1
5/2
013
4/1
2/2
013
6/7
/2013
8/2
/2013
9/2
7/2
013
11/2
2/2
013
Yield Spread (YTMS) OAS Average YTMS (1981-2012) Average OAS (1981-2012)
6/12/07 (YTMS = 260bp, OAS = 249bp)
YTMS = 540bp, OAS = 545bp
1/15/14 (YTMS = 346bp, OAS = 387bp)
12/16/08 (YTMS = 2,046bp, OAS = 2,144bp)

High Yield Bonds - Yield to Maturity vs. Yield to Worst
June 01, 2007 – January 15, 2014
Sources: Citigroup Yieldbook Index Data 4
0%
5%
10%
15%
20%
25%
6/1
/20
07
7/2
7/2
00
79
/21
/20
07
11
/16
/20
07
1/1
5/2
00
83
/11
/20
08
5/6
/20
08
7/1
/20
08
8/2
6/2
00
81
0/2
1/2
00
81
2/1
6/2
00
82
/12
/20
09
4/9
/20
09
6/4
/20
09
7/3
0/2
00
99
/24
/20
09
11
/19
/20
09
1/1
8/2
01
03
/15
/20
10
5/1
0/2
01
07
/5/2
01
08
/30
/20
10
10
/25
/20
10
12
/20
/20
10
2/1
4/2
01
14
/11
/20
11
6/6
/20
11
8/1
/20
11
9/2
6/2
01
11
1/2
1/2
01
11
/18
/20
12
3/1
4/2
01
25
/9/2
01
27
/4/2
01
28
/29
/20
12
10
/24
/20
12
12
/19
/20
12
2/1
5/2
01
34
/12
/20
13
6/7
/20
13
8/2
/20
13
9/2
7/2
01
31
1/2
2/2
01
3
YTM YTW
High12/12/08 (YTM = 23.03%)12/15/08 (YTW = 22.65%)
Low5/09/13 (YTM = 6.03%)5/09/13 (YTW = 4.99%)
1/15/14 (YTM = 6.34%)1/15/14 (YTW = 5.44%)

5
Major Risks Going Forward(For 2014)
• Global Economy Slowdown – Primarily U.S. (Double-Dip?): Impact on Default & Recovery Rates, Credit Availability & Credit Quality
– China– Europe
• Sovereign Debt Crisis – Europe (Asia?)– Calm in Late 2012-2013– Looming Corporate Defaults Despite Low (2012) Default Rate?– Survival of the Euro?– Problems in India and Indonesia, Brazil?
• Fed Balance Sheet, Money Supply and Inflation
• LBO and Covenant-Lite Risk
• Role of Collateral in the Global Financial System
• Contagion Between Markets – Debt and Equity
• Increased Investor Leverage in Stock Markets Similar to 2007
• Political Paralysis – Deficit/Debt Levels
• U.S. Municipal Bond & Federal Government Default Risk
• Uncertainties (non-quantifiable)

6
Historical Default Rates and Recession Periods in the U.S.
Periods of Recession: 11/73 - 3/75, 1/80 - 7/80, 7/81 - 11/82, 7/90 - 3/91, 4/01 – 12/01, 12/07 - 6/09
*All rates annual
Source: E. Altman (NYU Salomon Center) & National Bureau of Economic Research
HIGH YIELD BOND MARKET (1972 – 2013 (Preliminary))*
0.0%
2.0%
4.0%
6.0%
8.0%
10.0%
12.0%
14.0%
72
74
76
78
80
82
84
86
88
90
92
94
96
98
00
02
04
06
08
10
12

Straight Bonds Only Excluding Defaulted Issues From Par Value Outstanding, (US$ millions)1971 – 2013 (Preliminary)
Historical Default Rates
7
YearPar Value
Outstandinga ($)Par Value
Defaults ($)Default Rates
(%)
2012 1,212,362 19,647 1.621
2011 1,354,649 17,963 1.326
2010 1,221,569 13,809 1.130
2009 1,152,952 123,878 10.744
2008 1,091,000 50,763 4.653
2007 1,075,400 5,473 0.509
2006 993,600 7,559 0.761
2005 1,073,000 36,209 3.375
2004 933,100 11,657 1.249
2003 825,000 38,451 4.661
2002 757,000 96,855 12.795
2001 649,000 63,609 9.801
2000 597,200 30,295 5.073
1999 567,400 23,532 4.147
1998 465,500 7,464 1.603
1997 335,400 4,200 1.252
1996 271,000 3,336 1.231
1995 240,000 4,551 1.896
1994 235,000 3,418 1.454
1993 206,907 2,287 1.105
1992 163,000 5,545 3.402
1991 183,600 18,862 10.273
1990 181,000 18,354 10.140
1989 189,258 8,110 4.285
1988 148,187 3,944 2.662
1987 129,557 7,486 5.778
1986 90,243 3,156 3.497
a Weighted by par value of amount outstanding for each year.
YearPar Value
Outstanding* ($)Par Value
Defaults ($)Default
Rates (%)
1985 58,088 992 1.708
1984 40,939 0.840 0.840
1983 27,492 1.095 1.095
1982 18,109 3.186 3.186
1981 17,115 0.158 0.158
1980 14,935 1.500 1.500
1979 10,356 0.193 0.193
1978 8,946 1.330 1.330
1977 8,157 4.671 4.671
1976 7,735 0.388 0.388
1975 7,471 2.731 2.731
1974 10,894 1.129 1.129
1973 7,824 0.626 0.626
1972 6,928 2.786 2.786
1971 6,602 1.242 1.242
Standard Deviation (%)
Arithmetic Average Default Rate (%)
1971 to 2013 3.141 3.129
1978 to 2013 3.374 3.312
1985 to 2013 3.903 3.459
Weighted Average Default Rate (%)*1971 to 2013 3.606
1978 to 2013 3.612
1985 to 2013 3.631
Median Annual Default Rate (%)
1971 to 2013 1.621
2013 1,392,212 14,539 1.044
Source: Author’s compilation and Citigroup/Credit Suisse estimates

QUARTERLY DEFAULT RATE AND FOUR QUARTER MOVING AVERAGE
1989 – 2013 (Preliminary)
Source: Author’s Compilations
Default Rates on High-Yield Bonds
8
0.0%
2.0%
4.0%
6.0%
8.0%
10.0%
12.0%
14.0%
16.0%
0.0%
1.0%
2.0%
3.0%
4.0%
5.0%
6.0%
4 -
Qu
arte
r M
ovin
g A
vera
ge
Qu
arte
rly
Def
ault
Rat
e
Quarterly Moving

Trends in Bankruptcy Filings
Source: Edward I. Altman, “The Role of Distressed Debt Markets, Hedge Funds and Recent Trends in Bankruptcy on the Outcomes of Chapter 11 Reorganizations”, ABI Law Review forthcoming December 2013
9
10101010
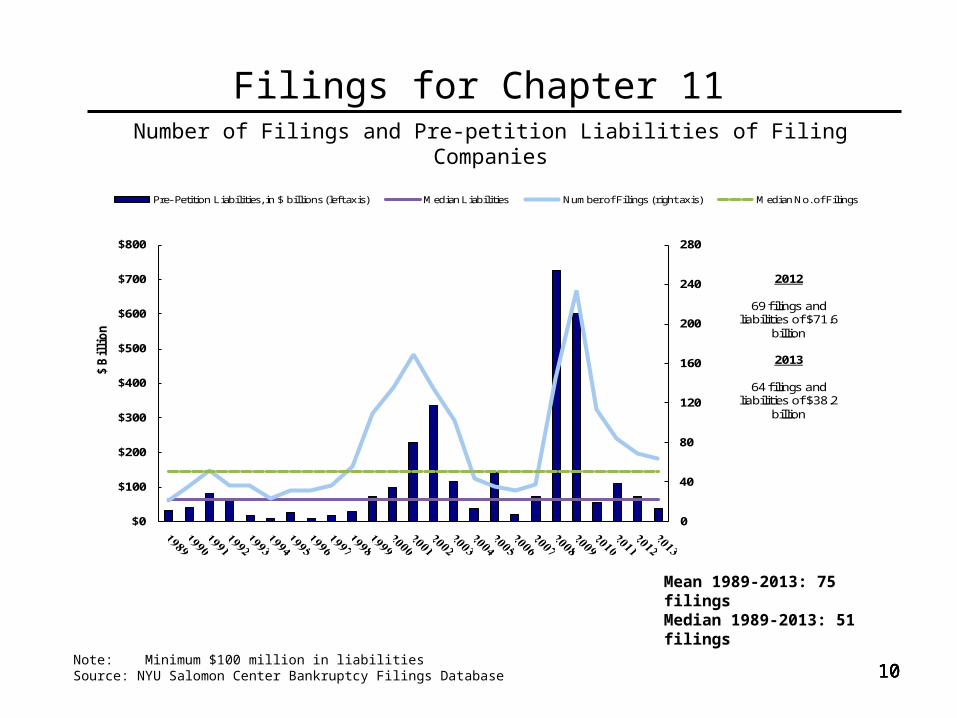
Filings for Chapter 11Number of Filings and Pre-petition Liabilities of Filing Companies
1989 – 2013 (Preliminary)
Note: Minimum $100 million in liabilitiesSource: NYU Salomon Center Bankruptcy Filings Database
0
40
80
120
160
200
240
280
$0
$100
$200
$300
$400
$500
$600
$700
$800
$ B
illi
on
Pre- Petition Liabilities, in $ billions (left axis) Median Liabilities Number of Filings (right axis) Median No. of Filings
2012
69 filings and liabilities of $71.6
billion
2012 (5/31)
36 filings and liabilities of $46.7
billion
2013 (5/31)
28 filings and liabilities of $16.9
billion
2012
69 filings and liabilities of $71.6
billion
2012 (5/31)
36 filings and liabilities of $46.7
billion
2013 (5/31)
28 filings and liabilities of $16.9
billion
2012
69 filings and liabilities of $71.6
billion
2012 (5/31)
36 filings and liabilities of $46.7
billion
2013 (5/31)
28 filings and liabilities of $16.9
billion
2012
69 filings and liabilities of $71.6
billion
2013
64 filings and liabilities of $38.2
billion
Mean 1989-2013: 75 filingsMedian 1989-2013: 51 filings

11
Chapter 11 Filing Statistics
Note: Minimum $100 million in liabilities. Source: NYU Salomon Center Bankruptcy Filings Database
YearNumber of
FilingsPre-Petition Liabilities
($ billions)Number of
Filings ≥ $1B≥$1B/Total Filings (%)
1989 22 33,539 10 451990 35 41,115 10 291991 51 81,158 11 221992 37 64,224 14 381993 37 17,701 4 111994 24 8,396 1 41995 32 27,153 7 221996 32 11,687 0 01997 36 18,866 5 141998 56 32,038 6 111999 109 70,957 19 172000 136 98,896 23 172001 169 228,604 38 222002 135 336,612 41 302003 102 115,172 26 252004 44 39,550 11 252005 35 142,625 11 312006 32 22,322 4 132007 38 72,646 8 212008 145 724,010 24 172009 234 603,992 50 212010 114 56,981 14 122011 84 109,119 7 82012 69 71,613 14 20
2013 (Prelim) 64 38,157 10 16Mean No. of Filings, 1989-2013 75 15 20%
Median No. of Filings, 1989-2013 51 11 20%
Median No. of Filings, 1998-2013 93 14
Mean Liabilities, 1989-2013 122,685
Median Liabilities, 1989-2013 64,224
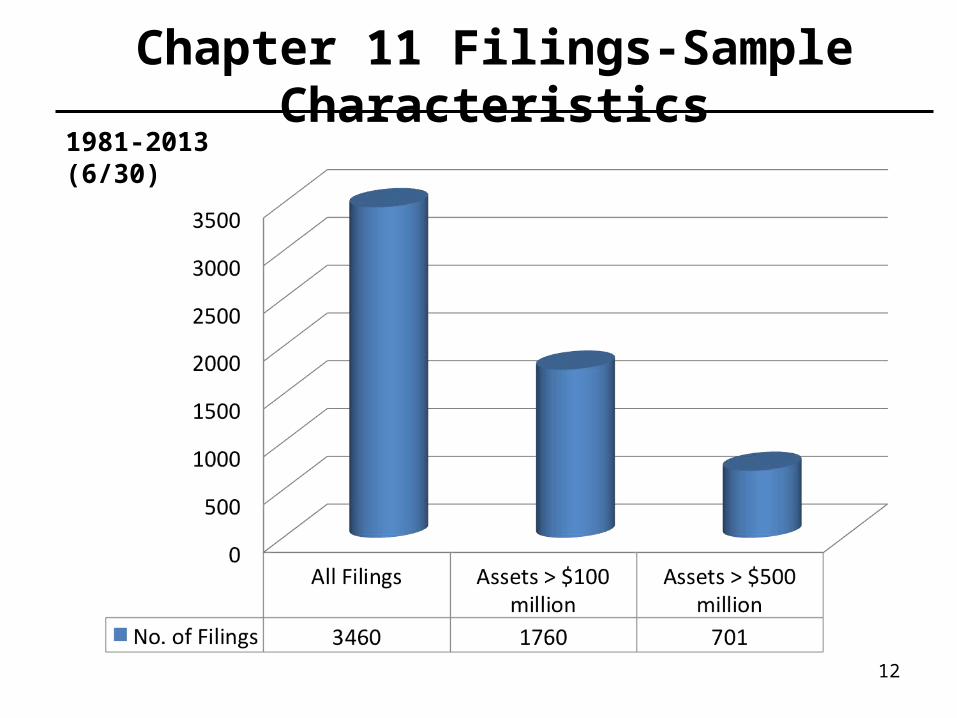
Chapter 11 Filings-Sample Characteristics1981-2013 (6/30)
12

• Successful Chapter 11– Emergence from Chapter 11– Acquired in Chapter 11
• Unsuccessful Chapter 11– Conversion into Chapter 7– Liquidated under Chapter 11
• Adjustments made for Chapter 22,33,44
13
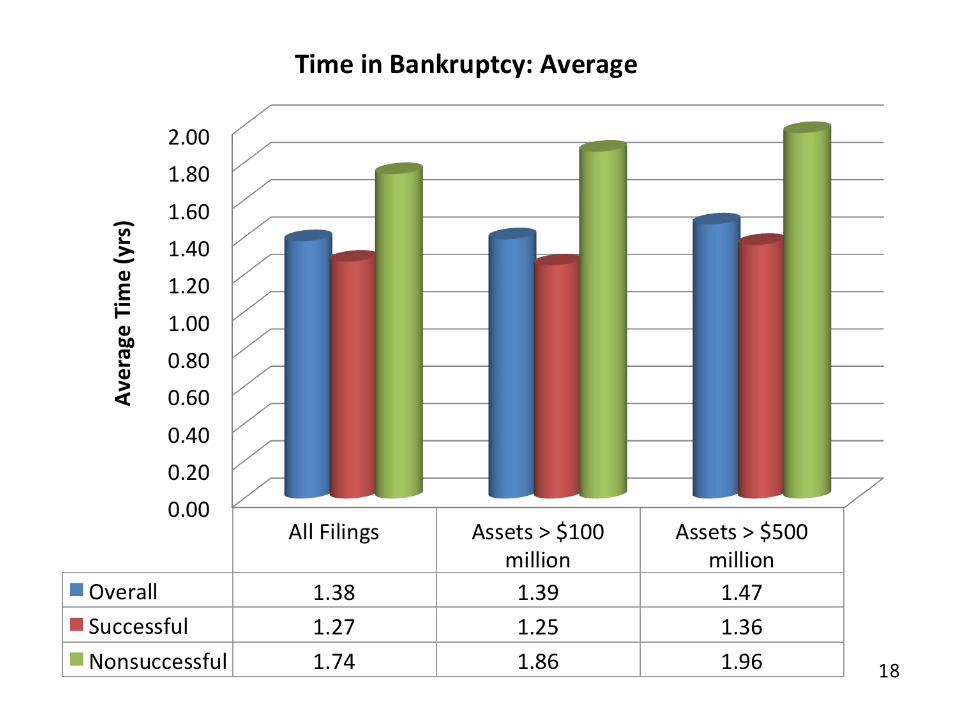
Successful vs Unsuccessful Chapter 11s
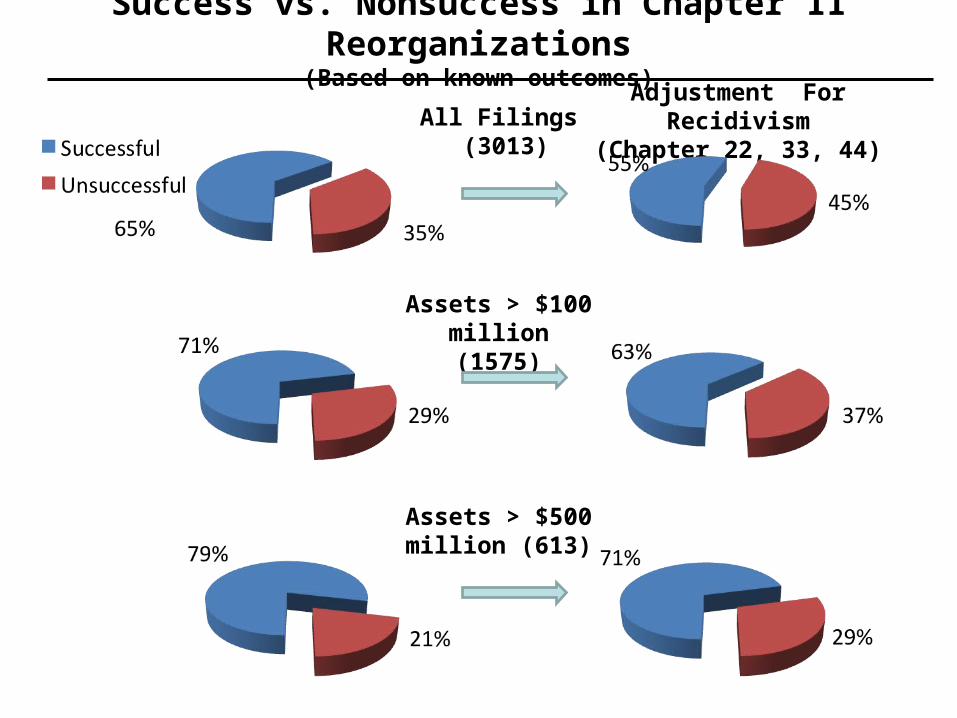
Success vs. Nonsuccess in Chapter 11 Reorganizations(Based on known outcomes)
Adjustment For Recidivism(Chapter 22, 33, 44)All Filings
(3013)
Assets > $100 million(1575)
Assets > $500 million (613)

Success vs. Nonsuccess in Chapter 11 Reorganizations(Based on known outcomes, no adjustments for recidivism)
2006-2010All Filings
Assets > $100 million
Assets > $500 million
1981-2013
(3013) (592)
(1575) (361)
(613) (154)

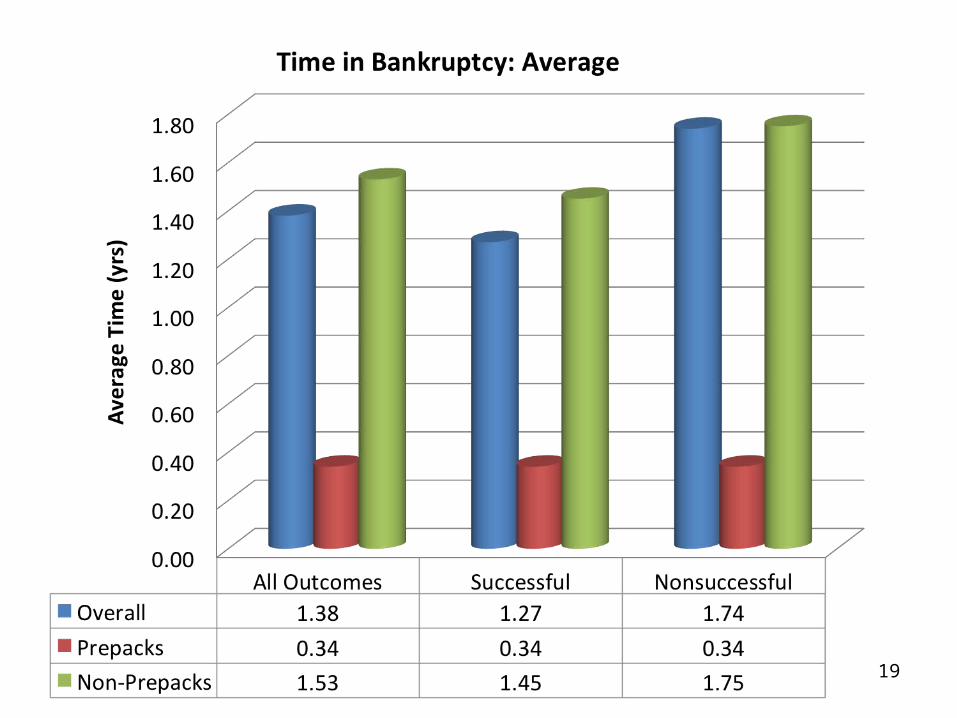
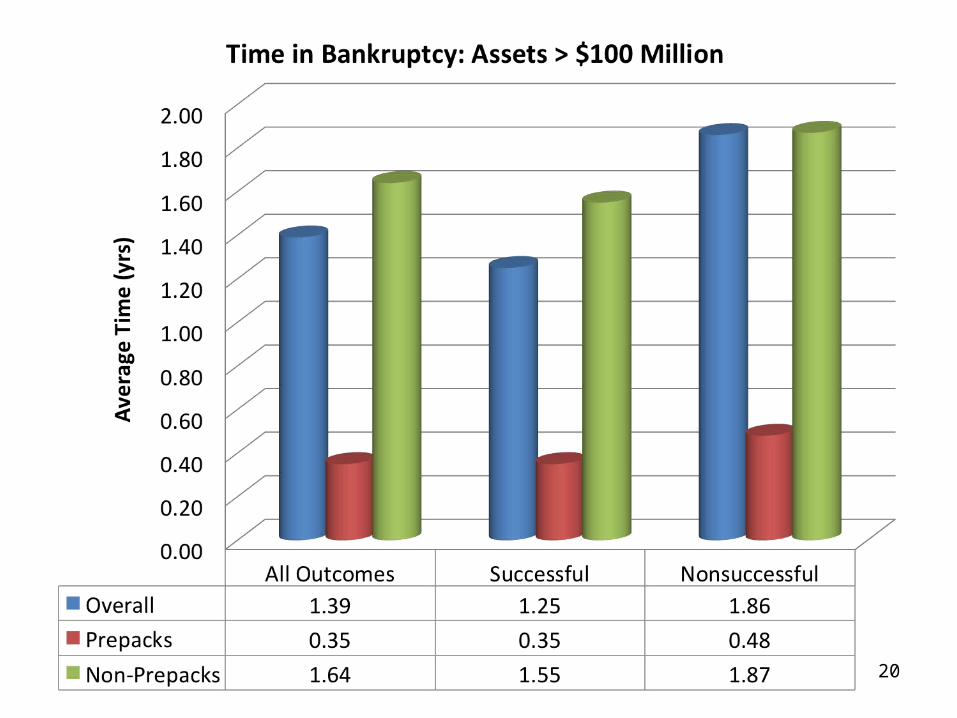
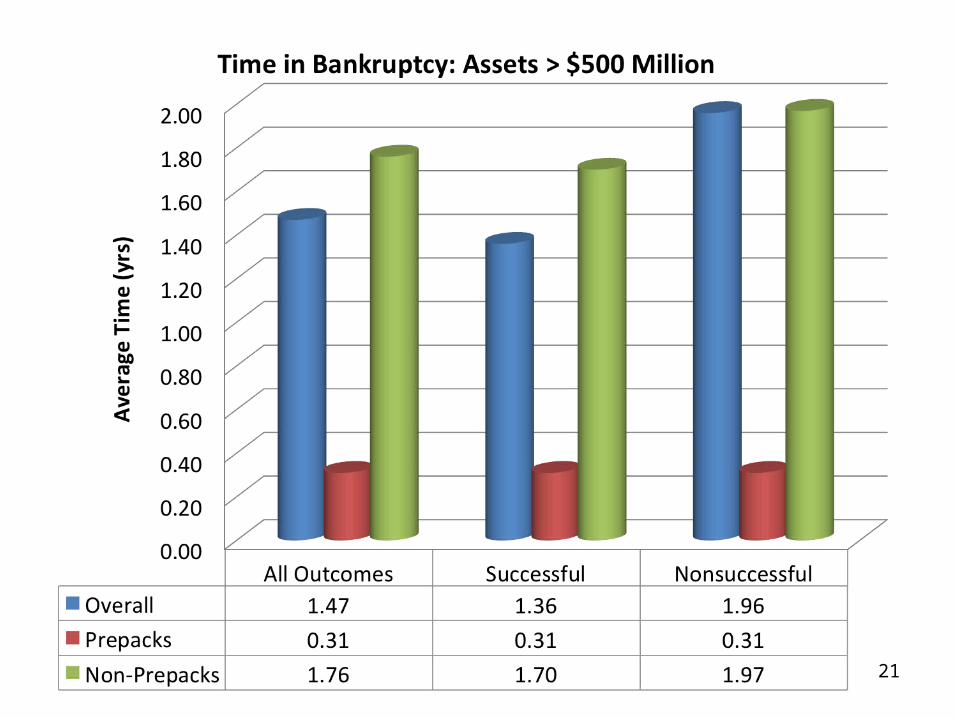
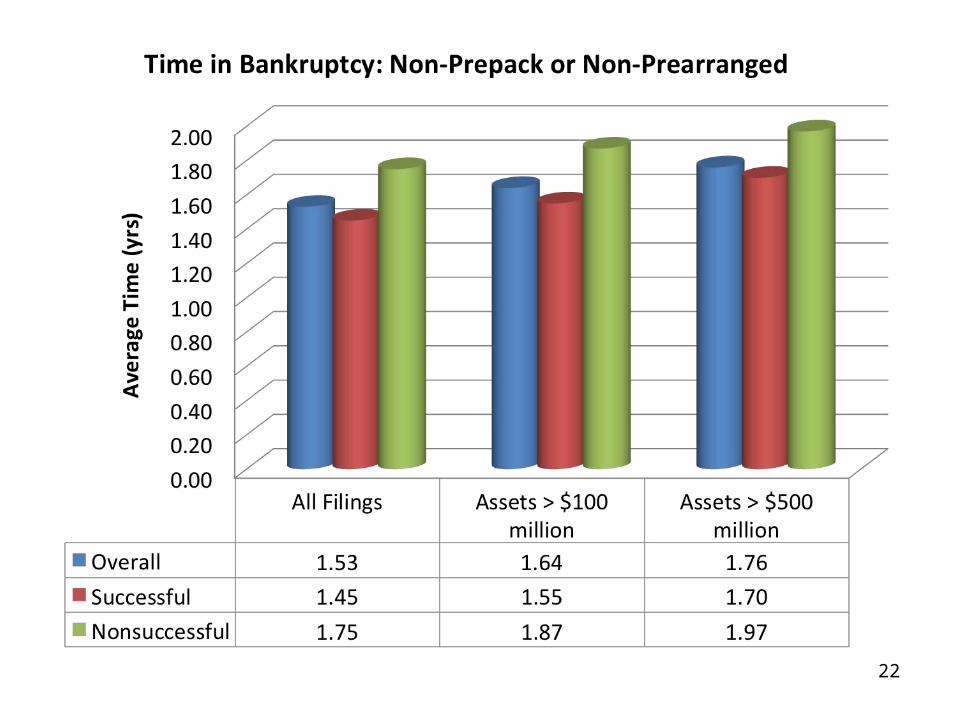
Prepacks/Prearranged vs Non-Prepacks among Non-Dismissed Filings
All Filings
Assets > $100 million
Assets > $500 million
2006-20131981-2013

17
18
19
20
21
22

Source: Bank of America Merrill Lynch
2005 – 2013
New Issuance: U.S. High Yield Bond Market ($ millions)
Ratings
Annual Total BB B CCC (% H.Y.) NR
2005 81,541.8 18,615.0 45,941.2 15,750.9 (19.3%) 1,234.7
2006 131,915.9 37,761.2 67,377.3 25,319.2 (19.2%) 1,458.2
2007 132,689.1 23,713.2 55,830.8 49,627.6 (37.4%) 3,517.5
2008 50,747.2 12,165.0 25,093.1 11,034.4 (21.7%) 2,454.6
2009 127,419.3 54,273.5 62,277.4 10,248.4 (8.0%) 620.0
2010 229,307.4 74,189.9 116,854.7 35,046.8 (15.3%) 3,216.1
2011 (1Q) 68,600.3 10,266.0 45,342.5 10,145.0 (14.8%) 2,846.8
(2Q) 62,846.7 16,492.7 38,849.0 7,505.0 (11.9%) 0.0
(3Q) 22,853.9 10,650.0 9,568.9 2,460.0 (10.8%) 175.0
(4Q) 30,270.0 17,125.0 11,880.0 1,265.0 (4.2%) 0.0
2011 Totals 184,571.0 54,533.8 105,640.4 21,375.0 (11.6%) 3,021.8
2012 (1Q) 75,462.0 26,071.1 36,003.0 11,362.9 (15.1%) 2,025.0
(2Q) 40,748.9 9,589.2 21,724.5 6,583.1 (16.2%) 2,852.0
(3Q) 86,806.5 23,529.1 46,640.0 16,092.4 (18.5%) 545.0
(4Q) 77,432.9 12,662.7 49,243.5 14,651.7 (18.9%) 875.0
2012 Totals 280,450.3 71,852.1 153,611.1 48,690.2 (17.4%) 6,297.0
2013 (1Q) 73,492.3 31,953.1 29,534.2 11,480.0 (15.6%) 525.0
(2Q) 62,135.0 24,380.0 23,665.0 13,790.0 (22.2%) 300.0
(3Q) 73,770.8 22,964.2 32,610.0 18,196.6 (24.7%) 0.0
(4Q) 60,936.8 24,050.0 22,686.8 14,175.0 (23.3%) 25.0
2013 Totals 270,334.8 103,347.3 108,495.9 57,641.6 (21.3%) 850.023
24
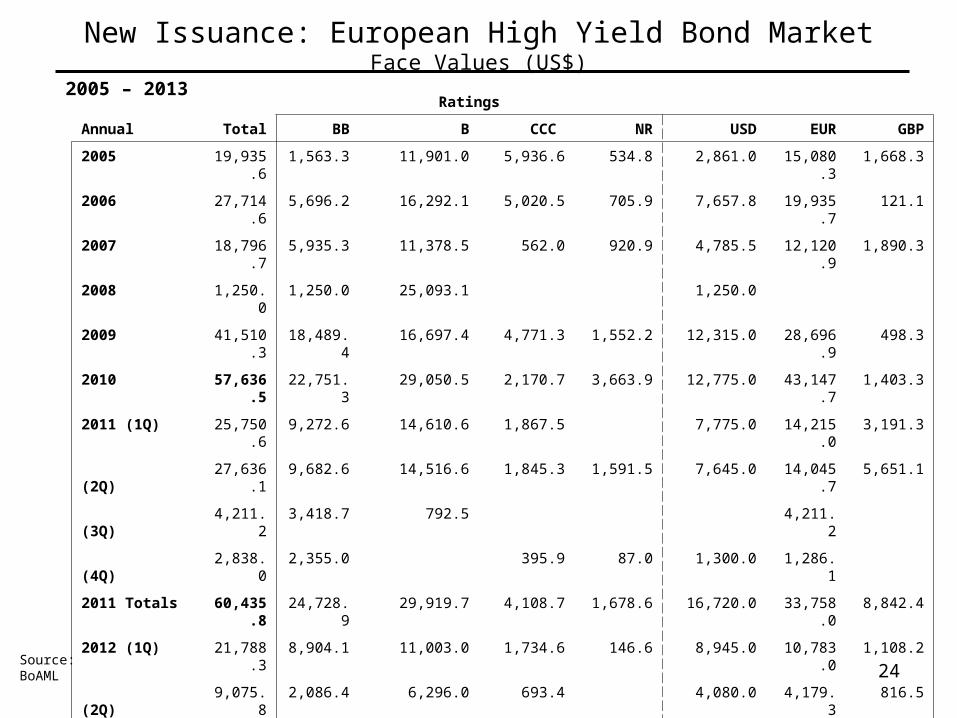
New Issuance: European High Yield Bond MarketFace Values (US$)
Ratings
Annual Total BB B CCC NR USD EUR GBP
2005 19,935.6 1,563.3 11,901.0 5,936.6 534.8 2,861.0 15,080.3 1,668.3
2006 27,714.6 5,696.2 16,292.1 5,020.5 705.9 7,657.8 19,935.7 121.1
2007 18,796.7 5,935.3 11,378.5 562.0 920.9 4,785.5 12,120.9 1,890.3
2008 1,250.0 1,250.0 25,093.1 1,250.0
2009 41,510.3 18,489.4 16,697.4 4,771.3 1,552.2 12,315.0 28,696.9 498.3
2010 57,636.5 22,751.3 29,050.5 2,170.7 3,663.9 12,775.0 43,147.7 1,403.3
2011 (1Q) 25,750.6 9,272.6 14,610.6 1,867.5 7,775.0 14,215.0 3,191.3
(2Q) 27,636.1 9,682.6 14,516.6 1,845.3 1,591.5 7,645.0 14,045.7 5,651.1
(3Q) 4,211.2 3,418.7 792.5 4,211.2
(4Q) 2,838.0 2,355.0 395.9 87.0 1,300.0 1,286.1
2011 Totals 60,435.8 24,728.9 29,919.7 4,108.7 1,678.6 16,720.0 33,758.0 8,842.4
2012 (1Q) 21,788.3 8,904.1 11,003.0 1,734.6 146.6 8,945.0 10,783.0 1,108.2
(2Q) 9,075.8 2,086.4 6,296.0 693.4 4,080.0 4,179.3 816.5
(3Q) 17,733.2 9,138.4 4,122.4 2,652.5 1,820.0 6,350.0 10,399.2 241.2
(4Q) 16,918.8 6,872.9 7,591.7 2,106.2 348.0 8,823.0 6,908.8 763.5
2012 Totals 65,516.1 27,001.7 29,013.0 7,186.7 2,314.6 28,198.0 32,270.4 2,929.3
2013 (1Q) 27,954.5 6,783.8 15,008.4 5,160.6 1,001.7 10,050.0 12,380.7 4,837.4
(2Q) 30,335.3 6,860.2 19,295.1 3,724.1 455.9 9,913.0 14,149.9 6,074.0
(3Q) 16,558.4 3,375.3 9,609.6 2,721.8 851.7 5,310.0 8,644.0 2,604.4
(4Q) 16,520.4 2,588.0 10,522.1 2,366.4 1,043.9 5,210.0 8,951.0 2,359.4
2013 Totals 91,368.6 19,607.3 54,435.2 13,972.9 3,353.2 30,483.0 44,125.6 15,875.3
Source: BoAML
2005 – 2013

25
1978 – 2013 (Mid-year US$ billions)
Size of the US High-Yield Bond Market
$1,392

Size of Western European HY Market (€ Billions)
26
Includes non-investment grade straight corporate debt of issuers with assets located in or revenues derived from Western Europe, or the bond is denominated in a Western European currency. Floating-rate and convertible bonds and preferred stock are not included.
Source: Credit Suisse
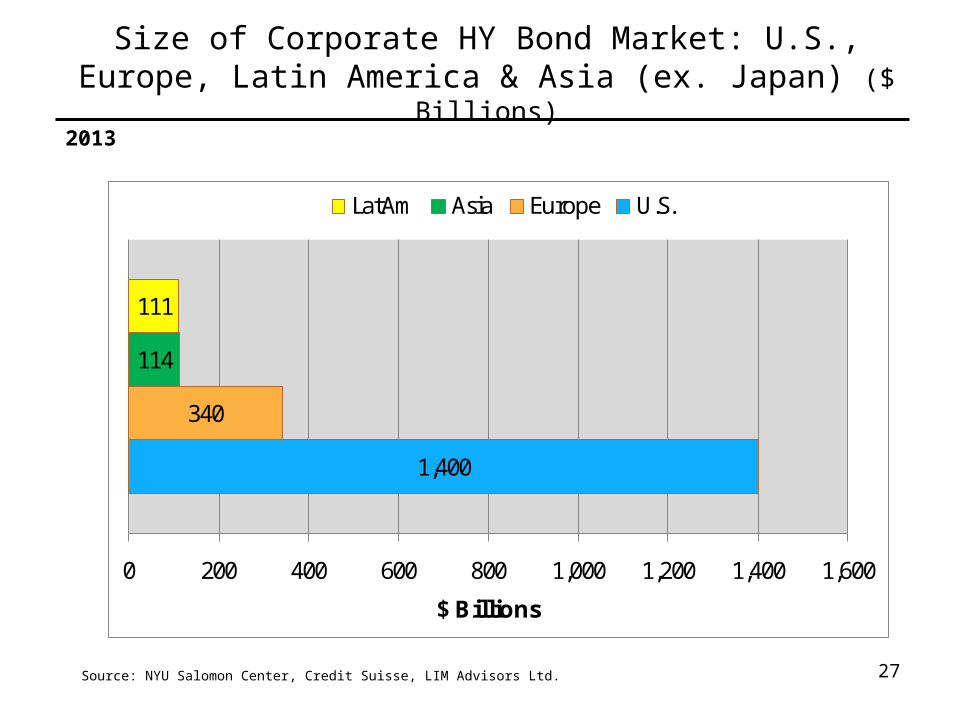
Size of Corporate HY Bond Market: U.S., Europe, Latin America & Asia (ex. Japan) ($ Billions)
27Source: NYU Salomon Center, Credit Suisse, LIM Advisors Ltd.
1,400
340
114
111
0 200 400 600 800 1,000 1,200 1,400 1,600
$ Billions
LatAm Asia Europe U.S.
2013

Stronger Investment Grade and/or High-Yield Firm Balance Sheets?
28

29
Z-Score Component Definitions and Weightings
Variable Definition Weighting Factor
X1 Working Capital 1.2
Total Assets
X2 Retained Earnings 1.4
Total Assets
X3 EBIT 3.3
Total Assets
X4 Market Value of Equity 0.6
Book Value of Total Liabilities
X5 Sales 1.0
Total Assets

30
Z ” Score Model for Manufacturers, Non-Manufacturer Industrials; Developed and
Emerging Market Credits
Z” = 6.56X1 + 3.26X2 + 6.72X3 + 1.05X4 +3.25
X1 = Current Assets - Current Liabilities
Total Assets
X2 = Retained Earnings
Total Assets
X3 = Earnings Before Interest and Taxes
Total Assets
X4 = Book Value of Equity
Total Liabilities

Comparing Financial Strength of High-Yield Bond Issuers in 2007& 2012
31
Year Average Z-Score/ (BRE)*
Median Z-Score/ (BRE)*
Average Z”-Score/ (BRE)*
Median Z”-Score/ (BRE)*
2007 1.89 (B) 1.81 (B) 4.58 (B+) 4.61 (B+)
2012 1.66 (B) 1.59 (B) 4.60 (B+) 4.60 (B+)
Difference in Means Test (2007 vs 2012)
Model Average Difference
Standard Deviation (2007/2012)
t-test Significance Level
Significant at .05?
Z-Score -0.23 1.29 / 1.15 -2.38 0.88% Yes
Z”-Score +0.02 2.50 / 2.07 +0.13 44.68% No
*Bond Rating EquivalentSource: Authors’ calculations, data from Altman and Hotchkiss (2006) and S&P Capital IQ.
Number of Firms
Z-Score Z”-Score
2007 277 383
2012 404 488

Comparing Financial Strength of Investment Grade Bond Issuers in 2007& 2012
32
Year Average Z-Score/ (BRE)*
Median Z-Score/ (BRE)*
Average Z”-Score/ (BRE)*
Median Z”-Score/ (BRE)*
2007 2.84 (BBB) 2.59 (BB+) 5.60 (BBB-) 5.56 (BBB-)
2012 2.60 (BB+) 2.36 (BB) 5.64 (BBB-) 5.65 (BBB-)
Difference in Means Test (2007 vs 2012)
Model Average Difference
Standard Deviation (2007/2012)
t-test Significance Level
Significant at .05?
Z-Score -0.24 1.86 / 1.61 -1.80 3.59% Yes
Z”-Score +0.04 2.51 / 2.17 +0.22 41.43% No
*Bond Rating EquivalentSource: Authors’ calculations, data from Altman and Hotchkiss (2006) and S&P Capital IQ.
Number of Firms
Z-Score Z”-Score
2007 324 349
2012 432 457

Average Z-Score by S&P Bond Rating
33Source: E. Altman and E. Hotchkiss (2006), Corporate Financial Distress and Bankruptcy, John Wiley & Sons, pp.247/248.
Rating Average Z-Score Standard Deviation
AAA 6.2 2.1
AA 4.7 2.4
A 3.7 2.3
BBB 2.8 1.5
BB 2.4 1.9
B 1.8 1.9
CCC 0.3 1.2
D -0.2 2.5

Average Z”-Score by S&P Bond Rating
34Source: E. Altman and E. Hotchkiss (2006), Corporate Financial Distress and Bankruptcy, John Wiley & Sons, pp.247/248.
Rating Average Z”-Score Rating Average Z”-Score
AAA 8.15 BB+ 5.25
AA+ 7.60 BB 4.95
AA 7.30 BB- 4.75
AA- 7.00 B+ 4.50
A+ 6.85 B 4.15
A 6.65 B- 3.75
A- 6.40 CCC+ 3.20
BBB+ 6.25 CCC 2.50
BBB 5.85 CCC- 1.75
BBB- 5.65 D 0.00
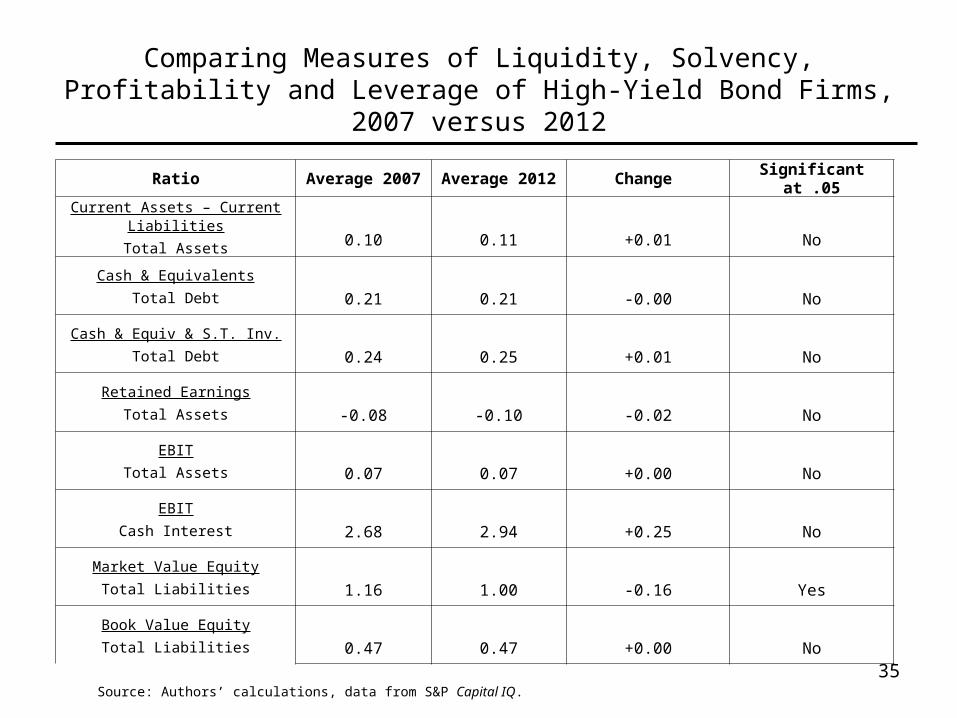
Comparing Measures of Liquidity, Solvency, Profitability and Leverage of High-Yield Bond Firms, 2007 versus 2012
35Source: Authors’ calculations, data from S&P Capital IQ.
Ratio Average 2007 Average 2012 Change Significant at .05
Current Assets – Current Liabilities
Total Assets 0.10 0.11 +0.01 No
Cash & Equivalents
Total Debt 0.21 0.21 -0.00 No
Cash & Equiv & S.T. Inv.
Total Debt 0.24 0.25 +0.01 No
Retained Earnings
Total Assets -0.08 -0.10 -0.02 No
EBIT
Total Assets 0.07 0.07 +0.00 No
EBIT
Cash Interest 2.68 2.94 +0.25 No
Market Value Equity
Total Liabilities 1.16 1.00 -0.16 Yes
Book Value Equity
Total Liabilities 0.47 0.47 +0.00 No

Comparing Measures of Liquidity, Solvency, Profitability and Leverage of Investment Grade Bond Firms, 2007 versus 2012
36Source: Authors’ calculations, data from S&P Capital IQ.
Ratio Average 2007 Average 2012 Average Change Significant at .05
Current Assets – Current Liabilities
Total Assets 0.05 0.07 +0.02 Yes
Cash & Equivalents
Total Debt 0.30 0.36 +0.06 Yes
Cash & Equiv & S.T. Inv.
Total Debt 0.12 0.19 +0.07 Yes
Retained Earnings
Total Assets 0.16 0.12 -0.04 Yes
EBIT
Total Assets 0.11 0.10 -0.01 No
EBIT
Cash Interest 6.33 6.73 +0.40 No
Market Value Equity
Total Liabilities 2.23 2.00 -0.23 No
Book Value Equity
Total Liabilities 0.74 0.81 +0.07 No
37
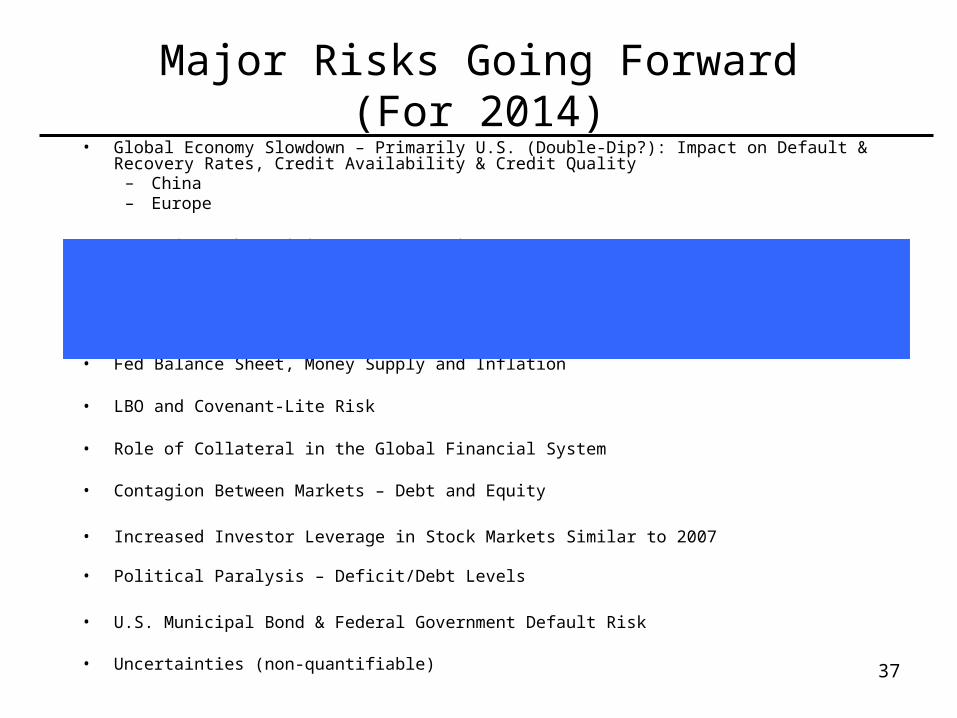
Major Risks Going Forward(For 2014)
• Global Economy Slowdown – Primarily U.S. (Double-Dip?): Impact on Default & Recovery Rates, Credit Availability & Credit Quality
– China– Europe
• Sovereign Debt Crisis – Europe (Asia?)– Calm in Late 2012-2013– Looming Corporate Defaults Despite Low (2012) Default Rate?– Survival of the Euro?– Problems in India and Indonesia, Brazil?
• Fed Balance Sheet, Money Supply and Inflation
• LBO and Covenant-Lite Risk
• Role of Collateral in the Global Financial System
• Contagion Between Markets – Debt and Equity
• Increased Investor Leverage in Stock Markets Similar to 2007
• Political Paralysis – Deficit/Debt Levels
• U.S. Municipal Bond & Federal Government Default Risk
• Uncertainties (non-quantifiable)
A Novel Approach to Assessing Sovereign Debt
Default Risk

Euro High-Yield Option-Adjusted Spreads
June 01, 2007 – January 15, 2014
Sources: Bank of America Merrill Lynch Index Data. 39
150
650
1150
1650
2150
2650
6/1/2007 6/1/2008 6/1/2009 6/1/2010 6/1/2011 6/1/2012 6/1/2013
OAS Average OAS (1998-2013)
12/18/08 (OAS = 2,326bp)
6/05/07 (OAS = 182bp)
Average OAS = 711bp
1/15/14 (OAS = 350bp)
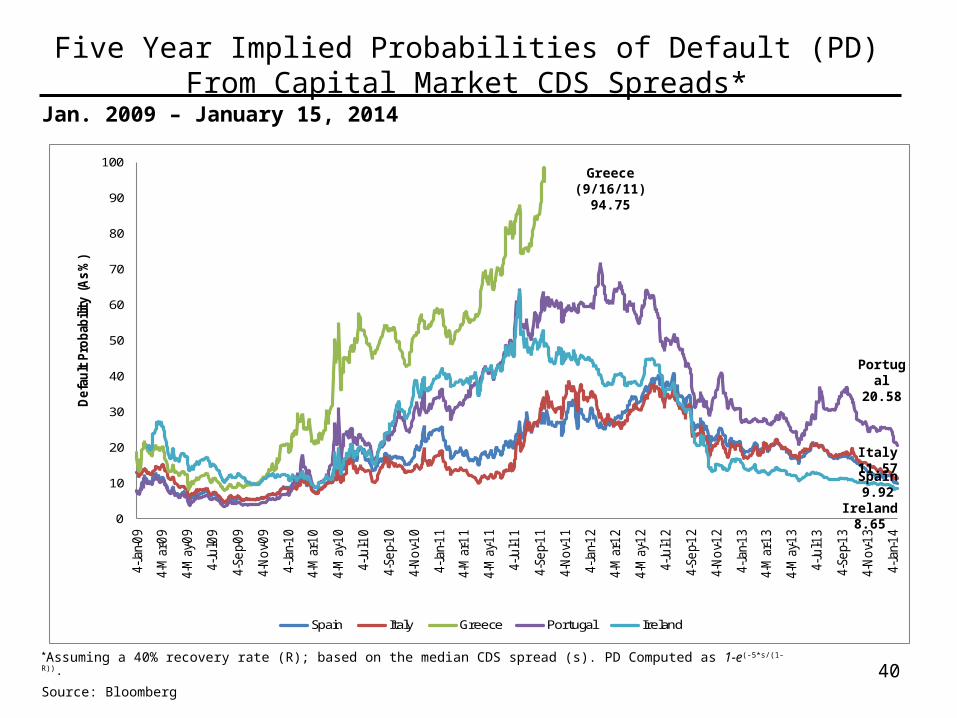
Jan. 2009 – January 15, 2014
*Assuming a 40% recovery rate (R); based on the median CDS spread (s). PD Computed as 1-e(-5*s/(1-R)).
Source: Bloomberg 40
Five Year Implied Probabilities of Default (PD) From Capital Market CDS Spreads*
0
10
20
30
40
50
60
70
80
90
100
4-Ja
n-0
9
4-M
ar-0
9
4-M
ay-0
9
4-Ju
l-09
4-Se
p-0
9
4-N
ov-0
9
4-Ja
n-1
0
4-M
ar-1
0
4-M
ay-1
0
4-Ju
l-10
4-Se
p-1
0
4-N
ov-1
0
4-Ja
n-1
1
4-M
ar-1
1
4-M
ay-1
1
4-Ju
l-11
4-Se
p-1
1
4-N
ov-1
1
4-Ja
n-1
2
4-M
ar-1
2
4-M
ay-1
2
4-Ju
l-12
4-Se
p-1
2
4-N
ov-1
2
4-Ja
n-1
3
4-M
ar-1
3
4-M
ay-1
3
4-Ju
l-13
4-Se
p-1
3
4-N
ov-1
3
4-Ja
n-1
4
De
fau
lt P
rob
abili
ty (
As
%)
Spain Italy Greece Portugal Ireland
Greece (9/16/11) 94.75
Portugal 20.58
Ireland 8.65
Italy 11.57
Spain 9.92
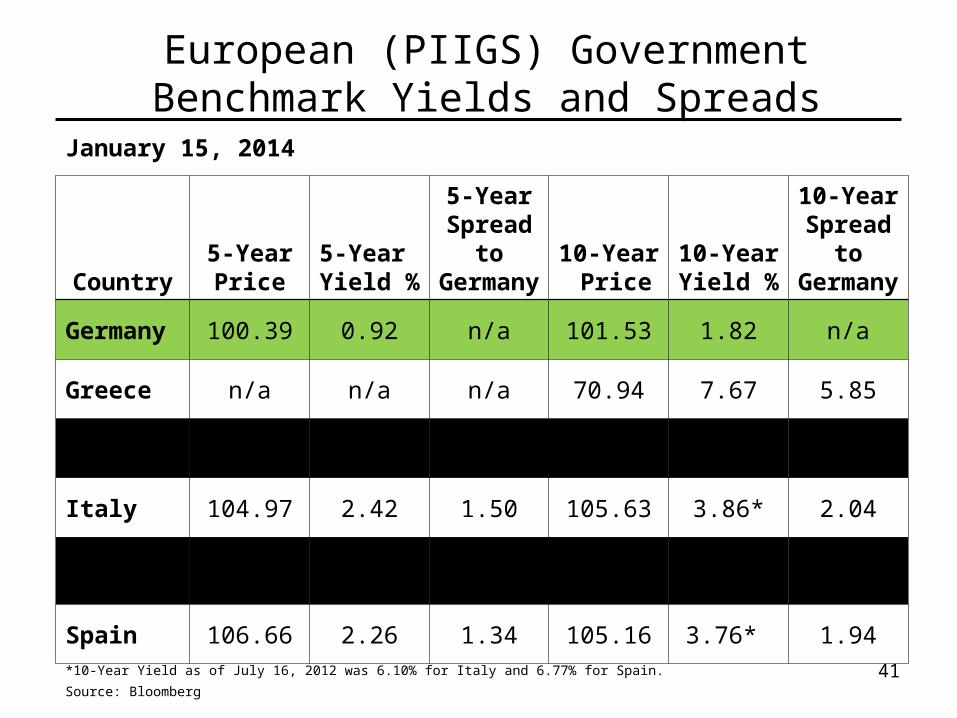
January 15, 2014
Country5-Year Price
5-Year Yield %
5-Year Spread to Germany
10-Year Price
10-Year Yield %
10-Year Spread to Germany
Germany 100.39 0.92 n/a 101.53 1.82 n/a
Greece n/a n/a n/a 70.94 7.67 5.85
Ireland 112.11 1.81 0.89 99.14 3.50 1.68
Italy 104.97 2.42 1.50 105.63 3.86* 2.04
Portugal 101.99 4.32 3.40 102.72 5.30 3.48
Spain 106.66 2.26 1.34 105.16 3.76* 1.94
*10-Year Yield as of July 16, 2012 was 6.10% for Italy and 6.77% for Spain. Source: Bloomberg
41
European (PIIGS) Government Benchmark Yields and Spreads

Sovereign Ratings Actions (Moody’s)2009 - Present
Greece
42
Rati
ngs
A1
B1
A2 A3
Ba1
Caa1
CaC
Caa3
Downgraded to SD by S&P, Dec. 2012
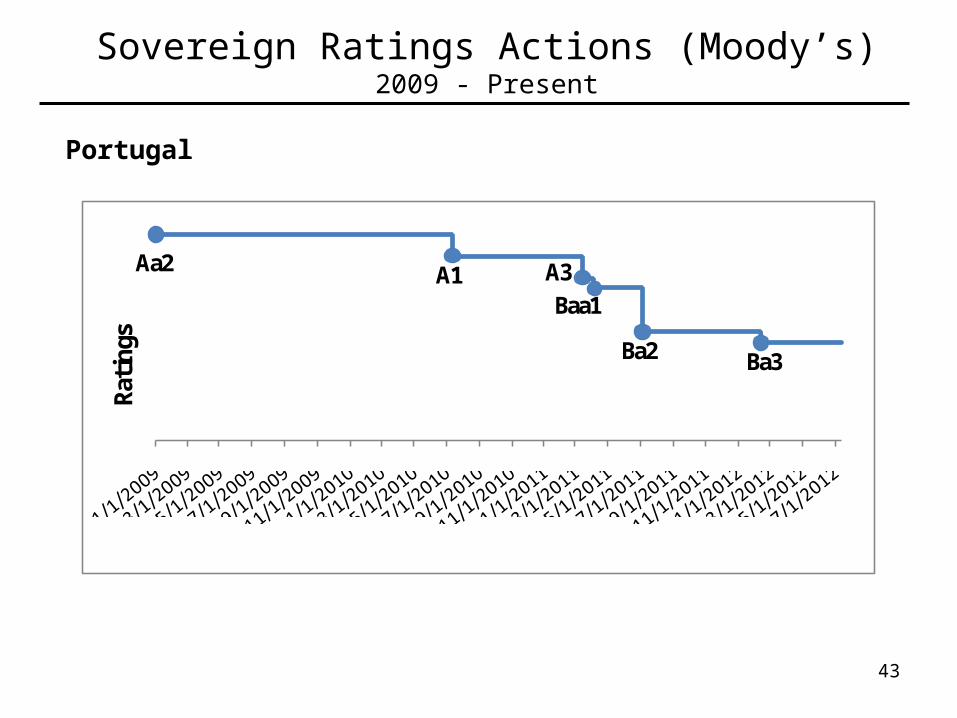
Portugal
Sovereign Ratings Actions (Moody’s)2009 - Present
43
Rati
ngs
Aa2 A1 A3Baa1
Ba2 Ba3

Ireland
Sovereign Ratings Actions (Moody’s)2009 - Present
44
Rati
ngs
AAAAa2
Baa1Baa3
Aa1
Ba1

Spain
Sovereign Ratings Actions (Moody’s)2009 - Present
45
Rati
ngs
AAAAa2Aa1
A1A3
Baa3
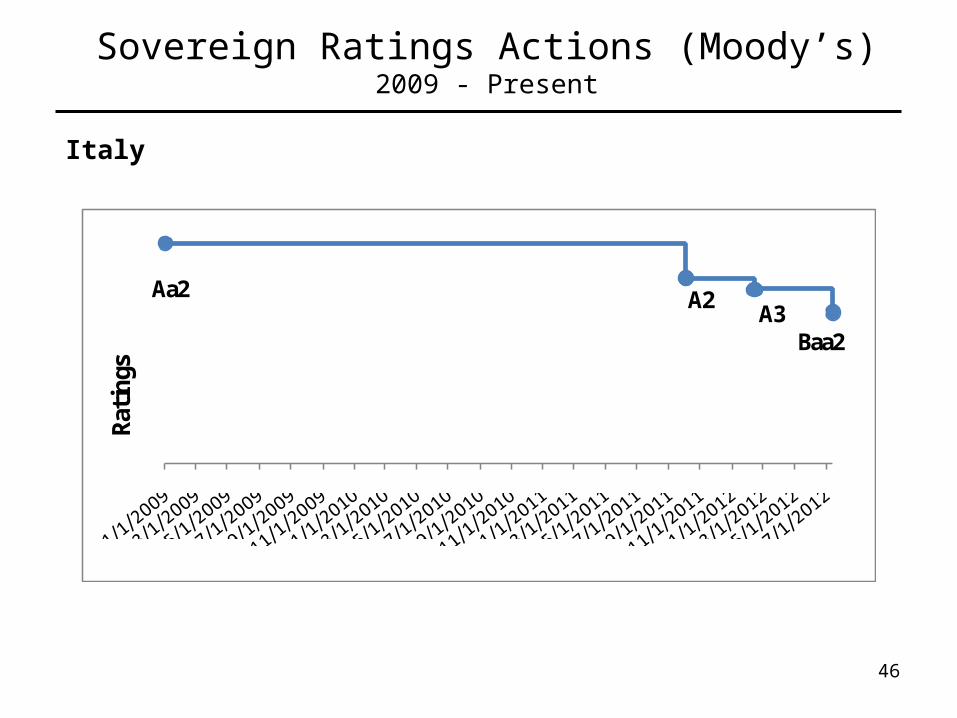
Italy
Sovereign Ratings Actions (Moody’s)2009 - Present
46
Rati
ngs
Aa2 A2 A3Baa2
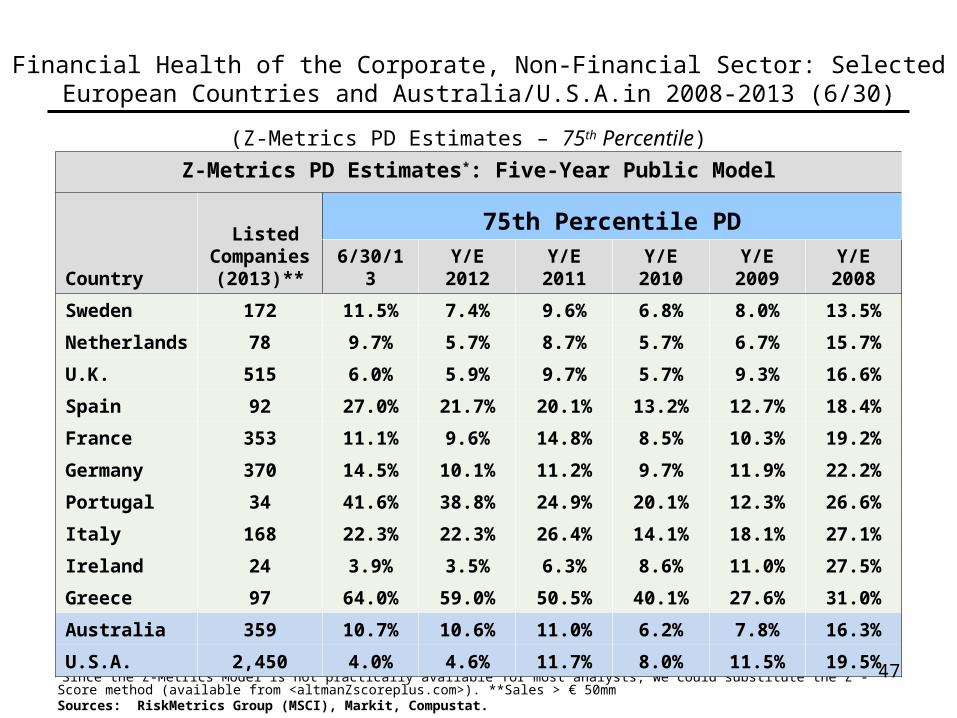
(Z-Metrics PD Estimates – 75th Percentile)
*Since the Z-Metrics Model is not practically available for most analysts, we could substitute the Z”-Score method (available from <altmanZscoreplus.com>). **Sales > € 50mmSources: RiskMetrics Group (MSCI), Markit, Compustat.
Z-Metrics PD Estimates*: Five-Year Public Model
Country
ListedCompanies
(2013)**
75th Percentile PD6/30/13 Y/E 2012 Y/E 2011 Y/E 2010 Y/E 2009 Y/E 2008
Sweden 172 11.5% 7.4% 9.6% 6.8% 8.0% 13.5%
Netherlands 78 9.7% 5.7% 8.7% 5.7% 6.7% 15.7%
U.K. 515 6.0% 5.9% 9.7% 5.7% 9.3% 16.6%
Spain 92 27.0% 21.7% 20.1% 13.2% 12.7% 18.4%
France 353 11.1% 9.6% 14.8% 8.5% 10.3% 19.2%
Germany 370 14.5% 10.1% 11.2% 9.7% 11.9% 22.2%
Portugal 34 41.6% 38.8% 24.9% 20.1% 12.3% 26.6%
Italy 168 22.3% 22.3% 26.4% 14.1% 18.1% 27.1%
Ireland 24 3.9% 3.5% 6.3% 8.6% 11.0% 27.5%
Greece 97 64.0% 59.0% 50.5% 40.1% 27.6% 31.0%
Australia 359 10.7% 10.6% 11.0% 6.2% 7.8% 16.3%
U.S.A. 2,450 4.0% 4.6% 11.7% 8.0% 11.5% 19.5%
Financial Health of the Corporate, Non-Financial Sector: Selected European Countries and Australia/U.S.A.in 2008-2013 (6/30)
47

Weighted Average Median 5-Year PD for Listed Non-Financial1 and Banking Firms2 (Europe & US): 2010
1 Based on Z-Metrics Default Probability Model.2 Based on Altman-Rijken Model (Preliminary)
Non-Financial Firms Banking Firms
Country PD (%) Weight PD (%) WeightWeighted
Average (%)Rank
CDS Spread PD (%)
Rank
Netherlands 2.5 0.977 11.1 0.023 2.70 1 2.03 1
Sweden 2.6 0.984 17.3 0.016 2.84 2 2.25 2
U.K. 3.7 0.977 15.5 0.023 3.97 3 4.73 6
Germany 3.9 0.983 13.1 0.017 4.06 4 2.50 3
France 4.0 0.986 14.0 0.014 4.14 5 4.51 5
U.S.A. 3.8 0.837 13.8 0.163 5.43 6 3.79 4
Spain 7.1 0.948 10.9 0.052 7.30 7 25.27 8
Italy 7.7 0.906 20.0 0.094 8.86 8 18.02 7
Portugal 9.9 0.971 12.1 0.029 9.96 9 34.05 9
Greece 18.7 0.921 30.1 0.079 19.60 10 59.14 10
48
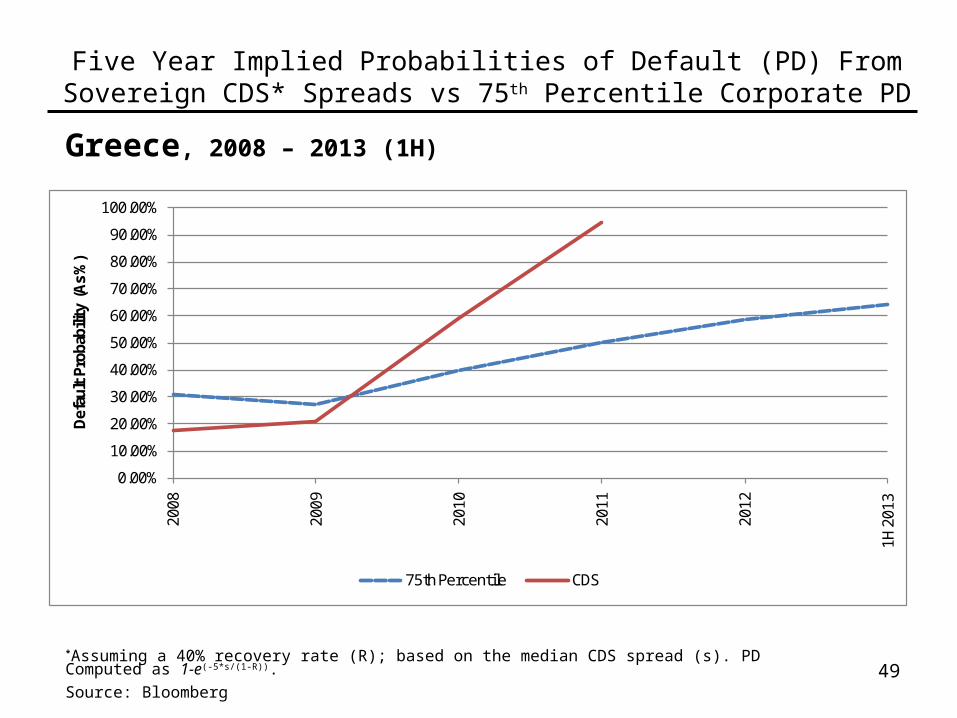
Five Year Implied Probabilities of Default (PD) From Sovereign CDS* Spreads vs 75th Percentile Corporate PD
Greece, 2008 – 2013 (1H)
49*Assuming a 40% recovery rate (R); based on the median CDS spread (s). PD Computed as 1-e(-5*s/(1-R)).
Source: Bloomberg
0.00%
10.00%
20.00%
30.00%
40.00%
50.00%
60.00%
70.00%
80.00%
90.00%
100.00%
2008
2009
2010
2011
2012
1H 2
013
Def
ault
Pro
babi
lity
(As
%)
75th Percentile CDS

Portugal, 2008 – 2013
Five Year Implied Probabilities of Default (PD) From Sovereign CDS* Spreads vs 75th Percentile Corporate PD
50*Assuming a 40% recovery rate (R); based on the median CDS spread (s). PD Computed as 1-e(-5*s/(1-R)).
Source: Bloomberg
0.00%
10.00%
20.00%
30.00%
40.00%
50.00%
60.00%
70.00%
2008
2009
2010
2011
2012
1H 2
013
2013
Def
ault
Pro
babi
lity
(As
%)
75th Percentile CDS
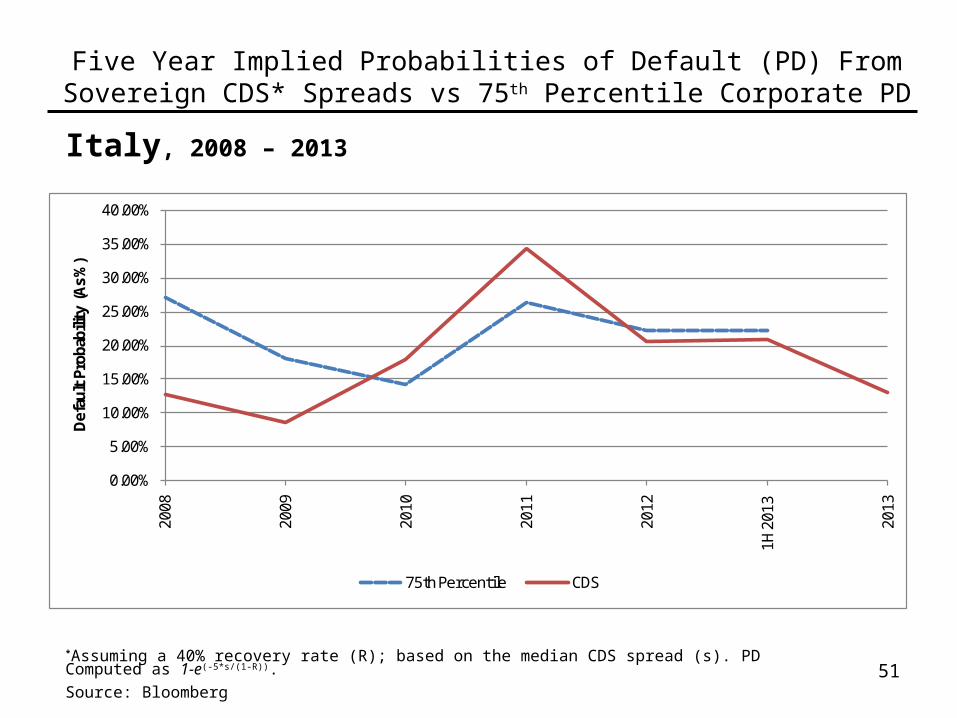
Italy, 2008 – 2013
Five Year Implied Probabilities of Default (PD) From Sovereign CDS* Spreads vs 75th Percentile Corporate PD
51*Assuming a 40% recovery rate (R); based on the median CDS spread (s). PD Computed as 1-e(-5*s/(1-R)).
Source: Bloomberg
0.00%
5.00%
10.00%
15.00%
20.00%
25.00%
30.00%
35.00%
40.00%
2008
2009
2010
2011
2012
1H 2
013
2013
Def
ault
Pro
babi
lity
(As
%)
75th Percentile CDS
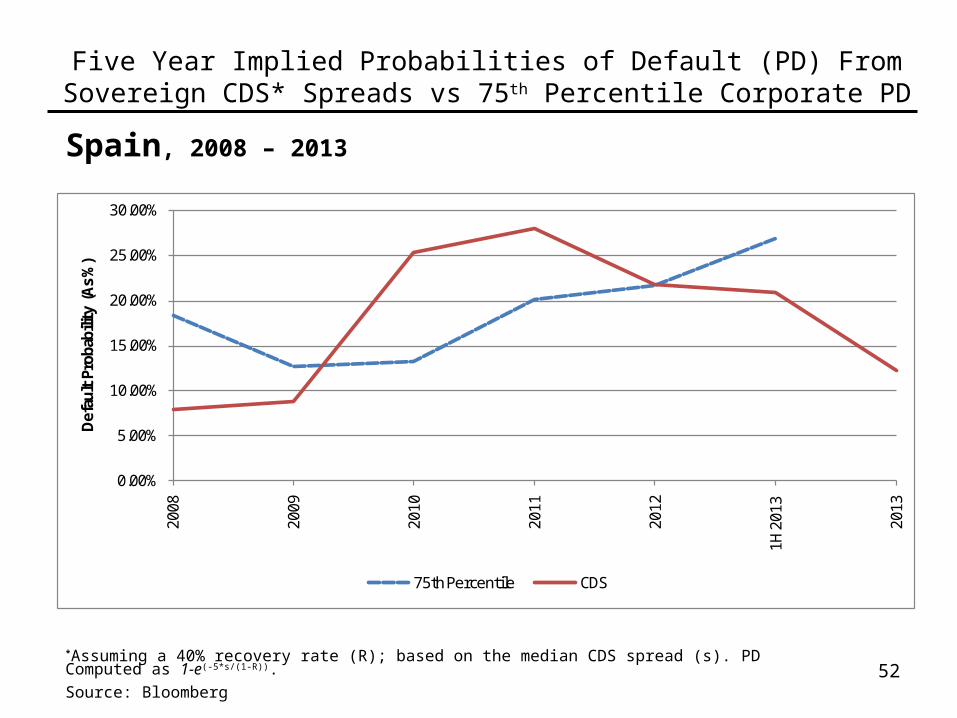
Spain, 2008 – 2013
Five Year Implied Probabilities of Default (PD) From Sovereign CDS* Spreads vs 75th Percentile Corporate PD
52*Assuming a 40% recovery rate (R); based on the median CDS spread (s). PD Computed as 1-e(-5*s/(1-R)).
Source: Bloomberg
0.00%
5.00%
10.00%
15.00%
20.00%
25.00%
30.00%
2008
2009
2010
2011
2012
1H 2
013
2013
Def
ault
Pro
babi
lity
(As
%)
75th Percentile CDS

Ireland, 2008 – 2013
Five Year Implied Probabilities of Default (PD) From Sovereign CDS* Spreads vs 75th Percentile Corporate PD
53*Assuming a 40% recovery rate (R); based on the median CDS spread (s). PD Computed as 1-e(-5*s/(1-R)).
Source: Bloomberg
0.00%
5.00%
10.00%
15.00%
20.00%
25.00%
30.00%
35.00%
40.00%
45.00%
50.00%
2008
2009
2010
2011
2012
1H 2
013
2013
Def
ault
Pro
babi
lity
(As
%)
75th Percentile CDS
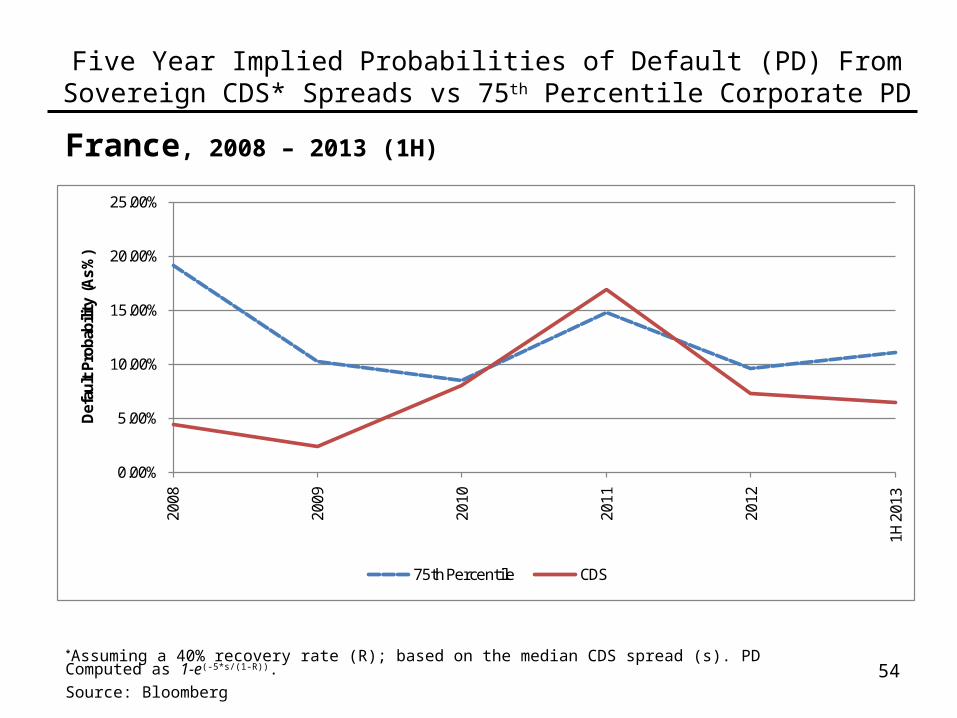
France, 2008 – 2013 (1H)
Five Year Implied Probabilities of Default (PD) From Sovereign CDS* Spreads vs 75th Percentile Corporate PD
54*Assuming a 40% recovery rate (R); based on the median CDS spread (s). PD Computed as 1-e(-5*s/(1-R)).
Source: Bloomberg
0.00%
5.00%
10.00%
15.00%
20.00%
25.00%
2008
2009
2010
2011
2012
1H 2
013
Def
ault
Pro
babi
lity
(As
%)
75th Percentile CDS
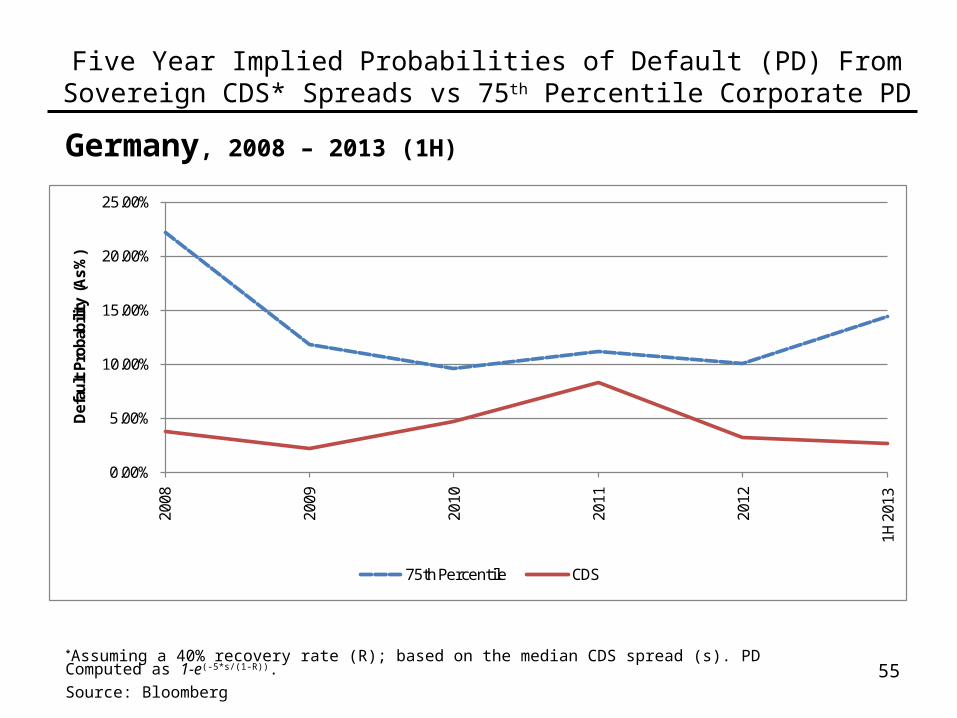
Germany, 2008 – 2013 (1H)
Five Year Implied Probabilities of Default (PD) From Sovereign CDS* Spreads vs 75th Percentile Corporate PD
55*Assuming a 40% recovery rate (R); based on the median CDS spread (s). PD Computed as 1-e(-5*s/(1-R)).
Source: Bloomberg
0.00%
5.00%
10.00%
15.00%
20.00%
25.00%
2008
2009
2010
2011
2012
1H 2
013
Def
ault
Pro
babi
lity
(As
%)
75th Percentile CDS

ASIA ANALYSIS
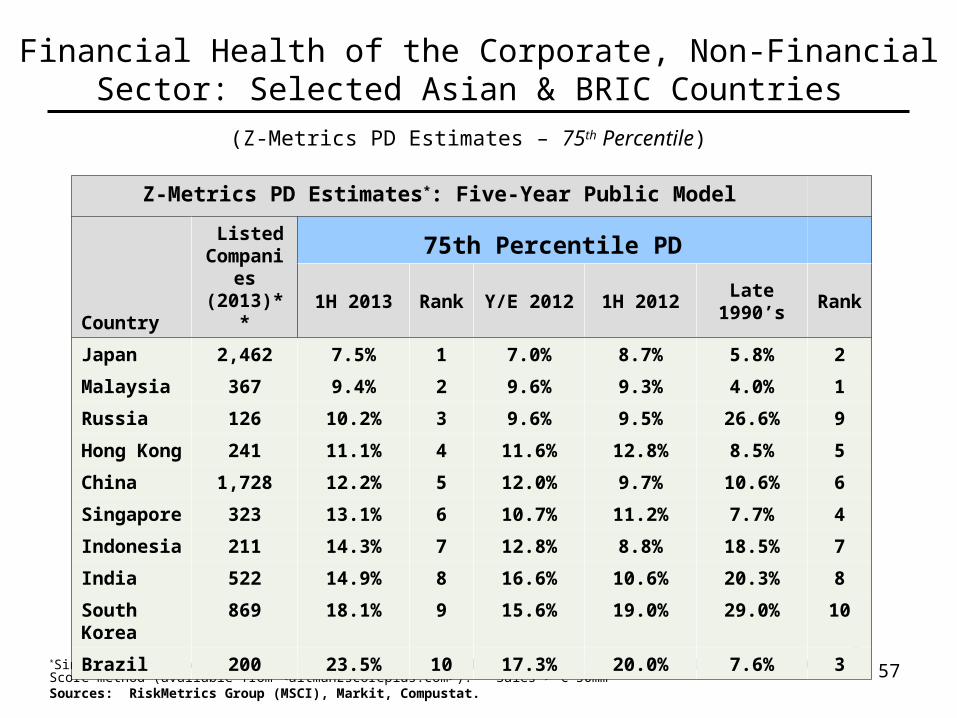
(Z-Metrics PD Estimates – 75th Percentile)
*Since the Z-Metrics Model is not practically available for most analysts, we could substitute the Z”-Score method (available from <altmanZscoreplus.com>). **Sales > € 50mmSources: RiskMetrics Group (MSCI), Markit, Compustat.
Z-Metrics PD Estimates*: Five-Year Public Model
Country
ListedCompanies
(2013)**
75th Percentile PD1H 2013 Rank Y/E 2012 1H 2012 Late 1990’s Rank
Japan 2,462 7.5% 1 7.0% 8.7% 5.8% 2
Malaysia 367 9.4% 2 9.6% 9.3% 4.0% 1
Russia 126 10.2% 3 9.6% 9.5% 26.6% 9
Hong Kong 241 11.1% 4 11.6% 12.8% 8.5% 5
China 1,728 12.2% 5 12.0% 9.7% 10.6% 6
Singapore 323 13.1% 6 10.7% 11.2% 7.7% 4
Indonesia 211 14.3% 7 12.8% 8.8% 18.5% 7
India 522 14.9% 8 16.6% 10.6% 20.3% 8
South Korea 869 18.1% 9 15.6% 19.0% 29.0% 10
Brazil 200 23.5% 10 17.3% 20.0% 7.6% 3
Financial Health of the Corporate, Non-Financial Sector: Selected Asian & BRIC Countries
57
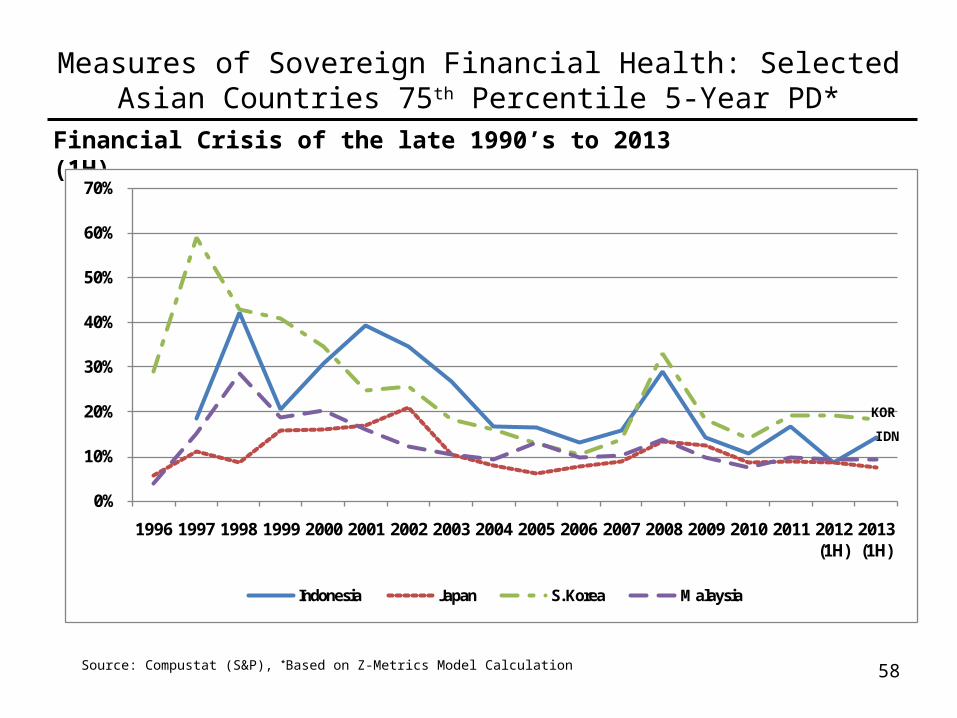
Measures of Sovereign Financial Health: Selected Asian Countries 75th Percentile 5-Year PD*
Source: Compustat (S&P), *Based on Z-Metrics Model Calculation
Financial Crisis of the late 1990’s to 2013 (1H)
58
0%
10%
20%
30%
40%
50%
60%
70%
1996 1997 1998 1999 2000 2001 2002 2003 2004 2005 2006 2007 2008 2009 2010 2011 2012 (1H)
2013 (1H)
Indonesia Japan S. Korea Malaysia
KOR
IDN

Measures of Sovereign Financial Health: BIRCHS Countries 75th Percentile 5-Year PD*
Financial Crisis of the late 1990’s to 2013 (1H)
59Source: Compustat (S&P), *Based on Z-Metrics Model Calculation
0%
5%
10%
15%
20%
25%
30%
35%
40%
1996 1997 1998 1999 2000 2001 2002 2003 2004 2005 2006 2007 2008 2009 2010 2011 2012 (1H)
2013 (1H)
Brazil China Hong Kong India Russia Singapore
BRA
IND

India, 2008 – 2013 (10/25)
Five Year Implied Probabilities of Default (PD) From CDS* Spreads vs 75th Percentile Corporate PD
60*State Bank of India. Assuming a 40% recovery rate (R); based on the median CDS spread (s). PD Computed as 1-e(-5*s/(1-R)).
Source: Bloomberg
0.00%
5.00%
10.00%
15.00%
20.00%
25.00%
30.00%
2008
2009
2010
2011
2012
1H 2
013
3Q 2
013
Def
ault
Pro
babi
lity
(As
%)
75th Percentile CDS
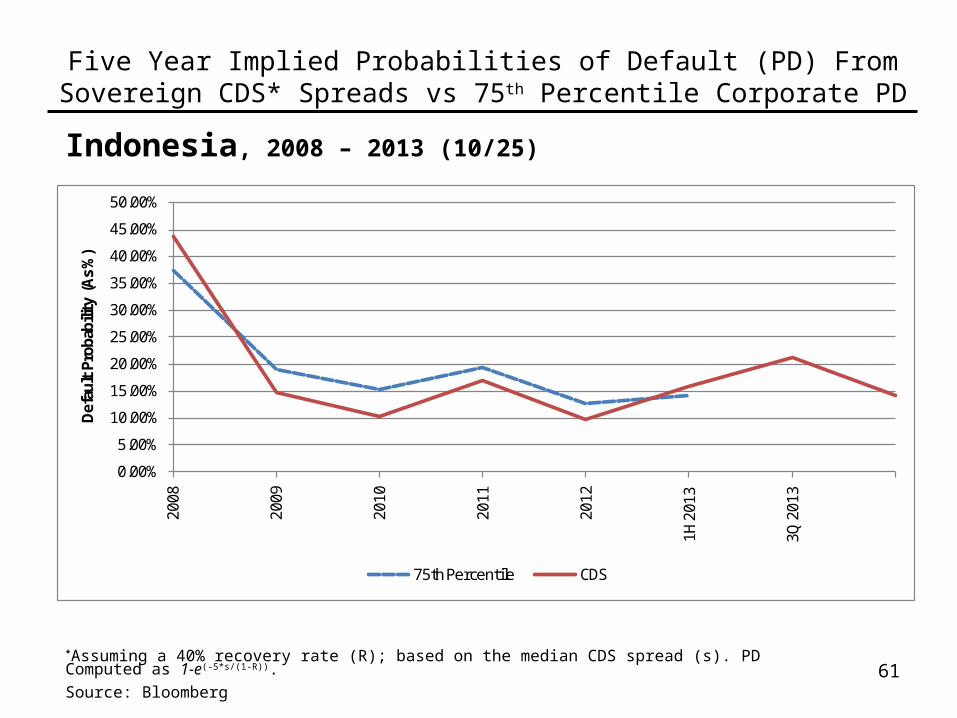
Indonesia, 2008 – 2013 (10/25)
Five Year Implied Probabilities of Default (PD) From Sovereign CDS* Spreads vs 75th Percentile Corporate PD
61*Assuming a 40% recovery rate (R); based on the median CDS spread (s). PD Computed as 1-e(-5*s/(1-R)).
Source: Bloomberg
0.00%
5.00%
10.00%
15.00%
20.00%
25.00%
30.00%
35.00%
40.00%
45.00%
50.00%
2008
2009
2010
2011
2012
1H 2
013
3Q 2
013
Def
ault
Pro
babi
lity
(As
%)
75th Percentile CDS
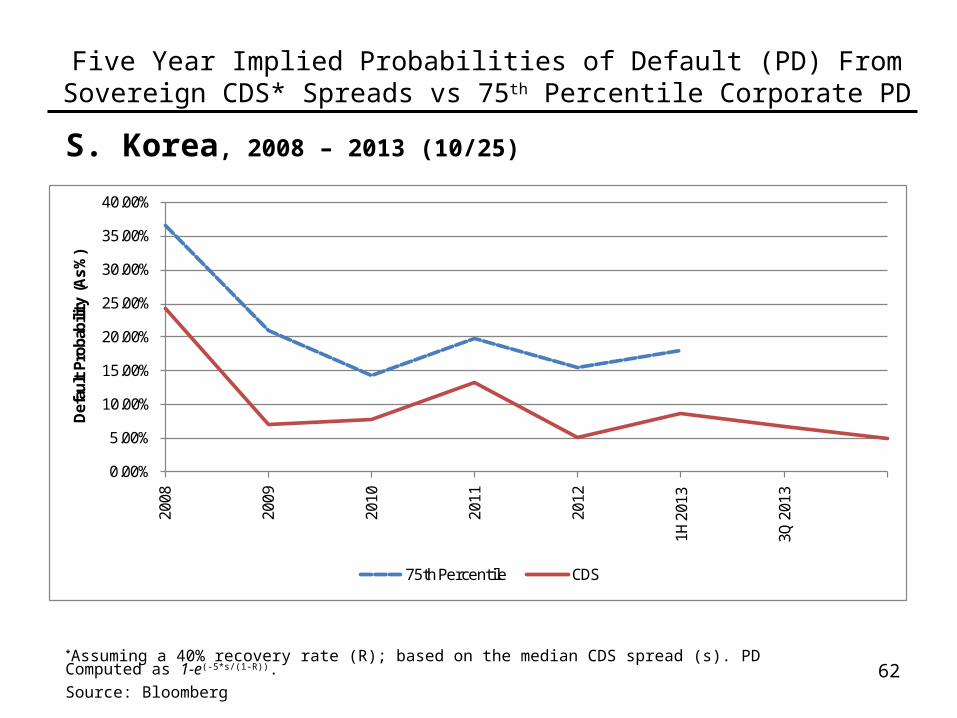
S. Korea, 2008 – 2013 (10/25)
Five Year Implied Probabilities of Default (PD) From Sovereign CDS* Spreads vs 75th Percentile Corporate PD
62*Assuming a 40% recovery rate (R); based on the median CDS spread (s). PD Computed as 1-e(-5*s/(1-R)).
Source: Bloomberg
0.00%
5.00%
10.00%
15.00%
20.00%
25.00%
30.00%
35.00%
40.00%
2008
2009
2010
2011
2012
1H 2
013
3Q 2
013
Def
ault
Pro
babi
lity
(As
%)
75th Percentile CDS

China, 2008 – 2013 (10/25)
Five Year Implied Probabilities of Default (PD) From Sovereign CDS* Spreads vs 75th Percentile Corporate PD
63*Assuming a 40% recovery rate (R); based on the median CDS spread (s). PD Computed as 1-e(-5*s/(1-R)).
Source: Bloomberg
0.00%
5.00%
10.00%
15.00%
20.00%
25.00%
30.00%
2008
2009
2010
2011
2012
1H 2
013
3Q 2
013
Def
ault
Pro
babi
lity
(As
%)
75th Percentile CDS

64
Major Risks Going Forward(For 2014)
• Global Economy Slowdown – Primarily U.S. (Double-Dip?): Impact on Default & Recovery Rates, Credit Availability & Credit Quality
– China– Europe
• Sovereign Debt Crisis – Europe (Asia?)– Calm in Late 2012-2013– Looming Corporate Defaults Despite Low (2012) Default Rate?– Survival of the Euro?– Problems in India and Indonesia, Brazil?
• Fed Balance Sheet, Money Supply and Inflation
• LBO and Covenant-Lite Risk
• Role of Collateral in the Global Financial System
• Contagion Between Markets – Debt and Equity
• Increased Investor Leverage in Stock Markets Similar to 2007
• Political Paralysis – Deficit/Debt Levels
• U.S. Municipal Bond & Federal Government Default Risk
• Uncertainties (non-quantifiable)
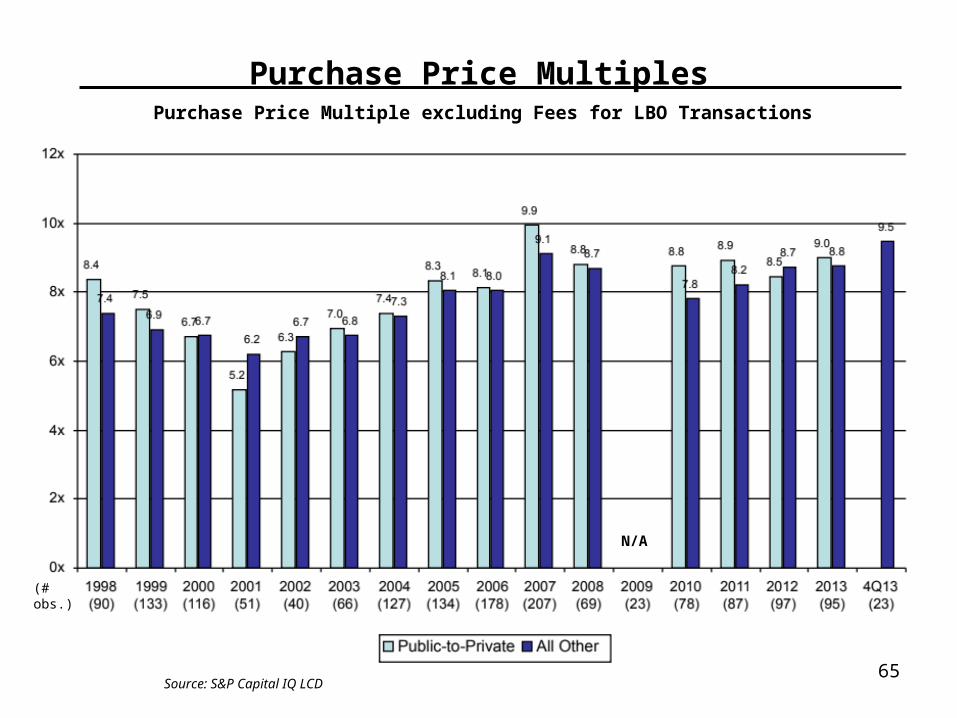
65Source: S&P Capital IQ LCD
Purchase Price Multiple excluding Fees for LBO Transactions
Purchase Price Multiples
N/A
(# obs.)

66
Average Total Debt Leverage Ratio for LBO’s: Europe and US with EBITDA of €/$50M or More
Source: S&P Capital IQ LCD
4.74.4 4.3 4.4 4.5
4.8
5.5
5.8
6.6
5.3
4.54.6
4.8
4.5
4.94.9
4.34.1 4.1
4.74.9
5.45.5
6.2
4.9
4.0
4.7
5.2 5.35.4
0.0x
1.0x
2.0x
3.0x
4.0x
5.0x
6.0x
7.0x
1999 2000 2001 2002 2003 2004 2005 2006 2007 2008 2009 2010 2011 2012 2013
Europe US
Default RateForecasting
67

Method 1:
Mortality Approach
68
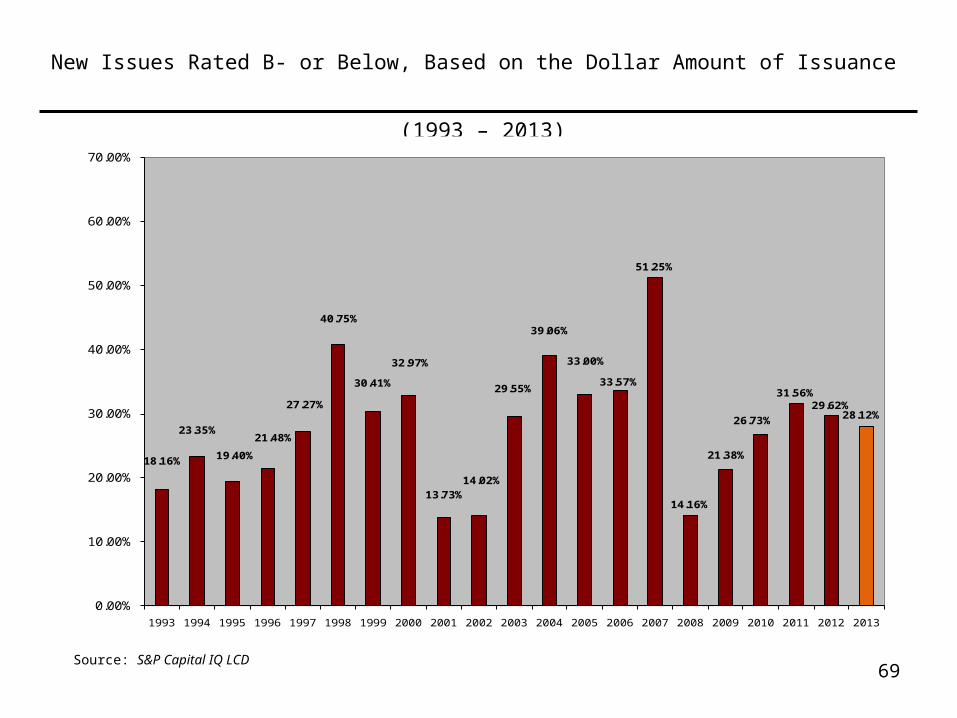
New Issues Rated B- or Below, Based on the Dollar Amount of Issuance
(1993 – 2013)
Source: S&P Capital IQ LCD69
18.16%
23.35%
19.40%
21.48%
27.27%
40.75%
30.41%
32.97%
13.73%14.02%
29.55%
39.06%
33.00%
33.57%
51.25%
14.16%
21.38%
26.73%
31.56%29.62%
28.12%
0.00%
10.00%
20.00%
30.00%
40.00%
50.00%
60.00%
70.00%
1993 1994 1995 1996 1997 1998 1999 2000 2001 2002 2003 2004 2005 2006 2007 2008 2009 2010 2011 2012 2013

70707070
Marginal and CumulativeMortality Rate Equation
One can measure the cumulative mortality rate (CMR) over a specific time period (1,2,…, T years) by subtracting the product of the surviving
populations of each of the previous years from one (1.0), that is,
MMR(t) =Total value of defaulting debt in year (t)
total value of the population at the start of the year (t)
MMR = Marginal Mortality Rate
CMR(t) = 1 - SR(t) ,t = 1
here CMR (t) = Cumulative Mortality Rate in (t),SR (t) = Survival Rate in (t) , 1 - MMR (t)

71717171
Source: Altman Mortality Tables (1971-2012) Source: Altman Mortality Tables (1971-2012)
Default Lag After Issuance: ‘B’ & ‘CCC’ Rated Corporate Bonds
2.94%
7.90%
5.81%
4.53%
3.64%
2.13%1.80%
0.79%
7.95%7.84%
0.0%
1.0%
2.0%
3.0%
4.0%
5.0%
6.0%
7.0%
8.0%
9.0%
1 2 3 4 5 6 7 8 9 10
Years after Issuance
De
fau
lt R
ate
Default Lag after Issuance for ‘B’
Ratings
8.25%
12.55%
18.15%16.40%
4.75%
11.70%
5.44% 4.91%
0.72%
4.36%
0.0%
2.0%
4.0%
6.0%
8.0%
10.0%
12.0%
14.0%
16.0%
18.0%
20.0%
1 2 3 4 5 6 7 8 9 10
Years after IssuanceD
efa
ult
Ra
te
Default Lag after Issuance for ‘CCC’
Ratings
72
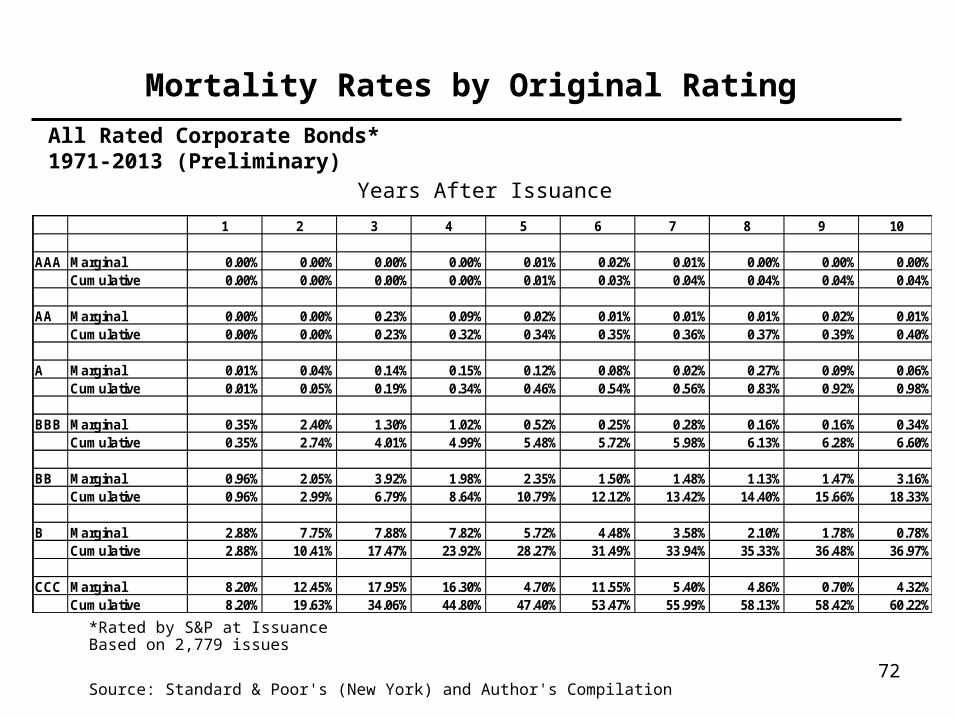
All Rated Corporate Bonds*1971-2013 (Preliminary)
Mortality Rates by Original Rating
*Rated by S&P at IssuanceBased on 2,779 issues
Source: Standard & Poor's (New York) and Author's Compilation
Years After Issuance
1 2 3 4 5 6 7 8 9 10
AAA Marginal 0.00% 0.00% 0.00% 0.00% 0.01% 0.02% 0.01% 0.00% 0.00% 0.00%Cumulative 0.00% 0.00% 0.00% 0.00% 0.01% 0.03% 0.04% 0.04% 0.04% 0.04%
AA Marginal 0.00% 0.00% 0.23% 0.09% 0.02% 0.01% 0.01% 0.01% 0.02% 0.01%Cumulative 0.00% 0.00% 0.23% 0.32% 0.34% 0.35% 0.36% 0.37% 0.39% 0.40%
A Marginal 0.01% 0.04% 0.14% 0.15% 0.12% 0.08% 0.02% 0.27% 0.09% 0.06%Cumulative 0.01% 0.05% 0.19% 0.34% 0.46% 0.54% 0.56% 0.83% 0.92% 0.98%
BBB Marginal 0.35% 2.40% 1.30% 1.02% 0.52% 0.25% 0.28% 0.16% 0.16% 0.34%Cumulative 0.35% 2.74% 4.01% 4.99% 5.48% 5.72% 5.98% 6.13% 6.28% 6.60%
BB Marginal 0.96% 2.05% 3.92% 1.98% 2.35% 1.50% 1.48% 1.13% 1.47% 3.16%Cumulative 0.96% 2.99% 6.79% 8.64% 10.79% 12.12% 13.42% 14.40% 15.66% 18.33%
B Marginal 2.88% 7.75% 7.88% 7.82% 5.72% 4.48% 3.58% 2.10% 1.78% 0.78%Cumulative 2.88% 10.41% 17.47% 23.92% 28.27% 31.49% 33.94% 35.33% 36.48% 36.97%
CCC Marginal 8.20% 12.45% 17.95% 16.30% 4.70% 11.55% 5.40% 4.86% 0.70% 4.32%Cumulative 8.20% 19.63% 34.06% 44.80% 47.40% 53.47% 55.99% 58.13% 58.42% 60.22%

73
All Rated Corporate Bonds*1971-2013 (Preliminary)
Mortality Losses by Original Rating
*Rated by S&P at IssuanceBased on 2,290 issues
Source: Standard & Poor's (New York) and Author's Compilation
Years After Issuance1 2 3 4 5 6 7 8 9 10
AAA Marginal 0.00% 0.00% 0.00% 0.00% 0.01% 0.01% 0.01% 0.00% 0.00% 0.00%Cumulative 0.00% 0.00% 0.00% 0.00% 0.01% 0.02% 0.03% 0.03% 0.03% 0.03%
AA Marginal 0.00% 0.00% 0.03% 0.03% 0.01% 0.01% 0.00% 0.01% 0.01% 0.01%Cumulative 0.00% 0.00% 0.03% 0.06% 0.07% 0.08% 0.08% 0.09% 0.10% 0.11%
A Marginal 0.00% 0.02% 0.06% 0.07% 0.07% 0.04% 0.02% 0.03% 0.06% 0.03%Cumulative 0.00% 0.02% 0.08% 0.15% 0.22% 0.26% 0.28% 0.31% 0.37% 0.40%
BBB Marginal 0.25% 1.56% 0.78% 0.60% 0.28% 0.15% 0.17% 0.10% 0.10% 0.19%Cumulative 0.25% 1.81% 2.57% 3.16% 3.43% 3.57% 3.74% 3.83% 3.93% 4.11%
BB Marginal 0.57% 1.19% 2.33% 1.13% 1.34% 0.72% 0.80% 0.50% 0.76% 1.12%Cumulative 0.57% 1.75% 4.04% 5.13% 6.40% 7.07% 7.82% 8.28% 8.97% 9.99%
B Marginal 1.93% 5.42% 5.35% 5.23% 3.78% 2.46% 2.33% 1.16% 0.93% 0.54%Cumulative 1.93% 7.25% 12.21% 16.80% 19.94% 21.91% 23.73% 24.62% 25.32% 25.72%
CCC Marginal 5.41% 8.71% 12.56% 11.48% 3.33% 8.66% 4.05% 3.40% 0.43% 2.76%Cumulative 5.41% 13.65% 24.49% 33.16% 35.39% 40.98% 43.37% 45.30% 45.53% 47.04%

Methods 2 & 3:
Market-Based Measures
74

75
The regression equation is
Default Rate = - 3.27 + 1.33 * Spread
Predictor Coef SE Coef T P
Constant -3.2748 0.9693 -3.3782 0.0019
Spread 1.3274 0.1853 7.1642 0.0000
S = 2.0064 R-Sq = 61.6% R-Sq(adj) = 60.4%
Application
Yield spread (12/30/2011) of 654bp, forecast PD for 2012 = 4.80% vs. actual of 1.62%
Yield spread (12/31/2012) of 506bp, forecast PD for 12/31/2013 = 3.32% vs. actual of 1.04%
Yield spread (12/31/2013) of 345bp, forecast PD for 12/31/2014 = 1.30%
Yield spread (01/15/2014) of 346bp, forecast PD for 01/15/2015 = 1.32%
Updated Market-Based Annual Default Rate ForecastAnnual Default Rate (t+1) versus High-Yield Spreads (t)
Sources: Slides 3 & 8 and authors’ compilations
0
2
4
6
8
10
12
14
0 2 4 6 8 10 12
Def
ault
Rat
e (t
+1) %
Yield-Spread (t) %
Annual Default Rates (t+1) vs. Yield-Spreads (t) (1978-2012)
y = 1.3274x - 3.2748 R2 = 0.6160

Distress Ratio History2000 – 2013 (Preliminary)
Date Distress RatioAnnual Default Rate
(t+1)
Default Rate(t+1)
/Distress Ratio(t) (%)
12/31/2000 37.33 9.80 26.25
12/31/2001 24.36 12.79 52.52
12/31/2002 31.21 4.66 14.93
12/31/2003 8.40 1.25 14.86
12/31/2004 4.96 3.37 68.05
12/31/2005 5.47 0.76 13.92
12/31/2006 1.62 0.51 31.44
12/31/2007 10.35 4.65 44.97
12/31/2008 81.29 10.74 13.22
12/31/2009 14.53 1.13 7.78
12/31/2010 7.19 1.33 18.43
12/31/2011 17.88 1.62 9.06
12/31/2012 9.88 1.04 10.57
12/31/2013 5.29 n/a n/a
Average 19.58 4.13 21.09
Median 10.35 1.62 14.93Sources: Bank of America Merrill Lynch & NYU Salomon Center
76
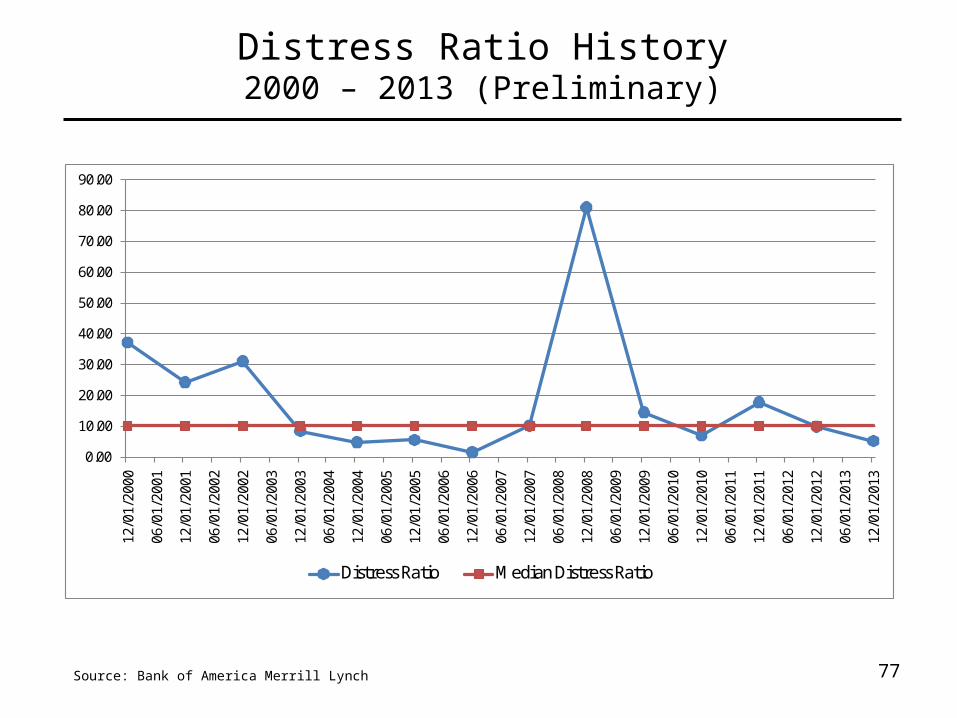
Distress Ratio History2000 – 2013 (Preliminary)
Source: Bank of America Merrill Lynch 77
0.00
10.00
20.00
30.00
40.00
50.00
60.00
70.00
80.00
90.00
12/0
1/20
00
06/0
1/20
01
12/0
1/20
01
06/0
1/20
02
12/0
1/20
02
06/0
1/20
03
12/0
1/20
03
06/0
1/20
04
12/0
1/20
04
06/0
1/20
05
12/0
1/20
05
06/0
1/20
06
12/0
1/20
06
06/0
1/20
07
12/0
1/20
07
06/0
1/20
08
12/0
1/20
08
06/0
1/20
09
12/0
1/20
09
06/0
1/20
10
12/0
1/20
10
06/0
1/20
11
12/0
1/20
11
06/0
1/20
12
12/0
1/20
12
06/0
1/20
13
12/0
1/20
13
Distress Ratio Median Distress Ratio

Estimated Size of the Distressed Bond Market Based on Distress Ratio
10255
16 5 18 21 9 1064 73
223158
236
69 46 5916
111
887
168
88
242
12074
-
150
300
450
600
750
900
1,050
1,200
1,350
1,500 19
90
1991
1992
1993
1994
1995
1996
1997
1998
1999
2000
2001
2002
2003
2004
2005
2006
2007
2008
2009
2010
2011
2012
2013
$ B
illio
ns
HY Bond Mkt Distressed Bond Mkt
Sources: Distress Ratio used in calculations from BofAML. HY Bond Market size from NYU Salomon Center estimates.78
79
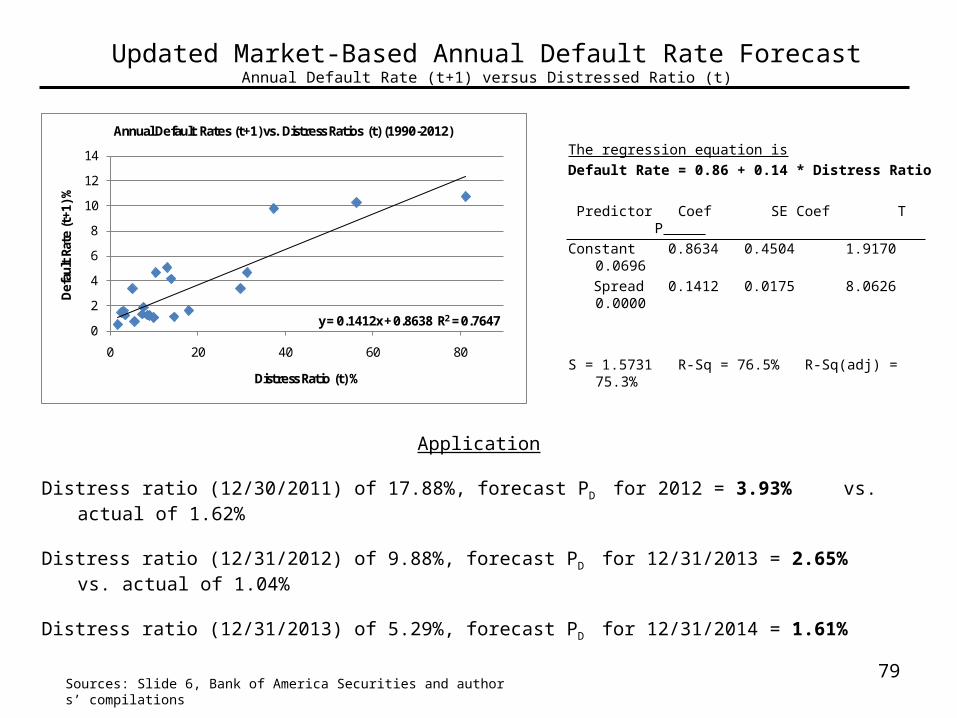
Updated Market-Based Annual Default Rate ForecastAnnual Default Rate (t+1) versus Distressed Ratio (t)
Application
Distress ratio (12/30/2011) of 17.88%, forecast PD for 2012 = 3.93% vs. actual of 1.62%
Distress ratio (12/31/2012) of 9.88%, forecast PD for 12/31/2013 = 2.65% vs. actual of 1.04%
Distress ratio (12/31/2013) of 5.29%, forecast PD for 12/31/2014 = 1.61%
The regression equation is
Default Rate = 0.86 + 0.14 * Distress Ratio
Predictor Coef SE Coef T P
Constant 0.8634 0.4504 1.9170 0.0696
Spread 0.1412 0.0175 8.0626 0.0000
S = 1.5731 R-Sq = 76.5% R-Sq(adj) = 75.3%
Sources: Slide 6, Bank of America Securities and authors’ compilations
0
2
4
6
8
10
12
14
0 20 40 60 80
Def
ault
Rat
e (t
+1) %
Distress Ratio (t) %
Annual Default Rates (t+1) vs. Distress Ratios (t) (1990-2012)
y = 0.1412x + 0.8638 R2 = 0.7647

Default and Recovery Forecasts: Summary of Forecast Models
Source: All Corporate Bond Issuance and Authors’ Estimates of Market Size in 2013 & 2014.
Model
2013 (12/31) Default Rate
Forecast as of 12/31/2012
2014 (12/31) Default Rate Forecast as
of 12/31/2013
2015 (01/15) Default Rate Forecast as
of 01/15/2014
Mortality Rate 3.73% 3.25% 3.25%
Yield-Spread 3.32%a 1.30%c 1.32%e
Distress Ratio 2.65%b 1.61%d 1.61%f
Average of Models
Recovery Rates*
3.23%
39.7%
2.05%
44.5%
2.06%
44.5%
* Recovery rate based on the log Linear equation between default and recovery rates, see Altman, et al (2005) Journal of Business, November and Slide 80. a Based on Dec. 31, 2012 yield-spread of 505.8bp. b Based on Dec. 31, 2011 Distress Ratio of 9.88%. e Based on Dec.31, 2013 yield-spread of 344.6bp. d Based on Dec. 31, 2013 Distress Ratio of 5.29%. e Based on Jan. 15, 2014 yield-spread of 346.0bp. f Based on Dec. 31, 2013 Distress Ratio of 5.29%.
80

Recovery Rate Analysis
81

828282
Default Rates and Lossesa
1978 – 2013 (Preliminary)
YearPar Value
Outstanding ($MM)Par Value
Defaults ($MM)Default
Rate (%)Weighted Price
After Default ($)Weighted
Coupon (%)Default
Loss (%)2013 1,392,212 14,539 1.04 53.6 10.04 0.542012 1,212,362 19,647 1.62 57.8 8.97 0.762011 1,354,649 17,963 1.33 60.3 9.10 0.592010 1,221,569 13,809 1.13 46.6 10.59 0.662009 1,152,952 123,878 10.74 36.1 8.16 7.302008 1,091,000 50,763 4.65 42.5 8.23 2.832007 1,075,400 5,473 0.51 66.6 9.64 0.192006 993,600 7,559 0.76 65.3 9.33 0.302005 1,073,000 36,209 3.37 61.1 8.61 1.462004 933,100 11,657 1.25 57.7 10.30 0.612003 825,000 38,451 4.66 45.5 9.55 2.762002 757,000 96,858 12.79 25.3 9.37 10.152001 649,000 63,609 9.80 25.5 9.18 7.762000 597,200 30,248 5.06 26.4 8.54 3.941999 567,400 23,532 4.15 27.9 10.55 3.211998 465,500 7,464 1.60 35.9 9.46 1.101997 335,400 4,200 1.25 54.2 11.87 0.651996 271,000 3,336 1.23 51.9 8.92 0.651995 240,000, 4,551 1.90 40.6 11.83 1.241994 235,000 3,418 1.45 39.4 10.25 0.961993 206,907 2,287 1.11 56.6 12.98 0.561992 163,000 5,545 3.40 50.1 12.32 1.911991 183,600 18,862 10.27 36.0 11.59 7.161990 181,000 18,354 10.14 23.4 12.94 8.421989 189,258 8,110 4.29 38.3 13.40 2.931988 148,187 3,944 2.66 43.6 11.91 1.661987 129,557 7,486 5.78 75.9 12.07 1.741986 90,243 3,156 3.50 34.5 10.61 2.481985 58,088 992 1.71 45.9 13.69 1.041984 40,939 344 0.84 48.6 12.23 0.481983 27,492 301 1.09 55.7 10.11 0.541982 18,109 577 3.19 38.6 9.61 2.111981 17,115 27 0.16 12.0 15.75 0.151980 14,935 224 1.50 21.1 8.43 1.251979 10,356 20 0.19 31.0 10.63 0.141978 8,946 119 1.33 60.0 8.38 0.59
Arithmetic Average 1978 – 2013 3.37 45.87 10.53 2.24Weighted Average 1978 - 2013 3.53 2.34
a Excludes defaulted issues..
Source: Authors’ compilations and various dealer price quotes.
82
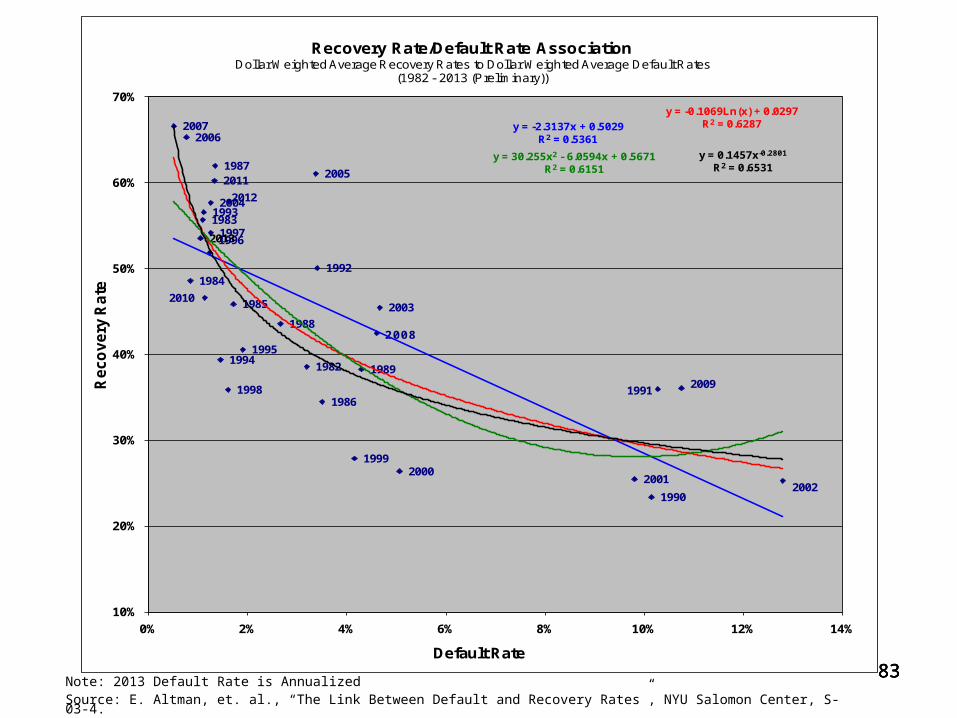
83838383Note: 2013 Default Rate is AnnualizedSource: E. Altman, et. al., “The Link Between Default and Recovery Rates”, NYU Salomon Center, S-03-4.
2005
2004
2003
20022001
20001999
1998
19971996
19951994
1993
1992
1991
1990
1989
1988
1987
1986
1985
1984
1983
1982
20062007
2008
2009
2010
2011
2012
2013
y = -2.3137x + 0.5029R2 = 0.5361
y = -0.1069Ln(x) + 0.0297R2 = 0.6287
y = 30.255x2 - 6.0594x + 0.5671R2 = 0.6151
y = 0.1457x-0.2801
R2 = 0.6531
10%
20%
30%
40%
50%
60%
70%
0% 2% 4% 6% 8% 10% 12% 14%
Reco
very
Rate
Default Rate
Recovery Rate/Default Rate AssociationDollar Weighted Average Recovery Rates to Dollar Weighted Average Default Rates
(1982 - 2013 (Preliminary))

84
Annual Returns (1978 – 2014 (1/15))Yields and Spreads on 10-Year Treasury (Treas) and High Yield (HY) Bonds
a End-of-year yields. b Lowest yield in time series. Source: Citigroup’s High Yield Composite Index
Return (%) Promised Yield (%)Year HY Treas Spread HY Treas Spread2014 (1/15) 0.89 1.17 (0.28) 6.34 2.88 3.462013 7.22 (7.85) 15.06 6.45 3.01 3.452012 15.17 4.23 10.95 6.80 1.74 5.062011 5.52 16.99 (11.47) 8.41 1.88 6.542010 14.32 8.10 6.22 7.87 3.29 4.582009 55.19 (9.92) 65.11 8.97 3.84 5.142008 (25.91) 20.30 (46.21) 19.53 2.22 17.312007 1.83 9.77 (7.95) 9.69 4.03 5.662006 11.85 1.37 10.47 7.82 4.70 3.112005 2.08 2.04 0.04 8.44 4.39 4.052004 10.79 4.87 5.92 7.35 4.21 3.142003 30.62 1.25 29.37 8.00 4.26 3.742002 (1.53) 14.66 (16.19) 12.38 3.82 8.562001 5.44 4.01 1.43 12.31 5.04 7.272000 (5.68) 14.45 (20.13) 14.56 5.12 9.441999 1.73 (8.41) 10.14 11.41 6.44 4.971998 4.04 12.77 (8.73) 10.04 4.65 5.391997 14.27 11.16 3.11 9.20 5.75 3.451996 11.24 0.04 11.20 9.58 6.42 3.161995 22.40 23.58 (1.18) 9.76 5.58 4.181994 (2.55) (8.29) 5.74 11.50 7.83 3.671993 18.33 12.08 6.25 9.08 5.80 3.281992 18.29 6.50 11.79 10.44 6.69 3.751991 43.23 17.18 26.05 12.56 6.70 5.861990 (8.46) 6.88 (15.34) 18.57 8.07 10.501989 1.98 16.72 (14.74) 15.17 7.93 7.241988 15.25 6.34 8.91 13.70 9.15 4.551987 4.57 (2.67) 7.24 13.89 8.83 5.061986 16.50 24.08 (7.58) 12.67 7.21 5.461985 26.08 31.54 (5.46) 13.50 8.99 4.511984 8.50 14.82 (6.32) 14.97 11.87 3.101983 21.80 2.23 19.57 15.74 10.70 5.041982 32.45 42.08 (9.63) 17.84 13.86 3.981981 7.56 0.48 7.08 15.97 12.08 3.891980 (1.00) (2.96) 1.96 13.46 10.23 3.231979 3.69 (0.86) 4.55 12.07 9.13 2.941978 7.57 (1.11) 8.68 10.92 8.11 2.81Arithmetic Annual Average1978-2013 10.95 8.01 2.94 11.68 6.49 5.20Compound Annual Average1978-2013 10.03 7.44 2.58
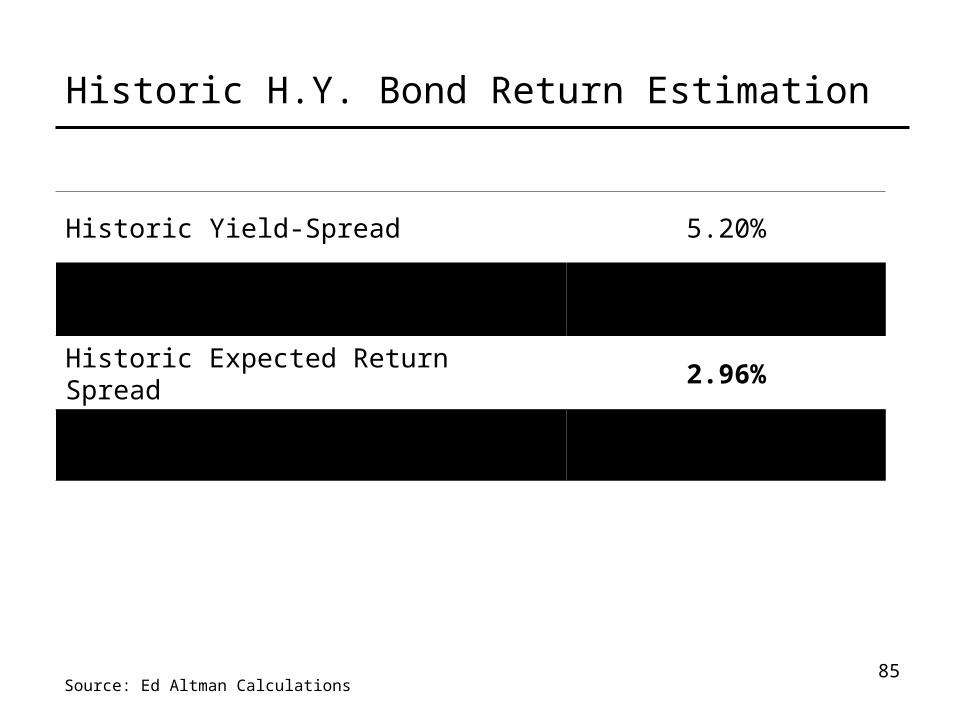
Historic H.Y. Bond Return Estimation
85
Historic Yield-Spread 5.20%
Less: Historic Annual Loss from Defaults (2.24)
Historic Expected Return Spread 2.96%
Historic Actual Return Spread 2.94%
Source: Ed Altman Calculations
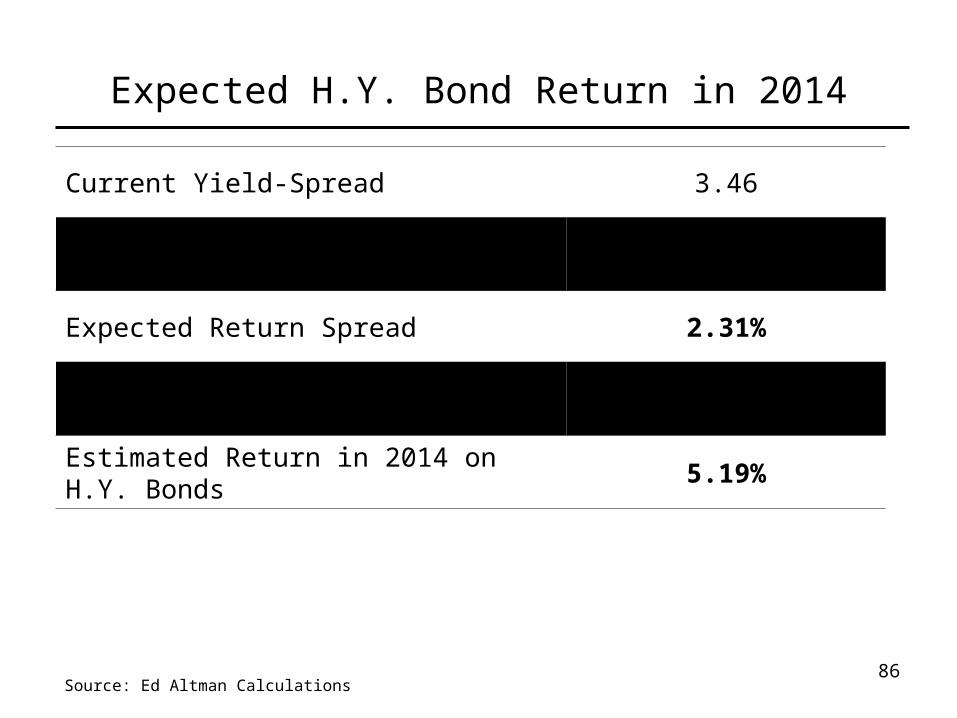
Expected H.Y. Bond Return in 2014
86
Current Yield-Spread 3.46
Less: Expected Loss from Defaults (1.15)
Expected Return Spread 2.31%
Plus: Current Yield 10 Yr T-Bonds 2.88
Estimated Return in 2014 on H.Y. Bonds 5.19%
Source: Ed Altman Calculations
Size of Distressed Debt Market
87
88888888
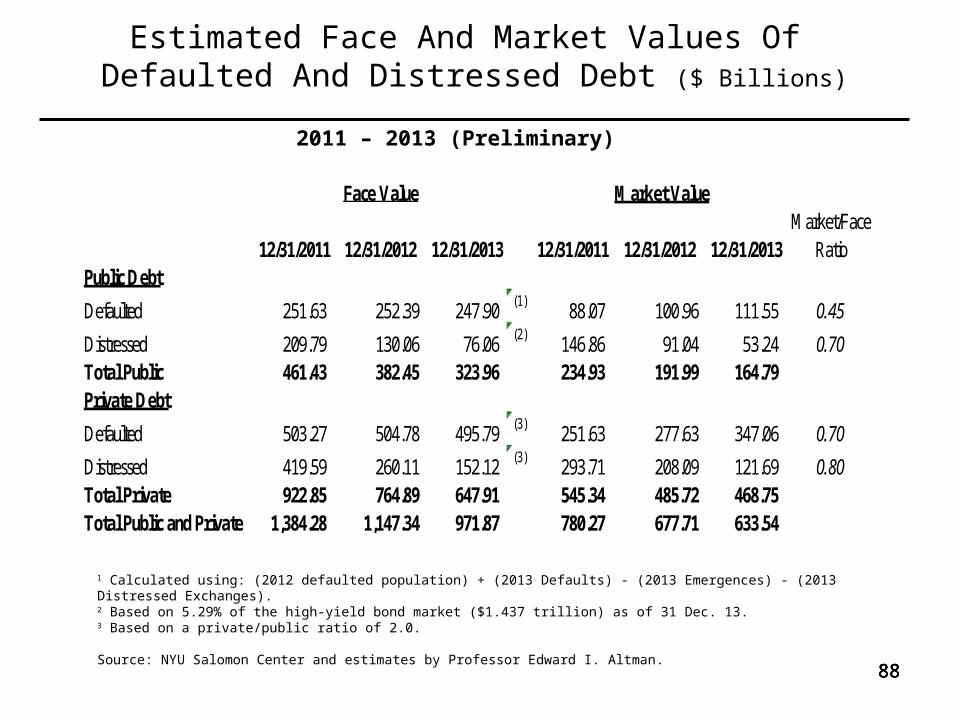
Estimated Face And Market Values Of Defaulted And Distressed Debt ($ Billions)
2011 – 2013 (Preliminary)
1 Calculated using: (2012 defaulted population) + (2013 Defaults) - (2013 Emergences) - (2013 Distressed Exchanges). 2 Based on 5.29% of the high-yield bond market ($1.437 trillion) as of 31 Dec. 13. 3 Based on a private/public ratio of 2.0.
Source: NYU Salomon Center and estimates by Professor Edward I. Altman.
Market Value
12/31/2011 12/31/2012 12/31/2013 12/31/2011 12/31/2012 12/31/2013Market/Face
RatioPublic Debt
Defaulted 251.63 252.39 247.90 (1) 88.07 100.96 111.55 0.45
Distressed 209.79 130.06 76.06 (2) 146.86 91.04 53.24 0.70Total Public 461.43 382.45 323.96 234.93 191.99 164.79 Private Debt
Defaulted 503.27 504.78 495.79 (3) 251.63 277.63 347.06 0.70
Distressed 419.59 260.11 152.12 (3) 293.71 208.09 121.69 0.80Total Private 922.85 764.89 647.91 545.34 485.72 468.75 Total Public and Private 1,384.28 1,147.34 971.87 780.27 677.71 633.54
Face Value

89898989
Size Of The US Defaulted And Distressed Debt Market ($ Billions)
1990 – 2013 (Preliminary)
Source: Author’s Compilations
$-
$500
$1,000
$1,500
$2,000
$2,500
$3,000
$3,500
$4,000 Face Value Market Value