Embed Size (px)
Citation preview
NBER WORKING PAPER SERIES
THE SURPRISINGLY DIRE SITUATION OF CHILDREN'S EDUCATION IN RURAL WEST AFRICA: RESULTS FROM THE CREO STUDY IN GUINEA-BISSAU
Peter BooneIla Fazzio
Kameshwari JandhyalaChitra Jayanty
Gangadhar JayantySimon Johnson
Vimala RamachandrinFilipa Silva
Zhaoguo Zhan
Working Paper 18971http://www.nber.org/papers/w18971
NATIONAL BUREAU OF ECONOMIC RESEARCH1050 Massachusetts Avenue
Cambridge, MA 02138April 2013
(COMPREHENSIVE REVIEW OF EDUCATION OUTCOMES)
We are grateful to the National Bureau of Economic Research (NBER), Cambridge, MA, USA, andEffective Intervention, a UK charity, for financial support. Pratham, an Indian charity, kindly providedassistance with test design. Participants at the NBER "African Successes" conference in Accra, Ghana,and the "CREO Study Report Conference" in Bissau, Guinea-Bissau, provided helpful comments.Alex Eble advised on early study design. The views expressed herein are those of the authors and donot necessarily reflect the views of the National Bureau of Economic Research. Corresponding author:Ila Fazzio.
At least one co-author has disclosed a financial relationship of potential relevance for this research.Further information is available online at http://www.nber.org/papers/w18971.ack
NBER working papers are circulated for discussion and comment purposes. They have not been peer-reviewed or been subject to the review by the NBER Board of Directors that accompanies officialNBER publications.
© 2013 by Peter Boone, Ila Fazzio, Kameshwari Jandhyala, Chitra Jayanty, Gangadhar Jayanty, SimonJohnson, Vimala Ramachandrin, Filipa Silva, and Zhaoguo Zhan. All rights reserved. Short sectionsof text, not to exceed two paragraphs, may be quoted without explicit permission provided that fullcredit, including © notice, is given to the source.
The Surprisingly Dire Situation of Children's Education in Rural West Africa: Results fromthe CREO Study in Guinea-Bissau (Comprehensive Review of Education Outcomes)Peter Boone, Ila Fazzio, Kameshwari Jandhyala, Chitra Jayanty, Gangadhar Jayanty, SimonJohnson, Vimala Ramachandrin, Filipa Silva, and Zhaoguo ZhanNBER Working Paper No. 18971April 2013JEL No. F35,H43,I2,O1,O55
ABSTRACT
We conducted a survey covering 20% of villages with 200-1000 population in rural Guinea-Bissau.We interviewed household heads, care-givers of children, and their teachers and schools. We analysedresults from 9,947 children, aged 7-17, tested for literacy and numeracy competency. Only 27% ofchildren were able to add two single digits, and just 19% were able to read and comprehend a simpleword. Our unannounced school checks found 72% of enrolled children in grades 1-4 attending theirschools, but the schools were poorly equipped. Teachers were present at 86% of schools visited. Despitesurveying 351 schools, we found no examples of successful schools where children reached reasonablelevels of literacy and numeracy for age. Our evidence suggests that interventions that raise schoolquality in these villages, rather than those which target enrollment, may be most important to generatevery sharp improvements in children's educational outcomes.
Peter BooneLondon School of [email protected]
Ila FazzioMadrid, [email protected]
Kameshwari JandhyalaDelhi, [email protected]
Chitra JayantyBissauGuinea [email protected]
Gangadhar JayantyBissau, Guinea [email protected]
Simon JohnsonMIT Sloan School of Management100 Main Street, E52-562Cambridge, MA 02142and [email protected]
Vimala RamachandrinDelhi, India [email protected]
Filipa SilvaBissau, Guinea-Bissau [email protected]
Zhaoguo ZhanBeijing, [email protected]
‐ 3 ‐
Authors roles:
Peter Boone: Conceived the study, participated in the design of the survey, analysed results, co‐
authored this paper, and raised the financing for the survey.
Ila Fazzio: Conceived the study, lead the design of the survey, lead the training and management of
field work teams, analysed results and co‐authored this paper.
Kameshwari Jandhyala: Advised on study design, surveys and implementation, and co‐authored this
paper.
Chitra Jayanty: Conceived the study, participated in the design of the survey, supervised the
implementation of the project, and co‐authored this paper.
Gangadhar Jayanty: Conceived the study, participated in implementation of the project, and co‐
authored this paper.
Filipa Silva: Participated in the design of the survey, trained and supervised the field work teams,
and co‐authored this paper.
Simon Johnson: Conceived the study, analysed results, co‐authored this paper, and raised financing
for the survey.
Vimala Ramachandrin: Advised on study design, surveys and implementation, co‐authored this
paper.
Zhan Zhaoguo : Carried out statistical analysis and co‐authored this paper.
‐ 4 ‐
1. Introduction
Despite declining global poverty, there are many regions of the world where poverty remains
widespread and chronic (Young 2012). Children grow up in these regions with poor health, and their
prospects are harmed by poor education (Boone and Johnson 2009). The right of every child to
primary school education is one of the Millennium Development Goals for 2015, yet in many of the
most extreme “pockets of poverty” little is being done to address these issues.
However, in order to understand the extent of problems and potential solutions, we need a
good understanding of the current conditions. Statistics from very poor regions are generally
unsatisfactory for this purpose (Jerven 2013). Often statistics are biased or missing because
authorities have incentives to paint a rosy picture, or they simply don’t make the effort or allocate
resources to measure. Even when good statistics are available, the measures usually cover service
provision (such as the level of school enrolment), rather than the desired outcome (indicators of
educational and skills levels achieved).
In this paper, we report on a unique survey that was conducted in 2010 in rural villages and
schools of Guinea‐Bissau, in West Africa. Guinea‐Bissau is one of the poorest nations of the world,
ranking 192 on income per capita, at $600 per person (Bank 2012). The United Nations Education,
Scientific and Cultural Organization (UNESCO) reports the national adult literacy rate is 54.2%, while
72% of Guinea‐Bissau’s youth aged 15‐24 are literate. The net primary school enrolment ratio is
73%. These figures represent national averages, but our work suggests they mask extremely poor
educational outcomes in rural regions.2
One goal of the CREO (Comprehensive Review of Education Outcomes) survey was to provide an
accurate, comprehensive overview of children’s learning outcomes and the relation of these to
school quality, parental care and socioeconomic variables. We are not aware of any other similarly
comprehensive, integrated surveys of schools, households, care‐givers and children in such poor
regions of West Africa.3 Our analysis is based on surveys from 202 villages (approximately 20% of
the population) with interviews from 3,968 households. We interviewed 8,782 parents, and
2 UNESCO defines literacy as “The ability to read and write with understanding a simple statement related to one’s daily life. It includes a continuum of reading and writing skills, and often includes basic arithmetic skills.” Our survey population represents approximately 25% of the country’s population. If youth literacy rates in urban areas were approximately 90%, then the UNESCO data could be consistent with our data. We have not surveyed urban areas, however our experience suggests literacy rates would be substantially lower than 90% but well above the rural rates reported here. 3 Demographic and Health Surveys (DHS) cover important socioeconomic variables. This survey allows us to identify children’s outcomes with their respective schools, villages and parents, thus permitting us to examine richer correlations. Since this is a survey, we cannot make causal interpretations based on these correlations.
‐ 5 ‐
analysed numeracy and literacy tests for 9,947 children aged 7 to 17. We asked children which
schools they attended, and then visited 351 schools and interviewed 781 teachers. We checked
whether schools were operating, measured attendance compared to enrolment, and surveyed
school materials.
The results of the survey present a bleak picture of educational resources and outcomes in rural
Guinea‐Bissau. According to the national curriculum, by third grade (children aged 9), children
should be able to read and comprehend a story, and complete the simple maths test we used (see
section 3.3). We found that 81% of ten year olds could not sum two single digit numbers, and 91%
could not read single words. Among the 1,169 ten year olds with test results, we found only one
child who was capable of completing both the numeracy and literacy tests.
Why are these results so poor? While survey responses should be taken with caution since they
may not reflect actions, our “demand” indicators suggest parents have a strong desire to send their
children to good schools. Over 98% of household heads reported they would be willing to pay an
average 20% of monthly income for school fees for each of their school‐aged children if good
schooling would be provided. In our spot checks of schools, we found 72% of enrolled children at
the school. Attendance rates are probably boosted by functioning school lunch programs. The fact
that children attend schools despite poor outcomes, and the reported willingness to pay for
schooling, suggest additional interventions that target attendance, such as conditional transfers
implemented in Mexico, are probably not of primary importance to improve educational outcomes
(Kremer 2003, Paul Schultz 2004).
On the supply side, given the poor test results, it is surprising to learn that 86% of schools were
open and roughly three quarters of enrolled children were attending when we conducted spot
checks. The teachers reported substantial experience and some training. However, very few
schools have adequate text books, and many teachers had a poor grasp of spoken Portuguese.
Guinea‐Bissau has many local languages. The most widely spoken language is a mix of
Portuguese, the national language, and local dialects called “Kriol”. The only spoken language with a
written script is Portuguese. Our numeracy tests (apart from number recognition) were simple math
questions written on paper, and instructions were given verbally in the local language, so children
did not need to know Portuguese in order to succeed in the test. Instructions for literacy tests were
given in the child’s local language, but children were tested on reading and comprehension of
Portuguese.
‐ 6 ‐
An important goal of our project was to find “examples of success” with the aim of using these
to better understand how projects to improve education can be developed. We anticipated that we
could find individual schools or villages where education levels were high, and lessons could be
learned from these. Unfortunately, we found only six schools (with greater than 10 pupils) where
average scores implied students could read a paragraph. For the numeracy tests, there were no
schools where the average student could multiply or divide.
These survey results provide a comprehensive picture of a dysfunctional school system. The
reasons for the poor functioning are numerous. However, we believe the evidence points to a strong
latent demand for education in these villages which remains unsatisfied due to the very poor quality
of existing teaching and schools organization. While there are many steps that could be taken to
make schools function better (Ramachandran 2003, Kremer and Holla 2009), it is important to
understand which should be prioritized in regions such as Guinea‐Bissau.
The public sector cannot be relied on to provide regular services due to political instability,
institutional capacity and a political system which does not serve the very poor. Private sector
provision of schooling in these villages is not profitable enough to generate activities due to low
income levels. The difficult logistics of finding trained teachers, gaining finances, securing materials
and supervising performance makes it daunting for individual villages to improve schools on their
own for a sustained period. Similar problems plague NGOs and foreign donors who attempt to
improve school outcomes. To some extent, when faced with the choice of attempting to build and
maintain effective schools, or waiting to learn whether the existing public schools might get better,
many villages choose to wait and hope.
The result is that one more generation of children is growing up without even basic numeracy
and literacy skills.
2. Methods
2.1 Survey location and eligible population
When the survey was conducted, the last published census in Guinea‐Bissau dated from
1991. We compiled a list of 913 potentially eligible villages from the census based on demographic
estimates of whether they were likely to have a population between 200 and 1000 in 2010. We then
randomly ordered these villages numbering them from 1 to 913.4 Field workers then visited each
4 The randomization was conducted in ACCESS, assigning each village a unique number using a random number generator. Villages were then ordered sequentially according to assigned numbers. The first 202 eligible villages from this ordering are reported here.
‐ 7 ‐
village and interviewed village leaders to learn the estimated true population of the village. Village
and household level surveys were completed from December 2009 until the end of the academic
year in 2010. Some delays in implementation and data checking were caused by security concerns
during and after the survey was completed.
A village was eligible for the survey if the village leaders agreed to the interview and survey,
and if the population was estimated to be between 200 and 1000 during the field worker’s visit with
a minimum of 20 households, and it was accessible by land during the dry season. From the list of
913 villages, we visited villages sequentially with a target of 200 villages. The teams visited 411
villages; however 209 of these were ineligible due to the number of households, or population,
being above or below eligibility thresholds. Ultimately surveys covering 202 villages were completed
and reported here in the analysis.5 Village elders were interviewed to complete baseline data on
villages.
There are no maps of households in villages. We selected households for interviews
according to systematic sampling (Luman, Worku et al. 2007). This sampling methodology generates
an average 20 households per village, independent of the size of the village. 6
A household was eligible for inclusion if they were in an eligible village, they were selected
by systematic sampling, they had at least one eligible child, and the household head agreed to be
interviewed. We conducted an initial interview with a household head to determine characteristics
of the household, and the eligible children in the household.
A child was eligible if she lived in an eligible house, and she was aged from 7 to 17 years, she
was available on the day of visit of the survey, and she had at least one eligible care‐giver who was
available to interview on the day of visit. We interviewed each child and conducted literacy and
numeracy tests. We also interviewed all the child’s available care‐givers.
5 We planned to complete 200 villages before the end of the 2009/10 school year. The teams kept working to complete their last village once the 200 total had been achieved. 6 The system used to select houses was derived from the SystRS methodology which was developed to be an easy but representative way of randomly selecting households when there is no sampling frame. An estimate of the number of households in the village is made, and then a “skipping interval” is calculated by dividing the total houses by 20. To establish the ‘starting’ point of the ‘random walk’ supervisors asked a senior member of the community to take them to two opposite edges of the village, preferably along the longest axis in the village (i.e. the two most distant houses in the village). These were the starting points for two interviewers. The interviewers then picked a random number between 0 and the “skipping interval” to determine the first house to visit. They then walked in a line counting houses until they reached this starting number. That would be the first house to interview. They then walked towards the village center in a serpentine way enumerating houses according to the calculated skipping interval. If they didn't enumerate a minimum of 20 houses using the interval system, they would walk back towards the edge and enumerate houses that had not been enumerated until they reached 20.
‐ 8 ‐
When we surveyed villages, we listed all Portuguese language schools in the region. There
are Koranic schools in these regions, where Portuguese is not taught, however we did not visit these
as they do not teach the national curriculum, and nearly all such children were also enrolled in a
Portuguese language school. We then visited all schools that children reported they were enrolled
at (during our child interviews). We sought permission from head teachers to survey schools and
conduct teacher interviews. We interviewed every teacher who was available on the day of
interview if they taught any grades 1 to 4.
We sought permission to interview from village leaders, head teachers, household heads,
and each participant. All villages and schools agreed to be included in the study. Only one
household head refused to permit interviews. In the remaining households, all children and care‐
givers agreed to be interviewed.
2.2 Main outcome: Test scores
The primary outcome measure for the survey is test score results from literacy and
numeracy tests given to eligible children. In our initial field work we recognized that a wide range of
outcomes was possible, but that a substantial fraction of the population would likely score poorly on
common international tests, so we needed a test that was more sensitive at discriminating at poorer
levels of education. We chose to modify tests developed by Pratham, a large Indian NGO that
specializes in educational outcome tests in India, to suit the environment in Guinea Bissau. We
conducted multiple field tests in villages prior to the survey.
The literacy test was implemented as follows: The test starts at a medium level task where
children are asked to read a sentence. If they were able to read at least 2 of the 4 sentences offered,
they would be asked about the meaning of some underlined words and also asked (in local language)
two questions about the comprehension of these sentences. If a child was able to read sentences
they would be offered to read a story, and tested on comprehension of the story. A child who was
not able to read a sentence would be offered mono and dissyllabic words to read. Children who
were not able to correctly read 4 out of 5 words were then asked to recognize letters. A child got
the highest possible mark (a score of eight) if they could read and comprehend a short story, while
they received zero if they could not read monosyllabic words.
The numeracy tests are designed similarly, starting with addition of two single digit numbers
without carry forward. If a child was able to solve correctly at least one sum, they would be offered
to solve subtraction with borrowing, followed by multiplication, simple division and inexact division.
A child got the highest possible mark if they could answer all questions correctly. If they could not
‐ 9 ‐
complete the initial addition questions, they were asked if they could recognize two digit and single
digit numbers. A child scored zero if they could not recognize single digit numbers.
The interviewers conducted the tests in languages that were convenient for the child.
However, since local languages are not written, and the national curriculum teaches children to read
in Portuguese, we tested children’s ability to read and comprehend Portuguese.
We also conducted background surveys to help interpret the reasons behind test score
results. We interviewed caregivers to learn their socioeconomic status as well as attitudes towards
schooling for their children. We also conducted a survey to measure the quality of school facilities,
and we interviewed teachers to learn their overall training and work conditions. Our school
interviews also provided spot checks to learn if schools were functioning and they measured
attendance.
2.3 Data collection and management
An initial team of 10 people and 10 vehicles travelled and located eligible villages based on the
1991 census. They sought consent from village leaders, recorded the GPS location of the village, and
determined the estimated current size of the village, and recorded the schools that children resident
in the village attended.
The remaining survey data collection was managed by 5 teams of 3 people, including one
supervisor for each team. These teams completed the household and child surveys, as well as
implementing child numeracy and literacy tests. They first sought permission to conduct the survey
from the head of the household. If permission was granted, and if there was an eligible child, they
proceeded to complete the survey. They sought interviews with all care‐givers for eligible children in
the household. The fieldworkers would typically stay in a village 3 days, and they were trained to
repeatedly seek out interviews with care‐givers and children until all eligible children and care‐givers
had been reached. When conducting tests, children were asked to step away from their friends and
other onlookers to complete the test. All surveys and discussion were completed in a local
language. For the numeracy tests, children were asked to answer written questions. If the child
could sum two digits correctly, we proceeded to harder questions. Hence, to pass the numeracy
tests, children did not need to speak any Portuguese.7 Instructions for literacy were stated in local
languages, however, the words and stories used in the test were in Portuguese.
7 If a child could not add two single digit numbers, then the test reverted to checking if they could recognize single and double digit numbers. They were required to respond verbally in Portuguese to this number recognition test. So, a child that spoke no Portuguese, and could not add two single digits in a written test,
‐ 10 ‐
The schools survey was completed by our survey supervisors during the village visits.
Supervisors made several attempts to visit schools during hours when they should be open, and if
schools were functioning, they sought the head teacher’s approval to conduct the survey. They
examined the official enrolment data at the school, and they visited classrooms to count the number
of children actually attending along with textbooks available.
During each village survey, supervisors double‐checked survey forms and errors were corrected
at that time. Four data entry personnel conducted double blind data entry. A supervisor was
responsible for correcting errors found when checking double blind entry. If needed, we attempted
to revisit interviewees to correct any errors found during data entry. Due to political uncertainty
before and after the survey, some data correction had to be delayed for security reasons and this
slowed the completion of data analysis, however such corrections were very minor.
2.4 Sample Size
The survey was designed to cover a national footprint and provide adequate power to learn
the importance of covariates. We were limited by access to good quality vehicles and needed to
complete the study within a school year. We were also limited by political upheaval which delayed
implementation of the survey due to security concerns. By surveying approximately 200 villages
with 10,000 children tested, we have a well‐powered data set to examine correlations between test
outcomes and other variables.
3.0 Results
3.1 Population Covered
The analysis is based on outcomes for the 202 surveyed villages, including 3,968 household
surveys, 4,907 female care giver surveys, 3,875 male care giver surveys. In total we found 19,776
children aged 0‐17 living in these households, of which 10,014 were aged 7‐17 and eligible for our
literacy and numeracy tests. We managed to complete surveys as well as numeracy and literacy
tests, and so base the analysis, on 9,947 of these children (Table 1).
3.2. Characteristics of Villages and Households
Table 2 shows average population of villages is 457 people. The average household size is ten
persons. Our survey of twenty households covers 40% of an average village. Fifty‐four per cent of
the villages had a school in the village, and when there was no school, the average walking time to
would score zero. A child that could add single digits in a written test was presumed to be able to recognize numbers and received no verbal test.
‐ 11 ‐
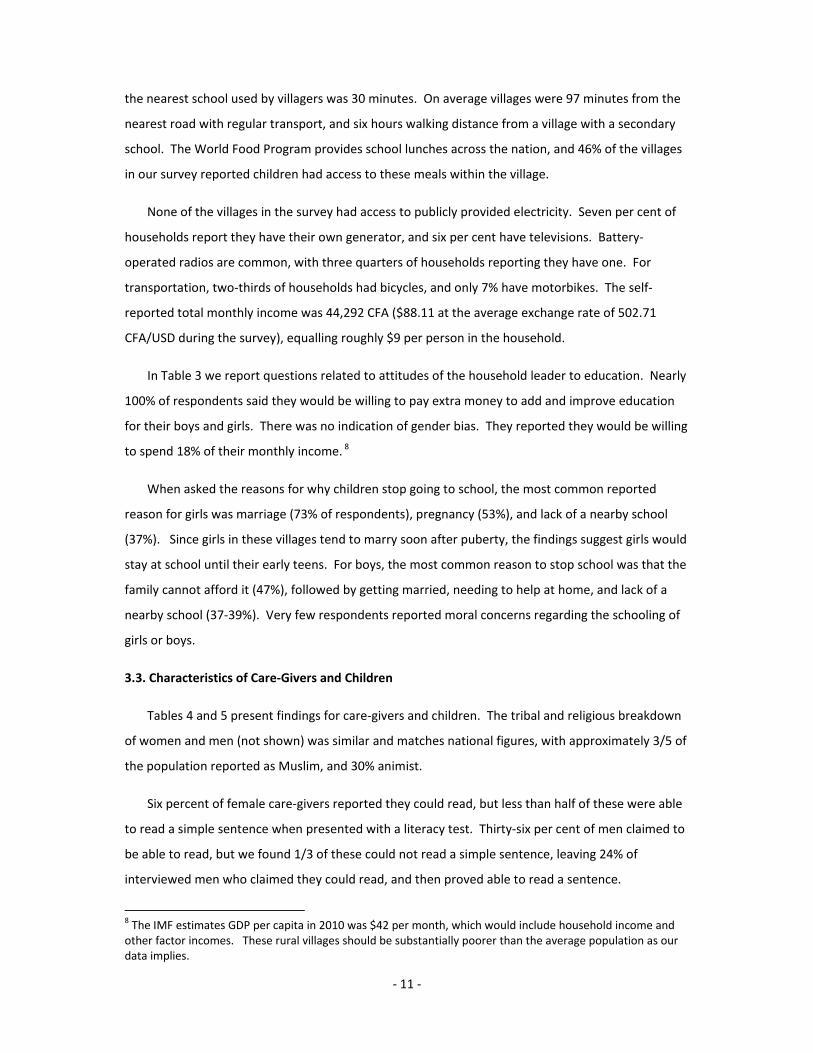
the nearest school used by villagers was 30 minutes. On average villages were 97 minutes from the
nearest road with regular transport, and six hours walking distance from a village with a secondary
school. The World Food Program provides school lunches across the nation, and 46% of the villages
in our survey reported children had access to these meals within the village.
None of the villages in the survey had access to publicly provided electricity. Seven per cent of
households report they have their own generator, and six per cent have televisions. Battery‐
operated radios are common, with three quarters of households reporting they have one. For
transportation, two‐thirds of households had bicycles, and only 7% have motorbikes. The self‐
reported total monthly income was 44,292 CFA ($88.11 at the average exchange rate of 502.71
CFA/USD during the survey), equalling roughly $9 per person in the household.
In Table 3 we report questions related to attitudes of the household leader to education. Nearly
100% of respondents said they would be willing to pay extra money to add and improve education
for their boys and girls. There was no indication of gender bias. They reported they would be willing
to spend 18% of their monthly income. 8
When asked the reasons for why children stop going to school, the most common reported
reason for girls was marriage (73% of respondents), pregnancy (53%), and lack of a nearby school
(37%). Since girls in these villages tend to marry soon after puberty, the findings suggest girls would
stay at school until their early teens. For boys, the most common reason to stop school was that the
family cannot afford it (47%), followed by getting married, needing to help at home, and lack of a
nearby school (37‐39%). Very few respondents reported moral concerns regarding the schooling of
girls or boys.
3.3. Characteristics of Care‐Givers and Children
Tables 4 and 5 present findings for care‐givers and children. The tribal and religious breakdown
of women and men (not shown) was similar and matches national figures, with approximately 3/5 of
the population reported as Muslim, and 30% animist.
Six percent of female care‐givers reported they could read, but less than half of these were able
to read a simple sentence when presented with a literacy test. Thirty‐six per cent of men claimed to
be able to read, but we found 1/3 of these could not read a simple sentence, leaving 24% of
interviewed men who claimed they could read, and then proved able to read a sentence.
8 The IMF estimates GDP per capita in 2010 was $42 per month, which would include household income and other factor incomes. These rural villages should be substantially poorer than the average population as our data implies.
‐ 12 ‐
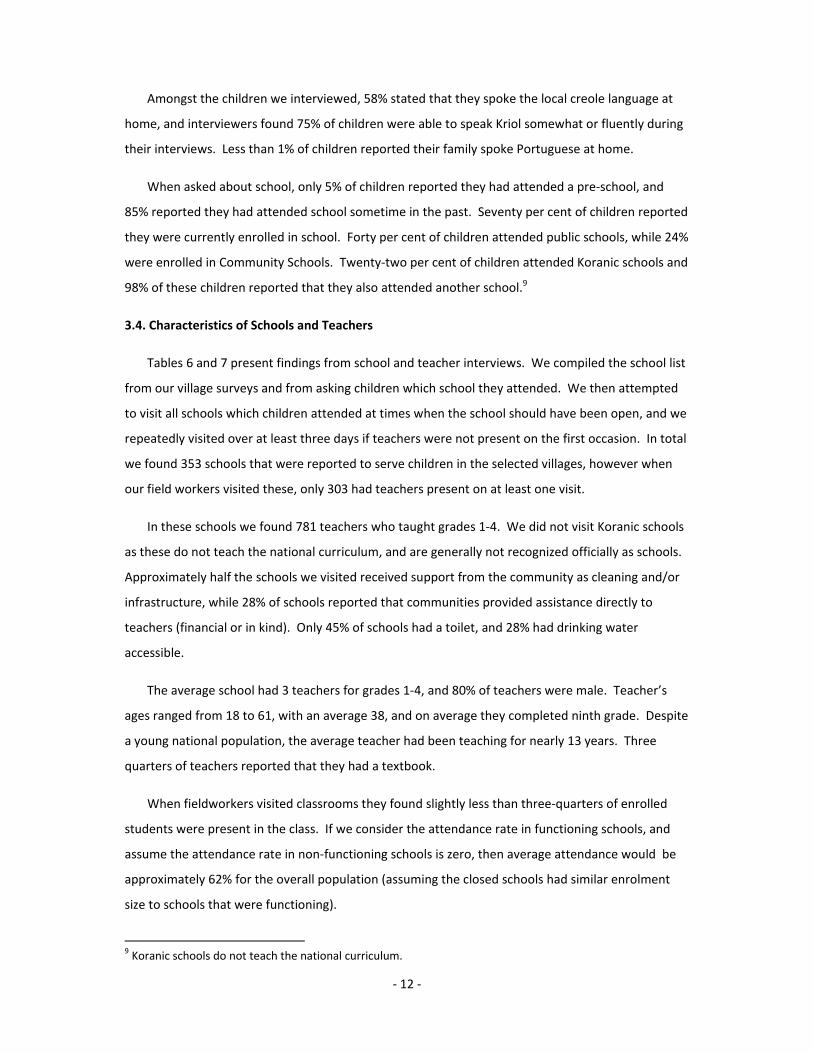
Amongst the children we interviewed, 58% stated that they spoke the local creole language at
home, and interviewers found 75% of children were able to speak Kriol somewhat or fluently during
their interviews. Less than 1% of children reported their family spoke Portuguese at home.
When asked about school, only 5% of children reported they had attended a pre‐school, and
85% reported they had attended school sometime in the past. Seventy per cent of children reported
they were currently enrolled in school. Forty per cent of children attended public schools, while 24%
were enrolled in Community Schools. Twenty‐two per cent of children attended Koranic schools and
98% of these children reported that they also attended another school.9
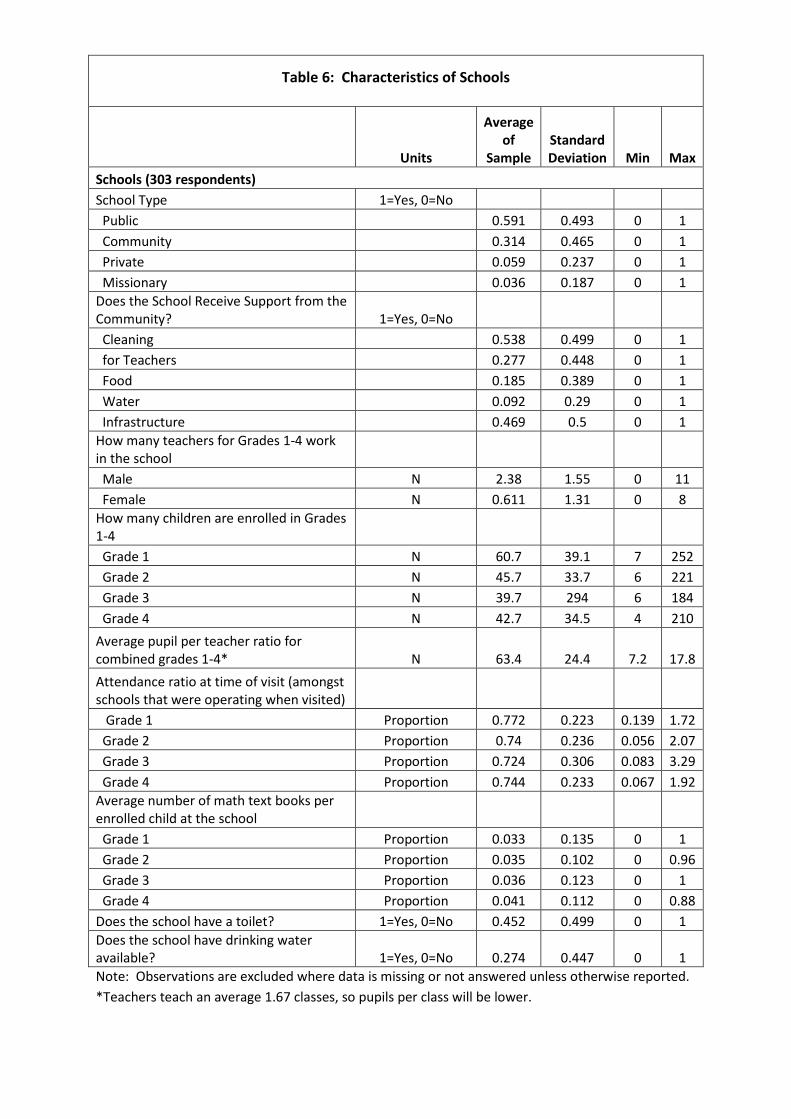
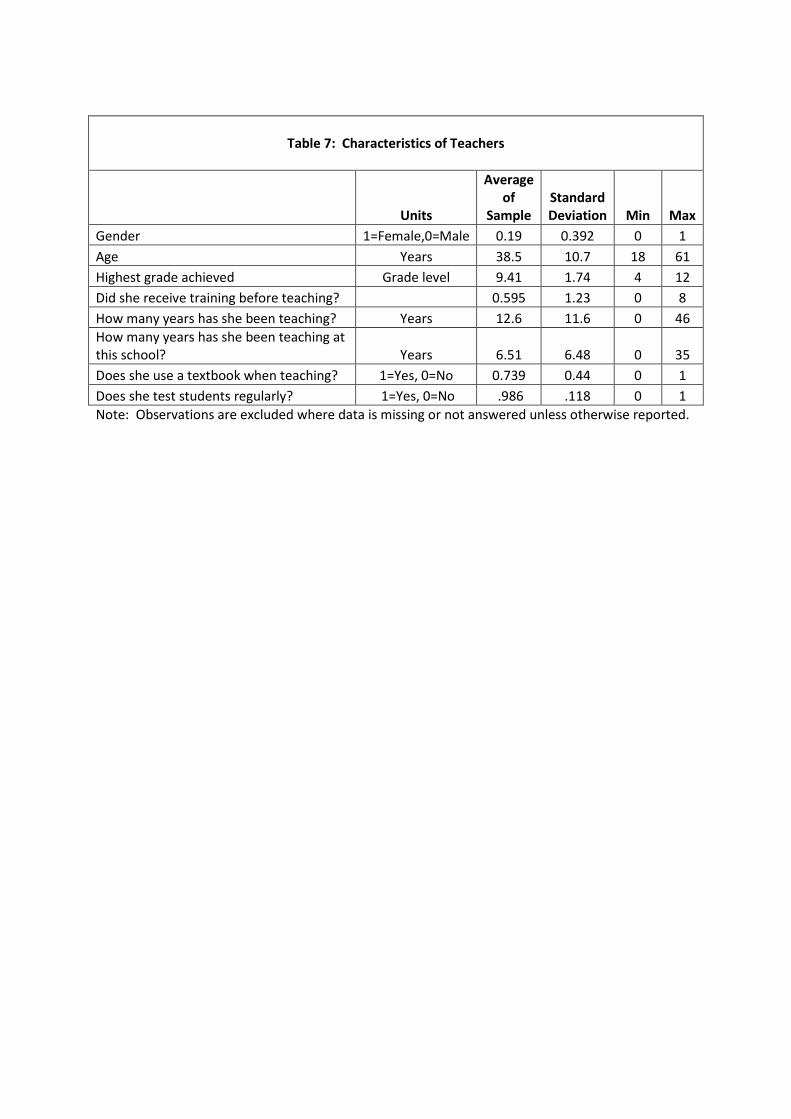
3.4. Characteristics of Schools and Teachers
Tables 6 and 7 present findings from school and teacher interviews. We compiled the school list
from our village surveys and from asking children which school they attended. We then attempted
to visit all schools which children attended at times when the school should have been open, and we
repeatedly visited over at least three days if teachers were not present on the first occasion. In total
we found 353 schools that were reported to serve children in the selected villages, however when
our field workers visited these, only 303 had teachers present on at least one visit.
In these schools we found 781 teachers who taught grades 1‐4. We did not visit Koranic schools
as these do not teach the national curriculum, and are generally not recognized officially as schools.
Approximately half the schools we visited received support from the community as cleaning and/or
infrastructure, while 28% of schools reported that communities provided assistance directly to
teachers (financial or in kind). Only 45% of schools had a toilet, and 28% had drinking water
accessible.
The average school had 3 teachers for grades 1‐4, and 80% of teachers were male. Teacher’s
ages ranged from 18 to 61, with an average 38, and on average they completed ninth grade. Despite
a young national population, the average teacher had been teaching for nearly 13 years. Three
quarters of teachers reported that they had a textbook.
When fieldworkers visited classrooms they found slightly less than three‐quarters of enrolled
students were present in the class. If we consider the attendance rate in functioning schools, and
assume the attendance rate in non‐functioning schools is zero, then average attendance would be
approximately 62% for the overall population (assuming the closed schools had similar enrolment
size to schools that were functioning).
9 Koranic schools do not teach the national curriculum.
‐ 13 ‐
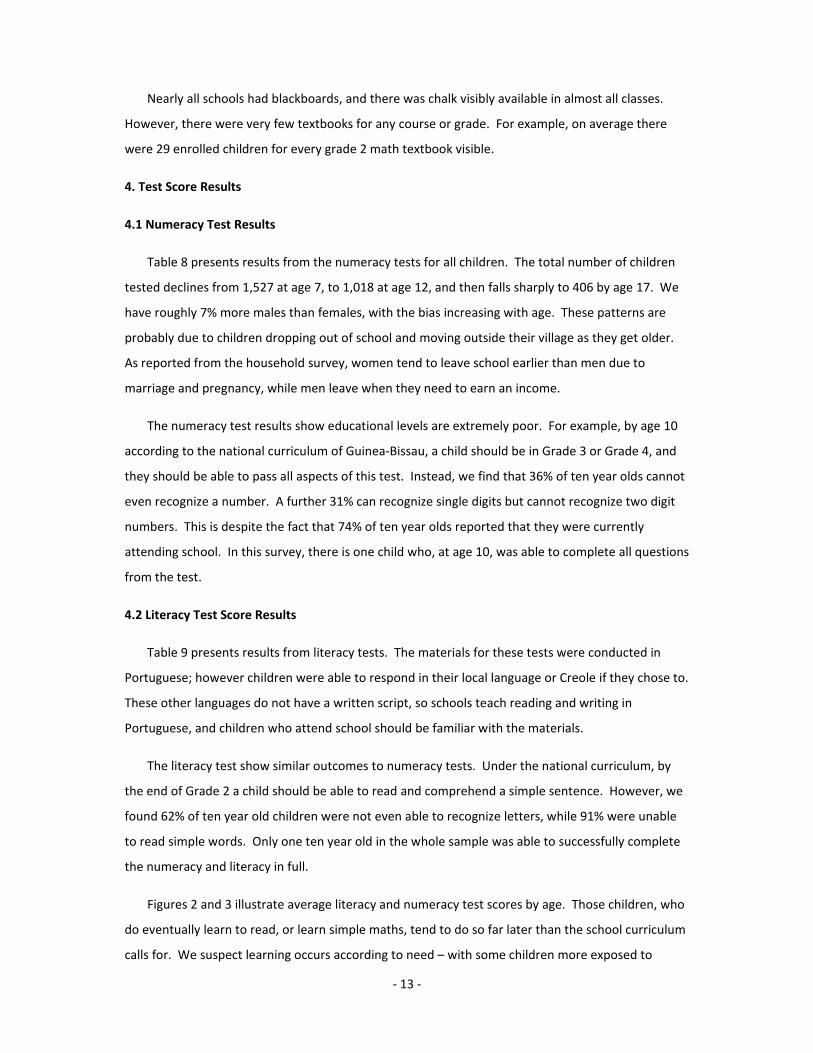
Nearly all schools had blackboards, and there was chalk visibly available in almost all classes.
However, there were very few textbooks for any course or grade. For example, on average there
were 29 enrolled children for every grade 2 math textbook visible.
4. Test Score Results
4.1 Numeracy Test Results
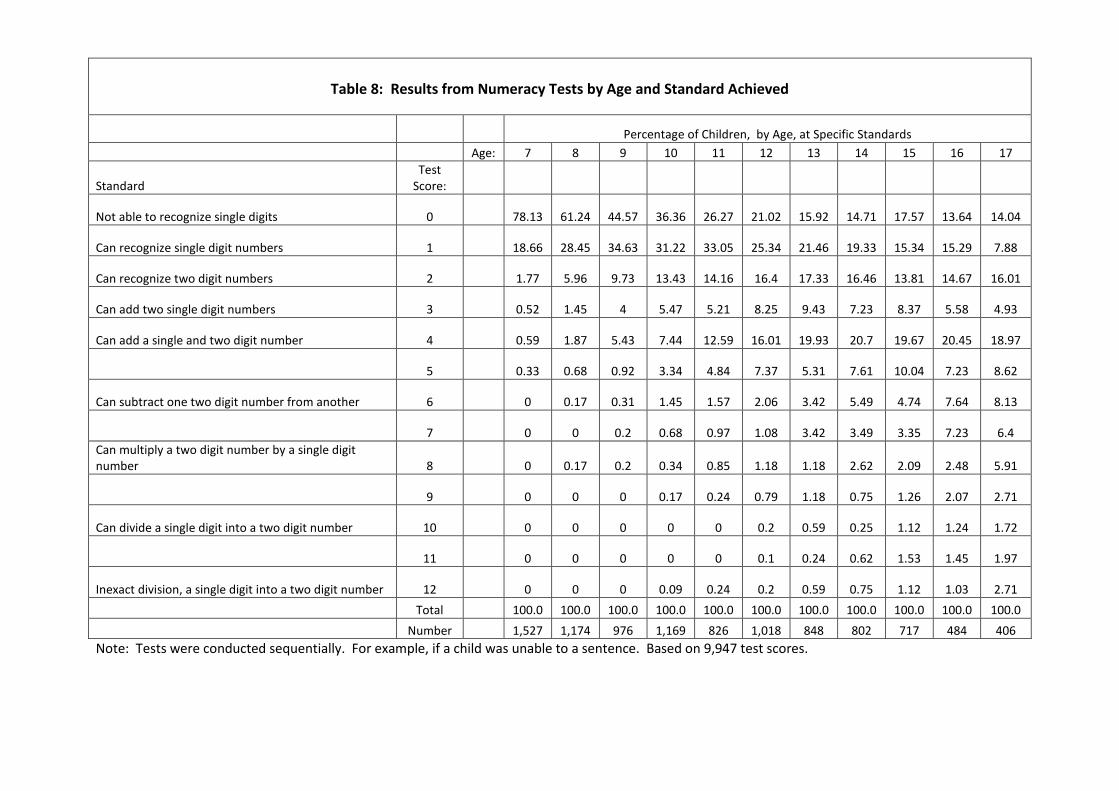
Table 8 presents results from the numeracy tests for all children. The total number of children
tested declines from 1,527 at age 7, to 1,018 at age 12, and then falls sharply to 406 by age 17. We
have roughly 7% more males than females, with the bias increasing with age. These patterns are
probably due to children dropping out of school and moving outside their village as they get older.
As reported from the household survey, women tend to leave school earlier than men due to
marriage and pregnancy, while men leave when they need to earn an income.
The numeracy test results show educational levels are extremely poor. For example, by age 10
according to the national curriculum of Guinea‐Bissau, a child should be in Grade 3 or Grade 4, and
they should be able to pass all aspects of this test. Instead, we find that 36% of ten year olds cannot
even recognize a number. A further 31% can recognize single digits but cannot recognize two digit
numbers. This is despite the fact that 74% of ten year olds reported that they were currently
attending school. In this survey, there is one child who, at age 10, was able to complete all questions
from the test.
4.2 Literacy Test Score Results
Table 9 presents results from literacy tests. The materials for these tests were conducted in
Portuguese; however children were able to respond in their local language or Creole if they chose to.
These other languages do not have a written script, so schools teach reading and writing in
Portuguese, and children who attend school should be familiar with the materials.
The literacy test show similar outcomes to numeracy tests. Under the national curriculum, by
the end of Grade 2 a child should be able to read and comprehend a simple sentence. However, we
found 62% of ten year old children were not even able to recognize letters, while 91% were unable
to read simple words. Only one ten year old in the whole sample was able to successfully complete
the numeracy and literacy in full.
Figures 2 and 3 illustrate average literacy and numeracy test scores by age. Those children, who
do eventually learn to read, or learn simple maths, tend to do so far later than the school curriculum
calls for. We suspect learning occurs according to need – with some children more exposed to
‐ 14 ‐
money and economic and social activities, such as small‐scale trading, where limited literacy and
numeracy is required.
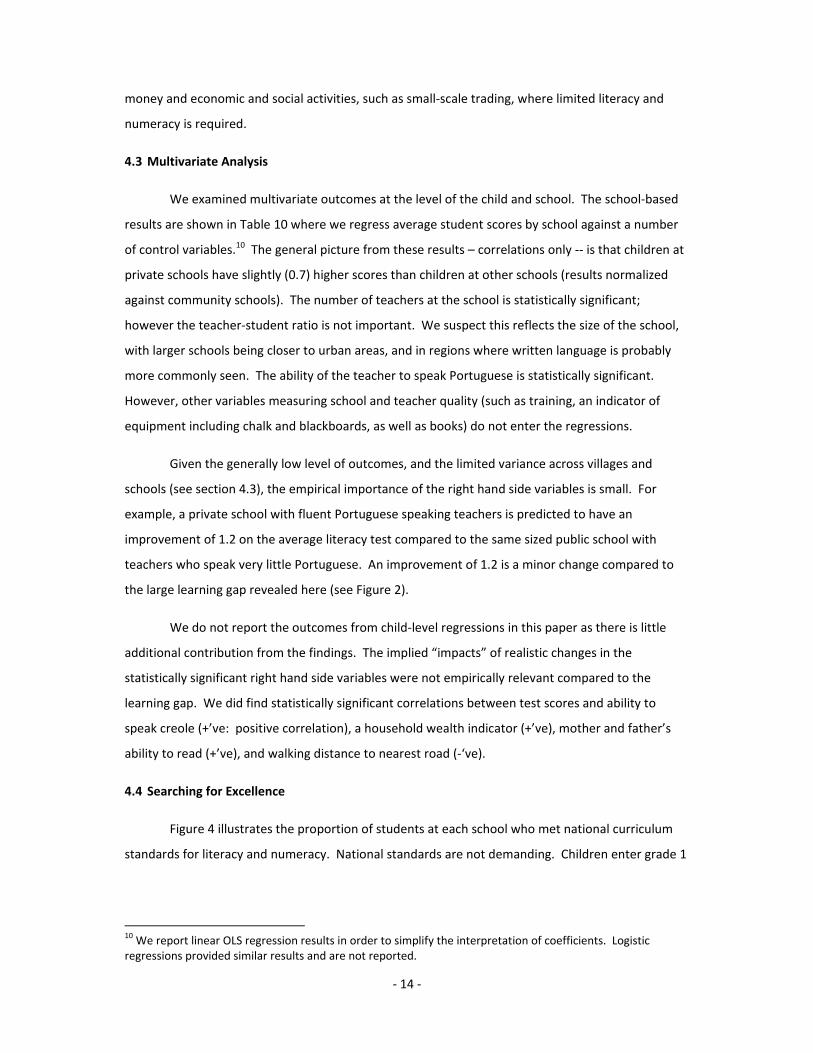
4.3 Multivariate Analysis
We examined multivariate outcomes at the level of the child and school. The school‐based
results are shown in Table 10 where we regress average student scores by school against a number
of control variables.10 The general picture from these results – correlations only ‐‐ is that children at
private schools have slightly (0.7) higher scores than children at other schools (results normalized
against community schools). The number of teachers at the school is statistically significant;
however the teacher‐student ratio is not important. We suspect this reflects the size of the school,
with larger schools being closer to urban areas, and in regions where written language is probably
more commonly seen. The ability of the teacher to speak Portuguese is statistically significant.
However, other variables measuring school and teacher quality (such as training, an indicator of
equipment including chalk and blackboards, as well as books) do not enter the regressions.
Given the generally low level of outcomes, and the limited variance across villages and
schools (see section 4.3), the empirical importance of the right hand side variables is small. For
example, a private school with fluent Portuguese speaking teachers is predicted to have an
improvement of 1.2 on the average literacy test compared to the same sized public school with
teachers who speak very little Portuguese. An improvement of 1.2 is a minor change compared to
the large learning gap revealed here (see Figure 2).
We do not report the outcomes from child‐level regressions in this paper as there is little
additional contribution from the findings. The implied “impacts” of realistic changes in the
statistically significant right hand side variables were not empirically relevant compared to the
learning gap. We did find statistically significant correlations between test scores and ability to
speak creole (+’ve: positive correlation), a household wealth indicator (+’ve), mother and father’s
ability to read (+’ve), and walking distance to nearest road (‐‘ve).
4.4 Searching for Excellence
Figure 4 illustrates the proportion of students at each school who met national curriculum
standards for literacy and numeracy. National standards are not demanding. Children enter grade 1
10 We report linear OLS regression results in order to simplify the interpretation of coefficients. Logistic
regressions provided similar results and are not reported.
‐ 15 ‐
after their sixth or seventh birthday.11 After first grade a child is expected to be able to understand
letters and numbers, and read and write simple sentences. At the end of second grade they should
be able to read and write short texts, add, and subtract. By grade 3 they should be able to read and
write texts, understand basic grammar, and add, subtract, multiply and divide.
We used test scores to calculate whether a child met the age specific standard implied by
the national curriculum (assuming a child did not fail a grade). If a child followed the national
curriculum, by the age of ten, a child should have been able to easily complete the literacy and
numeracy tests.12 We assumed that a child of seven could score zero on test as they may have just
entered school recently, while a child by age 8 should have completed only the material of grade
one, and a child aged nine should have completed grade two. We then compared children’s actual
scores to what could have been expected if they followed the national standard. We used this data
to examine whether any specific schools or villages were “outliers” with very good results compared
to the poor national averages.
Figure 4 shows that there are no good outliers amongst schools. We found similar results
when examining village‐level outcomes (not reported). There are no schools where 50% of children
could meet their standards for numeracy scores, and only six schools where more than half the
children met national standards for literacy.
We also examined whether schools financed by NGOs showed improved test results. There
were 35 schools which reported significant NGO financing from two foreign NGOs that have
operated for many years in the region. Only 17% and 10% of children in these schools met national
literacy and numeracy standards respectively.
5 Discussion
We conducted a representative survey of educational outcomes in small and medium‐sized
villages in Guinea‐Bissau. The results illustrate extremely poor literacy and numeracy outcome for
children, regardless of whether they attend school.
5.1 Study Limitations
11 At the time of the survey when a child passed their seventh birthday they were required to enrol at school, however often parents enrolled children at age six. Subsequent to this survey, the entry age for grade one was changed to six years. 12 Our survey was conducted in the last trimester of the school year, so a ten year old child would be nearing completion of either grade 3 or grade 4 if they had begun school at age seven and passed each school year successfully.
‐ 16 ‐
There are several limitations to this survey. We have provided a snapshot of the conditions in
the spring and early summer of 2010. This was a period of political uncertainty, but during this
period the government had made efforts to pay teachers’ salaries on time. Although this would not
have impacted test scores quickly, the reported attendance levels and school openings may have
been modestly better than other years.
Our literacy tests were in Portuguese, and children in rural villages are generally only exposed to
Portuguese at school. We managed the interviews in the local languages in order to be able to
improve compliance, and give children their best chance at communicating correct answers.
However, the language barrier would naturally reduce literacy scores. We do not see a reason for
language barriers to directly impact numeracy scores.
Given this is a survey, the correlations reported should not be treated as describing causality.
5.2 General Discussion
One goal of this study was to use the unique combination of interviews with parents, children,
teachers and schools in order to better understand the key factors determining educational
outcomes in the nation. This could provide a background for interventions aimed at improving
outcomes in the future.
The results provide some evidence that community demand for education is substantial. Nearly
100% of heads of households reported they were prepared to pay money in order to improve the
education of both boys and girls. On average, they were willing to spend approximately 20% of
income on children’s education. We found that 24% of children attended community schools. Many
of these were created and partially financed by local communities.
The reasons for dropping out of school also pointed to healthy desire for education. Girls were
reported to mainly drop out when they became pregnant or got married, meaning that they would
remain at school until after puberty. Boys were more likely to drop out in order to gain income, but
this may also have been associated with fatherhood and marriage.
We did not conduct any surveys on the returns to education, but there is no reason to think the
pattern in Guinea‐Bissau differs from elsewhere in Africa (Kuepie, Nordman et al. 2009). We did find
that their parents reported a willingness to pay for this education, and for the younger children in
this study, parent’s views of perceived returns may be most important (Jensen 2010). A literate and
numerate child would probably move to the capital, or another major city, where demand for skilled
labour is strong.
‐ 17 ‐
However, if demand for education were truly strong, we should expect communities and
households to find means to improve the quality and extent of schooling. There are some good
reasons to think that barriers to this are large. The extremely low education levels suggest some
communities will not have active members with the information and knowledge needed to
intervene successfully in schools. Private schools do exist in urban areas, but they are rare in small
villages. This is probably due to the large costs and logistic efforts needed to create, supervise, and
maintain schools in these isolated villages. Given the spending power of households is small (with
$88 average monthly household income), revenues would be modest.
Communities can and do form schools on their own, but to maintain these schools concerted
effort and financing is needed. We found students at community schools did not perform better
than those at state schools. Anecdotally, we were told in many villages that it is difficult for them to
attract good teachers who are willing to stay for long periods. Both seasonal and permanent
migration interferes with the sustainability of schools. Further, since families with school‐aged
children change as children grow up, there needs to be a means to ensure regular financing as
households who use the schools change. Some ethnic communities, such as the Fula, are known to
have stronger community structures than others such as Balanta, however ethnic background did
not correlate strongly with test outcomes (Einarsdó r 2004).
The fact that NGO financed schools, with better infrastructure and equipment, did not
demonstrate good test scores suggests that it is the operations in the classroom, such as teacher
activities and supervision of the outcomes of the school, which may be needed to generate better
outcomes.1314 One common barrier to all schools is language. Children and teachers have little
opportunity to use or improve Portuguese outside the classroom, and while teachers can teach using
local languages, the communication barrier when books are used, or literacy is taught, can be large.
It is hard to underestimate the difficult task a teacher faces. They work in communities where few
adults read and write, there are very few books and written language to be seen, children may not
have notebooks or pens and paper, and there is no good lighting at night.
13 In a study comparing children’s test results in 21 sub‐Saharan African nations, equipment and the number of school shifts of teachers were highly correlated with test score outcomes. We did not find similar results here. It is possible that reported correlations in our study, as well as this other study, effectively capture indicators of the schooling regime, rather than causality. Since no regimes appear to work across our populations, there are only weak correlations between indicator variables and test scores. Fehrler, S., K. Michaelowa and A. Wechtler (2009). "The effectiveness of inputs in primary education: insights from recent student surveys for Sub‐Saharan Africa." Journal of Development Studies (U K ) 45, No. 9: 1545‐1578. 14 A randomized evaluation of providing text books to children in Kenya found no impact on test scores for children receiving text books Glewwe, P., M. Kremer and S. Moulin (2009). "Many Children Left Behind? Textbooks and Test Scores in Kenya." American Economic Journal: Applied Economics 1(1): 112‐135.
‐ 18 ‐
The results from our survey suggest there is little pressure coming from teachers, or their
supervisors, to improve outcomes at schools. We are not aware of any attempts to incentivize
teachers to improve children’s educational outcomes (Glewwe, Ilias et al. 2010). Nearly all teachers
reported they were testing children regularly, and classes appeared to be functioning in most
schools. Hence, teachers must have been aware that children were faring extremely poorly at
schools compared to national standards.
If demand for education services is substantial, while collective action problems prevent the
formation of functioning schools, then we should observe that a provision of high quality services
would lead to substantial improvement in learning outcomes, especially compared to the low levels
observed in these villages in 2010. A cluster randomized controlled trial has recently been
completed in tribal regions of Andhra Pradesh, where public school quality is considered to be very
low, to learn whether average test scores of all children in villages can be raised if the children are
offered additional, high quality, afterschool training for their children. Such research will help
discern whether supply, rather than issues related to the demand for schooling, drives the poor
results in that region (Eble, Mann et al. 2010).
There are no randomized school allocations or “natural experiments” which could permit us to
examine whether improved supply of quality schooling has a causal impact on outcomes in our
survey population. We could only determine indicators of quality through variables such as the
availability of textbooks, chalkboards, and some basic characteristics of teachers. The results from
this analysis were mixed, but generally suggested that improvements in these indicators do not
correlate with large changes in educational outcomes.
6 Conclusion
Guinea‐Bissau is an extremely poor nation with frequent political instability and poor schooling,
health, and educational infrastructure. As we prepared our survey in 2009, the President was
assassinated. In the midst of our survey in April 2010, the Prime Minister and Army Chief of Staff
were imprisoned during an attempted coup. While other parts of Africa are reported to be
improving rapidly on socioeconomic indicators, Guinea‐Bissau is an example of a country which
appears trapped in poverty despite official data which claims improvements. Our survey suggests
nearly the entire current generation of children in rural villages is growing up innumerate and
illiterate.
Our survey indicated substantial desire by parents and household chiefs for improved education
in villages. Children continue to attend schools despite learning very little, and amongst schools that
‐ 19 ‐
were open, teachers were usually in the classrooms. Despite this, little learning is occurring. We
believe a main factor driving these poor results is poor quality of teaching within the schools.
Teachers are isolated, underequipped, receive salaries after long delays, and have little training. A
program that substantially improved conditions for teaching, while introducing strong supervision of
teachers and monitoring of student progress, may address some of the key reasons that children are
learning little despite attending schools.
However, further research is needed to learn which factors are at the heart of Guinea‐Bissau’s
poor outcomes, and to understand which interventions may be able to change these. If left
unattended, educational outcomes of young children in rural Guinea‐Bissau are likely to remain dire
well into the future.
‐ 20 ‐
References:
Bank, W. (2012). "World Development Report 2012: Gender Equality and Development." 458. Boone, P. and S. Johnson (2009). Breaking out of the Pocket: Do Health Interventions Work? What Works in Development: Thinking Big and Thinking Small. J. Cohen and W. Easterly. Washington, D.C., Brookings Institution Press: 55‐90. Eble, A., V. Mann, P. Bhakta, R. Lakshminarayana, C. Frost, D. Elbourne and P. Boone (2010). "The STRIPES trial‐‐support to rural India's public education system." Trials 11: 10. Einarsdó r, J. n. n. (2004). Tired of weeping : mother love, child death, and poverty in Guinea‐Bissau. Madison, University of Wisconsin Press. Fehrler, S., K. Michaelowa and A. Wechtler (2009). "The effectiveness of inputs in primary education: insights from recent student surveys for Sub‐Saharan Africa." Journal of Development Studies (U K ) 45, No. 9: 1545‐1578. Glewwe, P., N. Ilias and M. Kremer (2010). "Teacher Incentives." American Economic Journal: Applied Economics 2(3): 205‐227. Glewwe, P., M. Kremer and S. Moulin (2009). "Many Children Left Behind? Textbooks and Test Scores in Kenya." American Economic Journal: Applied Economics 1(1): 112‐135. Jensen, R. (2010). "THE (PERCEIVED) RETURNS TO EDUCATION AND THE DEMAND FOR SCHOOLING." The Quarterly Journal of Economics 125(2): 515‐548. Jerven, M. (2013). Poor Numbers: How We Are Misled by African Development Statistics and What to Do about It, Cornell University Press. Kremer, M. (2003). "Randomized Evaluations of Educational Programs in Developing Countries: Some Lessons." American Economic Review 93(2): 102‐106. Kremer, M. and A. Holla (2009). "Improving Education in the Developing World: What Have We Learned from Randomized Evaluations?" Annual Review of Economics 1(1): 513‐542. Kuepie, M., C. J. Nordman and F. o. Roubaud (2009). "Education and earnings in urban West Africa." Journal of Comparative Economics (U S ) 37, No. 3: 491‐515. Luman, E. T., A. Worku, Y. Berhane, R. Martin and L. Cairns (2007). "Comparison of two survey methodologies to assess vaccination coverage." Int J Epidemiol 36(3): 633‐641. Paul Schultz, T. (2004). "School subsidies for the poor: evaluating the Mexican Progresa poverty program." Journal of Development Economics 74(1): 199‐250. Ramachandran, V. (2003). Getting Children Back to School: Case Studies in Primary Education. Delhi, India, Sage India: 440. Young, A. (2012). "The African Growth Miracle." Journal of Political Economy 120(4): 696‐739.
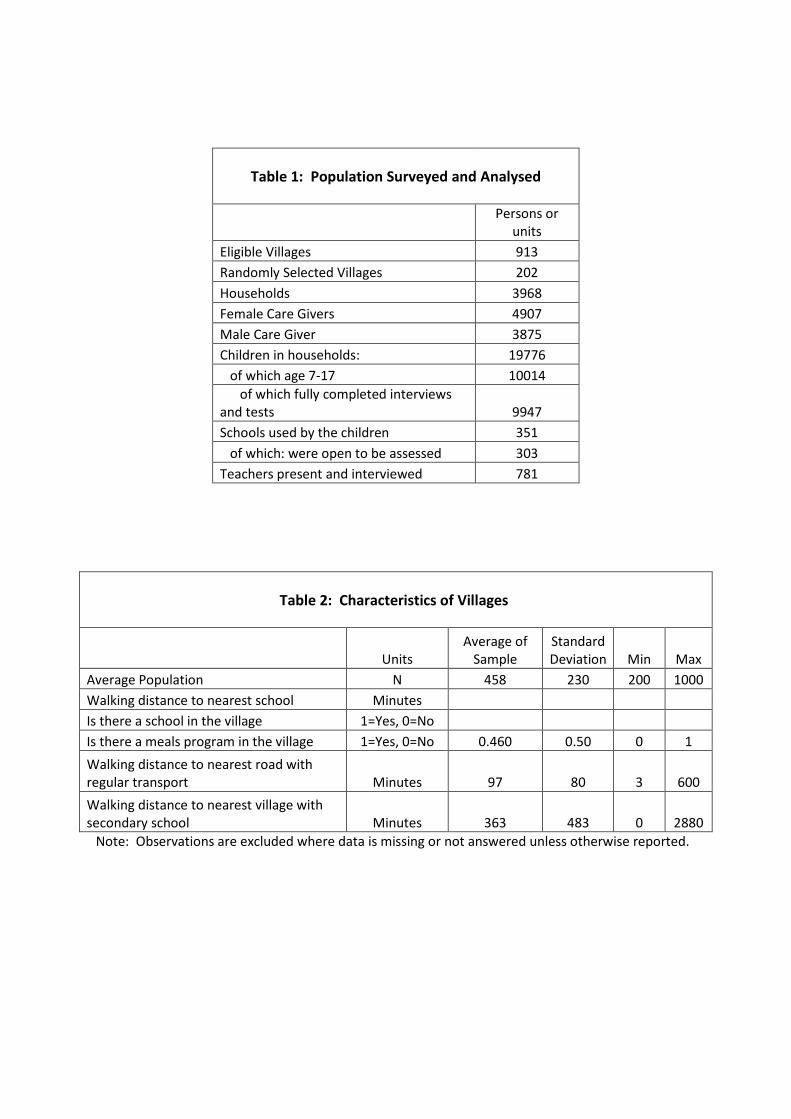
Table 1: Population Surveyed and Analysed
Persons or units
Eligible Villages 913 Randomly Selected Villages 202 Households 3968 Female Care Givers 4907 Male Care Giver 3875 Children in households: 19776 of which age 7-17 10014 of which fully completed interviews and tests 9947 Schools used by the children 351 of which: were open to be assessed 303 Teachers present and interviewed 781
Table 2: Characteristics of Villages
Units Average of
Sample Standard Deviation Min Max
Average Population N 458 230 200 1000 Walking distance to nearest school Minutes Is there a school in the village 1=Yes, 0=No Is there a meals program in the village 1=Yes, 0=No 0.460 0.50 0 1 Walking distance to nearest road with regular transport Minutes 97 80 3 600 Walking distance to nearest village with secondary school Minutes 363 483 0 2880
Note: Observations are excluded where data is missing or not answered unless otherwise reported.
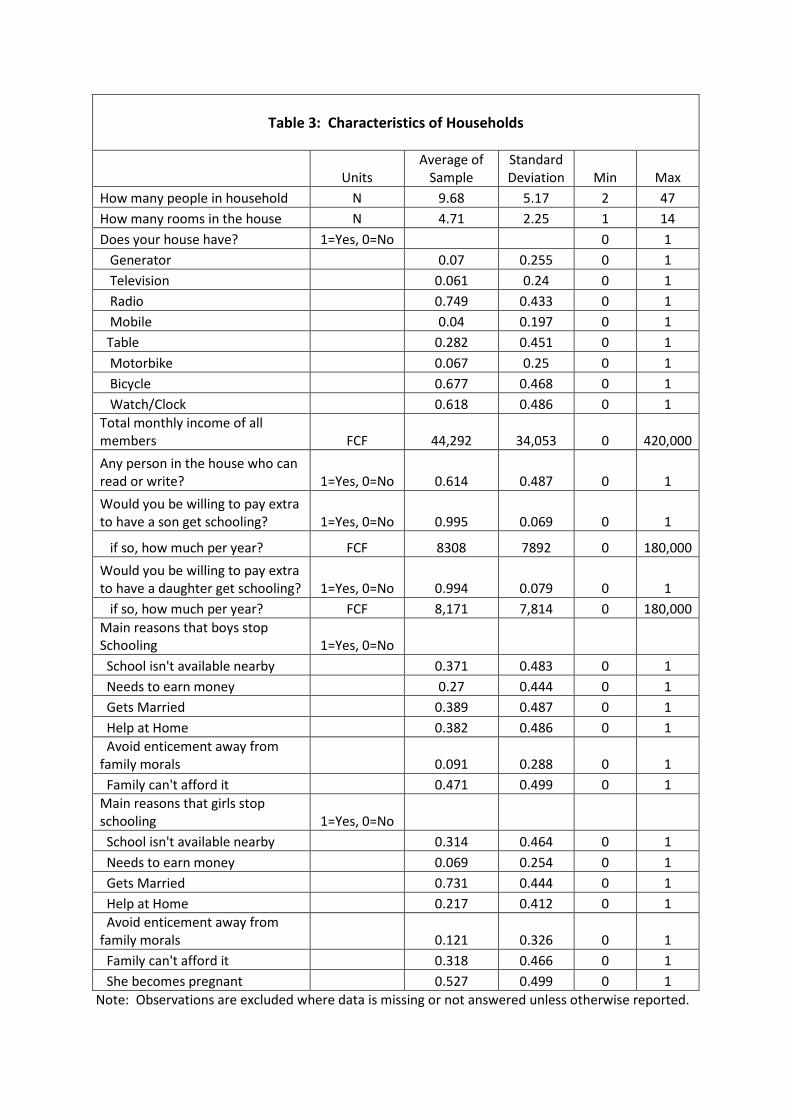
Table 3: Characteristics of Households
Units Average of
Sample Standard Deviation Min Max
How many people in household N 9.68 5.17 2 47 How many rooms in the house N 4.71 2.25 1 14 Does your house have? 1=Yes, 0=No 0 1 Generator 0.07 0.255 0 1 Television 0.061 0.24 0 1 Radio 0.749 0.433 0 1 Mobile 0.04 0.197 0 1 Table 0.282 0.451 0 1 Motorbike 0.067 0.25 0 1 Bicycle 0.677 0.468 0 1 Watch/Clock 0.618 0.486 0 1 Total monthly income of all members FCF 44,292 34,053 0
420,000
Any person in the house who can read or write? 1=Yes, 0=No 0.614 0.487 0 1 Would you be willing to pay extra to have a son get schooling? 1=Yes, 0=No 0.995 0.069 0 1
if so, how much per year? FCF 8308 7892 0 180,000 Would you be willing to pay extra to have a daughter get schooling? 1=Yes, 0=No 0.994 0.079 0 1 if so, how much per year? FCF 8,171 7,814 0 180,000 Main reasons that boys stop Schooling 1=Yes, 0=No School isn't available nearby 0.371 0.483 0 1 Needs to earn money 0.27 0.444 0 1 Gets Married 0.389 0.487 0 1 Help at Home 0.382 0.486 0 1 Avoid enticement away from family morals 0.091 0.288 0 1 Family can't afford it 0.471 0.499 0 1 Main reasons that girls stop schooling 1=Yes, 0=No School isn't available nearby 0.314 0.464 0 1 Needs to earn money 0.069 0.254 0 1 Gets Married 0.731 0.444 0 1 Help at Home 0.217 0.412 0 1 Avoid enticement away from family morals 0.121 0.326 0 1 Family can't afford it 0.318 0.466 0 1 She becomes pregnant 0.527 0.499 0 1
Note: Observations are excluded where data is missing or not answered unless otherwise reported.
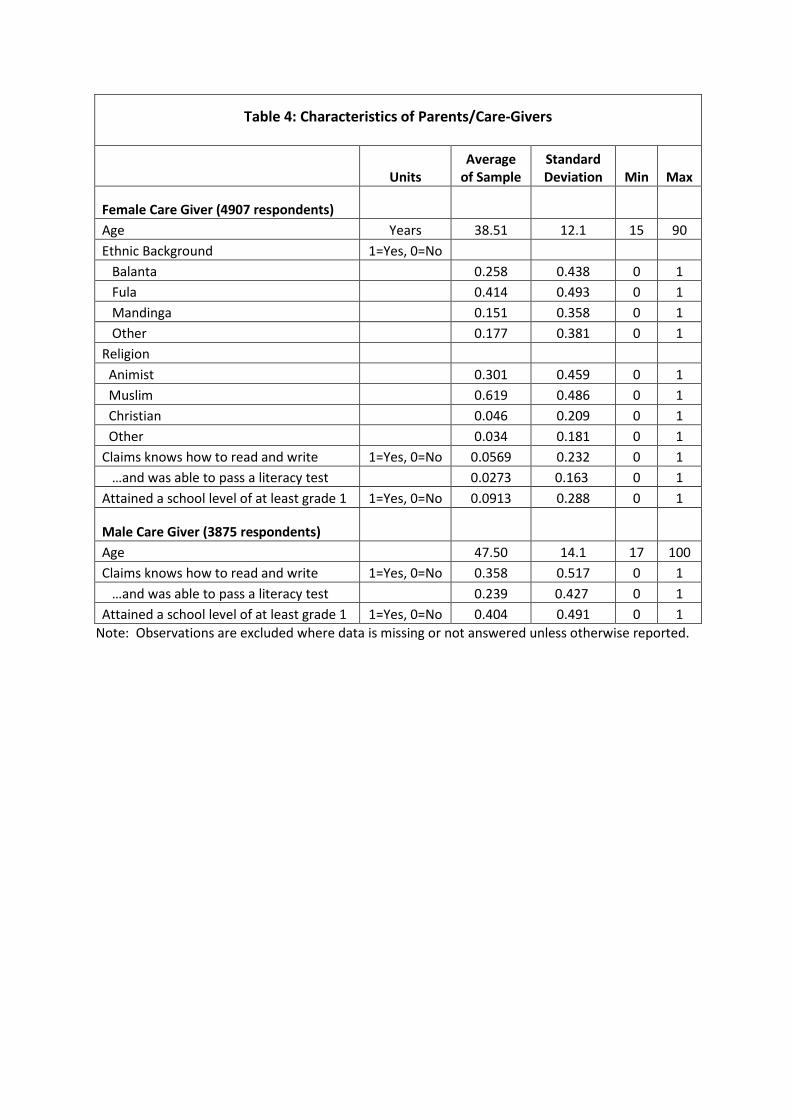
Table 4: Characteristics of Parents/Care-Givers
Units Average
of Sample Standard Deviation Min Max
Female Care Giver (4907 respondents) Age Years 38.51 12.1 15 90 Ethnic Background 1=Yes, 0=No Balanta 0.258 0.438 0 1 Fula 0.414 0.493 0 1 Mandinga 0.151 0.358 0 1 Other 0.177 0.381 0 1 Religion Animist 0.301 0.459 0 1 Muslim 0.619 0.486 0 1 Christian 0.046 0.209 0 1 Other 0.034 0.181 0 1 Claims knows how to read and write 1=Yes, 0=No 0.0569 0.232 0 1 …and was able to pass a literacy test 0.0273 0.163 0 1 Attained a school level of at least grade 1 1=Yes, 0=No 0.0913 0.288 0 1
Male Care Giver (3875 respondents) Age 47.50 14.1 17 100 Claims knows how to read and write 1=Yes, 0=No 0.358 0.517 0 1 …and was able to pass a literacy test 0.239 0.427 0 1 Attained a school level of at least grade 1 1=Yes, 0=No 0.404 0.491 0 1
Note: Observations are excluded where data is missing or not answered unless otherwise reported.
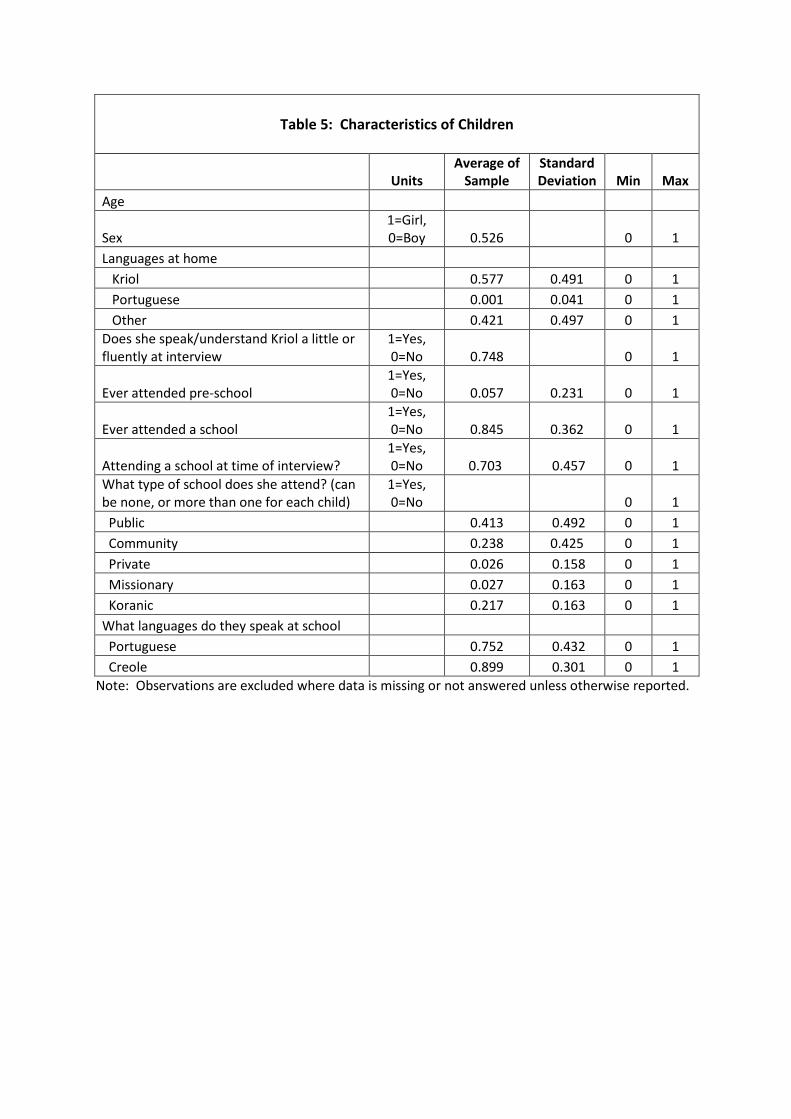
Table 5: Characteristics of Children
Units
Average of Sample
Standard Deviation Min Max
Age
Sex 1=Girl, 0=Boy 0.526 0 1
Languages at home Kriol 0.577 0.491 0 1 Portuguese 0.001 0.041 0 1 Other 0.421 0.497 0 1 Does she speak/understand Kriol a little or fluently at interview
1=Yes, 0=No 0.748 0 1
Ever attended pre-school 1=Yes, 0=No 0.057 0.231 0 1
Ever attended a school 1=Yes, 0=No 0.845 0.362 0 1
Attending a school at time of interview? 1=Yes, 0=No 0.703 0.457 0 1
What type of school does she attend? (can be none, or more than one for each child)
1=Yes, 0=No 0 1
Public 0.413 0.492 0 1 Community 0.238 0.425 0 1 Private 0.026 0.158 0 1 Missionary 0.027 0.163 0 1 Koranic 0.217 0.163 0 1 What languages do they speak at school Portuguese 0.752 0.432 0 1 Creole 0.899 0.301 0 1
Note: Observations are excluded where data is missing or not answered unless otherwise reported.
Note: Observations are excluded where data is missing or not answered unless otherwise reported. *Teachers teach an average 1.67 classes, so pupils per class will be lower.
Table 6: Characteristics of Schools
Units
Average of
Sample Standard Deviation Min Max
Schools (303 respondents) School Type 1=Yes, 0=No Public
0.591 0.493 0 1
Community 0.314 0.465 0 1 Private 0.059 0.237 0 1 Missionary 0.036 0.187 0 1 Does the School Receive Support from the Community? 1=Yes, 0=No Cleaning 0.538 0.499 0 1 for Teachers 0.277 0.448 0 1 Food 0.185 0.389 0 1 Water 0.092 0.29 0 1 Infrastructure 0.469 0.5 0 1 How many teachers for Grades 1-4 work in the school Male N 2.38 1.55 0 11 Female N 0.611 1.31 0 8 How many children are enrolled in Grades 1-4 Grade 1 N 60.7 39.1 7 252 Grade 2 N 45.7 33.7 6 221 Grade 3 N 39.7 294 6 184 Grade 4 N 42.7 34.5 4 210 Average pupil per teacher ratio for combined grades 1-4* N 63.4 24.4 7.2 17.8 Attendance ratio at time of visit (amongst schools that were operating when visited) Grade 1 Proportion 0.772 0.223 0.139 1.72 Grade 2 Proportion 0.74 0.236 0.056 2.07 Grade 3 Proportion 0.724 0.306 0.083 3.29 Grade 4 Proportion 0.744 0.233 0.067 1.92 Average number of math text books per enrolled child at the school Grade 1 Proportion 0.033 0.135 0 1 Grade 2 Proportion 0.035 0.102 0 0.96 Grade 3 Proportion 0.036 0.123 0 1 Grade 4 Proportion 0.041 0.112 0 0.88 Does the school have a toilet? 1=Yes, 0=No 0.452 0.499 0 1 Does the school have drinking water available? 1=Yes, 0=No 0.274 0.447 0 1
Note: Observations are excluded where data is missing or not answered unless otherwise reported.
Table 7: Characteristics of Teachers
Units
Average of
Sample Standard Deviation Min Max
Gender 1=Female,0=Male 0.19 0.392 0 1 Age Years 38.5 10.7 18 61 Highest grade achieved Grade level 9.41 1.74 4 12 Did she receive training before teaching? 0.595 1.23 0 8 How many years has she been teaching? Years 12.6 11.6 0 46 How many years has she been teaching at this school? Years 6.51 6.48 0 35 Does she use a textbook when teaching? 1=Yes, 0=No 0.739 0.44 0 1 Does she test students regularly? 1=Yes, 0=No .986 .118 0 1
Note: Tests were conducted sequentially. For example, if a child was unable to a sentence. Based on 9,947 test scores.
Table 8: Results from Numeracy Tests by Age and Standard Achieved
Percentage of Children, by Age, at Specific Standards Age: 7 8 9 10 11 12 13 14 15 16 17
Standard Test
Score:
Not able to recognize single digits 0 78.13 61.24 44.57 36.36 26.27 21.02 15.92 14.71 17.57 13.64 14.04
Can recognize single digit numbers 1 18.66 28.45 34.63 31.22 33.05 25.34 21.46 19.33 15.34 15.29 7.88
Can recognize two digit numbers 2 1.77 5.96 9.73 13.43 14.16 16.4 17.33 16.46 13.81 14.67 16.01
Can add two single digit numbers 3 0.52 1.45 4 5.47 5.21 8.25 9.43 7.23 8.37 5.58 4.93
Can add a single and two digit number 4 0.59 1.87 5.43 7.44 12.59 16.01 19.93 20.7 19.67 20.45 18.97
5 0.33 0.68 0.92 3.34 4.84 7.37 5.31 7.61 10.04 7.23 8.62
Can subtract one two digit number from another 6 0 0.17 0.31 1.45 1.57 2.06 3.42 5.49 4.74 7.64 8.13
7 0 0 0.2 0.68 0.97 1.08 3.42 3.49 3.35 7.23 6.4 Can multiply a two digit number by a single digit number 8 0 0.17 0.2 0.34 0.85 1.18 1.18 2.62 2.09 2.48 5.91
9 0 0 0 0.17 0.24 0.79 1.18 0.75 1.26 2.07 2.71
Can divide a single digit into a two digit number 10 0 0 0 0 0 0.2 0.59 0.25 1.12 1.24 1.72
11 0 0 0 0 0 0.1 0.24 0.62 1.53 1.45 1.97
Inexact division, a single digit into a two digit number 12 0 0 0 0.09 0.24 0.2 0.59 0.75 1.12 1.03 2.71 Total 100.0 100.0 100.0 100.0 100.0 100.0 100.0 100.0 100.0 100.0 100.0 Number 1,527 1,174 976 1,169 826 1,018 848 802 717 484 406
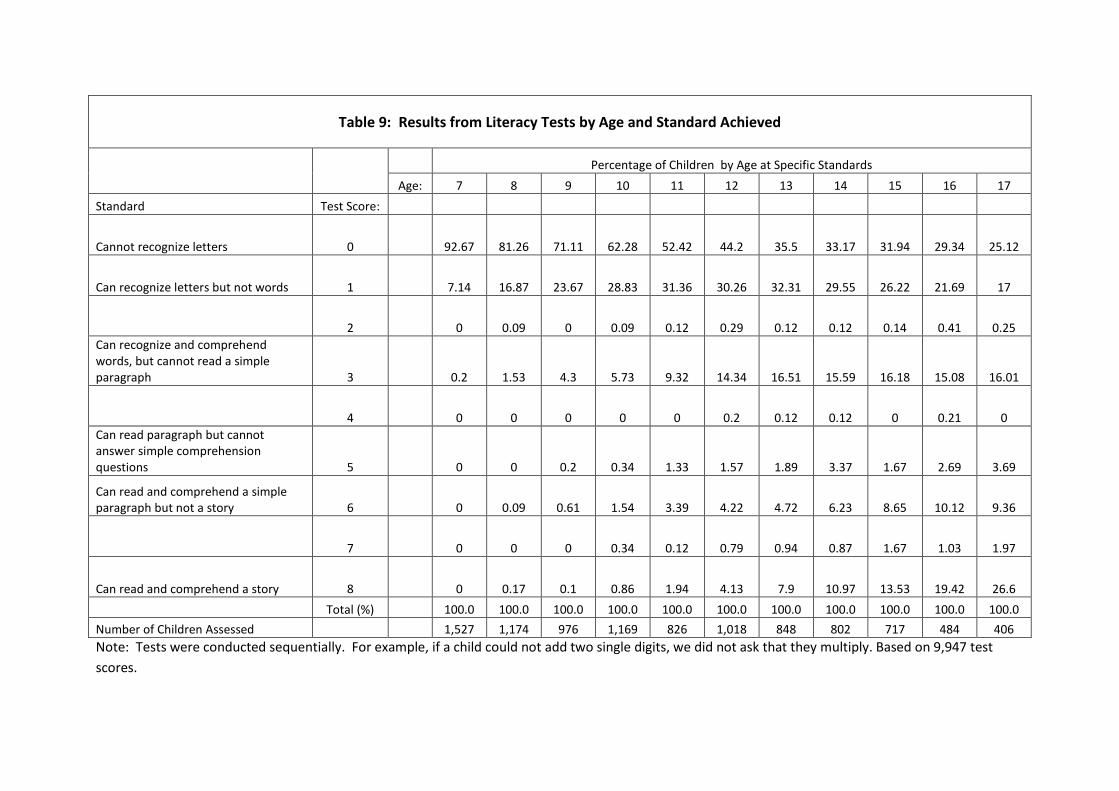
Table 9: Results from Literacy Tests by Age and Standard Achieved
Percentage of Children by Age at Specific Standards Age: 7 8 9 10 11 12 13 14 15 16 17
Standard Test Score:
Cannot recognize letters 0 92.67 81.26 71.11 62.28 52.42 44.2 35.5 33.17 31.94 29.34 25.12
Can recognize letters but not words 1 7.14 16.87 23.67 28.83 31.36 30.26 32.31 29.55 26.22 21.69 17
2 0 0.09 0 0.09 0.12 0.29 0.12 0.12 0.14 0.41 0.25 Can recognize and comprehend words, but cannot read a simple paragraph 3 0.2 1.53 4.3 5.73 9.32 14.34 16.51 15.59 16.18 15.08 16.01
4 0 0 0 0 0 0.2 0.12 0.12 0 0.21 0 Can read paragraph but cannot answer simple comprehension questions 5 0 0 0.2 0.34 1.33 1.57 1.89 3.37 1.67 2.69 3.69
Can read and comprehend a simple paragraph but not a story 6 0 0.09 0.61 1.54 3.39 4.22 4.72 6.23 8.65 10.12 9.36
7 0 0 0 0.34 0.12 0.79 0.94 0.87 1.67 1.03 1.97
Can read and comprehend a story 8 0 0.17 0.1 0.86 1.94 4.13 7.9 10.97 13.53 19.42 26.6 Total (%) 100.0 100.0 100.0 100.0 100.0 100.0 100.0 100.0 100.0 100.0 100.0 Number of Children Assessed 1,527 1,174 976 1,169 826 1,018 848 802 717 484 406 Note: Tests were conducted sequentially. For example, if a child could not add two single digits, we did not ask that they multiply. Based on 9,947 test scores.
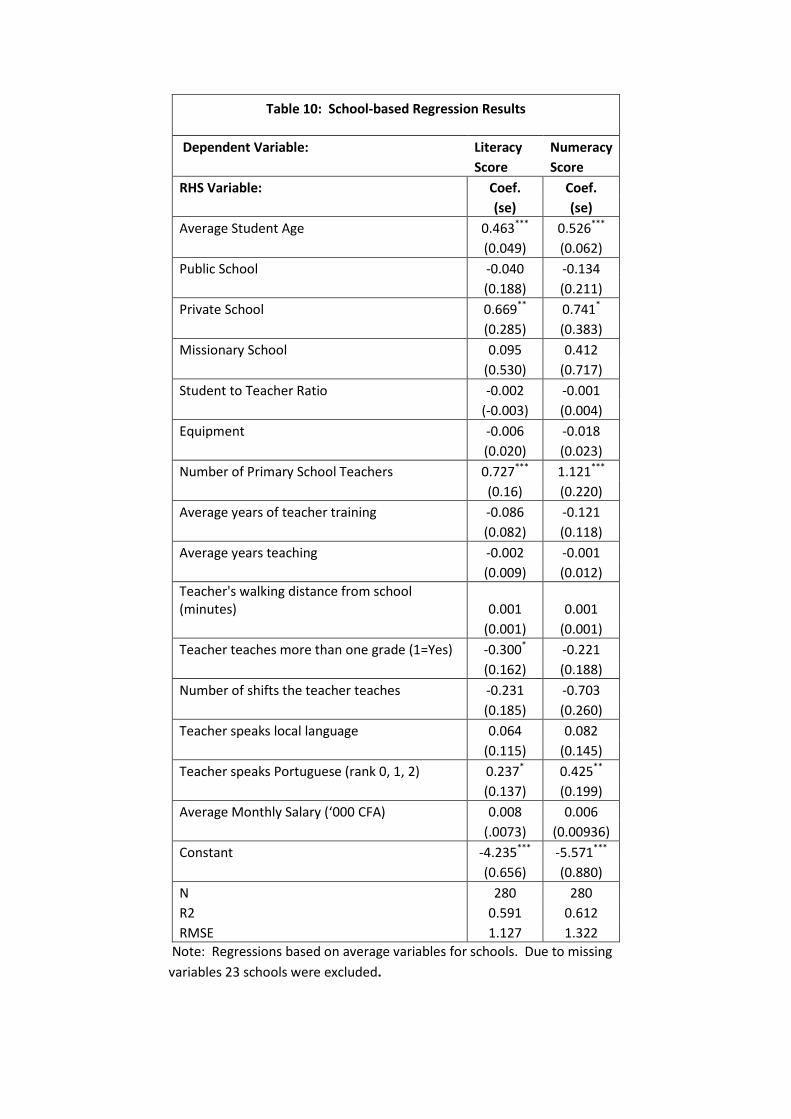
Table 10: School-based Regression Results
Dependent Variable: Literacy Numeracy Score Score RHS Variable: Coef. Coef. (se) (se) Average Student Age 0.463*** 0.526***
(0.049) (0.062) Public School -0.040 -0.134 (0.188) (0.211) Private School 0.669** 0.741*
(0.285) (0.383) Missionary School 0.095 0.412 (0.530) (0.717) Student to Teacher Ratio -0.002 -0.001 (-0.003) (0.004) Equipment -0.006 -0.018 (0.020) (0.023) Number of Primary School Teachers 0.727*** 1.121***
(0.16) (0.220) Average years of teacher training -0.086 -0.121 (0.082) (0.118) Average years teaching -0.002 -0.001 (0.009) (0.012) Teacher's walking distance from school (minutes) 0.001 0.001 (0.001) (0.001) Teacher teaches more than one grade (1=Yes) -0.300* -0.221 (0.162) (0.188) Number of shifts the teacher teaches -0.231 -0.703 (0.185) (0.260) Teacher speaks local language 0.064 0.082 (0.115) (0.145) Teacher speaks Portuguese (rank 0, 1, 2) 0.237* 0.425**
(0.137) (0.199) Average Monthly Salary (‘000 CFA) 0.008 0.006 (.0073) (0.00936) Constant -4.235*** -5.571***
(0.656) (0.880) N 280 280 R2 0.591 0.612 RMSE 1.127 1.322
Note: Regressions based on average variables for schools. Due to missing variables 23 schools were excluded.
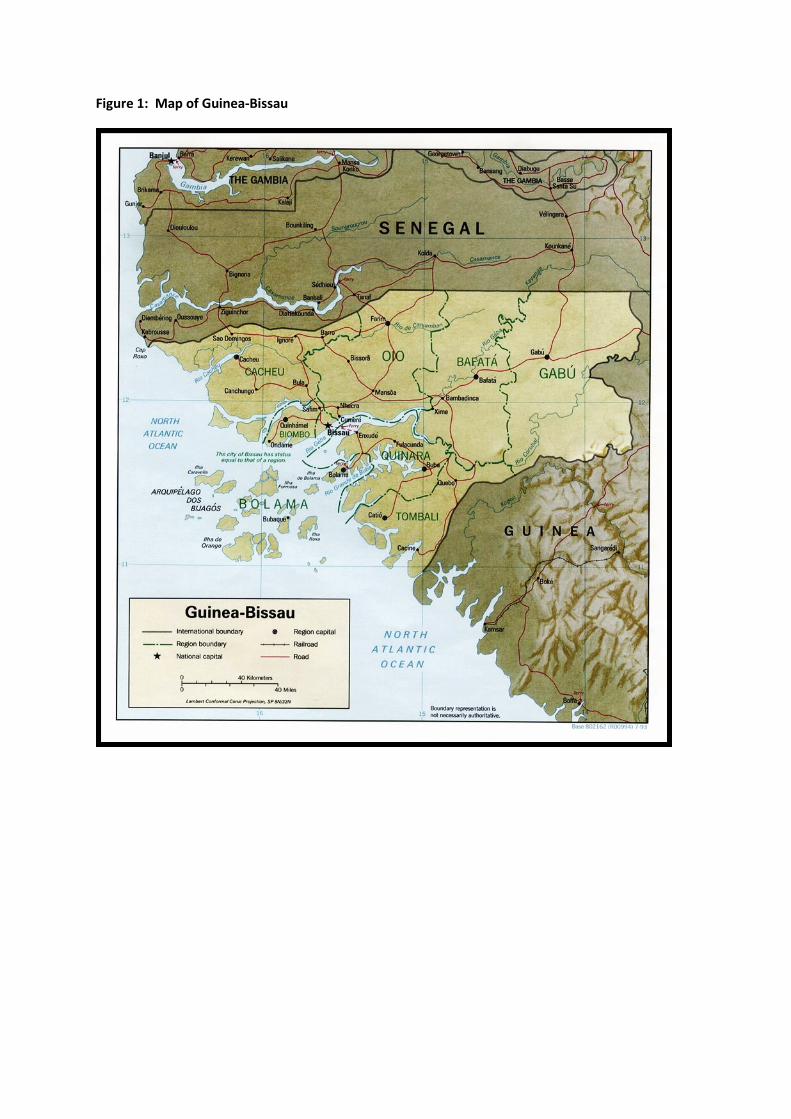
Figure 1: Map of Guinea-Bissau
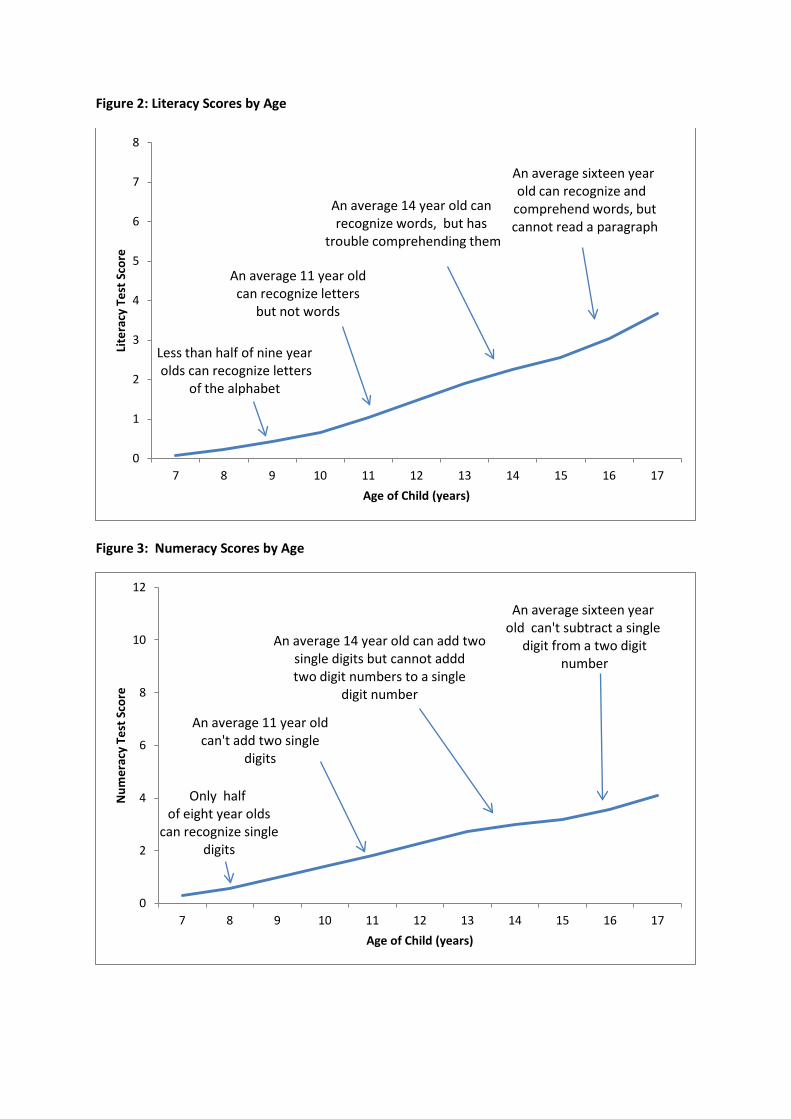
Figure 2: Literacy Scores by Age
Figure 3: Numeracy Scores by Age
0
1
2
3
4
5
6
7
8
7 8 9 10 11 12 13 14 15 16 17
Lite
racy
Tes
t Sco
re
Age of Child (years)
An average 11 year old can recognize letters
but not words
Less than half of nine year olds can recognize letters
of the alphabet
An average sixteen year old can recognize and
comprehend words, but cannot read a paragraph
An average 14 year old can recognize words, but has
trouble comprehending them
0
2
4
6
8
10
12
7 8 9 10 11 12 13 14 15 16 17
Num
erac
y Te
st S
core
Age of Child (years)
An average 11 year old can't add two single
digits
Only half of eight year olds
can recognize single digits
An average sixteen year old can't subtract a single
digit from a two digit number
An average 14 year old can add two single digits but cannot addd two digit numbers to a single
digit number
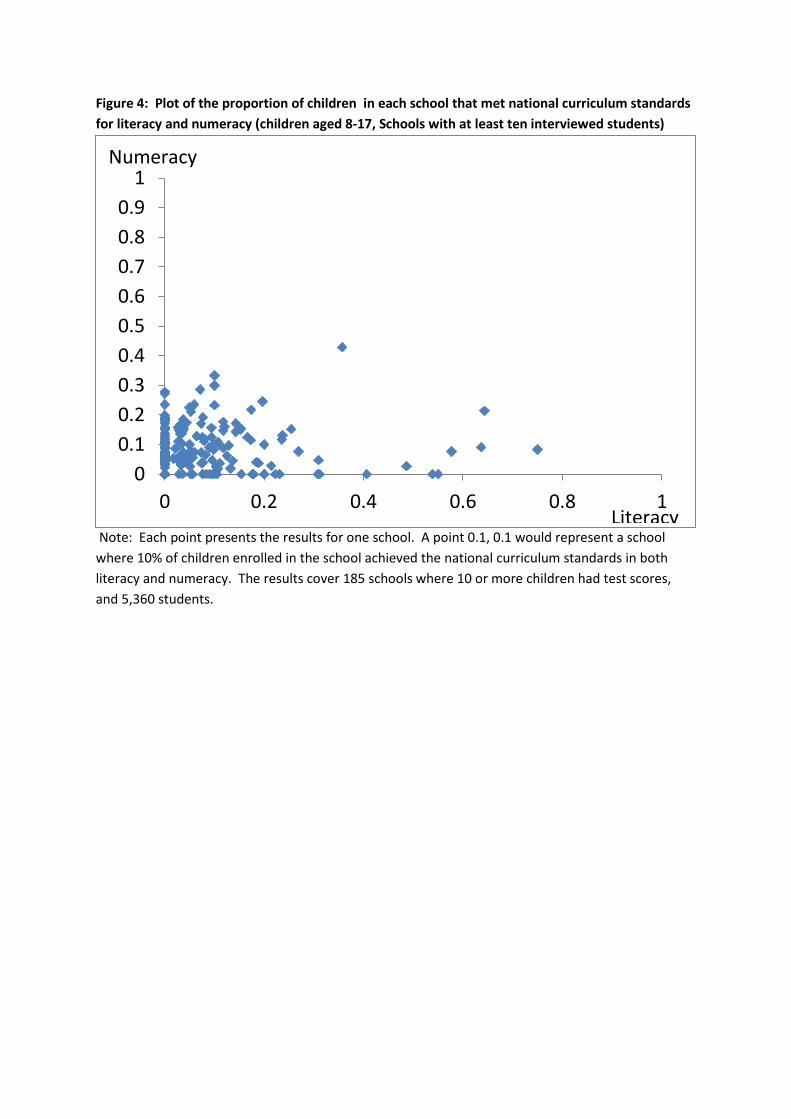
Figure 4: Plot of the proportion of children in each school that met national curriculum standards for literacy and numeracy (children aged 8-17, Schools with at least ten interviewed students)
Note: Each point presents the results for one school. A point 0.1, 0.1 would represent a school where 10% of children enrolled in the school achieved the national curriculum standards in both literacy and numeracy. The results cover 185 schools where 10 or more children had test scores, and 5,360 students.
0 0.1 0.2 0.3 0.4 0.5 0.6 0.7 0.8 0.9
1
0 0.2 0.4 0.6 0.8 1 Literacy
Numeracy