Embed Size (px)
Citation preview

Nature and Science 2015;13(12) http://www.sciencepub.net/nature
16
Comparative Study between Blue Ballpoint Pen Inks and Blue Erasable Pen inks by Using Spectroscopic analysis and chromatography method
Mohamed B. Gazy1 Taha M. A. Eldebss2*, Waleed K. El-Zawawy3, Mohamed R. Helal4 and Khaled E. Rashed5
1 Organic Chemistry Department, Faculty of Science Al-Azher University, Cairo, Egypt
2 Organic Chemistry Department, Faculty of Science, Cairo University, Cairo , Egypt 3 Cellulose and paper Department, National Research Center, Giza, Egypt
4General Manager, Expert in Forgery and Counterfeiting Researches, Forensic Medicine Authority, Ministry of Justice, Cairo, Egypt
5Examiner documented Departments of Forgery and counterfeiting research Forensic Medicine authority- ministry of Justice, Cairo, Egypt
[email protected] [email protected]
Abstract: The forensic analysis of ink is of great interest particularly in the investigation of forgery cases relating to handwriting and signatures. Documents such as checks, travelers checks, passports, birth certificates, rent and ownership contracts, bills of exchange, bill of debt promissory notes, receipts secretariat, graduation certificates , parchment, certificates of army, exits contracts, cash receipts, contracts of employment, resignations, identity cards, signatures on art picture , currency , paper money, bank money, bank bill , bank book, credit cards, , bills of credit , bills of lading , bills of sale , cash deposit form, marriage contract , bills of divorce, rescripts, anonymous letters, obscene letters, and any doubtful documents….etc. As the documents are usually written with writing pens, it is therefore of interest to characterize the inks of different brands among the ballpoint pen inks and erasable Pen inks. In this study the ballpoint pen inks and erasable Pen inks components were analyzed by means of Ultraviolet visible (UV-Vis), infrared (IR) and Raman spectroscopy. UV-Vis analysis is successful in characterizing ballpoint pen inks and blue erasable Pen inks of different brands. IR analysis revealed that each brands could be characterized and then differentiated by looking the pattern of each spectra that related to different functional groups. Raman analysis is useful for comparison of ink brands. Thus all mentioned Spectra were adequate methods for analysis of inks components such as dyes, pigments and other components. Also, thin layer Chromatography (TLC) is used in different analytical methods especially forensic sciences as it is less time consuming, low cost, and can be performed with less complicated technique. It has a wide application in inks analysis, as it can be used to differentiate between the blue ballpoint Pen Inks and blue erasable Pen inks. [Mohamed B. Gazy, Taha M. A. Eldebss, Waleed K. El-Zawawy, Mohamed R. Helal and Khaled E. Rashed.
Comparative Study between Blue Ballpoint Pen Inks and Blue Erasable Pen inks by Using Spectroscopic analysis and chromatography method. Nat Sci 2015;13(12):16-27]. (ISSN: 1545-0740). http://www.sciencepub.net/nature. 3. doi:10.7537/marsnsj131215.03. Keywords: Ballpoint pen ink, erasable Pen inks, questioned documents, spectroscopic analyses, chromatography methods and forensic Sciences.
1. Introduction
Forensic ink analysis is directly related to the branch of questioned documents that can be found in many forms for various crimes including ransom or hate crime letters, forgeries, and more. Ink analysis can be used to help link a suspect to a crime or determine the authenticity of a questioned document. That can take in consideration when analyzing ink from a questioned document is that slight chemical interactions may occur between the paper and the ink. Ink analysis is part of the questioned documents branch of forensic science, Currently, the methods used in forensic ink analysis include microscopy [1]. Alternative light sources, liquid chromatography, Thin layer Chromatography (TLC), capillary electrophoresis (CE), Raman and infrared spectroscopy. Although there are general ASTM
standards for questioned document analysis, ASTM 1789-04 (Standard Guide for Writing Ink Identification) and ASTM E 1422-05 (Standard Guide for Test Methods for Forensic Writing Ink Comparison) were withdrawn in January 2013 and 2014, respectively, with no replacement. However, since ink analysis falls within the category of questioned document analysis, ASTM E 444 (Standard Guide for Scope of Work of Forensic Document Examiners) could be referenced.
In 2013 Braz et al. published a review article on the use of Raman spectroscopy for the analysis of inks on questioned documents [2]. Infrared spectroscopy is a common technique in the analysis of inks from questioned documents and can be useful to solve crimes. FT-IR microspectroscopy has been used in combination with SEM-EDS mapping to successfully

Nature and Science 2015;13(12) http://www.sciencepub.net/nature
17
determine the sequence of intersecting lines of ink and laser toner [3]. Ink analysis may be also an important part of the investigation of questioned documents including forged checks, bills, contracts and others. Ink analysis does focus on new chemical and analytical methods or techniques [4]. Government and private sector were using the ink examination as a method to ensure the authenticity or fake nature of the question document [5]. Ink analysis has been used by forensic scientist to identify inks on questioned documents. Examination and dating of inks on questioned documents has become common, and law enforcement agencies use this technique during their criminal investigations. Ink analysis involved the examination of documents using the naked eye, oblique lighting conditions and using special optical filters. It can be performed using optical, spectroscopic and chromatographic methods [6].Diffuse Reflectance Infrared Fourier Transform Spectroscopy (DRIFTS)[7] was utilized for the analysis of blue ballpoint pen ink samples on paper using KBr as a background. This analysis was found to give a poor discrimination between the ink spectra while Micro-ATR-IR was found to be a simpler technique for acquiring spectra of the ballpoint pen ink samples [8]. FTIR was used to analyze different historical writing ink samples and revealed the possibilities to identify the historical ink based on their chemical composition, and the nature of ingredients in different ink. However, only KBr pellet and ZnSe cell methods were successful [9] Studies on multivariate chemometrics for the forensic discrimination of blue ballpoint pen inks based on their Vis spectra showed that the results of UV-Vis spectra of ink were difficult to compare but, the used ink sample size was very small to overcome this problem. Each of the spectra represents the average of the absorption from the same batch. Chemometrics application such as cluster analysis (CA), principal component analysis (PCA) and discriminate analysis (DA) were successively used to calculate the discriminate model. UV-VIS examination may indicates that the document has been stained by chemicals or other materials that may affect the ink analysis [10,11].
Thin layer chromatography (TLC) is a chromatography technique used to separate mixtures. Thin layer chromatography is performed on a sheet of glass, plastic, or aluminum foil, which is coated with a thin layer of adsorbent material, usually silica gel, aluminum oxide, or cellulose. This layer of adsorbent is known as the stationary phase. After the sample has been applied on the plate, a solvent or solvent mixture (known as the mobile phase) is drawn up the plate via capillary action. Because different analysts ascend the TLC plate at different rates, separation is achieved. The behavior of an individual compound in TLC is
characterized by a quantity Known as retardation factor Rƒ and is expressed as a decimal fraction. The Rƒ is calculated by dividing the distance in which the compound traveled from the original position by the distance the solvent travelled from the original position (the solvent front) .Rƒ = Distance of centre of spot from starting point/ Distance of solvent front from starting point [12-14].
2. Aim of the study:
The aim of this study is to evaluate the four methods used in analyses the inks for writing documents; thin-layer chromatography and spectroscopic methods (UV-VIS examination -infrared spectroscopy - Raman spectroscopy) where destructive examination ( thin-layer chromatography and UV-VIS examination-infrared spectroscopy) and non-destructive as (Raman spectroscopy). In addition to, potentiality of these methods to discriminate between blue ballpoint Pen Inks and blue erasable Pen inks. As well as an opportunity for designed purpose of forensic analysis. 3. Materials and Methods 3.1Materials 3.1.1Sample Preparation
The Blue Ballpoint Pen Inks and Blue an erasable Pen inks of five different brands were used to be analyzed in this study, the sample codes for the blue ballpoint pen inks and Blue an erasable Pen inks used are listed in table 1.
Table 1: Sample of blue ballpoint pen inks and Blue an erasable Pen inks of different brands
No. Ink Brand No. of Pen
Pen code
1 Reynolds Blue 10 E1 2 PRIMA solo Blue 10 E2 3 XZB 0,8 mm Blue 10 E3 4 SCMv12590,5mm Blue 10 E4 5 “Frixion’’ eraser.max
Blue 10 E5
Blue ballpoint inks and Blue an erasable Pen inks
mentioned in Table1 are collected in bottles and marked by Pen codes and the results were recorded. 3.2 Methods of Analysis 3.2.1 Chromatography methods 3.2.1.1 Thin Layer Chromatography
The separation of ink components is carried out by TLC (which includes preparation of silica gel glass plates in distilled water). Each of ink is dissolved in a suitable solvent. (E1and E2) dissolved in isopropanol, (E3 and E4) dissolved in petroleum ether, and E5 dissolved in water/ethanol mixture. All the spots were

Nature and Science 2015;13(12) http://www.sciencepub.net/nature
18
approximately 0.5-0.8mm in diameter and the amount of applied inks were about 1.0-1.5µg. The original were at 1.0cm from the bases of the plate. The used developing solvents were chloroform /methanol (90:10) where, different colors of dye components were
eluted from plate and collected for further analysis. The retardation factor, Rf and color tones of the separated bands were recorded according to the technique used in caseworks [15-18].
Fig (1) chromatogram of different brands ink (normal light)
Fig (2) chromatogram of different brands ink (UV) at 254nm
Table 2: Separate colour bands of blue ballpoint pen inks and Blue an erasable Pen inks Of different brands and their Rf values
Pen code Pen code of band
colour Rf values
E1 B1 Dark Blue 0.31 light Blue 0.62
E2 B2 Dark pink 0,12 pink 0,34
light pink 0.60 E3 B3 pink 0.34
light Blue 0.68 E4 B4 pink 0.37
light Blue 0.68 E5 B5 No. Spots zero
3.2.2 Spectroscopic Analysis 3.2.2.1Ultraviolet Analysis
Inks that used for UV–Vis analysis were dissolved in the suitable solvent such chloroform or ethanol (ethanol used as a blank solvent). Absorbance
spectrum was recorded in the wavelength range 100-800 nm. Where the maximum absorbance from each sample was obtained. The spectra regard comparison the maximum wave length and relative beak heights of the components peak for each sample [19,20]. {Ultraviolet Spectrophotometer Jenway Spectrophotometer – Model: 6505 UV-Vis-Voltage320/115v- Power 200 Frequency50/60, UK by Jenway led. Felsted, Dunmow, Essexch63lb}. 3.2.1.2 Infrared Analysis
10µL of ink sample was added to 100 mg of KBr powder. The sample extract was then grinded with KBr powder using mortar and pestle. The sample was totally dried and then pressed into KBr disc. Five tone pressures were applied to the sample to form a transparent disc. Infrared spectrum for each sample was recorded in the range of 500cm-1 to 4000cm-1.Infrared Spectrophotometer {(IR Spectra recorded on Shimadzu FT-IR8101 PC Infrared Spectrophotometer (Japan)}[21].
Nature and Science 2015;13(12) http://www.sciencepub.net/nature
19
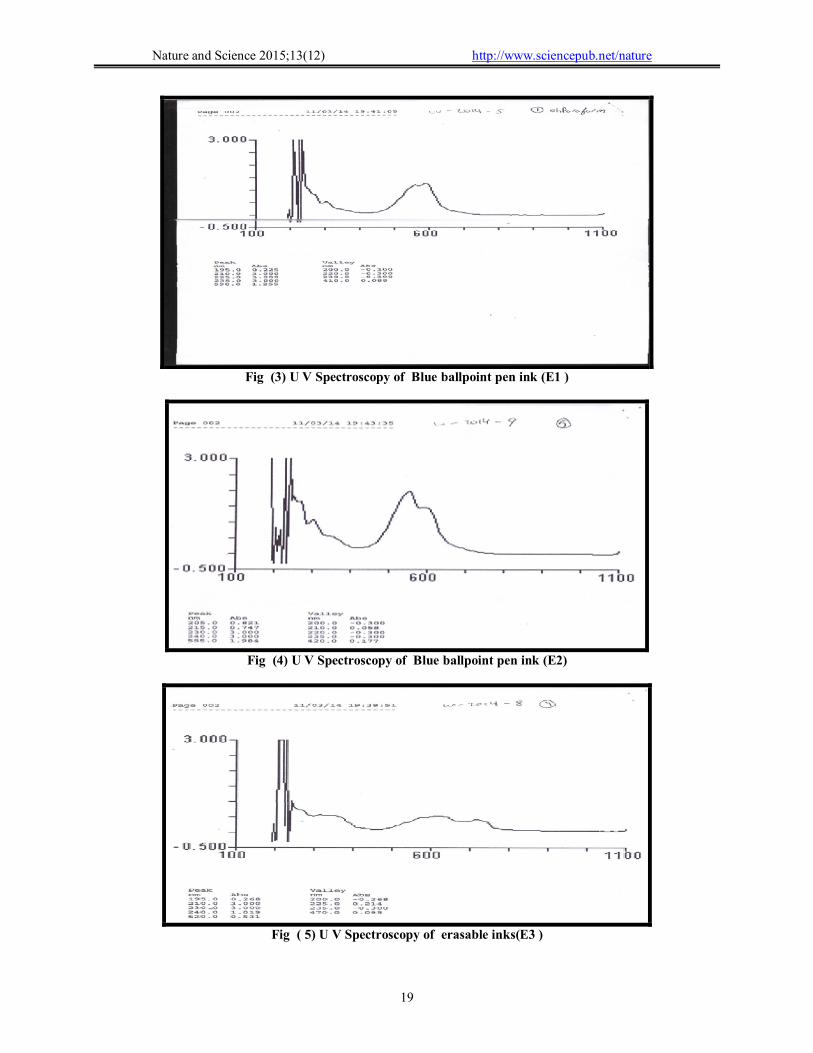
Fig (3) U V Spectroscopy of Blue ballpoint pen ink (E1 )
Fig (4) U V Spectroscopy of Blue ballpoint pen ink (E2)
Fig ( 5) U V Spectroscopy of erasable inks(E3 )

Nature and Science 2015;13(12) http://www.sciencepub.net/nature
20
Fig (6 ) U V Spectroscopy of erasable inks(E4 )
Fig (7 ) U V Spectroscopy of erasable inks(E5 )
Table3: UV-Vis main Peaks Sample of pen inks of different brands
Pen code Peaks nm E1 195-210- 225-235- 590 E2 205 -215-230- 240-555 E3 200- 240- 620nm E4 195- 240 - 620nm E5 200 - 240 nm
Fig (8) I R Spectroscopy of Blue ballpoint pen ink (E1)

Nature and Science 2015;13(12) http://www.sciencepub.net/nature
21
Fig (9) I R Spectroscopy of Blue ballpoint pen ink (E2)
Fig (10) I R Spectroscopy of Erasable inks(E3)
Fig (11) I R Spectroscopy of Erasable inks(E4)

Nature and Science 2015;13(12) http://www.sciencepub.net/nature
22
Fig (12) I R Spectroscopy of Erasable inks(E5)
Table4: Infrared main Peaks Sample of inks of different brands
Pen code Peaks cm-1 E1 3973.09- 3776.94-3421.2-2642.27-2503.86-1951.11-1373.65-837.05 E2 3984.66-3896..94-3830.65-3398.34-2954.7-1947.11-1168.65-817.05 E3 3976.94- 3922.94-3772.2-2210.27-2491.86-1944.11-1361.65-837.05 E4 3980.94- 3934.51-3433.06-2210.27-2491.86-1944.11-1118.64-860.05 E5 3965.37-3868..94-3795.65-2195.7-2144.6-1967.11-1168.65-821.05
3.2.1.3 Raman Analysis
All samples have been studied under the action of laser light using Raman spectral comparator. The
Raman spectra were recorded over the range 100-4000 cm-1, Raman Spectrophotometer {Senterra, Bruker Optics, (Germany)}[22]
Fig (13) Raman Spectroscopy of Blue ballpoint ink (E1)

Nature and Science 2015;13(12) http://www.sciencepub.net/nature
23
Fig ( 14) Raman Spectroscopy of Blue ballpoint pen ink (E2 )
Fig ( 15) Raman Spectroscopy of erasable inks(E3 )
Fig (16 ) Raman Spectroscopy of erasable inks(E4 )

Nature and Science 2015;13(12) http://www.sciencepub.net/nature
24
Fig (17 ) Raman Spectroscopy of erasable inks(E5 )
Table 5: Raman main Peaks Sample of inks of different brands
Pen code Peaks cm-1 E1 Range (2200-3500)-1587.33-1341.57-1143.00- 879.83-768.13-403.17 E2 Range (2400-2900)-1587.29 -1555002-1143.56-879.59-768.66-403.19 E3 1576.33- 1545.53-1330.57-1100.00- 762.13 E4 1356.01-1395.44-1310.21 E5 1355.95-762.66-1169.53-1129,62
4. Results And Discussion
Table 1 shows the different brands of blue ballpoint pen inks and erasable pen inks (Pen code E1,E2, E3, E4, E5). The results were analyzed according to brands that obtained in charts, the bands that obtained from Ultraviolet (UV), Infrared (IR) and Raman spectroscopy and Thin Layer Chromatography (TLC) were analyzed as follow: 4.1 Thin Layer Chromatography
The separation of ink components will be carried out by TLC which includes preparation of silica gel glass plates in distilled water. Each of the inks was dissolved in a suitable solvent. (E1 and E2) dissolved in isopropanol, (E3 and E4) dissolved in petroleum ether, and E5 dissolved in water/ethanol. All spots were approximately 0.5-0.8mm in diameter and the amounts of the inks applied. Selection of proper extraction solvent to extract the ink from a paper will affect the obtained results by TLC where pyridine is the reported and common solvent used with ballpoint pen inks[23]. In general the extraction was performed with different solvents (reported in Table 6).
Different colors of dye component will be eluted from plate and collected for further analysis Figures (1,2) and the retardation factor, Rf were recorded in (Table 2) at the end result with TLC is a pattern of colored spots, known as a chromatogram, for each ink.
Different inks have different chromatograms but if the sample ink has the same chromatogram.
Table. 6 :List of solvents used for the extraction of ink components from paper
No. Solvent Solubility of ink colors
1 Methanol Soluble 2 Pyridine Soluble 3 ethanol Soluble 4 chloroform Soluble 5 isopropanol Soluble 6 Ethyl acetate Soluble 7 Acetic acid Slightly 8 Acetone Slightly
4.2. Spectroscopic Analysis 4.2.1 Ultraviolet Analysis
Both mentioned inks were examined by UV-Vis spectrophotometer in the wavelength range from 100-800 nm. Figures (3-7) and the main brands in Table3. These brands show the absorbance spectra of blue ballpoint pen and erasable pen inks samples (E1, E2, E3, E4 and E5). All ink samples showed absorbance peaks in the wavelength as follow, E1 exhibited five bands at 195-210-225-235-590 nm, showed four maximum absorbance peak in the wavelength range

Nature and Science 2015;13(12) http://www.sciencepub.net/nature
25
195-235 nm and revealed one broad absorbance peak at the wavelength 590 nm while, E2 showed five bands at 205-215-230- 240-555 nm, showed four maximum absorbance peak in the wavelength range 205-240nm. On the other hand, E3 showed five bands at the wavelength 200, 220, 230, 240 and 620 nm, showed one broad absorbance peak at the wavelength 620 nm. Also, E4 exhibited five absorbance peaks at the wavelength 195-210-230-240- 620 nm. And finally E5 showed four absorbance bands at the region 200 - 240 nm [24]. 4.2.2 Infrared Analysis
The chemistry of inks of commercial pens are highly complex as each ink consisting of a mixture of chemical compounds that serve a variety of purposes. Many of these inks compounds are in turn very complex on molecular basis. Many of these inks being large organic molecules. As a result, Infrared spectra of inks tend to be complicated because of the overlap of many of vibrational bands from the different constituents of organic molecules. Infrared spectra for each sample were recorded in range of 500 - 4000 cm-
1as in figures (8-12) and the main peaks are present in Table4. It should be noticed that most of the absorption bands in the inks spectra are complex peaks, and exhibited band in different areas that are common to many organic compounds that are typically used in ink formulation . We can make interpretation of these spectra in spite of the mentioned overlap. The Infrared spectra for each brand generally showed a broad peak at the region 3000 - 3600 cm-1 that indicates the presence of the NH2 or CH2NH2 groups in the ink formulations as expected since ballpoint pen ink and erasable pen inks samples contained amino group. Similar spectrum with broad peak in the range from 3000 cm-1 to 3600 cm-1 also indicating the presence of CH2-OH group in these inks, and the presence of peaks at the range from 1580-1595cm-1 is characteristic of the ballpoint pen ink, and has been assigned to a skeletal vibration of triarylmethane dye(E1andE2) .in the range from 1238-1280cm-1 can be assigned to the vibration of aromatic ether (Ar-O) (E1, E2, E3, E4 and E5) , the absorption bands in range 1055-1295 cm-1 reflected the asymmetrical and symmetrical stretch vibration of aliphatic ether (C-O) (E1, E2, E3, E4 and E5) Moreover, the absorption band at 914 cm-1 to 984 cm-1
was caused by epoxy bond (E1,E2,E3,E4 and E5), the spectral bands at 1593 cm-1 to 1589 cm-1 characteristic of CH2 vibration on aliphatic chain (E1 and E2 ) and CH3 stretching at the region 2550 - 2650 cm-1 (E1, E2 , E3, E4 and E5). Also, the presence of peaks in rang 1600-1430cm-1 indicate the presence of aromatic compound , C=C and C=N groups and peak at 1100 cm-1 indicate the presence of C-O-C bond. Also, Ballpoint pen ink of two brands E1and E2 showed peak in the range from 1000 cm-1 to 700 cm-1indicate the
presence of C-H group and this C-H group vibration appear in the region 2900 -3000 cm-1. It is obvious that the blue ballpoint pen ink is a mixture of organic compounds such as triarylmethane dyes, epoxy resin, alkyd resin, and solvents, etc. [25, 26]. 4.2.3 Raman Analysis
Raman microscopic analysis is becoming a tool of major importance in forensic analysis, particularly of inks. It is a non-invasive, non-destructive chemical probe allowing samples to be examined in their entirety without any preparation. The Raman Analysis spectra presented in Figures (13-17) and the main peaks present in (Table 5) have shown Sample E1possessed Range (2200-3500) and 1587.33-1341.57-1143.00- 879.83-768.13-403.17 cm-1, abroad peak at Range (2200-3500) cm-1 indicate the presence of CH2 , CH3 and aromatic ring, respectively. 1587. 13 cm-1. Peak at1545.53 cm-1 and 762.13 cm-1 indicate the presence of C=C of aromatic ring , strong peak at 1330.57cm-1 indicates the presence of C-C aliphatic bond. Moderate peak at 762.13 cm-1 indicate the presence of C-C aliphatic, moderate peak at 1100.00 cm-1 indicate the presence of C-O-C. Ballpoint pen ink of two brands E1and E2 showed peak in the range 2500-3500 cm-1
and the lack of appearance in case of the erasable pen inks (E3,E4 and E5) [27-31]. 5. Conclusion
Based on the obtained results, the analysis of ink is of great interest in the field of forensic, particularly in the examination of questioned documents. Forged documents relating to handwriting and signatures often appear in forensic cases. As these documents are usually written with writing pens, it is therefore of interest to discriminate between the studies comprised of analysis of inks utilizing spectroscopic methods. In spectroscopic methods, the inks were analyzed by means of Ultraviolet visible (UV-Vis) and infrared (IR),(Raman) spectroscopy, and Thin layer Chromatography (TLC). UV-Vis analysis was successful in discriminating ballpoint pen inks and Blue an erasable Pen inks of different brands. IR, Raman analysis revealed that each brands for blue ballpoint pen ink and Blue an erasable Pen inks samples that are E1( Reynolds Blue pin, E2 (PRIMA solo Blue pin), E3 (Blue an erasable Pen inks XZB 0,8 mm), E4 (Blue an erasable Pen inks SCMv12590,5mm) and E5(Blue an erasable Pen inks Frixion’’ eraser.max) could be discriminated by looking the pattern of each spectra. the fingerprint regions for inks Infrared spectra at range ≈700 – 1800 cm-1 in which many of inks constituents, As will as which using thin layer chromatography methods we could be discriminated also depended on The retardation factor, (Rf). In case matching inks database if library inks present. Thus, the Raman Analysis
Nature and Science 2015;13(12) http://www.sciencepub.net/nature
26
spectra can differentiate between brands (E1,E2) of blue ballpoint pen ink and (E3, E4 and E5) for erasable Pen inks. Acknowledgement
The authors thank Dr. Maha M. Ebrahem Prof. of cellulose paper Department National Research Center, Dokki Cairo, Egypt and Dr. Amr A. Nada Researcher in Egyptian Petroleum Research Institute (EPRI), Cairo, Egypt. for guide, support and their help in this paper. References 1. Muro K. C., K. C. Doty, J. Bueno, L. Halámková,
and K. I. Lednev Vibrational Spectroscopy: Recent Developments to Revolutionize Forensic Science, analytical chemistry,87.(2014),306-327.
2. Braz A., M. Lopez-López, C. Garcīa- Ruiz, Raman Spectroscopy for Forensic analysis of inks in questioned documents , Forensic Science International.232, (2013), 206−212.
3. LEE L.C, M. R.OTHMAN,H.PUA,A. ISHAK, S.M. ISHAR,CLASSIFICATION AND IDENTIFICATION OF BLACK BALLPOINT PEN INKS BASED ON MULTIVARIATE ANALYSIS AND INFRARED SPECTRA problem of Forensic Science 92, (2012), 253−264.
4. Sharma N,. A, Agarwal, Analysis of blue fountain pen inks, Der Pharma Chemica, 6(1):2014, 448-452 .
5. Morsy A. F., S. El-Sherbiny, M. Awadalla, A Systematic Approach to Egyptian Ballpoint Ink Analysis for Forensic Science Application, Journal Forensic Science, 4, (2005)1-13.
6. E.FABIAÑSA, B.M.TRZCIÑSKA ,DIFFRENTION OF Ballpoint pen ink AND LUQUID INKS – A COMPARISON OF METHODS IN USE, Problems of Forensic Science. XLVI, (2001)383-400.
7. Merrill R.. E. G. Bartick, "Analysis of Ballpoint Pen Inks By Diffuse Reflectance Infrared Spectrometry," Journal of Forensic Sciences, JFSCA, 37, 2(1992),528-541.
8. Kher A., M. Mulholland, E. Green, B. Reedy, Forensic Classification of Ball point Pen Inks Using High Performance Liquid Chromatography and infrared Spectroscopy with Principal Component Analysis and Linear Discriminant Analysis, VIBRATIONAL SPECTROSCOPY, 40, (2006). 270- 277.
9. Senvaitienë J., A. Beganskienë, S. Tautkus, A. Padarauskas, A. Kareiva, Characterization of Historical Writing Ink by Different analytical techniques CHEMIJA. (16):(2005) 34 -38.
10. Nicholas C. T., , A. P. Nicholas, , P. E. Nicholas, Multivariate chemometrics for Forensic discrimination of Blue Ballpoint Pen Inks based on their spectra Forensic Science . International, 138,(2003). 75-84.
11. Senior S.; E. Hamed.; Masoud,E. Shehata, Characterization and Dating of Blue Ballpoint Pen Inks Using Principal Component Analysis of UV–Vis Absorption Spectra, IR Spectroscopy, and HPTLC, Journal forensic science (57)4(2012),1087-1093.
12. Bele A. A., K. Anubha ,an overview on thin layer chromatography; International Journal Pharmaceutical and Research. 2(2011), 256-267.
13. Wilson J. D.,G. M. LaPorte, and A. A. Cantu, Differentiation of Black Gel Inks Using Optical and Chemical Techniques, Journal of Forensic Sciences, Vol. 49, No. 2.( 2004),1-7.
14. Amandeep K., S. S. Sandeep, K.G. Rakesh, Separation of different components of hair cosmetic (Hairsprays) using TLC and HPTLC, Internet Journal of Forensic Medicine and Toxicology, 16, (1)(2015) 1-12.
15. Sharma N., A. Agarwal, YS. Negi, Analysis of Black Ballpoint Pen Inks International Journal for Pharmaceutical Research Scholars, V-3, I-2, (2014)2277 - 7873.
16. Cantu A.A., Comments on the Accelerated Aging of Ink. Journal of Forensic Sciences 33 (3) (1988) 744-750.
17. Brunelle R.L., A Sequential Multiple Approach to Determining the Relative Age of Writing Inks. International Journal of Forensic Document Examiners 1 (2) (1995) 94-98.
18. Aginsky V.N., Determination of the age of ballpoint pen ink by gas and densitometric thin-layer chromatography. Journal of Chromatography A 678 (1994) 119.
19. Chatwal G., , S. Anand, Instrumental Methods of Chemical Analysis; 2nd edition; Goel Publishers, New Delhi India, (2003) 107-184, 185-234, 624-639.
20. Skoog H. Fundamentals of Analytical Chemistry, Thomson Asia Pte. Ltd, Singapore, (2004) 788-807, 973-992.
21. Bhardwaj H., J. Jaiswal , N. Sharma, Analysis of Blue Ball Pen Inks, International Journal for Pharmaceutical Research Scholars,3,(2014)473-476.
22. Udritioiu F.M., A.A. Bunaciu , H.Y. Aboul-Enein, , I. G. Tanase, Application of Micro-Raman and FT - IR Spectroscopy in Forensic Analysis of Questioned Documents, Gazi University Journal of Science, 25(2)(2012) 371-375.

Nature and Science 2015;13(12) http://www.sciencepub.net/nature
27
23. American Society for Testing Materials, E 1789-96 Standard guide for writing ink identification, Annual Book of ASTM Standards, vol. 14.02, ASTM International, West Conshohocken, PA,(2000),740–745.
24. Zaharullil N. A., U. K. Ahmad, Discrimination of Ballpoint Pen Inks Using Spectroscopic Methods International Conference on Management, Behavioral Sciences and Economics Issues. Penang Malaysia,(2012)174-177.
25. Wang J., G. Luo, S. Sun, Z. Wang, and Y. Wang; Systematic Analysis of Bulk Blue Ballpoint Pen Ink by FTIR spectrometry, Journal of Forensic Science;46(5)(2001):1093–1097.
26. Abdul Halim M. I., N. S. Abdul Aziz, N. Saim, R. Osman , H. Jasmine, Statistical Discrimination of Blue Ballpoint Pen Inks by Infrared (IR) Spectroscopy, Malaysian Journal of Fundamental & Applied Sciences. 8(3) (2012) 155-161
27. Roman D. A., E. Efremov, F. Ariese, A. S. Carretero, C. Gooijer; Interfacing capillary
electrophoresis and surface-enhanced resonance Raman spectroscopy for the determination of dye compounds, Anal Bioanal Chem. 382:(2005) 180–185.
28. Claybourn M., M. Ansell; Using Raman Spectroscopy to solve crime: inks, questioned documents and fraud; Science & Justice; 40(4)(2000) 261-271.
29. White P.C., SERRS Spectroscopy- a new technique for Forensic Science, Science & Justice; 40(2)(2000)113-119.
30. Zięba-Palus J., M. Kunicki, Application of the micro-FTIR spectroscopy, Raman spectroscopy and XRF method examination of inks; Forensic Science International (158)2–3,( 2006),164–172.
31. Wagner E., S. Clement, Surface Enhanced Resonance Raman Scattering (Serrs) Spectroscopy Study On INKS , Problems of Forensic Sciences, XLVI, (2001), 437–441.
11/26/2015