Embed Size (px)
Citation preview
Saratoga, NYSaratoga, NYSeptember 25, 2008
Natural Gas UpdatePresentation to:
Northeast PowerCoordinating Council (NPCC)
General Meeting
Thomas Kiley President and CEOThomas Kiley, President and CEONortheast Gas Association
T iTopics
Winter OutlookGas Supply Task Force & Electric CoordinationInfrastructure DevelopmentsOn the Supply Horizon– Rockies gas– Marcellus Shale
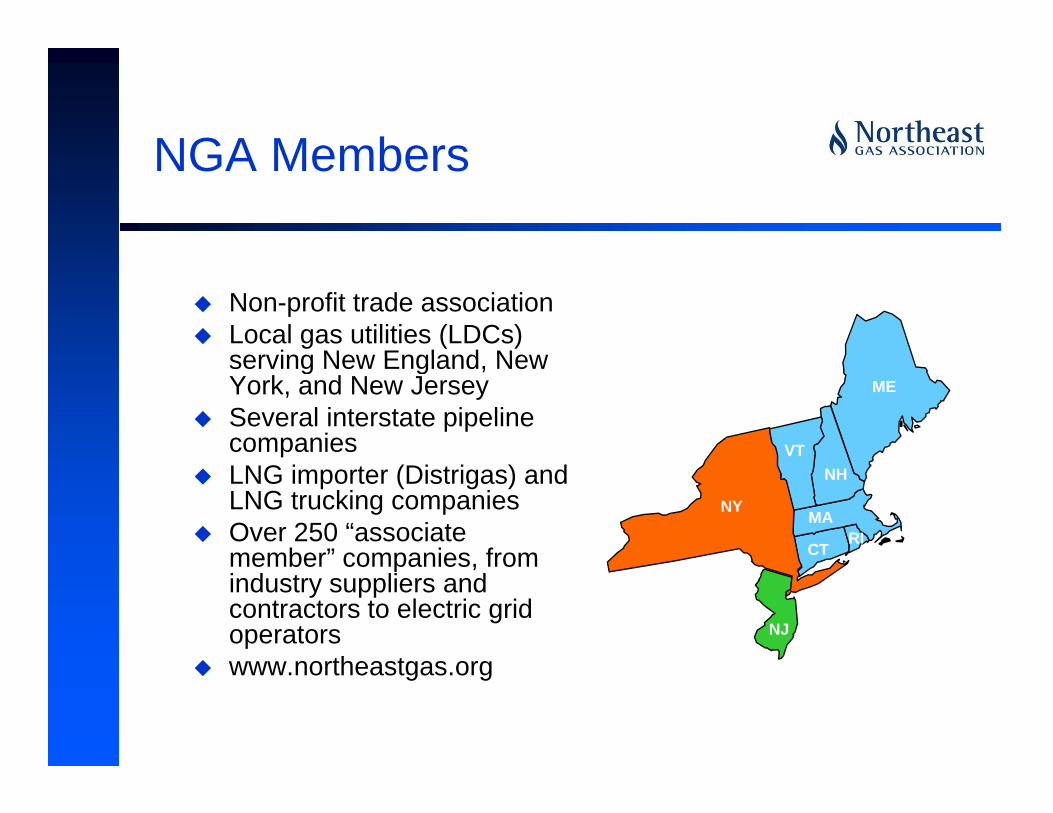
NGA MembersNGA Members
Non-profit trade associationLocal gas utilities (LDCs) serving New England Newserving New England, New York, and New JerseySeveral interstate pipeline companies VT
ME
LNG importer (Distrigas) and LNG trucking companiesOver 250 “associate member” companies from
RIMA
CT
NY
NH
member companies, from industry suppliers and contractors to electric grid operatorswww northeastgas org
NJ
www.northeastgas.org
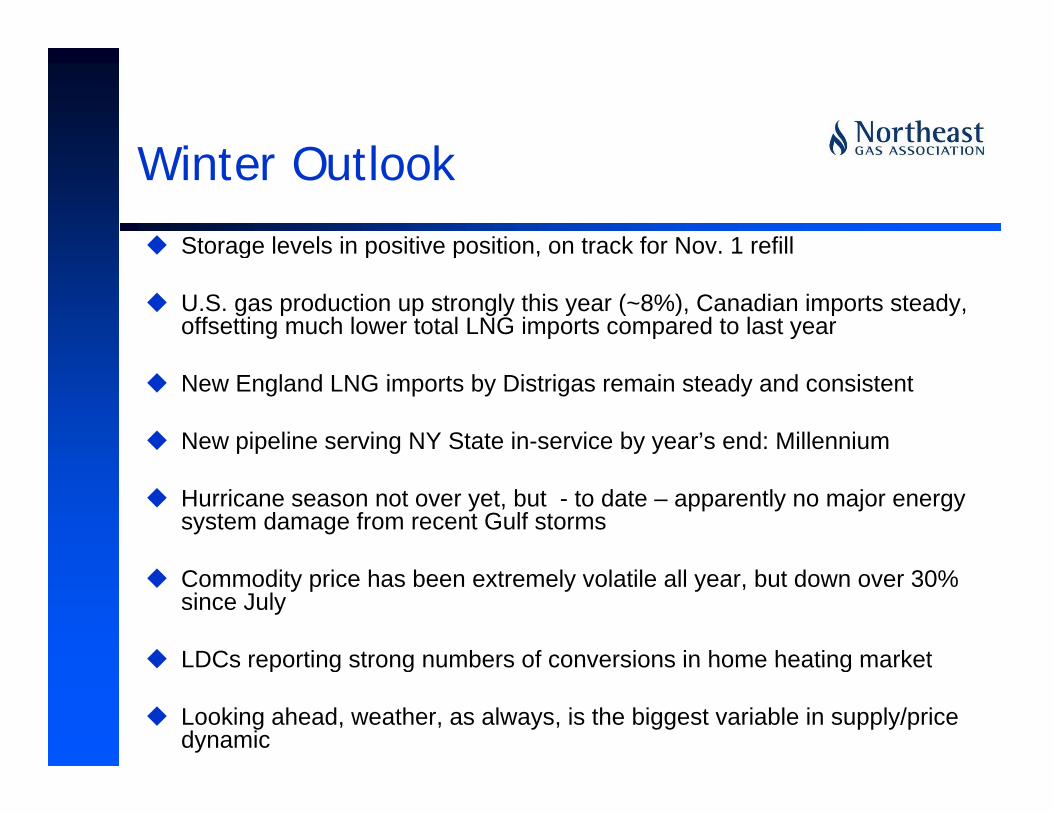
Wi t O tl kWinter OutlookStorage levels in positive position, on track for Nov. 1 refillStorage levels in positive position, on track for Nov. 1 refill
U.S. gas production up strongly this year (~8%), Canadian imports steady, offsetting much lower total LNG imports compared to last year
New England LNG imports by Distrigas remain steady and consistent
New pipeline serving NY State in-service by year’s end: Millennium
Hurricane season not over yet, but - to date – apparently no major energy system damage from recent Gulf storms
Commodity price has been extremely volatile all year, but down over 30% since July
LDCs reporting strong numbers of conversions in home heating marketLDCs reporting strong numbers of conversions in home heating market
Looking ahead, weather, as always, is the biggest variable in supply/price dynamic
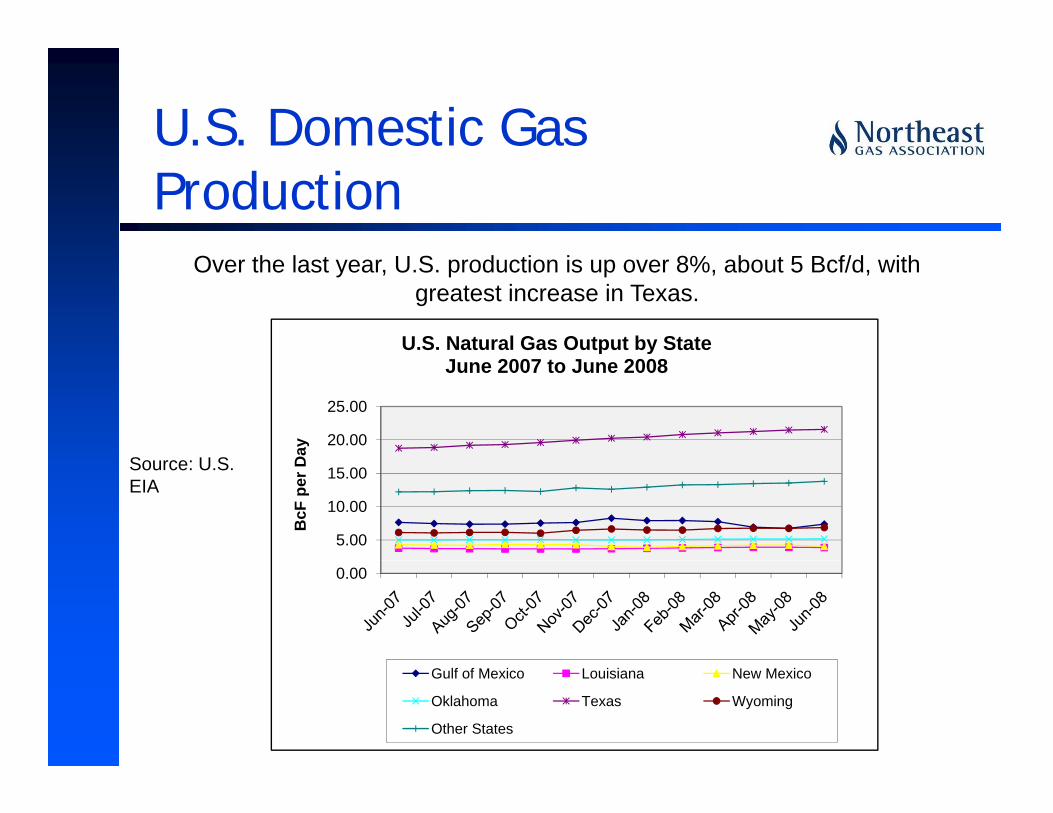
U.S. Domestic Gas Production
Over the last year, U.S. production is up over 8%, about 5 Bcf/d, withgreatest increase in Texas.
U.S. Natural Gas Output by State
S U S20.00
25.00
Day
June 2007 to June 2008
Source: U.S. EIA
5.00
10.00
15.00
BcF
per
D
0.00
Gulf of Mexico Louisiana New Mexico
Oklahoma Texas Wyoming
Other States
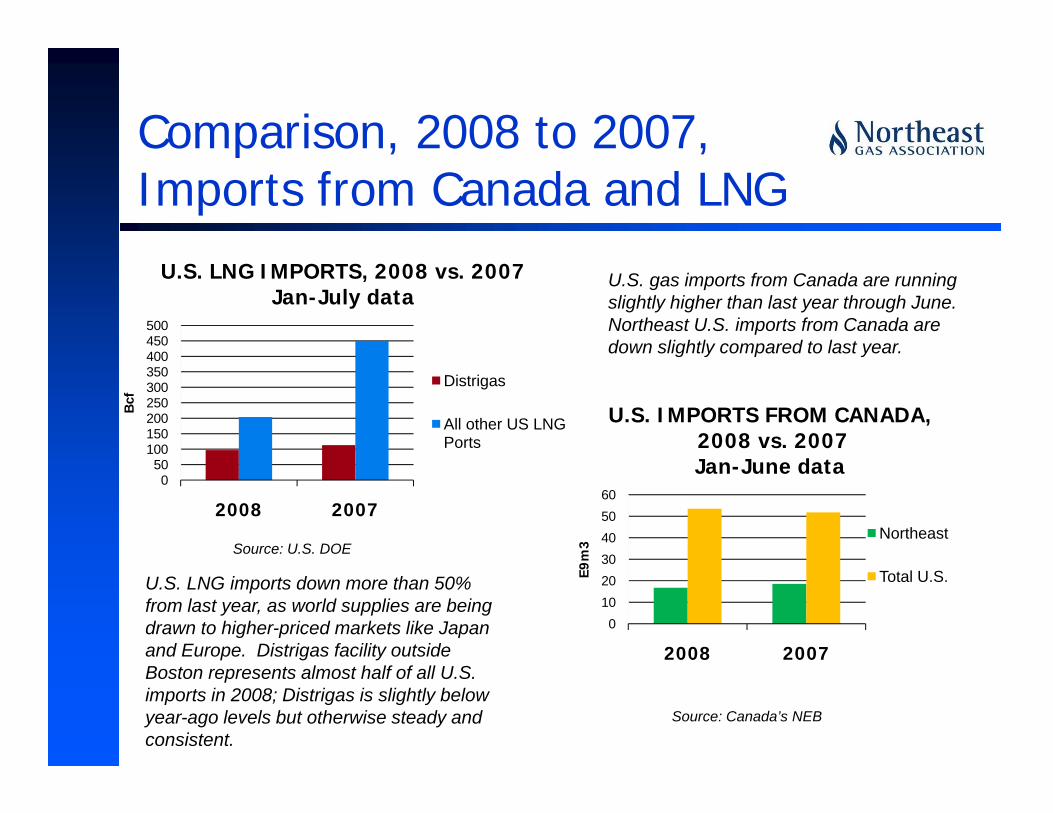
Comparison, 2008 to 2007, p , ,Imports from Canada and LNG
400450500
U.S. LNG IMPORTS, 2008 vs. 2007Jan-July data
U.S. gas imports from Canada are running slightly higher than last year through June. Northeast U.S. imports from Canada are down slightly compared to last year.
100150200250300350400
Bcf
Distrigas
All other US LNG Ports
U.S. IMPORTS FROM CANADA,2008 vs. 2007
d
g y p y
Source: U.S. DOE
050
2008 2007
30
40
50
60
m3
Jan-June data
Northeast
0
10
20
30
2008 2007
E9m
Total U.S.U.S. LNG imports down more than 50%from last year, as world supplies are being drawn to higher-priced markets like Japan and Europe. Distrigas facility outside
Source: Canada’s NEB
Boston represents almost half of all U.S. imports in 2008; Distrigas is slightly below year-ago levels but otherwise steady and consistent.
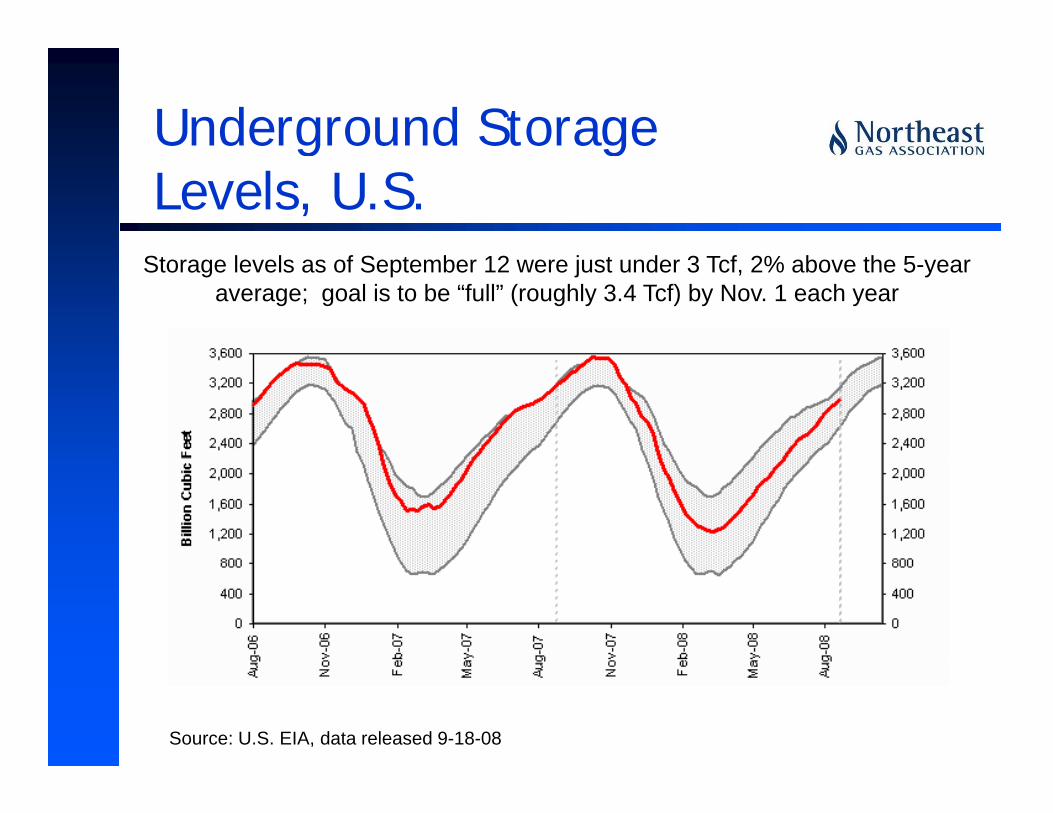
Underground Storage g gLevels, U.S.
Storage levels as of September 12 were just under 3 Tcf, 2% above the 5-year average; goal is to be “full” (roughly 3.4 Tcf) by Nov. 1 each year
Source: U.S. EIA, data released 9-18-08
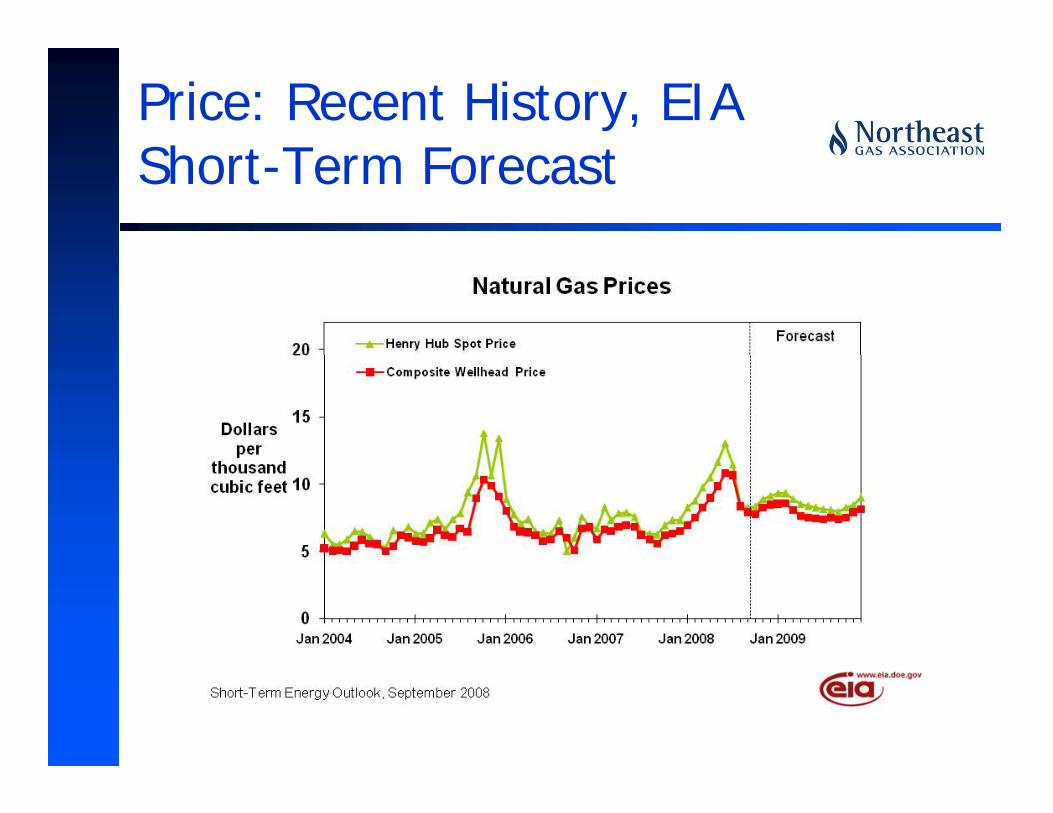
Price: Recent History, EIA Sh t T F tShort-Term Forecast
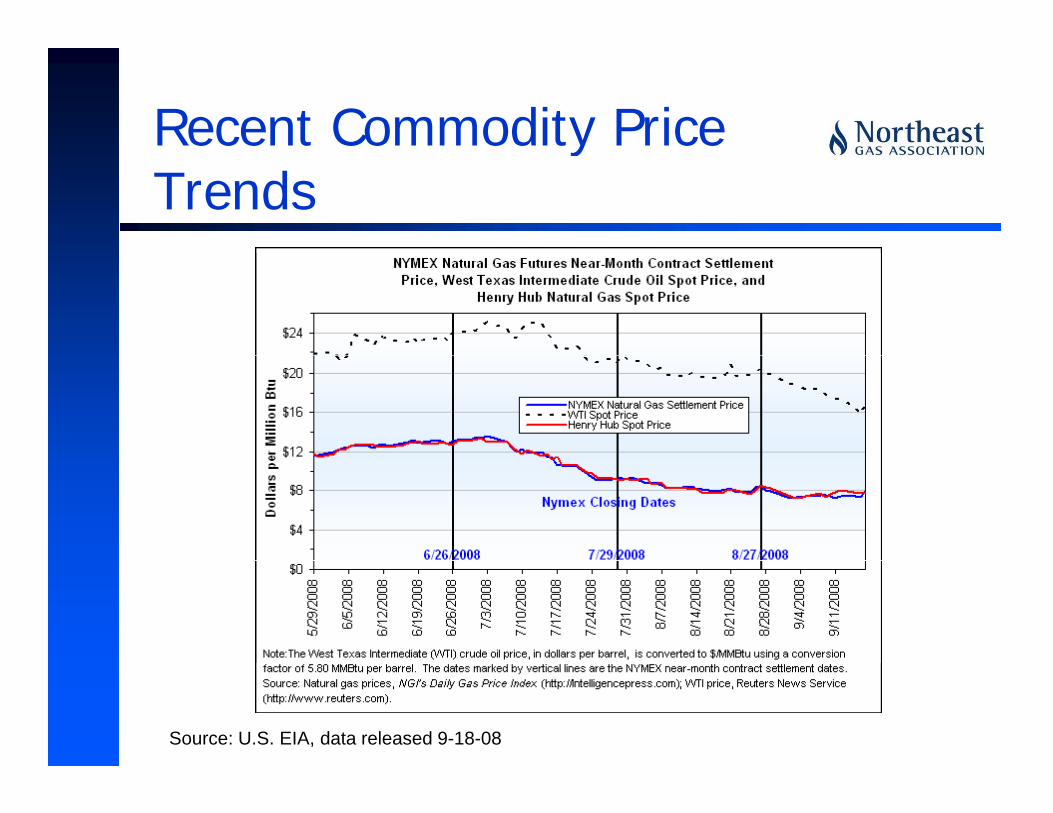
Recent Commodity Price yTrends
Source: U.S. EIA, data released 9-18-08
NGA Gas Supply Task Force
Members: all LDCs in region, interstate pipelines (including TransCanada), LNG transporters(including TransCanada), LNG transporters
Purpose: to help deal with meeting winter supply needs and deliverability within the Northeast regionneeds and deliverability within the Northeast region
Tasks: Monitor regional deliverability of its g ymembers’ gas supplies during periods of peak demand or supply curtailment; Advise region’s energy, regulatory and policy officials; also Updategy, g y p y ; pISOs in region of meetings, outcomes
NGA I t f ith ISONGA Interface with ISOs
Electric & Gas Operations Committee NGA and ISO NE/NY ISOElectric & Gas Operations Committee, NGA and ISO-NE/NY ISO– Meets periodically, provides updates on system issues (only publicly
available information discussed – transparency requirements)– Most recent call held 9-17-08, with ISO-NE, NY ISO, PJM, NGA,
and several pipelines and gas LDCs participatingand several pipelines and gas LDCs participating
NY ISO and ISO-NE will participate at NGA winter supply outlook briefing for state government officials in region, 11-6-08g g g
NGA helped develop operations communications protocol between NY ISO and interstate pipelines in early 2008
NGA on behalf of its NE Gas Supply Task Force will notify ISO-NE, NY ISO, PJM when Task Force meets, summary of any actions or status
Key issue remains level of non-firm transportation arrangements among gas-fired power generators
Infrastructure Enhancements:
Anticipated In-ServiceAnticipated In Service Between Last Winter and
Winter 2008 09Winter 2008-09
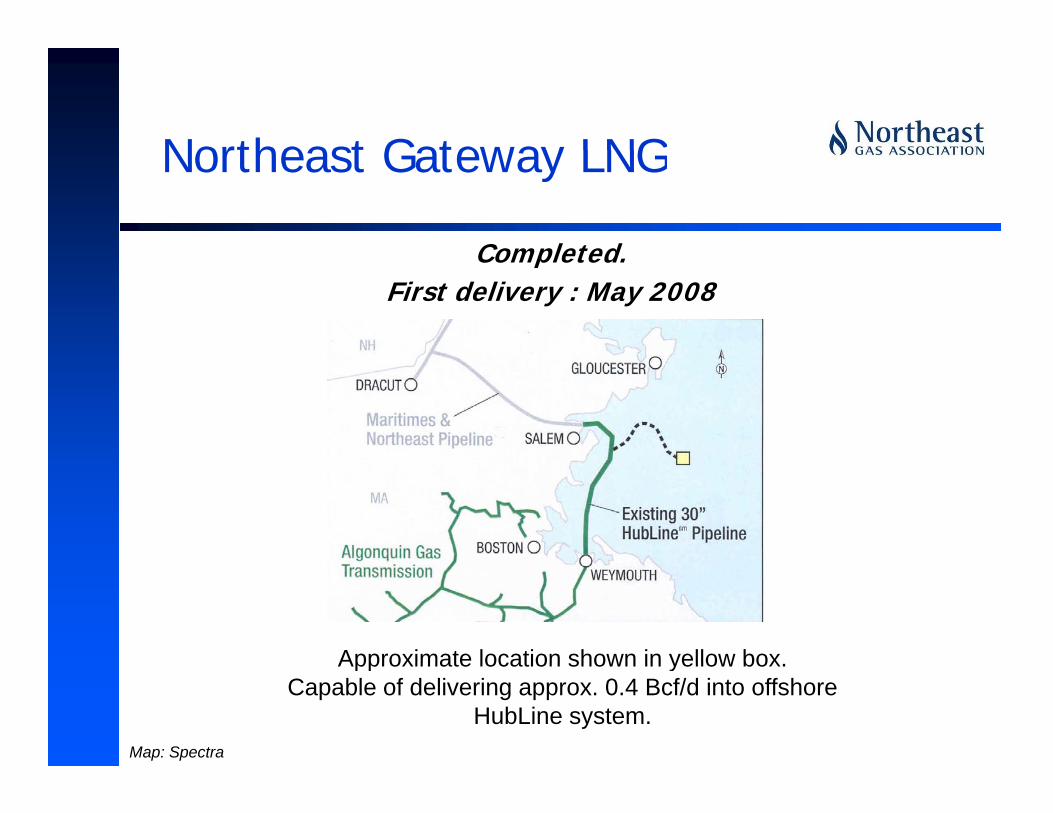
Northeast Gateway LNGNortheast Gateway LNG
CompletedCompleted.First delivery : May 2008
Approximate location shown in yellow boxApproximate location shown in yellow box.Capable of delivering approx. 0.4 Bcf/d into offshore
HubLine system.Map: Spectra
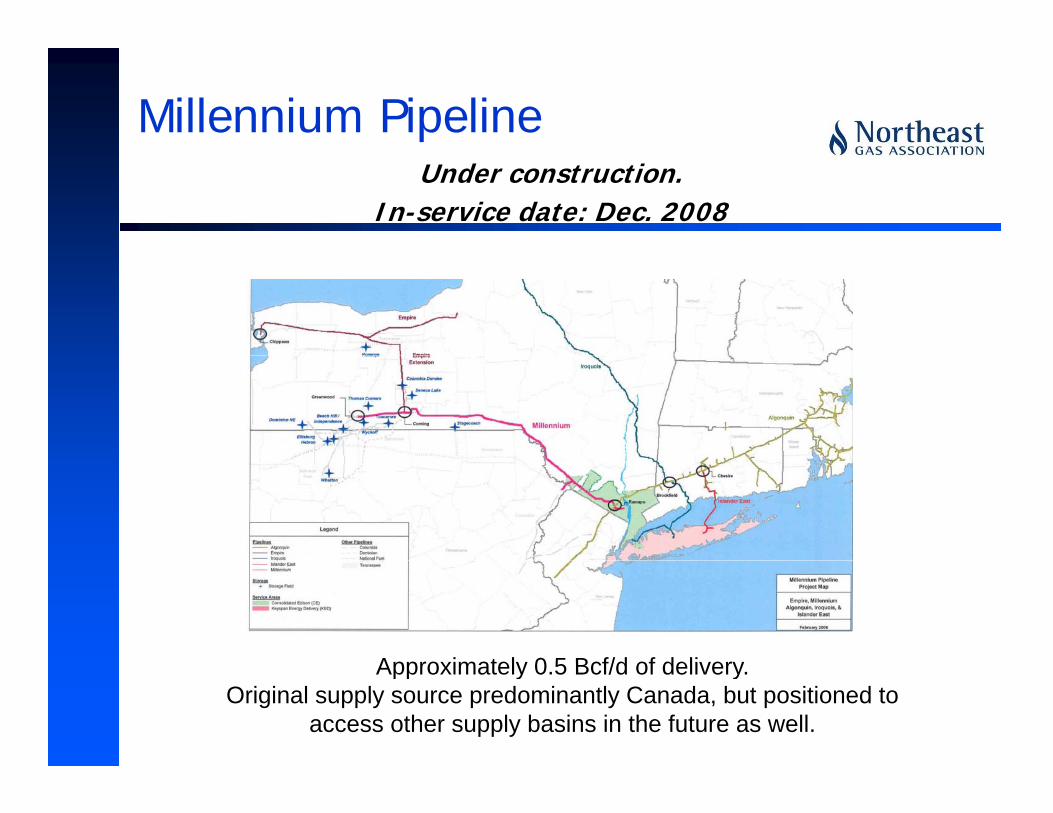
Millennium PipelineUnder construction.
In-service date: Dec. 2008
Approximately 0 5 Bcf/d of deliveryApproximately 0.5 Bcf/d of delivery.Original supply source predominantly Canada, but positioned to
access other supply basins in the future as well.
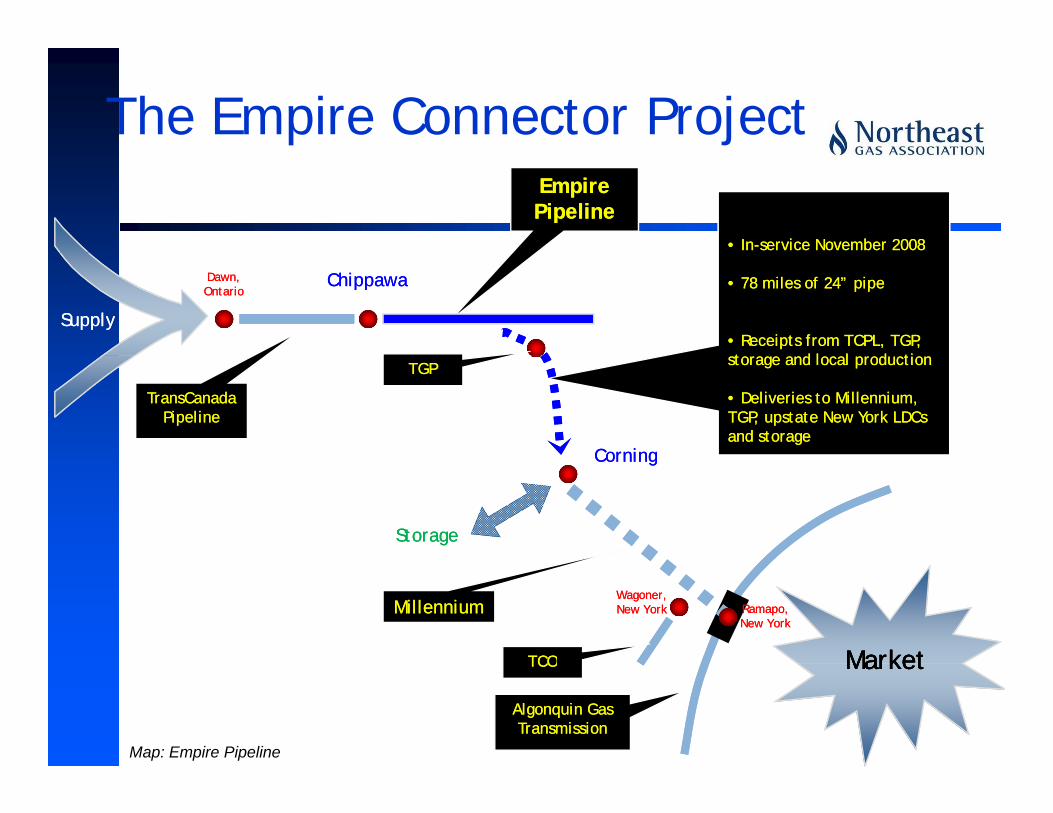
The Empire Connector ProjectEmpireEmpirePipelinePipeline
•• InIn--service November 2008service November 2008
SupplySupply
Dawn,Dawn,OntarioOntario
ChippawaChippawa •• 78 miles of 24” pipe78 miles of 24” pipe
•• Receipts from TCPL, TGP, Receipts from TCPL, TGP, t d l l d tit d l l d ti
CorningCorning
TransCanadaTransCanadaPipelinePipeline
storage and local productionstorage and local production
•• Deliveries to Millennium, Deliveries to Millennium, TGP, upstate New York LDCs TGP, upstate New York LDCs and storageand storage
TGPTGP
CorningCorning
StorageStorage
MarketMarketMarketMarket
Wagoner,Wagoner,New YorkNew York Ramapo,Ramapo,
New YorkNew York
TCOTCO
MillenniumMillennium
MarketMarketMarketMarket
Algonquin GasAlgonquin GasTransmissionTransmission
TCOTCO
Map: Empire Pipeline
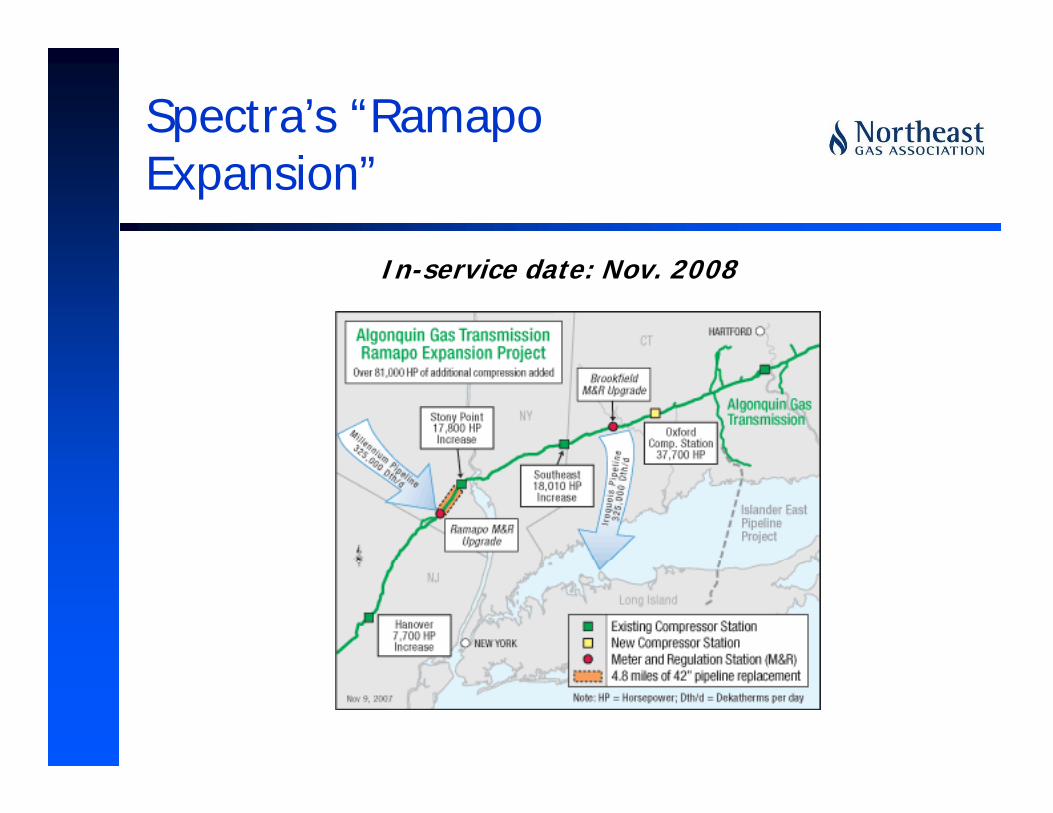
Spectra’s “Ramapo Expansion”
In-service date: Nov. 2008
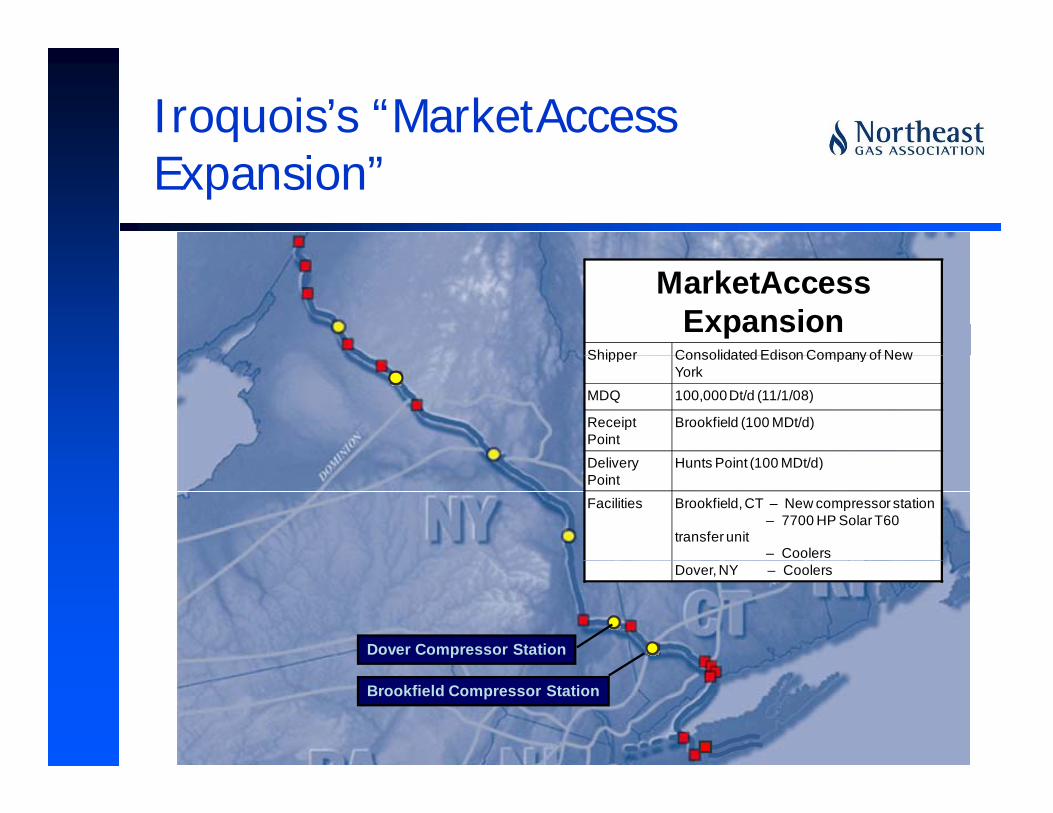
Iroquois’s “MarketAccessExpansion”
MarketAccessExpansion
Shipper Consolidated Edison Company of NewShipper Consolidated Edison Company of New York
MDQ 100,000 Dt/d (11/1/08)
Receipt Point
Brookfield (100 MDt/d)
D li H t P i t (100 MDt/d)Delivery Point
Hunts Point (100 MDt/d)
Facilities Brookfield, CT – New compressor station – 7700 HP Solar T60
transfer unit – Coolers
Dover Compressor Station
Dover, NY – Coolers
Brookfield Compressor Station
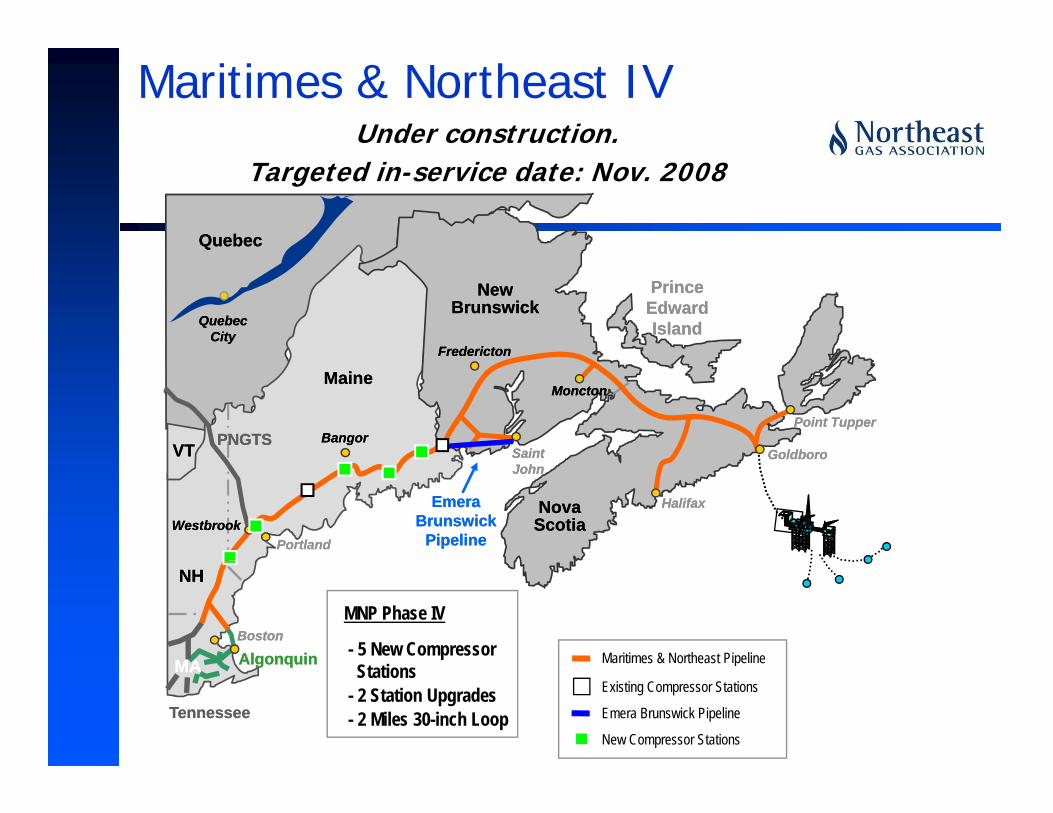
Maritimes & Northeast IVUnder construction.
QuebecQuebec
Targeted in-service date: Nov. 2008
Quebec Quebec CityCity
New New BrunswickBrunswick
Prince Prince Edward Edward IslandIsland
FrederictonFredericton
MonctonMonctonMaineMaine
VTVT
FrederictonFredericton
GoldboroGoldboroBangorBangor
Saint Saint
Point TupperPoint TupperPNGTSPNGTS
PortlandPortland
Nova Nova ScotiaScotia
HalifaxHalifax
GoldboroGoldboroJohnJohn
WestbrookWestbrookEmera Emera
Brunswick Brunswick PipelinePipeline
Maritimes & Northeast Pipeline
NHNH
BostonBoston
AlgonquinAlgonquinMAMA
MNP Phase IV
- 5 New Compressor
TennesseeTennessee
a t es & o t east pe e
Existing Compressor Stations
Emera Brunswick Pipeline
New Compressor Stations
AlgonquinAlgonquinMAMA Stations- 2 Station Upgrades- 2 Miles 30-inch Loop
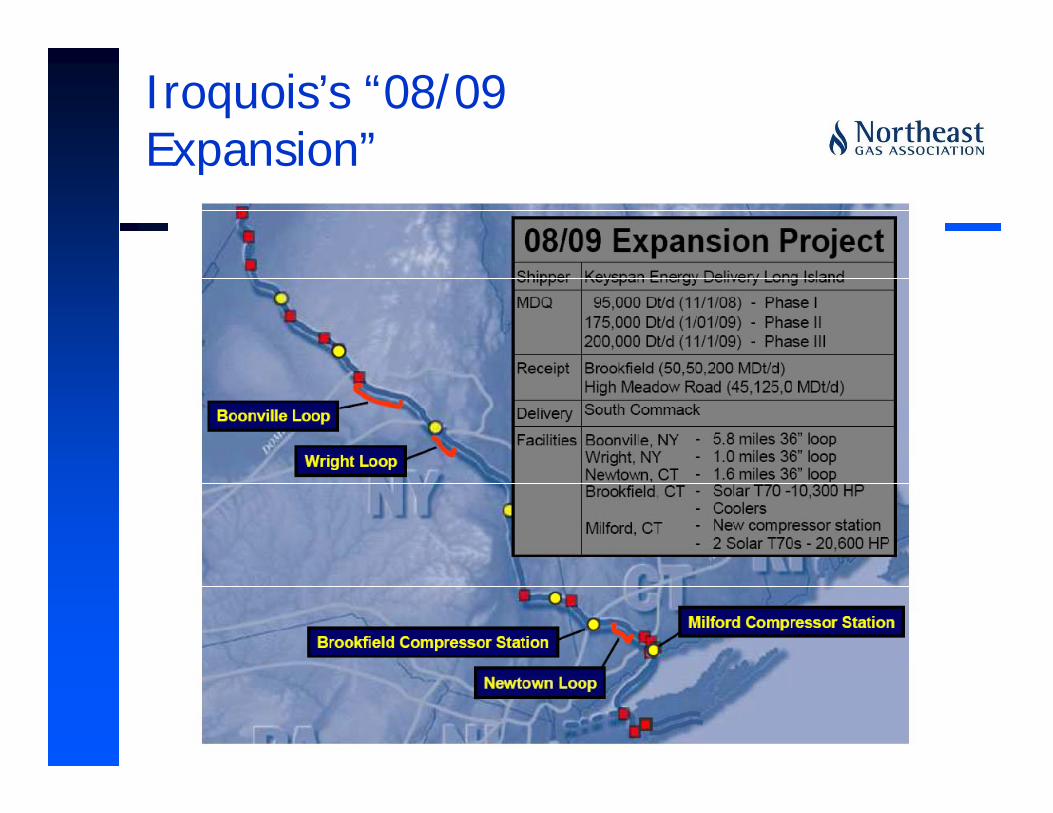
Iroquois’s “08/09 Expansion”Expansion
Infrastructure Enhancements:
Operational in 2009Ope at o a 009
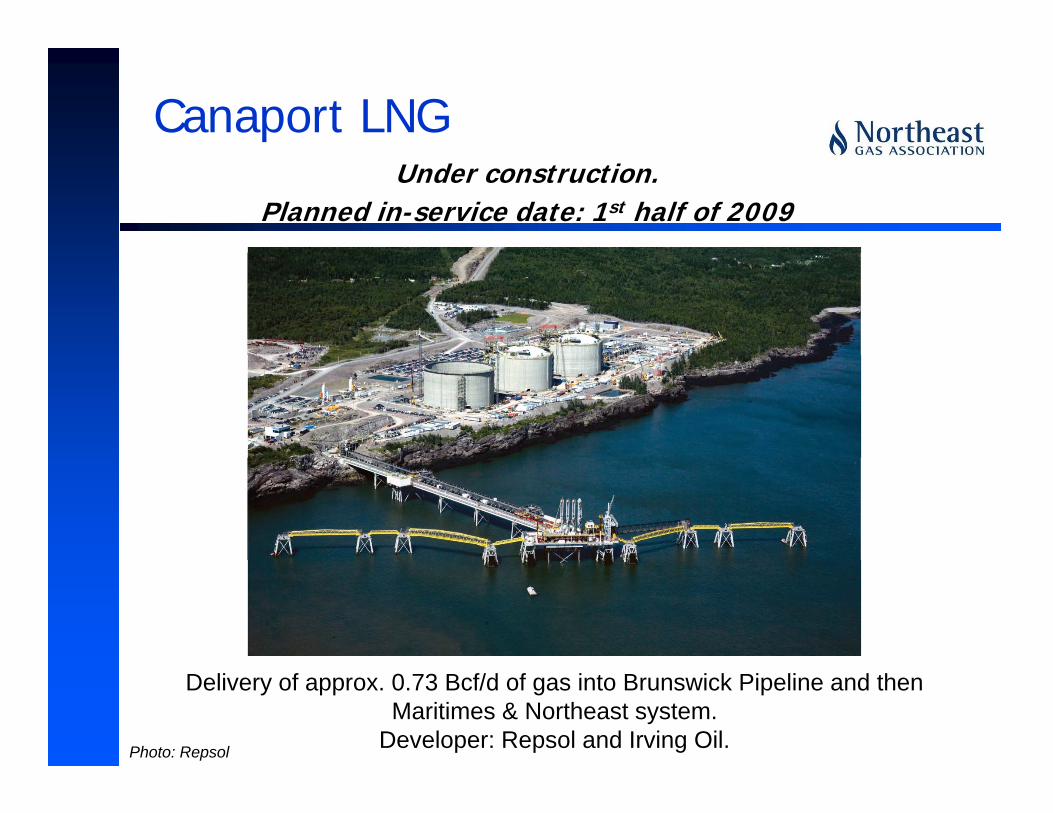
Canaport LNGUnder construction.
Planned in-service date: 1st half of 2009
Delivery of approx. 0.73 Bcf/d of gas into Brunswick Pipeline and then Maritimes & Northeast system.
Developer: Repsol and Irving Oil.Photo: Repsol
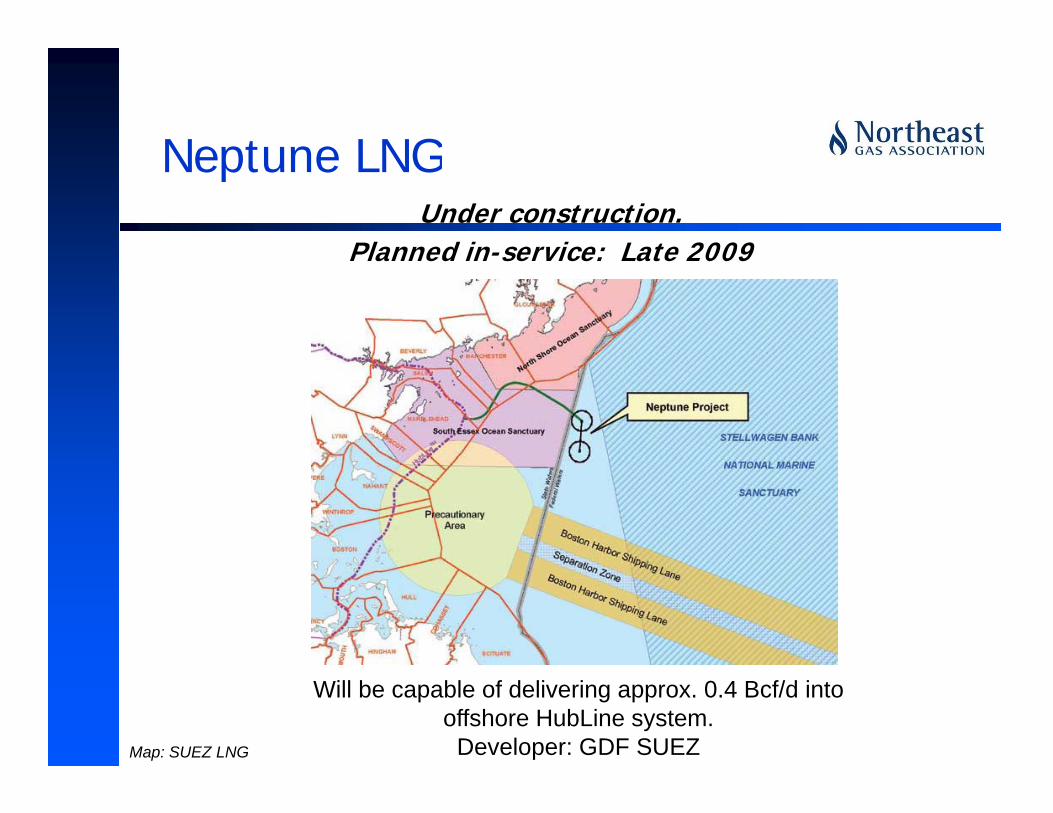
Neptune LNGNeptune LNGUnder construction.
Planned in-service: Late 2009Planned in-service: Late 2009
Will be capable of delivering approx. 0.4 Bcf/d into offshore HubLine system.
Developer: GDF SUEZ Map: SUEZ LNG
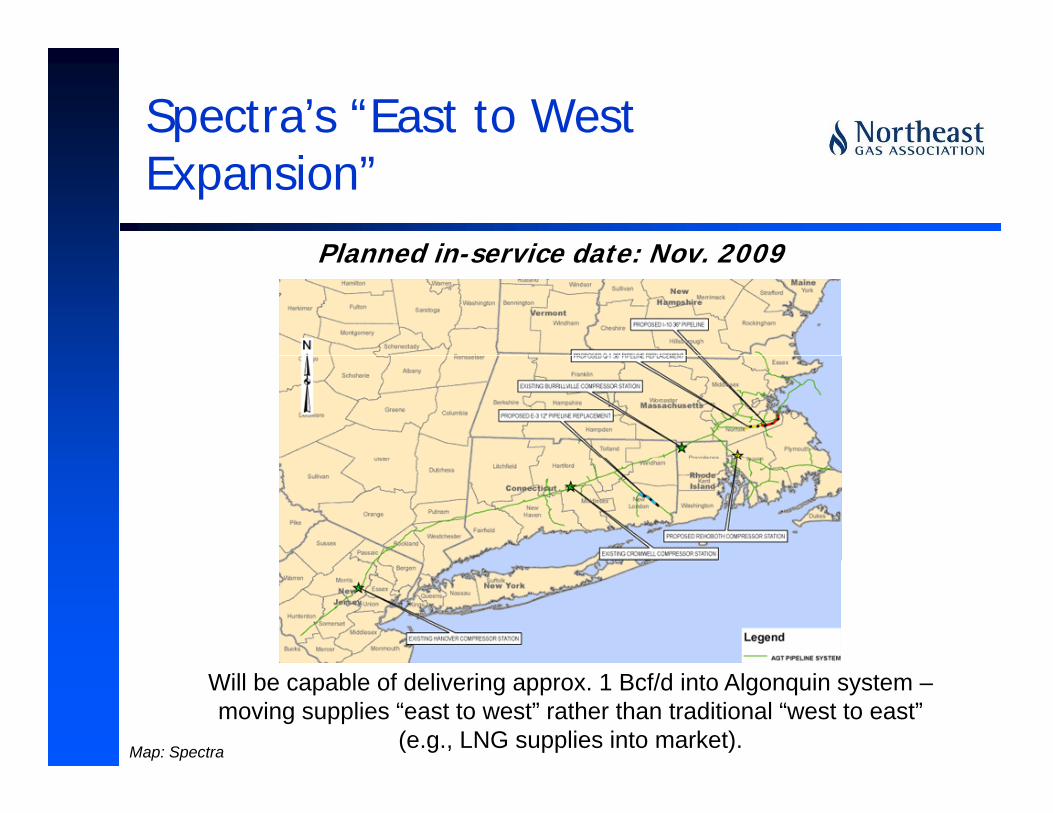
Spectra’s “East to West Expansion”
Planned in-service date: Nov 2009Planned in-service date: Nov. 2009
Will be capable of delivering approx. 1 Bcf/d into Algonquin system –moving supplies “east to west” rather than traditional “west to east”
(e.g., LNG supplies into market).Map: Spectra
On the Supply Horizon:Rockies Gas &Marcellus Shale
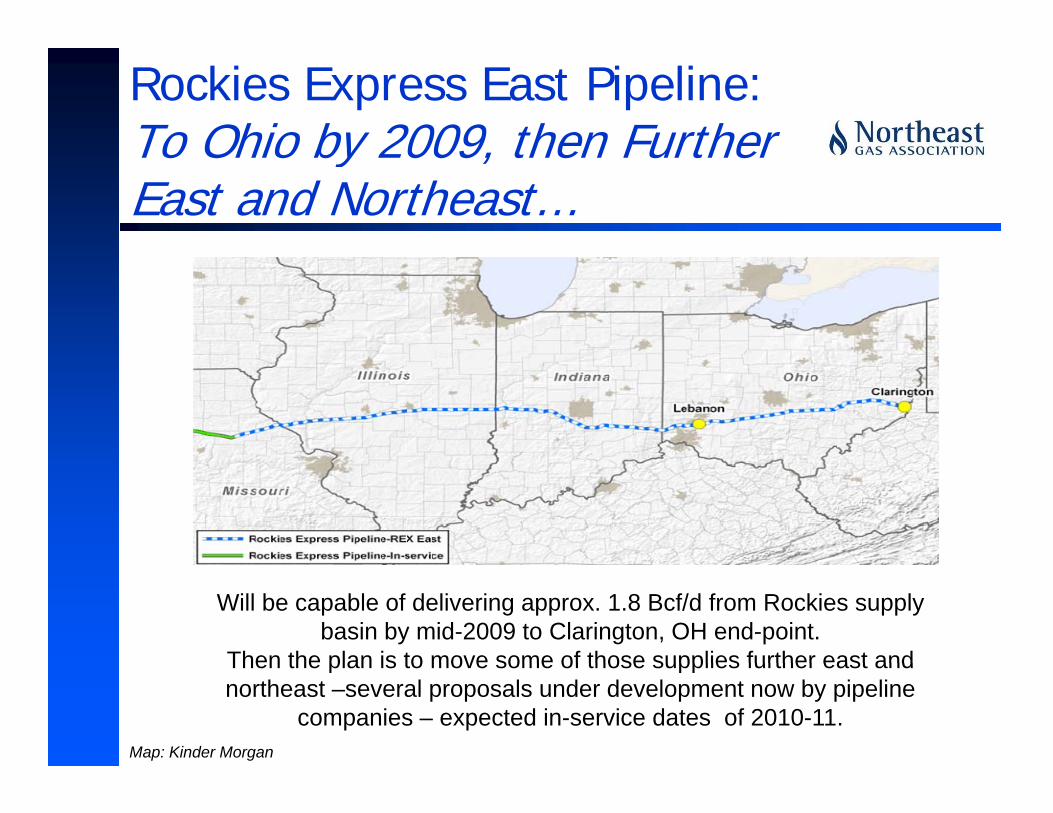
Rockies Express East Pipeline: To Ohio by 2009 then FurtherTo Ohio by 2009, then Further East and Northeast…
Will be capable of delivering approx. 1.8 Bcf/d from Rockies supply basin by mid-2009 to Clarington, OH end-point.
Then the plan is to move some of those supplies further east andThen the plan is to move some of those supplies further east and northeast –several proposals under development now by pipeline
companies – expected in-service dates of 2010-11.Map: Kinder Morgan
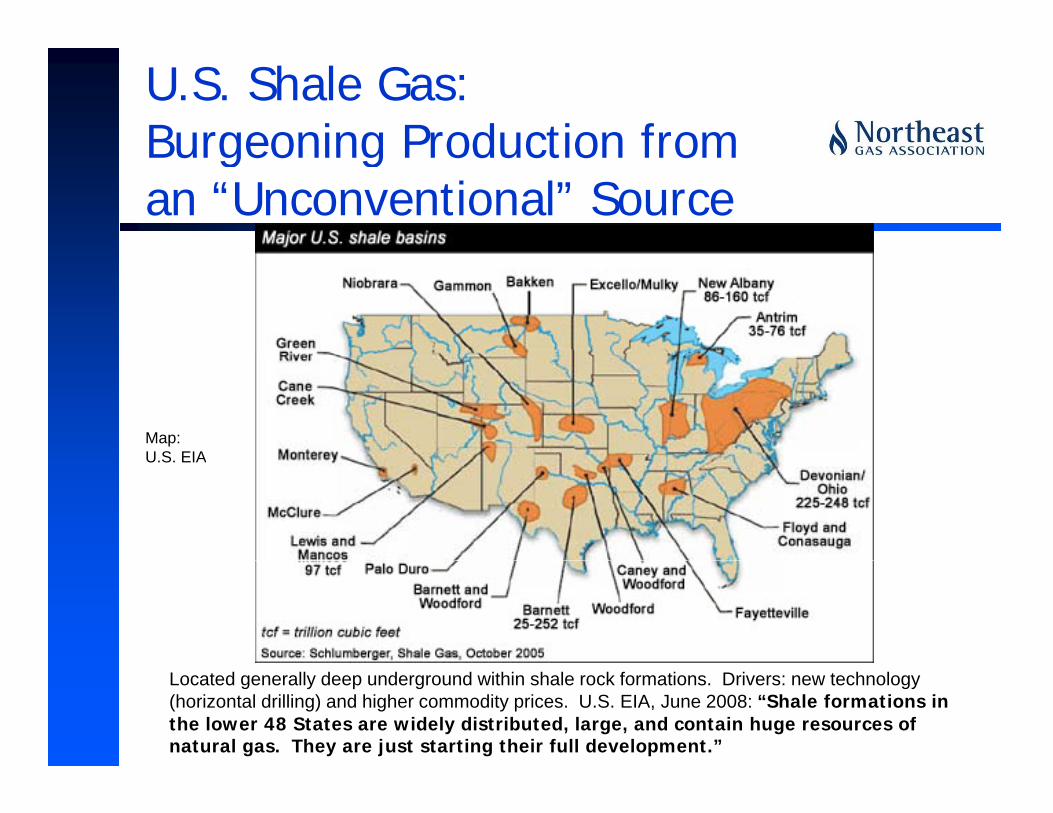
U.S. Shale Gas:Burgeoning Production fromBurgeoning Production from an “Unconventional” Source
Map:U S EIAU.S. EIA
Located generally deep underground within shale rock formations. Drivers: new technology (horizontal drilling) and higher commodity prices. U.S. EIA, June 2008: “Shale formations in the lower 48 States are widely distributed, large, and contain huge resources of natural gas. They are just starting their full development.”
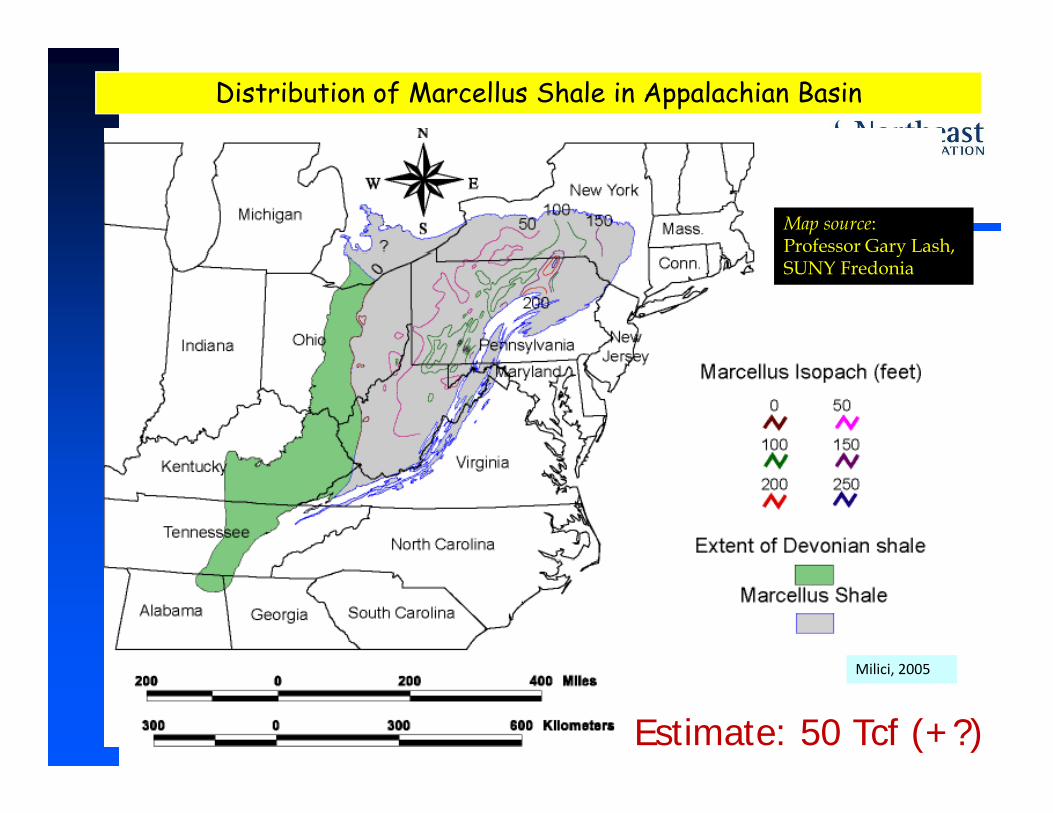
Distribution of Marcellus Shale in Appalachian Basin
Map source: Professor Gary Lash, y ,SUNY Fredonia
Milici, 2005
Estimate: 50 Tcf (+?)
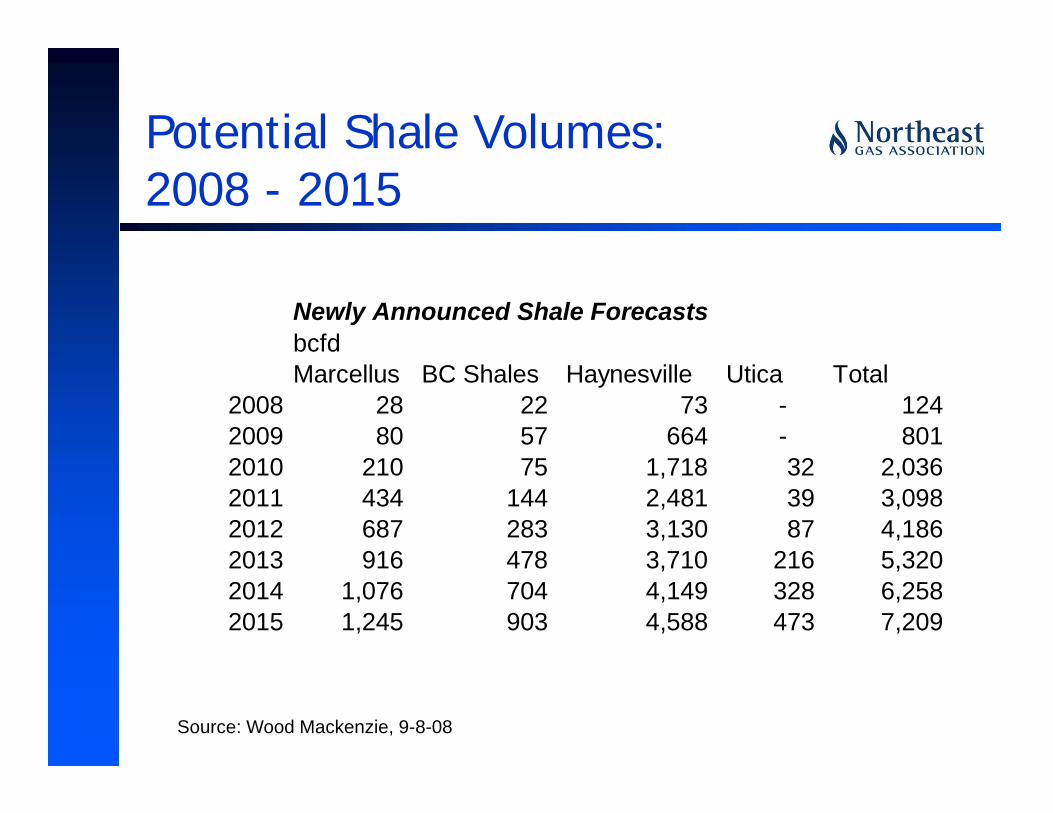
Potential Shale Volumes:2008 - 2015
Newly Announced Shale ForecastsbcfdMarcellus BC Shales Haynesville Utica Total
2008 28 22 73 - 124 2009 80 57 664 - 801 2010 210 75 1 718 32 2 0362010 210 75 1,718 32 2,036 2011 434 144 2,481 39 3,098 2012 687 283 3,130 87 4,186 2013 916 478 3 710 216 5 3202013 916 478 3,710 216 5,320 2014 1,076 704 4,149 328 6,258 2015 1,245 903 4,588 473 7,209
Source: Wood Mackenzie, 9-8-08
75 Second Avenue, Suite 510Needham, MA 02494-2824
Tel. 781-455-6800
1515 Broadway, 43rd floorNew York, NY
Tel. 212-354-4790
www.northeastgas.org