Embed Size (px)
Citation preview
No 2012 – 17 July
DO
CU
ME
NT
DE
TR
AV
AI
L
Native language, spoken language, translation and trade _____________
Jacques Melitz
Farid Toubal
CEPII, WP No 2012-17 Native language, spoken language, translation and trade
2
TABLE OF CONTENTS
Non-technical summary ....................................................................................................... 3
Abstract ............................................................................................................................... 5
Résumé non technique ......................................................................................................... 6
Résumé court ....................................................................................................................... 8
Introduction ......................................................................................................................... 9
1. Theory .......................................................................................................................15
2. Data and Measure ......................................................................................................19
3. The econometric form ...............................................................................................27
4. The results for total trade ...........................................................................................28
5. The results for the Rauch classification ......................................................................32
6. A proposed aggregate index of a common language ..................................................36
7. The role of cross-migrants .........................................................................................38
8. English as a separate language ...................................................................................40
9. Discussion and conclusion .........................................................................................42
References ..........................................................................................................................47
Appendix 1 .........................................................................................................................60
Appendix 2 .........................................................................................................................69
Appendix 3 .........................................................................................................................75
List of working papers released by CEPII ...........................................................................77
CEPII, WP No 2012-17 Native language, spoken language, translation and trade
3
NATIVE LANGUAGE, SPOKEN LANGUAGE, TRANSLATION AND TRADE
Jacques Melitz Farid Toubal
NON-TECHNICAL SUMMARY
It is now customary to control for common language in the study of any influence on bilateral trade, whatever the influence may be. The usual measure of common language is a binary one based on official status. However, it is not obvious that such a measure of common language can adequately reflect the diverse sources of linguistic influence on trade, including ethnic ties and trust, ability to communicate directly, and ability to communicate indirectly through interpreters and translation. In this study we try to estimate the impact of language on bilateral trade from all the likely sources by constructing separate measures of common native language CNL, common spoken language CSL, common official language COL, and linguistic proximity LP between different native languages. The interest of this combination of measures is easy to see. If CSL is significant in the presence of CNL, the significance of CSL would clearly reflect ease of communication rather than ethnicity and trust. If COL is important as well, in the joint presence of CSL and CNL, this would indicate the contribution of institutionalized support for translation from a chosen language into the others that are spoken at home. If LP proves significant while all three previous measures of a common language are present, this might reflect either the ease of obtaining translations and interpreters when native languages differ without any public support in a decentralized manner, or else the importance of the degree of ethnic rapport between groups when their native languages differ. Our study, based on all four measures, does indeed cast a lot of light on the total impact of language and the relative contributions of the different sources of linguistic influence.
In the first place, our results reinforce the earlier conclusion of Melitz that COL underestimates the impact of language at least on the order of one-half. That conclusion had rested on far poorer data. In addition, our results show that any estimate based on a single criterion of a common language, whether it be spoken language, native language or official language, falls far short of the mark. We also establish (as Melitz had taken for granted) that the primary source of linguistic influence on bilateral trade is information rather than ethnicity. At least 2/3 of the influence of language comes from ease of communication alone and has nothing to do with ethnic ties or trust. Based on an application of the Rauch classification between homogeneous, listed and heterogeneous goods, the role of ethnic ties and trust is mainly confined to differentiated goods. Furthermore, all influence of ethnicity on bilateral trade is primarily attributable to cross-migrants. Once cross-migrants enter the analysis, it is difficult to find any trace of influence of ethnicity for all 3 Rauch categories of goods, including differentiated ones. These results all take into account common religion,
CEPII, WP No 2012-17 Native language, spoken language, translation and trade
4
common law and the history of wars as well as the variables of long standing in the gravity literature on bilateral trade, that is, distance, contiguity, and two separate measures of ex-colonialism.
Since we allow CSL and second languages to enter in explaining bilateral trade, we open the door to simultaneity bias. In response to this problem, we propose a measure of common language resting strictly on exogenous factors for use as a control for language in studies of bilateral trade when the focus is not on language but elsewhere. This measure will depend strictly on CNL, COL and LP. However, whenever the subject is language itself, for example, the trade benefit of acquiring second languages or else the case for promoting second languages through public schooling in order to promote trade, a joint determination of bilateral trade and common language will be required. It will then be necessary to go beyond our work. Notwithstanding, we believe our work to be essential as a preliminary for such later investigation, since any effort to determine bilateral trade and common language jointly must capture the main linguistic influences on trade and be able to measure those influences. In addition, the large role of interpreters and translation in trade that we bring to light matters both for empirical analysis and policy. Empirically, this ability of interpreters and translation to facilitate trade makes it easier to understand why some firms are able to cross so many language barriers despite the separate importance of each and every barrier. As regards policy, the role of interpreters and translation points to social (third-party) effects of bilingualism that individuals may not internalize in their decisions about learning languages. We discuss the implications of our study for subsequent empirical work on trade and the benefits of learning languages and optimal language policy in the final section of our paper. Further, since our work assumes that the particular language does not matter for our results, we examine the validity of this assumption in the case of English, and we find no separate role for this language.
An important part of our contribution, if not the most important one, is the construction of our four separate series for common language, of which only one, common official language, is easy to fabricate and widely available. The data will be shortly available on the CEPII website.
CEPII, WP No 2012-17 Native language, spoken language, translation and trade
5
ABSTRACT
We construct new series for common native language and common spoken language for 195 countries, which we use together with series for common official language and linguistic proximity in order to draw inferences about (1) the aggregate impact of all linguistic factors on bilateral trade, (2) whether the linguistic influences come from ethnicity and trust or ease of communication, and (3) in so far they come from ease of communication, to what extent translation and interpreters play a role. The results show that the impact of linguistic factors, all together, is at least twice as great as the usual dummy variable for common language, resting on official language, would say. In addition, ease of communication is far more important than ethnicity and trust. Further, so far as ease of communication is at work, translation and interpreters are extremely important. Finally, ethnicity and trust come into play largely because of immigrants and their influence is otherwise difficult to detect.
JEL Classification: F10; F40 Key Words: Language, Bilateral Trade, Gravity Models
CEPII, WP No 2012-17 Native language, spoken language, translation and trade
6
LANGUE NATALE, LANGUE PARLÉE, TRADUCTION ET ÉCHANGE
Jacques Melitz Farid Toubal
RÉSUMÉ NON TECHNIQUE
Dans toute analyse empirique des échanges bilatéraux, il est d’usage de contrôler pour l’existence d’une langue commune aux deux partenaires. La mesure usuelle de la langue commune prend la forme d’une variable binaire selon que les deux pays ont, ou non, la même langue officielle. Cependant, il n’est pas évident qu’une telle mesure de langue commune puisse refléter de façon adéquate les diverses sources de l’influence linguistique sur les échanges, y compris celles liées à l'ethnicité et la confiance, ou à la capacité de communiquer directement ou indirectement via les interprètes et la traduction.
Dans cette étude nous tâchons d’estimer l’impact de la langue commune sur les échanges bilatéraux en prenant en compte toutes les influences possibles et en construisant des mesures distinctes de l’existence d’une langue natale commune (CNL), d’une langue parlée commune (CSL), d’une langue officielle commune (COL), et de la proximité linguistique (LP) des langues natales. Une telle combinaison de mesures permet de tirer davantage d’informations de chacune. Si CSL est significative en présence de CNL, alors la significativité de CSL provient de la facilité de communiquer plutôt que d’éventuelles influences de l'ethnicité et de la confiance. En ajoutant COL dans la spécification, sa significativité, en présence conjointe de CSL et CNL, indiquerait la contribution d’un support institutionnel pour la traduction d’une langue choisie vers celles qui sont parlées dans le pays. Si LP s’avère significatif lorsque les trois mesures précédentes sont présentes, cela pourrait refléter soit la facilité d’obtenir de manière décentralisée des traductions et des interprètes lorsque les langues natales sont différentes, soit une proximité ethnique entre groupes possédant des langues natales différentes. Notre étude met en lumière l’impact total de tous les facteurs linguistiques et le poids de leurs contributions respectives.
Nos résultats, obtenus à partir de données de meilleure qualité, renforcent d’abord la conclusion de Mélitz (2008) selon laquelle COL sous-estime l’impact de la langue commune d’environ la moitié. En outre, nos résultats montrent que toute estimation fondée sur un seul critère de langue commune, qu’il s’agisse de langue parlée, langue natale, ou langue officielle, sous-estime l’impact global de manière importante. Nous établissons aussi (ce que Mélitz avait simplement supposé) que la source primaire de l’influence linguistique est l’information plutôt que l’ethnicité. Au moins deux tiers de l’influence linguistique proviennent de la seule facilité de communiquer et n’ont rien à voir avec l'ethnicité ou la confiance. Nous montrons aussi, en appliquant la distinction établie par Rauch entre biens homogènes, biens référencés et biens différenciés, que l’influence des liens ethniques et de la confiance se limite pour
CEPII, WP No 2012-17 Native language, spoken language, translation and trade
7
l’essentiel aux biens différenciés. Par ailleurs, l’influence de l’ethnicité sur les échanges bilatéraux serait due principalement aux migrations entre les deux pays : lorsque la migration entre dans l’analyse, il devient difficile de discerner la moindre trace d’influence de l’ethnicité sur l’une ou l’autre des trois catégories de biens, y compris sur les biens différenciés. Ces résultats prennent en compte l’existence d’une religion commune, d’un régime légal commun et l'histoire de guerres passées aussi bien que les variables plus traditionnelles du modèle de gravité : distance, contigüité et relations coloniales.
En introduisant les langues parlées communes dans l’explication des échanges bilatéraux, nous ouvrons la porte au biais de simultanéité. En réponse à ce problème, nous proposons une mesure de langue commune qui ne dépend que de facteurs exogènes CNL, COL et COL pour l’étude des échanges bilatéraux si l’accent n’est pas sur l'impact du langage. Toutefois, lorsque le sujet est le langage lui-même – si on s’intéresse, par exemple, à l’intérêt, pour promouvoir les échanges, d’encourager une deuxième langue dans l’enseignement public – alors une détermination conjointe des échanges bilatéraux et de la langue commune est nécessaire. Il faudra donc dépasser notre travail. Néanmoins, ce travail nous semble important comme point de départ de futures investigations dans la mesure où il montre l’importance de la prise en compte simultanée de l’ensemble des principales influences linguistiques sur les échanges et de la mesure de ces influences. En outre, le rôle important des interprètes et de la traduction que nous mettons en évidence a des conséquences pour l’analyse empirique. Il permet de mieux comprendre pourquoi certaines firmes sont capables de surmonter plusieurs barrières linguistiques. Du point de vue de la politique économique, ce rôle des interprètes et de la traduction signale des externalités positives du bilinguisme qui ne sont pas intégrées aux décisions individuelles d’apprentissage des langues. Dans la dernière partie de l’article, nous revenons sur les implications de notre étude pour les futurs travaux empiriques sur les échanges et la politique optimale des langues. Enfin, puisque notre travail suppose que nos résultats sont indépendants de la langue considérée, nous examinons cette hypothèse dans le cas de l’anglais, et nous trouvons que cette langue n’a aucun rôle distinct.
Une partie importante de notre travail a consisté à construire les quatre séries nécessaires pour définir le langage commun, dont une seulement, celle de la langue officielle commune, est à la fois facile à construire et largement diffusée. Nos propres séries seront bientôt disponibles sur le site web du CEPII.
CEPII, WP No 2012-17 Native language, spoken language, translation and trade
8
RÉSUMÉ COURT
Nous construisons de nouvelles séries de langues natales communes et de langues parlées communes pour 195 pays. Nous utilisons ces séries avec celles de langues officielles communes et de proximité linguistique entre langues natales afin d’aboutir à des conclusions sur : (1) l’influence des facteurs linguistiques sur les échanges bilatéraux ; (2) l’origine de cette influence : ethnicité, confiance, ou facilité de communication, et (3) en ce qui concerne la facilité de communication, le rôle des interprètes et de la traduction. Nous montrons tout d'abord que les facteurs linguistiques, pris dans leur ensemble, ont sur les échanges bilatéraux un effet double de celui estimé à partir de seule la mesure de langue commune utilisée habituellement qui repose sur le statut officiel des langues. Nous montrons ensuite que l'effet du langage sur le commerce bilatéral relève bien davantage de la facilité de communication que de l’ethnicité ou de la confiance. Dans la mesure où c’est la communication qui compte, la traduction et les interprètes jouent un rôle majeur. Enfin, l'influence qu'auraient l'ethnicité ou la confiance sur le commerce bilatéral au travers des langues communes n'est pas claire. Cette influence disparaît lorsque nous contrôlons pour la migration.
Classification JEL : F10; F40 Mots-clefs : Language, Bilateral Trade, Gravity Models
CEPII, WP No 2012-17 Native language, spoken language, translation and trade
9
NATIVE LANGUAGE, SPOKEN LANGUAGE, TRANSLATION AND TRADE
Jacques Melitza Farid Toubalb
INTRODUCTION
It is now customary to control for common language in the study of any influence on bilateral
trade, whatever the influence may be. The usual measure of common language is a binary one
based on official status. However, it is not obvious that such a measure of common language
can adequately reflect the diverse sources of linguistic influence on trade, including ethnic ties
and trust, ability to communicate directly, and ability to communicate indirectly through
interpreters and translation. In this study we try to estimate the impact of language on
bilateral trade from all the likely sources by constructing separate measures of common native
language CNL, common spoken language CSL, common official language COL, and
linguistic proximity LP between different native languages. The interest of this combination
of measures is easy to see. If CSL is significant in the presence of CNL, the significance of
CSL would clearly reflect ease of communication rather than ethnicity and trust. The
additional importance of COL, in the joint presence of CSL and CNL, would indicate the
contribution of institutionalized support for translation from a chosen language into the others
that are spoken at home. If LP proves significant while all three previous measures of a
common language are present, this might reflect the ease of obtaining translations and
interpreters when native languages differ without any public support in a decentralized
The authors would like to thank Paul Bergin, Mathieu Crozet, Ronald Davies, Peter Egger, Victor Ginsburgh, Thierry Mayer, Marc Melitz, Giovanni Peri, and the members of the economics seminars at CES-Ifo, ETR Zurich, Heriot-Watt University, the Paris School of Economics, the University of California at Davis, UCLA, and University College Dublin for valuable comments. aHeriot-Watt University, CEPR, ENSAE and CEPII. Email: [email protected]. Address: Department of Economics, Mary Burton Building, Heriot-Watt University, Edinburgh EH14 4AS, UK. bParis School of Economics and CEPII. Email: [email protected]. Address: CEPII, 113 rue de Grenelle, 75007 Paris.
CEPII, WP No 2012-17 Native language, spoken language, translation and trade
10
manner. Or else it might reflect the importance of the degree of ethnic rapport between groups
when their native languages differ. Our study, based on all four of the measures together, does
indeed cast a lot of light on the total impact of language and the relative contributions of the
different sources of linguistic influence.
In the first place, our results reinforce the earlier conclusion of Melitz (2008) that COL
underestimates the impact of language at least on the order of one-half. That conclusion had
rested on far poorer data. In addition, our results show that any estimate based on a single
criterion of a common language, whether it be spoken language, native language or official
language, falls far short of the mark. We also establish (as Melitz had taken for granted) that
the primary source of linguistic influence on bilateral trade is information rather than
ethnicity. At least 2/3 of the influence of language comes from ease of communication alone
and has nothing to do with ethnic ties or trust. Based on an application of the Rauch (1999)
classification between homogeneous, listed and heterogeneous goods, the role of ethnic ties
and trust is mainly confined to differentiated goods. This may not be surprising. We would
have expected the significance of ethnic ties and trust to be higher for differentiated goods
than homogenous ones since the required information for bilateral trade is higher, but
confirmation is reassuring. Furthermore, all influence of ethnicity on bilateral trade is
primarily attributable to cross-migrants. Once cross-migrants enter the analysis, it is difficult
to find any trace of influence of ethnicity for all 3 Rauch categories of goods, including
differentiated ones. These results all take into account common religion, common law and the
history of wars as well as the variables of long standing in the gravity literature on bilateral
trade, that is, distance, contiguity, and two separate measures of ex-colonialism.
Of course, once we allow CSL and second languages to enter in explaining bilateral trade, we
open the door to simultaneity bias. In response to this problem, we will propose a measure of
common language resting strictly on exogenous factors for use as a control for language in
studies of bilateral trade when the focus is not on language but elsewhere. This measure will
depend strictly on CNL, COL and LP. However, when the subject is language itself, for
CEPII, WP No 2012-17 Native language, spoken language, translation and trade
11
example, the trade benefit of acquiring second languages or else the case for promoting
second languages through public schooling in order to promote trade, a joint determination of
bilateral trade and common language will be required. It will then be necessary to go beyond
our work. Notwithstanding, we believe our work to be an essential preliminary for such later
investigation. Any effort to determine bilateral trade and common language jointly must
capture the main linguistic influences on trade and be able to measure those influences. In
addition, the large role of interpreters and translation in trade that we bring to light matters
both for empirical analysis and policy. Empirically, this ability of interpreters and translation
to facilitate trade makes it easier to understand why some firms are able to cross so many
language barriers despite the separate importance of each and every one. As regards policy,
the role of interpreters and translation points to social (third-party) effects of bilingualism that
individuals may not internalize in their decisions about learning languages. In the closing
section we will return to the implications of our study for subsequent empirical work on trade,
the benefits of learning languages and optimal language policy.
Obviously crucial for our work was an ability to construct separate series for CSL, CNL, COL
and LP. Of the four, the only easy series to construct is COL. In this study, as everywhere,
this measure is a binary one, either 0 or 1. We treated the other three linguistic series as
continuous ones going from 0 upwards. Of the three, CNL was the easiest one to build. In
principle, we could have done so based on a single source, Ethnologue, or perhaps
Encyclopedia Britannica (which contains less detailed information) as Alesina et al. (2003)
did, though we proceeded differently. However, constructing series for CSL and LP was a
considerable challenge.
When one of us tackled the problem of measuring a CSL about a decade ago, the information
was so widely dispersed and difficult to get that he decided to stick to two sources in order to
retain some degree of consistency and reproducibility, namely, Ethnologue and the CIA world
factbook. He also needed to rely heavily on inferences from these two sources concerning
literacy rates (Melitz (2008)). When we revisited the problem together more recently, the
CEPII, WP No 2012-17 Native language, spoken language, translation and trade
12
information was far better and surprisingly easier to collect. Special Eurobarometer 243
(2006) made available the results of a detailed survey in November-December 2005 on
spoken languages in all EU members (including the two then-current prospective ones and the
two candidate members). Crystal (2005) had updated his earlier estimates of English speakers
in many parts of the rest of the world (which had appeared in Crystal (1997)) in the second
edition of the Cambridge Encyclopedia of the English Language. In addition, the French
Foreign Service supplied estimates of speakers of French for the members of l’organisation
de la francophonie. Very helpfully, the editors of the web encyclopedia Wikipedia had started
a special project of collecting referenced information on world languages, which incorporated
the results of a number of national census reports. Among other things, they had conveniently
brought together fairly comprehensive tables for English, Spanish and Portuguese. Finally,
the web version of Ethnologue offered far better coverage of second languages (non-native
languages) than the earlier published versions.
In the case of linguistic proximity LP, we were perhaps even luckier. There had been
measures of LP relying on scores on tests of language proficiency, usually concerning
immigrants and sometimes applicants for academic study abroad. However, all such measures
related to English. They had also usually centered on the US (see, for example, Chiswick and
Miller (1998, 2004)). These measures therefore were not ideal for us since we wanted ones
applying to as wide as possible a world sample in order to identify four separate linguistic
influences simultaneously.1 Perhaps the broadest source of quantified information on the
subject of LP for years was a study by ethnostatisticians (Dyen et al. (1992)). Yet even this
study is too confining for us since it is restricted to indo-European languages. However, a
clever effort to overcome this last problem had been made by Laitin (2000) and Fearon (2003)
1 There have been two earlier efforts to apply such measures of LP to bilateral trade, both of note, and both of them
requiring some limitations that we wished to avoid. In the first (which depended on degrees of English proficiency by emigrants to the US), Hutchison (2005) restricts himself to bilateral trade with the US. In the second, a particularly intriguing effort (based on scores on tests of English proficiency for admission to US colleges), Ku and Zussman (2010) manage to treat worldwide trade. But to do so they suppose that the single linguistic factor that enters in the analysis of bilateral trade besides “native or official language” (see the note to Table A1) is the ability of English to serve as a go-between.
CEPII, WP No 2012-17 Native language, spoken language, translation and trade
13
(jointly and earlier in unpublished work) on the basis of the Ethnologue classification of
language family trees. This effort had also since been taken up in studies of various topics
(see Guiso et al. (2009) and Desmet et al. (2009a, b)). See Ginsburgh and Weber (2011) for a
nice general treatment. We had prepared to rely exclusively on this method as well when it
became possible to do better.
Ethnolinguists had been trying to unify and systematize knowledge of lexical, grammatical
and phonological aspects of languages for decades and not only for the indo-European family
group but other language families as well. The advent of the computer permitted this
collective effort to make remarkable advances in recent years. At the time that we first learned
of the Automated Similarity Judgment Program or ASJP, an international project headed by
ethnolinguists and ethnostatisticians dating to the mid-2000s (see Brown et al. (2008)), it had
a databank covering the lexical aspects (word meanings) of more than 2400 of the world’s
nearly 7000 languages (Bakker et al. (2009)).2 By the time we engaged in an exchange with a
prominent member of the project, Dik Bakker, in October 2010, there were already “close to
5000” in the databank (to quote him). He had the kindness to supply us the matrix of language
distances for virtually all of the 100-some languages we asked for (and even to suggest close
substitutes in virtually all the cases where the specific varieties we requested were not the
ones to which the group had given priority). Our basic problem then was to convert this
language by language matrix to a country by country one for linguistic distances. This was no
mean task since we required consideration of 195 countries in our final results; but it did not
demand any further research.
The next section contains the basic gravity model of bilateral trade. There we shall explain
our controls in order to study language, which as mentioned include common legal system,
common religion, and the history of wars since 1823, as well as distance, contiguity, and two
measures of ex-colonialism. In the following section, we will discuss our data and explain all
2 For an earlier use of this source in a trade study that centers on four particular languages, English, French, Spanish
and Arabic, see Selmier and Oh (2012).
CEPII, WP No 2012-17 Native language, spoken language, translation and trade
14
of our measures. Section 3 shall discuss the econometric specification and our basic reliance
on cross-sectional evidence. While we shall use panel estimates for 1998-2007 inclusively, we
shall always do so with country-year fixed effects. Therefore the estimates strictly rest on the
cross-sectional evidence. In addition, we shall employ the cross-sectional estimates in the 10
individual years to indicate robustness. Since our main analysis deals strictly with positive
values for trade, we will also raise the issue of the zeros in the trade data, to which we will
return in an appendix. Section 4 will present our results for trade in the aggregate. Section 5
will then study separately each of the three Rauch classifications. Section 6 will propose our
aforementioned aggregate index of a common language based on exogenous sources.
According to this new measure, on a scale of 1 to 100 a one-point increase in common
language from all the previous sources increases bilateral trade by 1.15 percent. Estimates
based on official status alone would be around 0.5 percent. In terms of the literature, 0.5
corresponds precisely to the estimate in Frankel and Rose (2002) and in Melitz (2008). A
recent meta-analysis by Egger and Lassmann (2011), which rests on 81 different studies,
reports a coefficient of 0.44.
In all parts of the preceding analysis, we ignore endogenous influences on bilateral trade apart
from spoken language (CSL) since those might depend on language. In section 7, we will then
go back to the one of these influences that really matters and modifies the linguistic effects,
namely, cross-migrants. (Free trade areas and common currency areas do not matter.) As will
be seen, roughly 25 to 38 percent of the influence of linguistic influences on bilateral trade
from all sources, informational and cultural, comes from cross-migrants. Perhaps part of this
influence of cross-migrants is independent of language. But isolating this part would be a
separate project. The evidence also plainly shows that cross-migrants are the main reason for
the role of ethnicity and trust in explaining linguistic influences on bilateral trade. In addition,
our work assumes that the particular language does not matter for the results. Section 8 will
examine this assumption for English. We find no separate role for this language, nor for any
of the other major world ones. Section 9 will contain a concluding discussion.
CEPII, WP No 2012-17 Native language, spoken language, translation and trade
15
1. THEORY
We shall use the gravity model in our study with a single minor adaptation: namely, to treat
the differences in prices on delivery (cif) from different countries as stemming either from
trade frictions, as is usually done, or else from Armington (1969) preferences for trade with
different countries. This will allow for the possibility that the influence of common language
reflects a choice of trade partners as such rather than trade frictions. The basic equation,
which remains founded on CES preferences in all countries, is:
W
ji-1
i
jijij Y
YYPpt
M
(1)
Mij is the trade flow from country j to country i. Yi and Yj are the respective incomes of the
importing and exporting countries and YW is world output. β is the elasticity of substitution
between different goods and greater than 1. Pi is the Dixit-Stiglitz price level (based on utility
maximization) of the importing country and pj is the price of country j exports. tij is 1+xij
where as a fundamental point, xij is either positive and stands for the percentage of the costs
of foreign trade attributable to trade frictions relative to the export price pj, or is negative and
stands for the percentage discount below pj that country j’s firms accord country i out of
ethnic tie or trust. The Mji equation is the same with tjipi/Pj instead.
We shall be interested strictly in the sum impact of language on trade and not the difference
between fixed costs and variable costs of language. Otherwise, the instances of zero bilateral
trade would have special significance, as Helpman et al. (2008) have shown. We will also not
concern ourselves with the symmetry of the respective impacts of linguistic influences on
imports in the two opposite directions for a country pair. Recent work would imply that the
linguistic effects reflecting trust between country pairs are notably asymmetric (see Guiso et
al. (2009) and Felbermayr and Toubal (2010)). We shall disregard the point.
Next, we propose to model tij in a convenient log-linear form, namely
n
2k kij,kγ
ij vγexpDt 1 (2)
CEPII, WP No 2012-17 Native language, spoken language, translation and trade
16
where D is bilateral distance and the vij terms are bilateral frictions or aids to trade.
Accordingly, 1 is an elasticity and [k]k = 2, …, n is a vector of semi-elasticities. Except for 2
cases that we will explain in due course, all of the vij terms are either 0,1 dummies or else
continuous 0-1 values going from 0 to 1.
COL, CSL, CNL, and LP will be separate vij terms. Melitz (2008) interprets the dummy or
0,1 character of COL as implying that status as an official language means that all messages
in the language are received by everyone in the country at no marginal cost, regardless what
language they speak. There is an overhead social cost of establishing an official language and
therefore a maximum of two languages with official status in accord with the literature. But
once a language is official, receiving messages that originate in this language requires no
private cost, overhead or otherwise: everyone is “hooked up.” Here we shall follow this view
except on one important point. For reasons that will emerge later, we will consider the
presence of a private once-and-for-all overhead cost of getting “hooked up”. This leads us to
abandon the reference to “open-circuit communication”. As always, if COL equals 1 a
country pair shares an official language and otherwise COL equals 0.
CSL is a probability (0-1) that a pair of people at random from the two countries understand
one another in some language. CNL is the 0-1 probability that a random pair from two
countries speak the same native language. Therefore CSL embraces CNL and is necessarily
equal or greater than CNL. LP refers to the closeness of two different native languages along
a purely lexical scale, where a rise in LP means greater closeness. As a fundamental point, LP
is therefore irrelevant when two native languages are identical. For that reason, we never
entertain LP as a factor when CNL is 1 and assign it a value of 0 in this case as well as when
two languages bear no resemblance to one another whatever. In principle, we might have
assigned LP a value of 1 rather than 0 when CNL is 1 and simply constructed a combined 0-1
CNL+LP variable with LP adding something to the probability of communication in
encounters between people when their native languages differ. However, our measure of LP
rests on a completely different scale than the one for CNL. Furthermore, we wanted to
CEPII, WP No 2012-17 Native language, spoken language, translation and trade
17
distinguish the issue of translation and ability to interpret from that of direct communication.
For these reasons, we prefer to estimate the two influences separately (in a manner that we
shall discuss) and assign separate coefficients to them though we shall try to combine them
eventually.3
The additional vij terms are required controls in order to discern the impact of linguistic ties on
bilateral trade. Countries with a common border often share a common language. Pre-WWII
colonial history in the twentieth century and earlier is also highly important. People in ex-
colonies of an ex-colonizer often know the language of the ex-colonizer and, as a result,
people in two ex-colonies of the same ex-colonizer will also tend to know the ex-colonizer’s
language. We therefore use dummies for common border, relations between ex-colonies and
ex-colonizer and relations between pairs of ex-colonies of the same ex-colonizer as additional
vij terms and we base ex-colonial relationships on the situation in 1939, at the start of WWII.4
In addition, we wanted to reflect some additional variables that have entered the gravity
literature more recently and could well interact with the linguistic variables. These are
common legal system, common religion, and trust (apart from whatever indication of trust a
CL provides). A common legal system affects the costs of engaging in contracts, a
consideration not unlike the costs of misunderstanding that result from different languages. A
common religion creates affinities and trust between people just as a CNL might. On such
reasoning, we added a 0,1 dummy for common legal system, and created a continuous 0-1
variable for common religion on all fours with the one for CNL. Quite specifically, our
common religion variable refers to the probability that two people at random from two
countries share the same religion. To reflect trust as distinct from native language, was a
particular problem. Guiso et al. (2009) had exploited survey evidence about trust as such in an
EU survey of EU members. We have no such possibility in our worldwide sample. They also 3 When we do combine the two, we also render the series for LP comparable (at the means) to the one for COL, the
other linguistic series that refers to translation. 4 Common country also sometimes enters as a variable in gravity models because of separate entries for overseas
territories of countries (e.g., France and Guadeloupe). Our database does not include these overseas regions separately (e.g., Guadeloupe is included in France).
CEPII, WP No 2012-17 Native language, spoken language, translation and trade
18
used genetic distance and somatic distance to reflect ancestral links between people.
However, no one has yet converted these indices into worldwide ones for all country pairs.5
The only measure of ancestral links of theirs that we were able to use readily is the history of
wars; or at least we could do so by limiting ourselves to wars since 1823 rather than 1500 as
they had. This more limited measure of ancestral conflicts, it should be noted, has already
proven useful in related work concerning civil wars by Sarkees and Wayman (2010) (to say
nothing of related work by Martin et al. (2008) where the civil war data starts only in 1950).
As mentioned earlier, we decided to exclude possible controls that might be affected by
bilateral trade itself in our study period and therefore might be endogenous. For this reason,
we omitted free trade agreements (FTAs), common currency areas and cross-migration.6 The
problem in all of these cases is easy to see. Suppose, for example, that by promoting bilateral
trade, a CL enhances FTAs. Introducing FTAs as a separate control in the analysis may then
mask some influence of CL on trade. Of course, if FTAs affect trade independently of
language and are positively or negatively correlated with language, excluding FTAs will
entail some omitted variable bias. For this reason, we shall need to check later on whether
adding FTAs, common currency areas and cross-migration affects our estimates of the impact
of language on trade. Only cross-migration does so, as presaged earlier, and we shall examine
the implications. Still, if only for clarity, we prefer estimating the impact of linguistic
influences in the absence of any endogenous variables except CSL in our main investigation.
5 In a related study to that of Guiso et al. (2009), Giuliano et al. (2006) also limited their use of genetic and somatic
indices to Europe. 6 As regards FTAs and common currency areas, Baier and Bergstrand (2007), and more recently Egger et al. (2011), show a powerful reciprocal influence between FTAs and bilateral trade. Similarly, Persson (2001) argues that common currency areas may be endogenous (though see Rose’s (2001) response). Further, earlier studies give strong reason to think that cross-migration hinges partly on bilateral trade even if the work thus far has tended to concentrate on the impact the other way, that is, that of emigrants on trade.

CEPII, WP No 2012-17 Native language, spoken language, translation and trade
19
2. DATA AND MEASURE
Regarding data and measures, our source for bilateral trade is the BACI database of CEPII,
which corrects for various inconsistencies (see Gaulier and Zignano (2010)). The series
concerns 224 countries in 1998 to 2007 inclusively, of which 29 (mostly tiny islands) drop out
because of missing information on religion, legal framework and/or the share of native and
spoken languages. Eventually, we also dropped all observations that do not fit into Rauch’s
tripartite classification (as the BACI database permits us to do). This last limitation meant
losing only a minor additional percentage of the remaining observations, less than 0.5 of one
percent. Our measure of distance rests on the 2 most populated cities and comes from the
CEPII database as well. We shall concentrate next on our four language variables.
(a) Common official language
With regard to COL, the usual source is the CIA World Factbook. Though we used it as well,
we considered the broader evidence. As an example of the insufficiency of the Factbook,
English was adopted as an official language in Sudan only in 2005, during our study period,
while Russian was adopted officially in Tajikistan in 2009, since our study period. However,
in Tajikistan, Russian had continued to be widely used uninterruptedly in government and the
media since the breakdown of the Soviet Union in 1990, whereas there is no reason to believe
that the decision of Sudan to adopt English was independent of trade in our study period.
Similarly, in some countries, though the language of the former colonial ruler was dropped
officially after national independence, it remained in wide use in government and the media
throughout. This pertains to French in Algeria, Morocco and Tunisia. Other issues arose.
Thus, Lebanon has a law specifying situations where French may be used officially. German
is official in some neighboring regions of Denmark. In the case of all such questions, we
tended toward a liberal interpretation on the grounds that the basic issue was public support
for the language through government auspices. Thus, we accepted German in Denmark,
Russian in Tajikistan, French in Lebanon, Algeria, Morocco and Tunisia. Finally, we
restricted ourselves, as is typically done, to 2 official languages at most. To do so, we kept
CEPII, WP No 2012-17 Native language, spoken language, translation and trade
20
the 2 most important languages in world trade. Because of this 2-language restriction, we
kept English and Chinese for Singapore but dropped Malay, which is also rather important in
the region (a problematic case). As a result of this exercise, all in all, we have 19 official
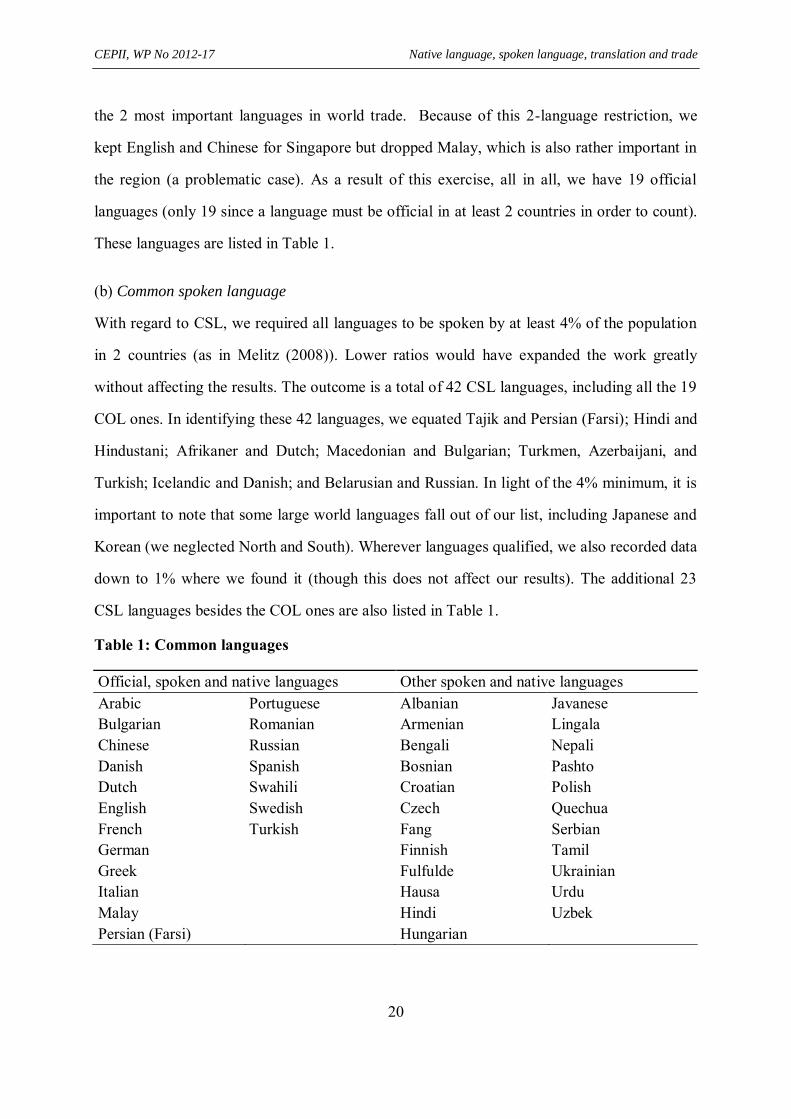
languages (only 19 since a language must be official in at least 2 countries in order to count).
These languages are listed in Table 1.
(b) Common spoken language
With regard to CSL, we required all languages to be spoken by at least 4% of the population
in 2 countries (as in Melitz (2008)). Lower ratios would have expanded the work greatly
without affecting the results. The outcome is a total of 42 CSL languages, including all the 19
COL ones. In identifying these 42 languages, we equated Tajik and Persian (Farsi); Hindi and
Hindustani; Afrikaner and Dutch; Macedonian and Bulgarian; Turkmen, Azerbaijani, and
Turkish; Icelandic and Danish; and Belarusian and Russian. In light of the 4% minimum, it is
important to note that some large world languages fall out of our list, including Japanese and
Korean (we neglected North and South). Wherever languages qualified, we also recorded data
down to 1% where we found it (though this does not affect our results). The additional 23
CSL languages besides the COL ones are also listed in Table 1.
Table 1: Common languages
Official, spoken and native languages Other spoken and native languages Arabic Portuguese Albanian Javanese Bulgarian Romanian Armenian Lingala Chinese Russian Bengali Nepali Danish Spanish Bosnian Pashto Dutch Swahili Croatian Polish English Swedish Czech Quechua French Turkish Fang Serbian German Finnish Tamil Greek Fulfulde Ukrainian Italian Hausa Urdu Malay Hindi Uzbek Persian (Farsi) Hungarian
CEPII, WP No 2012-17 Native language, spoken language, translation and trade
21
With respect to the figures themselves, we used the data from the EU survey in November-
December 2005 (Special Eurobarometer 243 (2006)). This data covers the current 27 EU
members (which only numbered 25 at the time) plus Croatia and Turkey, the two applicants.
The survey includes 32 languages, 21 of which are part of our CSL list. In recording this data
we summed the percentage responses to the two following questions: “What is your maternal
language” and “Which languages do you speak well enough in order to be able to have a
conversation, excluding your mother tongue (… multiple answers possible).” Next, for
English, we used the “list of countries by English-speaking population” from Wikipedia
(downloaded 18 June 2010), which reproduces the same numbers that we had extracted from
the EU survey but also updates many of the estimates in Crystal (2005) for the rest of the
world on the basis of various national census reports and more recent sources. For French, we
relied on the “estimation du nombre de francophones dans le monde en 2005” [estimate of the
number of francophones in the world] of the organisation internationale de la francophonie
(available on the web), which we complemented with information from separate entries for
“African French” and for “French Language” in Wikipedia, all the figures for which come
from referenced French governmental sources. For Spanish, we used a long entry on “Spanish
Language” in Wikipedia offering world figures from numerous cited sources (mostly
Ethnologue, national censuses and Encarta). A similar entry for “Geographical distribution of
Portuguese” served for Portuguese.
For all the rest, we basically combed the information in Ethnologue on the web first by
language and next by country. German, Russian and Arabic deserve separate mention. In the
case of German, the entry “Ethnologue: Germany” is particularly useful. So is a Wikipedia
entry on “German as a minority language.” In the case of Russian, a Gallup poll took place in
2008 with the web entry “Russian language enjoying a boost in post-Soviet states.” Arabic
was a problem. Despite all of the information in Ethnologue classified by language and by
country, we still needed to make numerous inferences from literacy rates in Arab-speaking
countries. Our resulting data set covers observations for spoken languages for different years,
CEPII, WP No 2012-17 Native language, spoken language, translation and trade
22
all between 2000 and 2008. In light of the rapid ascension of English as a world language in
our study period, we suspect the main flaws in our series to be some of the zeros for spoken
English (for example, South Korea).
After the data collection, it was necessary to go from the national data to country pair data.
This meant calculating the sums of the products of the population shares that speak identical
languages by country pair. Some double-counting took place. Consider simply the fact that
the 2005 EU survey allows respondents to quote as many as 3 languages besides their native
one in which they can converse. A Dutch and Belgian pair who can communicate in Dutch or
German and perhaps also in French may then count 2 or 3 times in our summation. There are
indeed 34 cases of values greater than 1 following the summation or the first step in our
construction of CSL from the national language data.
In order to correct for this problem, we applied a uniform algorithm to all of the data. Let the
aforementioned sum of products or the unadjusted value of a common spoken language be αij where αij =
n
1 1j1iLL for country pair ij, L1 is a particular language and n is the number of
languages the countries share. The algorithm requires first identifying the language that
contributes most to αij, recording its contribution, or max(αij), which is necessarily equal or
less than 1, and then calculating
CSL = max(α) + (α max(α)) (1 max(α))
(where we drop the country subscripts without ambiguity). CSL is now the adjusted value of
α that we will use. In the aforementioned 34 cases of α greater than 1 (whose maximum value
is 1.645 for the Netherlands and Belgium-Luxembourg), α max(α) is always less than 1.
Therefore the algorithm assures that CSL is 1 and below.7 In the other cases, whenever α is
close to max(α), the adjustment is negligible and CSL virtually equals max(α). However, if α
is notably above max(α), there can be a non-negligible downward adjustment and this
7 The lowest value of CSL in these 34 cases is .75 and relates to Switzerland and Denmark, for which the unadjusted value α is 1.01. This CSL value implies 1 chance out of 4 that a Dane and a Swiss at random will not understand each other in any language and about the same chance (since α CSL is .26) that they will understand each other in 2 languages or more.
CEPII, WP No 2012-17 Native language, spoken language, translation and trade
23
adjustment will be all the higher if the values of max(α) are higher or closer to 1. This makes
sense since values of max(α) closer to 1 leave less room for 2 people from 2 different
countries to understand each other only in a different language than the one already included
in max(α). We checked and found that the estimates of the influence of CNL on bilateral trade
following the application of the algorithm raise the coefficient of CNL notably without
changing the standard error in our estimates. This is exactly the desired result since it signifies
that the adjustment eliminates a part of α that has no effect on bilateral trade (double-
counting). We see no simpler way of making the adjustment.
(c) Common native language
For CNL we favored figures that are consistent with CSL. Thus, we stuck to Special
Eurobarometer 243 (2006) for the 29 countries in the EU survey and for the rest, we relied on
information from the identical source that we used for CSL whenever possible (not always).
In cases where holes needed to be filled we systematically consulted Ethnologue and checked
against the CIA World Factbook (which offers detailed breakdowns for some countries but
not others).8 By and large, we gave preference to dates corresponding to those for CSL. After
assembling this data, we summed the products of the percentages of native speakers of
common languages by country pair in the same manner as we had for CSL. But in this case,
no values greater than one arose (though they could have since the EU survey invites
respondents to mention more than one maternal language if they consider that right). In
general, double-counting appears negligible in our calculation of CNL and no adjustment was
needed. All CSL languages figure in the calculation of CNL.9
8 Even in the cases outside the EU survey where no holes needed to be filled, Ethnologue might well have been the
source. 9 This need not have happened. If any CSL language had failed to be a native language in more than a single country
(even at the 1 percent level), it would have fallen out of the CNL group. No such case arose.
CEPII, WP No 2012-17 Native language, spoken language, translation and trade
24
(d) Linguistic proximity
The LP measure raises distinct issues. In this case, taking the native language into account is
at the heart of the matter regardless whether the language has any role outside the country.
Thus, Japanese and Korean figure and, for example, Tagalog is far more relevant than English
in the Philippines. In addition, since we needed to simplify, we only admitted 2 native
languages at most in calculating LP. When there are 2, we adjusted their relative percentages
to sum to 1, the same score we ascribed in case of a single native language. Thus, Switzerland
shows 0.74 for German and 0.26 for French, Bolivia 0.54 for Spanish and 0.46 for Quechua.
The minimum percentage we recorded for a native language was 0.13 for Russian in Israel.
Very significantly too, we assigned 31 zeros. Those are cases of countries with a high index
of linguistic diversity (in Ethnologue) and where no native language concerns a majority of
the population. The underlying logic is clear. When languages are widely dispersed at home,
the linguistic benefit of trading at home rather than abroad is muddy to begin with. Therefore,
it is questionable to make fine distinctions about the distances of the 2 principal native
languages to foreign languages. The 31 countries to which we assigned zeros notably include
India (where linguistic diversity scores 0.94 out of 1). The other examples are mostly African
ones: South Africa is an outstanding case. Following this exercise, we have exactly 89 native
languages to deal with. These 89 exclude 5 of the 42 CSP languages (Fang, Fulfulde, Hausa,
Lingala and Urdu) for various reasons (an insufficient percentage of native speakers,
excessive linguistic diversity or both).
Next, as already presaged, we constructed two separate measures of LP, LP1 and LP2. LP1 is
inspired by the aforementioned idea in Fearon (2003) and Laitin (2000) of calculating
linguistic proximities on the basis of the Ethnologue classification of language trees between
trees, branches and sub-branches. We allowed 4 possibilities, 0 for 2 languages belonging to
separate family trees, 0.25 for 2 languages belonging to different branches of the same family
tree (English and French), 0.50 for 2 languages belonging to the same branch (English and
German), and 0.75 for 2 languages belonging to the same sub-branch (German and Dutch).
CEPII, WP No 2012-17 Native language, spoken language, translation and trade
25
This methodology poses a problem for comparisons between different trees: for example, it
assumes that 0.5 means the same in the Indo-European group as in the Altaic, Turkic one. We
held down the number of distinctions within trees to 3 precisely because of uneasiness about
this assumption (Fearon (2003) offers a more sophisticated suggestion). However, we also
knew at a certain point in our study that we would be able to test whether so crude a method
would yield comparable results to those that follow from the more sophisticated measure LP2,
resting on the databank of the ASJP (it did).
As regards LP2, the source is an analysis of lexical similarity between 200 words (sometimes
100) in a list (or two lists) that was (were) first compiled by Swadesh (1952). The members of
the ASJP project have since found that a selection of 40 of these words is fully adequate. (See
the list in Bakker et al. (2009) or Holman et al. (2008)). In order to construct our numbers, we
used the ASJP group’s preferred measure which makes an adjustment for noise (the fact that
words with identical meaning can resemble each other by chance). The adjusted series go
from 0 to 105 rather than 0 to 1. So we multiplied all the data by 100/105 to normalize the
data at 0 to 100. The original series also signify linguistic distance instead of linguistic
proximity, while we prefer the latter, if nothing else because we want all the expected signs of
the linguistic variables in the estimates to be the same. Therefore, we took the reciprocal of
each figure and we multiplied it by the lowest number in the original series (9.92 for Serbo-
Croatian and Croatian, or the 2 closest languages in the series). This then inverted the order of
the numbers without touching the sign while converting the series from 0-100 to 0-1.
Once we had made these adjustments to our two 89 by 88 bilateral matrices for linguistic
proximity by language, we needed to convert the 2 matrices into country by country ones. We
then faced instances of 2 or 4 linguistic proximities for many country pairs, and we needed to
construct an appropriate weighted average, which we based on the products of the population
ratios of the native speakers in both countries.10
10 In some cases 1 or both of the languages in both countries were the same and yet 1 or 2 linguistic proximity or proximities needed to be considered. In those cases we made sure that the population weights of the identical
CEPII, WP No 2012-17 Native language, spoken language, translation and trade
26
After constructing both LP1 and LP2, we normalized both series once more so that their
averages for the positive values of LP2 in our sample estimates would equal exactly 1. This
last normalization makes the estimated values of their coefficients exactly comparable to one
another and exactly comparable to the coefficient of COL. Making the coefficients of LP
comparable to those of COL makes sense since both variables concern translation. The
normalization also means that individual values of LP1 and LP2 now go from 0 to more
than 1.
We provide all of the raw language data in our dataset for values equal or above .04 on a
country basis for all 195 countries in our study in Appendix 1.
(e) The controls
The controls in the gravity equation demand our attention next. Both of our colonial variables
come from Head et al. (2010). For common legal system, we went to the website of
JuriGlobe. Specifically, we assigned 1 to all country pairs that shared Civil law, Common
law, or Muslim law and 0 to all the rest. Thus, we treated all countries with a Mixed legal
system (often including Customary law) as not sharing a legal system with anyone.
With respect to common religion, our starting point was the CIA World Factbook, which
reports population shares for Buddhist, Christian, Hindu, Jewish and Muslim, and a residual
population share of “atheists.” Next, we broke down the Christian and Muslim shares into
finer distinctions. For Christians, we distinguished between Roman Catholic, Catholic
Orthodox, and Protestants, as the CIA Factbook allows except for 15 countries in our sample,
mostly African ones and also China. In these cases, we retrieved the added information either
from the International Religious Freedom Report (2007) or the World Christian Database
(2005). For Muslim, we distinguished between Shia and Sunni. To do so, we used the Pew
languages were taken into account and that the population weights for the linguistic proximity or proximities (between the 1 or 2 different languages) added up to the right fraction of 1. Remember that a LP of 0 between 2 countries can mean either that the 2 countries speak the same language and therefore LP is irrelevant or that their languages are so different that there is no proximity between them.
CEPII, WP No 2012-17 Native language, spoken language, translation and trade
27
Forum (2009) whenever the CIA Factbook did not suffice. In order to construct common
religion in the final step, we went ahead exactly as we had for CNL and summed the products
of population shares with the same religion. Ours is a more detailed measure of common
religion than we have seen elsewhere.11
As regards the years of war since 1823, we relied on the Correlates of War Project (COW,
v4.0), the data for which is available at http://www.correlatesofwar.org/ and goes up to 2003.
This meant identifying former states of Germany with Germany, identifying the Kingdom of
Naples and Sicily with Italy, and substituting Russia for USSR. The series for the number of
years at war goes from 0 to 17.
For the stock of migrants, we utilized the World Bank International Bilateral Migration Stock
database which is available for 226 countries and territories. It is described in detail in
Parsons et al. (2007).
3. THE ECONOMETRIC FORM
We estimate two equation forms: one for the cross-sections in the individual years 1998
through 2007; the other for the panel over the 10-year period. The only difference is that in
the panel form we use country-year fixed effects instead of country fixed effects. After log-
linearizing eq. (1) (following substitution of eq. (2) for tij), the form for the individual-year
cross-sections is:
Log Mij = αo + δc Zc + α1 COLij + α2CSLij + α3 CNLij + α4 LPij +α5 log D + α6 Adjacencyij + α7
Excolij + α8 Comcolij + α9 Comlegij + α10 Comrelij + α11 Histwarsij + εij
αo is a constant that encompasses YW. δc Zc is a set of country fixed effects which will reflect
all country-specific unobserved characteristics in addition to Yi, Yj, Pi and pj. δc represents the
11
There are two recent studies that analyze the effects of adherence to different major world religions (e.g., Muslim) on bilateral trade and that contain some sophisticated measures of common religion as well: Helble (2007) and Lewer and Van den Berg (2007). In both articles, the authors control for common language with a binary variable (based on one of the usual sources, the popular Haveman website in Helble’s case, the CIA Factbook in Lewer and Van den Berg’s).
CEPII, WP No 2012-17 Native language, spoken language, translation and trade
28
effects themselves while Zc is a vector of indicator variables (one per country) where Zc equals
one if c = i or j and is 0 otherwise. The coefficients αi, i=1, …,11, are products of separate
bilateral influences on tij, on the one hand, and 1 β, on the other, where 1 β is the common
negative effect of the elasticity of substitution between goods (since β > 1). The disturbance
term, εij, is assumed to be log-normally distributed.
As a result of the logarithmic specification, we lose all observations of zero bilateral trade.
The principal problem with this elimination of the zeros is a possible selection bias. Imagine
that linguistic factors had no role in explaining the cases of the zeros and operated only in the
instances of positive trade. Then we might find important linguistic influences in our
estimates strictly because of our automatic dropping of the zeros resulting from our choice of
equation form. We focus on this issue in the last appendix.
There are some instances of zero trade in one direction but not the other in our sample. Except
for these cases, we have two separate positive observations for imports by individual country
pair. Therefore we adjust the standard errors upward for clustering by country pairs in the
panel estimates.
4. THE RESULTS FOR TOTAL TRADE
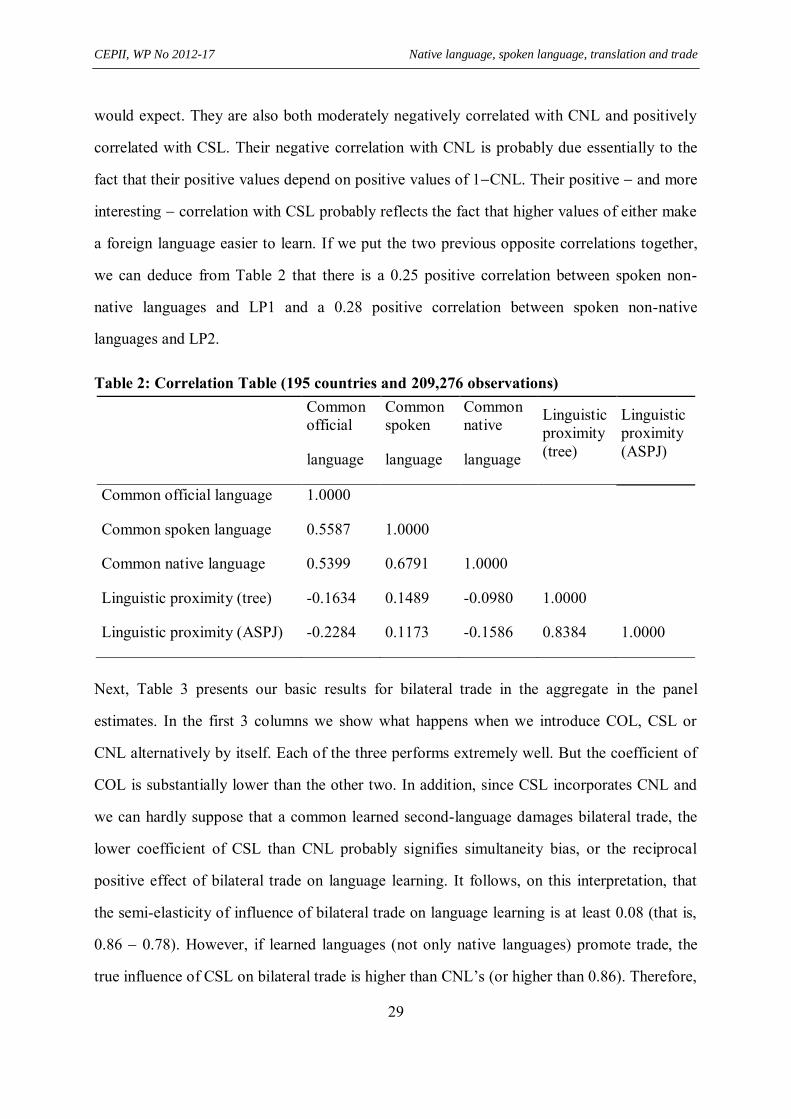
We turn to the results and begin with the correlation matrix for the separate COL, CSL, CNL
and LP series over the 209,276 observations in 1998-2007 in the panel estimates. (The
matrices for the individual years can only differ because of minor sample differences and they
are virtually identical.) As seen from Table 2, the correlation between COL and either CSL or
CNL is well below 1 and only moderately above 0.5. The outstanding reason is that there are
many countries where domestic linguistic diversity is high and the official language (or both
of them if there are 2) is (are) not widely spoken. In addition, the correlation between CSL
and CNL is only 0.68 and significantly below 1. In this case the reason is that European
languages and Arabic are important as second languages in the world, especially English. LP1
(language tree) and LP2 (ASJP) are highly correlated with one another at 0.84, just as we
CEPII, WP No 2012-17 Native language, spoken language, translation and trade
29
would expect. They are also both moderately negatively correlated with CNL and positively
correlated with CSL. Their negative correlation with CNL is probably due essentially to the
fact that their positive values depend on positive values of 1CNL. Their positive and more
interesting correlation with CSL probably reflects the fact that higher values of either make
a foreign language easier to learn. If we put the two previous opposite correlations together,
we can deduce from Table 2 that there is a 0.25 positive correlation between spoken non-
native languages and LP1 and a 0.28 positive correlation between spoken non-native
languages and LP2.
Table 2: Correlation Table (195 countries and 209,276 observations)
Common official
language
Common spoken
language
Common native
language
Linguistic proximity (tree)
Linguistic proximity (ASPJ)
Common official language 1.0000
Common spoken language 0.5587 1.0000
Common native language 0.5399 0.6791 1.0000
Linguistic proximity (tree) -0.1634 0.1489 -0.0980 1.0000
Linguistic proximity (ASPJ) -0.2284 0.1173 -0.1586 0.8384 1.0000
Next, Table 3 presents our basic results for bilateral trade in the aggregate in the panel
estimates. In the first 3 columns we show what happens when we introduce COL, CSL or
CNL alternatively by itself. Each of the three performs extremely well. But the coefficient of
COL is substantially lower than the other two. In addition, since CSL incorporates CNL and
we can hardly suppose that a common learned second-language damages bilateral trade, the
lower coefficient of CSL than CNL probably signifies simultaneity bias, or the reciprocal
positive effect of bilateral trade on language learning. It follows, on this interpretation, that
the semi-elasticity of influence of bilateral trade on language learning is at least 0.08 (that is,
0.86 0.78). However, if learned languages (not only native languages) promote trade, the
true influence of CSL on bilateral trade is higher than CNL’s (or higher than 0.86). Therefore,
CEPII, WP No 2012-17 Native language, spoken language, translation and trade
30
the simultaneity bias is greater than 0.08.
The next estimate, column 4, is basically a dialogue with the literature. The early works
introducing a 0,1 dummy for common languages in gravity models considered the relevant
languages whether English, Spanish, Arabic, etc. self-evident and never explained the
relevant concept or cited sources. See Havrylyshin and Pritchett (1991), Foroutan and
Pritchett (1993), Frankel, Stein and Wei (1993) and Frankel (1997). The practice has never
really disappeared. In their influential discussion of trade costs, Anderson and van Wincoop
(2004) base their estimates of linguistic barriers to trade entirely on two works that follow the
identical practice, namely Eaton and Kortum (2002) and Hummels (2001). One major website
for international trade data, associated with Jon Haveman, continues to provide language data
under the sub-heading “Languages – lists the primary language for 178 countries” (under the
more general heading “useful gravity data”) without explaining the grounds for the choice. In
all of these cases, it would be unfair to assume that the sole criterion is official status. It could
be native language instead or as well. But it must be one or the other or both since the variable
is always supposed to be exogenous. The first explicit reference to official status as the strict
basis for a dummy variable for a CL that we found is Rose (2000). Rose’s initiative took off,
especially since 2004-2005. But there has never been any conscious shift in the conception of
CL. That is the purpose of the 0,1 index of a common language in column 4: to show that a
dummy for CL based on a CNL is quite different than one based on a COL and yields
different results.
Suppose we constructed a dummy for common language based on native language alone, say
on the condition that half or more of the population in both countries possesses the same
native language. In our calculation, this would mean basing the index on a CNL of 0.25 or
more. The estimate in column 4 shows what happens when we assign a value of 1 to CL if
CNL ≥ 0.25. Very significantly, though, this cutoff point is of little importance. We have
experimented with cutoff points of 0.1 to 0.7 and the results barely change. As can be seen
from column 4, the dummy for CL based on native language has a significantly higher
CEPII, WP No 2012-17 Native language, spoken language, translation and trade
31
coefficient than COL’s, which veers toward CNL’s. This veering is even greater in samples
with fewer small languages than ours (as seen in the last appendix).
Column 5 proceeds to include COL, CSL and CNL all at once. The coefficients of the 3
notably drop below their earlier values in columns 1-3, a clear indication that each variable, if
standing alone, partly reflects the other two. However, while COL and CSL remain extremely
important in column 5, CNL becomes totally insignificant. Instead of pausing on this last
result, let us move on to columns 6 and 7 where we introduce LP1 and LP2 as alternatives.
Both indicators of LP have identical coefficients of 0.07/0.08 and both are precisely
estimated, LP1 more so than LP2. However, when either indicator is present, the coefficient
of CNL rises and becomes significant at the 5% confidence level. On this evidence, the
importance of native language only emerges once we recognize gradations in linguistic
proximity between different native languages and we cease to suppose a sharp cleavage
between presence and absence of a CNL. In addition, based on columns 6 and 7, all four
aspects of CL appear as simultaneously important. Furthermore, the importance of spoken
language clearly dominates that of native language.12 Last, official status matters
independently of anything else.
For the remainder of our study, we will stick to LP2 even though the estimate of LP1 is more
precise than LP2 in Table 3. This greater precision is not robust. In earlier experiments with
minor differences in the sample, we found the relative precision of LP1 and LP2 to vary and
to go sometimes in favor of LP2. Fundamentally, LP2 seems to us better founded and a better
basis for reasoning and our later experiments. We shall skip discussion of column 8 until an
appropriate later point.
12
Note that Ku and Zussman’s (2010) evidence basically agrees. These authors simply recognize no other spoken language outside of native languages except English.
CEPII, WP No 2012-17 Native language, spoken language, translation and trade
32
The following table, 4, repeats the cross-sectional estimates of columns 5 and 7 of Table 3 for
the individual years. In this case, we only present estimates for alternative years since that
suffices to give the whole picture. As we can see, the robustness is high. The same pattern of
changes in the coefficients of COL, CSL and CNL that we found in Table 3 emerges once
again. When LP is added, COL and CNL go up, markedly so for CNL, while CSL drops.
However, the performance of CNL is uneven across the individual years. We shall return to
this last point.
Of some interest as well, Common religion, Common legal system and Years at war are all
significant and with the expected signs both in the full sample and in the individual years.
Their coefficients are also fairly stable from year to year. There may be some qualification for
Years at war, but that is all.
5. THE RESULTS FOR THE RAUCH CLASSIFICATION
We shall next try to exploit the Rauch decomposition of bilateral trade between homogeneous
goods, listed goods and differentiated goods in Table 5. Homogeneous goods are quoted on
organized exchanges and consist entirely of primary products like corn, oil, wheat, etc. Listed
goods are not quoted on organized exchanges yet are still standard enough to be bought on the
basis of price lists without knowledge of the particular supplier. Examples are many
standardized sorts or grades of fertilizers, chemicals, and (certain) wired rods or plates of iron
and steel.13 In the case of differentiated goods, the purchaser buys from a specific supplier.
Illustrations are automobiles, consumers’ apparel, toys or cookware. Evidently we expect
linguistic influences to become progressively more important as we go from homogeneous to
listed to differentiated goods since the required information rises in this direction. For the
same reason, we expect ethnic ties and trust to be more important as we move that way. The
results for the three different categories support our hypotheses broadly; but there are some
grey areas that we will not cover up.
13
We use Rauch's conservative definition of the classifications.
CEPII, WP No 2012-17 Native language, spoken language, translation and trade
33
The first column in Table 5 provides the same sort of panel estimates as in Table 3, while the
next 5 columns offer the estimates for the odd years, as in Table 4. To economize on space,
we present the coefficients strictly for the linguistic variables and, because of their related
interest, for Common Religion. (More complete results appear in subsequent tables.) In the
case of homogeneous goods, we omit CNL. If CNL serves as the sole linguistic variable (in
estimates that we do not show), it is insignificant in half the individual years and has a low
coefficient in the panel estimate over the period as a whole. Thus, it seems unimportant.
However, when introduced jointly with CSL, the joint effect of CSL and CNL stays about the
same but the coefficient of CSL rises and that of CNL turns negative in compensation,
sometimes significantly so. It is difficult to make any sense of this last result. Furthermore,
except for the change in the coefficient of CSL, CNL’s absence has no effect on the rest of the
estimate. This explains why we drop CNL. Following, the results suggest not only that
language is strictly important in conveying information but also that the importance of
language does not even require any public support through official status. COL is
insignificant. The insignificance of Common Religion conforms broadly. It accords with the
idea that the role of language owes nothing to personal affinities and trust. The only possible
false note is the significance of LP, which only fits if LP can be properly regarded as
reflecting strictly ease of translation. In that case, everything still hangs together and the
results say that the importance of language for trade in homogeneous goods depends strictly
on direct communication and ease of translation in a decentralized manner and without public
support.
In the case of listed goods, CNL is not significant either but keeping it in the analysis raises
no problem. CSL is not affected either way. COL, LP and common religion, as well as CSL,
also retain the same coefficients regardless. They are all highly significant. The importance of
COL in the presence of CSL and LP means that the support of translation through government
auspices now matters. The relevance of religious ties is the only problematic aspect. If
religious ties matter, why does CNL not matter as well? The importance of religious ties
CEPII, WP No 2012-17 Native language, spoken language, translation and trade
34
might also be regarded as a sign that the significance of LP partly reflects ethnic rapport and
trust rather than strictly ease of communication through translation.
In the case of differentiated goods, the coefficient of COL is both significant and almost as
large as that of CSL. Translation is highly important. For the first time, the significance of
CNL is also difficult to deny even though CNL is not important every single year. However,
we encountered various signs in our work that the significance of CSL and CNL are partly
confused in the Rauch decomposition for differentiated goods, if not the rest. In estimates of
mildly different samples, CNL sometimes appears more significant than in Table 5 in the
panel results (though the significance of the variable is never consistently above conventional
levels in all the years). We accept its significance.
The next Table, 6, tries to dig more deeply into the interpretation of LP in Table 5. Suppose
that LP reflected strictly ethnic ties and trust. Then we would expect the high values of LP to
be fundamental and the low values to make little difference. Our reasoning goes as follows. It
is difficult to pin any ethnic interpretation on differences in LP when languages are distant;
the differences would seem to be almost strictly lexical. By the same token, when it is
question of ease of communication, then we would expect differences in LP to be just as
important at the low as the high end. Take native German as an example. Since German is
close to Dutch, we would expect the closer proximity of German to Dutch than to Italian to
matter and this is so regardless whether LP owes its importance to ethnicity or ease of
communication. However, if ethnic rapport was the only issue, then given the large distance
between German and Hindi, we would not expect the difference between the proximity of
German to Hindi and Japanese to matter even though Hindi is another Indo-European
language and Japanese is not. On the other hand, if the issue is ease of communication, the
greater proximity to Hindi than Japanese should matter just as much as the greater proximity
to Dutch than Italian does.
CEPII, WP No 2012-17 Native language, spoken language, translation and trade
35
Based on this line of reasoning, Table 6 divides LP2 between values greater than the median
and values lower than the median.14 As can be seen, in the case of homogeneous goods, LP is
equally important above and below the median and has about the same coefficient either way.
However, for listed and heterogeneous goods, LP is solely important above the median. Those
results fit nicely with the idea that LP in Table 5 reflects strictly the importance of costs of
communication for homogeneous goods but reflects mostly instead the importance of
ethnicity and trust for heterogeneous goods. However, the results reinforce our previous
discomfort about the total insignificance of CNL for listed goods.
The results for Common legal system and Years at war in Table 6 are also interesting.
Common legal system has a coefficient of 0.49 for homogeneous goods, a much lower
coefficient of 0.22 which is still highly significant for listed goods, and a totally insignificant
coefficient for heterogeneous goods. This would suggest some substitution between reliance
on similar law and investment in information. Specifically, when little information is
required, as for homogeneous goods, there is heavy reliance on similar law and when lots of
information is required, there is enough investment in information to make similar law
irrelevant. Note, finally, that the history of wars ceases to be uniformly significant and always
bears the wrong sign when bilateral trade is divided by Rauch classification.
In closing this section, we may return to some fundamental conceptual issues. Based on the
previous results as a whole, there is now strong reason to doubt the view that a COL implies
that everyone receives messages in an official language for free (as in Melitz (2008)). Far
more significantly, there is also reason to think that CSL reflects translation as well as direct
communication. LP is the clue in both cases. On the first point, regarding COL, the results for
homogeneous goods are central. LP matters for communicative ability whereas COL does not.
This clearly does not agree with the idea that an official language means that all messages in
the official language are available for free in one’s own tongue (unless we also suppose that
LP matters for all languages except official ones, which makes little sense). Consequently,
14
Notice that in this exercise LP2 is markedly more fitting than LP1.
CEPII, WP No 2012-17 Native language, spoken language, translation and trade
36
even though we continue to consider the 0,1 character of COL to imply there are no variable
costs of receiving messages from an official language, we now recognize some private fixed
cost of receiving the messages or getting “hooked up” in this (or these two) language(s).
Next, and more importantly, Tables 3 and 4, especially 4, clearly show that the introduction of
LP reduces the coefficient of CSL. It does so not only for total trade but for all three Rauch
categories separately (not shown).15 This would strongly suggest that CSL partly reflects
bilingualism and translation and not only direct communication. The role of COL may be
confined to translation, but CSL serves this role partly as well.
6. A PROPOSED AGGREGATE INDEX OF A COMMON LANGUAGE
Is it possible to summarize the evidence about the linguistic influences in an index resting
strictly on exogenous linguistic factors? That would be highly useful since we have many
occasions to wish to control for such factors when our interest lies elsewhere. Moreover, on
these occasions we sometimes work with small country samples when separate identification
of several linguistic series may be extremely difficult. The answer to the question is yes. In
other words, if we merely want to control for language in studying something else, a summary
index of CL can rest on COL, CNL and LP alone. Let us first go back to the last column of
Table 3 where we drop CSL. As seen, the sum of the influences of COL, CNL and LP in this
column stays about the same as the sum of those of COL, CNL, LP plus CSL in the previous
column. (It rises moderately.) Thus, whatever contribution spoken language makes to the
explanation of bilateral trade in column 7 of Table 3 (an underestimate, in our view, because
of simultaneity bias) is still present in column 8.16 Of course, it also follows that the
coefficient of CNL in column 8 represents mostly the role of spoken rather than native
language. We can perhaps attribute around 284/639 of the coefficient of CNL to native
15
The negative impact of LP on the coefficient of CSL for listed and differentiated goods has separate interest in implying that LP refers partly to ease of communication rather than strictly ethnicity and trust for these goods. 16
In principle, this is the outcome of two opposing forces. On the one hand, the elimination of the simultaneity bias increases the sum of the coefficients of the linguistic influences in column 8 relative to column 7. On the other hand, the poorer reflection of linguistic influences in column 8 than column 7 produces an attenuation bias (a case of “errors in variables”) and works the other way. Evidently the two effects approximately cancel out.
CEPII, WP No 2012-17 Native language, spoken language, translation and trade
37
language as such.
Next, let us construct a 0-1 index of CL based on COL, CNL and LP. To do so, we decided to
privilege CNL and strictly normalize COL+LP2, which we did by dividing the series by its
highest value and next multiplying it by 1CNL. (Remember that LP2 had already been
normalized to equal 1, like COL, at the sample mean of its positive values.) Then we equated
CL with the sum of CNL and this normalized sum of COL+LP2, equal to 1CNL at most.17
Table 7 provides the resulting panel estimates for the same gravity equation as before for total
bilateral trade and for the three separate Rauch classifications. Based on column 1, the
coefficient of this CL index is only slightly higher than the sum of the coefficients of COL,
CNL and LP in column 7 of Table 3. It is about 1.15 and very precisely estimated. The
separate coefficients of CL for homogeneous, listed and differentiated goods show up in the
next three successive columns. They go from 0.68 to 1.05 to 1.24. All three are also precisely
estimated, the coefficient for homogeneous goods less so than the other two. The rest of the
equation is not affected by our aggregation of the linguistic influences in a single index. In
particular, the earlier pattern of estimates of Common religion, Common legal system and
Years at war occurs for the three Rauch classifications. Specifically, common religion is not
significant for homogeneous goods but highly so for the other two classifications. Common
legal system is highly significant for homogeneous goods, less so yet still highly significant
for listed goods and no longer significant at all for heterogeneous goods. The coefficient of
Years at wars is small, significant and with the right sign for the aggregate, but partly
insignificant and always with the wrong sign for the Rauch decomposition.
In Appendix 2, Tables A2a-A2d, we offer the complete year by year estimates of the 4 panel
estimates in Table 7. The annual estimates of the coefficients of CL are quite stable, as are the
corresponding sums of the estimates of COL, CSL, CNL and LP2 in Table 4. It would seem
17
This is not the only way to proceed but it is a simple one. A more sophisticated way would be to take into account the differences in the accuracy of the estimates of COL, CNL and LP. Yet the simplicity of our method is a recommendation (as otherwise the aggregate becomes a function of the estimates). It is especially so since the accuracies of the separate estimates of COL, CNL and LP are broadly comparable.
CEPII, WP No 2012-17 Native language, spoken language, translation and trade
38
then that abandoning CSL and reflecting it in the other three linguistic indices is acceptable as
a means of controlling for exogenous linguistic factors. The annual values of CL move only
from 1.04 to 1.23 for aggregate trade (Table A2a), from 0.95 to 1.13 for listed goods (A2c)
and from 1.11 to 1.27 for differentiated goods (A2d). Only for homogeneous goods (A2b) is
there a large movement, going from 0.51 to 0.89. But a similar instability holds for these
goods in the earlier decomposition of the 4 linguistic influences. Note also, as regards
homogeneous goods, that though COL is insignificant in the corresponding earlier estimate
including CSL (Table 5), we cannot really drop COL from the CL index, for doing so worsens
the performance of the index in Table A2b considerably (as we discovered). This clearly
reflects the fact that in CSL’s absence, COL captures a good deal of its influence (even if both
CNL and LP are present).18
7. THE ROLE OF CROSS-MIGRANTS
Thus far we have included no endogenous influences but CSL in the gravity equation. As
mentioned earlier, however, one of the excluded influences notably alters the linguistic
effects: namely, the stock of cross-migrants. Suppose we now add this variable. The particular
measure of migration that we use, in conformity with our focus on aggregate demand
behavior and imports is the (log of) the stock of emigrants in the importing country from the
exporting one. Thus, for French imports from Germany, for example, this stock is the stock
of German emigrants in France. Note also that our measure reflects the stock of emigrants in
the year 2000. Further, by using it we lose about 10% of the observations.
In line with much earlier work on the subject of the role of emigrants in trade between host
18
Santos Silva and Tenreyro (2006) recommend the use of Poisson pseudo-maximum-likelihood (PPML) in order to avoid the problems resulting if the residuals happen to be linear. In light of the influence of their work, we have experimented with PPML even though we assume log-linear residuals in line with our general log-linear specification of the gravity model. Our results do not agree with theirs. Whereas they obtain sensible results with PPML, our own reinforce our choice of sticking to the assumption of log-linear residuals in accordance with the rest of our specification. In our PPML experiments, the influence of distance survives and swallows up the importance of most of the rest of the gravity variables, including not only language, but the colonial controls and common religion. There are good reasons for this, since bilateral trade and distance are the only two variables in our specification that vary widely in levels. The rest of our variables remain unchanged.
CEPII, WP No 2012-17 Native language, spoken language, translation and trade
39
and home country, this stock of emigrants proves extremely important (Gould (1994), Head
and Ries (1998), Dunlevy and Hutchinson (1999), Wagner et al. (2002), and Rauch and
Trindade (2002)).19 As we see from Table 8a, once we introduce Migration (log) in our
aggregate trade equation its coefficient enters with a very precisely estimated coefficient of
0.18 and the coefficients of COL, CSL and LP drop while that of CNL becomes uniformly
insignificant. Those changes from the earlier estimates in Table 4 are also very stable year by
year. In addition, corresponding changes take place in the three Rauch classifications
following the decomposition (compare Table 8b with the earlier estimates in Table 5). Note in
particular the pretty clear lack of significance of CNL for differentiated goods.
According to Table 8a, there are three separate significant linguistic influences on bilateral
trade, COL, CSL and LP. If we add up the coefficients of the three we obtain 0.69. However,
the coefficient of CSL in this total is an underestimate. If we try to correct for this flaw by
using our proposed aggregate index of linguistic influences (which then removes the
endogenous response of CSL though at the cost of a poorer reflection of CSL), we get a
coefficient of 0.87 (not shown). One might then argue that the right estimate of the impact of
linguistic factors on trade is around 0.69-0.87. But we would question this interpretation. In
the first place, the stock of emigrants from any country in any other clearly depends partly on
language, both directly because of a tendency to emigrate where the language is the same20
and, indirectly, via the impact of bilateral trade on bilateral migration. Even independently,
the stock of emigrants from the home country can itself be seen partly as a linguistic variable
or a linguistic influence on imports. It has been treated as such in the past, if only implicitly,
since the variable has never appeared in gravity equations side by side with an index of a
common language except when the stock of emigrants itself was a center of interest. Only
detailed study will tell us in the future what part of the changes in the estimates in Tables 8a 19
Of some note as well, the most recent literature on the relation between language and migration includes some attempts to use several measures of linguistic influence at once. See Belot and Eberveen (2010) and Adsera and Pytlikova (2011). 20
One particularly arresting study is Falk et al. (2010), which provides evidence of the impact of different regional German dialects on regional migration within Germany based on a singular late-nineteenth-century dataset. See also both references in the preceding note.
CEPII, WP No 2012-17 Native language, spoken language, translation and trade
40
and 8b associated with emigrants can be considered as totally independent of language. For
the time, we consider that around 25 to 38% of our estimate of 1.15 of the impact of CL in
Table 7 has some linguistic association with emigrants. We also consider that this part of the
estimate embraces most everything in the impact of common language on bilateral trade that
has to do with ethnicity and trust.
8. ENGLISH AS A SEPARATE LANGUAGE
The analysis thus far supposes that the particular language makes no difference. Many would
question this assumption, for English in particular. We therefore tested the separate
importance of English, and the other major world languages too, and we summarize the
results in Table 9, where we concentrate on English. The first test, column 1, is purely
expository. It treats English as the only common language. Suppose that all of our results
depended on English alone (a view that we encountered). Then the measures of COL, CSL,
CNL and LP2 in this first column would remove errors of measurement and yield higher and
better estimated coefficients. Suppose instead that our measures of CL are the correct ones.
Then the measures of CL in this column would be noisy and yield lower and less well
estimated coefficients than the previous ones. But in this last case that is, if our measures of
CL are the appropriate ones it is important to observe that there are two reasons why the
English-based measures of CL might perform particularly badly.
In the first place, an English-speaking country has a great many solutions for skirting the
language barrier altogether. There are lots of other English-speaking countries with which it
could trade. Therefore, common English can be expected to be an especially weak spur to
trade with any single common-language partner. Alternatively, a country speaking
Portuguese, for example, would have far fewer alternative partners with which to trade in
order to avoid the language barrier and therefore might exploit those opportunities more
intensely.21 This is the identical point that Anderson and van Wincoop (2003) made in
21
Of course, for that very reason, people in the Portuguese-speaking country would have stronger incentives to become multilingual. But while this diminishes the weight of the point, it does not deny it altogether. Note also that
CEPII, WP No 2012-17 Native language, spoken language, translation and trade
41
explaining why national trade barriers formed a far more powerful incentive for bilateral trade
between two Canadian provinces than between two US states. On this ground, the coefficients
of the CL variables based on English alone might be exceptionally low apart from
measurement error. The second point could be even more serious. Relying on English alone
means drawing numerous distinctions between country pairs who share a different common
language than English based upon their English, and proposing a quantitative ordering of
linguistic ties between these non-English pairs based on their common English alone.
Especially large distortions might arise.
The results in column 1 basically confirm our broad suspicion that a measure of CL resting on
English alone would perform badly. COL, CSL and CNL for English are insignificant. The
same tests for the 3 next largest languages in our database French, Spanish and Arabic
are no worse, though not particularly better. It is true, however, that LP2 matters for English,
a point to which we will return.
Column 2 is the genuine test. It examines whether adding separate measures of CL for
English to the earlier measures in the tests supports a separate consideration of English. In this
case, the results are entirely negative for COL, CSL and CNL. For all three measures, the sign
of CL without any separate notice of English and the one based on English alone go in
opposite directions (the signs of COL and CSL becoming significantly negative for English).
There is no sense in this. Given the high quality of the results for CL in the absence of special
attention to English, the only inference is that the separate consideration of the language is
unfounded. These last results are reminiscent of those we obtained when we introduced CNL
together with CSL for homogeneous goods. In this case too the signs of CNL and CSL went
in opposite directions (the sign of CNL becoming significantly negative) and we drew the
same (or the corresponding) inference that CNL should not be introduced jointly with CSL.
However, as regards LP2, English is still separately significant in column 2.
the higher multilateral trade barrier facing the Portuguese-speaking country because of language is independently captured by our country fixed effects.
CEPII, WP No 2012-17 Native language, spoken language, translation and trade
42
The similar tests for French, Spanish and Arabic yield similar results. In order to provide
some summary indication, column 3 presents the results of the test for a combined measure of
CL lumping together the major European world languages besides English French, Spanish,
German and Portuguese. Quite specifically, the measures of CL for these 4 languages in
column 3 follow from our method of construction after setting all the values for languages in
our database except these 4 equal to zero. As can be seen, broadly speaking, this alternative
set of languages as a group yields no better results than English does (though in the case of
COL the combined measure does do better than English, as is true for French and Spanish
separately). We also find, rather uncomfortably, that linguistic proximity harms bilateral trade
for this combination of languages, which is possibly simply a reflection of the earlier result
that native English helps exceptionally since English figures prominently in the other measure
of LP2 in column 3 (whose effect is now correspondingly higher). In other separate estimates
for individual languages, we also find that LP2 helps to interpret foreign languages for
Spanish and is harmful for French and Arabic. All these results about the significance of
separate native languages in interpreting foreign languages based on linguistic proximity
remain a mystery to us.
With this last caveat, we conclude that the distinction of English, or any other major language
for that matter, is not warranted. Once we control for distance, contiguity, ex-colonialism,
law, religion, the history of wars, and country/year fixed effects or “multilateral trade
resistance” in Anderson and Van Wincoop’s (2003) terms, all that really matters is common
language, whatever the language may be.
9. DISCUSSION AND CONCLUSION
It is common practice in the trade literature to use a binary 0,1 variable to control for a CL.
We have shown that this practice takes us way off the mark in estimating the impact of
linguistic factors on bilateral trade. Probably the most clear-cut basis for answering yes or no
to the presence of a CL is a COL. Country samples of any size where, even as a rough
approximation, every individual in all pairs has the same native language or else no one in all
CEPII, WP No 2012-17 Native language, spoken language, translation and trade
43
pairs shares a native language with anyone in the opposite country are either imaginary or
highly unlikely. Yet it is precisely when official status serves as the basis for a dummy
variable for a CL that the underestimate of CL is greatest, in the order of one-half.
In sum, there is no way to embrace the influence of language on bilateral trade by using a
measure of CL along any single dimension. Only a measure embracing a broad range of the
linguistic influences on bilateral trade will do. One source of linguistic influence that
sometimes gets primary attention is ethnic ties. This is particularly true in studies that center
on emigrants (e.g., Rauch and Trindade (2002)). Admittedly, the linguistic influences on trade
stemming from immigrants probably owe much to ethnicity and trust. However, ease of
communication is far and away more important as a general factor. According to our results,
the role of ease of communication in trade also hinges largely on translation and interpreters.
Translation and interpreters enter partly via official status and partly through bilingualism in
general together with linguistic proximity. Since few people possess more than two or three
languages, yet there are nearly 400 languages spoken by over a million people (Ethnologue)
in a world consisting of 200-some countries, it makes sense that translation and interpreters
would matter in easing communication in trade.22
It might seem curious at first that ease of communication would have as large an effect as we
find in the case of homogeneous goods, since all the required information for bilateral trade
seems minimal. In our estimate, an additional percentage point of CL increases bilateral trade
in these goods by 0.68 of a percentage point or quite a lot. Upon reflection, however, we can
see the possible reason. The ability to communicate in depth is never irrelevant in trade since
things can go wrong. Goods may arrive late or damaged; contracts may not be honored; there
may need to be recourse to the small print. Perhaps it is relevant too in this connection that a
common legal system matters as well for homogeneous goods. It enters with a semi-elasticity
22
Of considerable note, though, interpreters and translation are probably far less effective in production within a firm than in trade. Labor studies show a substantial positive return to the command of the principal home language on the wages of immigrants. See McManus, Gould and Welch (1983), Chiswick and Miller (1995, 2002, 2007), Dustmann and van Soest (2002), and Dustmann and Fabbri (2003). We would conjecture that the wage return would be lower if translation and interpreters were as effective in production as they are in trade.
CEPII, WP No 2012-17 Native language, spoken language, translation and trade
44
of 0.44, not that far below 0.68, though ethnicity and common religion are both irrelevant.
Once detailed information becomes pertinent in trade, as it is for differentiated goods, we may
expect the impact of language to go up. Based on our summary index of CL, the semi-
elasticity of influence of a CL indeed rises from 0.68 for homogeneous goods to 1.24 for
differentiated goods. In addition, the heightened effect of language in the case of
differentiated goods might be expected to act as a special spur to language learning. This too
appears confirmed in our results. There is clear evidence of simultaneity bias in Table 3 for
goods in general. When CSL and CNL enter together, CSL strongly dominates CNL, but
when either of them stands alone for all linguistic factors CSL (which trade can affect even
within a year) has a lower coefficient than CNL (which trade can only affect over generations
via demography). This would indicate a positive reciprocal effect of trade on language which,
though of the same sign as the one of language on trade, is weaker and therefore dilutes the
latter. However, if we repeat this test by separate Rauch category (not shown), we find that
the result hinges basically on differentiated goods. There is no similar sign of a reciprocal
effect of trade on language for homogenous and listed goods viewed either separately or
together.
It is also interesting to relate our results to the burgeoning empirical evidence about individual
firm activity in foreign trade. We know that there is a high incidence of exporting firms that
limit their foreign activity to a few countries. We also know that the percentage of firms that
export to as many as 5 foreign destinations is rather small and that these firms are unusually
big and efficient (see Bernard et al. (2008), Eaton et al. (2011), and Mayer and Ottaviano
(2007)). Evidently, if the large impact of language on trade in our results stems notably from a
fixed cost of crossing a language barrier at the level of the individual firm, our results would
contribute to understanding these facts. Indeed, Mayer and Ottaviano (2007) already suggest
that this may be true. They show, for France, not only that the percentage of individual firms
who export to other French-speaking destinations is unusually large but also that the firms
who exploit this linguistic advantage have lower average productivity than the rest of French
CEPII, WP No 2012-17 Native language, spoken language, translation and trade
45
exporting firms. This fits nicely, since the lower fixed costs of these firms than the rest would
mean that they require lower efficiency than the others in order to export profitably. If we
follow this line of reasoning, there is a new extensive margin to consider at the level of the
firm: the number of language destinations. One prediction, for example, would be that among
firms who export to 10 destinations, those who do so to countries who all practice the same
language would be less efficient than the rest (they have lower fixed costs to overcome). At
the other end of the spectrum, in the Eaton et al. (2011) dataset for France, the firms who
export to 75 or more destinations (who numbered only 244 in 2004) constitute a tiny fraction
of 1 percent of French exporters and, on a rough estimate, cross 31 language frontiers on
average (around 7 for languages that are not common ones in our study).23 Based on our
previous conjecture, the significance of translation and interpreters would help understand
these firms’ ability to traverse so many linguistic frontiers. The fixed cost of the language
frontier that these firms encounter probably has little tendency to decline on the extensive
margin. Therefore, if those fixed costs depended on direct communication, it is a reasonable
guess that the firms would export to fewer foreign language destinations despite their
exceptional productivity. These are all subjects for further investigation.
Another extension of this study that might be especially worthwhile would be to examine the
benefits of promoting language-learning through public policy, English in particular. Some
warning signs should be posted in this regard. We found no special significance of English in
explaining bilateral trade. Nonetheless, from a world perspective, it is pretty clear that
English-learning will do the world more good than learning any other language. That is, once
we sum up over all countries, if we can abstract from differences in the costs of learning
different languages, any amount of resources devoted to learning English will reduce the
Dixit-Stiglitz utility-based price level or Pi in eq. (1) more than learning any other language
and thereby will boost world consumption more. Yet even as concerns Pi, matters will vary by
country. For example, in Kazakhstan or Kyrgyzstan, good Russian probably remains more
23
We had access to the same database as these authors for more recent years and made the estimate ourselves.
CEPII, WP No 2012-17 Native language, spoken language, translation and trade
46
important than good English. Over and above, the importance of English in trade may be
widely reflected in existing public policies to teach English and private incentives to learn the
language. Do public policies to teach English in school curriculums and private incentives to
learn it fall short from a social perspective? The answer is not obvious, partly because of the
role of translation, but also because of the possibility of greater social neglect of returns from
learning other languages, which are also in demand but scarcer on the market24 and which may
be greater sources of utility in particular regional or national environments. The underlying
problem is that language learning has major external effects that individuals neglect in their
learning decisions (see, for example, Church and King (1993)). In addition, public choices
about schooling may not properly repair the resulting shortfalls in social utility. There is also
the larger question of the optimum number of languages in the world, which we are prone to
regard as requiring a broader framework where separate languages do not appear strictly as
impediments to trade. The right framework, we think, would recognize people’s attachment
to their maternal language and the benefits of linguistic diversity as a source of pleasure and
variety in consumption.
24
See, in particular, Ginsburg and Prieto (2010) who show that some languages other than English yield higher personal returns than English as second languages in various member countries of the EU outside of Ireland and the UK.
CEPII, WP No 2012-17 Native language, spoken language, translation and trade
47
REFERENCES
Adsera, Alicia and Mariola Pytlikova, 2011. The role of language in shaping international migration: Evidence from OECD countries 1985-2006. Mimeo.
Alesina, Alberto, Arnaud Devleeschauwer, William Easterly, Sergio Kurlat and Romain Wacziarg, 2003. Fractionalization. Journal of Economic Growth 8, 155-194.
Anderson, John and Erich van Wincoop, 2003. Gravity with gravitas: A solution to the border problem. American Economic Review 93, 170–192.
Anderson, John and Erich van Wincoop, 2004. Trade costs. Journal of Economic Literature 42, 691–751.
Armington, Paul, 1969. A Theory of Demand for Products Distinguished by Place of Production. International Monetary Fund Staff Papers 16, 159-176.
Baier, Scott and Bergstrand, Jeffrey, 2007. Do free trade agreements actually increase members’ international trade? Journal of International Economics 71, 72-95.
Bakker, Dik, André Müller, Viveka Velupillai, Søren Wichmann, Cecil Brown, Pamela Brown, Dimitry Egorov, Robert Mailhammer, Anthony Grant and Eric Hollman, 2009. Linguistic Typology 13, 167-179.
Belot, Michele and Sjef Ederveen (2010). Cultural and institutional barriers in migration between OECD countries. Forthcoming in Journal of Population Economics.
Bernard, Andrew, J. Bradford Jensen, Stephen Redding and Peter Schott 2007. Firms in international trade. Journal of Economic Perspectives 21, 105-130.
Boisso, Dale and Michael Ferrantino, 1997. Economic distance, cultural distance, and openness in international trade: Empirical puzzles. Journal of Economic Integration 12, 456–484.
Brown, Cecil, Eric Holman, Søren Wichmann and Viveka Velupillai, 2008. Automatic classification of the world’s languages: A description of the method and preliminary results. Language Typology and Universals 61(4), 285-308.
Central Intelligence Agency, World Factbook, US Government Printing Office, available online.
Chiswick, Barry and Paul Miller, 1995. The endogeneity between language and earnings: International analyses. Journal of Labor Economics 13, 246–248.
Chiswick, Barry and Paul Miller, 1998. English language fluency among immigrants in the United States. Research in Labor Economics 17, 151-200.
Chiswick, Barry and Paul Miller, 2002. Immigrant earnings: Language skills, linguistic concentration and the business cycle. Journal of Population Economics 15 (1), 312-57.
CEPII, WP No 2012-17 Native language, spoken language, translation and trade
48
Chiswick, Barry and Paul Miller, 2004. Linguistic distance: A quantitative measure of the distance between English and other languages. IZA Discussion Paper 1246, August.
Chiswick, Barry and Paul Miller, 2007. Computer usage, destination language proficiency and the earnings of natives and immigrants. Review of the Economics of the Household
5 (2), 129-157.
Church, Jeffrey and Ian King, 1993. Bilingualism and network externalities. Canadian
Journal of Economics, 337-345.
Crystal, David, 1997. English as a Global Language. Cambridge University Press, Cambridge.
Crystal, David, 2003. The Cambridge History of the English Language. Cambridge University Press, Cambridge, 2d edition.
Desmet, Klaus, Ignacio Ortuño-Ortin and Shlomo Weber, 2009 (a). Linguistic diversity and redistribution. Journal of the European Economic Association 7 (6), 1291-1318.
Desmet, Klaus, Ignacio Ortuño-Ortin and Romain Wacziarg, 2009 (b). The political economy of ethnolinguistic cleavages. CEPR Discussion Paper no. 7478.
Dunlevy, James and William Hutchinson, 1999. The impact of immigration on American import trade in the late nineteenth and early twentieth centuries. Journal of Economic
History 59, 1043–1062.
Dustmann, Christian and Francesca Fabbri, 2003. Language proficiency and labour market performance of immigrants in the UK. Economic Journal, 113(489), 695-717
Dustmann, Christian and Arthur van Soest, 2002. Language and the earnings of immigrants. Industrial and Labor Relations Review 55 (3), 473-492.
Dyen, Isidore, Joseph Kruskal and Paul Black, 1992. An Indo-European classification: An Indo-European classification: A lexicostatistical experiment. Transactions of the
American Philosophical Society 82 (5).
Eaton, Jonathan and Samuel Kortum, 2002. Technology, geography and trade. Econometrica 70, 1741–1779.
Eaton, Jonathan, Samuel Kortum and Francis Kramarz, 2011. An anatomy of international trade: evidence from French firms. Econometrica 79, 1453-1498.
Egger, Peter, Mario Larch, Kevin Staub and Rainer Winkelmann, 2011. The trade effects of endogenous preferential trade agreements. American Journal of Economic Policy 3, 113-143.
Egger, Peter and Andrea Lassmann, 2011. “The language effect in international trade: A meta-analysis,” CESifo Working Paper no. 3682 (December).
Ethnologue: Languages of the World, 2009. 16th ed. Summer Institute of Linguistics, International Academic Bookstore, Dallas, TX, available online.
CEPII, WP No 2012-17 Native language, spoken language, translation and trade
49
Falck, Oliver, Stefan Heblich, Alfred Lameti and Jens Südekum, 2010. Dialects, cultural identity, and economic exchange. IZA Discussion Paper No. 4743, February.
Fearon, James (2003). Ethnic and cultural diversty by country. Journal of Economic Growth 8, 195-222.
Felbermayr, Gabriel and Farid Toubal, 2010. Cultural proximity and trade. European
Economic Review 54, 279-293.
Foroutan, Faezeh and Lant Pritchett, 1993. Intra-Sub-Saharan African trade: Is it too little? Journal of African Economics 2, 74-105.
Frankel, Jeffrey, 1997. Regional trading blocs in the world trading system. Institute for International Economics.
Frankel, Jeffrey and Andrew Rose, 2002. An estimate of the effect of common currencies on trade and income. Quarterly Journal of Economics 117, 437–466.
Frankel, Jeffrey, Ernesto Stein and Shang-Jin Wei, 1998. Continental trading blocs: Are they natural or supernatural? In: Frankel, Jeffrey (Ed.), The Regionalization of the World
Economy. The University of Chicago Press, pp. 91–113.
Gaulier, Guillaume and Soledad Zignago, 2010. BACI: International trade database at the product-level: The 1994-2007 version. CEPII Working Paper, 2010-23.
Ginsburgh, Victor and Shlomo Weber, 2011. How many languages do we need? The
economics of linguistic diversity. Princeton University Press.
Ginsburgh, Victor and Juan Prieto-Rodriguez, 2007. Returns to foreign languages of native workers in the EU. Industrial & Labor Relations Review 64, 599-618.
Giuliano, Paola, Antonio Spilimbergo and Giovanni Tonon, 2006. Genetic, cultural and geographical distances. CEPR discussion paper 5807.
Gould, David, 1994. Immigrant links to the home country: Empirical implications for US bilateral trade flows. Review of Economics and Statistics 69, 301–316.
Guiso, Luigi, Paola Sapienza and Luigi Zingales, 2009. Cultural biases in economic exchange, Quarterly Journal of Economics 124, 1095-1131.
Havrylyshyn, Oleh and Lant Pritchett, 1991. European trade patterns after the transition. Policy, Research, and External Affairs Working Paper, World Bank.
Head, Keith and John Ries,1998. Immigration and trade creation: Econometric evidence from Canada. Canadian Journal of Economics 31, 46–62.
Head, Keith, Thierry Mayer and John Ries, 2010. The erosion of colonial trade linkages after independence. Journal of International Economics 81(1), 1-14.
Helble, Matthias (2007). Is God good for trade. Kyklos 60(3), 385-413.
CEPII, WP No 2012-17 Native language, spoken language, translation and trade
50
Helpman, Elhanan, Marc Melitz and Yona Rubinstein, 2008. Estimating trade flows: Trading partners and trading volumes. Quarterly Journal of Economics 123, 441-488.
Holman, Eric, Christian Schultze, Dietrich Stauffer and Søren Wichmann, 2007. On the relation between structural diversity and geographical distance among languages: Observations and computer simulations. Linguistic Typology 11(2), 393-422.
Hummels, David, 2001. Towards a geography of trade costs. Working Paper, Purdue University.
Hutchinson, William, 2005. ‘Linguistic distance’ as a determinant of bilateral trade. Southern
Economic Journal 72(1), 1-15.
International Religious Freedom, 2007. http://www.state.gov/g/drl/rls/irf/2007/index.htm
Ku, Hyejin and Asaf Zussman, 2010. Lingua franca: The role of English in international trade. Journal of Economic Behavior & Organization 75, 250-260.
Laitin, David, 2000. What is a language community? American Journal of Political Science 44, 142-155.
Lewer, Joshua and Hendrik van den Berg 2007. Estimating the institutional and network effects of religious cultures on bilateral trade. Kyklos 60 (2), 255-277.
Martin, Philippe, Thierry Mayer and Mathias Thoenig, 2008. Make Trade not War? Review of
Economic Studies 75(3), 865-900.
Mayer, Thierry and Gianmarco Ottaviano, 2007. The Happy Few: The Internationalisation of
European Firms: New Facts Based on Firm-level Evidence. Bruegel Blueprint Series vol. III.
McManus, Walter, William Gould and Finis Welch, 1983. Earnings of Hispanic men: The role of English language proficiency. Journal of Labor Economics 1, 101–130.
Melitz, Jacques, 2008. Language and foreign trade. European Economic Review 52, 667-699.
Parsons, Christopher, Ronald Skeldon, Terrie Walmsley and Alan Winters 2007. Quantifying International Migration : A Database of Bilateral Migrant Stocks. World Bank Policy
Research Working Paper No. 4165.
Persson, Torsten, 2001. Currency Union and Trade: How Large is the Treatment Effect? Economic Policy 33, 433-448.
Pew Research Center’s Forum on Religion & Public Life, 2009. Mapping the Global Muslim
Population: A Report on the Size and Distribution of the World's Muslim Population. October, 2009, The Pew Research Center.
Rauch, James, 1999. Networks versus markets in international trade. Journal of International
Economics 48, 7–35.
Rauch, James and Vitor Trindade, 2002. Ethnic Chinese networks in international trade.
CEPII, WP No 2012-17 Native language, spoken language, translation and trade
51
Review of Economics and Statistics 84, 116–130.
Rose, Andrew, 2000. One money, one market: the effect of common currencies on trade. Economic Policy 30, 7-45.
Rose, Andrew, 2001. Currency unions and trade: the effect is large, Economic Policy 33, 449-461.
Santos Silva, J. M. C. and Silvana Tenreyro, 2006. The log of gravity. The Review of
Economics and Statistics 88 (4), 641-658.
Sarkees, Meredith Reid and Frank Wayman, 2010. Resort to War: 1816 - 2007. CQ Press.
Selmier, Travis and Chang Hoon Oh, 2012. The power of major trade languages in trade and foreign direct investment. Review of International Political Economy 1, 1-29.
Special Eurobarometer 243, 2006. Europeans and their languages. The European Commission.
Swadesh, Morris, 1952. Lexico-statistic dating of prehistoric ethnic contacts. Proceedings of
the American Philosophical Society 96, 121-137.
Wagner, Don, Keith Head and John Ries, 2002. Immigration and the trade of provinces. Scottish Journal of Political Economy. 49, 507-525.
World Christian Database, 2005. www.worldchristiandatabase.org.
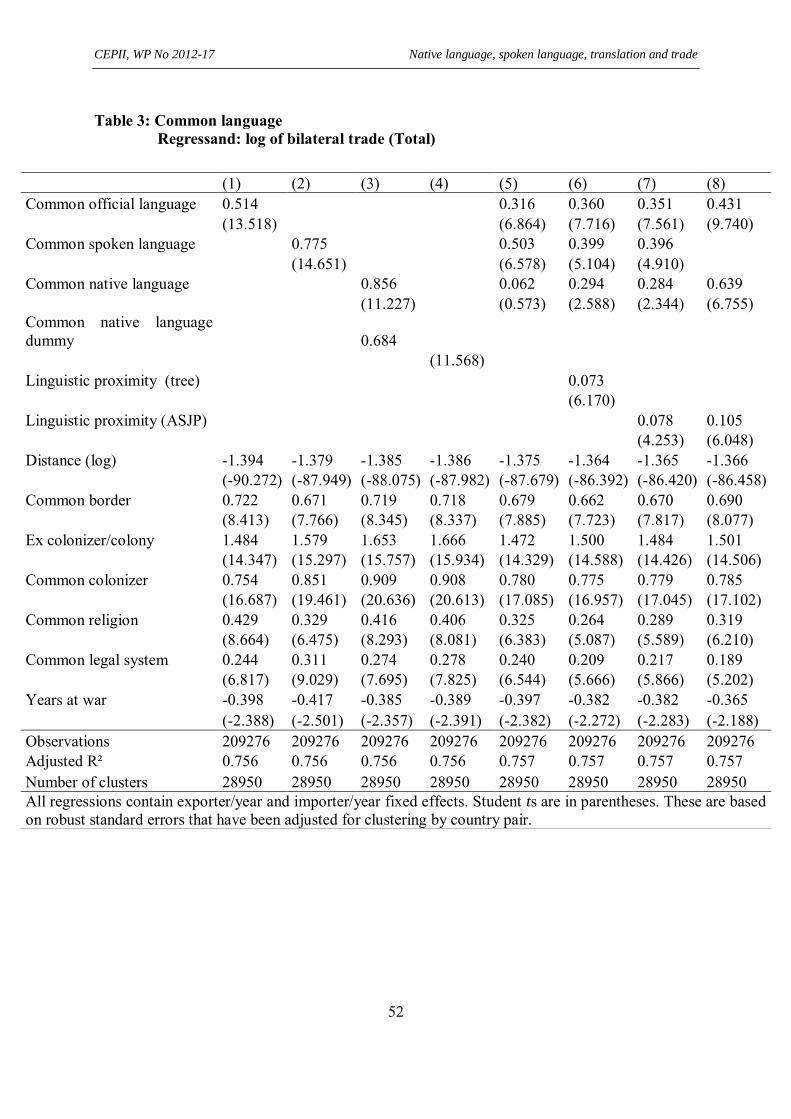
CEPII, WP No 2012-17 Native language, spoken language, translation and trade
52
Table 3: Common language Regressand: log of bilateral trade (Total)
(1) (2) (3) (4) (5) (6) (7) (8) Common official language 0.514 0.316 0.360 0.351 0.431 (13.518) (6.864) (7.716) (7.561) (9.740) Common spoken language 0.775 0.503 0.399 0.396 (14.651) (6.578) (5.104) (4.910) Common native language 0.856 0.062 0.294 0.284 0.639 (11.227) (0.573) (2.588) (2.344) (6.755) Common native language dummy 0.684 (11.568) Linguistic proximity (tree) 0.073 (6.170) Linguistic proximity (ASJP) 0.078 0.105 (4.253) (6.048) Distance (log) -1.394 -1.379 -1.385 -1.386 -1.375 -1.364 -1.365 -1.366 (-90.272) (-87.949) (-88.075) (-87.982) (-87.679) (-86.392) (-86.420) (-86.458) Common border 0.722 0.671 0.719 0.718 0.679 0.662 0.670 0.690 (8.413) (7.766) (8.345) (8.337) (7.885) (7.723) (7.817) (8.077) Ex colonizer/colony 1.484 1.579 1.653 1.666 1.472 1.500 1.484 1.501 (14.347) (15.297) (15.757) (15.934) (14.329) (14.588) (14.426) (14.506) Common colonizer 0.754 0.851 0.909 0.908 0.780 0.775 0.779 0.785 (16.687) (19.461) (20.636) (20.613) (17.085) (16.957) (17.045) (17.102) Common religion 0.429 0.329 0.416 0.406 0.325 0.264 0.289 0.319 (8.664) (6.475) (8.293) (8.081) (6.383) (5.087) (5.589) (6.210) Common legal system 0.244 0.311 0.274 0.278 0.240 0.209 0.217 0.189 (6.817) (9.029) (7.695) (7.825) (6.544) (5.666) (5.866) (5.202) Years at war -0.398 -0.417 -0.385 -0.389 -0.397 -0.382 -0.382 -0.365 (-2.388) (-2.501) (-2.357) (-2.391) (-2.382) (-2.272) (-2.283) (-2.188) Observations 209276 209276 209276 209276 209276 209276 209276 209276 Adjusted R² 0.756 0.756 0.756 0.756 0.757 0.757 0.757 0.757 Number of clusters 28950 28950 28950 28950 28950 28950 28950 28950 All regressions contain exporter/year and importer/year fixed effects. Student ts are in parentheses. These are based on robust standard errors that have been adjusted for clustering by country pair.
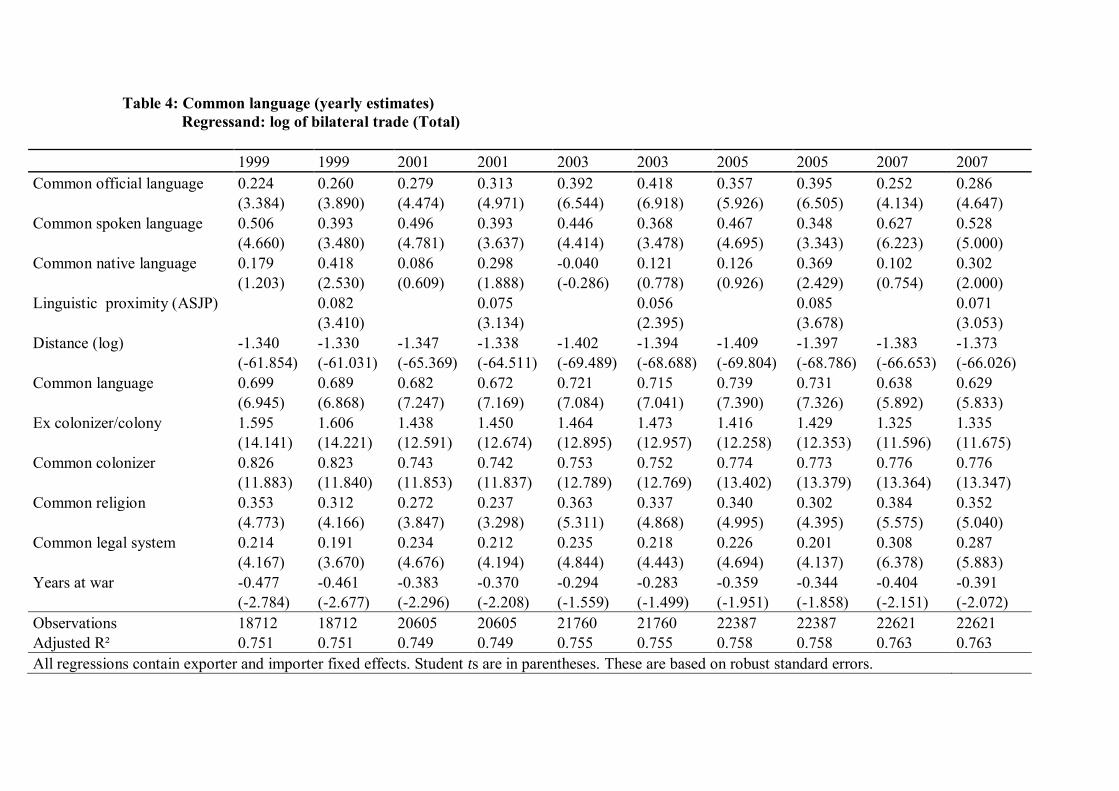
Table 4: Common language (yearly estimates) Regressand: log of bilateral trade (Total)
1999 1999 2001 2001 2003 2003 2005 2005 2007 2007 Common official language 0.224 0.260 0.279 0.313 0.392 0.418 0.357 0.395 0.252 0.286 (3.384) (3.890) (4.474) (4.971) (6.544) (6.918) (5.926) (6.505) (4.134) (4.647) Common spoken language 0.506 0.393 0.496 0.393 0.446 0.368 0.467 0.348 0.627 0.528 (4.660) (3.480) (4.781) (3.637) (4.414) (3.478) (4.695) (3.343) (6.223) (5.000) Common native language 0.179 0.418 0.086 0.298 -0.040 0.121 0.126 0.369 0.102 0.302 (1.203) (2.530) (0.609) (1.888) (-0.286) (0.778) (0.926) (2.429) (0.754) (2.000) Linguistic proximity (ASJP) 0.082 0.075 0.056 0.085 0.071 (3.410) (3.134) (2.395) (3.678) (3.053) Distance (log) -1.340 -1.330 -1.347 -1.338 -1.402 -1.394 -1.409 -1.397 -1.383 -1.373 (-61.854) (-61.031) (-65.369) (-64.511) (-69.489) (-68.688) (-69.804) (-68.786) (-66.653) (-66.026) Common language 0.699 0.689 0.682 0.672 0.721 0.715 0.739 0.731 0.638 0.629 (6.945) (6.868) (7.247) (7.169) (7.084) (7.041) (7.390) (7.326) (5.892) (5.833) Ex colonizer/colony 1.595 1.606 1.438 1.450 1.464 1.473 1.416 1.429 1.325 1.335 (14.141) (14.221) (12.591) (12.674) (12.895) (12.957) (12.258) (12.353) (11.596) (11.675) Common colonizer 0.826 0.823 0.743 0.742 0.753 0.752 0.774 0.773 0.776 0.776 (11.883) (11.840) (11.853) (11.837) (12.789) (12.769) (13.402) (13.379) (13.364) (13.347) Common religion 0.353 0.312 0.272 0.237 0.363 0.337 0.340 0.302 0.384 0.352 (4.773) (4.166) (3.847) (3.298) (5.311) (4.868) (4.995) (4.395) (5.575) (5.040) Common legal system 0.214 0.191 0.234 0.212 0.235 0.218 0.226 0.201 0.308 0.287 (4.167) (3.670) (4.676) (4.194) (4.844) (4.443) (4.694) (4.137) (6.378) (5.883) Years at war -0.477 -0.461 -0.383 -0.370 -0.294 -0.283 -0.359 -0.344 -0.404 -0.391 (-2.784) (-2.677) (-2.296) (-2.208) (-1.559) (-1.499) (-1.951) (-1.858) (-2.151) (-2.072) Observations 18712 18712 20605 20605 21760 21760 22387 22387 22621 22621 Adjusted R² 0.751 0.751 0.749 0.749 0.755 0.755 0.758 0.758 0.763 0.763 All regressions contain exporter and importer fixed effects. Student ts are in parentheses. These are based on robust standard errors.
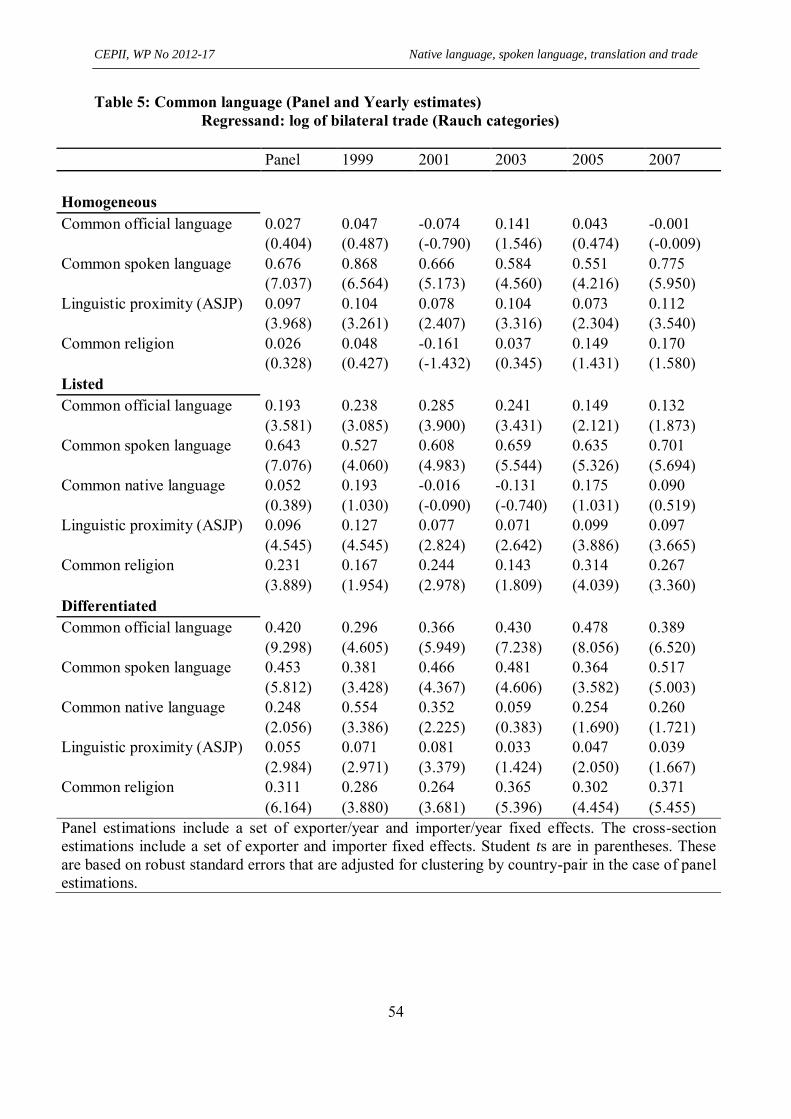
CEPII, WP No 2012-17 Native language, spoken language, translation and trade
54
Table 5: Common language (Panel and Yearly estimates) Regressand: log of bilateral trade (Rauch categories)
Panel 1999 2001 2003 2005 2007 Homogeneous Common official language 0.027 0.047 -0.074 0.141 0.043 -0.001 (0.404) (0.487) (-0.790) (1.546) (0.474) (-0.009) Common spoken language 0.676 0.868 0.666 0.584 0.551 0.775 (7.037) (6.564) (5.173) (4.560) (4.216) (5.950) Linguistic proximity (ASJP) 0.097 0.104 0.078 0.104 0.073 0.112 (3.968) (3.261) (2.407) (3.316) (2.304) (3.540) Common religion 0.026 0.048 -0.161 0.037 0.149 0.170 (0.328) (0.427) (-1.432) (0.345) (1.431) (1.580) Listed Common official language 0.193 0.238 0.285 0.241 0.149 0.132 (3.581) (3.085) (3.900) (3.431) (2.121) (1.873) Common spoken language 0.643 0.527 0.608 0.659 0.635 0.701 (7.076) (4.060) (4.983) (5.544) (5.326) (5.694) Common native language 0.052 0.193 -0.016 -0.131 0.175 0.090 (0.389) (1.030) (-0.090) (-0.740) (1.031) (0.519) Linguistic proximity (ASJP) 0.096 0.127 0.077 0.071 0.099 0.097 (4.545) (4.545) (2.824) (2.642) (3.886) (3.665) Common religion 0.231 0.167 0.244 0.143 0.314 0.267 (3.889) (1.954) (2.978) (1.809) (4.039) (3.360) Differentiated Common official language 0.420 0.296 0.366 0.430 0.478 0.389 (9.298) (4.605) (5.949) (7.238) (8.056) (6.520) Common spoken language 0.453 0.381 0.466 0.481 0.364 0.517 (5.812) (3.428) (4.367) (4.606) (3.582) (5.003) Common native language 0.248 0.554 0.352 0.059 0.254 0.260 (2.056) (3.386) (2.225) (0.383) (1.690) (1.721) Linguistic proximity (ASJP) 0.055 0.071 0.081 0.033 0.047 0.039 (2.984) (2.971) (3.379) (1.424) (2.050) (1.667) Common religion 0.311 0.286 0.264 0.365 0.302 0.371 (6.164) (3.880) (3.681) (5.396) (4.454) (5.455) Panel estimations include a set of exporter/year and importer/year fixed effects. The cross-section estimations include a set of exporter and importer fixed effects. Student ts are in parentheses. These are based on robust standard errors that are adjusted for clustering by country-pair in the case of panel estimations.
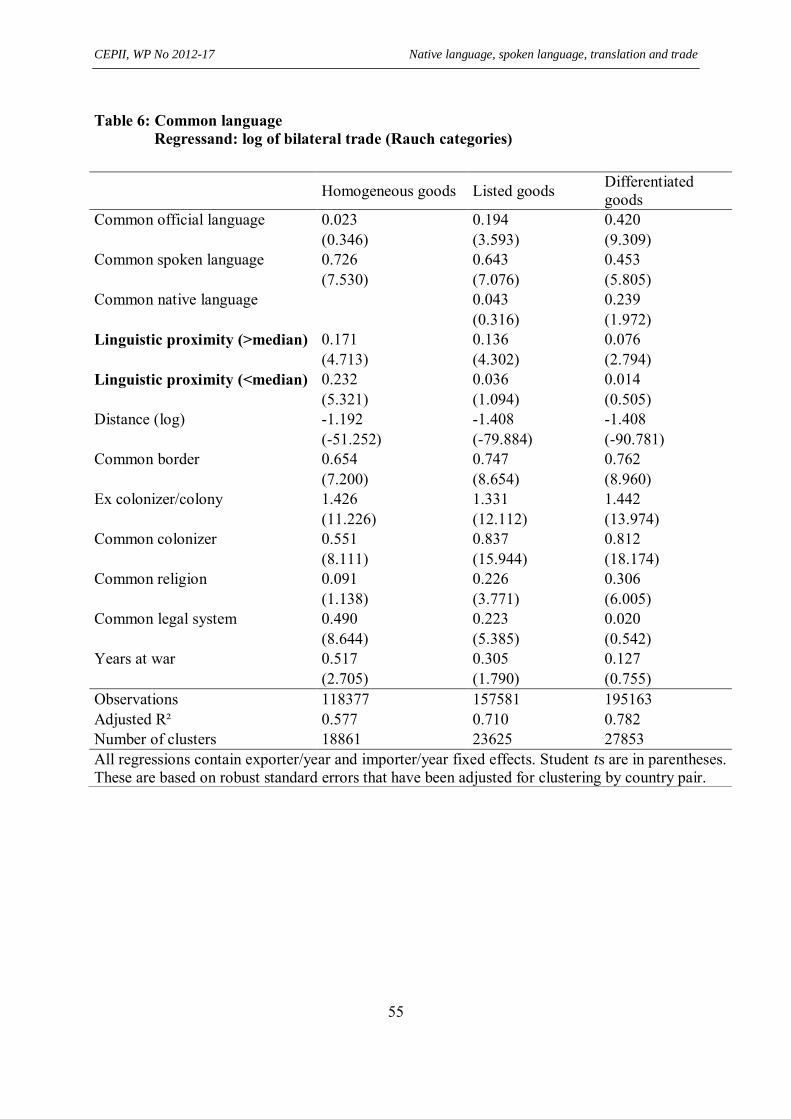
CEPII, WP No 2012-17 Native language, spoken language, translation and trade
55
Table 6: Common language Regressand: log of bilateral trade (Rauch categories)
Homogeneous goods Listed goods Differentiated goods
Common official language 0.023 0.194 0.420 (0.346) (3.593) (9.309) Common spoken language 0.726 0.643 0.453 (7.530) (7.076) (5.805) Common native language 0.043 0.239 (0.316) (1.972) Linguistic proximity (>median) 0.171 0.136 0.076 (4.713) (4.302) (2.794) Linguistic proximity (<median) 0.232 0.036 0.014 (5.321) (1.094) (0.505) Distance (log) -1.192 -1.408 -1.408 (-51.252) (-79.884) (-90.781) Common border 0.654 0.747 0.762 (7.200) (8.654) (8.960) Ex colonizer/colony 1.426 1.331 1.442 (11.226) (12.112) (13.974) Common colonizer 0.551 0.837 0.812 (8.111) (15.944) (18.174) Common religion 0.091 0.226 0.306 (1.138) (3.771) (6.005) Common legal system 0.490 0.223 0.020 (8.644) (5.385) (0.542) Years at war 0.517 0.305 0.127 (2.705) (1.790) (0.755) Observations 118377 157581 195163 Adjusted R² 0.577 0.710 0.782 Number of clusters 18861 23625 27853 All regressions contain exporter/year and importer/year fixed effects. Student ts are in parentheses. These are based on robust standard errors that have been adjusted for clustering by country pair.
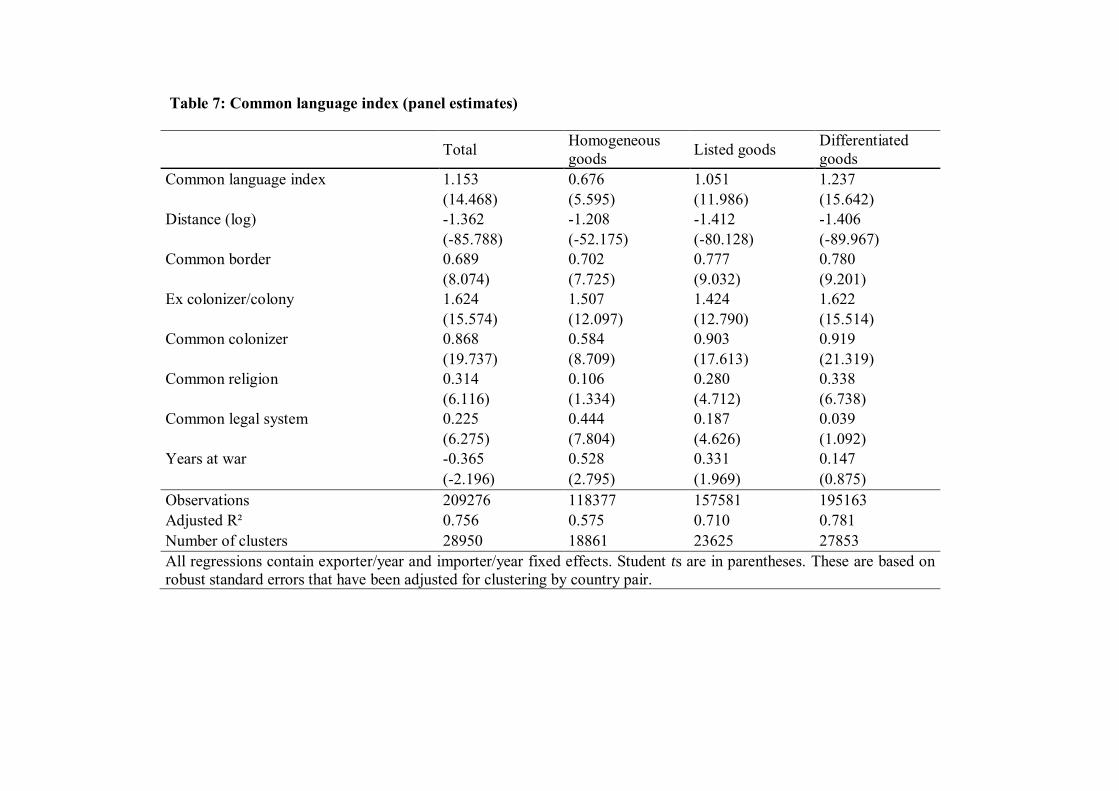
Table 7: Common language index (panel estimates)
Total Homogeneous goods Listed goods Differentiated
goods Common language index 1.153 0.676 1.051 1.237 (14.468) (5.595) (11.986) (15.642) Distance (log) -1.362 -1.208 -1.412 -1.406 (-85.788) (-52.175) (-80.128) (-89.967) Common border 0.689 0.702 0.777 0.780 (8.074) (7.725) (9.032) (9.201) Ex colonizer/colony 1.624 1.507 1.424 1.622 (15.574) (12.097) (12.790) (15.514) Common colonizer 0.868 0.584 0.903 0.919 (19.737) (8.709) (17.613) (21.319) Common religion 0.314 0.106 0.280 0.338 (6.116) (1.334) (4.712) (6.738) Common legal system 0.225 0.444 0.187 0.039 (6.275) (7.804) (4.626) (1.092) Years at war -0.365 0.528 0.331 0.147 (-2.196) (2.795) (1.969) (0.875) Observations 209276 118377 157581 195163 Adjusted R² 0.756 0.575 0.710 0.781 Number of clusters 28950 18861 23625 27853 All regressions contain exporter/year and importer/year fixed effects. Student ts are in parentheses. These are based on robust standard errors that have been adjusted for clustering by country pair.
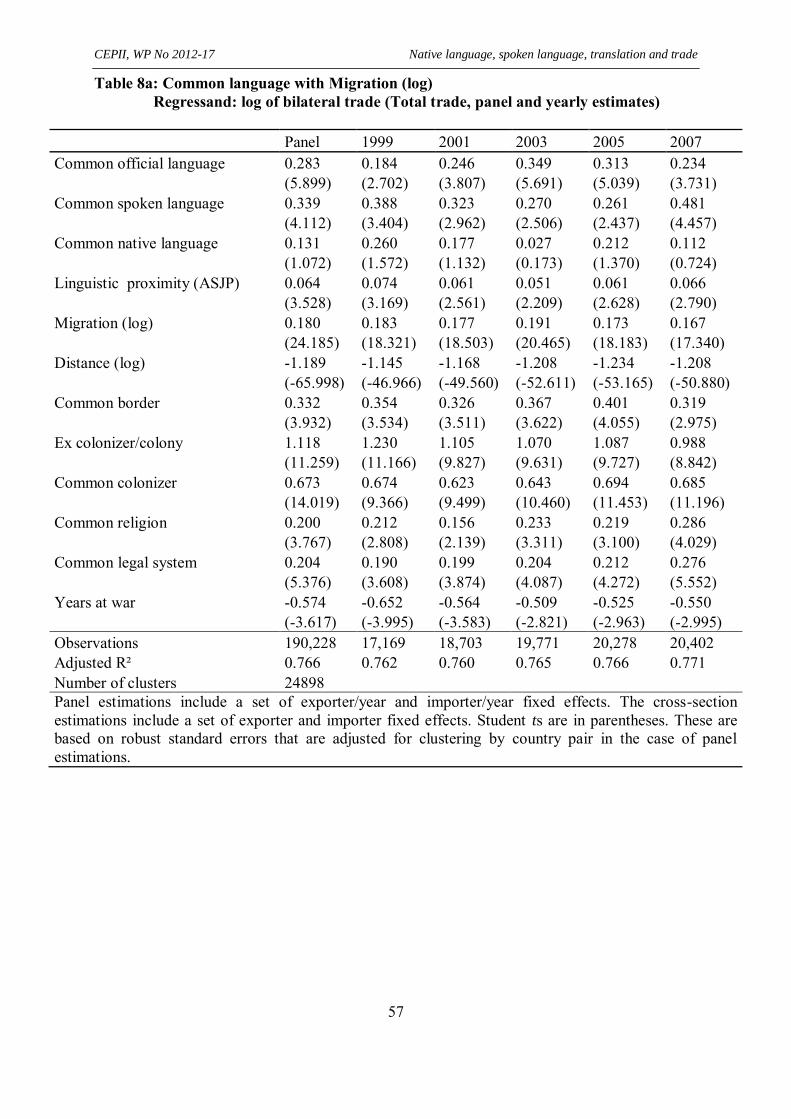
CEPII, WP No 2012-17 Native language, spoken language, translation and trade
57
Table 8a: Common language with Migration (log) Regressand: log of bilateral trade (Total trade, panel and yearly estimates)
Panel 1999 2001 2003 2005 2007 Common official language 0.283 0.184 0.246 0.349 0.313 0.234 (5.899) (2.702) (3.807) (5.691) (5.039) (3.731) Common spoken language 0.339 0.388 0.323 0.270 0.261 0.481 (4.112) (3.404) (2.962) (2.506) (2.437) (4.457) Common native language 0.131 0.260 0.177 0.027 0.212 0.112 (1.072) (1.572) (1.132) (0.173) (1.370) (0.724) Linguistic proximity (ASJP) 0.064 0.074 0.061 0.051 0.061 0.066 (3.528) (3.169) (2.561) (2.209) (2.628) (2.790) Migration (log) 0.180 0.183 0.177 0.191 0.173 0.167 (24.185) (18.321) (18.503) (20.465) (18.183) (17.340) Distance (log) -1.189 -1.145 -1.168 -1.208 -1.234 -1.208 (-65.998) (-46.966) (-49.560) (-52.611) (-53.165) (-50.880) Common border 0.332 0.354 0.326 0.367 0.401 0.319 (3.932) (3.534) (3.511) (3.622) (4.055) (2.975) Ex colonizer/colony 1.118 1.230 1.105 1.070 1.087 0.988 (11.259) (11.166) (9.827) (9.631) (9.727) (8.842) Common colonizer 0.673 0.674 0.623 0.643 0.694 0.685 (14.019) (9.366) (9.499) (10.460) (11.453) (11.196) Common religion 0.200 0.212 0.156 0.233 0.219 0.286 (3.767) (2.808) (2.139) (3.311) (3.100) (4.029) Common legal system 0.204 0.190 0.199 0.204 0.212 0.276 (5.376) (3.608) (3.874) (4.087) (4.272) (5.552) Years at war -0.574 -0.652 -0.564 -0.509 -0.525 -0.550 (-3.617) (-3.995) (-3.583) (-2.821) (-2.963) (-2.995) Observations 190,228 17,169 18,703 19,771 20,278 20,402 Adjusted R² 0.766 0.762 0.760 0.765 0.766 0.771 Number of clusters 24898 Panel estimations include a set of exporter/year and importer/year fixed effects. The cross-section estimations include a set of exporter and importer fixed effects. Student ts are in parentheses. These are based on robust standard errors that are adjusted for clustering by country pair in the case of panel estimations.
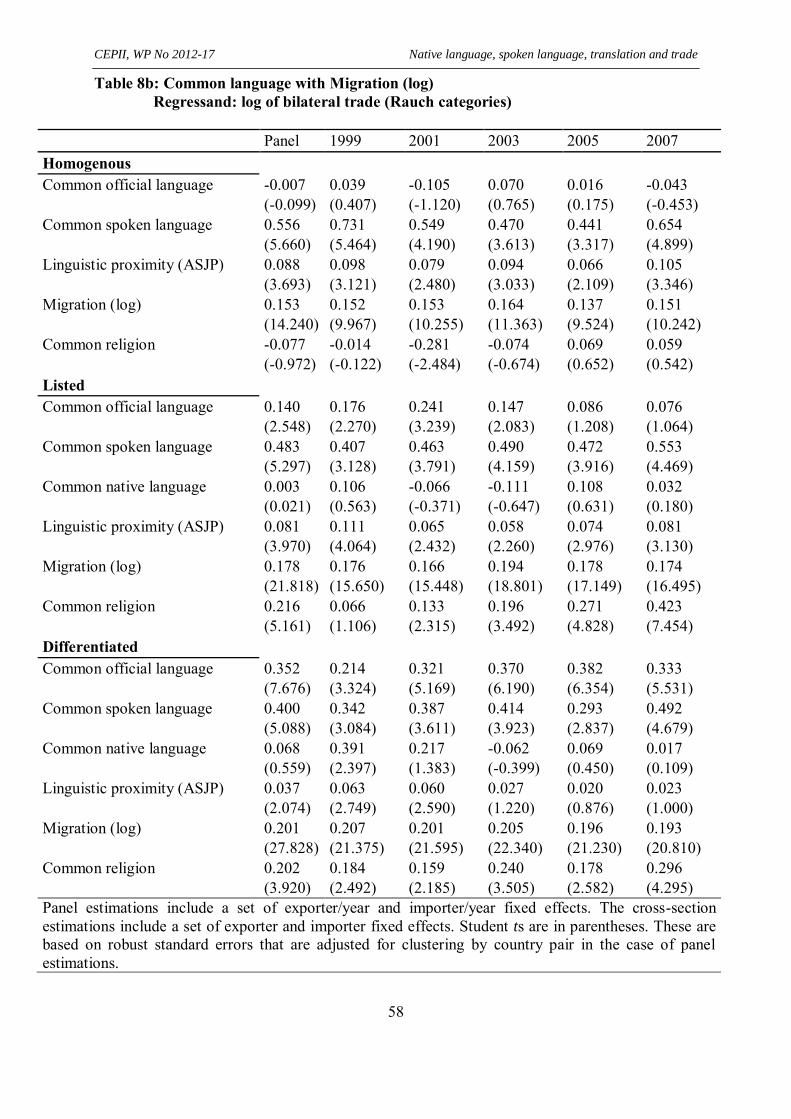
CEPII, WP No 2012-17 Native language, spoken language, translation and trade
58
Table 8b: Common language with Migration (log) Regressand: log of bilateral trade (Rauch categories)
Panel 1999 2001 2003 2005 2007 Homogenous Common official language -0.007 0.039 -0.105 0.070 0.016 -0.043 (-0.099) (0.407) (-1.120) (0.765) (0.175) (-0.453) Common spoken language 0.556 0.731 0.549 0.470 0.441 0.654 (5.660) (5.464) (4.190) (3.613) (3.317) (4.899) Linguistic proximity (ASJP) 0.088 0.098 0.079 0.094 0.066 0.105 (3.693) (3.121) (2.480) (3.033) (2.109) (3.346) Migration (log) 0.153 0.152 0.153 0.164 0.137 0.151 (14.240) (9.967) (10.255) (11.363) (9.524) (10.242) Common religion -0.077 -0.014 -0.281 -0.074 0.069 0.059 (-0.972) (-0.122) (-2.484) (-0.674) (0.652) (0.542) Listed Common official language 0.140 0.176 0.241 0.147 0.086 0.076 (2.548) (2.270) (3.239) (2.083) (1.208) (1.064) Common spoken language 0.483 0.407 0.463 0.490 0.472 0.553 (5.297) (3.128) (3.791) (4.159) (3.916) (4.469) Common native language 0.003 0.106 -0.066 -0.111 0.108 0.032 (0.021) (0.563) (-0.371) (-0.647) (0.631) (0.180) Linguistic proximity (ASJP) 0.081 0.111 0.065 0.058 0.074 0.081 (3.970) (4.064) (2.432) (2.260) (2.976) (3.130) Migration (log) 0.178 0.176 0.166 0.194 0.178 0.174 (21.818) (15.650) (15.448) (18.801) (17.149) (16.495) Common religion 0.216 0.066 0.133 0.196 0.271 0.423 (5.161) (1.106) (2.315) (3.492) (4.828) (7.454) Differentiated Common official language 0.352 0.214 0.321 0.370 0.382 0.333 (7.676) (3.324) (5.169) (6.190) (6.354) (5.531) Common spoken language 0.400 0.342 0.387 0.414 0.293 0.492 (5.088) (3.084) (3.611) (3.923) (2.837) (4.679) Common native language 0.068 0.391 0.217 -0.062 0.069 0.017 (0.559) (2.397) (1.383) (-0.399) (0.450) (0.109) Linguistic proximity (ASJP) 0.037 0.063 0.060 0.027 0.020 0.023 (2.074) (2.749) (2.590) (1.220) (0.876) (1.000) Migration (log) 0.201 0.207 0.201 0.205 0.196 0.193 (27.828) (21.375) (21.595) (22.340) (21.230) (20.810) Common religion 0.202 0.184 0.159 0.240 0.178 0.296 (3.920) (2.492) (2.185) (3.505) (2.582) (4.295) Panel estimations include a set of exporter/year and importer/year fixed effects. The cross-section estimations include a set of exporter and importer fixed effects. Student ts are in parentheses. These are based on robust standard errors that are adjusted for clustering by country pair in the case of panel estimations.
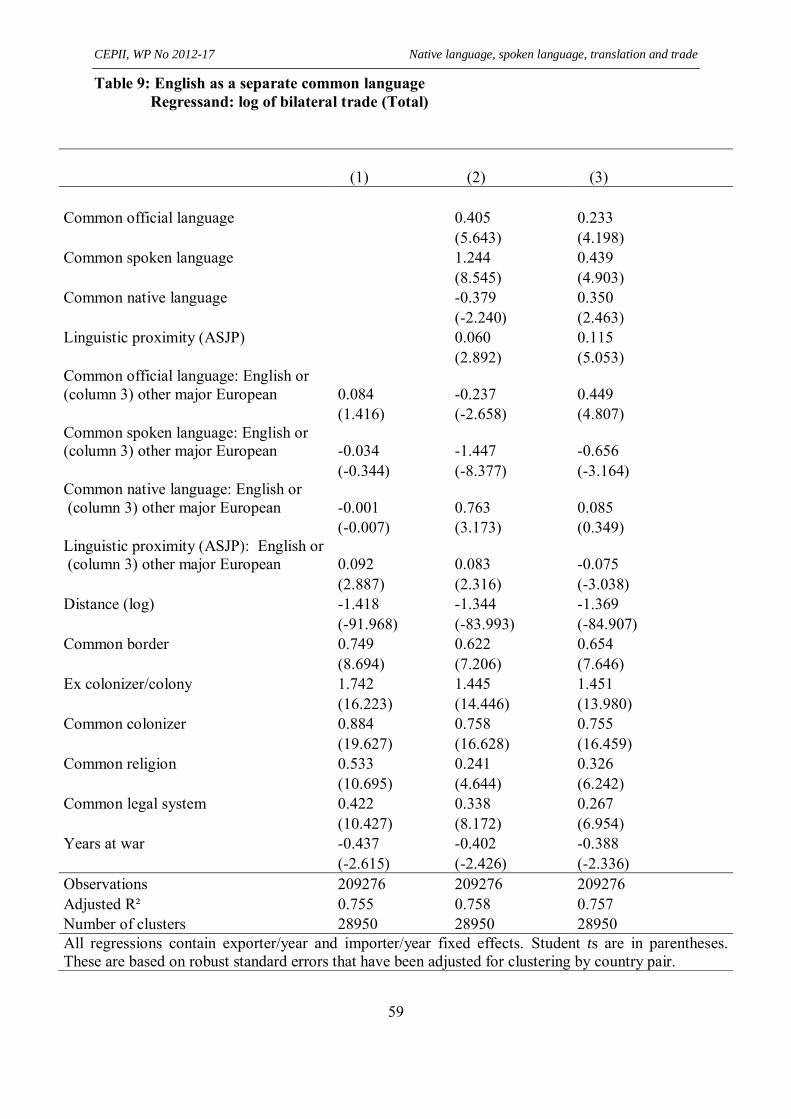
CEPII, WP No 2012-17 Native language, spoken language, translation and trade
59
Table 9: English as a separate common language Regressand: log of bilateral trade (Total)
(1) (2) (3)
Common official language 0.405 0.233 (5.643) (4.198) Common spoken language 1.244 0.439 (8.545) (4.903) Common native language -0.379 0.350 (-2.240) (2.463) Linguistic proximity (ASJP) 0.060 0.115 (2.892) (5.053) Common official language: English or (column 3) other major European 0.084 -0.237 0.449 (1.416) (-2.658) (4.807) Common spoken language: English or (column 3) other major European -0.034 -1.447 -0.656 (-0.344) (-8.377) (-3.164) Common native language: English or (column 3) other major European -0.001 0.763 0.085 (-0.007) (3.173) (0.349) Linguistic proximity (ASJP): English or (column 3) other major European 0.092 0.083 -0.075 (2.887) (2.316) (-3.038) Distance (log) -1.418 -1.344 -1.369 (-91.968) (-83.993) (-84.907) Common border 0.749 0.622 0.654 (8.694) (7.206) (7.646) Ex colonizer/colony 1.742 1.445 1.451 (16.223) (14.446) (13.980) Common colonizer 0.884 0.758 0.755 (19.627) (16.628) (16.459) Common religion 0.533 0.241 0.326 (10.695) (4.644) (6.242) Common legal system 0.422 0.338 0.267 (10.427) (8.172) (6.954) Years at war -0.437 -0.402 -0.388 (-2.615) (-2.426) (-2.336) Observations 209276 209276 209276 Adjusted R² 0.755 0.758 0.757 Number of clusters 28950 28950 28950 All regressions contain exporter/year and importer/year fixed effects. Student ts are in parentheses. These are based on robust standard errors that have been adjusted for clustering by country pair.
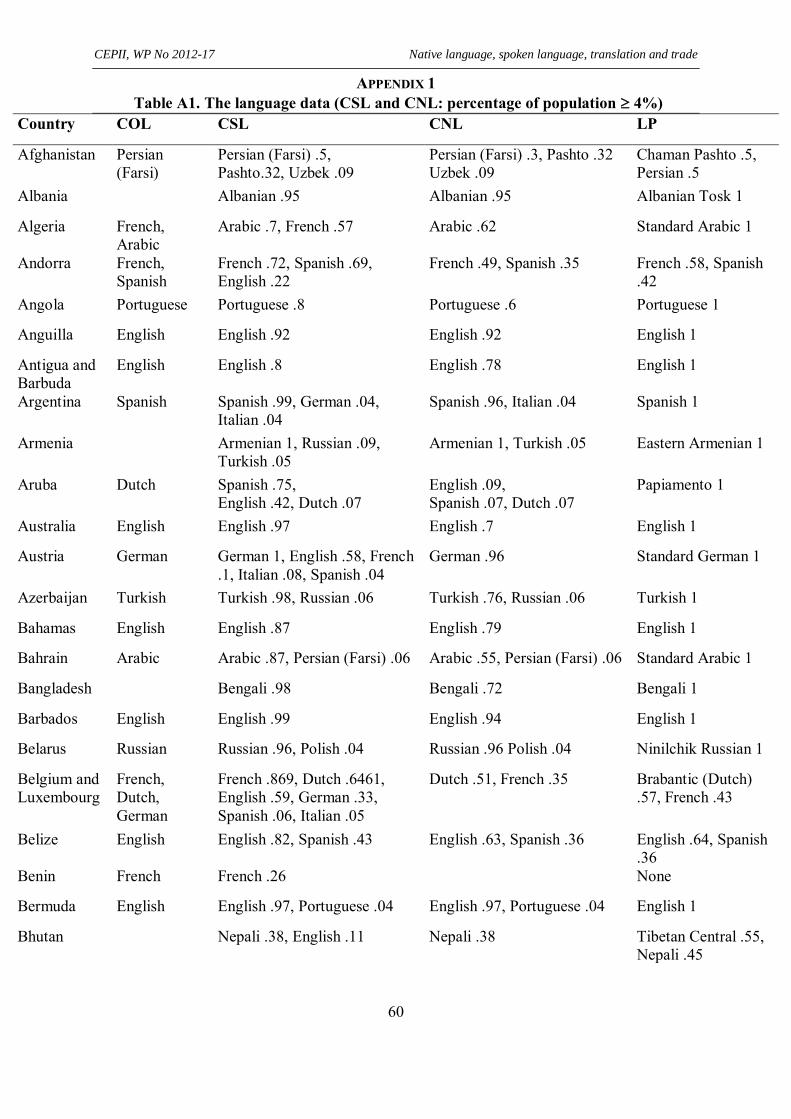
CEPII, WP No 2012-17 Native language, spoken language, translation and trade
60
APPENDIX 1
Table A1. The language data (CSL and CNL: percentage of population 4%) Country COL CSL CNL LP
Afghanistan Persian (Farsi)
Persian (Farsi) .5, Pashto.32, Uzbek .09
Persian (Farsi) .3, Pashto .32 Uzbek .09
Chaman Pashto .5, Persian .5
Albania Albanian .95 Albanian .95 Albanian Tosk 1
Algeria French, Arabic
Arabic .7, French .57 Arabic .62 Standard Arabic 1
Andorra French, Spanish
French .72, Spanish .69, English .22
French .49, Spanish .35 French .58, Spanish .42
Angola Portuguese Portuguese .8 Portuguese .6 Portuguese 1
Anguilla English English .92 English .92 English 1
Antigua and Barbuda
English English .8 English .78 English 1
Argentina Spanish Spanish .99, German .04, Italian .04
Spanish .96, Italian .04 Spanish 1
Armenia Armenian 1, Russian .09, Turkish .05
Armenian 1, Turkish .05 Eastern Armenian 1
Aruba Dutch Spanish .75, English .42, Dutch .07
English .09, Spanish .07, Dutch .07
Papiamento 1
Australia English English .97 English .7 English 1
Austria German German 1, English .58, French .1, Italian .08, Spanish .04
German .96 Standard German 1
Azerbaijan Turkish Turkish .98, Russian .06 Turkish .76, Russian .06 Turkish 1
Bahamas English English .87 English .79 English 1
Bahrain Arabic Arabic .87, Persian (Farsi) .06 Arabic .55, Persian (Farsi) .06 Standard Arabic 1
Bangladesh Bengali .98 Bengali .72 Bengali 1
Barbados English English .99 English .94 English 1
Belarus Russian Russian .96, Polish .04 Russian .96 Polish .04 Ninilchik Russian 1
Belgium and Luxembourg
French, Dutch, German
French .869, Dutch .6461, English .59, German .33, Spanish .06, Italian .05
Dutch .51, French .35 Brabantic (Dutch) .57, French .43
Belize English English .82, Spanish .43 English .63, Spanish .36 English .64, Spanish .36
Benin French French .26 None
Bermuda English English .97, Portuguese .04 English .97, Portuguese .04 English 1
Bhutan Nepali .38, English .11 Nepali .38 Tibetan Central .55, Nepali .45
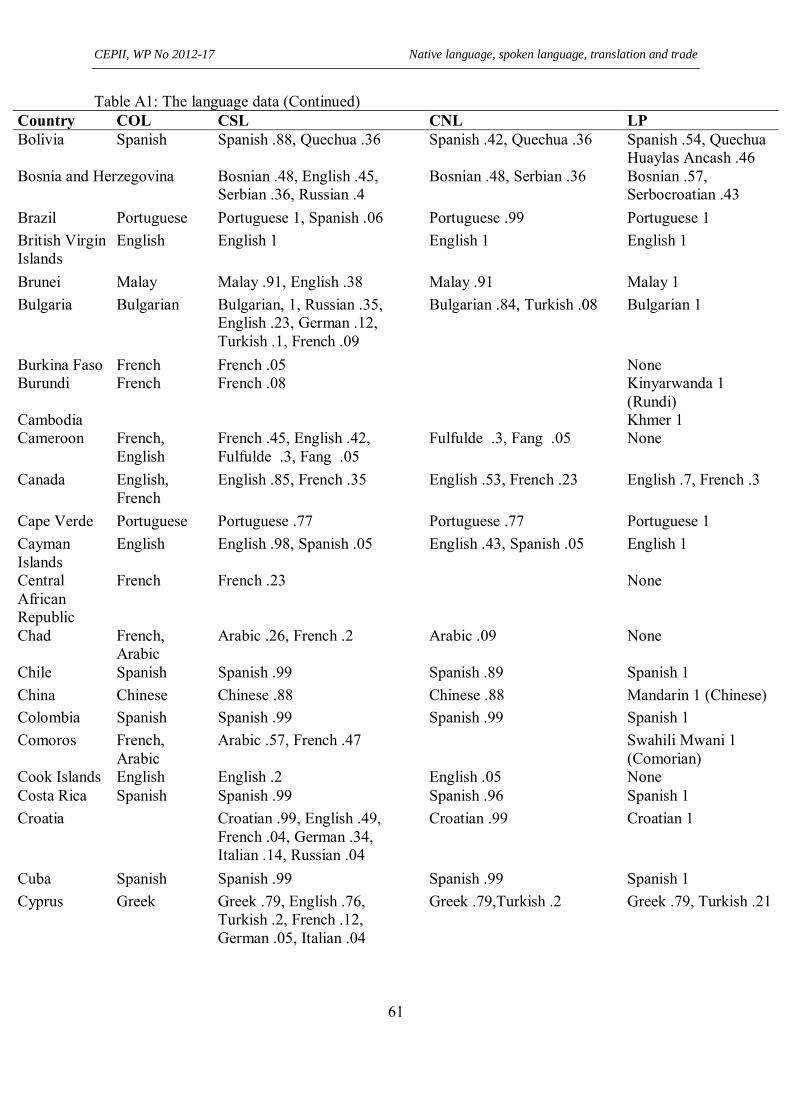
CEPII, WP No 2012-17 Native language, spoken language, translation and trade
61
Table A1: The language data (Continued)
Country COL CSL CNL LP Bolivia Spanish Spanish .88, Quechua .36 Spanish .42, Quechua .36 Spanish .54, Quechua
Huaylas Ancash .46 Bosnia and Herzegovina Bosnian .48, English .45,
Serbian .36, Russian .4 Bosnian .48, Serbian .36 Bosnian .57,
Serbocroatian .43 Brazil Portuguese Portuguese 1, Spanish .06 Portuguese .99 Portuguese 1 British Virgin Islands
English English 1 English 1 English 1
Brunei Malay Malay .91, English .38 Malay .91 Malay 1 Bulgaria Bulgarian Bulgarian, 1, Russian .35,
English .23, German .12, Turkish .1, French .09
Bulgarian .84, Turkish .08 Bulgarian 1
Burkina Faso French French .05 None Burundi French French .08 Kinyarwanda 1
(Rundi) Cambodia Khmer 1 Cameroon French,
English French .45, English .42, Fulfulde .3, Fang .05
Fulfulde .3, Fang .05 None
Canada English, French
English .85, French .35 English .53, French .23 English .7, French .3
Cape Verde Portuguese Portuguese .77 Portuguese .77 Portuguese 1 Cayman Islands
English English .98, Spanish .05 English .43, Spanish .05 English 1
Central African Republic
French French .23 None
Chad French, Arabic
Arabic .26, French .2 Arabic .09 None
Chile Spanish Spanish .99 Spanish .89 Spanish 1 China Chinese Chinese .88 Chinese .88 Mandarin 1 (Chinese) Colombia Spanish Spanish .99 Spanish .99 Spanish 1 Comoros French,
Arabic Arabic .57, French .47 Swahili Mwani 1
(Comorian) Cook Islands English English .2 English .05 None Costa Rica Spanish Spanish .99 Spanish .96 Spanish 1 Croatia Croatian .99, English .49,
French .04, German .34, Italian .14, Russian .04
Croatian .99 Croatian 1
Cuba Spanish Spanish .99 Spanish .99 Spanish 1 Cyprus Greek Greek .79, English .76,
Turkish .2, French .12, German .05, Italian .04
Greek .79,Turkish .2 Greek .79, Turkish .21
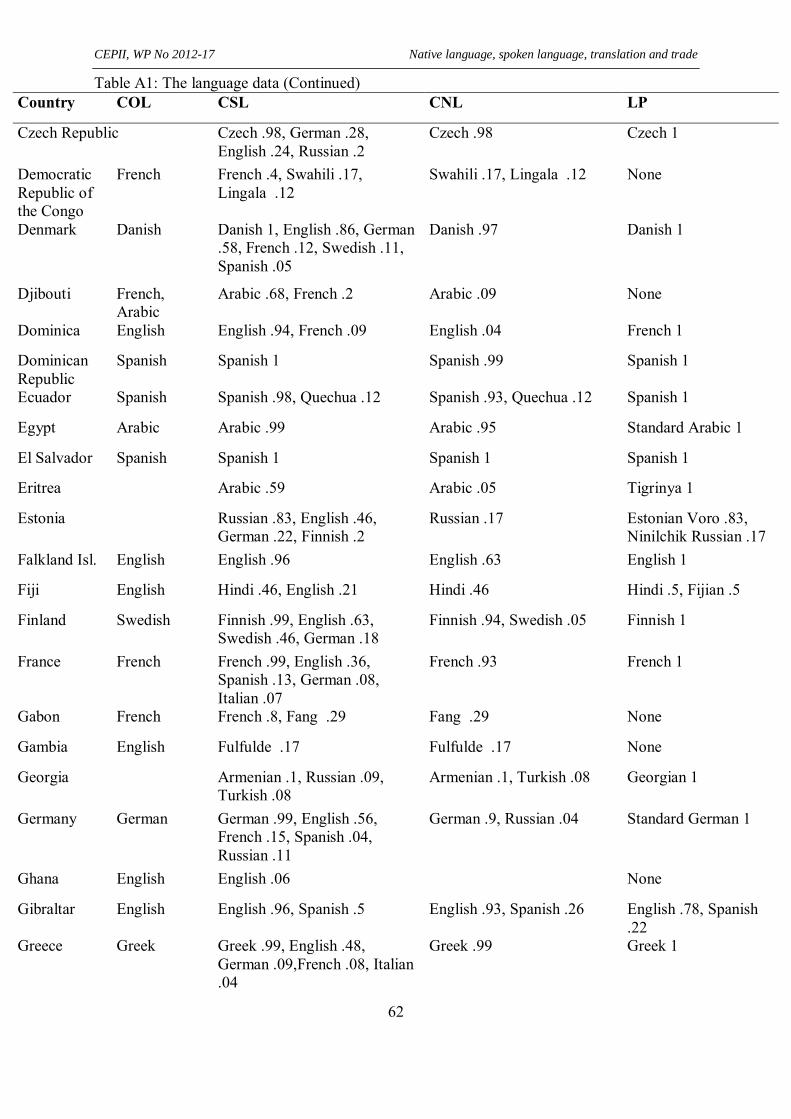
CEPII, WP No 2012-17 Native language, spoken language, translation and trade
62
Table A1: The language data (Continued) Country COL CSL CNL LP
Czech Republic Czech .98, German .28, English .24, Russian .2
Czech .98 Czech 1
Democratic Republic of the Congo
French French .4, Swahili .17, Lingala .12
Swahili .17, Lingala .12 None
Denmark Danish Danish 1, English .86, German .58, French .12, Swedish .11, Spanish .05
Danish .97 Danish 1
Djibouti French, Arabic
Arabic .68, French .2 Arabic .09 None
Dominica English English .94, French .09 English .04 French 1
Dominican Republic
Spanish Spanish 1 Spanish .99 Spanish 1
Ecuador Spanish Spanish .98, Quechua .12 Spanish .93, Quechua .12 Spanish 1
Egypt Arabic Arabic .99 Arabic .95 Standard Arabic 1
El Salvador Spanish Spanish 1 Spanish 1 Spanish 1
Eritrea Arabic .59 Arabic .05 Tigrinya 1
Estonia Russian .83, English .46, German .22, Finnish .2
Russian .17 Estonian Voro .83, Ninilchik Russian .17
Falkland Isl. English English .96 English .63 English 1
Fiji English Hindi .46, English .21 Hindi .46 Hindi .5, Fijian .5
Finland Swedish Finnish .99, English .63, Swedish .46, German .18
Finnish .94, Swedish .05 Finnish 1
France French French .99, English .36, Spanish .13, German .08, Italian .07
French .93 French 1
Gabon French French .8, Fang .29 Fang .29 None
Gambia English Fulfulde .17 Fulfulde .17 None
Georgia Armenian .1, Russian .09, Turkish .08
Armenian .1, Turkish .08 Georgian 1
Germany German German .99, English .56, French .15, Spanish .04, Russian .11
German .9, Russian .04 Standard German 1
Ghana English English .06 None
Gibraltar English English .96, Spanish .5 English .93, Spanish .26 English .78, Spanish .22
Greece Greek Greek .99, English .48, German .09,French .08, Italian .04
Greek .99 Greek 1
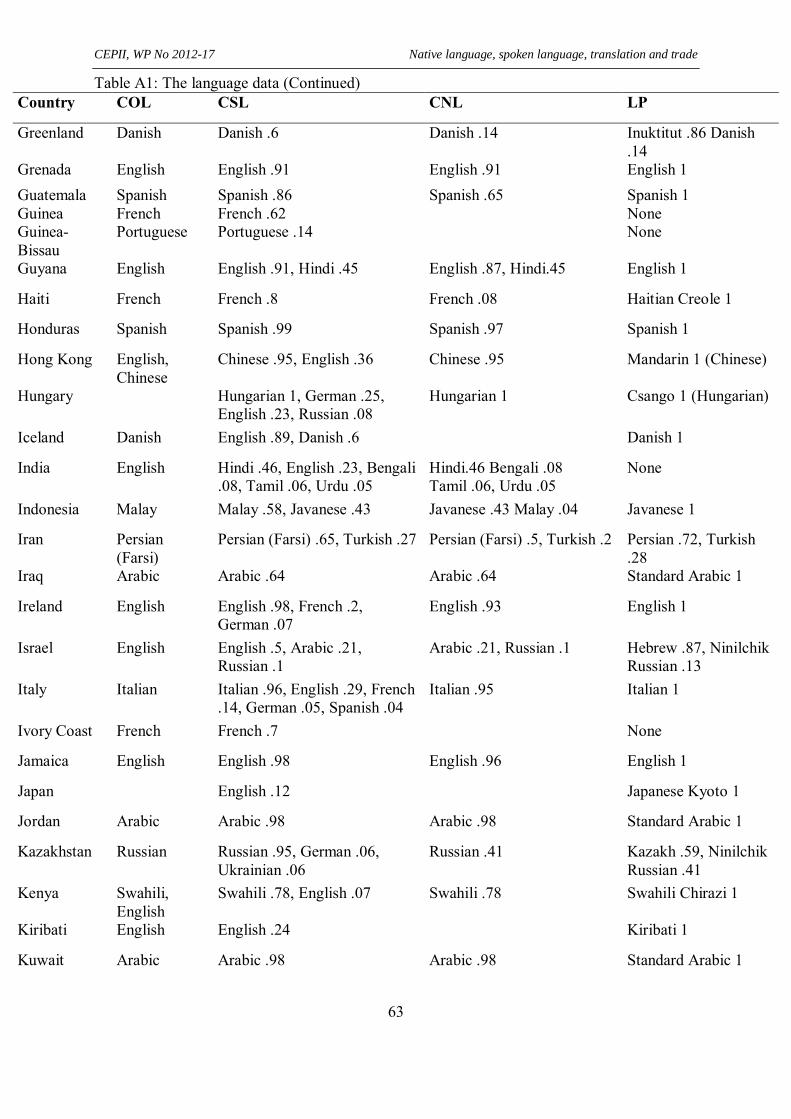
CEPII, WP No 2012-17 Native language, spoken language, translation and trade
63
Table A1: The language data (Continued) Country COL CSL CNL LP
Greenland Danish Danish .6 Danish .14 Inuktitut .86 Danish .14
Grenada English English .91 English .91 English 1 Guatemala Spanish Spanish .86 Spanish .65 Spanish 1 Guinea French French .62 None Guinea-Bissau
Portuguese Portuguese .14 None
Guyana English English .91, Hindi .45 English .87, Hindi.45 English 1
Haiti French French .8 French .08 Haitian Creole 1
Honduras Spanish Spanish .99 Spanish .97 Spanish 1
Hong Kong English, Chinese
Chinese .95, English .36 Chinese .95 Mandarin 1 (Chinese)
Hungary Hungarian 1, German .25, English .23, Russian .08
Hungarian 1 Csango 1 (Hungarian)
Iceland Danish English .89, Danish .6 Danish 1
India English Hindi .46, English .23, Bengali .08, Tamil .06, Urdu .05
Hindi.46 Bengali .08 Tamil .06, Urdu .05
None
Indonesia Malay Malay .58, Javanese .43 Javanese .43 Malay .04 Javanese 1
Iran Persian (Farsi)
Persian (Farsi) .65, Turkish .27 Persian (Farsi) .5, Turkish .2 Persian .72, Turkish .28
Iraq Arabic Arabic .64 Arabic .64 Standard Arabic 1
Ireland English English .98, French .2, German .07
English .93 English 1
Israel English English .5, Arabic .21, Russian .1
Arabic .21, Russian .1 Hebrew .87, Ninilchik Russian .13
Italy Italian Italian .96, English .29, French .14, German .05, Spanish .04
Italian .95 Italian 1
Ivory Coast French French .7 None
Jamaica English English .98 English .96 English 1
Japan English .12 Japanese Kyoto 1
Jordan Arabic Arabic .98 Arabic .98 Standard Arabic 1
Kazakhstan Russian Russian .95, German .06, Ukrainian .06
Russian .41 Kazakh .59, Ninilchik Russian .41
Kenya Swahili, English
Swahili .78, English .07 Swahili .78 Swahili Chirazi 1
Kiribati English English .24 Kiribati 1
Kuwait Arabic Arabic .98 Arabic .98 Standard Arabic 1
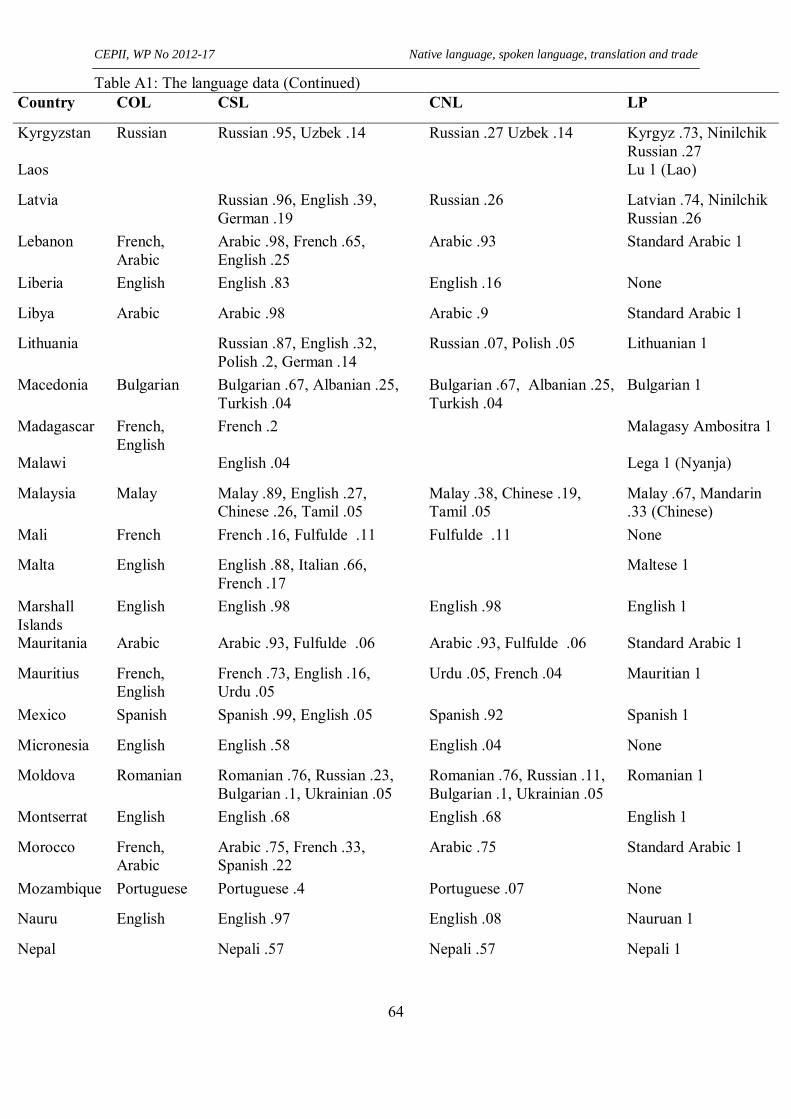
CEPII, WP No 2012-17 Native language, spoken language, translation and trade
64
Table A1: The language data (Continued) Country COL CSL CNL LP
Kyrgyzstan Russian Russian .95, Uzbek .14 Russian .27 Uzbek .14 Kyrgyz .73, Ninilchik Russian .27
Laos Lu 1 (Lao)
Latvia Russian .96, English .39, German .19
Russian .26 Latvian .74, Ninilchik Russian .26
Lebanon French, Arabic
Arabic .98, French .65, English .25
Arabic .93 Standard Arabic 1
Liberia English English .83 English .16 None
Libya Arabic Arabic .98 Arabic .9 Standard Arabic 1
Lithuania Russian .87, English .32, Polish .2, German .14
Russian .07, Polish .05 Lithuanian 1
Macedonia Bulgarian Bulgarian .67, Albanian .25, Turkish .04
Bulgarian .67, Albanian .25, Turkish .04
Bulgarian 1
Madagascar French, English
French .2 Malagasy Ambositra 1
Malawi English .04 Lega 1 (Nyanja)
Malaysia Malay Malay .89, English .27, Chinese .26, Tamil .05
Malay .38, Chinese .19, Tamil .05
Malay .67, Mandarin .33 (Chinese)
Mali French French .16, Fulfulde .11 Fulfulde .11 None
Malta English English .88, Italian .66, French .17
Maltese 1
Marshall Islands
English English .98 English .98 English 1
Mauritania Arabic Arabic .93, Fulfulde .06 Arabic .93, Fulfulde .06 Standard Arabic 1
Mauritius French, English
French .73, English .16, Urdu .05
Urdu .05, French .04 Mauritian 1
Mexico Spanish Spanish .99, English .05 Spanish .92 Spanish 1
Micronesia English English .58 English .04 None
Moldova Romanian Romanian .76, Russian .23, Bulgarian .1, Ukrainian .05
Romanian .76, Russian .11, Bulgarian .1, Ukrainian .05
Romanian 1
Montserrat English English .68 English .68 English 1
Morocco French, Arabic
Arabic .75, French .33, Spanish .22
Arabic .75 Standard Arabic 1
Mozambique Portuguese Portuguese .4 Portuguese .07 None
Nauru English English .97 English .08 Nauruan 1
Nepal Nepali .57 Nepali .57 Nepali 1
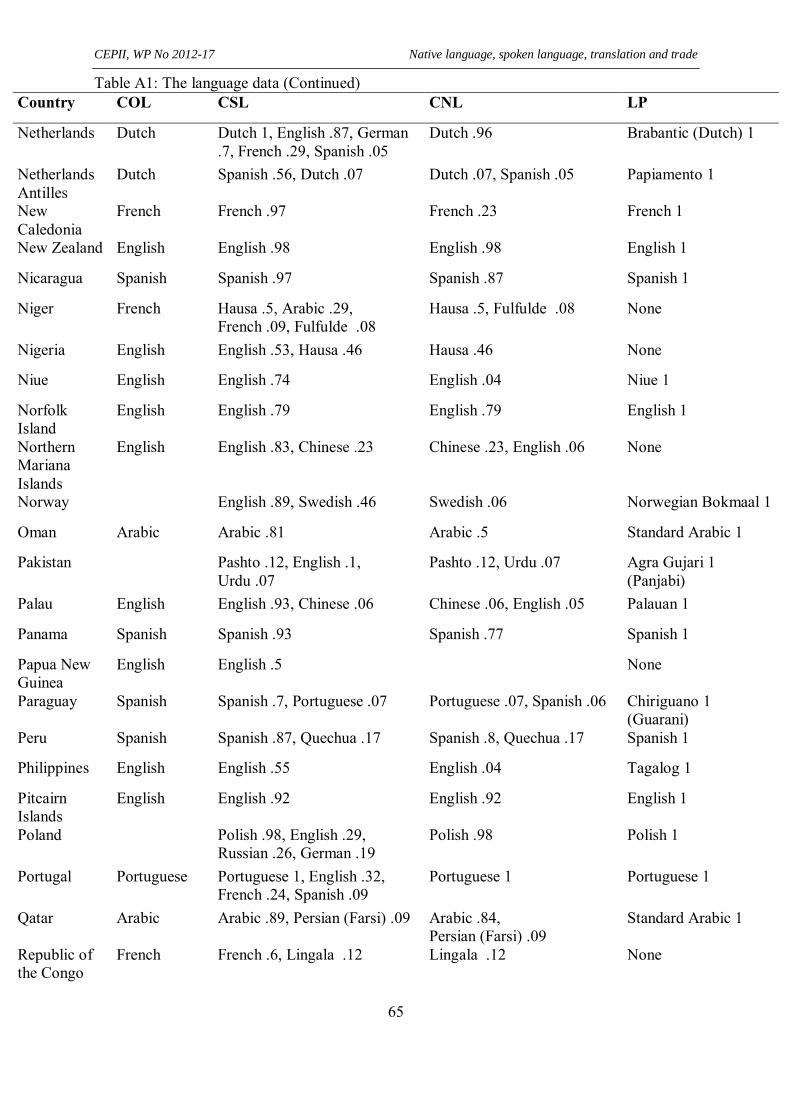
CEPII, WP No 2012-17 Native language, spoken language, translation and trade
65
Table A1: The language data (Continued) Country COL CSL CNL LP
Netherlands Dutch Dutch 1, English .87, German .7, French .29, Spanish .05
Dutch .96 Brabantic (Dutch) 1
Netherlands Antilles
Dutch Spanish .56, Dutch .07 Dutch .07, Spanish .05 Papiamento 1
New Caledonia
French French .97 French .23 French 1
New Zealand English English .98 English .98 English 1
Nicaragua Spanish Spanish .97 Spanish .87 Spanish 1
Niger French Hausa .5, Arabic .29, French .09, Fulfulde .08
Hausa .5, Fulfulde .08 None
Nigeria English English .53, Hausa .46 Hausa .46 None
Niue English English .74 English .04 Niue 1
Norfolk Island
English English .79 English .79 English 1
Northern Mariana Islands
English English .83, Chinese .23 Chinese .23, English .06 None
Norway English .89, Swedish .46 Swedish .06 Norwegian Bokmaal 1
Oman Arabic Arabic .81 Arabic .5 Standard Arabic 1
Pakistan Pashto .12, English .1, Urdu .07
Pashto .12, Urdu .07 Agra Gujari 1 (Panjabi)
Palau English English .93, Chinese .06 Chinese .06, English .05 Palauan 1
Panama Spanish Spanish .93 Spanish .77 Spanish 1
Papua New Guinea
English English .5 None
Paraguay Spanish Spanish .7, Portuguese .07 Portuguese .07, Spanish .06 Chiriguano 1 (Guarani)
Peru Spanish Spanish .87, Quechua .17 Spanish .8, Quechua .17 Spanish 1
Philippines English English .55 English .04 Tagalog 1
Pitcairn Islands
English English .92 English .92 English 1
Poland Polish .98, English .29, Russian .26, German .19
Polish .98 Polish 1
Portugal Portuguese Portuguese 1, English .32, French .24, Spanish .09
Portuguese 1 Portuguese 1
Qatar Arabic Arabic .89, Persian (Farsi) .09 Arabic .84, Persian (Farsi) .09
Standard Arabic 1
Republic of the Congo
French French .6, Lingala .12 Lingala .12 None
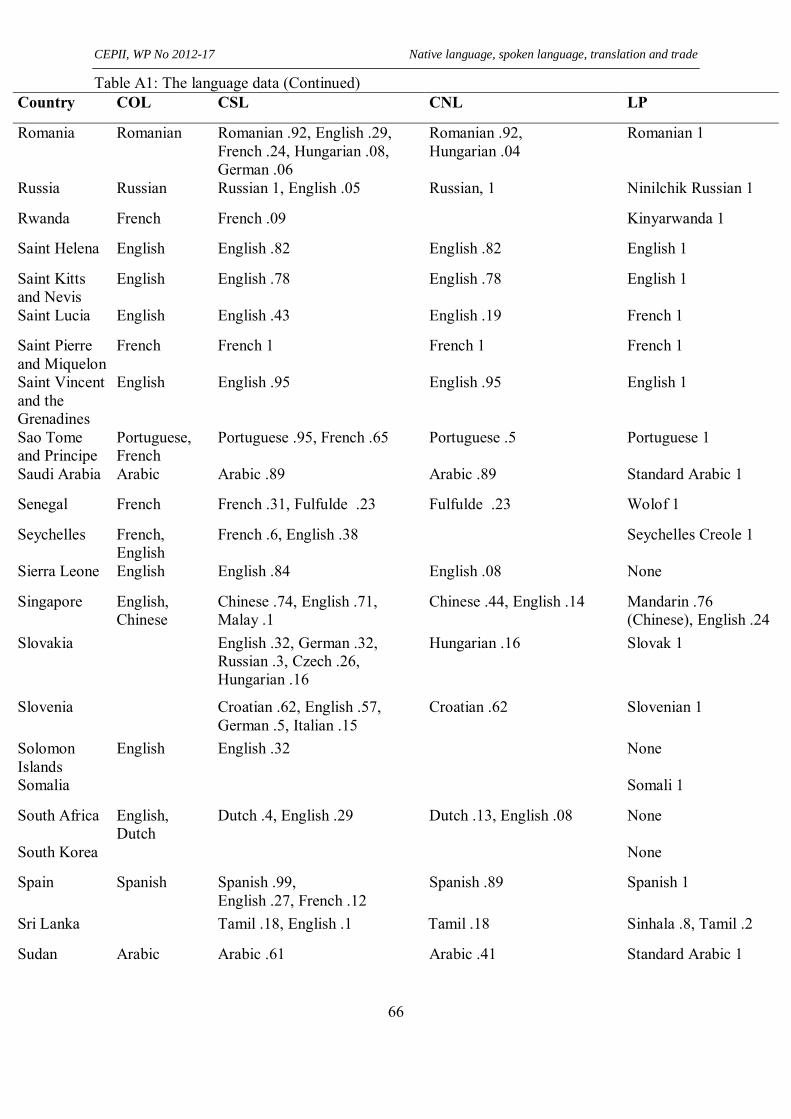
CEPII, WP No 2012-17 Native language, spoken language, translation and trade
66
Table A1: The language data (Continued) Country COL CSL CNL LP
Romania Romanian Romanian .92, English .29, French .24, Hungarian .08, German .06
Romanian .92, Hungarian .04
Romanian 1
Russia Russian Russian 1, English .05 Russian, 1 Ninilchik Russian 1
Rwanda French French .09 Kinyarwanda 1
Saint Helena English English .82 English .82 English 1
Saint Kitts and Nevis
English English .78 English .78 English 1
Saint Lucia English English .43 English .19 French 1
Saint Pierre and Miquelon
French French 1 French 1 French 1
Saint Vincent and the Grenadines
English English .95 English .95 English 1
Sao Tome and Principe
Portuguese, French
Portuguese .95, French .65 Portuguese .5 Portuguese 1
Saudi Arabia Arabic Arabic .89 Arabic .89 Standard Arabic 1
Senegal French French .31, Fulfulde .23 Fulfulde .23 Wolof 1
Seychelles French, English
French .6, English .38 Seychelles Creole 1
Sierra Leone English English .84 English .08 None
Singapore English, Chinese
Chinese .74, English .71, Malay .1
Chinese .44, English .14 Mandarin .76 (Chinese), English .24
Slovakia English .32, German .32, Russian .3, Czech .26, Hungarian .16
Hungarian .16 Slovak 1
Slovenia Croatian .62, English .57, German .5, Italian .15
Croatian .62 Slovenian 1
Solomon Islands
English English .32 None
Somalia Somali 1
South Africa English, Dutch
Dutch .4, English .29 Dutch .13, English .08 None
South Korea None
Spain Spanish Spanish .99, English .27, French .12
Spanish .89 Spanish 1
Sri Lanka Tamil .18, English .1 Tamil .18 Sinhala .8, Tamil .2
Sudan Arabic Arabic .61 Arabic .41 Standard Arabic 1
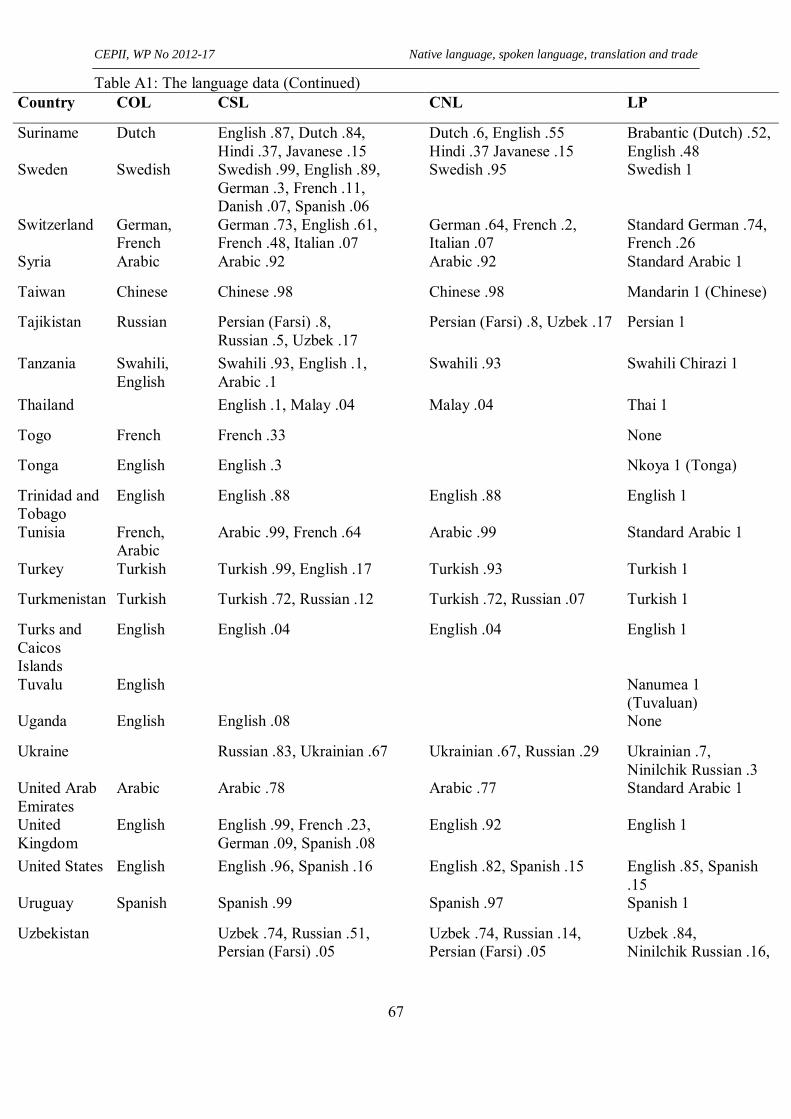
CEPII, WP No 2012-17 Native language, spoken language, translation and trade
67
Table A1: The language data (Continued) Country COL CSL CNL LP
Suriname Dutch English .87, Dutch .84, Hindi .37, Javanese .15
Dutch .6, English .55 Hindi .37 Javanese .15
Brabantic (Dutch) .52, English .48
Sweden Swedish Swedish .99, English .89, German .3, French .11, Danish .07, Spanish .06
Swedish .95 Swedish 1
Switzerland German, French
German .73, English .61, French .48, Italian .07
German .64, French .2, Italian .07
Standard German .74, French .26
Syria Arabic Arabic .92 Arabic .92 Standard Arabic 1
Taiwan Chinese Chinese .98 Chinese .98 Mandarin 1 (Chinese)
Tajikistan Russian Persian (Farsi) .8, Russian .5, Uzbek .17
Persian (Farsi) .8, Uzbek .17 Persian 1
Tanzania Swahili, English
Swahili .93, English .1, Arabic .1
Swahili .93 Swahili Chirazi 1
Thailand English .1, Malay .04 Malay .04 Thai 1
Togo French French .33 None
Tonga English English .3 Nkoya 1 (Tonga)
Trinidad and Tobago
English English .88 English .88 English 1
Tunisia French, Arabic
Arabic .99, French .64 Arabic .99 Standard Arabic 1
Turkey Turkish Turkish .99, English .17 Turkish .93 Turkish 1
Turkmenistan Turkish Turkish .72, Russian .12 Turkish .72, Russian .07 Turkish 1
Turks and Caicos Islands
English English .04 English .04 English 1
Tuvalu English Nanumea 1 (Tuvaluan)
Uganda English English .08 None
Ukraine Russian .83, Ukrainian .67 Ukrainian .67, Russian .29 Ukrainian .7, Ninilchik Russian .3
United Arab Emirates
Arabic Arabic .78 Arabic .77 Standard Arabic 1
United Kingdom
English English .99, French .23, German .09, Spanish .08
English .92 English 1
United States English English .96, Spanish .16 English .82, Spanish .15 English .85, Spanish .15
Uruguay Spanish Spanish .99 Spanish .97 Spanish 1
Uzbekistan Uzbek .74, Russian .51, Persian (Farsi) .05
Uzbek .74, Russian .14, Persian (Farsi) .05
Uzbek .84, Ninilchik Russian .16,
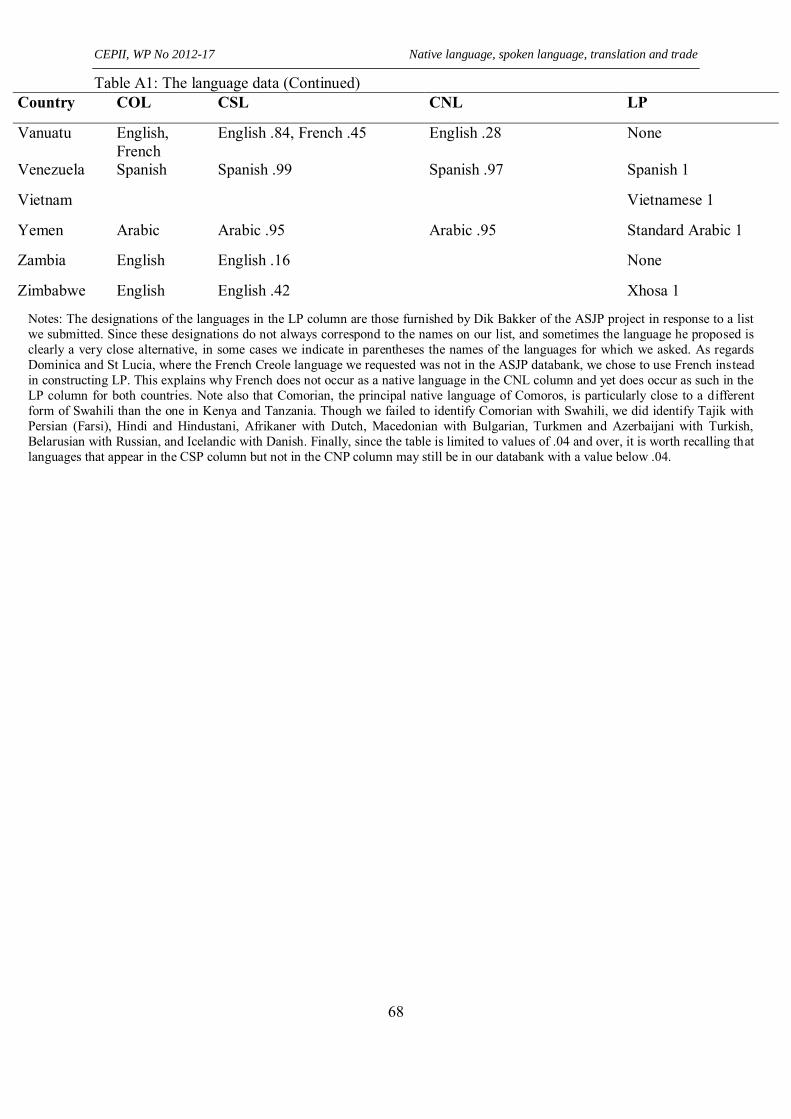
CEPII, WP No 2012-17 Native language, spoken language, translation and trade
68
Table A1: The language data (Continued) Country COL CSL CNL LP
Vanuatu English, French
English .84, French .45 English .28 None
Venezuela Spanish Spanish .99 Spanish .97 Spanish 1
Vietnam Vietnamese 1
Yemen Arabic Arabic .95 Arabic .95 Standard Arabic 1
Zambia English English .16 None
Zimbabwe English English .42 Xhosa 1
Notes: The designations of the languages in the LP column are those furnished by Dik Bakker of the ASJP project in response to a list we submitted. Since these designations do not always correspond to the names on our list, and sometimes the language he proposed is clearly a very close alternative, in some cases we indicate in parentheses the names of the languages for which we asked. As regards Dominica and St Lucia, where the French Creole language we requested was not in the ASJP databank, we chose to use French instead in constructing LP. This explains why French does not occur as a native language in the CNL column and yet does occur as such in the LP column for both countries. Note also that Comorian, the principal native language of Comoros, is particularly close to a different form of Swahili than the one in Kenya and Tanzania. Though we failed to identify Comorian with Swahili, we did identify Tajik with Persian (Farsi), Hindi and Hindustani, Afrikaner with Dutch, Macedonian with Bulgarian, Turkmen and Azerbaijani with Turkish, Belarusian with Russian, and Icelandic with Danish. Finally, since the table is limited to values of .04 and over, it is worth recalling that languages that appear in the CSP column but not in the CNP column may still be in our databank with a value below .04.
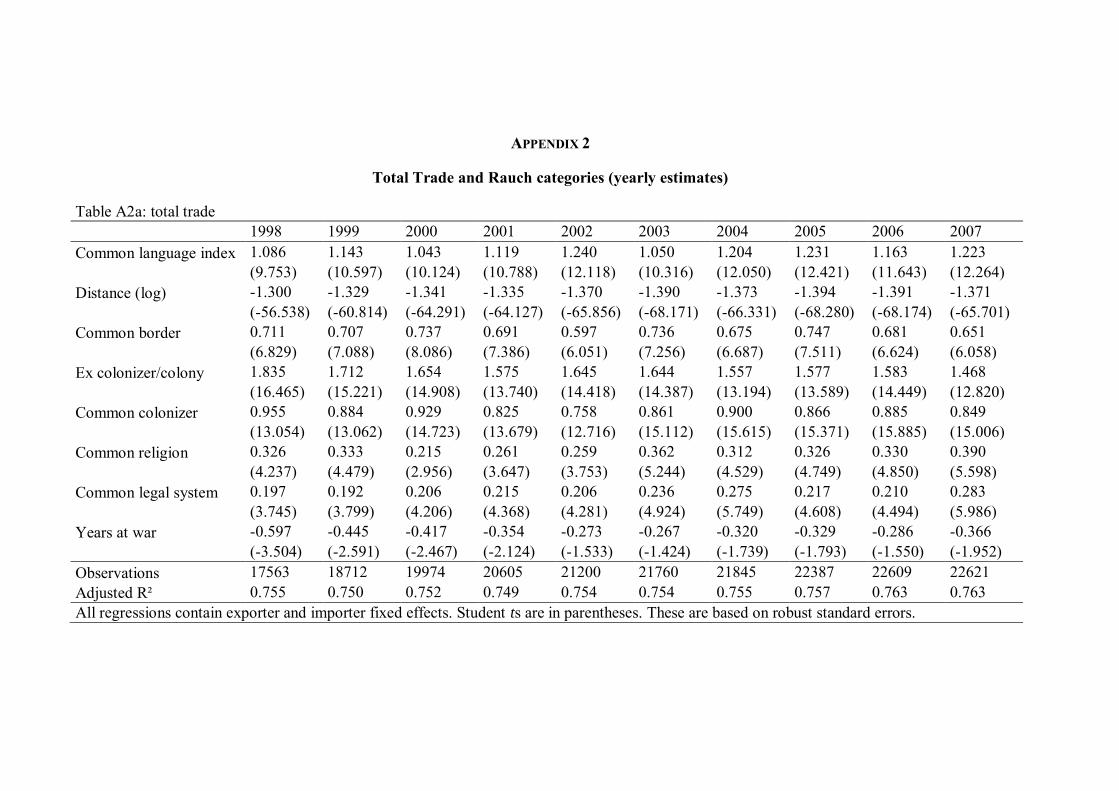
APPENDIX 2
Total Trade and Rauch categories (yearly estimates)
Table A2a: total trade 1998 1999 2000 2001 2002 2003 2004 2005 2006 2007 Common language index 1.086 1.143 1.043 1.119 1.240 1.050 1.204 1.231 1.163 1.223 (9.753) (10.597) (10.124) (10.788) (12.118) (10.316) (12.050) (12.421) (11.643) (12.264) Distance (log) -1.300 -1.329 -1.341 -1.335 -1.370 -1.390 -1.373 -1.394 -1.391 -1.371 (-56.538) (-60.814) (-64.291) (-64.127) (-65.856) (-68.171) (-66.331) (-68.280) (-68.174) (-65.701) Common border 0.711 0.707 0.737 0.691 0.597 0.736 0.675 0.747 0.681 0.651 (6.829) (7.088) (8.086) (7.386) (6.051) (7.256) (6.687) (7.511) (6.624) (6.058) Ex colonizer/colony 1.835 1.712 1.654 1.575 1.645 1.644 1.557 1.577 1.583 1.468 (16.465) (15.221) (14.908) (13.740) (14.418) (14.387) (13.194) (13.589) (14.449) (12.820) Common colonizer 0.955 0.884 0.929 0.825 0.758 0.861 0.900 0.866 0.885 0.849 (13.054) (13.062) (14.723) (13.679) (12.716) (15.112) (15.615) (15.371) (15.885) (15.006) Common religion 0.326 0.333 0.215 0.261 0.259 0.362 0.312 0.326 0.330 0.390 (4.237) (4.479) (2.956) (3.647) (3.753) (5.244) (4.529) (4.749) (4.850) (5.598) Common legal system 0.197 0.192 0.206 0.215 0.206 0.236 0.275 0.217 0.210 0.283 (3.745) (3.799) (4.206) (4.368) (4.281) (4.924) (5.749) (4.608) (4.494) (5.986) Years at war -0.597 -0.445 -0.417 -0.354 -0.273 -0.267 -0.320 -0.329 -0.286 -0.366 (-3.504) (-2.591) (-2.467) (-2.124) (-1.533) (-1.424) (-1.739) (-1.793) (-1.550) (-1.952) Observations 17563 18712 19974 20605 21200 21760 21845 22387 22609 22621 Adjusted R² 0.755 0.750 0.752 0.749 0.754 0.754 0.755 0.757 0.763 0.763 All regressions contain exporter and importer fixed effects. Student ts are in parentheses. These are based on robust standard errors.
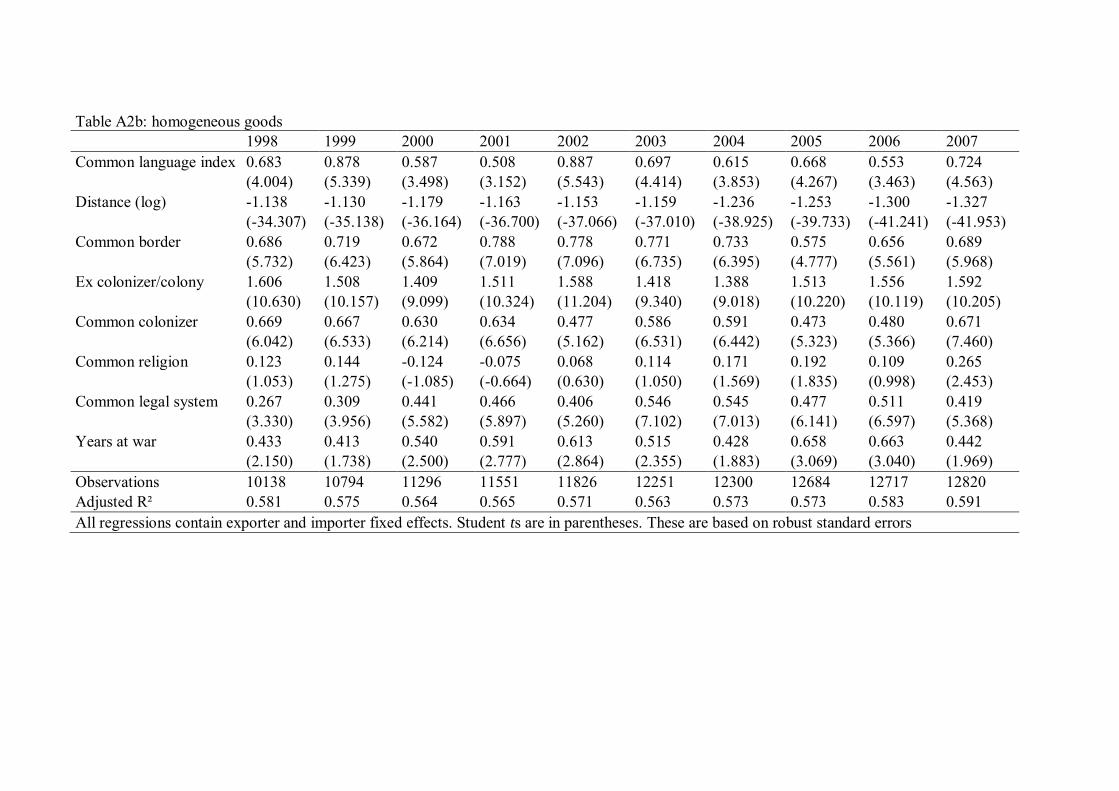
Table A2b: homogeneous goods 1998 1999 2000 2001 2002 2003 2004 2005 2006 2007 Common language index 0.683 0.878 0.587 0.508 0.887 0.697 0.615 0.668 0.553 0.724 (4.004) (5.339) (3.498) (3.152) (5.543) (4.414) (3.853) (4.267) (3.463) (4.563) Distance (log) -1.138 -1.130 -1.179 -1.163 -1.153 -1.159 -1.236 -1.253 -1.300 -1.327 (-34.307) (-35.138) (-36.164) (-36.700) (-37.066) (-37.010) (-38.925) (-39.733) (-41.241) (-41.953) Common border 0.686 0.719 0.672 0.788 0.778 0.771 0.733 0.575 0.656 0.689 (5.732) (6.423) (5.864) (7.019) (7.096) (6.735) (6.395) (4.777) (5.561) (5.968) Ex colonizer/colony 1.606 1.508 1.409 1.511 1.588 1.418 1.388 1.513 1.556 1.592 (10.630) (10.157) (9.099) (10.324) (11.204) (9.340) (9.018) (10.220) (10.119) (10.205) Common colonizer 0.669 0.667 0.630 0.634 0.477 0.586 0.591 0.473 0.480 0.671 (6.042) (6.533) (6.214) (6.656) (5.162) (6.531) (6.442) (5.323) (5.366) (7.460) Common religion 0.123 0.144 -0.124 -0.075 0.068 0.114 0.171 0.192 0.109 0.265 (1.053) (1.275) (-1.085) (-0.664) (0.630) (1.050) (1.569) (1.835) (0.998) (2.453) Common legal system 0.267 0.309 0.441 0.466 0.406 0.546 0.545 0.477 0.511 0.419 (3.330) (3.956) (5.582) (5.897) (5.260) (7.102) (7.013) (6.141) (6.597) (5.368) Years at war 0.433 0.413 0.540 0.591 0.613 0.515 0.428 0.658 0.663 0.442 (2.150) (1.738) (2.500) (2.777) (2.864) (2.355) (1.883) (3.069) (3.040) (1.969) Observations 10138 10794 11296 11551 11826 12251 12300 12684 12717 12820 Adjusted R² 0.581 0.575 0.564 0.565 0.571 0.563 0.573 0.573 0.583 0.591 All regressions contain exporter and importer fixed effects. Student ts are in parentheses. These are based on robust standard errors
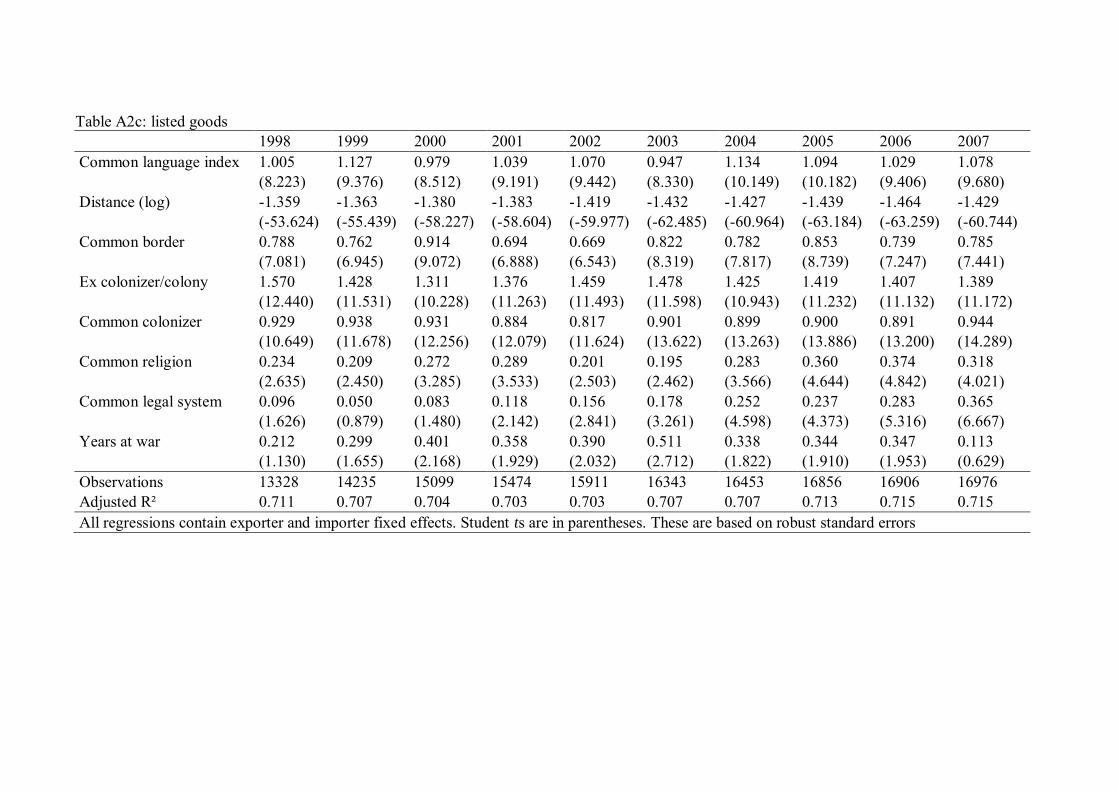
Table A2c: listed goods 1998 1999 2000 2001 2002 2003 2004 2005 2006 2007 Common language index 1.005 1.127 0.979 1.039 1.070 0.947 1.134 1.094 1.029 1.078 (8.223) (9.376) (8.512) (9.191) (9.442) (8.330) (10.149) (10.182) (9.406) (9.680) Distance (log) -1.359 -1.363 -1.380 -1.383 -1.419 -1.432 -1.427 -1.439 -1.464 -1.429 (-53.624) (-55.439) (-58.227) (-58.604) (-59.977) (-62.485) (-60.964) (-63.184) (-63.259) (-60.744) Common border 0.788 0.762 0.914 0.694 0.669 0.822 0.782 0.853 0.739 0.785 (7.081) (6.945) (9.072) (6.888) (6.543) (8.319) (7.817) (8.739) (7.247) (7.441) Ex colonizer/colony 1.570 1.428 1.311 1.376 1.459 1.478 1.425 1.419 1.407 1.389 (12.440) (11.531) (10.228) (11.263) (11.493) (11.598) (10.943) (11.232) (11.132) (11.172) Common colonizer 0.929 0.938 0.931 0.884 0.817 0.901 0.899 0.900 0.891 0.944 (10.649) (11.678) (12.256) (12.079) (11.624) (13.622) (13.263) (13.886) (13.200) (14.289) Common religion 0.234 0.209 0.272 0.289 0.201 0.195 0.283 0.360 0.374 0.318 (2.635) (2.450) (3.285) (3.533) (2.503) (2.462) (3.566) (4.644) (4.842) (4.021) Common legal system 0.096 0.050 0.083 0.118 0.156 0.178 0.252 0.237 0.283 0.365 (1.626) (0.879) (1.480) (2.142) (2.841) (3.261) (4.598) (4.373) (5.316) (6.667) Years at war 0.212 0.299 0.401 0.358 0.390 0.511 0.338 0.344 0.347 0.113 (1.130) (1.655) (2.168) (1.929) (2.032) (2.712) (1.822) (1.910) (1.953) (0.629) Observations 13328 14235 15099 15474 15911 16343 16453 16856 16906 16976 Adjusted R² 0.711 0.707 0.704 0.703 0.703 0.707 0.707 0.713 0.715 0.715 All regressions contain exporter and importer fixed effects. Student ts are in parentheses. These are based on robust standard errors
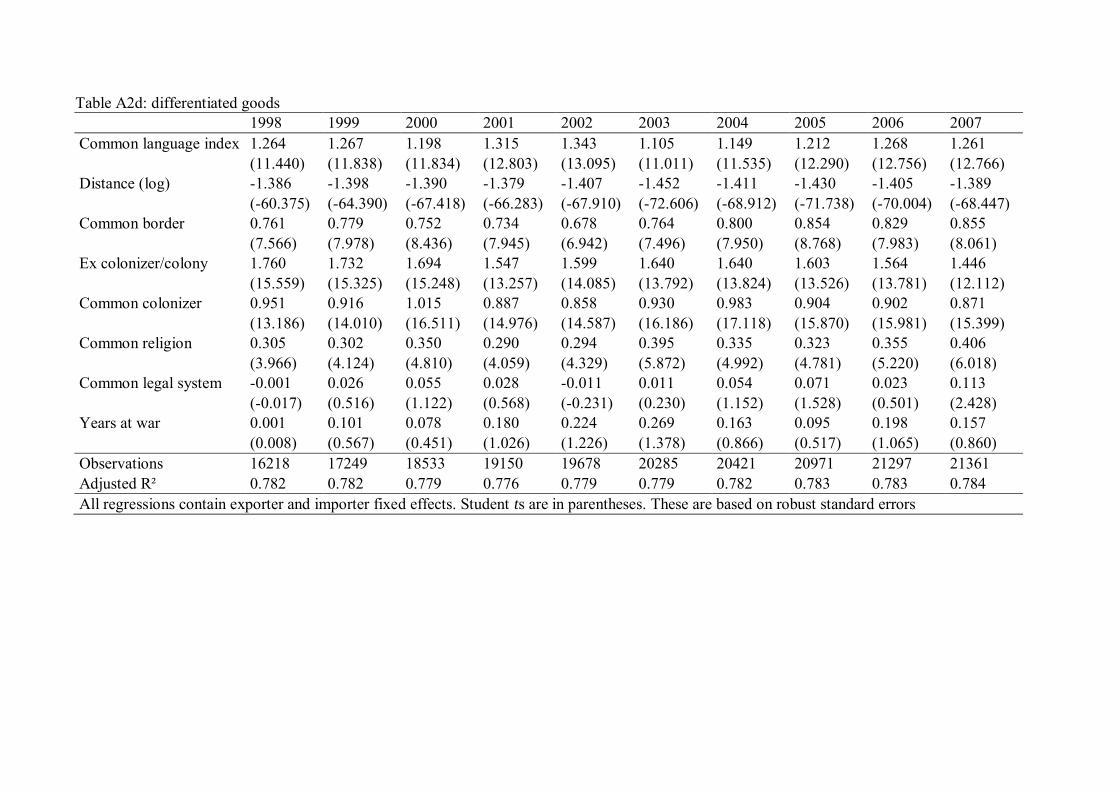
Table A2d: differentiated goods 1998 1999 2000 2001 2002 2003 2004 2005 2006 2007 Common language index 1.264 1.267 1.198 1.315 1.343 1.105 1.149 1.212 1.268 1.261 (11.440) (11.838) (11.834) (12.803) (13.095) (11.011) (11.535) (12.290) (12.756) (12.766) Distance (log) -1.386 -1.398 -1.390 -1.379 -1.407 -1.452 -1.411 -1.430 -1.405 -1.389 (-60.375) (-64.390) (-67.418) (-66.283) (-67.910) (-72.606) (-68.912) (-71.738) (-70.004) (-68.447) Common border 0.761 0.779 0.752 0.734 0.678 0.764 0.800 0.854 0.829 0.855 (7.566) (7.978) (8.436) (7.945) (6.942) (7.496) (7.950) (8.768) (7.983) (8.061) Ex colonizer/colony 1.760 1.732 1.694 1.547 1.599 1.640 1.640 1.603 1.564 1.446 (15.559) (15.325) (15.248) (13.257) (14.085) (13.792) (13.824) (13.526) (13.781) (12.112) Common colonizer 0.951 0.916 1.015 0.887 0.858 0.930 0.983 0.904 0.902 0.871 (13.186) (14.010) (16.511) (14.976) (14.587) (16.186) (17.118) (15.870) (15.981) (15.399) Common religion 0.305 0.302 0.350 0.290 0.294 0.395 0.335 0.323 0.355 0.406 (3.966) (4.124) (4.810) (4.059) (4.329) (5.872) (4.992) (4.781) (5.220) (6.018) Common legal system -0.001 0.026 0.055 0.028 -0.011 0.011 0.054 0.071 0.023 0.113 (-0.017) (0.516) (1.122) (0.568) (-0.231) (0.230) (1.152) (1.528) (0.501) (2.428) Years at war 0.001 0.101 0.078 0.180 0.224 0.269 0.163 0.095 0.198 0.157 (0.008) (0.567) (0.451) (1.026) (1.226) (1.378) (0.866) (0.517) (1.065) (0.860) Observations 16218 17249 18533 19150 19678 20285 20421 20971 21297 21361 Adjusted R² 0.782 0.782 0.779 0.776 0.779 0.779 0.782 0.783 0.783 0.784 All regressions contain exporter and importer fixed effects. Student ts are in parentheses. These are based on robust standard errors
CEPII, WP No 2012-17 Native language, spoken language, translation and trade
75
APPENDIX 3
The zeros for bilateral trade
One possible problem in our study is selection bias. Suppose that the influence of language in our estimates depended on our automatic exclusion of the zeros through our choice of a log-linear specification. In effect, this would mean that language has virtually no role in explaining the zeros and is only significant because we drop them.
As a response, we can select the countries in our sample on the basis of size of GNP instead. It so happens (though it need not have) that the countries with the 50 largest GNPs trade with nearly all of the other 49. Of the 24,500 possible observations, 24,312 remain, and the zeros constitute less than 1%. There are therefore few zeros quite independently of our choice of a log-linear specification. If language is strictly significant for positive trade values, language will still remain significant in our tests. However, if instead language does play a role in explaining the zeros, the coefficient of language might be expected to fall though remaining significant. The reason is that the trade values for the 50 largest countries are much higher on average than in the complete sample. Therefore, any fixed costs resulting from linguistic frictions would play a smaller relative role. Those fixed costs might be expected to fall in proportion to trade as trade values rise. We might therefore expect lower coefficients of language to follow.
The results are in Table A3. The coefficients of COL, CSL and CNL indeed fall though remaining highly significant. They also retain the same relative order as before. Once the three variables appear together, with or without LP, though, they are no longer simultaneously significant. This is not surprising since the variance of the linguistic factors, on which we depend in order to be able to identify three, if not four, separate linguistic influences at once, is now much lower than before in the individual-year estimates (and therefore also in the panel estimates). Notwithstanding, the one linguistic influence that remains significant at the .05 confidence level or close to it is CSL, in conformity with our analysis. There is nothing here to comfort the idea that by choosing a specification that automatically drops the zeros, we fortify the impact of language.
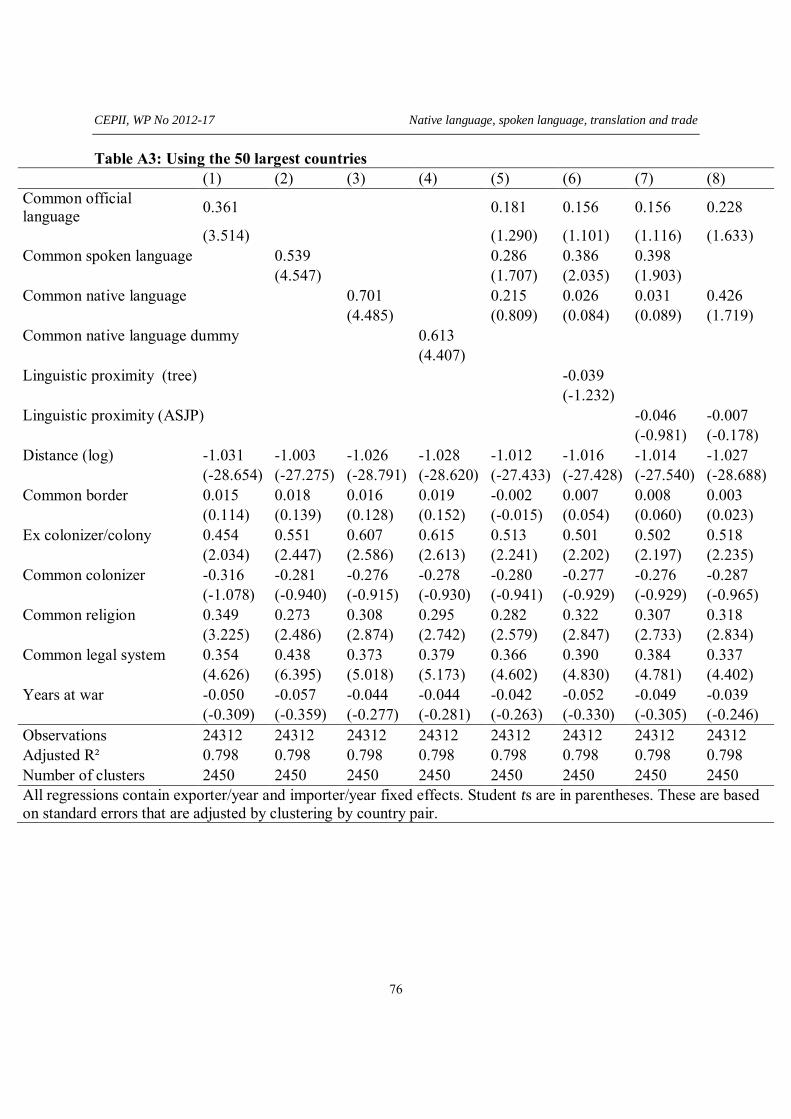
CEPII, WP No 2012-17 Native language, spoken language, translation and trade
76
Table A3: Using the 50 largest countries (1) (2) (3) (4) (5) (6) (7) (8) Common official language 0.361 0.181 0.156 0.156 0.228
(3.514) (1.290) (1.101) (1.116) (1.633) Common spoken language 0.539 0.286 0.386 0.398 (4.547) (1.707) (2.035) (1.903) Common native language 0.701 0.215 0.026 0.031 0.426 (4.485) (0.809) (0.084) (0.089) (1.719) Common native language dummy 0.613 (4.407) Linguistic proximity (tree) -0.039 (-1.232) Linguistic proximity (ASJP) -0.046 -0.007 (-0.981) (-0.178) Distance (log) -1.031 -1.003 -1.026 -1.028 -1.012 -1.016 -1.014 -1.027 (-28.654) (-27.275) (-28.791) (-28.620) (-27.433) (-27.428) (-27.540) (-28.688) Common border 0.015 0.018 0.016 0.019 -0.002 0.007 0.008 0.003 (0.114) (0.139) (0.128) (0.152) (-0.015) (0.054) (0.060) (0.023) Ex colonizer/colony 0.454 0.551 0.607 0.615 0.513 0.501 0.502 0.518 (2.034) (2.447) (2.586) (2.613) (2.241) (2.202) (2.197) (2.235) Common colonizer -0.316 -0.281 -0.276 -0.278 -0.280 -0.277 -0.276 -0.287 (-1.078) (-0.940) (-0.915) (-0.930) (-0.941) (-0.929) (-0.929) (-0.965) Common religion 0.349 0.273 0.308 0.295 0.282 0.322 0.307 0.318 (3.225) (2.486) (2.874) (2.742) (2.579) (2.847) (2.733) (2.834) Common legal system 0.354 0.438 0.373 0.379 0.366 0.390 0.384 0.337 (4.626) (6.395) (5.018) (5.173) (4.602) (4.830) (4.781) (4.402) Years at war -0.050 -0.057 -0.044 -0.044 -0.042 -0.052 -0.049 -0.039 (-0.309) (-0.359) (-0.277) (-0.281) (-0.263) (-0.330) (-0.305) (-0.246) Observations 24312 24312 24312 24312 24312 24312 24312 24312 Adjusted R² 0.798 0.798 0.798 0.798 0.798 0.798 0.798 0.798 Number of clusters 2450 2450 2450 2450 2450 2450 2450 2450 All regressions contain exporter/year and importer/year fixed effects. Student ts are in parentheses. These are based on standard errors that are adjusted by clustering by country pair.
CEPII, WP No 2012-17 Native language, spoken language, translation and trade
77
LIST OF WORKING PAPERS RELEASED BY CEPII
An Exhaustive list is available on the website: \\www.cepii.fr.
No Tittle Authors
2012-16 Assessing the Price-Raising Effect of Non-Tariff Measures in Africa
O.Cadot & J.Gourdon
2012-15 International Migration and Trade Agreements: the New Role of PTAs
G. Orefice
2012-14 Scanning the Ups and Downs of China’s Trade Imbalances
F. Lemoine & D. Ünal
2012-13 Revisiting the Theory of Optimum Currency Areas: Is the CFA Franc Zone Sustainable?
C. Couharde, I. Coulibaly, D. Guerreiro
& V. Mignon
2012-12 Macroeconomic Transmission of Eurozone Shocks to Emerging Economies
B. Erten
2012-11 The fiscal Impact of Immigration in France: a Generational Accounting Approach
X. Chojnicki
2012-10 MAcMap-HS6 2007, an Exhaustive and Consistent Measure of Applied Protection in 2007
H. Guimbard, S. Jean, M. Mimouni & X. Pichot
2012-09 Regional Integration and Natural Resources: Who Benefits? Evidence from MENA
C. Carrère, J. Gourdon & M. Olarreaga
2012-08 A Foreign Direct Investment Database for Global CGE Models
C. Gouël, H. Guimbard & D. Laborde
2012-07 On Currency Misalignments within the Euro Area V. Coudert, C. Couharde & V. Mignon
2012-06 How Frequently Firms Export? Evidence from France G. Békés, L. Fontagné, B. Muraközy & V. Vicard
CEPII, WP No 2012-17 Native language, spoken language, translation and trade
78
No Tittle Authors
2012-05 Fiscal Sustainability in the Presence of Systemic Banks: the Case of EU Countries
A. Bénassy-Quéré & G. Roussellet
2012-04 Low-Wage Countries’ Competition, Reallocation across Firms and the Quality Content of Exports
J. Martin & I. Méjean
2012-03 The Great Shift: Macroeconomic Projections for the World Economy at the 2050 Horizon
J. Fouré, A. Bénassy-Quéré
& L. Fontagné
2012-02 The Discriminatory E_ect of Domestic Regulations on International Services Trade: Evidence from Firm-Level Data
M. Crozet, E. Milet & D. Mirza
2012-01 Optimal food price stabilization in a small open developing country
C. Gouël & S. Jean
2011-33 Export Dynamics and Sales at Home N. Berman, A. Berthou & J. Héricourt
2011-32 Entry on Difficult Export Markets by Chinese Domestic Firms: The Role of Foreign Export Spillovers
F. Mayneris & S. Poncet
2011-31 French Firms at the Conquest of Asian Markets: The Role of Export Spillovers
F. Mayneris & S. Poncet
2011-30 Environmental Policy and Trade Performance: Evidence from China
L. Hering & S. Poncet
2011-29 Immigration, Unemployment and GDP in the Host Country: Bootstrap Panel Granger Causality Analysis on OECD Countries
E. Boubtane D. Coulibaly & C. Rault
2011-28 Index Trading and Agricultural Commodity Prices: A Panel Granger Causality Analysis
G. Capelle-Blancard & D. Coulibaly
2011-27 The Impossible Trinity Revised: An Application to China
B. Carton
2011-26 Isolating the Network Effect of Immigrants on Trade M. Aleksynska & G. Peri
CEPII, WP No 2012-17 Native language, spoken language, translation and trade
79
No Tittle Authors
2011-25 Notes on CEPII’s Distances Measures: The GeoDist Database
T. Mayer & S. Zignago
2011-24 Estimations of Tariff Equivalents for the Services Sectors
L. Fontagné, A. Guillin & C. Mitaritonna
2011-23 Economic Impact of Potential Outcome of the DDA Y. Decreux & L. Fontagné
2011-22 More Bankers, more Growth? Evidence from OECD Countries
G. Capelle-Blancard & C. Labonne
2011-21 EMU, EU, Market Integration and Consumption Smoothing
A. Christev & J. Mélitz
2011-20 Real Time Data and Fiscal Policy Analysis J. Cimadomo
2011-19 On the inclusion of the Chinese renminbi in the SDR basket
A. Bénassy-Quéré & D. Capelle
2011-18 Unilateral trade reform, Market Access and Foreign Competition: the Patterns of Multi-Product Exporters
M. Bas & P. Bombarda
2011-17 The “ Forward Premium Puzzle” and the Sovereign Default Risk
V. Coudert & V. Mignon
2011-16 Occupation-Education Mismatch of Immigrant Workers in Europe: Context and Policies
M. Aleksynska & A. Tritah
2011-15 Does Importing More Inputs Raise Exports? Firm Level Evidence from France
M. Bas & V. Strauss-Kahn
2011-14 Joint Estimates of Automatic and Discretionary Fiscal Policy: the OECD 1981-2003
J. Darby & J. Mélitz
2011-13 Immigration, vieillissement démographique et financement de la protection sociale : une évaluation par l’équilibre général calculable appliqué à la France
X. Chojnicki & L. Ragot
2011-12 The Performance of Socially Responsible Funds: Does the Screening Process Matter?
G. Capelle-Blancard & S. Monjon
CEPII, WP No 2012-17 Native language, spoken language, translation and trade
80
No Tittle Authors
2011-11 Market Size, Competition, and the Product Mix of Exporters
T. Mayer, M. Melitz & G. Ottaviano
2011-10 The Trade Unit Values Database A. Berthou & C. Emlinger
2011-09 Carbon Price Drivers: Phase I versus Phase II Equilibrium
A. Creti, P.-A. Jouvet & V. Mignon
2011-08 Rebalancing Growth in China: An International Perspective
A. Bénassy-Quéré, B. Carton & L. Gauvin
2011-07 Economic Integration in the EuroMed: Current Status and Review of Studies
J. Jarreau
2011-06 The Decision to Import Capital Goods in India: Firms' Financial Factors Matter
A. Berthou & M. Bas
2011-05 FDI from the South: the Role of Institutional Distance and Natural Resources
M. Aleksynska & O. Havrylchyk
2011-04b What International Monetary System for a fast-changing World Economy?
A. Bénassy-Quéré & J. Pisani-Ferry
2011-04a Quel système monétaire international pour une économie mondiale en mutation rapide ?
A. Bénassy-Quéré & J. Pisani-Ferry
2011-03 China’s Foreign Trade in the Perspective of a more Balanced Economic Growth
G. Gaulier, F. Lemoine & D. Ünal
2011-02 The Interactions between the Credit Default Swap and the Bond Markets in Financial Turmoil
V. Coudert & M. Gex
2011-01 Comparative Advantage and Within-Industry Firms Performance
M. Crozet & F. Trionfetti
Organisme public d’étude et de recherche en économie internationale, le CEPII est placé auprès du Centre d’Analyse Stratégique. Son programme de travail est fixé par un conseil composé de responsables de l’administration et de personnalités issues des entreprises, des organisations syndicales et de l’Université.
Les documents de travail du CEPII mettent à disposition du public professionnel des travaux effectués au CEPII, dans leur phase d’élaboration et de discussion avant publication définitive. Les documents de
travail sont publiés sous la responsabilité de la direction du CEPII et n’engagent ni le conseil du Centre, ni le Centre d’Analyse Stratégique. Les opinions qui y sont exprimées sont celles des auteurs.
Les documents de travail du CEPII sont disponibles sur le site : http//www.cepii.fr.