Embed Size (px)
DESCRIPTION
National Rural Health Mission (NRHM). Review Meeting with State’s Health Secretaries, Mission Directors & Directors of Health Services. 11 th & 12 th Sept. 2012 --- JS (Policy). ACHIEVEMENTS, SO FAR…. Status of Drop in MMR (in points) from 2004-06 to 2007-09. - PowerPoint PPT Presentation
Citation preview
1
Nati onal Rural Health Mission (NRHM)
Review Meeting with State’s Health Secretaries, Mission Directors &
Directors of Health Services11th& 12th Sept. 2012
--- JS (Policy)
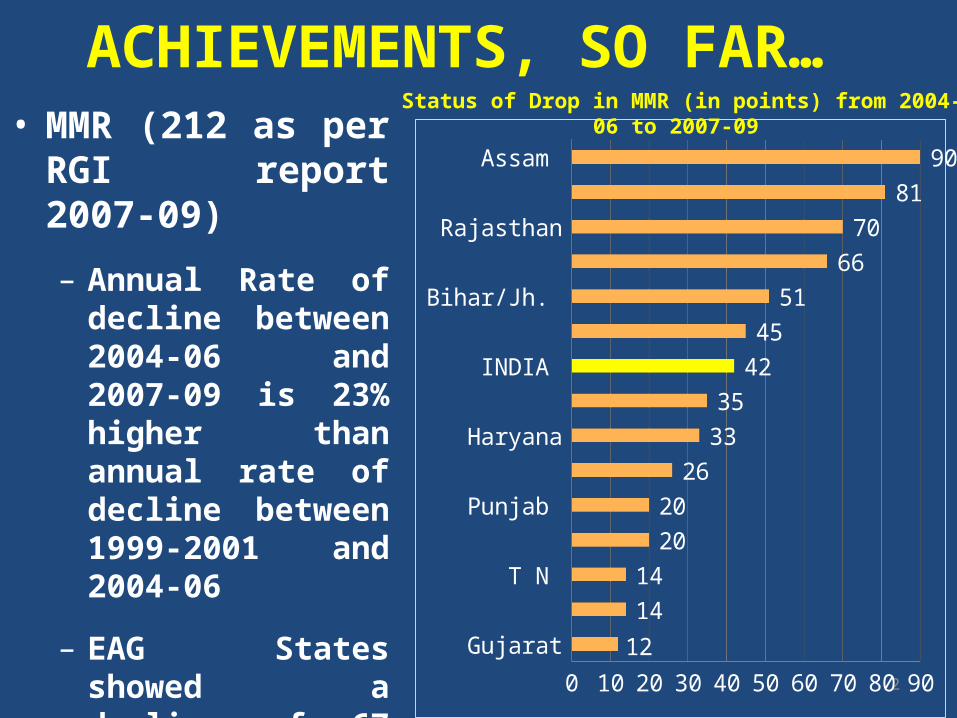
• MMR (212 as per RGI report 2007-09)
– Annual Rate of decline between 2004-06 and 2007-09 is 23% higher than annual rate of decline between 1999-2001 and 2004-06
– EAG States showed a decline of 67 points in MMR (in 2007-09 compared to 2004-06) against a National Decline of 42 points 2
GujaratKerala
T N Andra Pradesh
Punjab Maharashtra
HaryanaKarnataka
INDIA Orissa
Bihar/Jh. M P/Chhattisgarh
RajasthanU P/Uttarakhand
Assam
0 10 20 30 40 50 60 70 80 9012
1414
2020
263335
4245
5166
7081
90
Status of Drop in MMR (in points) from 2004-06 to 2007-09
ACHIEVEMENTS, SO FAR…
• IMR reduced from 58 in 2005 to 47 as per SRS 2010
– Rate of Decline of IMR accelerated by 29 % between 2005-10 as compared to 2000-2005
– Decline in Rural IMR and U5MR is higher than the decline in urban areas, thereby narrowing the Rural - Urban Gap
– Decline of U5MR & IMR is more in EAG States
• India has remained free of Wild Polio for more than a year
3
ACHIEVEMENTS, SO FAR…
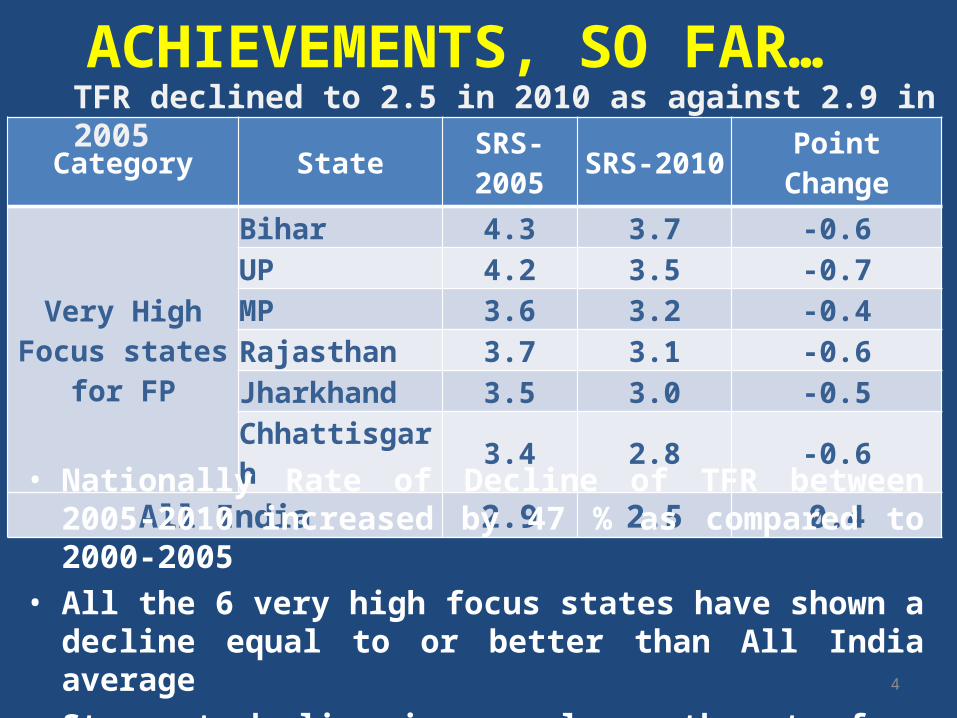
Category State SRS-2005 SRS-2010 Point Change
Very High Focus states for FP
Bihar 4.3 3.7 -0.6UP 4.2 3.5 -0.7MP 3.6 3.2 -0.4Rajasthan 3.7 3.1 -0.6Jharkhand 3.5 3.0 -0.5Chhattisgarh 3.4 2.8 -0.6
All India 2.9 2.5 0.4
• Nationally Rate of Decline of TFR between 2005-2010 increased by 47 % as compared to 2000-2005
• All the 6 very high focus states have shown a decline equal to or better than All India average
• Steepest decline in annual growth rate from 1.97 to 1.64 since independence 4
TFR declined to 2.5 in 2010 as against 2.9 in 2005 ACHIEVEMENTS, SO FAR…
5
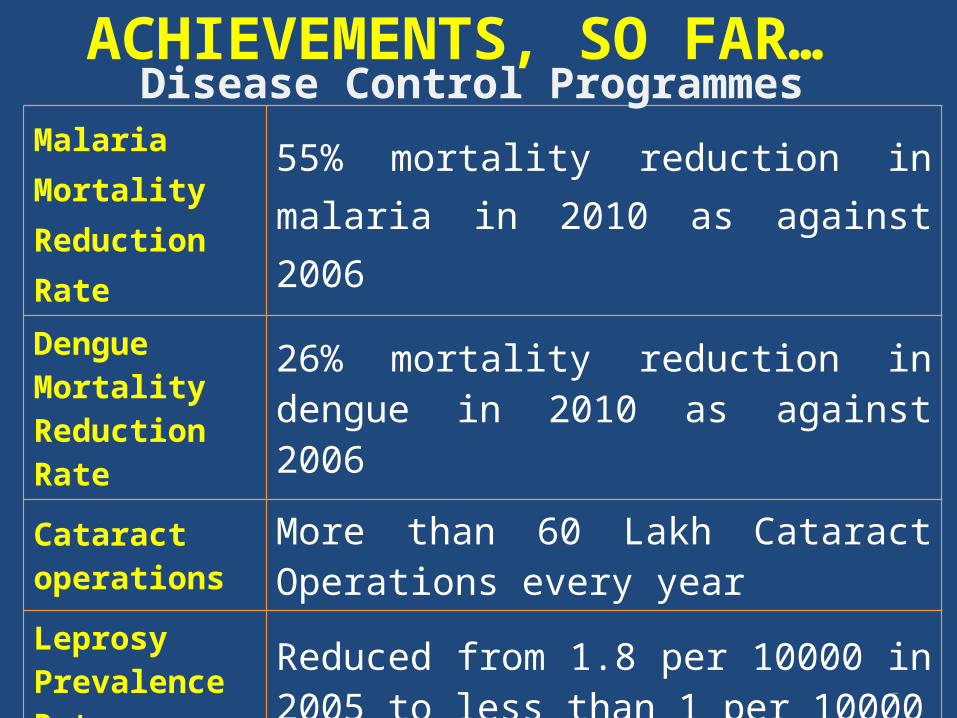
Malaria Mortality Reduction Rate
55% mortality reduction in malaria in 2010 as against 2006
Dengue Mortality Reduction Rate
26% mortality reduction in dengue in 2010 as against 2006
Cataract operations
More than 60 Lakh Cataract Operations every year
Leprosy Prevalence Rate
Reduced from 1.8 per 10000 in 2005 to less than 1 per 10000
Tuberculosis 73% case detection rate and 88% Cure rate
Disease Control ProgrammesACHIEVEMENTS, SO FAR…
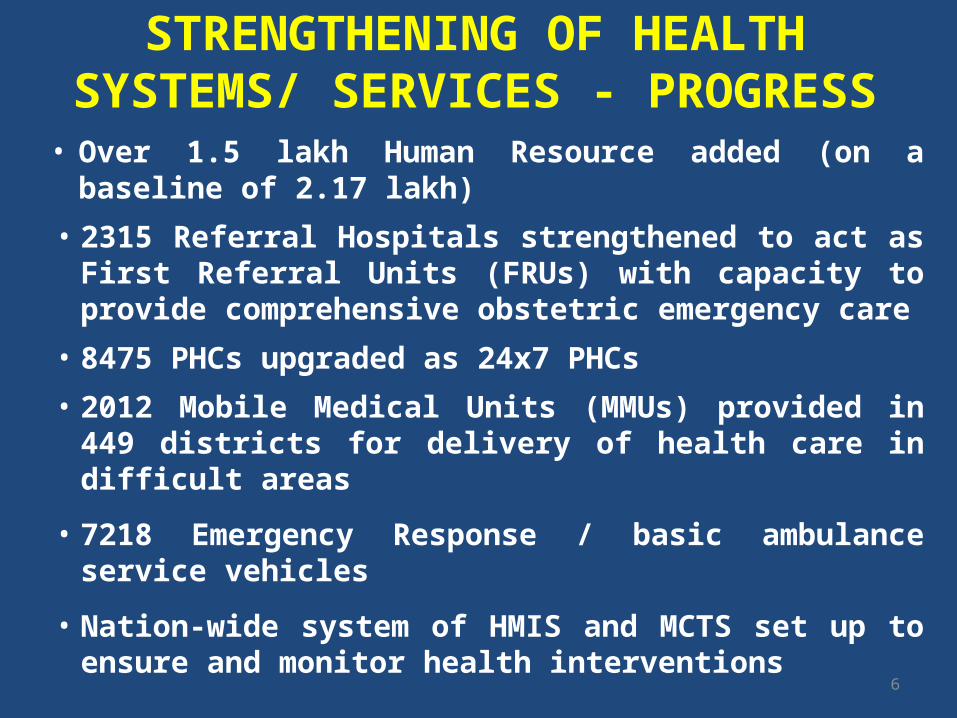
STRENGTHENING OF HEALTH SYSTEMS/ SERVICES - PROGRESS
• Over 1.5 lakh Human Resource added (on a baseline of 2.17 lakh)
• 2315 Referral Hospitals strengthened to act as First Referral Units (FRUs) with capacity to provide comprehensive obstetric emergency care
• 8475 PHCs upgraded as 24x7 PHCs
• 2012 Mobile Medical Units (MMUs) provided in 449 districts for delivery of health care in difficult areas
• 7218 Emergency Response / basic ambulance service vehicles
• Nation-wide system of HMIS and MCTS set up to ensure and monitor health interventions 6

HOWEVER…
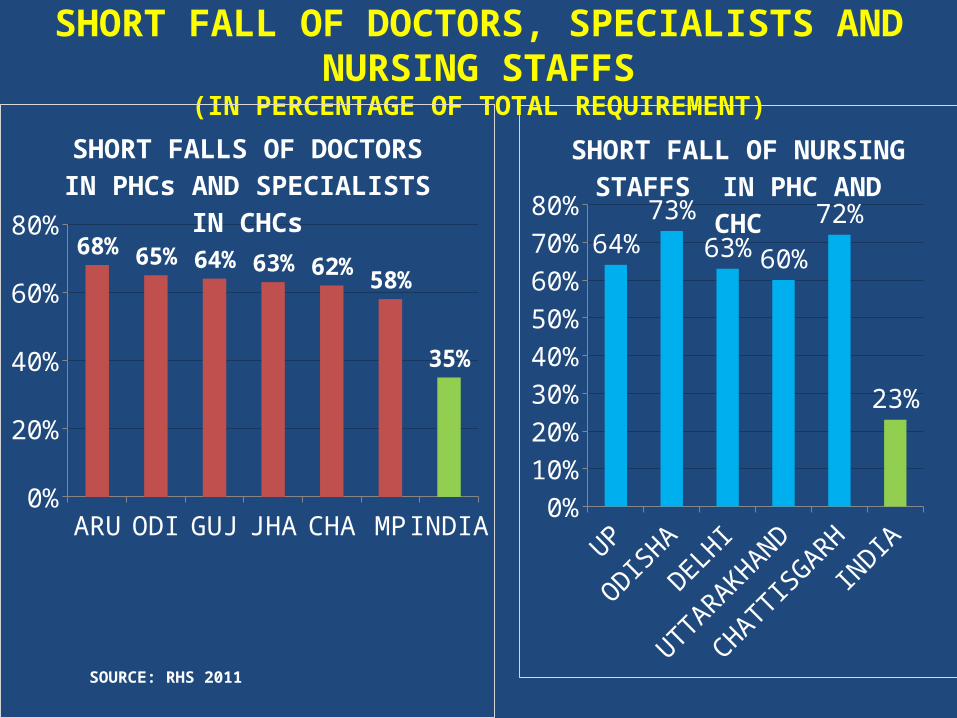
UP
ODISHA
DELHI
UTTARAKHAND
CHATTISGARH
INDIA
0%10%20%30%40%50%60%70%80%
64%73%
63% 60%
72%
23%
SHORT FALL OF NURSING STAFFS IN PHC AND CHC
SHORT FALL OF DOCTORS, SPECIALISTS AND NURSING STAFFS(IN PERCENTAGE OF TOTAL REQUIREMENT)
SOURCE: RHS 2011
ARU ODI GUJ JHA CHA MP INDIA0%
10%20%30%40%50%60%70%80%
68% 65% 64% 63% 62% 58%
35%
SHORT FALLS OF DOCTORS IN PHCs AND SPECIALISTS IN CHCs
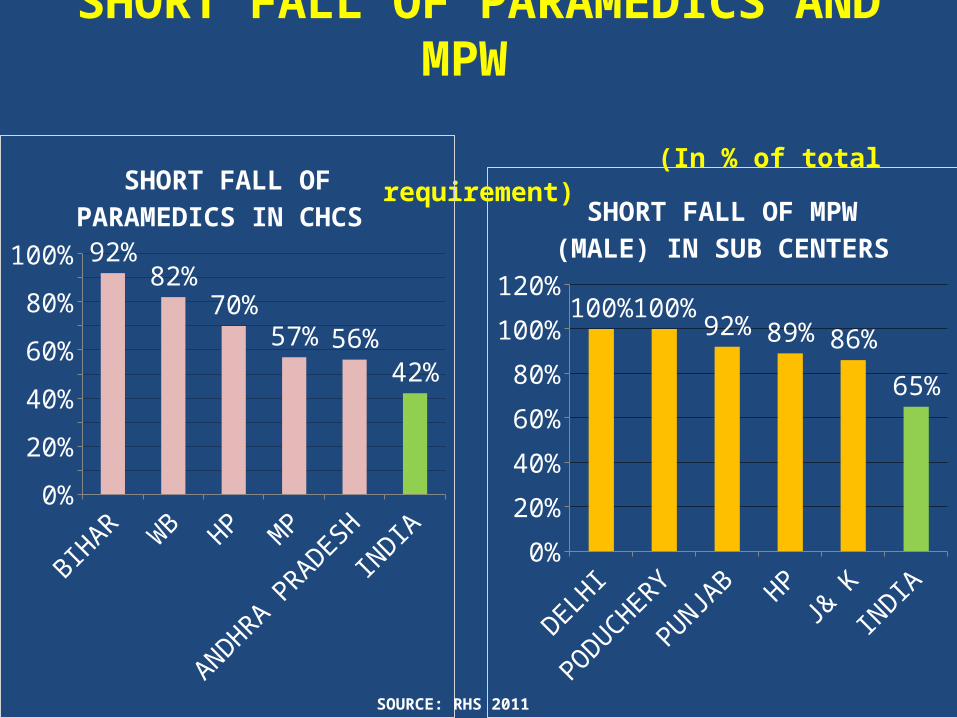
SHORT FALL OF PARAMEDICS AND MPW (In % of total requirement)
BIHAR
WB HP M
P
ANDHRA PRADESHIN
DIA0%
10%20%30%40%50%60%70%80%90%
100% 92%82%
70%57% 56%
42%
SHORT FALL OF PARAMEDICS IN CHCS
DELHI
PODUCHERY
PUNJAB HP
J& K
INDIA
0%
20%
40%
60%
80%
100%
120%100%100%
92% 89% 86%
65%
SHORT FALL OF MPW (MALE) IN SUB CENTERS
SOURCE: RHS 2011
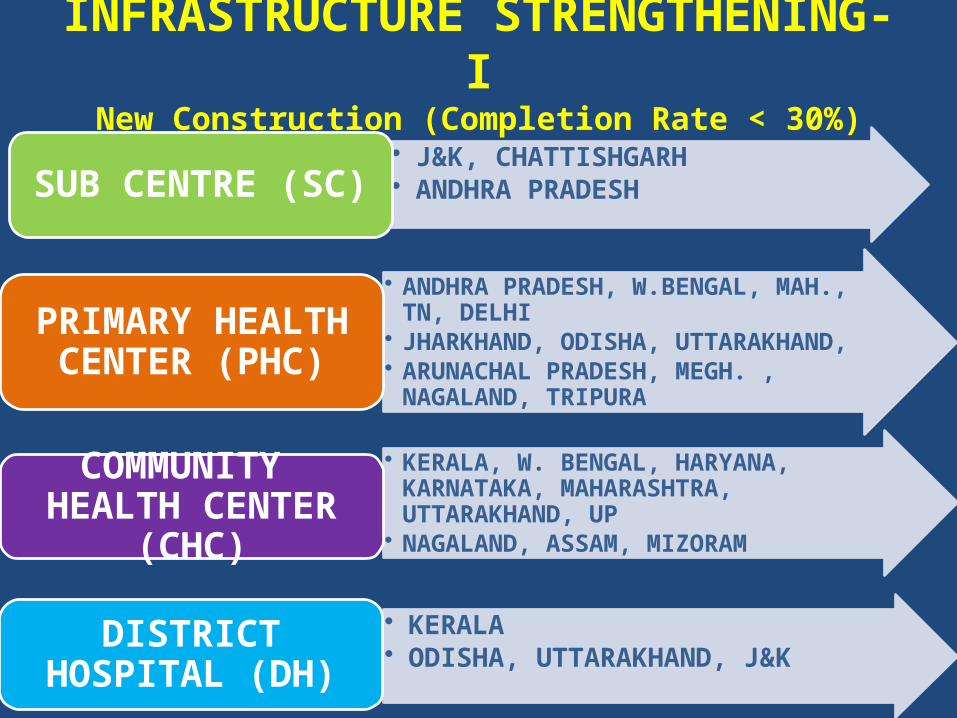
INFRASTRUCTURE STRENGTHENING- INew Construction (Completion Rate < 30%)
• J&K, CHATTISHGARH• ANDHRA PRADESHSUB CENTRE (SC)
• ANDHRA PRADESH, W.BENGAL, MAH., TN, DELHI• JHARKHAND, ODISHA, UTTARAKHAND, • ARUNACHAL PRADESH, MEGH. , NAGALAND, TRIPURAPRIMARY HEALTH
CENTER (PHC)
• KERALA, W. BENGAL, HARYANA, KARNATAKA, MAHARASHTRA, UTTARAKHAND, UP
• NAGALAND, ASSAM, MIZORAMCOMMUNITY HEALTH CENTER (CHC)
• KERALA• ODISHA, UTTARAKHAND, J&KDISTRICT HOSPITAL
(DH)
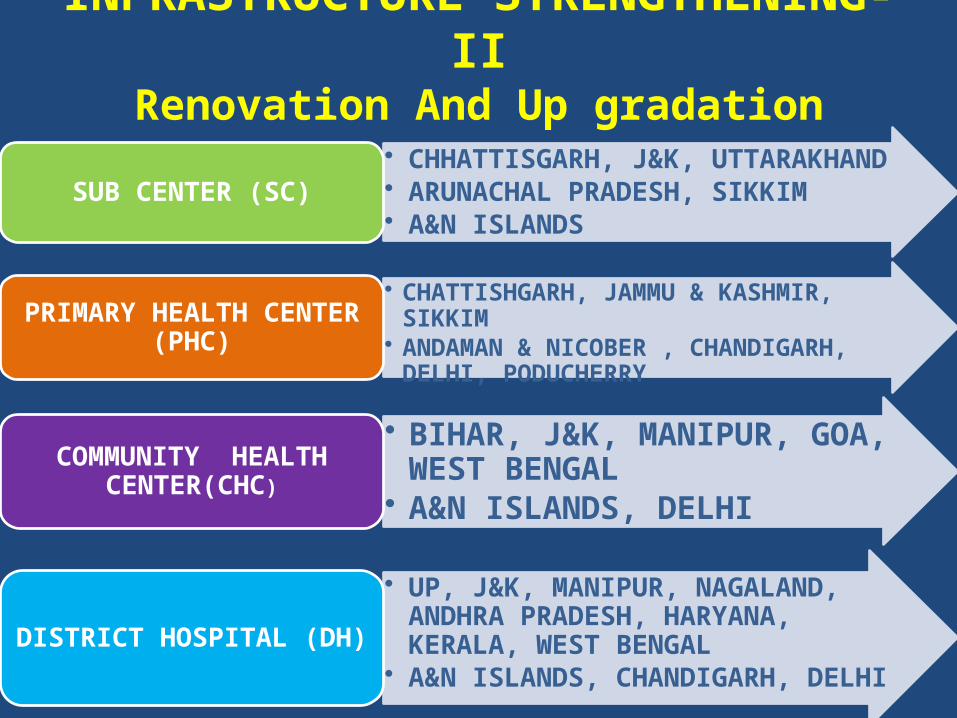
INFRASTRUCTURE STRENGTHENING- IIRenovation And Up gradation
(Completion Rate < 30%)• CHHATTISGARH, J&K, UTTARAKHAND• ARUNACHAL PRADESH, SIKKIM• A&N ISLANDS
SUB CENTER (SC)
• CHATTISHGARH, JAMMU & KASHMIR, SIKKIM• ANDAMAN & NICOBER , CHANDIGARH, DELHI,
PODUCHERRYPRIMARY HEALTH CENTER (PHC)
• BIHAR, J&K, MANIPUR, GOA, WEST BENGAL
• A&N ISLANDS, DELHICOMMUNITY HEALTH
CENTER(CHC)
• UP, J&K, MANIPUR, NAGALAND, ANDHRA PRADESH, HARYANA, KERALA, WEST BENGAL
• A&N ISLANDS, CHANDIGARH, DELHIDISTRICT HOSPITAL (DH)
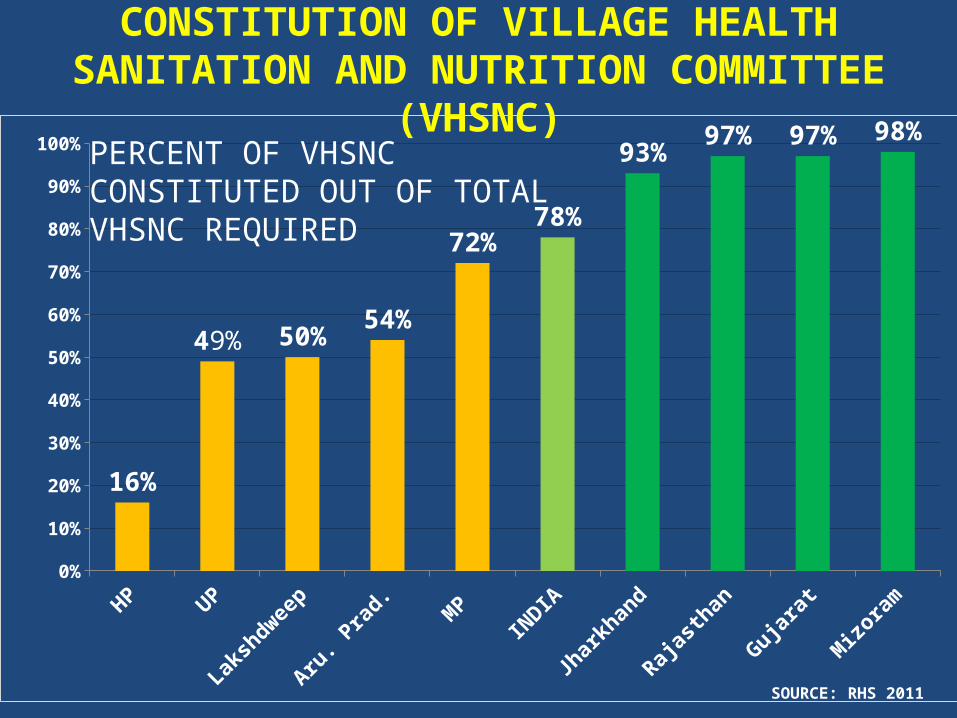
CONSTITUTION OF VILLAGE HEALTH SANITATION AND NUTRITION COMMITTEE (VHSNC)
HP UP
Laksh
dweep
Aru. Prad
.MP
INDIA
Jharkhan
d
Rajasth
an
Gujarat
Mizoram
0%
10%
20%
30%
40%
50%
60%
70%
80%
90%
100%
16%
49% 50%54%
72%78%
93%97% 97% 98%
SOURCE: RHS 2011
PERCENT OF VHSNC CONSTITUTED OUT OF TOTAL VHSNC REQUIRED
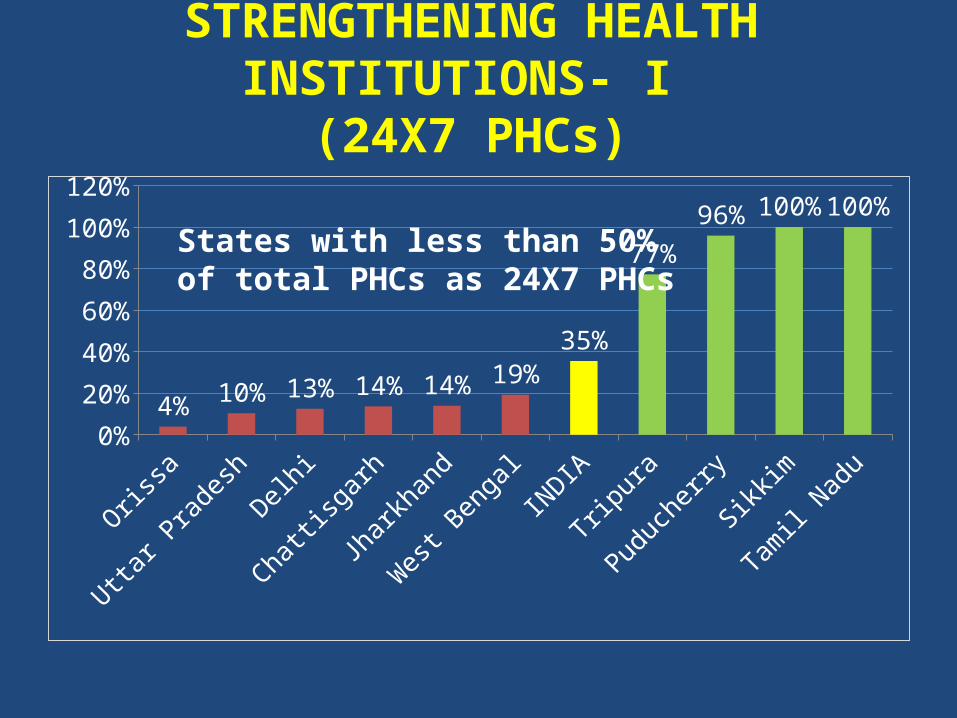
STRENGTHENING HEALTH INSTITUTIONS- I
(24X7 PHCs)
Orissa
Uttar Pradesh
Delhi
Chattisgarh
Jharkhand
West
Bengal
INDIA
Tripura
Puducherry
Sikkim
Tamil Nadu
0%
20%
40%
60%
80%
100%
120%
4%10% 13% 14% 14% 19%
35%
77%
96% 100% 100%States with less than 50% of total PHCs as 24X7 PHCs
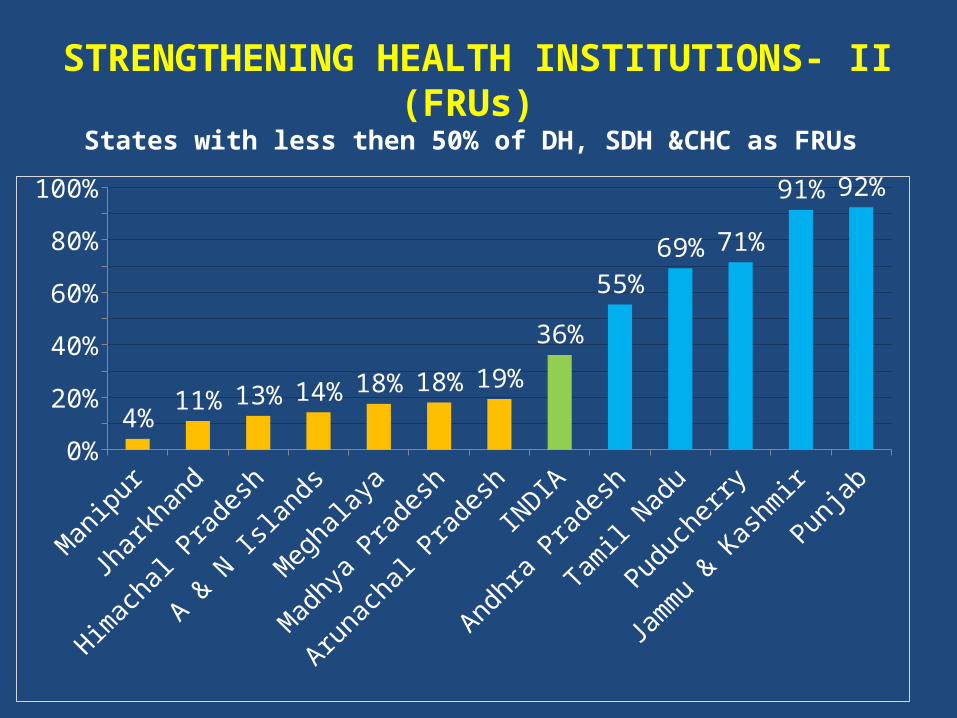
STRENGTHENING HEALTH INSTITUTIONS- II (FRUs) States with less then 50% of DH, SDH &CHC as FRUs
Manipur
Jharkhand
Himach
al Pradesh
A & N Is
lands
Meghalaya
Madhya Pradesh
Arunachal P
radeshIN
DIA
Andhra Pradesh
Tamil Nadu
Puducherry
Jammu & Kash
mir
Punjab0%
10%20%30%40%50%60%70%80%90%
100%
4%11% 13% 14% 18% 18% 19%
36%
55%
69% 71%
91% 92%

Action Plan for the Year 2012-13
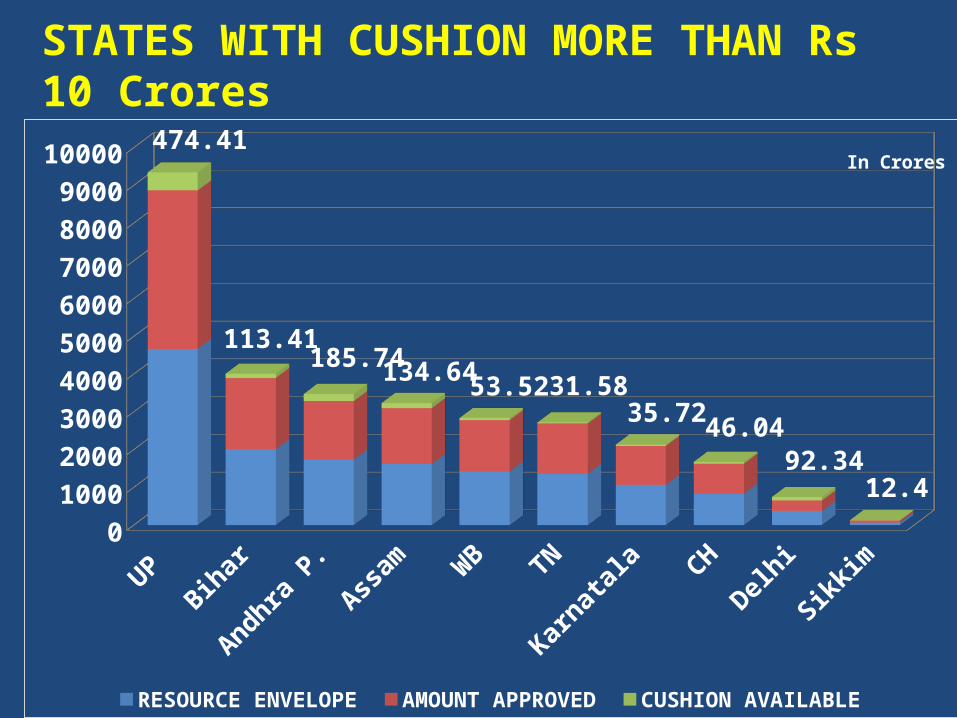
UP Bihar
Andhra P.
Assam W
B TN
Karnatala CH
Delhi
Sikkim0
1000
2000
3000
4000
5000
6000
7000
8000
9000
10000 474.41
113.41185.74134.64 53.52 31.58
35.7246.04
92.3412.4
RESOURCE ENVELOPE AMOUNT APPROVED CUSHION AVAILABLE
In Crores
STATES WITH CUSHION MORE THAN Rs 10 Crores
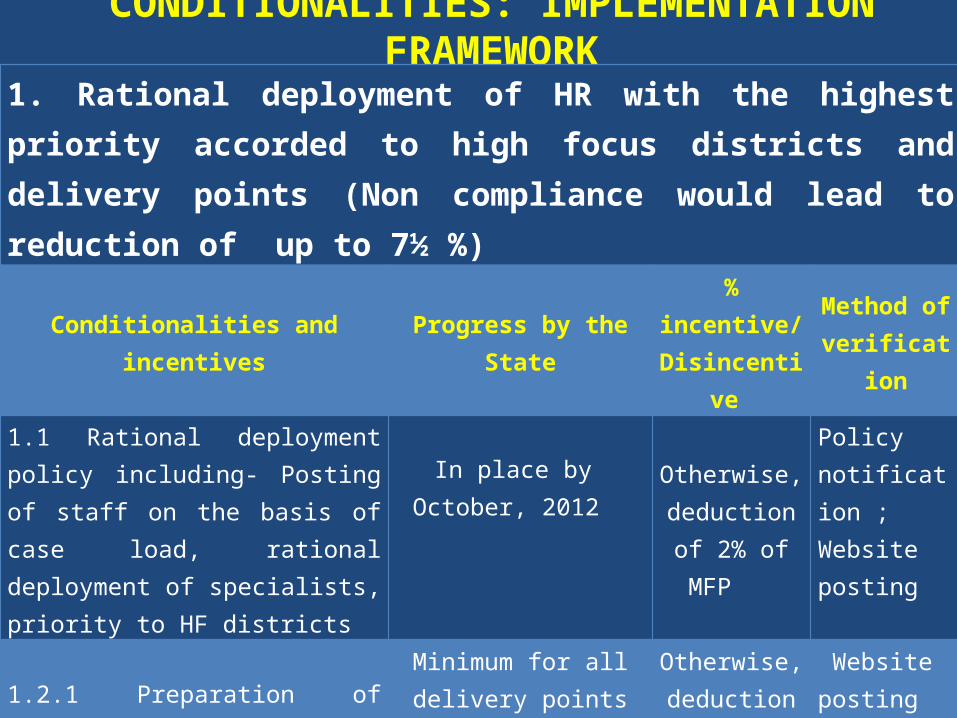
CONDITIONALITIES: IMPLEMENTATION FRAMEWORK1. Rational deployment of HR with the highest priority accorded to high focus districts and delivery points (Non compliance would lead to reduction of up to 7½ %)
Conditionalities and incentives Progress by the State % incentive/Disincentive
Method of verification
1.1 Rational deployment policy including- Posting of staff on the basis of case load, rational deployment of specialists, priority to HF districts
In place by October, 2012
Otherwise, deduction of 2% of MFP
Policy notification ; Website posting
1.2.1 Preparation of baseline data for HR
Minimum for all delivery points and SCs in high focus districts; by Nov
2012
Otherwise, deduction of 2% of MFP.
Website posting and state report
1.2.2 Evidence of corrective action in line with the policy
90% of all delivery points staffed as per norms, 90% of all SCs in high focus districts should
have at least one ANM
Otherwise, deduction of
2% and 1.5% of MFP
respectively.
State report; website posting by December 2012.
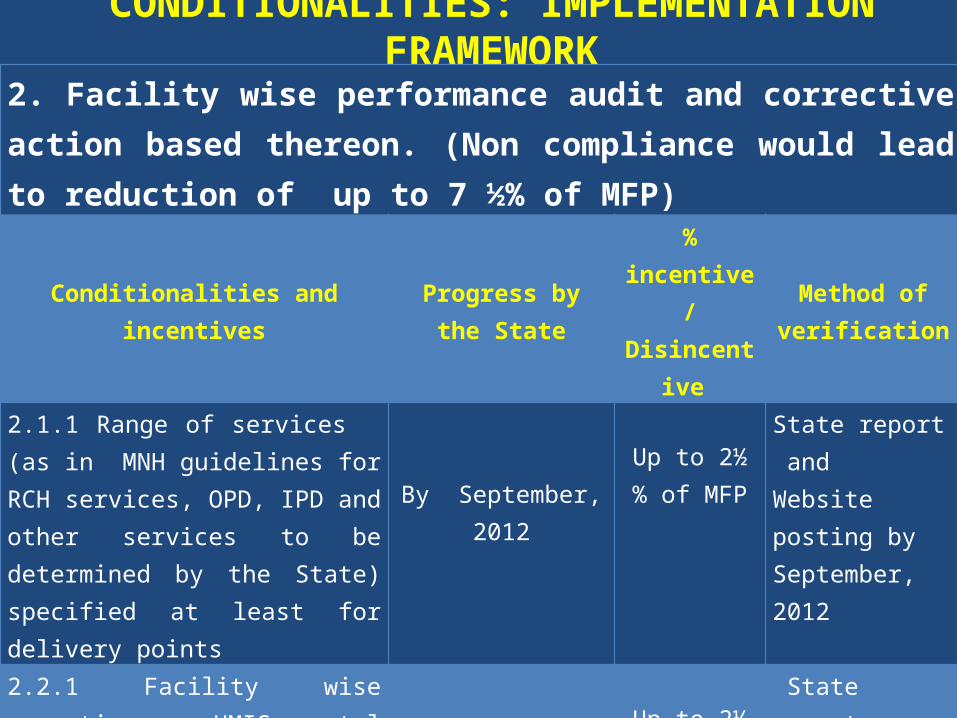
CONDITIONALITIES: IMPLEMENTATION FRAMEWORK2. Facility wise performance audit and corrective action based thereon. (Non compliance would lead to reduction of up to 7 ½% of MFP)
Conditionalities and incentives Progress by the State % incentive/Disincentive
Method of verification
2.1.1 Range of services (as in MNH guidelines for RCH services, OPD, IPD and other services to be determined by the State) specified at least for delivery points
By September, 2012Up to 2½ % of
MFP
State report and Website posting by September, 2012
2.2.1 Facility wise reporting on HMIS portal by all priority facilities/delivery points for October( SC data if needed be uploaded from PHC)
By November, 2012 Up to 2½ % of
MFP
State report ; State HMIS October data to be uploaded by November
2.2.2 Corrective action (priority to be given to high focus districts) based on facility wise reporting.
By November, 2012 Up to 2½ % of MFP
State reports on corrective action by Nov, 2012. State visits
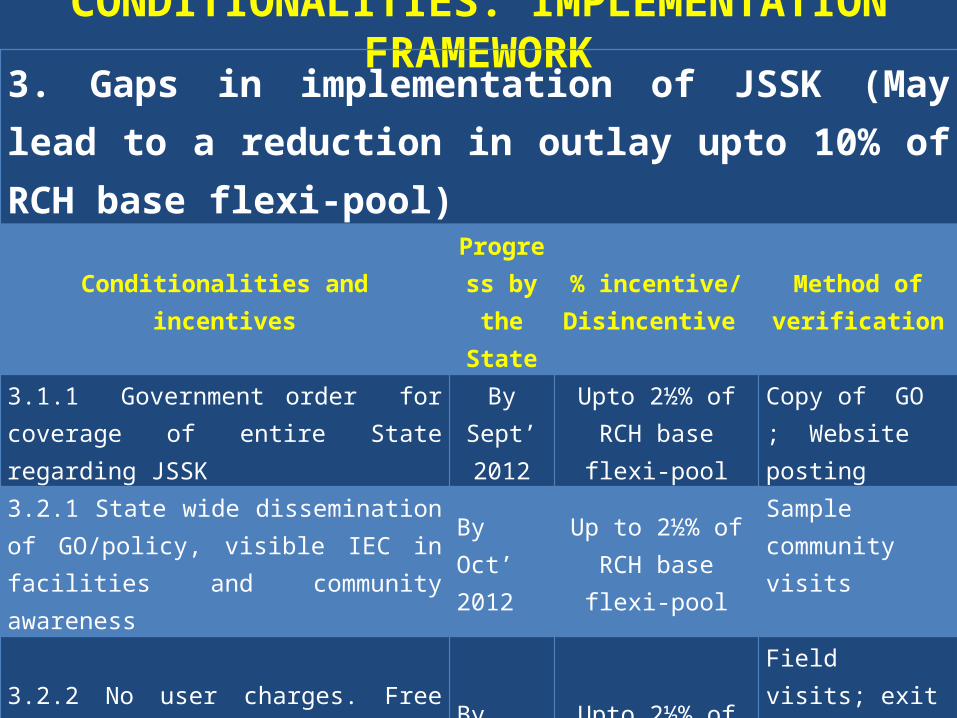
CONDITIONALITIES: IMPLEMENTATION FRAMEWORK3. Gaps in implementation of JSSK (May lead to a reduction in outlay upto 10% of RCH base flexi-pool)
Conditionalities and incentivesProgress
by the State
% incentive/Disincentive
Method of verification
3.1.1 Government order for coverage of entire State regarding JSSK
By Sept’ 2012
Upto 2½% of RCH base flexi-pool
Copy of GO ; Website posting
3.2.1 State wide dissemination of GO/policy, visible IEC in facilities and community awareness
By Oct’ 2012
Up to 2½% of RCH base flexi-pool
Sample community visits
3.2.2 No user charges. Free Drugs, diagnostics, diet. Grievance redressal system operational
By Oct’ 2012
Upto 2½% of RCH base flexi-pool
Field visits; exit interviews grievance redressal records.
3.2.3 At least 50% of pregnant women and sick newborns coming in should be using assured and cashless means of transport- and getting a similar drop back home
By Nov’ 2012,
Upto 2½% of RCH base flexi-pool -do-
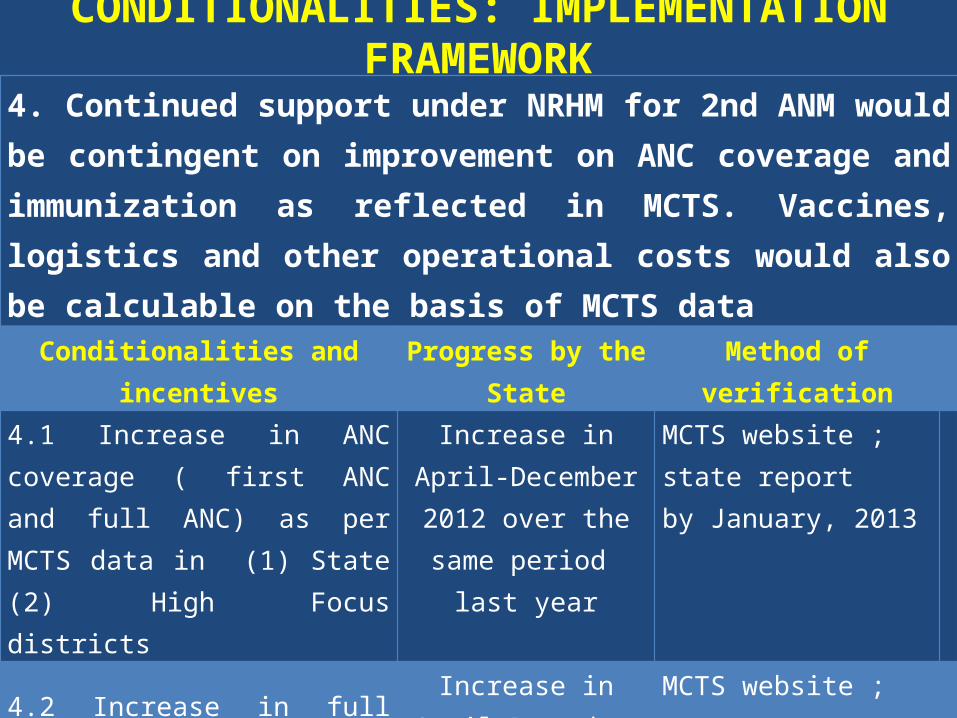
CONDITIONALITIES: IMPLEMENTATION FRAMEWORK4. Continued support under NRHM for 2nd ANM would be contingent on improvement on ANC coverage and immunization as reflected in MCTS. Vaccines, logistics and other operational costs would also be calculable on the basis of MCTS data
Conditionalities and incentives Progress by the State Method of verification
4.1 Increase in ANC coverage ( first ANC and full ANC) as per MCTS data in (1) State (2) High Focus districts
Increase in April-December 2012 over the same period last
year
MCTS website ; state report by January, 2013
4.2 Increase in full immunization as per MCTS data in (1) State (2)High Focus districts
Increase in April-December 2012 over the same period last
year
MCTS website ; state report by January, 2013
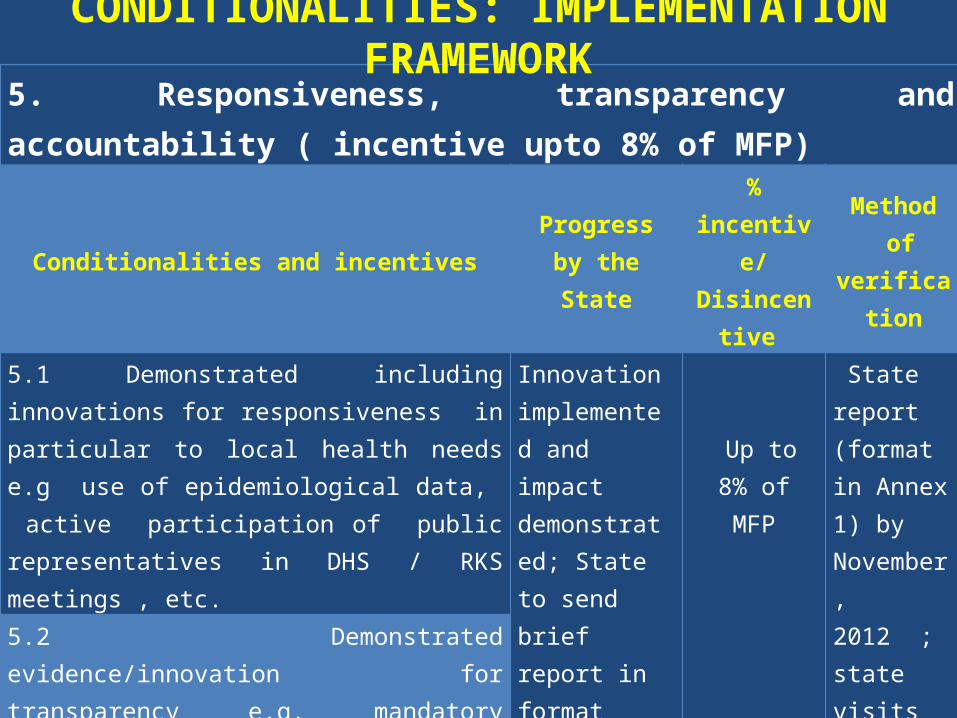
5. Responsiveness, transparency and accountability ( incentive upto 8% of MFP)
Conditionalities and incentives Progress by the State
% incentive/Disincentive
Method of
verification
5.1 Demonstrated including innovations for responsiveness in particular to local health needs e.g use of epidemiological data, active participation of public representatives in DHS / RKS meetings , etc.
Innovation implemented and impact demonstrated; State to send brief report in format suggested by November, 2012. ( one innovation in each of the three areas)
Up to 8% of
MFP
State report (format in Annex 1) by November, 2012 ; state visits for rapid appraisal
5.2 Demonstrated evidence/innovation for transparency e.g. mandatory disclosures and other important information including HR posting etc. to be displayed in the State NRHM websites etc.
5.3 Demonstrated evidence/innovation for accountability: e.g. initiatives in community monitoring, Jan sunwai etc
CONDITIONALITIES: IMPLEMENTATION FRAMEWORK
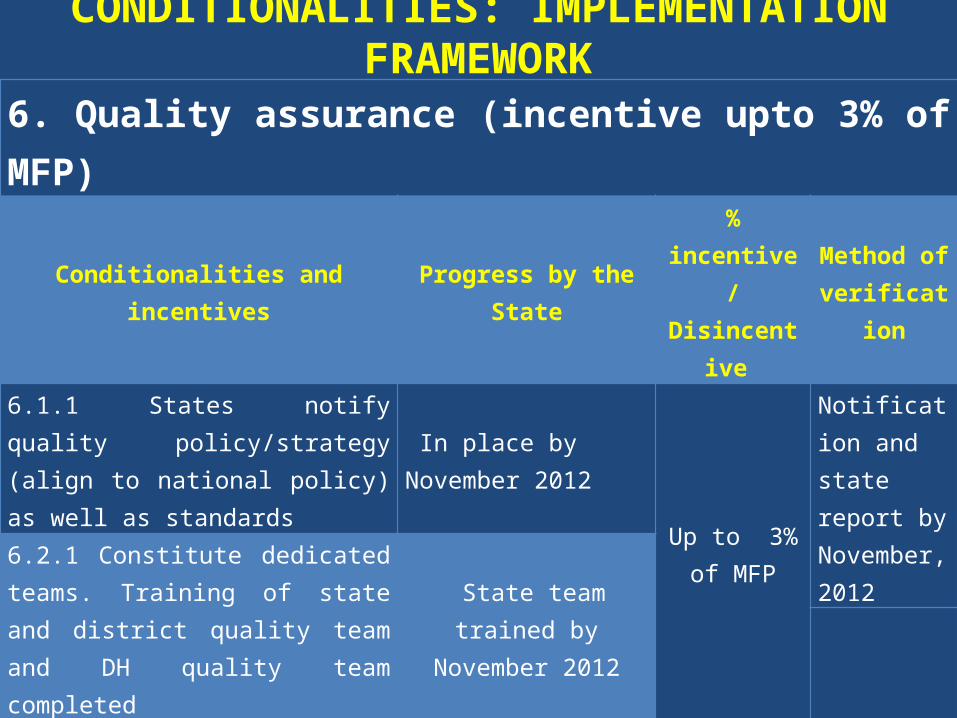
6. Quality assurance (incentive upto 3% of MFP)
Conditionalities and incentives Progress by the State % incentive/Disincentive
Method of verification
6.1.1 States notify quality policy/strategy (align to national policy) as well as standards
In place by November 2012
Up to 3% of MFP
Notification and state report by November, 2012
6.2.1 Constitute dedicated teams. Training of state and district quality team and DH quality team completed
State team trained by November 2012
6.2.2 Current levels of quality measured for all “priority facilities” and scored and available on public domain. Deadlines for each facility to achieve quality standards declared
Quality scores of all priority facilities available in public domain
CONDITIONALITIES: IMPLEMENTATION FRAMEWORK
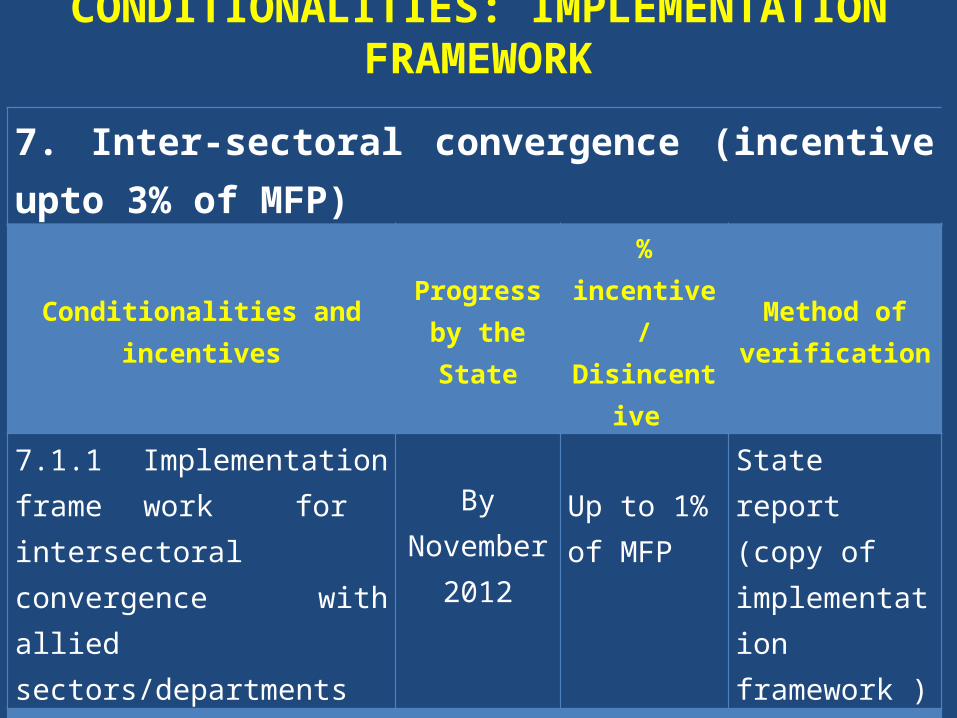
7. Inter-sectoral convergence (incentive upto 3% of MFP)
Conditionalities and incentives Progress by the State
% incentive/Disincentive
Method of verification
7.1.1 Implementation frame work for intersectoral convergence with allied sectors/departments
By November
2012
Up to 1% of MFP
State report (copy of implementation framework )
7.2.1 Intersectoral convergence opportunities identified with WCD, PHED, education, etc. and action initiated.
By November
2012
Up to 2% of MFP
Government order , State report
CONDITIONALITIES: IMPLEMENTATION FRAMEWORK
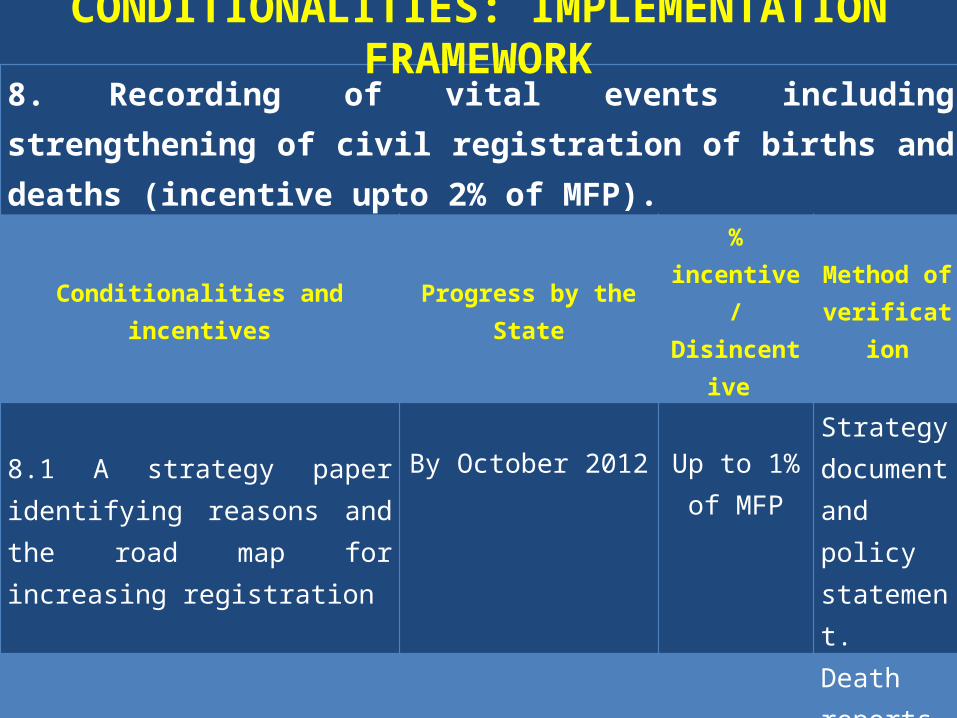
8. Recording of vital events including strengthening of civil registration of births and deaths (incentive upto 2% of MFP).
Conditionalities and incentives Progress by the State % incentive/Disincentive
Method of verification
8.1 A strategy paper identifying reasons and the road map for increasing registration
By October 2012 Up to 1% of MFP
Strategy document and policy statement.
8.2 Death reports with cause of death (especially any under 5 child or any woman in 15 to 49 age group) shared with district health team on monthly basis.
By November 2012 Up to 1% of MFP
Death reports received at district level- verified in sample of districts.
CONDITIONALITIES: IMPLEMENTATION FRAMEWORK
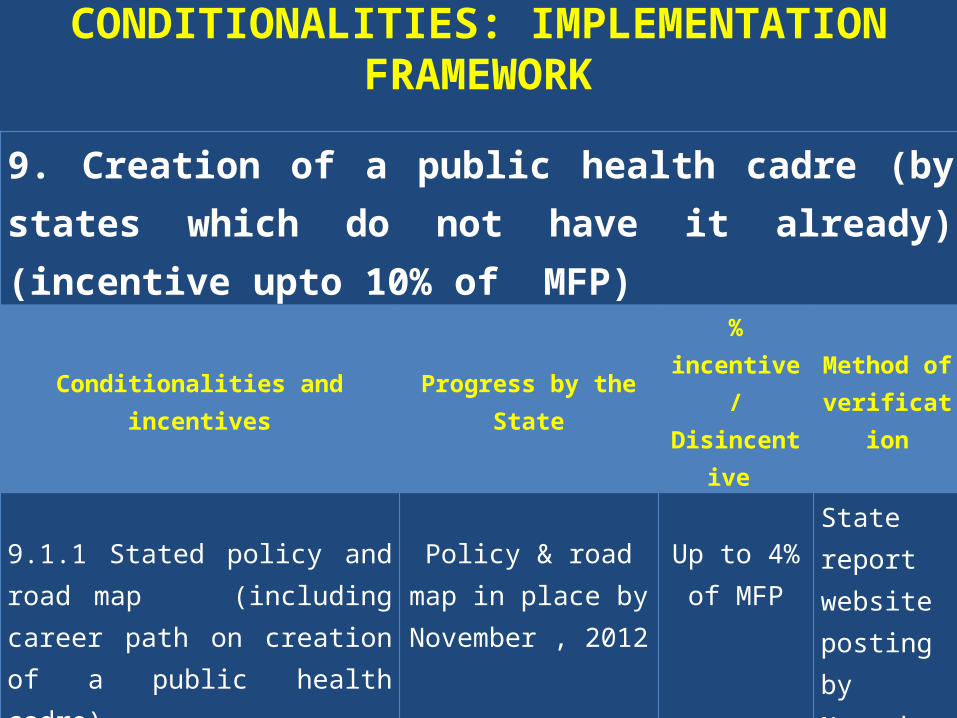
9. Creation of a public health cadre (by states which do not have it already) (incentive upto 10% of MFP)
Conditionalities and incentives Progress by the State % incentive/Disincentive
Method of verification
9.1.1 Stated policy and road map (including career path on creation of a public health cadre)
Policy & road map in place by November ,
2012
Up to 4% of MFP
State report website posting by November , 2012
9.2.1 Notification for creation of public health cadre
Government order in place.
Up to 6% of MFP
Website posting / state report
CONDITIONALITIES: IMPLEMENTATION FRAMEWORK
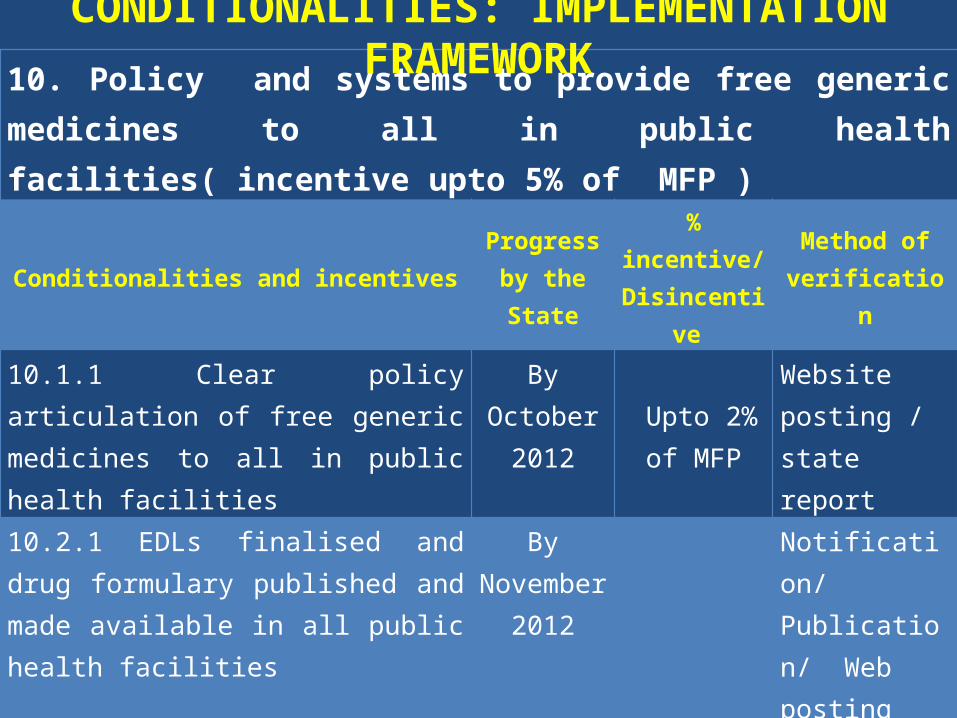
10. Policy and systems to provide free generic medicines to all in public health facilities( incentive upto 5% of MFP )
Conditionalities and incentives Progress by the State
% incentive/Disincentive
Method of verification
10.1.1 Clear policy articulation of free generic medicines to all in public health facilities
By October 2012 Upto 2% of
MFP
Website posting / state report
10.2.1 EDLs finalised and drug formulary published and made available in all public health facilities
By November
2012
Up to 3% of MFP
Notification/ Publication/ Web posting
10.2.2. Overall procurement and logistics strategy in place. Detailed design and plan for rate contracting, regular stock up dates, indent management, warehousing, promotion of rational drug use, contingency funds with devolution of financial powers etc. in place.
By November
2012
State report/ strategy document
CONDITIONALITIES: IMPLEMENTATION FRAMEWORK
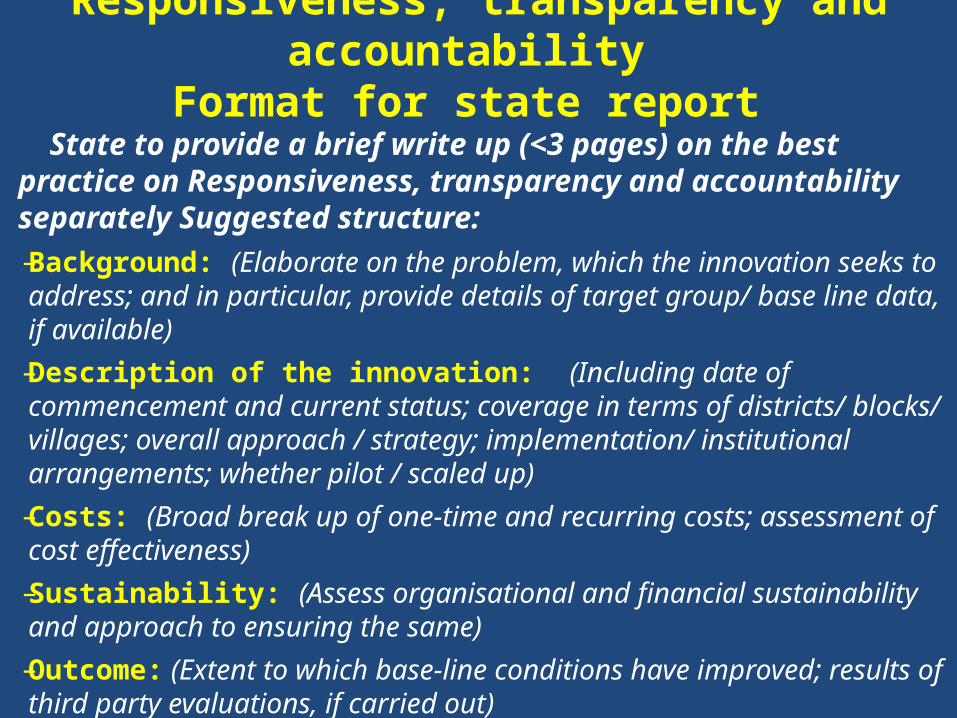
Responsiveness, transparency and accountability Format for state report
State to provide a brief write up (<3 pages) on the best practice on Responsiveness, transparency and accountability separately Suggested structure: – Background: (Elaborate on the problem, which the innovation seeks to
address; and in particular, provide details of target group/ base line data, if available)
– Description of the innovation: (Including date of commencement and current status; coverage in terms of districts/ blocks/ villages; overall approach / strategy; implementation/ institutional arrangements; whether pilot / scaled up)
– Costs: (Broad break up of one-time and recurring costs; assessment of cost effectiveness)
– Sustainability: (Assess organisational and financial sustainability and approach to ensuring the same)
– Outcome: (Extent to which base-line conditions have improved; results of third party evaluations, if carried out)
Thank You