Embed Size (px)
DESCRIPTION
NATIONAL FOOD SECURITY MISSION 12 th NFSM-EC meeting (Date 3.06.13, New Delhi). Department of Agriculture, Maharashtra State. National Food Security Mission. Comparative Productivity from 2006-07 to 2012-13 - Rice. (Area in 00 ha., Production 00 M.T., Yield in kg/ha.). - PowerPoint PPT Presentation
Citation preview
NATIONAL FOOD SECURITY MISSIONNATIONAL FOOD SECURITY MISSION
12thNFSM-EC meeting(Date 3.06.13, New Delhi)
NATIONAL FOOD SECURITY MISSIONNATIONAL FOOD SECURITY MISSION
12thNFSM-EC meeting(Date 3.06.13, New Delhi)
Department of Agriculture,Department of Agriculture,Maharashtra StateMaharashtra State
1
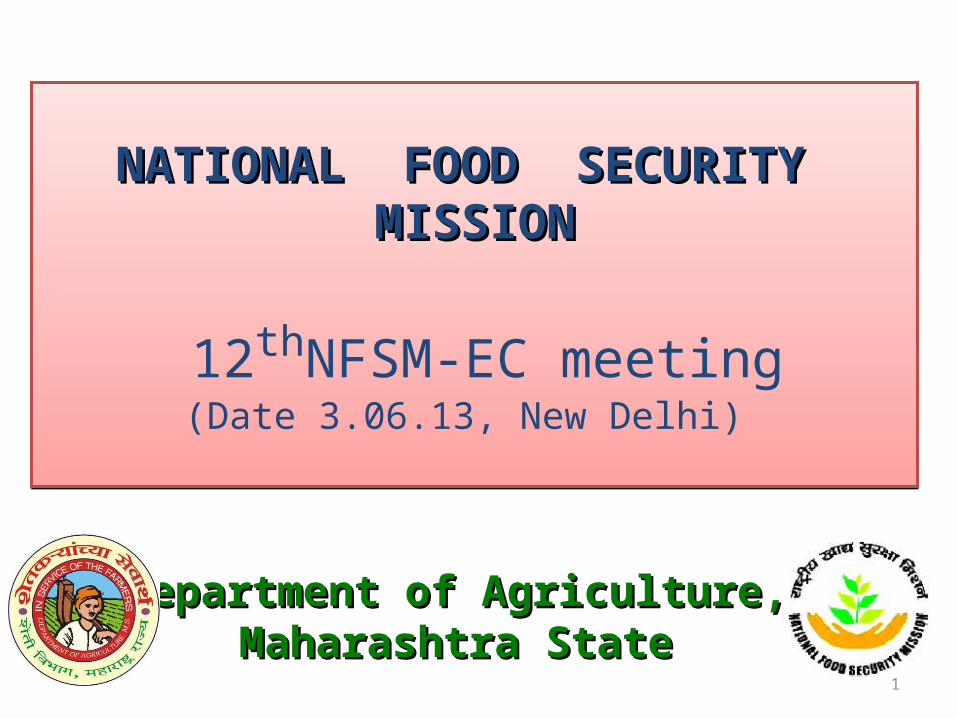
Crop Rice Wheat PulsesDistricts covered
6 8 33
Districts
Nasik, Pune,
Bhandara,Gondia,
Chandrapur,Gadchiroli
Nasik, Dhule
Ahmednagar,Pune,
Solapur Aurangabad,
Parbhani, Nagpur
All over Maharashtra
National Food Security MissionNational Food Security Mission
2
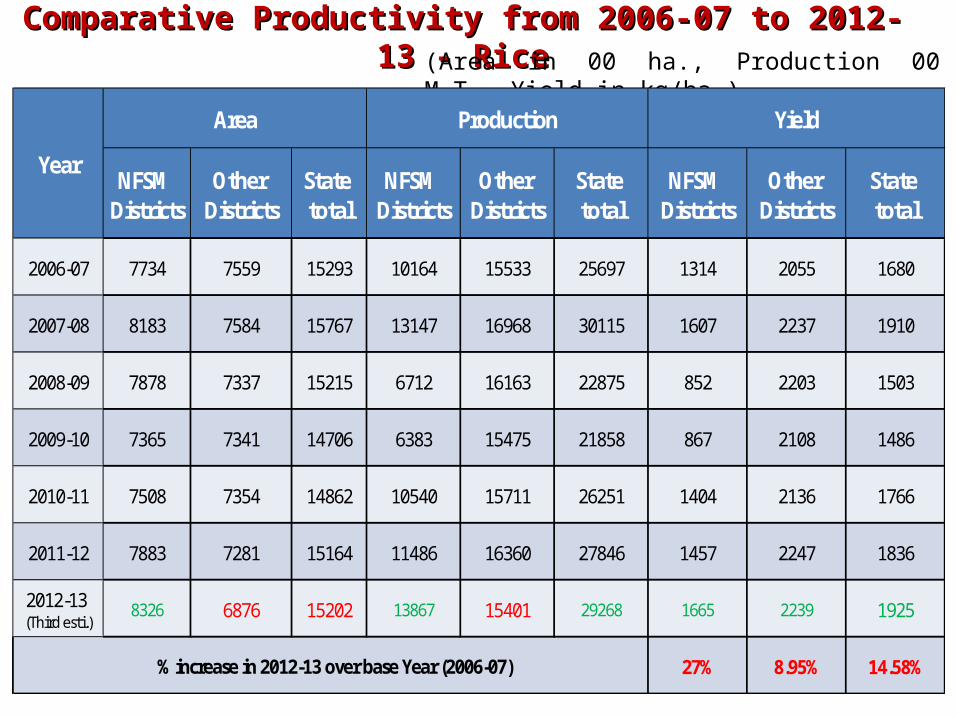
Comparative Productivity from 2006-07 to 2012-13 - RiceComparative Productivity from 2006-07 to 2012-13 - Rice(Area in 00 ha., Production 00 M.T., Yield in kg/ha.)
3
NFSM Districts
Other Districts
State total
NFSM Districts
Other Districts
State total
NFSM Districts
Other Districts
State total
2006-07 7734 7559 15293 10164 15533 25697 1314 2055 1680
2007-08 8183 7584 15767 13147 16968 30115 1607 2237 1910
2008-09 7878 7337 15215 6712 16163 22875 852 2203 1503
2009-10 7365 7341 14706 6383 15475 21858 867 2108 1486
2010-11 7508 7354 14862 10540 15711 26251 1404 2136 1766
2011-12 7883 7281 15164 11486 16360 27846 1457 2247 1836
2012-13 (Third esti.)
8326 6876 15202 13867 15401 29268 1665 2239 1925
27% 8.95% 14.58% % increase in 2012-13 over base Year (2006-07)
Year
Area Production Yield

Sr.No
District 06-07 07-08 08-09 09-10 10-11 11-12 2012-13 (3rd Esti.)
1 Nashik 1012 1352 1286 392 407 1237 1102
2 Pune 1078 1245 1234 818 1181 1380 1447
3 Bhandara 1467 1814 742 1019 1426 1709 2044
4 Gondia 1161 1688 717 1091 1717 1706 1942
5 Chandrapur 1385 1575 854 635 1401 1264 1487
6 Gadchiroli 1475 1515 844 760 1487 1198 1450
a) Total of NFSM Districts
1314 1607 852 867 1404 1457 1665
b) Total of Other Disticts
2055 2237 2203 2108 2136 2247 2239
Total of State 1680 1910 1503 1486 1766 1836 1925
(Productivity – Kg/ha)
Districtwise comparative Productivity Districtwise comparative Productivity from 2006-07 to 2012-13 - Ricefrom 2006-07 to 2012-13 - Rice
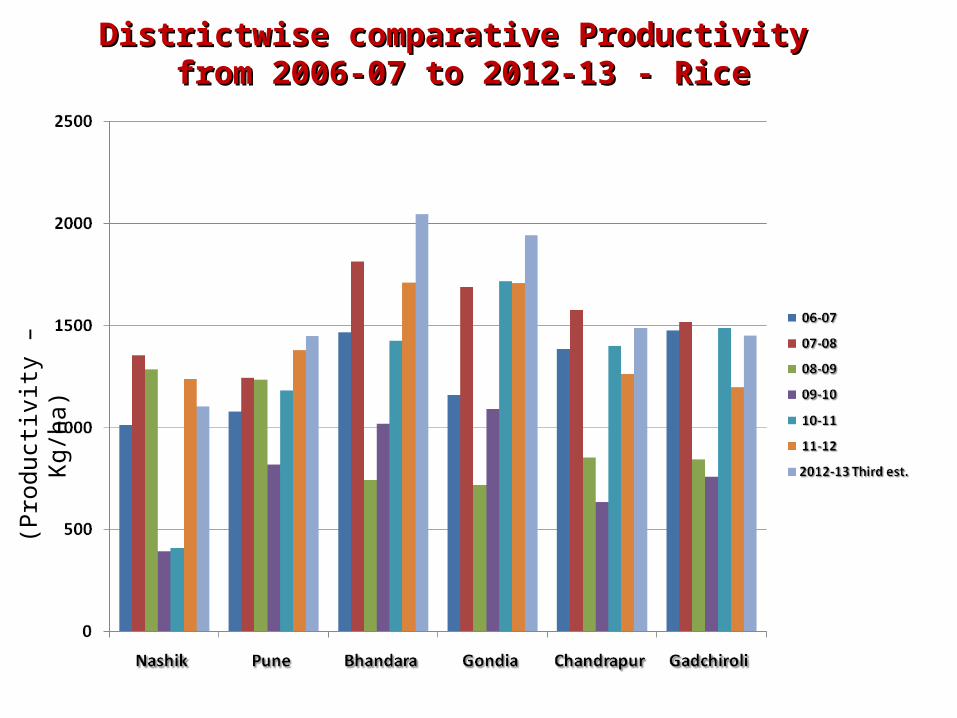
Districtwise comparative Productivity Districtwise comparative Productivity from 2006-07 to 2012-13 - Ricefrom 2006-07 to 2012-13 - Rice
(Pro
ducti
vity
– K
g/ha
)
(Area in 00 ha., Production 00 M.T., Yield in kg/ha.)
6
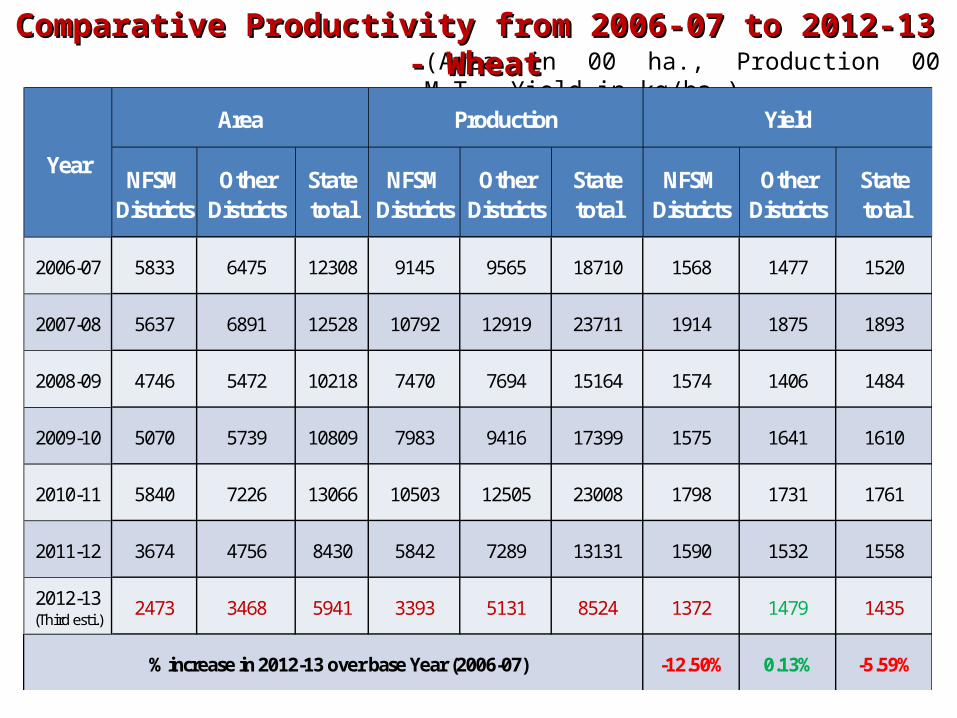
Comparative Productivity from 2006-07 to 2012-13 - WheatComparative Productivity from 2006-07 to 2012-13 - Wheat
NFSM Districts
Other Districts
State total
NFSM Districts
Other Districts
State total
NFSM Districts
Other Districts
State total
2006-07 5833 6475 12308 9145 9565 18710 1568 1477 1520
2007-08 5637 6891 12528 10792 12919 23711 1914 1875 1893
2008-09 4746 5472 10218 7470 7694 15164 1574 1406 1484
2009-10 5070 5739 10809 7983 9416 17399 1575 1641 1610
2010-11 5840 7226 13066 10503 12505 23008 1798 1731 1761
2011-12 3674 4756 8430 5842 7289 13131 1590 1532 1558
2012-13 (Third esti.)
2473 3468 5941 3393 5131 8524 1372 1479 1435
-12.50% 0.13% -5.59% % increase in 2012-13 over base Year (2006-07)
Year
Area Production Yield
Sr.No
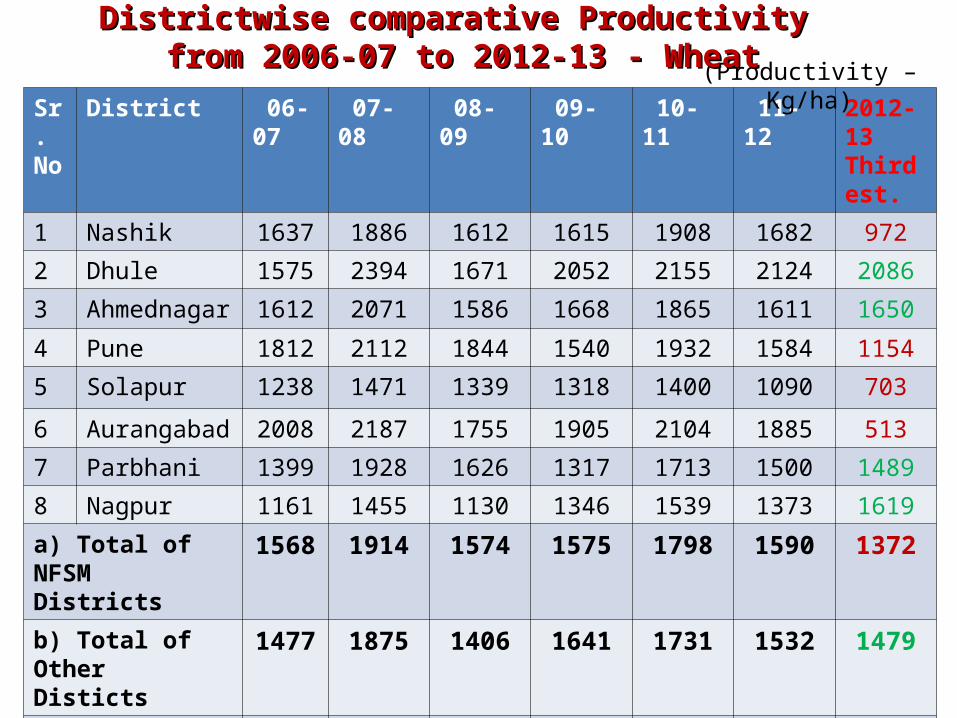
District 06-07 07-08 08-09 09-10 10-11 11-12 2012-13Third est.
1 Nashik 1637 1886 1612 1615 1908 1682 972
2 Dhule 1575 2394 1671 2052 2155 2124 2086
3 Ahmednagar 1612 2071 1586 1668 1865 1611 1650
4 Pune 1812 2112 1844 1540 1932 1584 1154
5 Solapur 1238 1471 1339 1318 1400 1090 703
6 Aurangabad 2008 2187 1755 1905 2104 1885 513
7 Parbhani 1399 1928 1626 1317 1713 1500 1489
8 Nagpur 1161 1455 1130 1346 1539 1373 1619
a) Total of NFSM Districts
1568 1914 1574 1575 1798 1590 1372
b) Total of Other Disticts
1477 1875 1406 1641 1731 1532 1479
Total of State 1520 1893 1484 1610 1761 1558 1435
(Productivity – Kg/ha)
Districtwise comparative Productivity Districtwise comparative Productivity from 2006-07 to 2012-13 - Wheatfrom 2006-07 to 2012-13 - Wheat

(Pro
ducti
vity
– K
g/ha
)Districtwise comparative Productivity Districtwise comparative Productivity
from 2006-07 to 2012-13 - Wheatfrom 2006-07 to 2012-13 - Wheat
9
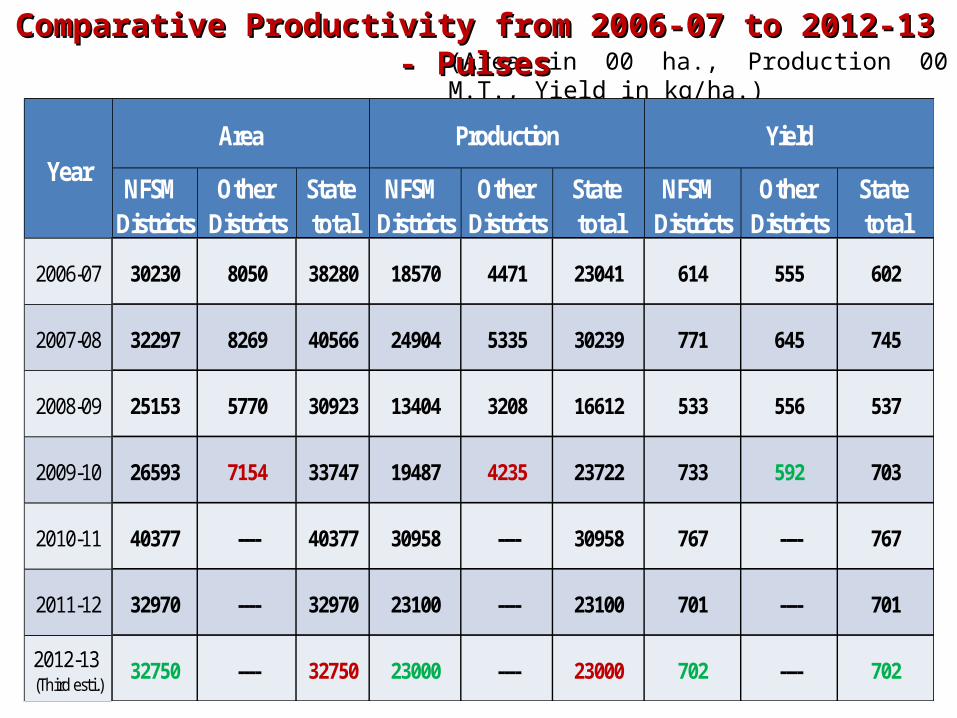
(Area in 00 ha., Production 00 M.T., Yield in kg/ha.)Comparative Productivity from 2006-07 to 2012-13 - PulsesComparative Productivity from 2006-07 to 2012-13 - Pulses
NFSM Districts
Other Districts
State total
NFSM Districts
Other Districts
State total
NFSM Districts
Other Districts
State total
2006-07 30230 8050 38280 18570 4471 23041 614 555 602
2007-08 32297 8269 40566 24904 5335 30239 771 645 745
2008-09 25153 5770 30923 13404 3208 16612 533 556 537
2009-10 26593 7154 33747 19487 4235 23722 733 592 703
2010-11 40377 ---- 40377 30958 ---- 30958 767 ---- 767
2011-12 32970 ---- 32970 23100 ---- 23100 701 ---- 701
2012-13 (Third esti.)
32750 ---- 32750 23000 ---- 23000 702 ---- 702
YearArea Production Yield

Sr. No. Crop
Yield (Kg/ha.)
2006-07(Base year)
2007-08 2008-09 2009-10 2010-11 2011-122012-13
(3rd Est.)
1 Tur 726 928 600 841 750 706 827
2 Mung 412 556 248 332 672 586 476
3 Udid 408 568 308 332 682 685 542
4 Gram 707 824 677 863 904 797 767
10
Cropwise comparative Productivity Cropwise comparative Productivity from 2006-07 to 2012-13 - Pulsesfrom 2006-07 to 2012-13 - Pulses

11
Cropwise comparative Productivity Cropwise comparative Productivity from 2006-07 to 2012-13 - Pulsesfrom 2006-07 to 2012-13 - Pulses
(Pro
ducti
vity
– K
g/ha
)
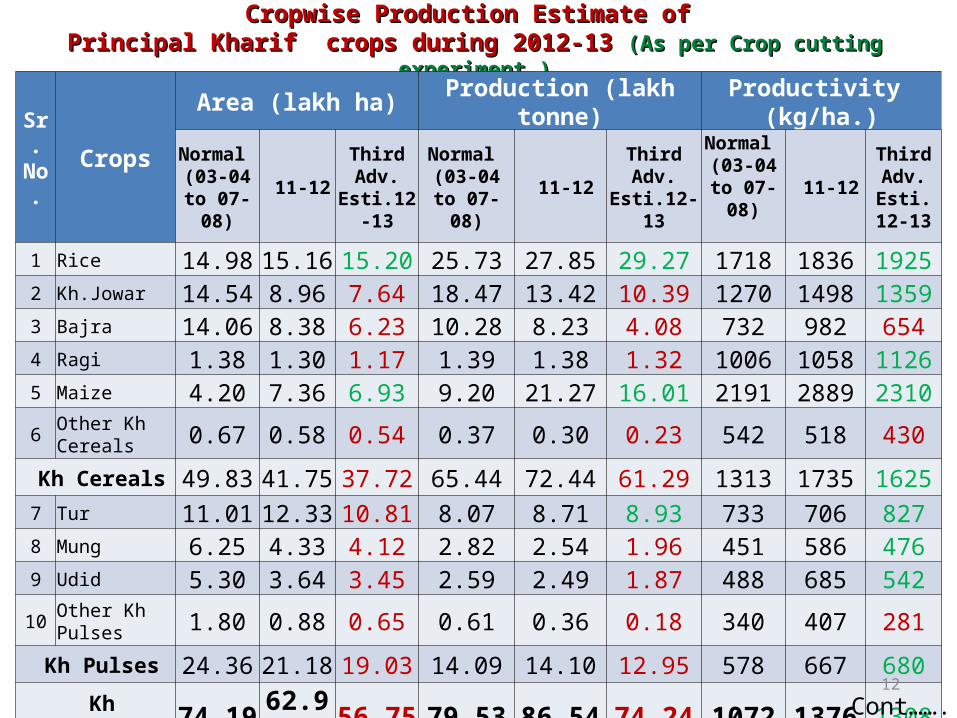
Cropwise Production Estimate of Cropwise Production Estimate of Principal Kharif crops during 2012-13 Principal Kharif crops during 2012-13 (As per Crop cutting experiment )(As per Crop cutting experiment )
Sr. No. Crops
Area (lakh ha) Production (lakh tonne) Productivity (kg/ha.)
Normal (03-04 to
07-08) 11-12
ThirdAdv.
Esti.12-13
Normal (03-04 to
07-08) 11-12
ThirdAdv.
Esti.12-13
Normal (03-04 to
07-08) 11-12Third
Adv. Esti. 12-13
1 Rice 14.98 15.16 15.20 25.73 27.85 29.27 1718 1836 19252 Kh.Jowar 14.54 8.96 7.64 18.47 13.42 10.39 1270 1498 13593 Bajra 14.06 8.38 6.23 10.28 8.23 4.08 732 982 6544 Ragi 1.38 1.30 1.17 1.39 1.38 1.32 1006 1058 11265 Maize 4.20 7.36 6.93 9.20 21.27 16.01 2191 2889 2310
6 Other Kh Cereals 0.67 0.58 0.54 0.37 0.30 0.23 542 518 430
Kh Cereals 49.83 41.75 37.72 65.44 72.44 61.29 1313 1735 16257 Tur 11.01 12.33 10.81 8.07 8.71 8.93 733 706 8278 Mung 6.25 4.33 4.12 2.82 2.54 1.96 451 586 4769 Udid 5.30 3.64 3.45 2.59 2.49 1.87 488 685 542
10 Other Kh Pulses 1.80 0.88 0.65 0.61 0.36 0.18 340 407 281
Kh Pulses 24.36 21.18 19.03 14.09 14.10 12.95 578 667 680 Kh Foodgrains 74.19 62.92 56.75 79.53 86.54 74.24 1072 1376 1308
12Cont…….
Sr. No. Crops
Area (lakh ha)Production
(lakh tonne)Productivity
(kg/ha.)
Normal (03-04 to
07-08) 11-12
ThirdAdv.
Esti.12-13
Normal (03-04 to
07-08) 11-12
ThirdAdv.
Esti.12-13
Normal (03-04 to
07-08) 11-12Third
Adv. Esti. 12-13
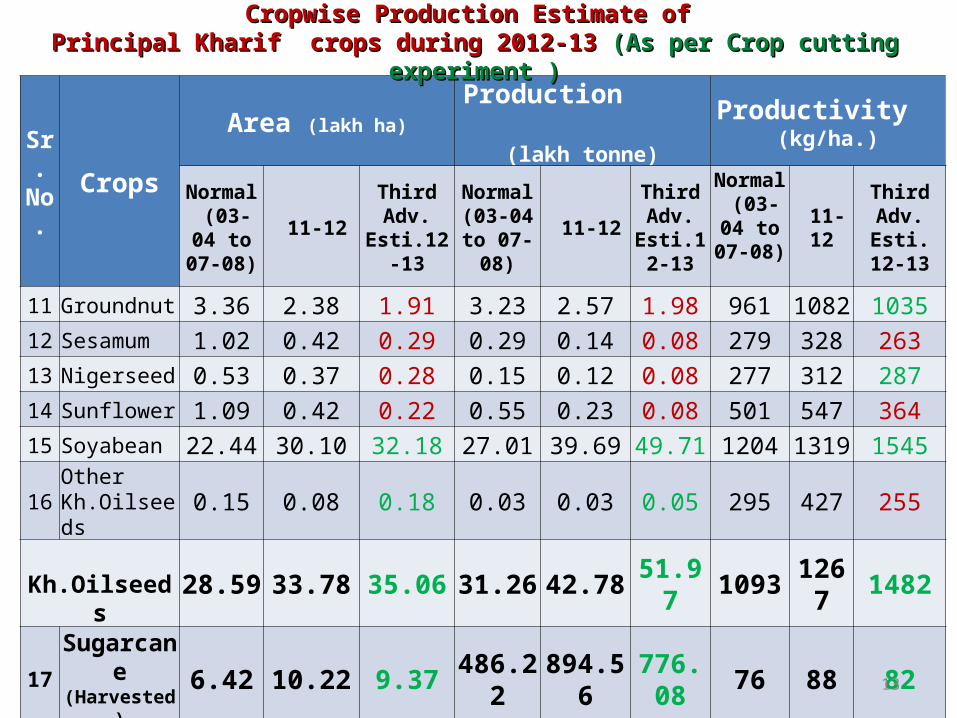
11 Groundnut 3.36 2.38 1.91 3.23 2.57 1.98 961 1082 103512 Sesamum 1.02 0.42 0.29 0.29 0.14 0.08 279 328 26313 Nigerseed 0.53 0.37 0.28 0.15 0.12 0.08 277 312 28714 Sunflower 1.09 0.42 0.22 0.55 0.23 0.08 501 547 36415 Soyabean 22.44 30.10 32.18 27.01 39.69 49.71 1204 1319 1545
16 Other Kh.Oilseeds 0.15 0.08 0.18 0.03 0.03 0.05 295 427 255
Kh.Oilseeds 28.59 33.78 35.06 31.26 42.78 51.97 1093 1267 1482
17 Sugarcane (Harvested) 6.42 10.22 9.37 486.22 894.56 776.08 76 88 82
18 Cotton (Lint) 29.56 41.67 41.46 41.62 68.20 66.65 239 278 273
Total kh. Crops 138.76 148.59 142.63 13
Cropwise Production Estimate of Cropwise Production Estimate of Principal Kharif crops during 2012-13 Principal Kharif crops during 2012-13 (As per Crop cutting experiment )(As per Crop cutting experiment )
14
Sr. No Crops
Area in lakh ha Production in lakh tonne Productivity in Kg/ha
Normal (03-04 to
07-08)
2011-12
ThirdAdv. Esti.
12-13
Normal (03-04 to 07-
08)
2011-12
ThirdAdv. Esti.
12-13
Normal (03-04 to
07-08)
2011-12
ThirdAdv. Esti.
12-13
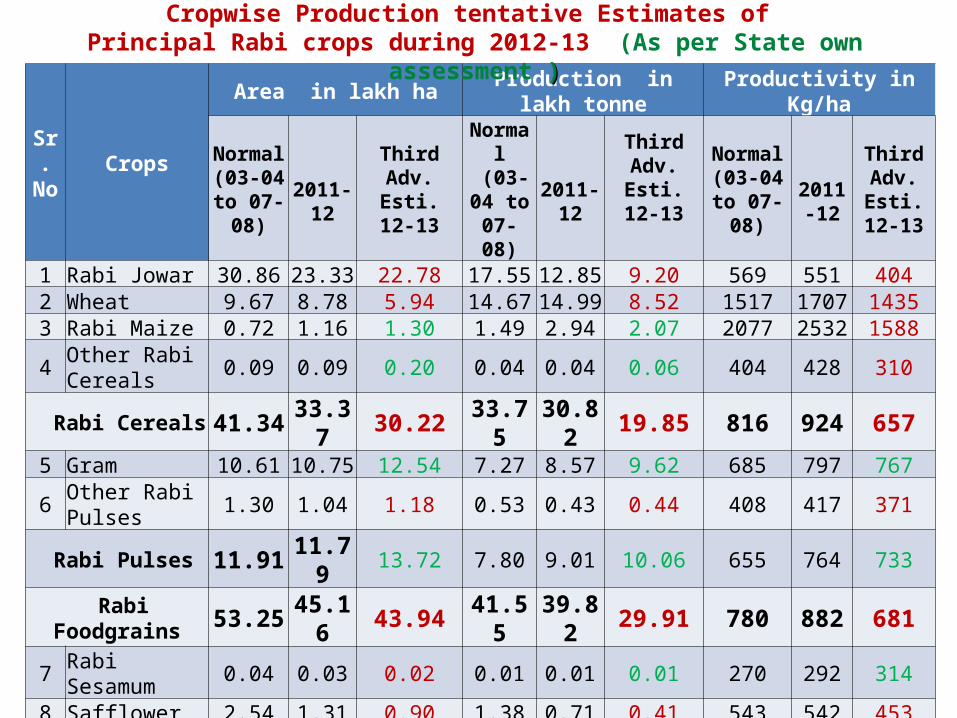
1 Rabi Jowar 30.86 23.33 22.78 17.55 12.85 9.20 569 551 4042 Wheat 9.67 8.78 5.94 14.67 14.99 8.52 1517 1707 14353 Rabi Maize 0.72 1.16 1.30 1.49 2.94 2.07 2077 2532 1588
4 Other Rabi Cereals 0.09 0.09 0.20 0.04 0.04 0.06 404 428 310
Rabi Cereals 41.34 33.37 30.22 33.75 30.82 19.85 816 924 6575 Gram 10.61 10.75 12.54 7.27 8.57 9.62 685 797 767
6 Other Rabi Pulses 1.30 1.04 1.18 0.53 0.43 0.44 408 417 371
Rabi Pulses 11.91 11.79 13.72 7.80 9.01 10.06 655 764 733 Rabi Foodgrains 53.25 45.16 43.94 41.55 39.82 29.91 780 882 6817 Rabi Sesamum 0.04 0.03 0.02 0.01 0.01 0.01 270 292 3148 Safflower 2.54 1.31 0.90 1.38 0.71 0.41 543 542 4539 Rabi Sunflower 2.03 0.55 0.28 1.12 0.34 0.08 554 607 301
10 Linseed 0.63 0.31 0.26 0.16 0.08 0.10 254 246 370
11 Rapeseed & Mustard 0.11 0.13 0.09 0.04 0.04 0.02 335 339 249
Rabi Oilseeds 5.35 2.33 1.55 2.71 1.17 0.62 507 503 398 Rabi crops 58.60 47.50 45.49
Cropwise Production tentative Estimates of Principal Rabi crops during 2012-13 (As per State own assessment ))
15
Sr. No Crops
Area in lakh ha Production in lakh tonne Productivity in Kg/ha
Normal (03-04 to 07-
08)
2011-12
Target for
12-13.
Normal (03-04 to
07-08) 2011-12
Target for
12-13.
Normal (03-04 to
07-08)
2011-12
Target for 12-13.
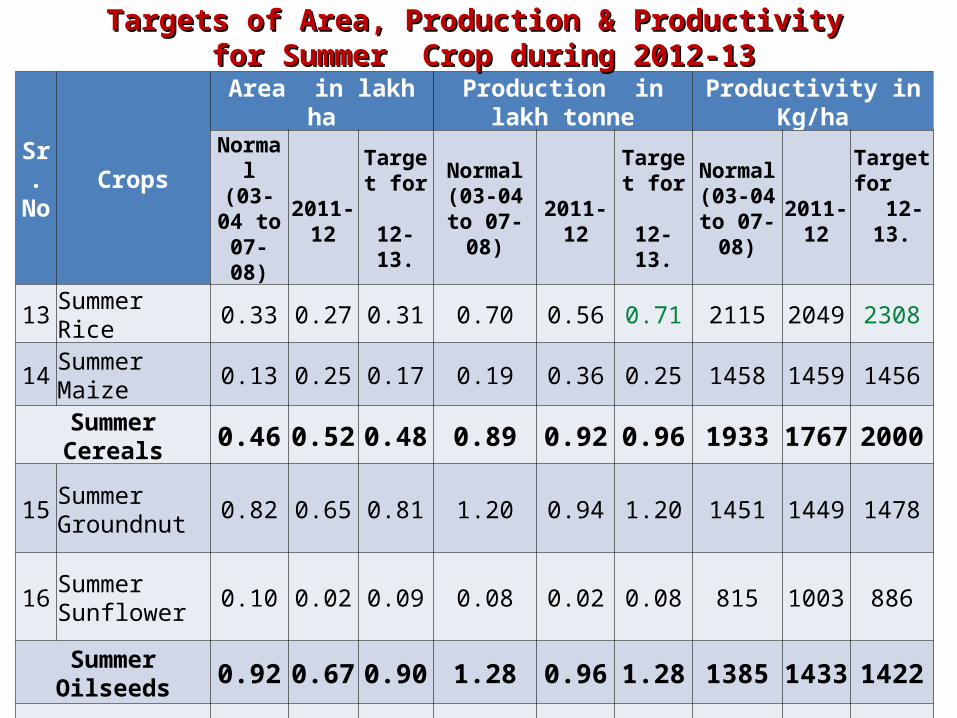
13 Summer Rice 0.33 0.27 0.31 0.70 0.56 0.71 2115 2049 2308
14 Summer Maize 0.13 0.25 0.17 0.19 0.36 0.25 1458 1459 1456
Summer Cereals 0.46 0.52 0.48 0.89 0.92 0.96 1933 1767 2000
15 Summer Groundnut 0.82 0.65 0.81 1.20 0.94 1.20 1451 1449 1478
16 Summer Sunflower 0.10 0.02 0.09 0.08 0.02 0.08 815 1003 886
Summer Oilseeds 0.92 0.67 0.90 1.28 0.96 1.28 1385 1433 1422
Summer crops 1.38 1.19 1.38
Targets of Area, Production & ProductivityTargets of Area, Production & Productivity for Summer Crop during 2012-13for Summer Crop during 2012-13
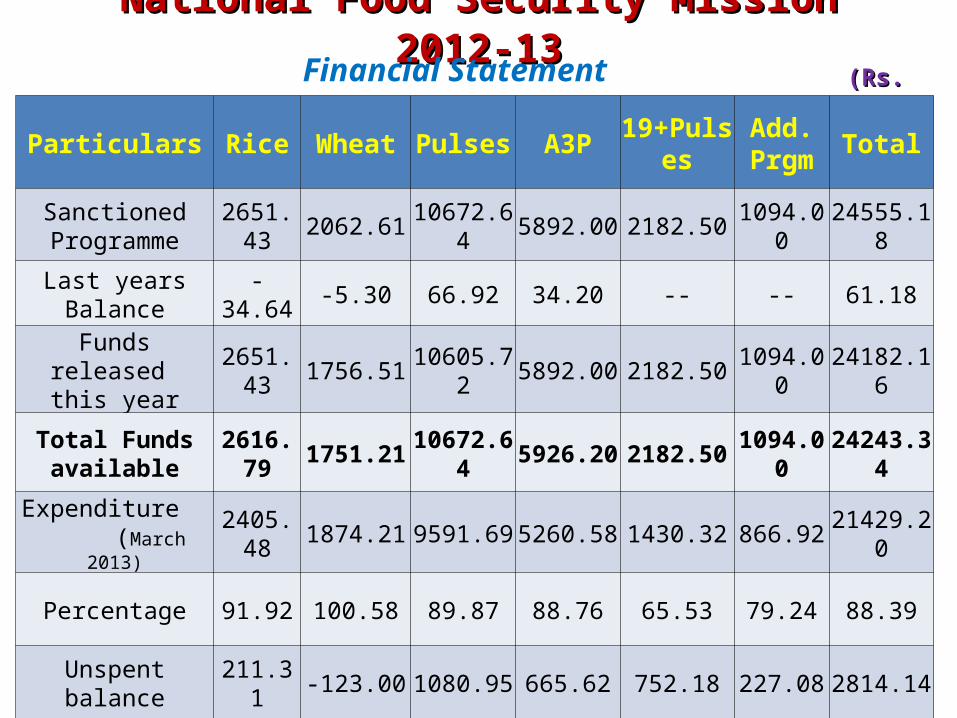
National Food Security Mission 2012-13National Food Security Mission 2012-13(Rs. Lakh)(Rs. Lakh)Financial Statement
16
Particulars Rice Wheat Pulses A3P 19+Pulses Add. Prgm Total
Sanctioned Programme 2651.43 2062.61 10672.64 5892.00 2182.50 1094.00 24555.18
Last years Balance -34.64 -5.30 66.92 34.20 -- -- 61.18
Funds released this year 2651.43 1756.51 10605.72 5892.00 2182.50 1094.00 24182.16
Total Funds available 2616.79 1751.21 10672.64 5926.20 2182.50 1094.00 24243.34
Expenditure (March 2013)
2405.48 1874.21 9591.69 5260.58 1430.32 866.92 21429.20
Percentage 91.92 100.58 89.87 88.76 65.53 79.24 88.39
Unspent balance 211.31 -123.00 1080.95 665.62 752.18 227.08 2814.14
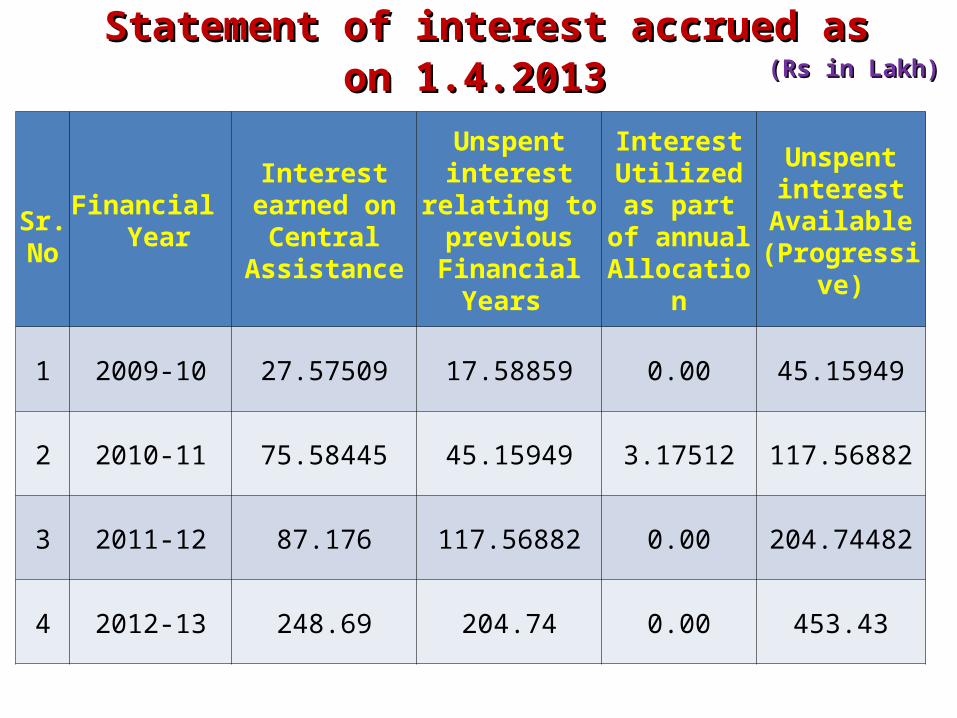
Sr. No
Financial Year
Interest earned on Central Assistance
Unspent interest relating
to previous Financial Years
Interest Utilized as
part of annual
Allocation
Unspent interest
Available (Progressive)
1 2009-10 27.57509 17.58859 0.00 45.15949
2 2010-11 75.58445 45.15949 3.17512 117.56882
3 2011-12 87.176 117.56882 0.00 204.74482
4 2012-13 248.69 204.74 0.00 453.43
Statement of interest accrued as on 1.4.2013Statement of interest accrued as on 1.4.2013(Rs in Lakh)(Rs in Lakh)
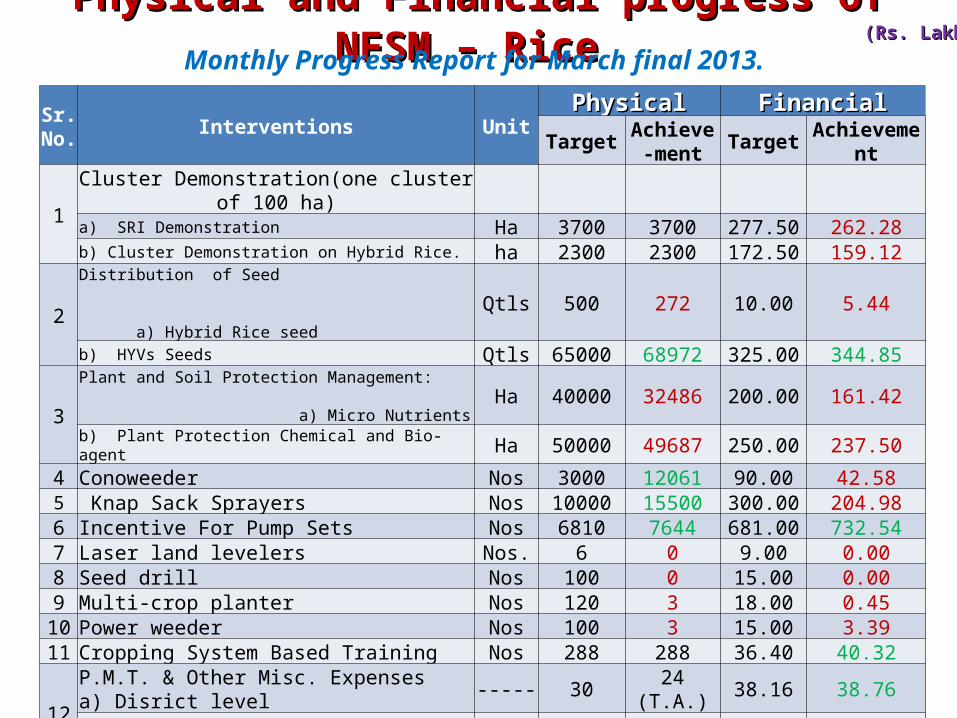
Physical and Financial progress of NFSM – Rice Physical and Financial progress of NFSM – Rice (Rs. Lakh)(Rs. Lakh)
Sr. No. Interventions Unit
PhysicalPhysical FinancialFinancial
Target Achieve-ment Target Achievement
1Cluster Demonstration(one cluster of 100 ha)
a) SRI Demonstration Ha 3700 3700 277.50 262.28b) Cluster Demonstration on Hybrid Rice. ha 2300 2300 172.50 159.12
2Distribution of Seed a) Hybrid Rice seed Qtls 500 272 10.00 5.44
b) HYVs Seeds Qtls 65000 68972 325.00 344.85
3Plant and Soil Protection Management: a) Micro Nutrients Ha 40000 32486 200.00 161.42
b) Plant Protection Chemical and Bio-agent Ha 50000 49687 250.00 237.504 Conoweeder Nos 3000 12061 90.00 42.585 Knap Sack Sprayers Nos 10000 15500 300.00 204.986 Incentive For Pump Sets Nos 6810 7644 681.00 732.547 Laser land levelers Nos. 6 0 9.00 0.008 Seed drill Nos 100 0 15.00 0.009 Multi-crop planter Nos 120 3 18.00 0.45
10 Power weeder Nos 100 3 15.00 3.3911 Cropping System Based Training Nos 288 288 36.40 40.32
12P.M.T. & Other Misc. Expensesa) Disrict level ----- 30 24 (T.A.) 38.16 38.76
b) State level ----- 4 2 (T.A.) 13.87 3.84
13 Local Initiative ---- ------ ---- 200.00 168.01
Total --- --- --- 2651.43 2405.48
Monthly Progress Report for March final 2013.

(Rs. Lakh)(Rs. Lakh)
Sr. No. Interventions Unit
PhysicalPhysical FinancialFinancial
Target Achieve-ment Target Achieve-ment
1 Cluster Demonstrations (100 ha.each) Ha 3750 3630 187.50 170.45
2 Assistance of Distribution of HYVs Seeds Qtls 100000 108043 500 507.34
3
Need Based Plant/Soil Management:
a) Micro Nutrients Ha 12500 11105 62.50 48.13b) Gypsum Ha 40000 18741 200.00 108.48c) Plant Protection Chemical and Bioagent Ha 25000 14332 125.00 67.15
4a) Knap Sack Sprayers Nos 7000 12376 210.00 224.60b) Rotavaters Nos 450 493 135.00 141.30
5 Effective Water Application Tools-Pump Sets
Nos 3000 5205 300.00 513.45
6 Laser Land Levelers Nos. 8 0 12.00 0.007 Seed Drill Nos 1000 80 150.00 0.008 Cropping System Based Training Nos 273 273 35.70 35.66
9P.M.T. & Other Misc. Expensesa) Disrict level
---- 40 33(T.A.) 51.04 43.64
b) State level ----- 4 2 (T.A.) 13.87 4.01
10 Local Initiative
---- ------ ----- 80.00 10.00
Total --- --- ----- 2062.61 1874.21
Physical and Financial progress of NFSM – WheatPhysical and Financial progress of NFSM – Wheat Monthly Progress Report for March 2013.

National Food Security Mission-PulsesNational Food Security Mission-Pulses (Rs. Lakh) Monthly Progress Report for March 2013.
Sr. No. Interventions Unit
Physical Financial
Target Achievement Target Achievement
1 Distribution of Certified Seeds.
Qtl.120000 114653 1740.00 1757.71
a) For varieties less than 10 year 30000 28663 660.00 439.43b) For varieties more than 10 year old 90000 85990 1080.00 1318.28
2 Demonstrations on Improved Technologies :-a) Cluster Demonstrations (of 100 ha. each) Nos. 61500 60900 3075.00 2583.01
Demonstrations under Dry Land Mission Nos. 33560 33560 1678.00 1586.47
3 Integrated Nutrient Management:-a) Micronutrients Ha 85000 81193 425.00 364.75(b) Lime/Gypsum/Sulphur 80% WDG Ha 85000 59492 637.50 403.63(c) Assistance for Rhizobium Culture/PSB distribution Ha 85000 71963 85.00 68.34
Sub Total of 3 255000 212648 1147.50 836.72
4 Integrated Pest Management (IPM):-(a) IPM Package. Ha 85000 80816 637.50 575.37(b) Distribution of NPV. Ha 5000 3264 12.50 7.71c) Distribution of PP Chemicals . Ha 70000 65887 350.00 320.32(d) Weedicides Ha 10000 88 50.00 0.19Sub Total of 4 170000 150055 1050.00 903.59
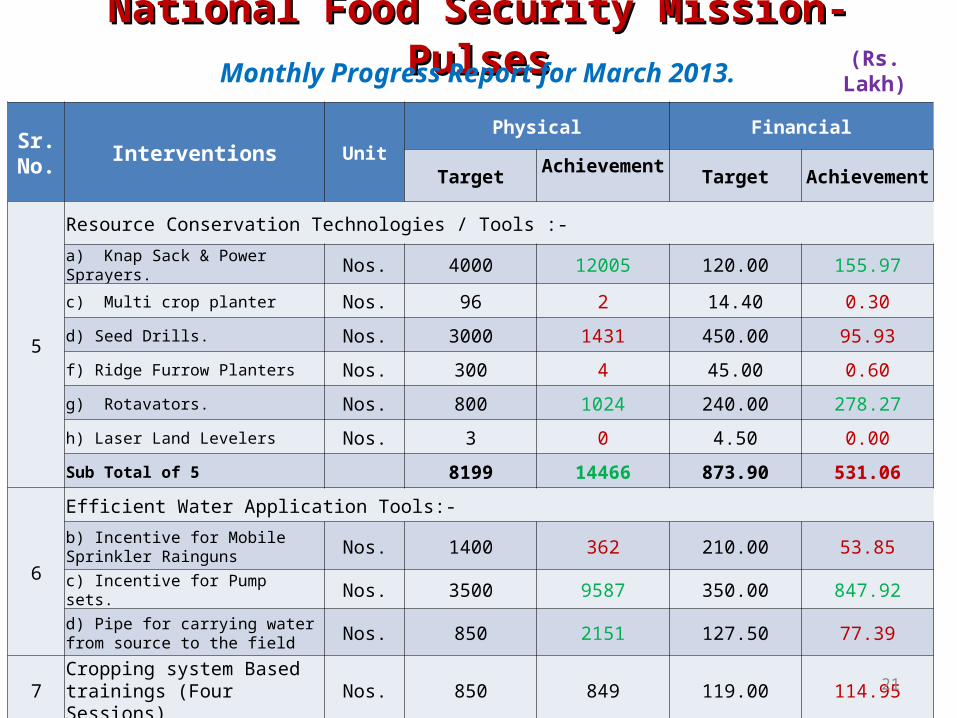
National Food Security Mission-PulsesNational Food Security Mission-Pulses
Sr. No. Interventions Unit
Physical Financial
Target Achievement Target Achievement
5
Resource Conservation Technologies / Tools :-
a) Knap Sack & Power Sprayers. Nos. 4000 12005 120.00 155.97
c) Multi crop planter Nos. 96 2 14.40 0.30
d) Seed Drills. Nos. 3000 1431 450.00 95.93
f) Ridge Furrow Planters Nos. 300 4 45.00 0.60
g) Rotavators. Nos. 800 1024 240.00 278.27
h) Laser Land Levelers Nos. 3 0 4.50 0.00
Sub Total of 5 8199 14466 873.90 531.06
6
Efficient Water Application Tools:-
b) Incentive for Mobile Sprinkler Rainguns Nos. 1400 362 210.00 53.85
c) Incentive for Pump sets. Nos. 3500 9587 350.00 847.92
d) Pipe for carrying water from source to the field Nos. 850 2151 127.50 77.39
7 Cropping system Based trainings (Four Sessions) Nos. 850 849 119.00 114.95
(Rs. Lakh) Monthly Progress Report for March 2013.
21
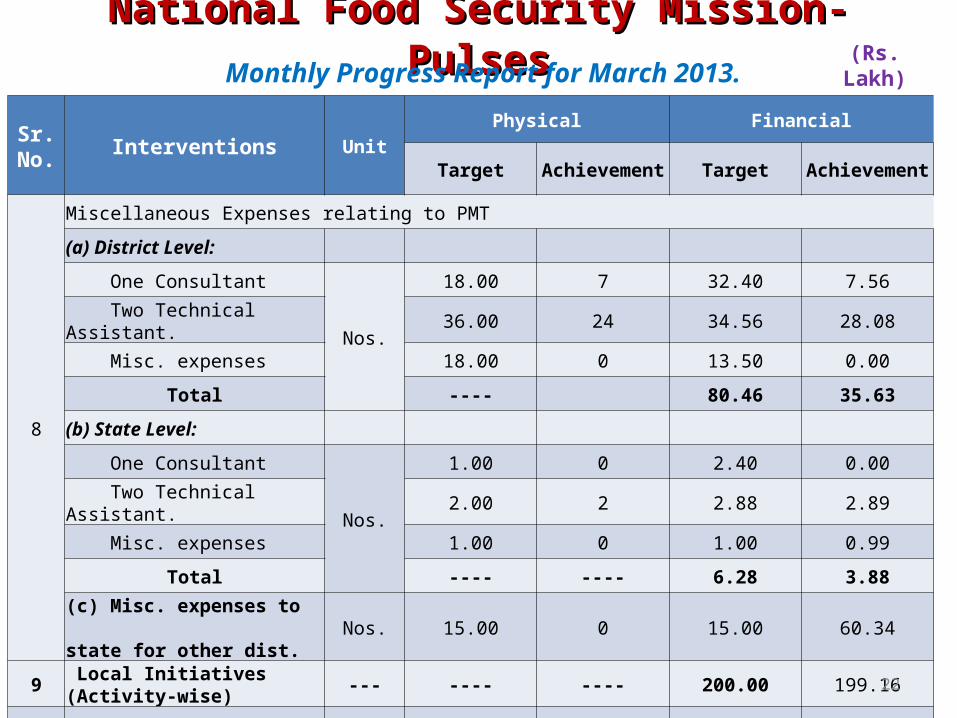
National Food Security Mission-PulsesNational Food Security Mission-Pulses
Sr. No. Interventions Unit
Physical Financial
Target Achievement Target Achievement
8
Miscellaneous Expenses relating to PMT
(a) District Level:
One Consultant
Nos.
18.00 7 32.40 7.56
Two Technical Assistant. 36.00 24 34.56 28.08
Misc. expenses 18.00 0 13.50 0.00
Total ---- 80.46 35.63
(b) State Level:
One Consultant
Nos.
1.00 0 2.40 0.00
Two Technical Assistant. 2.00 2 2.88 2.89
Misc. expenses 1.00 0 1.00 0.99
Total ---- ---- 6.28 3.88(c) Misc. expenses to state for other dist. Nos. 15.00 0 15.00 60.34
9 Local Initiatives (Activity-wise) --- ---- ---- 200.00 199.16
Total --- ---- ---- 10672.64 9591.69
(Rs. Lakh) Monthly Progress Report for March 2013.
22
23
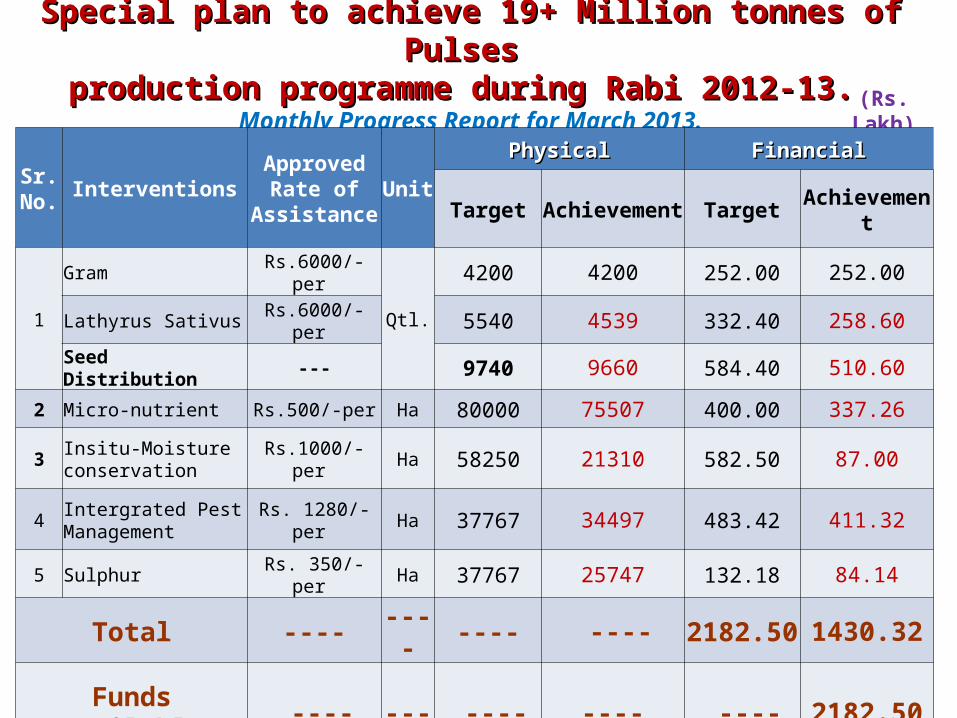
Special plan to achieve 19+ Million tonnes of Pulses Special plan to achieve 19+ Million tonnes of Pulses production programme during Rabi 2012-13. production programme during Rabi 2012-13.
Monthly Progress Report for March 2013. (Rs. Lakh)
Sr. No. Interventions
Approved Rate of
AssistanceUnit
PhysicalPhysical FinancialFinancial
Target Achievement Target Achievement
1
Gram Rs.6000/-per
Qtl.
4200 4200 252.00 252.00
Lathyrus Sativus Rs.6000/-per 5540 4539 332.40 258.60
Seed Distribution --- 9740 9660 584.40 510.60
2 Micro-nutrient Rs.500/-per Ha 80000 75507 400.00 337.26
3 Insitu-Moisture conservation Rs.1000/-per Ha 58250 21310 582.50 87.00
4 Intergrated Pest Management Rs. 1280/-per Ha 37767 34497 483.42 411.32
5 Sulphur Rs. 350/-per Ha 37767 25747 132.18 84.14
Total ---- ---- ---- ---- 2182.50 1430.32Funds Available ---- ---- ---- ---- ---- 2182.50
Percentage ---- ---- ---- ---- ---- 65.53
2424
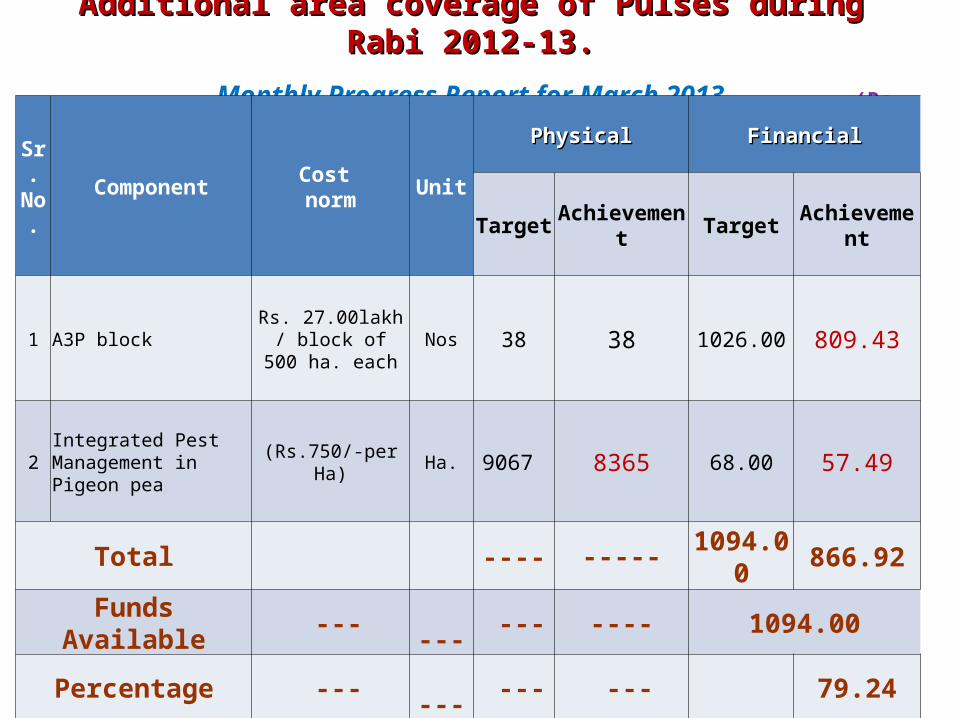
Additional area coverage of Pulses during Rabi 2012-13.Additional area coverage of Pulses during Rabi 2012-13.
Monthly Progress Report for March 2013. (Rs. Lakh)
Sr. No. Component Cost
norm Unit
PhysicalPhysical FinancialFinancial
Target Achievement Target Achievement
1 A3P blockRs. 27.00lakh / block of 500 ha.
eachNos 38 38 1026.00 809.43
2Integrated Pest Management in Pigeon pea
(Rs.750/-per Ha) Ha. 9067 8365 68.00 57.49
Total ---- ----- 1094.00 866.92
Funds Available --- --- --- ---- 1094.00
Percentage --- --- --- --- 79.24
25
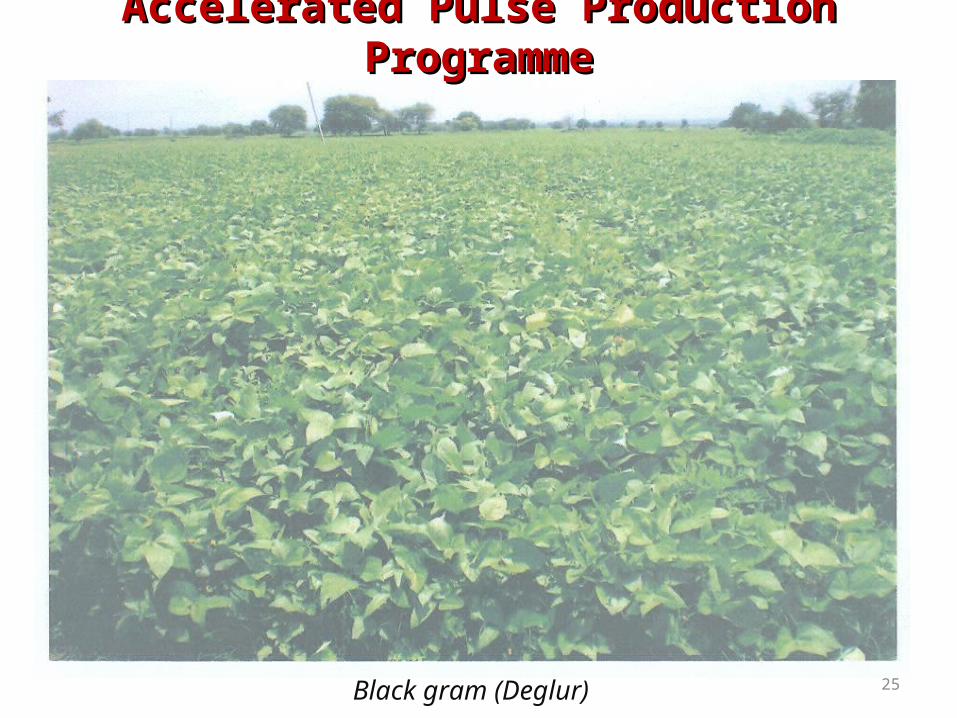
Accelerated Pulse Production ProgrammeAccelerated Pulse Production Programme
Black gram (Deglur)
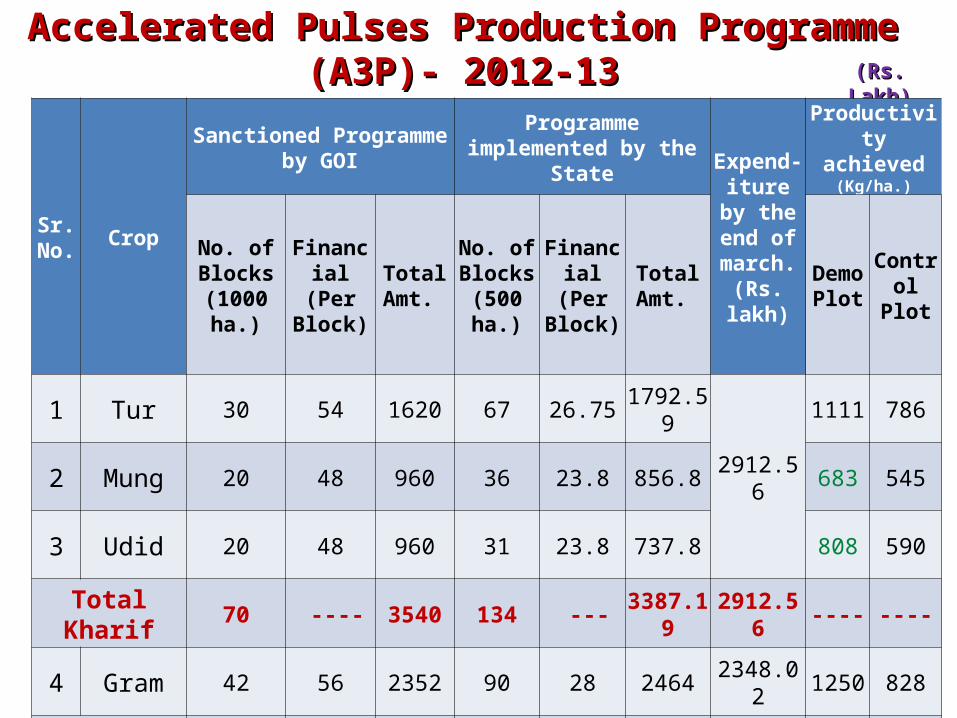
Accelerated Pulses Production Programme (A3P)- 2012-13Accelerated Pulses Production Programme (A3P)- 2012-13
26
(Rs. Lakh)(Rs. Lakh)
Sr. No. Crop
Sanctioned Programme by GOI
Programme implemented by the State Expend-
iture by the end of
march. (Rs. lakh)
Productivity achieved
(Kg/ha.)
No. of Blocks
(1000 ha.)
Financial (Per
Block)
Total Amt.
No. of Blocks
(500 ha.)
Financial (Per
Block)
Total Amt.
Demo Plot
Control Plot
1 Tur 30 54 1620 67 26.75 1792.59
2912.56
1111 786
2 Mung 20 48 960 36 23.8 856.8 683 545
3 Udid 20 48 960 31 23.8 737.8 808 590
Total Kharif 70 ---- 3540 134 --- 3387.19 2912.56 ---- ----
4 Gram 42 56 2352 90 28 2464 2348.02 1250 828
Total kh.+ Rabi
112 ----- 5892 224 ----- 5851.19 5260.58 ---- ----
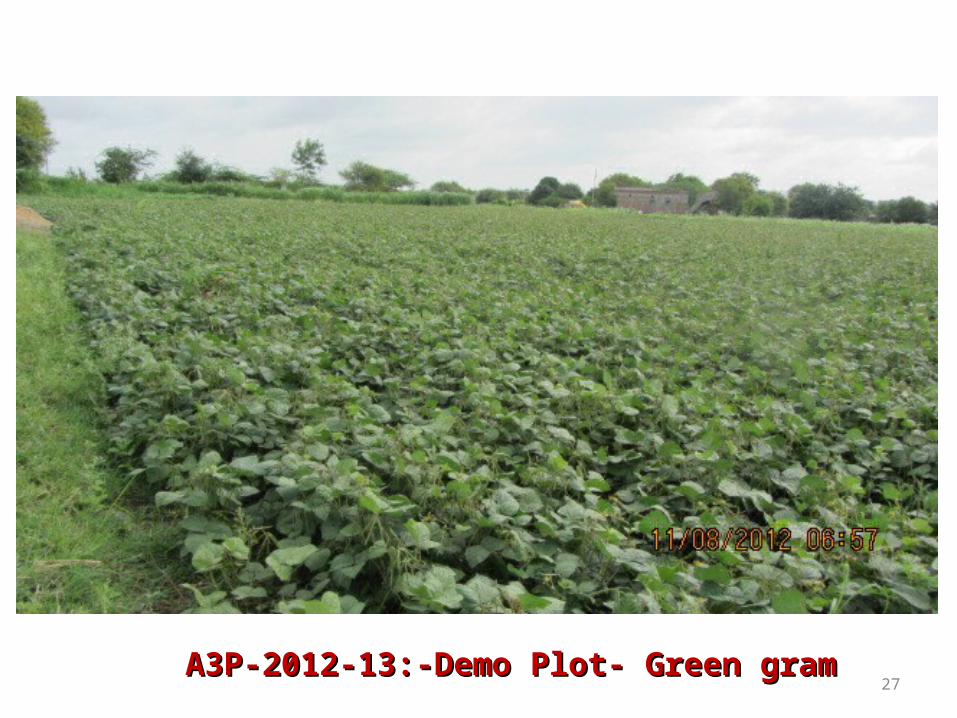
27A3P-2012-13:-Demo Plot- Green gramA3P-2012-13:-Demo Plot- Green gram
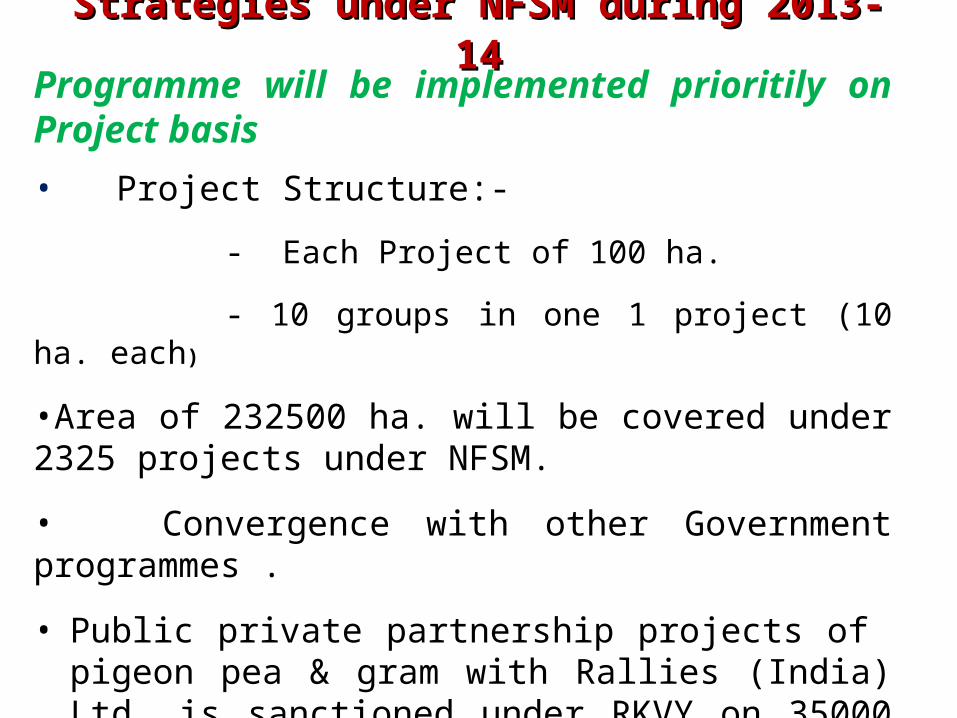
Programme will be implemented prioritily on Project basis• Project Structure:-
- Each Project of 100 ha.
- 10 groups in one 1 project (10 ha. each)
•Area of 232500 ha. will be covered under 2325 projects under NFSM.
• Convergence with other Government programmes .
• Public private partnership projects of pigeon pea & gram with Rallies (India) Ltd. is sanctioned under RKVY on 35000 ha.
Strategies under NFSM during 2013-14Strategies under NFSM during 2013-14
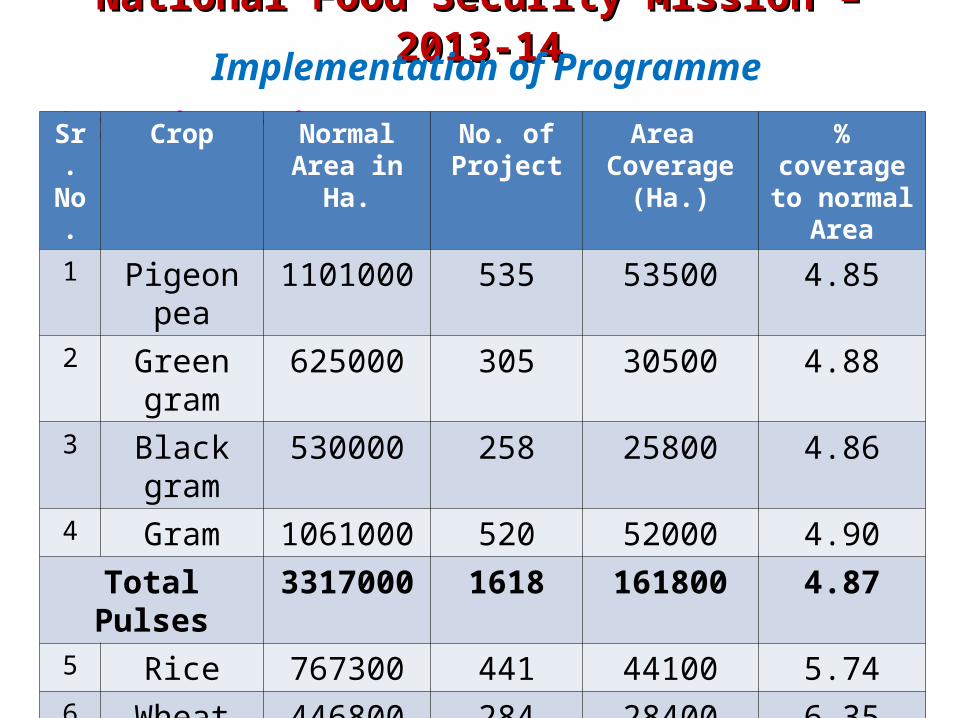
Crop wise Projects:-Sr. No.
Crop Normal Area in Ha.
No. of Project
Area Coverage
(Ha.)
% coverage to normal
Area
1 Pigeon pea 1101000 535 53500 4.85
2 Green gram
625000 305 30500 4.88
3 Black gram 530000 258 25800 4.864 Gram 1061000 520 52000 4.90Total Pulses 3317000 1618 161800 4.87
5 Rice 767300 441 44100 5.746 Wheat 446800 284 28400 6.35
Total Project 4531100 2343 234300 5.17
National Food Security Mission – 2013-14National Food Security Mission – 2013-14Implementation of Programme

30
i. Reduction of area under intercropping of pigeon pea & cotton as they are not companion crops.
ii. Encouragement of Arhar+ soyabean cropping pattern.
iii. At present Soybean + Arhar is grown in proportion of 6:1 in the state instead it should be in row 4:1
iv. Mung is generally grown as sole crop. To some extent it is also grown as intercrop in kh. Sorghum, Bajra, Cotton.
v. Instead of Arhar, Mung should be promoted as intercrop in cotton.
vi. Introduction of powdery mildew resistant varieties of mung & udid in paddy area of Eastern Vidharbha & Konkan region
vii. Timely supply of inputs.
Strategies for increasing Production of PulsesStrategies for increasing Production of Pulses
Crop Diversification / area expansion :-
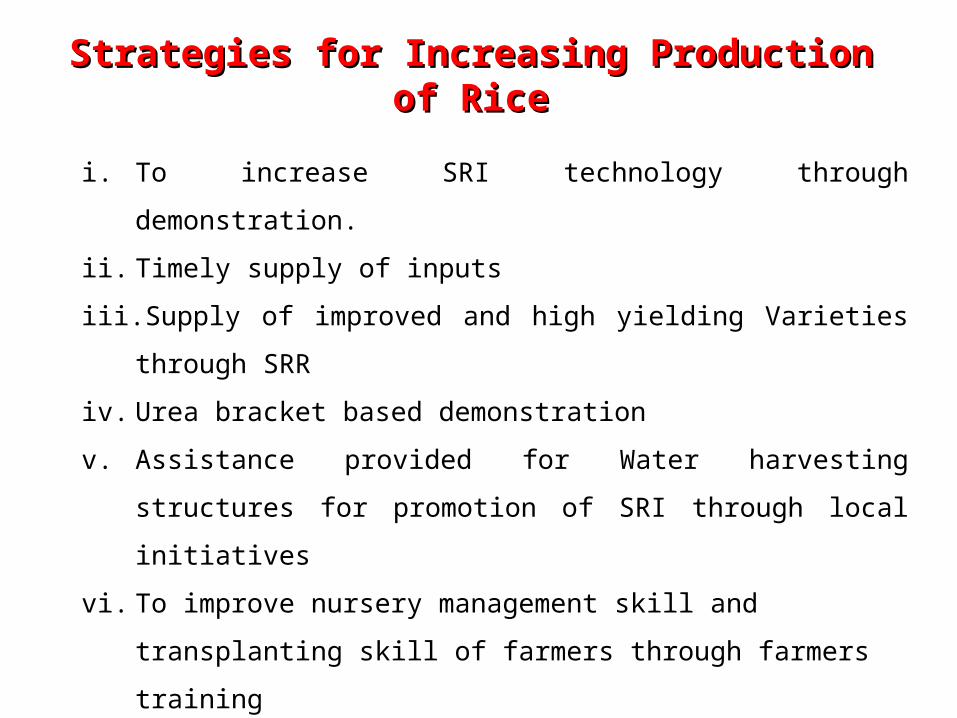
i. To increase SRI technology through demonstration.
ii. Timely supply of inputs
iii. Supply of improved and high yielding Varieties through SRR
iv. Urea bracket based demonstration
v. Assistance provided for Water harvesting structures for promotion of
SRI through local initiatives
vi. To improve nursery management skill and transplanting skill of farmers
through farmers training
Strategies for Increasing Production of RiceStrategies for Increasing Production of Rice
32
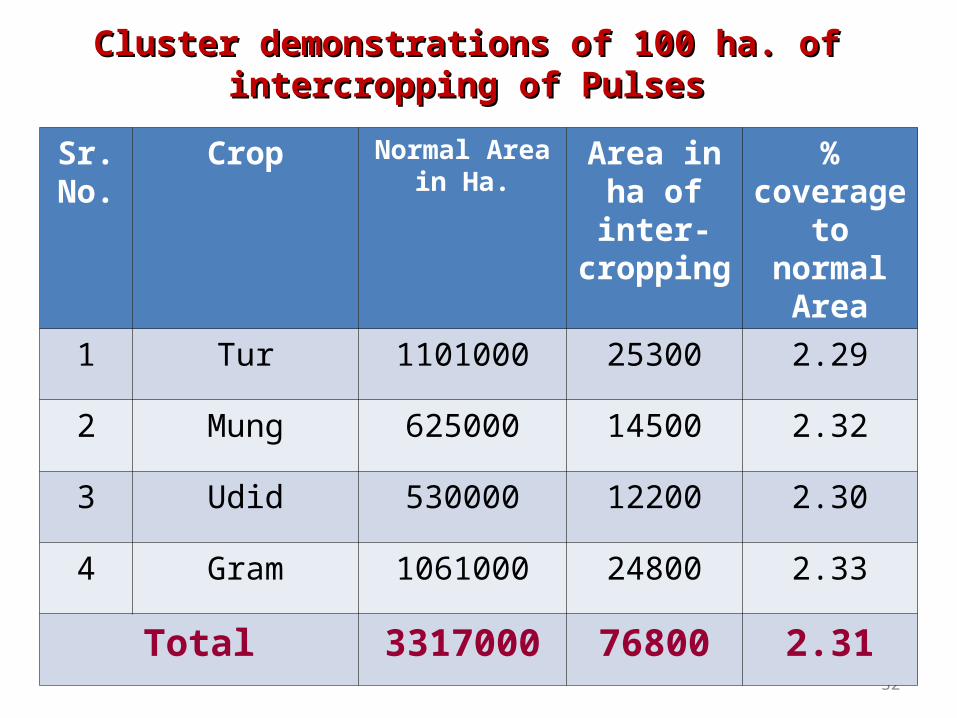
Cluster demonstrations of 100 ha. of intercropping of PulsesCluster demonstrations of 100 ha. of intercropping of Pulses
Sr. No.
Crop Normal Area in Ha.
Area in ha of inter-cropping
% coverage to normal
Area
1 Tur 1101000 25300 2.29
2 Mung 625000 14500 2.32
3 Udid 530000 12200 2.30
4 Gram 1061000 24800 2.33
Total 3317000 76800 2.31

33
• Seed treatment with fungicides & bio-fertilizers• Sowing on BBF• Use of mid late, disease resistant varieties like Rajeshwari,
Vipula, BDN-708 in Tur & use of powdery mildew & yellow vein mosaic resistant varieties like vaibhav, BPMR-145 in Mung
• Protective irrigations during flowering and pod development
• 2 % spray of KNO3 at pod initiation & grain development • Integrated weed management• Integrated pest management• Seed production of varieties of mid late duration with
resistance/ tolerance to biotic and a biotic stresses
ProductivityProductivity Increase in PulsesIncrease in Pulses

Special initiatives takenSpecial initiatives taken
• Projectised approach in the implementation of NFSM since 2011-12. Some projects were for seed production.
• Convergence of schemes :-
1) NFSM 2) RKVY
3) Mechanization 4) ATMA
5) Micro-Irrigation 6) CROPSAP
• Community nurseries in Paddy
•Food Grain bazzars (Dhanya bazzars) for sale of cereals and pulses from directly farmers to customers.
• Soil Health Mission.
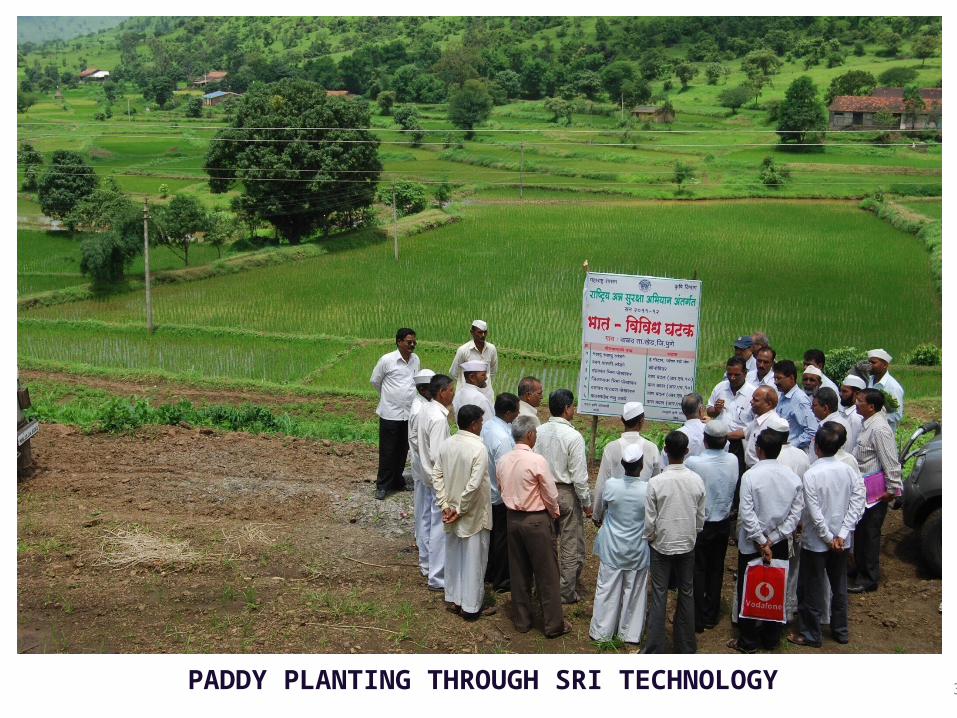
35PADDY PLANTING THROUGH SRI TECHNOLOGY

Input planning for kharif 2013-14Input planning for kharif 2013-14Sr. No.
Input Crop Requirement Availability Nodal
agency Remark
1Seed in
Qtls.
Paddy improved varieties
70000 120252 M.S.S.C.
Supply in progress. Seed is availablePaddy Hybrid 2000 3227 M.S.S.C.
Pigeon pea 12167 12167 M.S.S.C.Green gram 4710 4710 M.S.S.C.Black gram 16080 16080 M.S.S.C.
2 Micronutrients (ZnSo4, FeSo4) in MT
2950 2950 M.A.I.D.C. /MARKFED Micronutrients &
Gypsum available. Supply in progress 3 Gypsum in MT 13000 13000 M.A.I.D.C.
/MARKFED
4 Bio-fertilizers in MT 65 65 M.A.I.D.C. /MARKFED
Bio-fertilizers available
Supply in progress
5Plant protection (Pesticides & Bio-
pesticides)
------ M.A.I.D.C. /MARKFED
Pesticides & Bio-pesticides available. Supply in progress

Accelerated Pulse Production ProgrammeAccelerated Pulse Production Programme
Pigeon Pea (Badnapur, Dist :- Jalna) 37

Strategies For Increasing Production of RiceStrategies For Increasing Production of Rice
Sr. No. Districts
Normal Normal Area Area
(00 ha) (00 ha)
SRI Demonstration (ha)SRI Demonstration (ha) Hybrid Rice Demonstration (ha)Hybrid Rice Demonstration (ha)
Physical Financial % area covered Physical Financial % area covered
1 Nasik 504 800 60.00 1.5 350 22.50 0.6
2 Pune 638 900 67.50 1.5 350 22.50 0.5
3 Bhandara 1749 2600 195.00 1.5 850 60.00 0.5
4 Gondia 1862 2800 210.00 1.5 850 60.00 0.5
5 Chandrapur 1445 2200 165.00 1.5 700 45.00 0.5
6 Gadchiroli 1475 2200 165.00 1.5 700 52.50 0.5
Total 7673 11500 862.50 1.5 3800 262.50 0.5
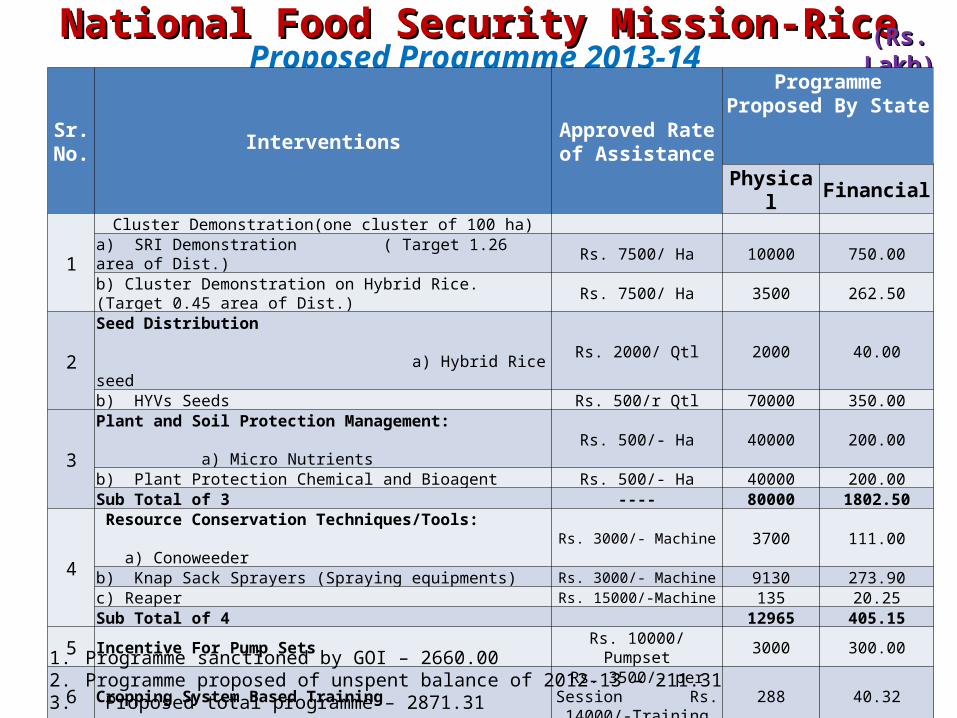
National Food Security Mission-RiceNational Food Security Mission-Rice (Rs. Lakh)(Rs. Lakh) Proposed Programme 2013-14
Sr. No. Interventions Approved Rate of
Assistance
Programme Proposed By State
Physical Financial
1
Cluster Demonstration(one cluster of 100 ha)a) SRI Demonstration ( Target 1.26 area of Dist.) Rs. 7500/ Ha 10000 750.00b) Cluster Demonstration on Hybrid Rice. (Target 0.45 area of Dist.)
Rs. 7500/ Ha 3500 262.50
2Seed Distribution a) Hybrid Rice seed
Rs. 2000/ Qtl 2000 40.00
b) HYVs Seeds Rs. 500/r Qtl 70000 350.00
3
Plant and Soil Protection Management: a) Micro Nutrients
Rs. 500/- Ha 40000 200.00
b) Plant Protection Chemical and Bioagent Rs. 500/- Ha 40000 200.00Sub Total of 3 ---- 80000 1802.50
4
Resource Conservation Techniques/Tools: a) Conoweeder
Rs. 3000/- Machine 3700 111.00
b) Knap Sack Sprayers (Spraying equipments) Rs. 3000/- Machine 9130 273.90c) Reaper Rs. 15000/-Machine 135 20.25Sub Total of 4 12965 405.15
5 Incentive For Pump Sets Rs. 10000/ Pumpset 3000 300.00
6 Cropping System Based Training Rs. 3500/- per Session Rs. 14000/-Training
288 40.32
7Project Management Team & Other Misc. Expensesa) Disrict level
Rs.6.36 Lakh District 6 38.16
b) State level Rs.13.87 Lakh 1 13.87
8 Local Initiative
60.00
Total --- 2660.001. Programme sanctioned by GOI – 2660.002. Programme proposed of unspent balance of 2012-13 – 211.313. Proposed total programme – 2871.31
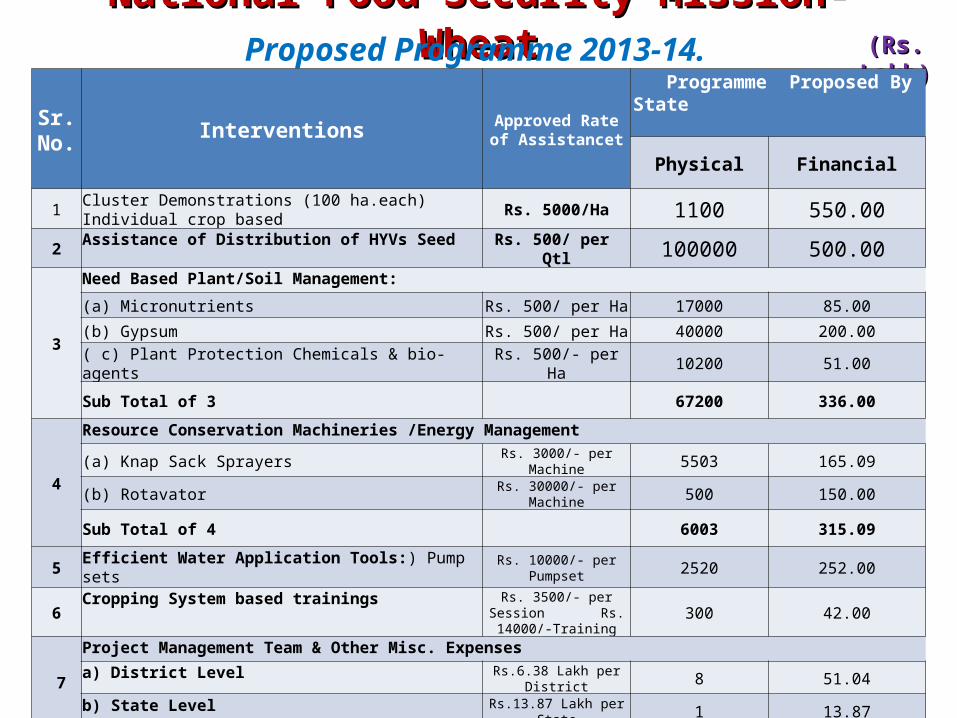
National Food Security Mission-WheatNational Food Security Mission-Wheat(Rs. Lakh)(Rs. Lakh) Proposed Programme 2013-14.
Sr. No. Interventions Approved Rate of
Assistancet
Programme Proposed By State
Physical Financial
1 Cluster Demonstrations (100 ha.each) Individual crop based Rs. 5000/Ha 1100 550.002 Assistance of Distribution of HYVs Seed Rs. 500/ per Qtl 100000 500.00
3
Need Based Plant/Soil Management:
(a) Micronutrients Rs. 500/ per Ha 17000 85.00
(b) Gypsum Rs. 500/ per Ha 40000 200.00
( c) Plant Protection Chemicals & bio-agents Rs. 500/- per Ha 10200 51.00
Sub Total of 3 67200 336.00
4
Resource Conservation Machineries /Energy Management
(a) Knap Sack Sprayers Rs. 3000/- per Machine 5503 165.09
(b) Rotavator Rs. 30000/- per Machine 500 150.00
Sub Total of 4 6003 315.09
5 Efficient Water Application Tools:) Pump sets Rs. 10000/- per Pumpset 2520 252.00
6 Cropping System based trainings Rs. 3500/- per Session Rs. 14000/-Training 300 42.00
7
Project Management Team & Other Misc. Expensesa) District Level Rs.6.38 Lakh per District 8 51.04
b) State Level Rs.13.87 Lakh per State 1 13.87
8 Local initiative 40.00
TOTAL 2100.00

National Food Security Mission-PulsesNational Food Security Mission-Pulses (Rs. Lakh)(Rs. Lakh) Proposed Action Plan 2013-14.
Sr. No. Interventions Cost norm Unit
Programme Proposed By State
Physical Financial
1 Distribution of Certified Seeds. ---
Qtl.128000 1856.00
a) For varieties less than 10 year Rs.2200/- 32000 704.00b) For varieties more than 10 year old Rs.1200/- 96000 1152.00
2 Demonstrations on Improved Technologies :-a) Cluster Demonstrations (of 100 ha. each) Rs.5000/- Nos. 76800 3793.92
3 Integrated Nutrient Management:a) Micronutrients Rs. 500/- Ha Ha 85000 425.00(b) Lime/Gypsum/Sulphur 80% WDG Rs. 750/- Ha Ha 85000 637.50(c) Assistance for Rhizobium Culture/PSB distribution Rs. 100/- Ha Ha 85000 85.00
Sub Total of 3 ---- -- 1147.50
4 Integrated Pest Management (IPM).(a) IPM Package. Rs. 750/- Ha Ha 100000 750.00(b) Distribution of NPV. Rs. 250/- Ha Ha 5054 12.64c) Distribution of PP Chemicals . Rs. 500/- Ha Ha 100000 500.00(d) Weedicides Rs. 500/- Ha Ha 5000 25.00Sub Total of 4 --- 1287.64

National Food Security Mission-PulsesNational Food Security Mission-Pulses (Rs. Lakh)(Rs. Lakh) Proposed Action Plan 2013-14.
Sr. No. Interventions Cost norm Unit
Programme Proposed By State
Physical Financial
5
Resource Conservation Technologies / Tools :-
a) Knap Sack & Power Sprayers. Rs. 3000/- Nos. 10000 300.00
c) Multi crop planter Rs.15000/- Nos. 100 15.00
d) Seed Drills. Rs.15000/- Nos. 3500 525.00
f) Ridge Furrow Planters Rs.15000/- Nos. 1500 225.00
g) Rotavators. Rs. 30000/- Nos. 2300 690.00
Sub Total of 5 --- --- --- 1755.00
6
Efficient Water Application Tools:-
a) Sprinklers set Rs. 7500/- Nos. 9827 737.03
b) Incentive for Mobile Sprinkler Rainguns Rs. 15000/- Raingun. Nos. 300 45.00
c) Incentive for Pump sets. Rs. 10000/- Nos. 1435 143.50
d) Pipe for carrying water from source to the field Rs. 15000/-Farmers. Nos. 850 127.50

National Food Security Mission-PulsesNational Food Security Mission-Pulses (Rs. Lakh)(Rs. Lakh) Proposed Action Plan 2013-14.
Sr. No. Interventions Cost norm Unit
Programme Proposed By State
Physical Financial
7 Cropping system Based trainings (Four Sessions)
Rs. 14,000/- Training Nos. 850 119.00
8
Miscellaneous Expenses relating to PMT(a) District Level: One Consultant
---- Nos.
18 43.20 Two Technical Assistant. 36 64.80 Misc. expenses 18 49.20
Total ---- 157.20(b) State Level:
--- One Consultant
Nos.
1 3.60 Two Technical Assistant. 2 4.32 Misc. expenses 1 1.00
Total ---- 8.92(c) Misc. expenses to state for other dist.
Rs. 1.00 lakh/dist. Nos. 15 21.80
9 Local Initiatives (Activity-wise) --- --- ---- 200.00
Total --- --- --- 11400.001. Programme sanctioned by GOI – 11400.002. Programme proposed from unspent balance of 2012-13 of NFSM pulses, 19+& additional coverage schemes-2060.213. Proposed total programme – 13460.21
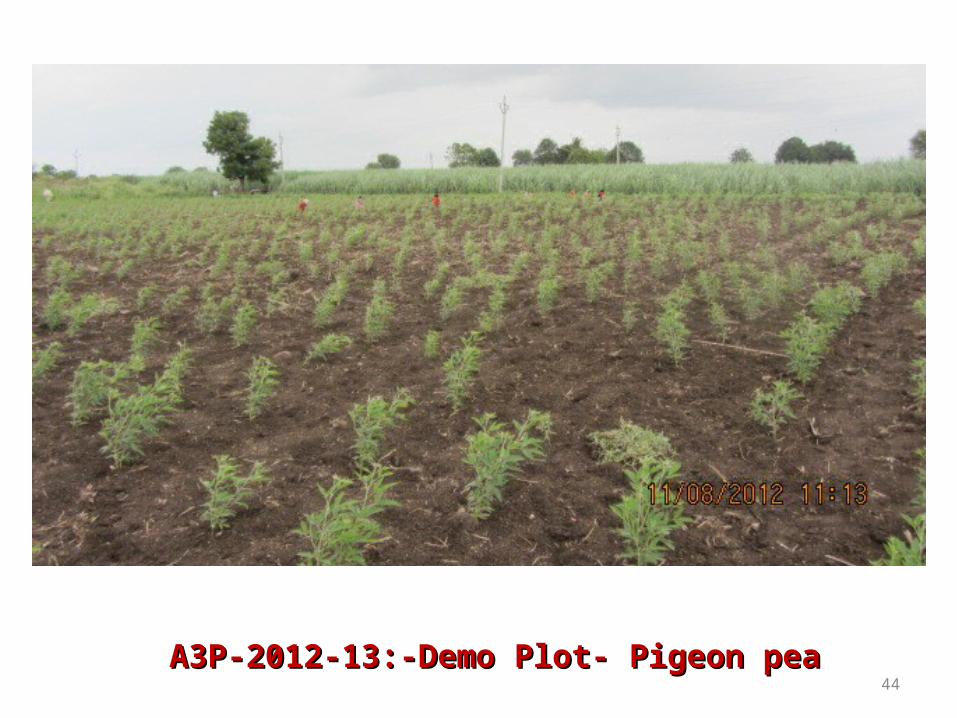
44A3P-2012-13:-Demo Plot- Pigeon peaA3P-2012-13:-Demo Plot- Pigeon pea
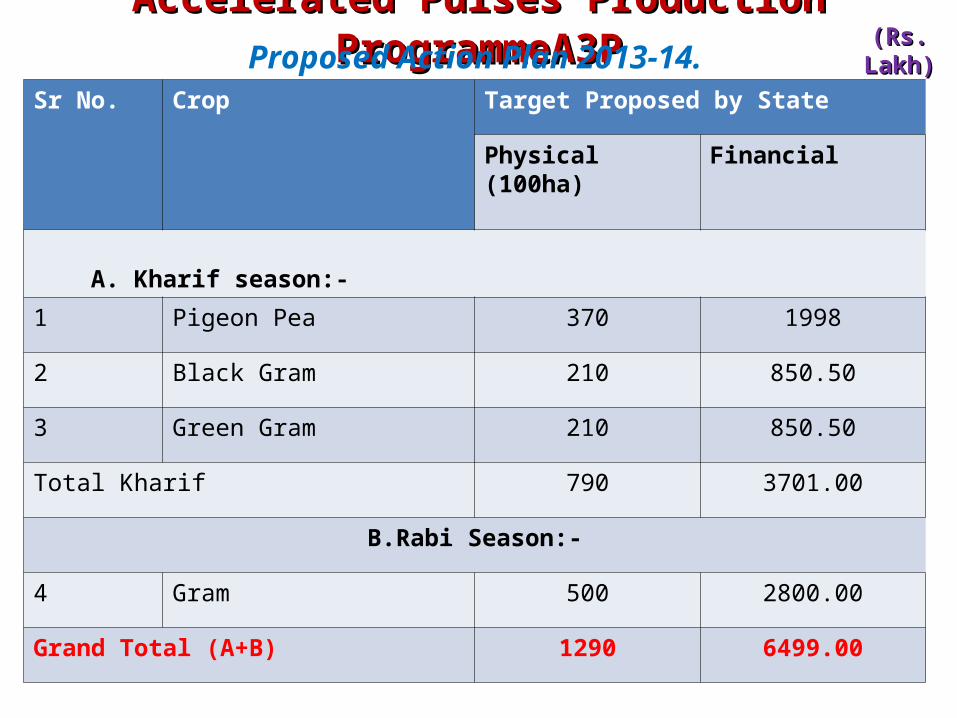
Accelerated Pulses Production ProgrammeA3PAccelerated Pulses Production ProgrammeA3P(Rs. Lakh)(Rs. Lakh) Proposed Action Plan 2013-14.
Sr No. Crop Target Proposed by State
Physical (100ha) Financial
A. Kharif season:-
1 Pigeon Pea 370 1998
2 Black Gram 210 850.50
3 Green Gram 210 850.50
Total Kharif 790 3701.00
B.Rabi Season:-
4 Gram 500 2800.00
Grand Total (A+B) 1290 6499.00

46
Issues for discussionIssues for discussion
Crop Cost of seed/kg
Present norms % Subsidy on actual basis
Pigeon pea 92 50% of the cost or Rs.1200 per qtl whichever is less. i.e. 12Rs/kg
13 %
Green gram 90 50% of the cost or Rs.1200 per qtl whichever is less. i.e. 12Rs/kg
14%
Black Gram 88 50% of the cost or Rs.1200 per qtl whichever is less. i.e. 12Rs/kg
14%
Paddy 29 Assistance @ Rs. 5/- per kg. or 50% of the cost, whichever is less.
17%
• For seed distribution subsidy of Rs. 3500/- per qtl or 50% of the cost whichever is less should be allowed for pulses and for rice & wheat subsidy should be increased upto Rs. 1500/- per qtl or 50% of the cost whichever is less.
• Cost norms are required to be revised as costs of various inputs are increased for example details of seed component are given below:-

47
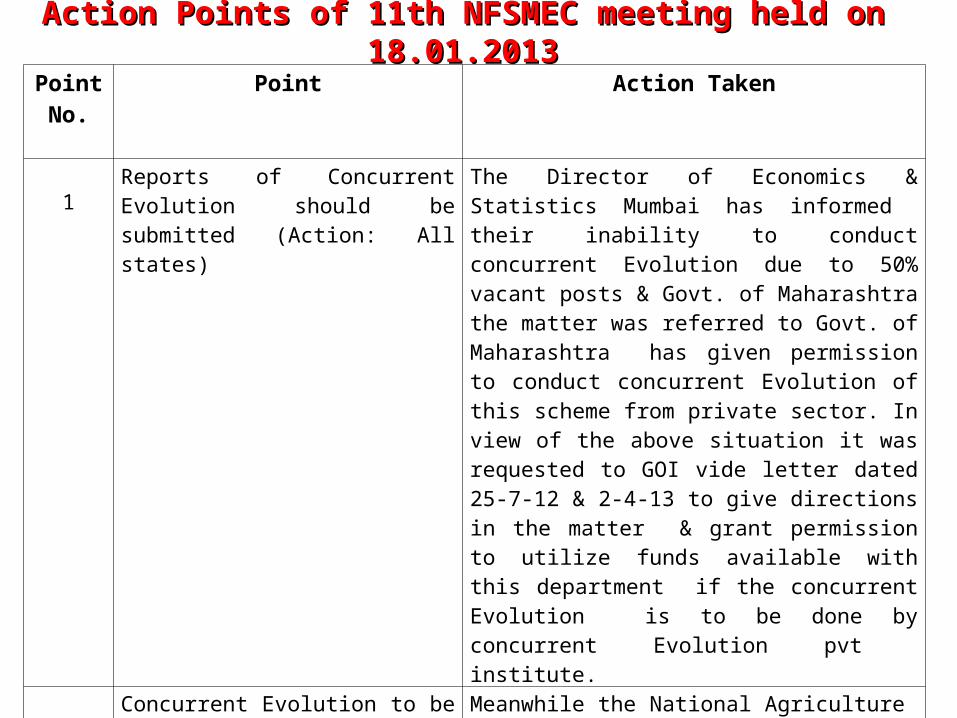
Action Points of 11th NFSMEC meeting held on 18.01.2013Action Points of 11th NFSMEC meeting held on 18.01.2013Point No.
Point Action Taken
1Reports of Concurrent Evolution should be submitted (Action: All states)
The Director of Economics & Statistics Mumbai has informed their inability to conduct concurrent Evolution due to 50% vacant posts & Govt. of Maharashtra the matter was referred to Govt. of Maharashtra has given permission to conduct concurrent Evolution of this scheme from private sector. In view of the above situation it was requested to GOI vide letter dated 25-7-12 & 2-4-13 to give directions in the matter & grant permission to utilize funds available with this department if the concurrent Evolution is to be done by concurrent Evolution pvt institute.
2Concurrent Evolution to be done by reputed faculty/organization who has good manpower/ & expertise (Action : All States)
Meanwhile the National Agriculture Banking Consultancy service NABARD Pune has been requested to conduct concurrent Evolution of NFSM for the year 2011-12 & 2012-13.
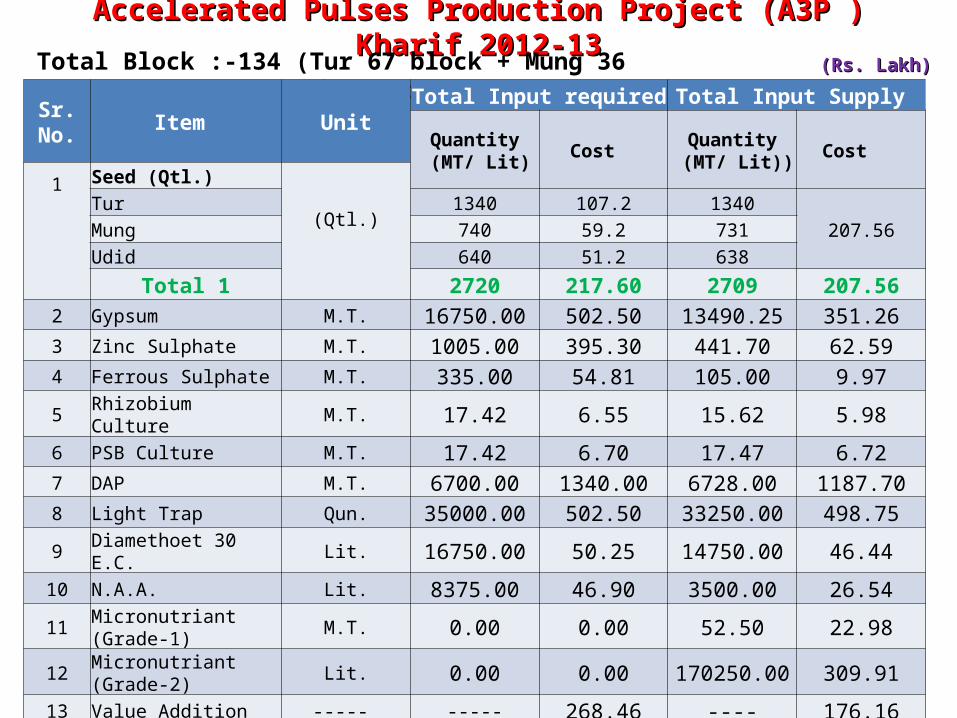
Accelerated Pulses Production Project (A3P ) Kharif 2012-13Accelerated Pulses Production Project (A3P ) Kharif 2012-13Total Block :-134 (Tur 67 block + Mung 36 block + Udid 31 block) (Rs. Lakh)(Rs. Lakh)
Sr.No. Item Unit
Total Input required Total Input Supply
Quantity (MT/ Lit) Cost Quantity
(MT/ Lit)) Cost
1
Seed (Qtl.)
(Qtl.)
Tur 1340 107.2 1340207.56Mung 740 59.2 731
Udid 640 51.2 638
Total 1 2720 217.60 2709 207.562 Gypsum M.T. 16750.00 502.50 13490.25 351.263 Zinc Sulphate M.T. 1005.00 395.30 441.70 62.594 Ferrous Sulphate M.T. 335.00 54.81 105.00 9.975 Rhizobium Culture M.T. 17.42 6.55 15.62 5.986 PSB Culture M.T. 17.42 6.70 17.47 6.727 DAP M.T. 6700.00 1340.00 6728.00 1187.708 Light Trap Qun. 35000.00 502.50 33250.00 498.759 Diamethoet 30 E.C. Lit. 16750.00 50.25 14750.00 46.44
10 N.A.A. Lit. 8375.00 46.90 3500.00 26.5411 Micronutriant (Grade-1) M.T. 0.00 0.00 52.50 22.9812 Micronutriant (Grade-2) Lit. 0.00 0.00 170250.00 309.9113 Value Addition ----- ----- 268.46 ---- 176.16
Total 2 ---- ---- 3173.97 ---- 2705.00Total 1+2 ---- ---- 3391.57 ---- 2912.56
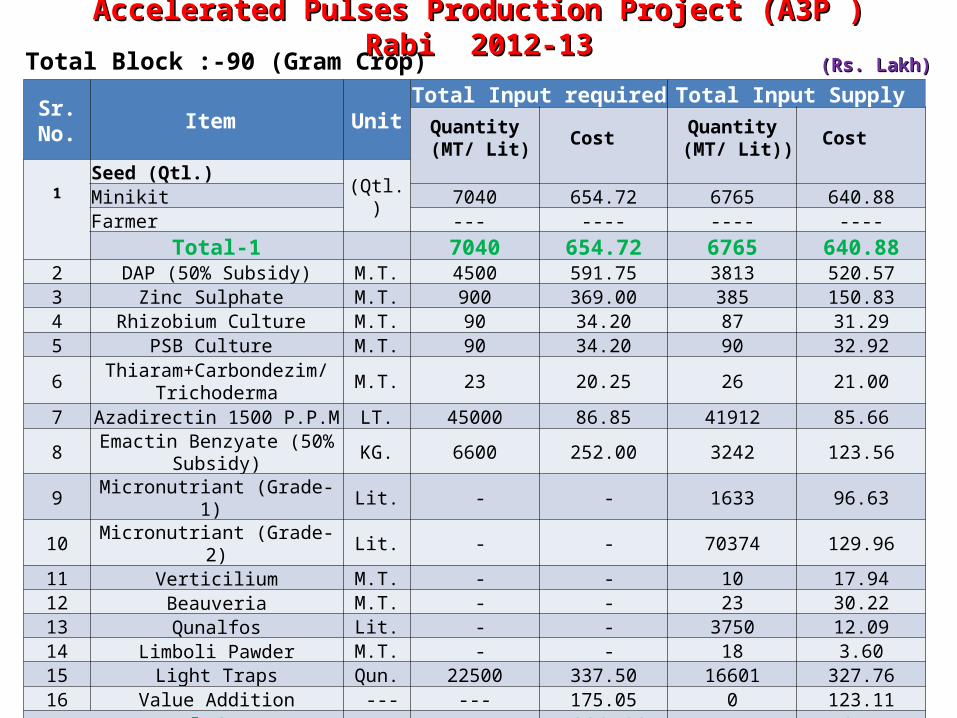
Accelerated Pulses Production Project (A3P ) Rabi 2012-13Accelerated Pulses Production Project (A3P ) Rabi 2012-13Total Block :-90 (Gram Crop) (Rs. Lakh)(Rs. Lakh)
Sr.No. Item Unit
Total Input required Total Input Supply Quantity (MT/ Lit)
Cost
Quantity (MT/ Lit))
Cost
1
Seed (Qtl.)(Qtl.)Minikit 7040 654.72 6765 640.88
Farmer --- ---- ---- ----Total-1 7040 654.72 6765 640.88
2 DAP (50% Subsidy) M.T. 4500 591.75 3813 520.573 Zinc Sulphate M.T. 900 369.00 385 150.834 Rhizobium Culture M.T. 90 34.20 87 31.295 PSB Culture M.T. 90 34.20 90 32.92
6 Thiaram+Carbondezim/Trichoderma M.T. 23 20.25 26 21.00
7 Azadirectin 1500 P.P.M LT. 45000 86.85 41912 85.668 Emactin Benzyate (50% Subsidy) KG. 6600 252.00 3242 123.569 Micronutriant (Grade-1) Lit. - - 1633 96.63
10 Micronutriant (Grade-2) Lit. - - 70374 129.9611 Verticilium M.T. - - 10 17.9412 Beauveria M.T. - - 23 30.2213 Qunalfos Lit. - - 3750 12.0914 Limboli Pawder M.T. - - 18 3.6015 Light Traps Qun. 22500 337.50 16601 327.7616 Value Addition --- --- 175.05 0 123.11
Total-2 ---- ---- 1900.80 --- 1707.14Total 1+2 ---- ---- 2555.52 ---- 2348.02