Embed Size (px)
Citation preview
PETROLEUM RESOURCE ASSESSMENT OF THE EAGLE PLAIN, YUKON TERRITORY, CANADA
National Energy Board for Energy Resources Branch
September 2000Whitehorse, Yukon
Economic Development

© September 2000Department of Economic DevelopmentBox 2703Whitehorse, Yukon Y1A 2C6phone: 867-667-8525fax: 867-393-6262
ISBN 1-55018-802-X
This publication was first produced in November 1994 with corrections made in February 1999 and in September 2000.
FOREWORD
To the CD-ROM version (March 1999)
The Oil and Gas Resources Branch, Department of Economic Development, Government of Yukon are pleased to provide a digital copy of the Petroleum Resource Assessment of the Eagle Plain, Yukon Territory, Canada. The original report of November 1994 was reprinted in an enhanced format in March 1998. This digital version is a copy of the March 1998 reprint with minor corrections to the diagrams.
The Oil and Gas Resources Branch was previously known as the Energy Resources Branch. The text of this document refers to the Energy Resources Branch.
On November 19, 1998, the Government of Canada transferred to the Government of Yukon the administrative legislative powers and responsibilities of managing onshore oil and gas resources. Yukon oil and gas resources are now governed under the Yukon Oil and Gas Act.
To the original report (November 1994)
The Government of Canada and the Government of Yukon have reached an agreement to transfer to Yukon the administrative legislative powers and responsibilities of managing onshore oil and gas resources. In the interim, officials of Canada involved in the administration of federal oil and gas legislation are cooperating and consulting with Yukon to facilitate implementing the Accord.
A study of the petroleum resources of the Yukon part of the Eagle Plain was undertaken by the National Energy Board (NEB) in response to a request from the Yukon Territorial Government. Assessment of petroleum resource potential is important for forming regulatory policies for these resources and for providing a basis for planning and issuing exploration rights.
PETROLEUM RESOURCE ASSESSMENT OF THE EAGLE PLAIN, YUKON TERRITORY, CANADA

PETROLEUM RESOURCE ASSESSMENT OF THE EAGLE PLAIN, YUKON TERRITORY, CANADA
EXECUTIVE SUMMARYThe Eagle Plain is an immaturely explored area with proven Cretaceous, Carboniferous and Devonian gas and oil measures. Potential exists for further gas and oil discoveries in these and lower portions of the stratigraphic section.
Basin Age
Basin Area in Yukon
Depth to Target Zones
Maximum Basin Thickness
Hydrocarbon Shows
First Discovery
Last Discovery
Discovered Resources
Production
Potential Resources(Study Area Totals)
Basin Type
Depositional Setting
Potential Reservoirs
Regional Structure
Seals
Source Rocks
Depth to Oil/Gas Window
Wells in Study Area
Released SeismicCoverage
Pipelines
Early Paleozoic to Cretaceous; Quaternary cover.
20,608 km2 (8,050 sq. miles).
Middle Devonian targets: 1,000 to 2,000 m (3,300 to 6,400 ft.); Carboniferous targets: 800 to 1,500 m (2,600 to 5,000 ft.); Lower Cretaceous targets: 600 to 1,000 m (1,960 to 3,325 ft.).
5,800 m.
Surface: none. Subsurface: Gas: In several wells, from Silurian-Ordovician Bouvette Formation to Upper Cretaceous Fishing Branch Formation. Oil: In several wells, from Carboniferous Chance Member to Permian Jungle Creek Formation.
Western Minerals Chance Y.T. No. 1 M-08 (Rig Release 25-May-60; Fishing Branch Formation gas, Chance Member gas and oil, Canoe River Member gas and oil, Tuttle Formation gas).
Socony Mobil Western Minerals Birch B-34 (Rig release 08-June-65; Chance Member gas, Tuttle Formation gas).
Gas: 2,376 106m3 (83.7 Bcf) Oil: 1.8 106m3 (11.1 MMbbls).
No production to date.
Gas: Mean 28,478 106m3 (1,005.7 Bcf) @ 45% probability.Oil: Mean 4.5 106m3 (28.2 MMBbls) @45% probability.
Paleozoic to Lower Mesozoic: shallow marine shelf; Mesozoic to Recent: intermontane compressional.
Shallow water carbonate and clastic shelf.
Carbonate reefal mounds and facies fronts; fractured carbonates; unconformity traps and discontinuous marine clastic lenses.
Long wavelength folds at surface; detachments with thrust-folds within deeper strata; contraction and minor relaxation faulting.
Cretaceous Targets: shale of the Whitestone River Formation. Permian Targets: Cretaceous shale of the Whitestone River Formation. Carboniferous Targets: Lower Carboniferous Alder Member limestone or Upper Carboniferous Blackie Formation shale. Devonian Targets: Lower Carboniferous Ford Lake Formation shale, Upper Devonian Imperial and Canol formations shale or Middle Devonian carbonate. Silurian-Ordovician Targets: Road River Formation shale or Bouvette Group carbonates.
Cretaceous shale; Carboniferous shale; Devonian shale.
1,900 to 3,100 m.
32 (2 gas wells, 2 gas and oil wells, 1 oil well, 27 dry)
2D: 9,952 line kilometres (6,170 miles), 8% post 1975. 3D: 0 line kilometres, 0% post 1975.
None.

PETROLEUM RESOURCE ASSESSMENT OF THE EAGLE PLAIN, YUKON TERRITORY, CANADA
CONTENTSIntroduction....................................................................................................................1
Acknowledgements ..............................................................................................................1Methodology..........................................................................................................................1Units/Abbreviations ..............................................................................................................2
Regional Geological Setting ..........................................................................................3Stratigraphy and Depositional Setting...............................................................................3
Precambrian......................................................................................................................3Cambrian ..........................................................................................................................3Cambro-Silurian ..............................................................................................................5Devonian ...........................................................................................................................5Carboniferous ..................................................................................................................6Permian .............................................................................................................................6Triassic ...............................................................................................................................7Jurassic ..............................................................................................................................7Cretaceous .......................................................................................................................7Tertiary to Recent ...........................................................................................................7
Structural Geology ................................................................................................................7Regional Geochemistry........................................................................................................8
Petroleum Geology.........................................................................................................9Exploration History................................................................................................................9Discovered Resources ........................................................................................................10Seismic Coverage ................................................................................................................11
Available Seismic Data .................................................................................................11Seismic Examples...........................................................................................................11Paleozoic Subcrop Play................................................................................................12Middle Devonian Carbonate Edge Play....................................................................13Triangle Zone Play.........................................................................................................13
Potential Resources ......................................................................................................14Petroleum Plays....................................................................................................................14Play Sheets ............................................................................................................................15
Fishing Branch Sandstone Play ...................................................................................16Jungle Creek Sandstone Play ......................................................................................20Chance Sandstone Structural Play .............................................................................24Chance Sandstone Unconformity Play .....................................................................28Chance Sandstone Stratigraphic Play ........................................................................32Canoe River Limestone Play........................................................................................36Tuttle Formation Play ....................................................................................................40Triangle Zone Structural Play ......................................................................................44Ettrain Carbonate Play ..................................................................................................48Ogilvie Carbonate Stratigraphic Play.........................................................................52Ogilvie Carbonate Structural Play..............................................................................56Bouvette Stratigraphic Play..........................................................................................60
Discussion of results.....................................................................................................64
References .....................................................................................................................66

PETROLEUM RESOURCE ASSESSMENT OF THE EAGLE PLAIN, YUKON TERRITORY, CANADA

PETROLEUM RESOURCE ASSESSMENT OF THE EAGLE PLAIN, YUKON TERRITORY, CANADA 1
ALASKA USA
QUEBEC
B.C.ALTA.
ONT.
SASK.MAN.
NFLD
N.S.
PEIN.B.
YUKON
Eagle Plain Basin
NORTHWEST NUNAVUT
TERRITORIES
INTRODUCTION
Figure 1. Eagle Plain location
map.
INTRODUCTIONThe objective of this study was to investigate the petroleum resource potential and endowment of the Eagle Plain (Figure 1). The study area is located in the north-central portion of the Yukon between latitudes 650 and 680 N and longitudes 135° and 1400 W, and covers an area of approximately 20,608 km2 or 8,050 sq. miles (Figure 2). The Arctic Circle bisects the basin. Physiographic features of the study area are the Eagle Plain bounded by surrounding mountain ranges: including the Keele, Nahoni and Taiga ranges of the Ogilvie Mountains, and the Richardson Mountains.
ACKNOWLEDGEMENTSThe National Energy Board would like to acknowledge the previous work done on this basin by staff at the Institute of Sedimentary & Petroleum Geology in Calgary. Key papers used in preparation of this report were done by J. Dixon, A.P. Hamblin, A.W. Norris, and D.C. Pugh and are included in the references. Thanks are also given to T. Bird, J. Dixon, A.P. Hamblin, D.W. Morrow, and L. Lane for their review and comments.
METHODOLOGYThe analysis of the hydrocarbon endowment of the Eagle Plain study area began with documentating and synthesizing the regional geological setting as it relates to the basin evolution, geometry, sedimentation history, geochemistry, structural history and hydrocarbon occurrences (shows and discoveries) within the study area. Current literature on the geology and resources discovered in the basin are listed in the references. The results of this study were synthesized into a series of geologic illustrations and maps that show: 1) the geologic settings of the discoveries and the parameters that control the discovered resources; 2) schematic cross-sections which describe and illustrate play complexity; and 3) play maps showing areas with the potential for discoveries similar to those already made and conceptual discoveries that should be present based on sound geological analysis. Within this framework, models for hydrocarbon entrapment within the study area were developed.
The discovered resource and show information is summarized in Table 1 (page 10). These hydrocarbon occurences clearly demonstrate that a varied geographic and geologic distribution exists within the study area and points to a wide range of potential oil and gas reservoirs.
Geoscientific analysis was followed by systematic statistical analysis using a resource assessment methodology developed by the NEB. A description of the methodology was included in the NEB’s Natural Gas Resource Assessment, Northeast British Columbia released as a working paper in January 1994. This methodology uses a series of developed

2 PETROLEUM RESOURCE ASSESSMENT OF THE EAGLE PLAIN, YUKON TERRITORY, CANADA
Surface traces of Laramide Anticlines
66°
140° 138° 137° 136°
66° 30'
139°
67°
66° 30'
66°
67° 30' 67° 30'
67°
65° 30'65° 30'
136°138°139° 137°140°
Eagle Plain
Discoveries
0 50
Km
N W T
Y u k o n
BELL SUB-BASIN
SOUTHEAGLE
SUB-BASIN
Chance
BirchBlackie
Eagle
A
rch
T A I G A R A N G E S
RIC
HA
RD
SO
N M
OU
NT
AIN
S
KEELE R
ANGE
NAHONI RANGE
Min
erRi
ver
Fishing
Branch
R iver
Porc
up
Rive
r
Po r cupineR
.
Ri ver
Bell
Eagle
Dem
pste
rH
ighw
ay
Whitestone
Hart
Blacks
tone
R.
PeelRiver
River
Ogilv
ie
River
ine
River
Riv
er
Figure 2. Physiographic features
of Eagle Plain.
INTRODUCTION
in-house templates, created in the spreadsheet software package “Excel 4.0®” by
Microsoft Corporation, combined with Pallisade Corporation’s “@RISK®” add-in set of
programs. @RISK links directly to Excel and adds risk analysis and modelling capabilities to the Excel spreadsheet models.
UNITS/ABBREVIATIONS106m3 - million cubic metersac-ft - acre feetAOF - absolute open flowBbls - barrelsBcf - billion cubic feetBOE - barrels of oil equivalentd - dayft - feetft kb - feet below Kelly (the floor of the drill platform)GIP - gas in placeGOR - gas/oil ratioHa - hectaresIMG - marketable gaskm - kilometresm - metresmd - millidarciesmi - milesmKb - metres below Kelly (the floor of the drill platform) MMbbls - million barrelsMMcf - million cubic feetpsi - pounds per square inchTcf - trillion cubic feet

PETROLEUM RESOURCE ASSESSMENT OF THE EAGLE PLAIN, YUKON TERRITORY, CANADA 3
REGIONAL GEOLOGICAL SETTINGThe study area includes the present day physiographic elements of Eagle Plain and its surrounding mountain ranges (Figure 2). The Eagle Plain area lies within an intermontane compressional basin with a maximum sediment thickness of 5,800 m. Outcrops of Mesozoic sediment in the surrounding mountain ranges outlines the basin. Recent alluvium covers much of the region’s surface. The present Eagle Plain geomorphology consists of low rolling hills with elevations varying between 400 and 800 m. The southern plains are lightly forested with the amount of forestation thinning to the north. Tundra conditions exist in both the northern areas and at higher elevations in the southern areas. Year-round access to the basin is via the Dempster Highway.
STRATIGRAPHY AND DEPOSITIONAL SETTINGThe Eagle Plain area underwent continuous subsidence and deposition as part of the western miogeosyncline during Cambrian to Carboniferous times. After the Carboniferous, there was a long period of emergence, with the exception of clastic deposition during the Permian. This emergence is recognized by the absence of Triassic and Jurassic sediments in the region. Deposition returned in the Lower Cretaceous, followed by more erosion before Upper Cretaceous deposition.
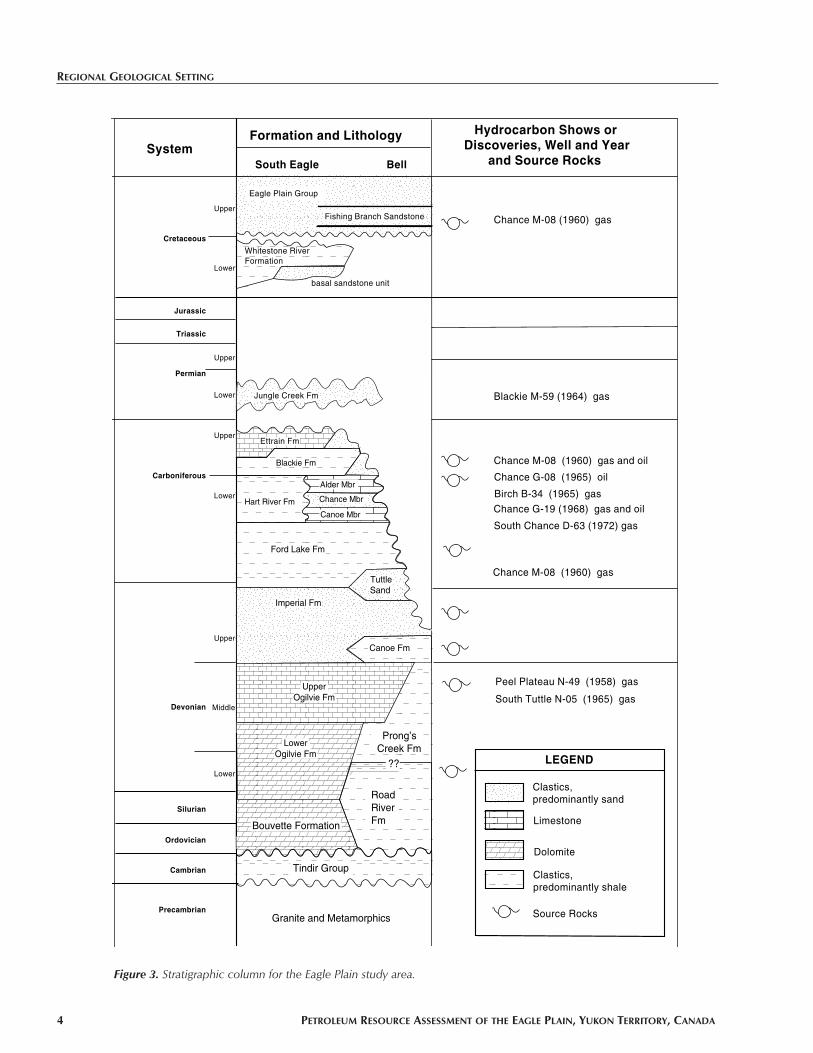
The Eagle Plain area offers a setting of stratigraphic conditions suitable for the sourcing, migration and entrapment of hydrocarbons. An understanding of the stratigraphy and depositional setting is therefore important for analyzing the discovered hydrocarbon accumulations and for predicting possible conceptual accumulations. The age, name and lithology of potential reservoir and source rock horizons found in the study area are outlined in Figure 3, and in the following written summary.
PRECAMBRIAN
Underlying the Phanerozoic cover of the study area and forming the effective economic basement is a mixture of metasediments of Precambrian, likely Helikian age. Metasediments include shale, dolomite, argillite and orthoquartzite (a silica-cemented quartz sandstone). No wells in the area have been drilled into the Precambrian. However, other well, mainly on the Peel Plateau have encountered these metasediments.
CAMBRIAN
Cambrian sedimentary strata have been encountered in four wells in the Eagle Plain, and consist of mainly shale and evaporite. They are not considered to have any potential reservoir units. Total thickness of the sediments is estimated to be 400 to 500 m. The Cambrain sediments are called the Tindir Group, and are correlative to the Mount Clark, Mount Cap and Saline River formations of the Mackenzie and Liard areas according to Pugh (1983).
REGIONAL GEOLOGICAL SETTING
basal sandstone unit
Blackie Fm
Alder Mbr
Chance Mbr
Canoe Mbr
Hart River Fm
Ford Lake Fm
TuttleSand
Imperial Fm
Canoe Fm
Bouvette Formation
Tindir Group
??
Granite and Metamorphics
Prong’sCreek Fm
UpperOgilvie Fm
LowerOgilvie Fm
Road RiverFm
SystemFormation and Lithology
South Eagle Bell
Hydrocarbon Shows or Discoveries, Well and Year and Source Rocks
Eagle Plain Group
Fishing Branch Sandstone
Whitestone RiverFormation
Chance M-08 (1960) gas
Era
Jungle Creek Fm
Ettrain Fm
Blackie M-59 (1964) gas
Chance M-08 (1960) gas and oil
Chance G-08 (1965) oil
Birch B-34 (1965) gas
Chance G-19 (1968) gas and oil
Chance M-08 (1960) gas
South Chance D-63 (1972) gas
Peel Plateau N-49 (1958) gas
South Tuttle N-05 (1965) gas
LEGEND
Clastics, predominantly sand
Limestone
Dolomite
Clastics, predominantly shale
Source Rocks
Upper
Lower
Upper
Lower
Upper
Lower
Jurassic
Triassic
Cretaceous
Permian
Upper
Lower
MiddleDevonian
Carboniferous
Silurian
Ordovician
Cambrian
Precambrian
4 PETROLEUM RESOURCE ASSESSMENT OF THE EAGLE PLAIN, YUKON TERRITORY, CANADA
basal sandstone unit
Blackie Fm
Alder Mbr
Chance Mbr
Canoe Mbr
Hart River Fm
Ford Lake Fm
TuttleSand
Imperial Fm
Canoe Fm
Bouvette Formation
Tindir Group
??
Granite and Metamorphics
Prong’sCreek Fm
UpperOgilvie Fm
LowerOgilvie Fm
Road RiverFm
SystemFormation and Lithology
South Eagle Bell
Hydrocarbon Shows or Discoveries, Well and Year and Source Rocks
Eagle Plain Group
Fishing Branch Sandstone
Whitestone RiverFormation
Chance M-08 (1960) gas
Era
Jungle Creek Fm
Ettrain Fm
Blackie M-59 (1964) gas
Chance M-08 (1960) gas and oil
Chance G-08 (1965) oil
Birch B-34 (1965) gas
Chance G-19 (1968) gas and oil
Chance M-08 (1960) gas
South Chance D-63 (1972) gas
Peel Plateau N-49 (1958) gas
South Tuttle N-05 (1965) gas
LEGEND
Clastics, predominantly sand
Limestone
Dolomite
Clastics, predominantly shale
Source Rocks
Upper
Lower
Upper
Lower
Upper
Lower
Jurassic
Triassic
Cretaceous
Permian
Upper
Lower
MiddleDevonian
Carboniferous
Silurian
Ordovician
Cambrian
Precambrian
REGIONAL GEOLOGICAL SETTING
Figure 3. Stratigraphic column for the Eagle Plain study area.

PETROLEUM RESOURCE ASSESSMENT OF THE EAGLE PLAIN, YUKON TERRITORY, CANADA 5
CAMBRO-SILURIAN
A thick Cambrian to Silurian carbonate shelf facies, called the Bouvette Formation, overlies the Cambrian shale in this area. The Lower Paleozoic dolomite grades eastward into thick basinal shale of the Road River Formation in the Richardson Trough. Here, the Bouvette consists of a thin, upper, cherty limestone and dolomite unit that caps a thicker section of light-coloured, medium to coarsely crystalline dolomite, grey-coloured microcrystalline dolomite and interbedded orthoquartzite and shale. This succession reaches an average thickness of 1,000 m.
In the northwestern and southeastern portions of the Eagle Plain, the Bouvette Formation is unconformably overlain by the Road River Formation clastics. While these clastics were being deposited, shale deposition continued in the Richardson Trough. Traps may form in the Bouvette where porous dolomite pinches out against tight limestone or where the entire unit pinches out against the carbonate-shale facies change.
DEVONIAN
Lower and Middle Devonian strata are represented by the Ogilvie formation. The Lower Ogilvie consists of light-brown to dark-brown and buff-coloured, finely crystalline to sucrosic dolomite with vuggy and intercrystalline porosity. The Upper Ogilvie consists of medium-brown to grey, fine-grained, thin-bedded to massive limestones with beds of coarse-grained encrinite (a crinoidal-rich coquina bed).
The Ogilvie formation was deposited as a carbonate bank within this area and passes into the basinal shale of the Upper Road River Formation in the Richardson Trough. This pinchout occurs near the South Eagle and Bell Sub-basins at the Eagle Arch. The lower dolomite occupies a back-bank position in this basin and does not extend out to the carbonate-shale facies change. It is described as dark-grey to black shale with minor thin interbeds of limestone, overlain by interbedded shale and limestone and an upper section of interbedded shale and black chert.
A major change in the regional tectonic setting and sedimentation style occurred at the end of the Lower Paleozoic. Carbonate-dominated Lower Paleozoic units were capped by a thick sequence of Upper Paleozoic clastic-dominated units consisting of a mixture of clastics and carbonate. The Upper Paleozoic facies belts trend north-south on the west side of the plain and east-west on the south end of the plain. Sediments were sourced from the north and northeast.
Upper Devonian deposition began with an influx of sandy shales or siltstone of the Imperial Formation. The Imperial can be up to 1,900 m thick. In basinal areas, the initial deposition consisted of black, very thin-bedded, cherty shale of the Canol Formation, which may be 125 m thick. The Imperial was replaced in part by a thick sequence of coarse-grained clastics called the Tuttle Formation. The Tuttle reaches a maximum thickness of 1,421 m in the O-22
basal sandstone unit
Blackie Fm
Alder Mbr
Chance Mbr
Canoe Mbr
Hart River Fm
Ford Lake Fm
TuttleSand
Imperial Fm
Canoe Fm
Bouvette Formation
Tindir Group
??
Granite and Metamorphics
Prong’sCreek Fm
UpperOgilvie Fm
LowerOgilvie Fm
Road RiverFm
SystemFormation and Lithology
South Eagle Bell
Hydrocarbon Shows or Discoveries, Well and Year and Source Rocks
Eagle Plain Group
Fishing Branch Sandstone
Whitestone RiverFormation
Chance M-08 (1960) gas
Era
Jungle Creek Fm
Ettrain Fm
Blackie M-59 (1964) gas
Chance M-08 (1960) gas and oil
Chance G-08 (1965) oil
Birch B-34 (1965) gas
Chance G-19 (1968) gas and oil
Chance M-08 (1960) gas
South Chance D-63 (1972) gas
Peel Plateau N-49 (1958) gas
South Tuttle N-05 (1965) gas
LEGEND
Clastics, predominantly sand
Limestone
Dolomite
Clastics, predominantly shale
Source Rocks
Upper
Lower
Upper
Lower
Upper
Lower
Jurassic
Triassic
Cretaceous
Permian
Upper
Lower
MiddleDevonian
Carboniferous
Silurian
Ordovician
Cambrian
Precambrian
REGIONAL GEOLOGICAL SETTING

6 PETROLEUM RESOURCE ASSESSMENT OF THE EAGLE PLAIN, YUKON TERRITORY, CANADA
well. Tuttle deposition did not extend to the west side of the area, where Imperial clastics continued to accumulate. The Tuttle consists of vari-coloured chert conglomerate and very poorly sorted quartz and chert sandstone, and grey and brown shales. Upper Devonian deposition closed shortly after deposition of the shale dominated Ford Lake Formation started. The Ford Lake consists of dark-grey to black shales, siliceous siltstone and sandstones and orthoquartzite. The Ford Lake reaches a maximum thickness of 975 m.
CARBONIFEROUS
Ford Lake deposition continued well into the Lower Carboniferous, before being overlain by shale and carbonate of the Hart River Formation. Shale was deposited on the west side of Eagle Plain, while laminated silty micritic limestone, dolomite and chert were
deposited on the east side. This carbonate unit is informally called the Canoe River Member, and may be up to 480 m thick. The carbonates were conformably overlain by sand-dominated sediments, while shale deposition continued in the west. This sandstone unit is called the Chance Member and consists of conglomeratic sandstone, medium- to coarse-grained sandstone and calcareous shale. Maximum thickness intersected in drilling is 310 m. The Chance Member is conformably overlain by a repetition of the carbonates, while shale deposition continued in the west. This second carbonate unit is informally called the Alder Member.
Upper Carboniferous sediments are represented by the shale of the Blackie Formation. The Blackie may be almost 700 m thick and consists of black bituminous shale in the lower 294 m and brown-grey argillaceous or calcareous siltstone in the upper portion. The Blackie may have some marine sandstone deposited towards the east. The Blackie is conformably overlain by up to 732 m of limestone belonging to the Ettrain Formation. The Ettrain consists of light-grey skeletal limestone with grey chert lenses or micritic skeletal limestone with some coarser units of skeletal limestone. The Ettrain also contains some marine sandstone eastward.
PERMIAN
The only preserved Permian sediments belong to the Jungle Creek Formation, which has a maximum thickness of 719 m in the N-53 well. The Jungle Creek consists of skeletal conglomeratic limestone, micritic limestone, calcareous sandstone and siltstone. Locally, it consists of a calcareous chert pebble conglomerate.
basal sandstone unit
Blackie Fm
Alder Mbr
Chance Mbr
Canoe Mbr
Hart River Fm
Ford Lake Fm
TuttleSand
Imperial Fm
Canoe Fm
Bouvette Formation
Tindir Group
??
Granite and Metamorphics
Prong’sCreek Fm
UpperOgilvie Fm
LowerOgilvie Fm
Road RiverFm
SystemFormation and Lithology
South Eagle Bell
Hydrocarbon Shows or Discoveries, Well and Year and Source Rocks
Eagle Plain Group
Fishing Branch Sandstone
Whitestone RiverFormation
Chance M-08 (1960) gas
Era
Jungle Creek Fm
Ettrain Fm
Blackie M-59 (1964) gas
Chance M-08 (1960) gas and oil
Chance G-08 (1965) oil
Birch B-34 (1965) gas
Chance G-19 (1968) gas and oil
Chance M-08 (1960) gas
South Chance D-63 (1972) gas
Peel Plateau N-49 (1958) gas
South Tuttle N-05 (1965) gas
LEGEND
Clastics, predominantly sand
Limestone
Dolomite
Clastics, predominantly shale
Source Rocks
Upper
Lower
Upper
Lower
Upper
Lower
Jurassic
Triassic
Cretaceous
Permian
Upper
Lower
MiddleDevonian
Carboniferous
Silurian
Ordovician
Cambrian
Precambrian
REGIONAL GEOLOGICAL SETTING

PETROLEUM RESOURCE ASSESSMENT OF THE EAGLE PLAIN, YUKON TERRITORY, CANADA 7
TRIASSIC
No Triassic sediments are preserved in the study area.
JURASSIC
No Jurassic sediments are preserved in the study area.
CRETACEOUS
Lower Cretaceous consist of a thick sequence of marine siltstone, shale and sandstone. The Whitestone River Formation, which has a maximum thickness of 1,500 m, consists of shale interbedded with very fine-grained sandstone and siltstone. There is a basal sandstone unit which covers most of the study area.
Upper Cretaceous strata unconformably overly the Whitestone River Formation and is called the Eagle Plain Group. The Eagle Plain Group can be up to 1,680 m in thickness and consists mainly of shale interbedded with fine- to coarse-grained, locally pebbly, sandstone and siltstone. One of the formations within the Eagle Plain Group is the Fishing Branch Sandstone, which was formerly called the Blackie Sand. It consists of about 820 m of shales and sandstone.
TERTIARY TO RECENT
Altough there is evidence of glaciation (mainly glacial erratics) on the east and west sides of the basin, there is no evidence of glacial deposits in the basin. These systems are marked only by deposits of fluvial sand and gravel in the major river valleys.
STRUCTURAL GEOLOGYThe northern Yukon area was essentially a stable cratonic region during the Lower Paleozoic. Shallow-water carbonate of the Lower Paleozoic is bounded on the east by a major carbonate to shale facies change into the Richardson Trough.
Upper Paleozoic facies transitions trended north-south along the west side of the craton. However, an east-west trend developed later as the Aklavik Arch formed to the north. A series of tectonic pulses during the Upper Devonian and Permian deposited a number of clastic wedges. These shallow water clastics and carbonates were sourced from the northeast and are bounded on the southwest by a major facies change to basinal shale. Thick Cretaceous sediments indicate that the Eagle Plain was a depositional basin associated with Cordilleran deformation.
The Eagle Plain is a structural depression surrounded by exposed Paleozoic rocks, brought to the surface by complex normal and thrust faulting. Before Mesozoic deposition, the east-west trending Eagle Arch formed, deforming the Paleozoic section into northern and southern sub-basins. The two sub-basins are called the Bell Sub-basin in the north and the South Eagle Sub-basin in the south.
REGIONAL GEOLOGICAL SETTING
basal sandstone unit
Blackie Fm
Alder Mbr
Chance Mbr
Canoe Mbr
Hart River Fm
Ford Lake Fm
TuttleSand
Imperial Fm
Canoe Fm
Bouvette Formation
Tindir Group
??
Granite and Metamorphics
Prong’sCreek Fm
UpperOgilvie Fm
LowerOgilvie Fm
Road RiverFm
SystemFormation and Lithology
South Eagle Bell
Hydrocarbon Shows or Discoveries, Well and Year and Source Rocks
Eagle Plain Group
Fishing Branch Sandstone
Whitestone RiverFormation
Chance M-08 (1960) gas
Era
Jungle Creek Fm
Ettrain Fm
Blackie M-59 (1964) gas
Chance M-08 (1960) gas and oil
Chance G-08 (1965) oil
Birch B-34 (1965) gas
Chance G-19 (1968) gas and oil
Chance M-08 (1960) gas
South Chance D-63 (1972) gas
Peel Plateau N-49 (1958) gas
South Tuttle N-05 (1965) gas
LEGEND
Clastics, predominantly sand
Limestone
Dolomite
Clastics, predominantly shale
Source Rocks
Upper
Lower
Upper
Lower
Upper
Lower
Jurassic
Triassic
Cretaceous
Permian
Upper
Lower
MiddleDevonian
Carboniferous
Silurian
Ordovician
Cambrian
Precambrian

8 PETROLEUM RESOURCE ASSESSMENT OF THE EAGLE PLAIN, YUKON TERRITORY, CANADA
In the South Eagle Sub-basin, the Upper Paleozoic clastics and carbonates subcrop against the pre-Cretaceous unconformity. During the Laramide Orogeny, linear anticlines and synclines trending approximately north-south developed and extend for hundreds of kilometres. These anticlines affect the entire stratigraphic section and have created numerous potential traps in the Upper Paleozoic section. All of the currently discovered hydrocarbons are found in the South Eagle Sub-basin.
In the Bell Sub-basin, similar Laramide anticlinal structures have formed. However, Upper Paleozoic reservoir units were removed by pre-Cretaceous erosion. Potential for the types of traps tested in the South Eagle Sub-basin is minimal for the Bell Sub-basin. This area does have the potential for Cretaceous clastic reservoirs in triangle zone type closures formed by thrust faulting.
REGIONAL GEOCHEMISTRYSource rocks have been identified in a number of horizons from the Lower Paleozoic to the Upper Mesozoic. However, they have not all been been properly analysed. The Lower Devonian Michelle Formation (uppermost Road River shale) are the oldest. They average a total organic content (TOC) of between 1 and 2% but some samples go as high as 9.5%, containing mostly Type III kerogens and are thought to be overmature. The Upper Devonian Canol Formation shale, containing Type II and III kerogens, have a TOC of up to 9%, and testing indicates it is are overmature for oil. The Lower Carboniferous Ford Lake Formation shale contains Type II and III kerogens and has a TOC of up to 4%. It is considered to be mature for oil generation. The Upper Carboniferous Blackie Formation shale and organic-rich Ettrain carbonate contain Type II and III kerogens and have a TOC of up to 5%. These formations are marginally mature for oil. The youngest potential source rock is the Cretaceous Whitestone River Formation which also contains Type II and III kerogens and is marginally mature. There may also be some minor source rock potential in the Upper Devonian Imperial shale and in the Lower Permian Jungle Creek Formation.
The depth to the oil window is quite variable in this area. Based on work done by Link & Bustin (1989), in the outcrops of the surrounding mountains, sediments are in the oil window at near-surface conditions. In the Eagle Plain, the depth to the oil window varies from approximately 1,900 m (6,250 ft.) to approximately 3,100 m (10,200 ft.) in the area of the Whitefish J-70 well.
REGIONAL GEOLOGICAL SETTING

PETROLEUM RESOURCE ASSESSMENT OF THE EAGLE PLAIN, YUKON TERRITORY, CANADA 9
PETROLEUM GEOLOGY
EXPLORATION HISTORYSurface exploration commenced in the mid to late 1950s in this region of the Yukon. The first well drilled was the Peel Plateau Eagle Plain YT No.1 N-49 well (classified as dry and abandoned) with a rig release date of July 1958. The second well, and first discovery, was drilled by Western Minerals at Chance YT No. 1 M-08 with a rig release date of May 1960. This well flowed gas, at a maximum rate of 283 103m3 (10 MMcf/d), with 1.1 m3
(6.5 barrels) of oil recovered from the Chance Member of the Carboniferous Hart River Formation. Both of these wells were drilled on Laramide anticlinal structures. Since then, an additional 28 wells have been drilled resulting in further discoveries at the Birch B-34 and Blackie M-59 wells. The most recent wells were drilled in 1985. However, the last discovery was made at Birch in 1965. The deepest well was the Western Minerals North Hope YT N-53, which was drilled and completed in 1970. This well encountered Precambrian sedimentary strata at a total depth of 4,280 m (14,043 ft.). Hydrocarbons have been found and tested in nine separate zones. Additionally, there were two gas shows at deeper levels. The deepest zones penetrated in each of the wells is shown on the accompanying penetration map (Figure 4).
It should be noted on the penetration map, most of the wells drilled to date have only penetrated the shallower horizons, down to the Upper Devonian. Only six wells have penetrated the deeper carbonate horizons of the Ogilvie or Bouvette formations sediments. Most of the large hydrocarbon deposit potential is considered to be in these carbonates.
PETROLEUM GEOLOGY
T A I G A R A N G E S
RIC
HA
RD
SO
N M
OU
NT
AIN
S
KEELE R
ANGE
NAHONI RANGE
N W T
Y u k o n
66°
140° 138° 137° 136°
66° 30'
139°
67°
66° 30'
66°
67° 30' 67° 30'
67°
65° 30'65° 30'
136°138°139° 137°140°
Eagle Plain
0 50
Km
Cretaceous
Carboniferous
Upper Devonian
Lower Devonian
Cambrian
Oil Well
Gas and Oil Well
Gas Well
Abandoned
Min
erRi
ver
Fishing
Branch
R iver
Porc
up
Rive
r
Po r cupineR
.
Ri ver
Bell
Eagle
Dem
pste
rH
ighw
ay
Whitestone
Hart
Blacks
tone
R.
PeelRiver
River
Ogilv
ie
River
ine
River
Riv
er
UD
UD
UD
K
C
UD
LD
UD
UD
K
LD
LD
UD UD
UDC
UDUD
C
C
C
CUD C
C
CC
C
UD
LD
C
'
Figure 4. Well penetration map.

10 PETROLEUM RESOURCE ASSESSMENT OF THE EAGLE PLAIN, YUKON TERRITORY, CANADA
DISCOVERED RESOURCESThe NEB released to the public the discovered resources of the Eagle Plain in 1993. The discovered resources and significant shows are given in Table 1. A map of the wells is shown for reference in Figure 5.
Location and Zone — OIL Recovery, m (feet) Estimated Resource, 106m3 (MMbbls)
Chance D-22 Fishing Branch oil cut mud 0Birch B-34 Jungle Cr. oil cut mud 0Chance M-08 Chance #1 610 m (2,000) oil 700 (4.44) Chance #2 4 bbls oil 20 (0.12) Chance #3 4 bbls oil 0 Canoe R. #2 290 m (1,000) oil 7.3 (0.05)Chance G-08 Chance #1A 360 m (1,180) oil 770 (4.87)Chance J-19 Chance #3 500 m (1,640) oil 260 (1.64) Canoe oil cut mud 0E. Chance C-18 Canoe 37 m (120) cond. 0W. Parkin D-51 Canoe 91 m (300) oil 0
Total Oil: 1,757.3 (11.05)
Location and Zone — GAS Recovery, m3/d (mcf/d) Estimated Resource, 106m3 (Bcf)
Chance G-08 Fishing Branch 93,447 (3,300) 150 (5.0) Chance #1A gas too small to measure 0Chance M-08 Fishing Branch 22,994 (812) incl. Chance #1 283,174 (10,000) 770 (27.2) Chance #2 14,159 (500) 212 (7.5) Chance #3 14,159 (500) 212 (7.5) Canoe R. #2 283,000 (10,000) 2.8 (0.1) Tuttle 226,539 (8,000) 57 (2.0) W. Parkin C-33 Fishing Branch 7,929 (280) 0 Canoe gas too small to measure 0W. Parkin D-51 Fishing Branch gas too small to measure 0 Canoe gas too small to measure 0N. Parkin D-61 Fishing Branch gas cut water 0Whitefish J-70 Fishing Branch gas cut water 0W. Parkin D-54 Fishing Branch 1,004 (36) 0 Canoe gas cut water 0Chance D-22 Fishing Branch gas cut mud 0Blackie M-59 Jungle Cr. 79,288 (2,800) 660 (23.3) Canoe 4,021 (142) 0S. Chance D-63 Jungle Cr. gas cut mud 0Birch E-53 Jungle Cr. gas cut water 0Porcupine I-13 Jungle Cr. 368 (13) 0 Canoe 1,444 (51) 0Birch B-34 Jungle Cr. gas too small to measure 0 Chance 150,000 (5,500) 179 (6.3) Tuttle 200,000 (7,300) 81 (3.0)E. Chance C-18 Chance 56,502 (1,600) 0 Canoe R. 14,640 (512) 0 Chance J-19 Canoe R. #1 62,690 (2,214) 52 (1.8)Porcupine K-56 Canoe R. gas too small to measure 0Whitestone N-26 Tuttle 13,026 (460) 0Ellen C-24 Tuttle gas cut mud 0Whitefish I-05 Tuttle gassy water 0Ridge F-48 Tuttle 1,246 (44) 0S. Tuttle N-05 Ogilvie gas too small to measure 0 Lower Ogilvie 28,540 (1,000) 0Schaffer O-22 Lower Ogilvie gas cut mud 0Peel Plat. N-49 Ogilvie gassy mud 0N. Hope N-53 Bouvette gas cut mud 0
Table 1. Current shows and
estimates of discovered
resources.
PETROLEUM GEOLOGY

PETROLEUM RESOURCE ASSESSMENT OF THE EAGLE PLAIN, YUKON TERRITORY, CANADA 11
66°
140° 138° 137° 136°
66° 30'
139°
67°
66° 30'
66°
67° 30' 67° 30'
67°
65° 30'65° 30'
136°138°139° 137°140°
Eagle Plain
0 50
km
Oil Well
Gas and Oil Well
Gas Well
Abandoned
T A I G A R A N G E S
RIC
HA
RD
SO
N M
OU
NT
AIN
S
KEELE R
ANGE
NAHONI RANGE
N W T
Y u k o n
Min
erRi
ver
Fishing
Branch
R iver
Porc
up
Rive
r
Po r cupineR
.
Ri ver
Bell
Eagle
Dem
pste
rH
ighw
ay
Whitestone
Hart
Blacks
tone
R.
PeelRiver
River
Ogilv
ie
River
ine
River
Riv
er
P-34
F-48
I-05
N-50
C-24
J-70
O-22
N-05D-61
B-62 D-22 D-54
B-34
N-58
N-26K-56
M-59
D-63
N-53
N-49
I-13
F-18M-08 C-18
B-53
D-51J-19
G-08
O-78
D-77
C-33
C-33
Figure 5. Well identification map.
PETROLEUM GEOLOGY
SEISMIC COVERAGE
AVAILABLE SEISMIC DATA
All historic seismic coverage has been released to the public and totals 9,952 line kilometres of two-dimensional (2D) surveys. Only 8% of that has been shot since 1975, and no three-dimensional (3D) has been shot to date. The largest regional program was completed by Chevron in 1971. In most cases, gravity and magnetic surveys were conducted concurrently with the seismic. Data is of a reasonable quality but is concentrated in the southern end of the basin in the vicinity of the three existing discoveries. The present seismic coverage for which the NEB has data available is shown on the seismic map (Figure 6).
SEISMIC EXAMPLES
Parts of four different seismic lines are included at the end of the report (Figures 7 to 10). Each of the lines is described in a general format and each illustrates a different play or plays with the potential for oil or gas.
Chance structure
The Chance structure is illustrated on Chevron seismic lines 4XA and 32X, which run at angle to each other over the Chance field generally north to south along the strike of Larimide folding (Figure 7, at report end). The statics break in processing due to the different datums of the lines causes a difference in time between Chance M-08 and Chance J-19, whereas the actual depth of the lithologic units vary only slightly in the wells. The polarity is reverse, as can be seen from the correlation of the high velocity

12 PETROLEUM RESOURCE ASSESSMENT OF THE EAGLE PLAIN, YUKON TERRITORY, CANADA
sandstone sequences on the gamma ray log for Chance J-19 and the troughs on corresponding synthetic seismogram.
At the J-19 well, the structure is not conformable with the Lower Paleozoic normal faulting at 2.0 seconds. The folded structure of the Chance field and the increased isopach thickening of the Ford Lake and Imperial formations by 300 m is likely the result of Larimide compression.
The gamma ray log for J-19 shows the seismic correlation of the sand sequences in the Fishing Branch and Hart River formations. The sand in the Fishing Branch, which tested gas in M-08, gives a weak response on the seismic. The basal sand response is also weak at J-19, but shows a higher amplitude as the sand thickens from 60 to 120 m into the low to the northeast. The same is true for the two Chance Member sandstone lobes in the Hart River Formation between 1,234 and 1,372 m, separated by shale and argillaceous limestone. The Chance Member sandstone sequence within the low has several high amplitude events over a 212 m interval, which would likely correspond to similar sandtone-shale sequences similar to those in J-19. The seismic dominant frequency of 40 Hz would give a seismic event for sandstone greater than about 30 m. Tuning of the events was not considered for the weak response at the well. The amplitude increase for the response in the low is more likely explained by a change in lithology.
PALEOZOIC SUBCROP PLAY
The subcrop edge of the Paleozoic occurs between the Blackie and Chance fields and is evident on Chevron line 4XA which runs north-south (Figure 8, at report end). Subcropping below the sub-Cretaceous unconformity are the Jungle Creek and Ettrain formations and, not shown, but just to the right, the Blackie Formation.
68° 00135° 00140° 00
68° 00
65° 30135° 00
65° 30140° 00
66° 66°
67° 67°
N Basin Outline of Mesozoic Cover
Oil Well
Gas and Oil Well
Gas Well
Abandoned
Seismic Lines
Figure 6. Seismic map.
PETROLEUM GEOLOGY

PETROLEUM RESOURCE ASSESSMENT OF THE EAGLE PLAIN, YUKON TERRITORY, CANADA 13
The dipping events and isopach thinning of the Paleozoic formations indicate a depositional slope toward the south. Of particular interest is the isopach thickening of the Hart River and the clinoform-like deposition basinward of the Chance sandstone within this formation.
The maximum thickness of the sequence of high amplitude events is about 250 m and is most likely interbedded sands and shales with some limestone.
The Ogilvie Formation in the lower part of the section shows an anomalous seismic response similar to that for closely spaced normal faults or localized carbonate build-up features. The mapping of this event shows an antiformal structure.
MIDDLE DEVONIAN CARBONATE EDGE PLAY
The Middle Devonian carbonate to shale transition occurs near the South Eagle Sub-basin-Eagle Arch and is illustrated on Chevron line 15A (Figure 9, at report end). The edge is located on the seismic section where the seismic response below the Canol changes from high amplitude events (corresponding to the impedance contrast of the interbedded shale and carbonate of the Ogilvie Formation) to a quiescent zone corresponding to more uniform lithology.
The sandstones of the Imperial Formation subcrop below the sub-Mesozoic unconformity. These high amplitude reflectors mark the northern edge of the Eagle sub-basin. The seismic response suggests thin sands interbedded with shale and carbonate of the Imperial. The Cretaceous sandstone units from about 670 to 900 m in the Whitefish I-05 well correlate with the series of high amplitude reflectors that continue to the south. There is also a good seismic response for the Lower Cretaceous sandstone including the basal sandstone on the sub-Mesozoic unconformity.
TRIANGLE ZONE PLAY
At north end of the Bell sub-basin, Larimide thrust compression has resulted in Mesozoic and Cretaceous sediments being uplifted through a series of thrust faults and reverse thrust fault slivers. Chevron line 39X shows the pre-Mesozoic unconformity and the Cretaceous high amplitude events correlated from Whitefish I-05 (Figure 10, at report end).
The lack of well control in the northern area makes an accurate interpretation of the seismic lines difficult. This line is included only to indicate the complexity of the structure and the potential for trapping within the triangle zones. These traps are likely to have enhanced porosity and permeability due to fracturing of the reservoir rocks.
PETROLEUM GEOLOGY

14 PETROLEUM RESOURCE ASSESSMENT OF THE EAGLE PLAIN, YUKON TERRITORY, CANADA
POTENTIAL RESOURCES
PETROLEUM PLAYSThe NEB has adopted several descriptive terms in its resource assessments. The following definitions were modified from Reinson et al. (1993). For the purposes of this study a play is defined as a family of pools and/or prospects that share a common history of hydrocarbon generation, migration, reservoir development and trap configuration (Energy, Mines and Resources Canada, 1977). A prospect is defined as an untested exploration target within a single stratigraphic interval; it may or may not contain hydrocarbons; it is not synonymous with an undiscovered pool. An established play is one which is demonstrated to exist by virtue of discovered pools with established reserves or discovered resources. An immature play is one which by geological analysis and understanding has been proven to exist but for which there are no commercial discoveries at this time.
Twelve petroleum plays were identified within the study area (7 gas and 5 gas and oil)(Table 2). Seven plays are considered established as they have yielded proven discoveries. The other five have petroleum shows in this basin or in other basins and are considered immature.
NOTE: The estimates of potential resources are based on limited data, especially for the immature plays and for the stratigraphic plays. There is considerable uncertainty involved both in the play analysis and in the play assessment.
Play Type Potential
Established Plays
Cretaceous Fishing Branch Sandstone . . . . Laramide folds . . . . . . . . . . . . gas
Permian Jungle Creek Sandstone. . . . . . . . . Laramide folds . . . . . . . . . . . . gas and oil
Carboniferous Chance Sandstone . . . . . . . . Laramide folds . . . . . . . . . . . . gas and oil
Carboniferous Chance Sandstone . . . . . . . . Structural and stratigraphic . . gas and oil
Carboniferous Chance Sandstone . . . . . . . . Stratigraphic. . . . . . . . . . . . . . gas and oil
Carboniferous Canoe River Member . . . . . Limestone-Stratigraphic. . . . . gas and oil
Lower Carboniferous Tuttle Sandstone . . . . Stratigraphic. . . . . . . . . . . . . . gas
Immature Plays
Cretaceous Sandstone . . . . . . . . . . . . . . . . . Triangle Zone Structures. . . . gas
Upper Carboniferous Ettrain Limestone . . . Stratigraphic. . . . . . . . . . . . . . gas
Devonian Ogilvie Carbonate . . . . . . . . . . . . Stratigraphic. . . . . . . . . . . . . . gas
Devonian Ogilvie Carbonate . . . . . . . . . . . . Antiformal Structures . . . . . . gas
Ordovician/Silurian Bouvette. . . . . . . . . . . . Stratigraphic. . . . . . . . . . . . . . gas
Table 2. Established and
immature plays in Eagle Plain.
POTENTIAL RESOURCES
PETROLEUM RESOURCE ASSESSMENT OF THE EAGLE PLAIN, YUKON TERRITORY, CANADA 15
PLAY SHEETSA play sheet was prepared for each play on the play list. Each play sheet provides an outline of the geology, a discussion of the discovered resources for that play and a discussion of the undiscovered potential. A table of reservoir parameters is included, based on drilling and test results, as well as a map showing the discovery or show locations, the assigned area of potential, and a schematic cross-section. Following the play sheet is the @Risk data input and output sheets.
Following all the play sheets and data input and output sheets is a table of results for the various plays, a summation of the results and a discussion of the results.
POTENTIAL RESOURCES

16 PETROLEUM RESOURCE ASSESSMENT OF THE EAGLE PLAIN, YUKON TERRITORY, CANADA
CretaceousFISHING BRANCH SANDSTONE
ESTABLISHED GAS PLAY
Reservoir description
Fishing Branch Formation reservoirs are produced by the structural drape of sandstone sections over Laramide-aged folds. Linear anticlines trending north-south can be up to 100 km long, may be double plunging, and can represent hundreds of metres of closure. Interbedded reservoir rocks and source rocks are present and structures are visible both on the surface and on seismic sections.
The Fishing Branch sandstone is described as a salt and pepper, fine-grained, medium-sorted, subangular to subrounded, cherty marine sandstone with clear quartz and black and white chert. This unit has up to 50 m of clean sandstone and thins to the northwest.
Discovered resources
So far, only one discovery has been made. In the Chance Field, at wells M-08 and G-08, gas is trapped on top of water. The gas flowed on a drill stem test (DST) at rates up to 23 103 m3/d with no recovered oil or condensate.
66°
140° 138° 137° 136°
66° 30'
139°
67°
66° 30'
66°
67° 30' 67° 30'
67°
65° 30'65° 30'
136°138°139° 137°140°
Eagle Plain
0 50
km
Area of Potential
Laramide Anticlines
Discoveries
Rivers
Dem
pste
rH
ighw
ay
T A I G A R A N G E S
KEELE R
ANGE
Chance
Birch
Blackie
N W T
Y u k o nRIC
HA
RD
SO
N M
OU
NT
AIN
S
NA
HO
NI R
AN
GE
Eagle
A
rch
POTENTIAL RESOURCES FISHING BRANCH SANDSTONE

PETROLEUM RESOURCE ASSESSMENT OF THE EAGLE PLAIN, YUKON TERRITORY, CANADA 17
Field Resources Area Net Pay Porosity Hydrocarbon Recovery Initial marketable (ha.) (m) (%) saturation (%) factor (%) gas 106m3 (Bcf)
Chance gas 458 5.0 22 65 47 82.5 (2.9)
Shale
Shale
ChanceM-08
Water
Sandstone
Gas
FISHING BRANCH SANDSTONE POTENTIAL RESOURCES
Potential resources
The area of potential resources covers most of the study area, limited only by the distribution of Laramide folding. This is considered to be a gas play, since the source rocks are only marginally mature.
Reservoir parameters
These results are taken from the successful wells in each play. While they may be used as the most likely values on the triangular distribution, that is not necessarily the case.

18 PETROLEUM RESOURCE ASSESSMENT OF THE EAGLE PLAIN, YUKON TERRITORY, CANADA
In place
Recoverable
Sulphur (MMlt)
Oil (MMb) Solution gas (Bcf)
Non associated gas (Bcf)
Total gas (BcF)
Liquids(MMb)
Barrels ofoilequivalent (MMBOE)
Marketable gas (Bcf)
3.0000 3.3000 3.5000 3.267
0.270 0.270 0.270 0.270
2.730 3.030 3.230 2.997
0.100 0.190 0.250 0.180
0.250 0.500 0.700 0.483
0.261
0.050 0.120 0.220 0.130
0.500 0.650 0.750 0.633
0.100 0.150 0.200 0.150
0.250 0.470 0.650 0.457
10.0 16.0 26.0 17.3
0.050 0.130 0.200 0.127
0.000 0.000 0.000 0.000
0.000
0.033
0.228 0.240 0.252 0.240
1.130 1.137 1.144 1.137
0.800 0.900 0.950 0.883
0.061
561.9
84.3
217.0
99.1
93.8
4.000 5.100 6.400 5.2
0.000 0.000 0.000 0.000
0.001 0.003 0.005 0.003
6.000
0.050
0.947
Total play area (MM acres)
Tested play area (MM acres)
Untested play area (MM acres)
Fraction of total play area in trap
Fraction of untested play area filled (areally)
Potential hydrocarbon area (MM acres)
Porosity
Hydrocarbon saturation
Oil recovery factor
Gas recovery factor
Average net pay (ft.)
Probability of hydrocarbons
Fraction of pore volume oil bearing
Potential oil area (MM acres)
Potential gas area (MM acres)
Gas oil ratio (GOR) (MMcf/bbls)
Formation volume factor (FVF)
Gas compressibility factor ‘Z’
Gas volume factor (GVF)
Oil in place (bbls/acre-foot)
Oil recovery (bbls/acre-foot)
Gas in place (MMcf/acre-foot)
Raw gas recovery (MMcf/acre-foot)
Marketable gas recovery (MMcf/acre-foot)
Liquid yield (bbls/MMcf)
H2S content
CO2 content
Gas to BOE conversion factor (MMcf/BOE)
Surface loss (fuel gas, etc.)
Marketable gas (fraction of raw)
POTENTIAL RESOURCES FISHING BRANCH SANDSTONE
Oil depth: 2,400 ft.; Gas depth: 2,385 ft.; Gas reservoir temperature: 66°F; gas pressure: 792 psi
0.00 124.21 124.21 20.70
0.00 0.00 56.72 56.72 0.29 9.75 53.71
0.00
Estimate of potential
petroleum resources
Total for play
Minimum Most likely Maximum Mean

PETROLEUM RESOURCE ASSESSMENT OF THE EAGLE PLAIN, YUKON TERRITORY, CANADA 19
0 5 0 1 0 0 1 5 0 2 0 0 2 5 00 %
1 0 %
2 0 %
3 0 %
4 0 %
5 0 %
6 0 %
7 0 %
8 0 %
9 0 %
1 0 0 %Probabil i ty > %
Marketable gas (Bcf)
Mean = 54.3 Bcf @ 42.4% Probabil i ty
FISHING BRANCH SANDSTONE POTENTIAL RESOURCES
Percentile values100%.........................0 95%.......................16 90%.......................21 85%.......................25 80%.......................28 75%.......................32 70%.......................35 65%.......................39 60%.......................43 55%.......................46 50%.......................50 45%.......................53 40%.......................56 35%.......................60 30%.......................65 25%.......................69 20%.......................74 15%.......................80 10%.......................93 5%.....................111 0%.....................237

20 PETROLEUM RESOURCE ASSESSMENT OF THE EAGLE PLAIN, YUKON TERRITORY, CANADA
Permian JUNGLE CREEK SANDSTONE
ESTABLISHED GAS AND OIL PLAY
Reservoir description
Jungle Creek Sandstone reservoirs are found in closures that have been formed by Laramide-aged anticlines. The Jungle Creek Formation is subcropped by the pre-Cretaceous unconformity. The structural anomaly is observed on the surface and on seismic sections.
The Jungle Creek sandstone is described as having a variable lithology, including skeletal, micritic and spicular limestone, calcareous sandstone, chert pebble conglomerate, calcareous shale, siliceous mudstone and siltstone. The unit can have up to 166 m of clean sandstone, but thins to the south and subcrops to the north.
SANDSTONELIMIT
Dem
pste
rH
ighw
ay
66°
140° 138° 137° 136°
66° 30'
139°
67°
66° 30'
66°
67° 30' 67° 30'
67°
65° 30'65° 30'
136°138°139° 137°140°
Eagle Plain
0 50
km
Area of Potential
Laramide Anticlines
Discoveries
Outcrop area
Rivers
T A I G A R A N G E S
KEELE R
ANGE
Chance
Birch
Blackie
N W T
Y u k o nRIC
HA
RD
SO
N M
OU
NT
AIN
S
NA
HO
NI R
AN
GE
Eagle
A
rch
POTENTIAL RESOURCES JUNGLE CREEK SANDSTONE

PETROLEUM RESOURCE ASSESSMENT OF THE EAGLE PLAIN, YUKON TERRITORY, CANADA 21
Discovered resources
There is only one current discovery, the Blackie Field, which has gas trapped on water. Gas flowed on a DST at a maximum of 79 103m3/d with no recovered oil or condensate. There was a minor show of oil: traces of oil in a mud recovery on a DST mud recovery in the Birch B-34 well.
Potential resources
The area of potential resources is limited by the subcrop of the unit near Chance and by outcropping along the southern edge of the basin. Although there is some potential for oil, gas is more likely, as indicated by testing and the maturity of the source rocks.
Reservoir parameters
Field Resources Area Net Pay Porosity Hydrocarbon Recovery Initial marketable (ha.) (m) (%) saturation (%) factor (%) gas 106m3 (Bcf)
Blackie gas 1,599 17.7 15 70 45 594.0 (21.0)
Birch oil 0 1.8 8 0 0
Shale
Shale
BlackieM-59
Water
Sandstone
Gas
Oil
JUNGLE CREEK SANDSTONE POTENTIAL RESOURCES

22 PETROLEUM RESOURCE ASSESSMENT OF THE EAGLE PLAIN, YUKON TERRITORY, CANADA
In place
Recoverable
Sulphur (MMlt)
Oil (MMb) Solution gas (Bcf)
Non associated gas (Bcf)
Total gas (BcF)
Liquids(MMb)
Barrels ofoilequivalent (MMBOE)
Marketable gas (Bcf)
0.6000 0.6400 0.6600 0.633
0.060 0.060 0.060 0.060
0.540 0.580 0.600 0.573
0.120 0.160 0.180 0.153
0.300 0.500 0.700 0.500
0.044
0.050 0.100 0.150 0.100
0.600 0.700 0.800 0.700
0.100 0.150 0.200 0.150
0.400 0.550 0.800 0.583
15.0 35.0 60.0 36.7
0.100 0.200 0.250 0.183
0.001 0.005 0.010 0.005
0.000
0.008
0.190 0.200 0.210 0.200
1.108 1.114 1.120 1.114
0.800 0.900 0.950 0.883
0.059
487.5
73.1
179.2
104.5
100.5
0.400 0.480 0.600 0.5
0.000 0.000 0.000 0.000
0.007 0.008 0.009 0.008
6.000
0.030
0.962
POTENTIAL RESOURCES JUNGLE CREEK SANDSTONE
Oil depth: 2,000 ft.; gas depth: 2,000 ft.; gas pressure: 775 psi; gas reservoir temperature: 70°F
0.77 52.66 52.66 9.54
0.12 0.02 30.72 30.74 0.02 5.25 29.57
0.00
Total play area (MM acres)
Tested play area (MM acres)
Untested play area (MM acres)
Fraction of total play area in trap
Fraction of untested play area filled (areally)
Potential hydrocarbon area (MM acres)
Porosity
Hydrocarbon saturation
Oil recovery factor
Gas recovery factor
Average net pay (ft.)
Probability of hydrocarbons
Fraction of pore volume oil bearing
Potential oil area (MM acres)
Potential gas area (MM acres)
Gas oil ratio (GOR) (MMcf/bbls)
Formation volume factor (FVF)
Gas compressibility factor ‘Z’
Gas volume factor (GVF)
Oil in place (bbls/acre-foot)
Oil recovery (bbls/acre-foot)
Gas in place (MMcf/acre-foot)
Raw gas recovery (MMcf/acre-foot)
Marketable gas recovery (MMcf/acre-foot)
Liquid yield (bbls/MMcf)
H2S content
CO2 content
Gas to BOE conversion factor (MMcf/BOE)
Surface loss (fuel gas, etc.)
Marketable gas (fraction of raw)
Estimate of potential
petroleum resources
Total for play
Minimum Most likely Maximum Mean

PETROLEUM RESOURCE ASSESSMENT OF THE EAGLE PLAIN, YUKON TERRITORY, CANADA 23
0 . 0 0 0 0 . 1 0 0 0 . 2 0 0 0 . 3 0 0 0 . 4 0 0 0 . 5 0 00 %
1 0 %
2 0 %
3 0 %
4 0 %
5 0 %
6 0 %
7 0 %
8 0 %
9 0 %
1 0 0 %Probabil i ty > %
Recoverable oil (MMbbls)
Mean = 0.12 MMbbls @ 40.3% Probabil i ty
0 2 0 4 0 6 0 8 0 1 0 00 %
1 0 %
2 0 %
3 0 %
4 0 %
5 0 %
6 0 %
7 0 %
8 0 %
9 0 %
1 0 0 %Probabil i ty > %
Marketable gas (Bcf)
Mean = 30.0 Bcf @ 40.3% Probabil i ty
JUNGLE CREEK SANDSTONE POTENTIAL RESOURCES
Percentile values100%..................0.000 95%..................0.034 90%..................0.042 85%..................0.051 80%..................0.057 75%..................0.062 70%..................0.068 65%..................0.077 60%..................0.085 55%..................0.092 50%..................0.098 45%..................0.108 40%..................0.116 35%..................0.127 30%..................0.136 25%..................0.147 20%..................0.169 15%..................0.197 10%..................0.226 5%..................0.274 0%..................0.467
Percentile values100%.........................0 95%.......................12 90%.......................14 85%.......................17 80%.......................18 75%.......................19 70%.......................21 65%.......................22 60%.......................24 55%.......................26 50%.......................27 45%.......................29 40%.......................30 35%.......................32 30%.......................34 25%.......................37 20%.......................40 15%.......................43 10%.......................50 5%.......................57 0%.....................100

24 PETROLEUM RESOURCE ASSESSMENT OF THE EAGLE PLAIN, YUKON TERRITORY, CANADA
CarboniferousCHANCE SANDSTONE STRUCTURAL
ESTABLISHED GAS AND OIL PLAY
Reservoir description
The Chance Sandstone play consists of closures formed by Laramide-aged anticlines, which may be partially influenced by normal faulting along north-south and east-west planes.
The Chance Member sandstone is described as thick units of grey- to buff-coloured, salt and pepper, very fine- to coarse-grained, fair to well sorted and are massive to thinly bedded. A maximum of 166 m of clean sandstone may be present. The unit subcrops to the north and west.
Dem
pste
rH
ighw
ay
66°
140° 138° 137° 136°
66° 30'
139°
67°
66° 30'
66°
67° 30' 67° 30'
67°
65° 30'65° 30'
136°138°139° 137°140°
Eagle Plain
0 50
km
Area of Potential
Laramide Anticlines
Discoveries
Subcrop ofChance Sandstone
Rivers
T A I G A R A N G E S
KEELE R
ANGE
Chance
Birch
Blackie
N W T
Y u k o nRIC
HA
RD
SO
N M
OU
NT
AIN
S
NA
HO
NI R
AN
GE
Eagle
A
rch
POTENTIAL RESOURCES CHANCE SANDSTONE STRUCTURAL

PETROLEUM RESOURCE ASSESSMENT OF THE EAGLE PLAIN, YUKON TERRITORY, CANADA 25
Field Resources Area Net Pay Porosity Hydrocarbon Recovery Initial marketable (ha.) (m) (%) saturation (%) factor (%) gas 106m3 (Bcf)
Birch gas 177 3.9 18 75 72 82.9 (2.9)
Discovered resources
One discovery has been made in the Birch B-34 well, which has gas trapped on water. The gas flowed on a DST at a maximum of 194 103m3/d with no recovered oil or condensate.
Potential resources
The area of potential resources is limited by the subcrop of the sandstone and the presence of structural deformation. There is potential for oil, as indicated by the oil in the sandstone at the Chance.
Reservoir parameters
Carbonate and Shale
Carbonate and Shale
BirchB-34
Water
Sandstone
Oil
Gas
CHANCE SANDSTONE STRUCTURAL POTENTIAL RESOURCES

26 PETROLEUM RESOURCE ASSESSMENT OF THE EAGLE PLAIN, YUKON TERRITORY, CANADA
Total play area (MM acres)
Tested play area (MM acres)
Untested play area (MM acres)
Fraction of total play area in trap
Fraction of untested play area filled (areally)
Potential hydrocarbon area (MM acres)
Porosity
Hydrocarbon saturation
Oil recovery factor
Gas recovery factor
Average net pay (ft.)
Probability of hydrocarbons
Fraction of pore volume oil bearing
Potential oil area (MM acres)
Potential gas area (MM acres)
Gas oil ratio (GOR) (MMcf/bbls)
Formation volume factor (FVF)
Gas compressibility factor ‘Z’
Gas volume factor (GVF)
Oil in place (bbls/acre-foot)
Oil recovery (bbls/acre-foot)
Gas in place (MMcf/acre-foot)
Raw gas recovery (MMcf/acre-foot)
Marketable gas recovery (MMcf/acre-foot)
Liquid yield (bbls/MMcf)
H2S content
CO2 content
Gas to BOE conversion factor (MMcf/BOE)
Surface loss (fuel gas, etc.)
Marketable gas (fraction of raw)
0.5500 0.5880 0.6000 0.579
0.072 0.072 0.072 0.072
0.478 0.516 0.528 0.507
0.100 0.140 0.180 0.140
0.300 0.500 0.700 0.500
0.036
0.090 0.180 0.220 0.163
0.550 0.750 0.900 0.733
0.100 0.150 0.200 0.150
0.550 0.720 0.800 0.690
10.0 23.0 30.0 21.0
0.080 0.150 0.200 0.143
0.020 0.100 0.200 0.107
0.001
0.005
0.399 0.420 0.441 0.420
1.227 1.239 1.251 1.239
0.764 0.780 0.796 0.780
0.279
749.7
112.5
1,453.9
1,003.2
938.0
15.000 20.100 25.000 20.0
0.000 0.000 0.000 0.000
0.010 0.015 0.020 0.015
6.000
0.050
0.935
POTENTIAL RESOURCES CHANCE SANDSTONE STRUCTURAL
Oil depth: 4,200 ft.; gas depth: 4,200 ft.; gas pressure: 3,368 psi; gas reservoir temperature: 90°F
8.55 138.84 138.84 31.69
1.28 0.54 95.80 96.34 1.92 19.26 90.11
0.00
Estimate of potential
petroleum resources
Total for play
In place
Sulphur (MMlt)
Oil (MMb) Solution gas (Bcf)
Non associated gas (Bcf)
Total gas (BcF)
Liquids(MMb)
Barrels ofoilequivalent (MMBOE)
Marketable gas (Bcf)
Recoverable
Minimum Most likely Maximum Mean

PETROLEUM RESOURCE ASSESSMENT OF THE EAGLE PLAIN, YUKON TERRITORY, CANADA 27
0 1 2 3 4 50 %
1 0 %
2 0 %
3 0 %
4 0 %
5 0 %
6 0 %
7 0 %
8 0 %
9 0 %
1 0 0 %Probabil i ty > %
Recoverable oil (MMbbls)
Mean = 1.3 MMbbls @ 44.6% Probabil i ty
0 5 0 1 0 0 1 5 0 2 0 0 2 5 00 %
1 0 %
2 0 %
3 0 %
4 0 %
5 0 %
6 0 %
7 0 %
8 0 %
9 0 %
1 0 0 %Probabil i ty > %
Marketable gas (Bcf)
Mean = 90.8 Bcf @ 44.6% Probabil i ty
CHANCE SANDSTONE STRUCTURAL POTENTIAL RESOURCES
Percentile values100%.........................0 95%......................0.4 90%......................0.5 85%......................0.6 80%......................0.7 75%......................0.8 70%......................0.8 65%......................0.9 60%......................1.0 55%......................1.1 50%......................1.1 45%......................1.2 40%......................1.3 35%......................1.4 30%......................1.5 25%......................1.7 20%......................1.8 15%......................2.0 10%......................2.2 5%......................2.6 0%......................4.4
Percentile values100%.........................0 95%.......................40 90%.......................48 85%.......................54 80%.......................59 75%.......................64 70%.......................68 65%.......................72 60%.......................76 55%.......................80 50%.......................85 45%.......................89 40%.......................94 35%.....................101 30%.....................106 25%.....................114 20%.....................120 15%.....................130 10%.....................139 5%.....................160 0%.....................248

28 PETROLEUM RESOURCE ASSESSMENT OF THE EAGLE PLAIN, YUKON TERRITORY, CANADA
Carboniferous CHANCE SANDSTONE UNCONFORMITY
ESTABLISHED GAS AND OIL PLAY
Reservoir description
Carboniferous Chance Sandstone is subcropped by the pre-Cretaceous unconformity, leaving sandstone against Cretaceous shale to form a stratigraphic trap. This trap is enhanced by structural doming of the sandstone units during Laramide deformation. Chance sandstone and the associated Laramide anticlines have been discussed previously.
Discovered resources
There is one discovery in the Chance Field with gas and/or oil trapped on top of water in a number of sandstone layers. Gas has flowed to the surface at varying rates on DSTs, to a maximum of 230 103m3/d, while the maximum oil recovery was 610 m3.
Dem
pste
rH
ighw
ay
66°
140° 138° 137° 136°
66° 30'
139°
67°
66° 30'
66°
67° 30' 67° 30'
67°
65° 30'65° 30'
136°138°139° 137°140°
Eagle Plain
0 50
km
Area of Potential
Laramide Anticlines
Discoveries
Outcrop Area
Rivers
T A I G A R A N G E S
RIC
HA
RD
SO
N M
OU
NT
AIN
S
KEELE R
ANGE
NA
HO
NI R
AN
GE
Eagle
A
rch
Chance
Birch
Blackie
N W T
Y u k o n
POTENTIAL RESOURCES CHANCE SANDSTONE UNCONFORMITY

PETROLEUM RESOURCE ASSESSMENT OF THE EAGLE PLAIN, YUKON TERRITORY, CANADA 29
Potential resources
The area of potential is limited by the subcrop of the sandstone and the need for folding. Both gas and oil pools are expected to be small, based on the current discovered pool sizes.
Reservoir Parameters
Field Resources Area Net Pay Porosity Hydrocarbon Recovery Initial marketable (ha.) (m) (%) saturation (%) factor (%) gas 106m3 (Bcf)
Chance Sand #1 gas 416 15.0 14 55 75 496.4 (17.5)
Sand #2 gas 206 10.0 14 55 75 163.9 (5.8)
Sand #3 gas 369 10.0 10 55 75 209.7 (7.4)
Sand #1 oil 916 5.0 8 60 30 0.5 (3.2)
Sand #2 oil 87 1.4 5 60 30 0.01 (0.05)
Sand #3 oil 97 6.7 8 60 30 0.07 (0.45)
ChanceJ-19
ChanceM-08
Subcrop edge
Cretaceous Shale
Carboniferous Limestone
Sandstone
Shale
Carboniferous Limestone
GasGas
Water
Shale
OilWaterOilGas
Sandstone
Water
Sandstone
CHANCE SANDSTONE UNCONFORMITY POTENTIAL RESOURCES

30 PETROLEUM RESOURCE ASSESSMENT OF THE EAGLE PLAIN, YUKON TERRITORY, CANADA
0.5800 0.5880 0.5900 0.586
0.066 0.066 0.066 0.066
0.514 0.522 0.524 0.520
0.090 0.150 0.200 0.147
0.500 0.700 0.900 0.700
0.053
0.090 0.130 0.230 0.150
0.500 0.550 0.750 0.600
0.150 0.300 0.400 0.283
0.600 0.750 0.900 0.750
20.0 50.0 100.0 56.7
0.150 0.250 0.350 0.250
0.030 0.100 0.200 0.110
0.001
0.012
0.399 0.420 0.441 0.420
1.227 1.239 1.251 1.239
0.774 0.790 0.806 0.790
0.171
563.4
159.6
669.3
502.0
457.8
25.000 36.000 45.000 35.3
0.001 0.001 0.002 0.001
0.050 0.057 0.065 0.057
6.000
0.030
0.912
Total play area (MM acres)
Tested play area (MM acres)
Untested play area (MM acres)
Fraction of total play area in trap
Fraction of untested play area filled (areally)
Potential hydrocarbon area (MM acres)
Porosity
Hydrocarbon saturation
Oil recovery factor
Gas recovery factor
Average net pay (ft.)
Probability of hydrocarbons
Fraction of pore volume oil bearing
Potential oil area (MM acres)
Potential gas area (MM acres)
Gas oil ratio (GOR) (MMcf/bbls)
Formation volume factor (FVF)
Gas compressibility factor ‘Z’
Gas volume factor (GVF)
Oil in place (bbls/acre-foot)
Oil recovery (bbls/acre-foot)
Gas in place (MMcf/acre-foot)
Raw gas recovery (MMcf/acre-foot)
Marketable gas recovery (MMcf/acre-foot)
Liquid yield (bbls/MMcf)
H2S content
CO2 content
Gas to BOE conversion factor (MMcf/BOE)
Surface loss (fuel gas, etc.)
Marketable gas (fraction of raw)
POTENTIAL RESOURCES CHANCE SANDSTONE UNCONFORMITY
Oil depth: 4,200 ft.; gas depth: 4,200 ft.; gas pressure: 4,363 psi; gas reservoir temperature: 90°F
47.00 451.84 107.26 64.74
13.30 5.58 338.88 86.02 2.84 30.46 314.65
0.00
Estimate of potential
petroleum resources
Total for play
In place
Sulphur (MMlt)
Oil (MMb) Solution gas (Bcf)
Non associated gas (Bcf)
Total gas (BcF)
Liquids(MMb)
Barrels ofoilequivalent (MMBOE)
Marketable gas (Bcf)
Recoverable
Minimum Most likely Maximum Mean

PETROLEUM RESOURCE ASSESSMENT OF THE EAGLE PLAIN, YUKON TERRITORY, CANADA 31
0 1 0 2 0 3 0 4 0 5 0 6 0 7 00 %
1 0 %
2 0 %
3 0 %
4 0 %
5 0 %
6 0 %
7 0 %
8 0 %
9 0 %
1 0 0 %Probabil i ty > %
Recoverable oil (MMbbls)
Mean = 13.4 MMbbls @ 37.7% Probabil i ty
0 5 0 1 0 0 1 5 0 2 0 0 2 5 0 3 0 00 %
1 0 %
2 0 %
3 0 %
4 0 %
5 0 %
6 0 %
7 0 %
8 0 %
9 0 %
1 0 0 %Probabil i ty > %
Marketable gas (Bcf)
Mean = 79.6 Bcf @ 37.7% Probabil i ty
CHANCE SANDSTONE UNCONFORMITY POTENTIAL RESOURCES
Percentile values100%.........................0 95%......................4.2 90%......................5.2 85%......................6.0 80%......................6.8 75%......................7.5 70%......................8.1 65%......................8.7 60%......................9.5 55%....................10.5 50%....................11.2 45%....................11.9 40%....................12.8 35%....................13.8 30%....................14.8 25%....................16.9 20%....................19.1 15%....................21.4 10%....................25.3 5%....................30.4 0%....................61.6
Percentile values100%.........................0 95%.......................32 90%.......................40 85%.......................45 80%.......................48 75%.......................51 70%.......................53 65%.......................58 60%.......................63 55%.......................66 50%.......................70 45%.......................74 40%.......................80 35%.......................86 30%.......................93 25%.....................101 20%.....................109 15%.....................118 10%.....................132 5%.....................161 0%.....................253

32 PETROLEUM RESOURCE ASSESSMENT OF THE EAGLE PLAIN, YUKON TERRITORY, CANADA
Carboniferous CHANCE SANDSTONE STRATIGRAPHIC
ESTABLISHED GAS AND OIL PLAY
Reservoir description
The Chance Sandstone stratigraphic facies change trap is created by porous sandstone pinching out of against non-porous sandstone. Trapping can be enhanced by dip reversals, but structural enhancement is not necessary. The Chance Sandstone is described under the Chance Sandstone – Laramide Folds play description.
Discovered resources
The one oil discovery was in the Chance G-08 well. The oil is found to be structurally lower than the oil/water interface in the equivalent sand in the M-08 well nearby. The well recovered 360 m of oil on a DST. There has also been a gas show in the South Chance D-63 well which recovered gas-cut mud on a DST.
Dem
pste
rH
ighw
ay
66°
140° 138° 137° 136°
66° 30'
139°
67°
66° 30'
66°
67° 30' 67° 30'
67°
65° 30'65° 30'
136°138°139° 137°140°
Eagle Plain
0 50
km
Area of Potential
Laramide Anticlines
Discoveries
Subcrop ofChance Sandstone
Rivers
S Chance D-63
T A I G A R A N G E S
KEELE R
ANGE
Chance
Birch
Blackie
N W T
Y u k o nRIC
HA
RD
SO
N M
OU
NT
AIN
S
NA
HO
NI R
AN
GE
Eagle
A
rch
POTENTIAL RESOURCES CHANCE SANDSTONE STRATIGRAPHIC

PETROLEUM RESOURCE ASSESSMENT OF THE EAGLE PLAIN, YUKON TERRITORY, CANADA 33
Undiscovered resources
The area of potential is limited only by the subcrop of the sandstone, as folding is not a factor. Both small gas and oil pools can be expected, with equal probabilities. Pool sizes are expected to be small since reservoirs can be pinched out by cementation or subcropped by the erosional edge.
Reservoir parameters
Field Resources Area Net Pay Porosity Hydrocarbon Recovery Initial marketable (ha.) (m) (%) saturation (%) factor (%) gas 106m3 (Bcf)
South Chance D-63 gas 0 7.0 8 75 - 0 (0)
Chance Sand 1A oil 802 5.0 6 60 30 0.4 (2.2)
ChanceG-08
Cretaceous Shale
Carboniferous Limestone
Carboniferous Limestone
Subcrop edge
Water
Sandstone
Oil
GasOil
CHANCE SANDSTONE STRATIGRAPHIC POTENTIAL RESOURCES

34 PETROLEUM RESOURCE ASSESSMENT OF THE EAGLE PLAIN, YUKON TERRITORY, CANADA
POTENTIAL RESOURCES CHANCE SANDSTONE STRATIGRAPHIC
Oil depth: 4,200 ft.; gas depth: 4,200 ft.; gas pressure: 4,363 psi; gas reservoir temperature: 90°F
Total play area (MM acres)
Tested play area (MM acres)
Untested play area (MM acres)
Fraction of total play area in trap
Fraction of untested play area filled (areally)
Potential hydrocarbon area (MM acres)
Porosity
Hydrocarbon saturation
Oil recovery factor
Gas recovery factor
Average net pay (ft.)
Probability of hydrocarbons
Fraction of pore volume oil bearing
Potential oil area (MM acres)
Potential gas area (MM acres)
Gas oil ratio (GOR) (MMcf/bbls)
Formation volume factor (FVF)
Gas compressibility factor ‘Z’
Gas volume factor (GVF)
Oil in place (bbls/acre-foot)
Oil recovery (bbls/acre-foot)
Gas in place (MMcf/acre-foot)
Raw gas recovery (MMcf/acre-foot)
Marketable gas recovery (MMcf/acre-foot)
Liquid yield (bbls/MMcf)
H2S content
CO2 content
Gas to BOE conversion factor (MMcf/BOE)
Surface loss (fuel gas, etc.)
Marketable gas (fraction of raw)
Estimate of potential
petroleum resources
Total for play
In place
Sulphur (MMlt)
Oil (MMb) Solution gas (Bcf)
Non associated gas (Bcf)
Total gas (BcF)
Liquids(MMb)
Barrels ofoilequivalent (MMBOE)
Marketable gas (Bcf)
0.5650 0.5880 0.6000 0.584
0.085 0.085 0.085 0.085
0.480 0.503 0.515 0.499
0.300 0.500 0.800 0.533
0.400 0.700 0.900 0.667
0.178
0.060 0.070 0.100 0.077
0.500 0.600 0.800 0.633
0.150 0.300 0.400 0.283
0.600 0.750 0.900 0.750
10.0 30.0 45.0 28.3
0.090 0.200 0.300 0.197
0.080 0.150 0.200 0.143
0.005
0.030
0.399 0.420 0.441 0.420
1.227 1.239 1.251 1.239
0.774 0.790 0.806 0.790
0.149
305.1
86.3
317.2
237.9
219.1
20.000 28.000 35.000 27.7
0.000 0.000 0.000 0.000
0.022 0.029 0.035 0.029
6.000
0.050
0.921
43.10 268.88 72.86 55.24
12.21 5.13 210.66 59.77 1.51 23.68 190.86
Recoverable
Minimum Most likely Maximum Mean

PETROLEUM RESOURCE ASSESSMENT OF THE EAGLE PLAIN, YUKON TERRITORY, CANADA 35
0 1 0 2 0 3 0 4 0 5 00 %
1 0 %
2 0 %
3 0 %
4 0 %
5 0 %
6 0 %
7 0 %
8 0 %
9 0 %
1 0 0 %Probabil i ty > %
Recoverable oi l (MMbbls)
Mean = 12.4 MMbbls @ 41.0% Probabil i ty
0 2 0 4 0 6 0 8 0 1 0 0 1 2 0 1 4 0 1 6 0 1 8 0 2 0 00 %
1 0 %
2 0 %
3 0 %
4 0 %
5 0 %
6 0 %
7 0 %
8 0 %
9 0 %
1 0 0 %Probabil i ty > %
Marketable gas (Bcf)
Mean = 56.2 Bcf @ 41.0% Probabil i ty
CHANCE SANDSTONE STRATIGRAPHIC POTENTIAL RESOURCES
Percentile values100%.........................0 95%......................4.4 90%......................5.3 85%......................6.0 80%......................6.4 75%......................7.1 70%......................7.8 65%......................8.3 60%......................9.3 55%....................10.1 50%....................10.8 45%....................11.2 40%....................12.3 35%....................13.4 30%....................14.4 25%....................15.5 20%....................17.2 15%....................19.4 10%....................22.0 5%....................26.4 0%....................44.2
Percentile values100%.........................0 95%.......................22 90%.......................27 85%.......................30 80%.......................33 75%.......................36 70%.......................38 65%.......................41 60%.......................44 55%.......................46 50%.......................49 45%.......................53 40%.......................56 35%.......................59 30%.......................63 25%.......................70 20%.......................76 15%.......................84 10%.......................95 5%.....................108 0%.....................193

36 PETROLEUM RESOURCE ASSESSMENT OF THE EAGLE PLAIN, YUKON TERRITORY, CANADA
Carboniferous CANOE RIVER LIMESTONE
ESTABLISHED GAS AND OIL PLAY
Reservoir description
Carboniferous Canoe River limestone stratigraphic facies change traps are the result of porous carbonate pinching out against non-porous carbonate associated with a clearly defined facies boundary within the same formation, or against other non-porous formations. Reservoirs may or may not be enhanced by Laramide structures.
The Canoe River Member is the lower limestone of the Hart River Formation. It is described as a thinly bedded micritic crinoidal limestone with interbeds of dolomite, chert and dark bioturbated shale. The unit is subcropped by the pre-Cretaceous unconformity in the north and thins rapidly to the south. A maximum thickness of 500 m can be expected.
Discovered resources
One discovery and one show have been made in two wells in the Chance Field. The J-19 well has a porous limey sandstone at the top of the Canoe River Member that has gas trapped on water. A test of this zone recovered gas-cut mud. The M-08 well has a porous limey sandstone section within the Canoe River Member that has gas trapped on oil on water. A test flowed gas at 283 103m3/d and recovered 290 m3 of oil. Zones are highly fractured.
Dem
pste
rH
ighw
ay
66°
140° 138° 137° 136°
66° 30'
139°
67°
66° 30'
66°
67° 30' 67° 30'
67°
65° 30'65° 30'
136°138°139° 137°140°
Eagle Plain
0 50
km
Area of Potential
Laramide Anticlines
Discoveries
Subcrop ofHart River
Rivers
T A I G A R A N G E S
KEELE R
ANGE
Chance
Birch
Blackie
N W T
Y u k o nRIC
HA
RD
SO
N M
OU
NT
AIN
S
NA
HO
NI R
AN
GE
Eagle
A
rch
POTENTIAL RESOURCES CANOE RIVER LIMESTONE

PETROLEUM RESOURCE ASSESSMENT OF THE EAGLE PLAIN, YUKON TERRITORY, CANADA 37
Potential resources
The area of potential is limited by the subcrop edge. Fracturing may be necessary for economic production rates. Both oil and gas are possible, but gas is considered to be more likely, based on results to date.
Reservoir parameters
Field Resources Area Net Pay Porosity Hydrocarbon Recovery Initial marketable (ha.) (m) (%) saturation (%) factor (%) gas 106m3 (Bcf)
Chance J-19 gas 229 2.5 13 70 65 40.8 (1.44)
M-08 gas 168 1.0 3 60 50 1.24 (0.04)
M-08 oil 168 0.7 3 60 20 0.15 (0.02)
ChanceM-08
Cretaceous Shale
Porous Limestone
Carboniferous Shale
Subcrop edge
Oil
Water
Gas
CANOE RIVER LIMESTONE POTENTIAL RESOURCES

38 PETROLEUM RESOURCE ASSESSMENT OF THE EAGLE PLAIN, YUKON TERRITORY, CANADA
POTENTIAL RESOURCES CANOE RIVER LIMESTONE
Oil depth: 5,100 ft.; gas depth: 5,100 ft.; gas pressure: 3,994 psi; gas reservoir temperature: 117°F
4.99 97.61 97.61 21.25
1.00 0.51 60.19 60.70 2.15 13.26 54.26
0.00
Total play area (MM acres)
Tested play area (MM acres)
Untested play area (MM acres)
Fraction of total play area in trap
Fraction of untested play area filled (areally)
Potential hydrocarbon area (MM acres)
Porosity
Hydrocarbon saturation
Oil recovery factor
Gas recovery factor
Average net pay (ft.)
Probability of hydrocarbons
Fraction of pore volume oil bearing
Potential oil area (MM acres)
Potential gas area (MM acres)
Gas oil ratio (GOR) (MMcf/bbls)
Formation volume factor (FVF)
Gas compressibility factor ‘Z’
Gas volume factor (GVF)
Oil in place (bbls/acre-foot)
Oil recovery (bbls/acre-foot)
Gas in place (MMcf/acre-foot)
Raw gas recovery (MMcf/acre-foot)
Marketable gas recovery (MMcf/acre-foot)
Liquid yield (bbls/MMcf)
H2S content
CO2 content
Gas to BOE conversion factor (MMcf/BOE)
Surface loss (fuel gas, etc.)
Marketable gas (fraction of raw)
Estimate of potential
petroleum resources
Total for play
In place
Recoverable
Sulphur (MMlt)
Oil (MMb) Solution gas (Bcf)
Non associated gas (Bcf)
Total gas (BcF)
Liquids(MMb)
Barrels ofoilequivalent (MMBOE)
Marketable gas (Bcf)
1.0000 1.2000 1.2500 1.150
0.130 0.130 0.130 0.130
0.870 1.070 1.120 1.020
0.020 0.100 0.300 0.140
0.500 0.850 0.950 0.767
0.109
0.030 0.065 0.150 0.082
0.500 0.650 0.750 0.633
0.100 0.200 0.300 0.200
0.500 0.600 0.750 0.617
2.0 9.0 20.0 10.3
0.050 0.150 0.240 0.147
0.040 0.100 0.150 0.097
0.002
0.015
0.485 0.510 0.536 0.510
1.276 1.291 1.305 1.291
0.833 0.850 0.867 0.850
0.289
310.9
62.2
651.2
401.6
358.6
27.0 35.6 44.5 35.7
0.0 0.0 0.0 0.000
0.020 0.057 0.100 0.059
6.000
0.050
0.893
Minimum Most likely Maximum Mean

PETROLEUM RESOURCE ASSESSMENT OF THE EAGLE PLAIN, YUKON TERRITORY, CANADA 39
0 5 0 1 0 0 1 5 0 2 0 0 2 5 0 3 0 0 3 5 00 %
1 0 %
2 0 %
3 0 %
4 0 %
5 0 %
6 0 %
7 0 %
8 0 %
9 0 %
1 0 0 %Probabil i ty > %
Marketable gas (Bcf)
Mean = 55.8 Bcf @ 36.8% Probabil i ty
0 1 2 3 4 5 6 7 80 %
1 0 %
2 0 %
3 0 %
4 0 %
5 0 %
6 0 %
7 0 %
8 0 %
9 0 %
1 0 0 %Probabil i ty > %
Recoverable oil (MMbbls)
Mean = 1.0 MMbbls @ 36.8% Probabil i ty
CANOE RIVER LIMESTONE POTENTIAL RESOURCES
Percentile values100%.........................0 95%......................0.2 90%......................0.2 85%......................0.3 80%......................0.4 75%......................0.4 70%......................0.5 65%......................0.5 60%......................0.6 55%......................0.7 50%......................0.7 45%......................0.8 40%......................0.9 35%......................1.1 30%......................1.2 25%......................1.3 20%......................1.5 15%......................1.6 10%......................2.0 5%......................2.7 0%......................7.9
Percentile values100%.........................0 95%.......................11 90%.......................14 85%.......................17 80%.......................20 75%.......................24 70%.......................28 65%.......................31 60%.......................34 55%.......................38 50%.......................43 45%.......................47 40%.......................52 35%.......................58 30%.......................65 25%.......................69 20%.......................78 15%.......................93 10%.....................113 5%.....................150 0%.....................326

40 PETROLEUM RESOURCE ASSESSMENT OF THE EAGLE PLAIN, YUKON TERRITORY, CANADA
Carboniferous TUTTLE FORMATION
ESTABLISHED GAS PLAY
Reservoir description
The Tuttle Formation is a stratigraphic facies change play that occurs where the Tuttle Formation pinches out into the Lower Carboniferous Ford Lake shale or against the Upper Devonian Imperial shale, or where the sandstone bodies pinch out within the formation. Trapping is enhanced by structure but it is not necessary for this play.
The Tuttle Formation is a mixture of chert conglomerate, very poorly sorted quartz and chert sandstone, siltstone and shale. It is distinguished by the presence of presence of kaolinite and quartz in the pores and by orthoquartzite beds. The sands are fluviodeltaic in nature and are thought to have a northeast source. There are variable amounts of sandstone in the basin and the maximum thickness is 1,420 m.
Dem
pste
rH
ighw
ay
66°
140° 138° 137° 136°
66° 30'
139°
67°
66° 30'
66°
67° 30' 67° 30'
67°
65° 30'65° 30'
136°138°139° 137°140°
Eagle Plain
0 50km
Area of Potential
Laramide Anticlines
Discoveries
Subcrop ofTuttle Formation
Rivers
T A I G A R A N G E S
KEELE R
ANGE
Chance
Birch
Blackie
N W T
Y u k o nRIC
HA
RD
SO
N M
OU
NT
AIN
S
NA
HO
NI R
AN
GE
Eagle
A
rch
POTENTIAL RESOURCES TUTTLE FORMATION

PETROLEUM RESOURCE ASSESSMENT OF THE EAGLE PLAIN, YUKON TERRITORY, CANADA 41
Discovered resources
There have been discoveries at Chance and Birch, both of which are enhanced by Laramide structures. At Chance, the zone has gas trapped on water and tested gas at a maximum of 283 103m3/d. At Birch, there is no water leg and the zone tested at a maximum of 258 103m3/d.
Potential resources
The area of potential resources is controlled by pinchout of the sandstone to the northwest and by its subcrop to the southwest. This is considered to be a gas play.
Reservoir parameters
Field Resources Area Net Pay Porosity Hydrocarbon Recovery Initial marketable (ha.) (m) (%) saturation (%) factor (%) gas 106m3 (Bcf)
Chance gas 168 1.8 16 90 60 32.2 (1.14)
Birch gas 229 6.1 5.0 72 70 48.3 (1.7)
TUTTLE FORMATION POTENTIAL RESOURCES
BirchB-34
Ford Lake Shale
Ford Lake Shale
Imperial Shale
Tuttle Formation
Gas
Water

42 PETROLEUM RESOURCE ASSESSMENT OF THE EAGLE PLAIN, YUKON TERRITORY, CANADA
POTENTIAL RESOURCES TUTTLE FORMATION
Oil depth: 6,160 ft.; gas depth: 6,160 ft.; gas pressure: 4,083 psi; gas reservoir temperature: 103°F
0.00 124.25 124.25 20.71
0.00 0.00 80.76 80.76 1.29 14.75 75.81
0.02
n
Total play area (MM acres)
Tested play area (MM acres)
Untested play area (MM acres)
Fraction of total play area in trap
Fraction of untested play area filled (areally)
Potential hydrocarbon area (MM acres)
Porosity
Hydrocarbon saturation
Oil recovery factor
Gas recovery factor
Average net pay (ft.)
Probability of hydrocarbons
Fraction of pore volume oil bearing
Potential oil area (MM acres)
Potential gas area (MM acres)
Gas oil ratio (GOR) (MMcf/bbls)
Formation volume factor (FVF)
Gas compressibility factor ‘Z’
Gas volume factor (GVF)
Oil in place (bbls/acre-foot)
Oil recovery (bbls/acre-foot)
Gas in place (MMcf/acre-foot)
Raw gas recovery (MMcf/acre-foot)
Marketable gas recovery (MMcf/acre-foot)
Liquid yield (bbls/MMcf)
H2S content
CO2 content
Gas to BOE conversion factor (MMcf/BOE)
Surface loss (fuel gas, etc.)
Marketable gas (fraction of raw)
Estimate of potential
petroleum resources
Total for play
In place
Sulphur (MMlt)
Oil (MMb) Solution gas (Bcf)
Non associated gas (Bcf)
Total gas (BcF)
Liquids(MMb)
Barrels ofoilequivalent (MMBOE)
Marketable gas (Bcf)
0.8500 2.3300 3.8000 2.327
0.130 0.130 0.130 0.130
0.720 2.200 3.670 2.197
0.040 0.100 0.150 0.097
0.250 0.400 0.550 0.400
0.085
0.050 0.070 0.110 0.077
0.600 0.800 0.900 0.767
0.100 0.200 0.300 0.200
0.550 0.650 0.750 0.650
4.0 13.0 25.0 14.0
0.040 0.100 0.250 0.130
0.000 0.000 0.000 0.000
0.000
0.011
0.585 0.616 0.647 0.616
1.334 1.351 1.369 1.351
0.804 0.820 0.836 0.820
0.314
337.5
67.5
803.8
522.4
490.4
12.0 15.9 19.9 15.9
0.000 0.000 0.020 0.007
0.005 0.011 0.020 0.012
6.000
0.050
0.939
Recoverable
Minimum Most likely Maximum Mean

PETROLEUM RESOURCE ASSESSMENT OF THE EAGLE PLAIN, YUKON TERRITORY, CANADA 43
0 5 0 1 0 0 1 5 0 2 0 0 2 5 0 3 0 0 3 5 00 %
1 0 %
2 0 %
3 0 %
4 0 %
5 0 %
6 0 %
7 0 %
8 0 %
9 0 %
1 0 0 %Probabil i ty > %
Marketable gas (Bcf)
Mean = 75.7 Bcf @ 39.0% Probabil i ty
TUTTLE FORMATION POTENTIAL RESOURCES
Percentile values100%.........................0 95%.......................17 90%.......................26 85%.......................30 80%.......................35 75%.......................40 70%.......................44 65%.......................48 60%.......................53 55%.......................58 50%.......................63 45%.......................69 40%.......................75 35%.......................82 30%.......................91 25%.......................98 20%.....................110 15%.....................122 10%.....................138 5%.....................172 0%.....................338

44 PETROLEUM RESOURCE ASSESSMENT OF THE EAGLE PLAIN, YUKON TERRITORY, CANADA
TRIANGLE ZONE STRUCTURAL
IMMATURE GAS PLAY
Reservoir description
Triangle zone structures are formed by thrust faulting in the Bell Sub-basin. This faulting occurred during the Laramide Orogeny as the surrounding mountains of the Dave Lord and Nahonni ranges of the Richardson Mountains were formed. These structures have not been found in the South Eagle Sub-basin. The presence of duplex and related structures have been interpreted on seismic sections within the sub-basin in the northeast. Structuring could involve Cretaceous clastics of the Eagle Plain Group.
Undiscovered resources
No wells have been drilled for these targets as they have only recently been researched at the Geological Survey of Canada in Calgary. The area of potential is restricted to the northeastern part of the basin. This is also expected to be a gas play.
Dem
pste
rH
ighw
ay
66°
140° 138° 137° 136°
66° 30'
139°
67°
66° 30'
66°
67° 30' 67° 30'
67°
65° 30'65° 30'
136°138°139° 137°140°
Eagle Plain
0 50
km
Area of Potential
Discoveries
Rivers
T A I G A R A N G E S
KEELE R
ANGE
Chance
Birch
Blackie
N W T
Y u k o nRIC
HA
RD
SO
N M
OU
NT
AIN
S
NA
HO
NI R
AN
GE
Eagle
A
rch
POTENTIAL RESOURCES TRIANGLE ZONE STRUCTURAL

PETROLEUM RESOURCE ASSESSMENT OF THE EAGLE PLAIN, YUKON TERRITORY, CANADA 45
Sandstone Sandstone
Cretaceous Sandstone
Gas
Tight
TRIANGLE ZONE STRUCTURAL POTENTIAL RESOURCES

46 PETROLEUM RESOURCE ASSESSMENT OF THE EAGLE PLAIN, YUKON TERRITORY, CANADA
POTENTIAL RESOURCES TRIANGLE ZONE STRUCTURAL
Oil depth: 4,000 ft; gas depth: 4,100 ft.; gas pressure: 3,500 psi; gas reservoir temperature: 100°F
0.00 65.84 65.84 10.97
0.00 0.00 50.47 50.47 0.26 8.67 46.44
0.00
Total play area (MM acres)
Tested play area (MM acres)
Untested play area (MM acres)
Fraction of total play area in trap
Fraction of untested play area filled (areally)
Potential hydrocarbon area (MM acres)
Porosity
Hydrocarbon saturation
Oil recovery factor
Gas recovery factor
Average net pay (ft.)
Probability of hydrocarbons
Fraction of pore volume oil bearing
Potential oil area (MM acres)
Potential gas area (MM acres)
Gas oil ratio (GOR) (MMcf/bbls)
Formation volume factor (FVF)
Gas compressibility factor ‘Z’
Gas volume factor (GVF)
Oil in place (bbls/acre-foot)
Oil recovery (bbls/acre-foot)
Gas in place (MMcf/acre-foot)
Raw gas recovery (MMcf/acre-foot)
Marketable gas recovery (MMcf/acre-foot)
Liquid yield (bbls/MMcf)
H2S content
CO2 content
Gas to BOE conversion factor (MMcf/BOE)
Surface loss (fuel gas, etc.)
Marketable gas (fraction of raw)
Estimate of potential
petroleum resources
Total for play
In place
Recoverable
Sulphur (MMlt)
Oil (MMb) Solution gas (Bcf)
Non associated gas (Bcf)
Total gas (BcF)
Liquids(MMb)
Barrels ofoilequivalent (MMBOE)
Marketable gas (Bcf)
0.3500 0.5400 1.0000 0.630
0.000 0.000 0.000 0.000
0.350 0.540 1.000 0.630
0.030 0.100 0.200 0.110
0.300 0.600 0.900 0.600
0.042
0.050 0.120 0.220 0.130
0.500 0.650 0.750 0.633
0.050 0.150 0.250 0.150
0.700 0.750 0.850 0.767
10.0 16.0 26.0 17.3
0.010 0.100 0.200 0.103
0.000 0.000 0.000 0.000
0.000
0.004
0.380 0.400 0.420 0.400
1.217 1.228 1.239 1.228
0.882 0.900 0.918 0.900
0.246
520.1
78.0
884.0
677.8
623.5
4.0 5.1 6.4 5.2
0.000 0.000 0.000 0.000
0.010 0.030 0.050 0.030
6.000
0.050
0.920
Minimum Most likely Maximum Mean

PETROLEUM RESOURCE ASSESSMENT OF THE EAGLE PLAIN, YUKON TERRITORY, CANADA 47
0 5 0 1 0 0 1 5 0 2 0 0 2 5 00 %
1 0 %
2 0 %
3 0 %
4 0 %
5 0 %
6 0 %
7 0 %
8 0 %
9 0 %
1 0 0 %Probabil i ty > %
Marketable gas (Bcf)
Mean = 46.5 Bcf @ 38.7% Probabil i ty
TRIANGLE ZONE STRUCTURAL POTENTIAL RESOURCES
Percentile values100%.........................0 95%.......................10 90%.......................14 85%.......................17 80%.......................20 75%.......................23 70%.......................25 65%.......................28 60%.......................32 55%.......................35 50%.......................39 45%.......................42 40%.......................45 35%.......................49 30%.......................55 25%.......................61 20%.......................68 15%.......................77 10%.......................88 5%.....................111 0%.....................220

48 PETROLEUM RESOURCE ASSESSMENT OF THE EAGLE PLAIN, YUKON TERRITORY, CANADA
Carboniferous ETTRAIN CARBONATE
IMMATURE GAS PLAY
Reservoir description
The Ettrain carbonate play results from the stratigraphic pinchout of porous carbonates trapped against the subcrop edge or against non-porous carbonates within the unit. Structures would enhance the stratigraphic plays but are not necessary for the play.
The Ettrain carbonate unit is described as a light-brown skeletal or micritic limestone with interbeds of dark-grey chert and dolomite. Thickness of this unit is variable, averaging about 90 m, with a maximum thickness of more than 240 m.
Dem
pste
rH
ighw
ay
66°
140° 138° 137° 136°
66° 30'
139°
67°
66° 30'
66°
67° 30' 67° 30'
67°
65° 30'65° 30'
136°138°139° 137°140°
Eagle Plain
0 50
km
Area of Potential
Laramide Anticlines
Discoveries
Carbonate-ShaleLine
Rivers
Carbonate
Shale
T A I G A R A N G E S
KEELE R
ANGE
Chance
Birch
Blackie
N W T
Y u k o nRIC
HA
RD
SO
N M
OU
NT
AIN
S
NA
HO
NI R
AN
GE
Eagle
A
rch
POTENTIAL RESOURCES ETTRAIN CARBONATE

PETROLEUM RESOURCE ASSESSMENT OF THE EAGLE PLAIN, YUKON TERRITORY, CANADA 49
Undiscovered resources
Nine wells have been drilled penetrating the Ettrain Formation. However, there have been no hydrocarbon discoveries or any shows reported in this zone. One show previously reported from this play is actually in Jungle Creek Sandstone. The area for potential discoveries is limited by the subcrop edge of the unit and by the number of penetrations by the unsuccessful wells. Due to the limited amount of potential, this play should probably be a secondary target only. It is considered to be a gas play.
Blackie Shale
Subcrop edge
Gas
Ettrain Formation
Cretaceous Shale
Tight
Porous
ETTRAIN CARBONATE POTENTIAL RESOURCES

50 PETROLEUM RESOURCE ASSESSMENT OF THE EAGLE PLAIN, YUKON TERRITORY, CANADA
0.7500 0.9000 1.0000 0.883
0.056 0.056 0.056 0.056
0.694 0.844 0.944 0.827
0.030 0.100 0.300 0.143
0.300 0.600 0.800 0.567
0.067
0.030 0.090 0.150 0.090
0.550 0.600 0.700 0.617
0.100 0.200 0.300 0.200
0.650 0.750 0.850 0.750
5.0 20.0 50.0 25.0
0.020 0.080 0.150 0.083
0.000 0.000 0.000 0.000
0.000
0.006
0.238 0.250 0.263 0.250
1.135 1.143 1.150 1.143
0.784 0.800 0.816 0.800
0.075
376.9
75.4
180.4
135.3
127.2
6.0 8.0 10.0 8.0
0.0 0.0 0.0 0.000
0.005 0.010 0.020 0.012
6.000
0.050
0.940
POTENTIAL RESOURCES ETTRAIN CARBONATE
Oil depth: 2,500 ft.; gas depth: 2,500 ft.; gas pressure: 900 psi; gas reservoir temperature: 75°F
0.00 25.26 25.26 4.21
0.00 0.00 18.95 18.95 0.15 3.31 17.81
0.00
Total play area (MM acres)
Tested play area (MM acres)
Untested play area (MM acres)
Fraction of total play area in trap
Fraction of untested play area filled (areally)
Potential hydrocarbon area (MM acres)
Porosity
Hydrocarbon saturation
Oil recovery factor
Gas recovery factor
Average net pay (ft.)
Probability of hydrocarbons
Fraction of pore volume oil bearing
Potential oil area (MM acres)
Potential gas area (MM acres)
Gas oil ratio (GOR) (MMcf/bbls)
Formation volume factor (FVF)
Gas compressibility factor ‘Z’
Gas volume factor (GVF)
Oil in place (bbls/acre-foot)
Oil recovery (bbls/acre-foot)
Gas in place (MMcf/acre-foot)
Raw gas recovery (MMcf/acre-foot)
Marketable gas recovery (MMcf/acre-foot)
Liquid yield (bbls/MMcf)
H2S content
CO2 content
Gas to BOE conversion factor (MMcf/BOE)
Surface loss (fuel gas, etc.)
Marketable gas (fraction of raw)
Estimate of potential
petroleum resources
Total for play
In place
Recoverable
Sulphur (MMlt)
Oil (MMb) Solution gas (Bcf)
Non associated gas (Bcf)
Total gas (BcF)
Liquids(MMb)
Barrels ofoilequivalent (MMBOE)
Marketable gas (Bcf)
Minimum Most likely Maximum Mean

PETROLEUM RESOURCE ASSESSMENT OF THE EAGLE PLAIN, YUKON TERRITORY, CANADA 51
0 2 0 4 0 6 0 8 0 1 0 00 %
1 0 %
2 0 %
3 0 %
4 0 %
5 0 %
6 0 %
7 0 %
8 0 %
9 0 %
1 0 0 %Probabil i ty > %
Marketable gas (Bcf)
Mean = 18.0 Bcf @ 37.5% Probabil i ty
ETTRAIN CARBONATE POTENTIAL RESOURCES
Percentile values100%.........................0 95%.........................3 90%.........................5 85%.........................6 80%.........................7 75%.........................8 70%.........................8 65%.......................10 60%.......................11 55%.......................13 50%.......................14 45%.......................16 40%.......................17 35%.......................19 30%.......................22 25%.......................25 20%.......................27 15%.......................30 10%.......................36 5%.......................44 0%.......................99

52 PETROLEUM RESOURCE ASSESSMENT OF THE EAGLE PLAIN, YUKON TERRITORY, CANADA
Devonian OGILVIE CARBONATE STRATIGRAPHIC
IMMATURE GAS PLAY
Reservoir description
The Ogilvie carbonate stratigraphic facies change traps exist where porous carbonates are present against tight basinal shale or against non-porous carbonate within the formation. For this play, the majority of potential is expected in the upper limestone as the lower dolomite is not present at the carbonate-shale edge. It is only present in the back-bank position. As a result, there is also potential for gas at the dolomite/limestone interface.
The lower Ogilvie dolomite is described as brown to buff, finely crystalline to sucrosic dolomite with vuggy and intercyrstalline porosity. The upper Ogilvie limestone is described as medium-brown to grey, fine-grained, thin-bedded to massive limestone with beds of coarse-grained encrinite. The unit is very thick — more than 1,220 m within the basin.
PEELPLATEAUN-49
SOUTHTUTTLEN-05
Dem
pste
rH
ighw
ay
66°
140° 138° 137° 136°
66° 30'
139°
67°
66° 30'
66°
67° 30' 67° 30'
67°
65° 30'65° 30'
136°138°139° 137°140°
Eagle Plain
0 50
km
Area of Potential
Laramide Anticlines
Discoveries
Rivers
Carbonate-Shale Line
T A I G A R A N G E S
KEELE R
ANGE
Chance
Birch
Blackie
N W T
Y u k o nRIC
HA
RD
SO
N M
OU
NT
AIN
S
NA
HO
NI R
AN
GE
Eagle
A
rch
POTENTIAL RESOURCES OGILVIE CARBONATE STRATIGRAPHIC

PETROLEUM RESOURCE ASSESSMENT OF THE EAGLE PLAIN, YUKON TERRITORY, CANADA 53
Discovered resources
One gas show has been recorded in the South Tuttle N-05 well. This flowed gas at a maximum rate of 28 103m3/d from the lower dolomite. However, the flow rate declined rapidly. Gassy mud from the Ogilvie limestone was recovered in the Peel Plateau N-49 well.
Potential resources
The area of potential resources is restricted to a region shelfward of the carbonate-shale facies change on the northeast side. The play extends east of the basin edge into the Richardson Trough. This is considered to be a gas play due to the maturation level in the source rocks.
Reservoir parameters
PeelPlateau
N-49
South TuttleN-05
TightGas
Water
OgilvieDolomite
Porous Limestone Tight
Gas
WaterRoad River Shale
Porous Carbonate
Ogilvie Limestone GasWaterTight
Field Resources Area Net Pay Porosity Hydrocarbon Recovery Initial marketable (ha.) (m) (%) saturation (%) factor (%) gas 106m3 (Bcf)
South Tuttle gas 0 4.3 11 70 0 0 (0)
Peel Plateau gas 0 3 ? ? 0 0 (0)
OGILVIE CARBONATE STRATIGRAPHIC POTENTIAL RESOURCES

54 PETROLEUM RESOURCE ASSESSMENT OF THE EAGLE PLAIN, YUKON TERRITORY, CANADA
Total play area (MM acres)
Tested play area (MM acres)
Untested play area (MM acres)
Fraction of total play area in trap
Fraction of untested play area filled (areally)
Potential hydrocarbon area (MM acres)
Porosity
Hydrocarbon saturation
Oil recovery factor
Gas recovery factor
Average net pay (ft.)
Probability of hydrocarbons
Fraction of pore volume oil bearing
Potential oil area (MM acres)
Potential gas area (MM acres)
Gas oil ratio (GOR) (MMcf/bbls)
Formation volume factor (FVF)
Gas compressibility factor ‘Z’
Gas volume factor (GVF)
Oil in place (bbls/acre-foot)
Oil recovery (bbls/acre-foot)
Gas in place (MMcf/acre-foot)
Raw gas recovery (MMcf/acre-foot)
Marketable gas recovery (MMcf/acre-foot)
Liquid yield (bbls/MMcf)
H2S content
CO2 content
Gas to BOE conversion factor (MMcf/BOE)
Surface loss (fuel gas, etc.)
Marketable gas (fraction of raw)
POTENTIAL RESOURCES OGILVIE CARBONATE STRATIGRAPHIC
Oil depth: 6,200 ft.; gas depth: 6,200 ft.; gas pressure: 4,000 psi; gas reservoir temperature: 135°F
0.00 415.94 415.94 69.32
0.00 0.00 291.16 291.16 3.20 51.73 267.86
0.11
0.8000 1.5000 2.0000 1.433
0.450 0.450 0.450 0.450
0.350 1.050 1.550 0.983
0.090 0.200 0.330 0.207
0.200 0.500 0.700 0.467
0.095
0.050 0.110 0.150 0.103
0.600 0.700 0.800 0.700
0.100 0.200 0.300 0.200
0.600 0.700 0.800 0.700
10.0 25.0 100.0 45.0
0.050 0.100 0.200 0.117
0.000 0.000 0.000 0.000
0.000
0.011
0.589 0.620 0.651 0.620
1.336 1.353 1.371 1.353
0.882 0.900 0.918 0.900
0.265
414.6
82.9
835.4
584.8
538.0
7.0 11.0 15.0 11.0
0.001 0.010 0.020 0.010
0.002 0.020 0.050 0.024
6.000
0.050
0.920
Estimate of potential
petroleum resources
Total for play
Solution gas (Bcf)
Non associated gas (Bcf)
Total gas (BcF)
Liquids(MMb)
Barrels ofoilequivalent (MMBOE)
Marketable gas (Bcf)
In place
Recoverable
Sulphur (MMlt)
Oil (MMb)
Minimum Most likely Maximum Mean

PETROLEUM RESOURCE ASSESSMENT OF THE EAGLE PLAIN, YUKON TERRITORY, CANADA 55
0 3 0 0 6 0 0 9 0 0 1 2 0 0 1 5 0 00 %
1 0 %
2 0 %
3 0 %
4 0 %
5 0 %
6 0 %
7 0 %
8 0 %
9 0 %
1 0 0 %Probabil i ty > %
Marketable gas (Bcf)
Mean = 262.9 Bcf @ 38.6% Probabil i ty
OGILVIE CARBONATE STRATIGRAPHIC POTENTIAL RESOURCES
Percentile values100%.........................0 95%.......................61 90%.......................77 85%.......................95 80%.....................111 75%.....................124 70%.....................145 65%.....................164 60%.....................180 55%.....................194 50%.....................211 45%.....................233 40%.....................254 35%.....................285 30%.....................305 25%.....................351 20%.....................406 15%.....................447 10%.....................502 5%.....................614 0%..................1,402

56 PETROLEUM RESOURCE ASSESSMENT OF THE EAGLE PLAIN, YUKON TERRITORY, CANADA
DevonianOGILVIE CARBONATE STRUCTURAL
IMMATURE GAS PLAY
Reservoir description
Antiforms have been observed on seismic sections in the Lower Devonian Ogilvie Formation in the sub-surface. These structures are independent of the Laramide anticlines observed on the present day basin surface.
Potential resources
At least one well has penetrated a Devonian antiform structure in the South Eagle Sub-basin, but without success. There have been several structures mapped with available seismic sections. The area of potential is on the west side of the plain, shelfward of the area of potential for the Ogilvie carbonate-shale facies change play. This is expected to be a gas play due to the maturation levels in the source rocks.
Dem
pste
rH
ighw
ay
66°
140° 138° 137° 136°
66° 30'
139°
67°
66° 30'
66°
67° 30' 67° 30'
67°
65° 30'65° 30'
136°138°139° 137°140°
Eagle Plain
0 50km
Area of Potential
Laramide Anticlines
Discoveries
Rivers
Carbonate-Shale Line
T A I G A R A N G E S
KEELE R
ANGE
Chance
Birch
Blackie
N W T
Y u k o n RIC
HA
RD
SO
N M
OU
NT
AIN
S
NA
HO
NI R
AN
GE
Eagle
A
rch
POTENTIAL RESOURCES OGILVIE CARBONATE STRUCTURAL

PETROLEUM RESOURCE ASSESSMENT OF THE EAGLE PLAIN, YUKON TERRITORY, CANADA 57
Ogilvie Dolomite
Ogilvie Limestone
Tight
Tight
Gas
Gas
Porous
Porous
OGILVIE CARBONATE STRUCTURAL POTENTIAL RESOURCES

58 PETROLEUM RESOURCE ASSESSMENT OF THE EAGLE PLAIN, YUKON TERRITORY, CANADA
1.5000 2.3000 3.0000 2.267
0.020 0.020 0.020 0.020
1.480 2.280 2.980 2.247
0.050 0.100 0.150 0.100
0.020 0.150 0.300 0.157
0.035
0.050 0.110 0.150 0.103
0.600 0.700 0.800 0.700
0.100 0.200 0.300 0.200
0.600 0.700 0.800 0.700
10.0 25.0 100.0 45.0
0.010 0.100 0.200 0.103
0.000 0.000 0.000 0.000
0.000
0.004
0.589 0.620 0.651 0.620
1.336 1.353 1.371 1.353
0.882 0.900 0.918 0.900
0.297
414.6
82.9
935.1
654.6
602.2
7.0 11.0 15.0 11.0
0.001 0.010 0.020 0.010
0.002 0.020 0.050 0.024
6.000
0.050
0.920
POTENTIAL RESOURCES OGILVIE CARBONATE STRUCTURAL
Oil depth: 6,200 ft.; gas depth: 6,300 ft.; gas pressure: 4,500 psi; gas reservoir temperature: 138°F
0.00 153.05 153.05 25.51
0.00 0.00 107.13 107.13 1.18 19.03 98.56
0.04
Total play area (MM acres)
Tested play area (MM acres)
Untested play area (MM acres)
Fraction of total play area in trap
Fraction of untested play area filled (areally)
Potential hydrocarbon area (MM acres)
Porosity
Hydrocarbon saturation
Oil recovery factor
Gas recovery factor
Average net pay (ft.)
Probability of hydrocarbons
Fraction of pore volume oil bearing
Potential oil area (MM acres)
Potential gas area (MM acres)
Gas oil ratio (GOR) (MMcf/bbls)
Formation volume factor (FVF)
Gas compressibility factor ‘Z’
Gas volume factor (GVF)
Oil in place (bbls/acre-foot)
Oil recovery (bbls/acre-foot)
Gas in place (MMcf/acre-foot)
Raw gas recovery (MMcf/acre-foot)
Marketable gas recovery (MMcf/acre-foot)
Liquid yield (bbls/MMcf)
H2S content
CO2 content
Gas to BOE conversion factor (MMcf/BOE)
Surface loss (fuel gas, etc.)
Marketable gas (fraction of raw)
Estimate of potential
petroleum resources
Total for play
Solution gas (Bcf)
Non associated gas (Bcf)
Total gas (BcF)
Liquids(MMb)
Barrels ofoilequivalent (MMBOE)
Marketable gas (Bcf)
In place
Recoverable
Sulphur (MMlt)
Oil (MMb)
Minimum Most likely Maximum Mean

PETROLEUM RESOURCE ASSESSMENT OF THE EAGLE PLAIN, YUKON TERRITORY, CANADA 59
0 1 0 0 2 0 0 3 0 0 4 0 0 5 0 0 6 0 00 %
1 0 %
2 0 %
3 0 %
4 0 %
5 0 %
6 0 %
7 0 %
8 0 %
9 0 %
1 0 0 %Probabil i ty > %
Marketable gas (Bcf)
Mean = 98.7 Bcf @ 38.3% Probabil i ty
OGILVIE CARBONATE STRUCTURAL POTENTIAL RESOURCES
Percentile values100%.........................0 95%.......................18 90%.......................23 85%.......................29 80%.......................34 75%.......................39 70%.......................45 65%.......................52 60%.......................60 55%.......................66 50%.......................75 45%.......................85 40%.......................94 35%.....................105 30%.....................116 25%.....................131 20%.....................152 15%.....................173 10%.....................197 5%.....................255 0%.....................588

60 PETROLEUM RESOURCE ASSESSMENT OF THE EAGLE PLAIN, YUKON TERRITORY, CANADA
Ordovician-Silurian BOUVETTE STRATIGRAPHIC
IMMATURE GAS PLAY
Reservoir description
The Bouvette carbonate-shale facies transition play is similar to the Ogilvie carbonate shale out to Road River basinal shale in the Richardson Trough. Porous carbonate of Cambrian to Silurian age is trapped against tight basinal Road River shale or against non-porous carbonate within the formation.
The Bouvette formation is a generalized description for the succession of Lower Paleozoic carbonates. In this area, the succession consists of a thin upper cherty limestone and dolomite unit, which caps a thicker section of light-coloured, medium to coarsely crystalline dolomite, grey-coloured microcrystalline dolomite and interbedded orthoquartzite and shale. This very thick succession of carbonate reaches a maximum thickness of 2,040 m within the basin.
Dem
pste
rH
ighw
ay
66°
140° 138° 137° 136°
66° 30'
139°
67°
66° 30'
66°
67° 30' 67° 30'
67°
65° 30'65° 30'
136°138°139° 137°140°
Eagle Plain
0 50
km
Area of Potential
Laramide Anticlines
Discoveries
BouvetteCarbonate-Shale
Line
Rivers
NorthHopeN-53
T A I G A R A N G E S
KEELE R
ANGE
Chance
Birch
Blackie
N W T
Y u k o nRIC
HA
RD
SO
N M
OU
NT
AIN
S
NA
HO
NI R
AN
GE
Eagle
Arch
POTENTIAL RESOURCES BOUVETTE STRATIGRAPHIC

PETROLEUM RESOURCE ASSESSMENT OF THE EAGLE PLAIN, YUKON TERRITORY, CANADA 61
N-53
Porous Carbonate
Tight
Road River Shale
North Hope
Tight Gas
Gas
Water
Water
Bouvette Formation
Porous CarbonateTight
Discovered resources
The North Hope N-53 well, drilled in 1970, recovered gas-cut mud and gas-cut water cut mud from Bouvette carbonate. No other shows have been reported from this zone.
Potential resources
The area of potential resources is limited to a region south of the carbonate-shale facies change on the northeast side of the basin. This play also extends east of the basin into the Richardson Trough and is also considered to be a gas play, due to the maturation levels in the source rocks.
Reservoir parameters
BOUVETTE STRATIGRAPHIC POTENTIAL RESOURCES
Field Resources Area Net Pay Porosity Hydrocarbon Recovery Initial marketable (ha.) (m) (%) saturation (%) factor (%) gas 106m3 (Bcf)
North Hope gas 0 6 9 60 0 0 (0)

62 PETROLEUM RESOURCE ASSESSMENT OF THE EAGLE PLAIN, YUKON TERRITORY, CANADA
POTENTIAL RESOURCES BOUVETTE STRATIGRAPHIC
Oil depth: 10,000 ft.; gas depth:10,900 ft.; gas pressure: 4,700 psi; gas reservoir temperature: 196°F
0.00 223.92 223.92 37.32
0.00 0.00 167.94 167.94 0.03 28.02 140.90
0.00
Estimate of potential
petroleum resources
Total for play
Solution gas (Bcf)
Non associated gas (Bcf)
Total gas (BcF)
Liquids(MMb)
Barrels ofoilequivalent (MMBOE)
Marketable gas (Bcf)
1.5000 2.5000 3.0000 2.333
0.340 0.340 0.340 0.340
1.160 2.160 2.660 1.993
0.020 0.100 0.250 0.123
0.100 0.300 0.500 0.300
0.074
0.030 0.090 0.150 0.090
0.550 0.600 0.700 0.617
0.100 0.200 0.300 0.200
0.650 0.750 0.850 0.750
5.0 20.0 100.0 41.7
0.020 0.100 0.200 0.107
0.000 0.000 0.000 0.000
0.000
0.008
0.950 1.000 1.050 1.000
1.542 1.570 1.599 1.570
0.882 0.900 0.918 0.900
0.283
274.2
54.8
683.1
512.3
429.8
0.1 0.2 0.2 0.2
0.0 0.0 0.0 0.000
0.070 0.111 0.150 0.110
6.000
0.050
0.839
In place
Recoverable
Sulphur (MMlt)
Oil (MMb)
Total play area (MM acres)
Tested play area (MM acres)
Untested play area (MM acres)
Fraction of total play area in trap
Fraction of untested play area filled (areally)
Potential hydrocarbon area (MM acres)
Porosity
Hydrocarbon saturation
Oil recovery factor
Gas recovery factor
Average net pay (ft.)
Probability of hydrocarbons
Fraction of pore volume oil bearing
Potential oil area (MM acres)
Potential gas area (MM acres)
Gas oil ratio (GOR) (MMcf/bbls)
Formation volume factor (FVF)
Gas compressibility factor ‘Z’
Gas volume factor (GVF)
Oil in place (bbls/acre-foot)
Oil recovery (bbls/acre-foot)
Gas in place (MMcf/acre-foot)
Raw gas recovery (MMcf/acre-foot)
Marketable gas recovery (MMcf/acre-foot)
Liquid yield (bbls/MMcf)
H2S content
CO2 content
Gas to BOE conversion factor (MMcf/BOE)
Surface loss (fuel gas, etc.)
Marketable gas (fraction of raw)
Minimum Most likely Maximum Mean

PETROLEUM RESOURCE ASSESSMENT OF THE EAGLE PLAIN, YUKON TERRITORY, CANADA 63
0 1 0 0 2 0 0 3 0 0 4 0 0 5 0 0 6 0 0 7 0 0 8 0 0 9 0 00 %
1 0 %
2 0 %
3 0 %
4 0 %
5 0 %
6 0 %
7 0 %
8 0 %
9 0 %
1 0 0 %Probabil i ty > %
Marketable gas (Bcf)
Mean = 137.5 Bcf @ 34.6% Probabil i ty
BOUVETTE STRATIGRAPHIC POTENTIAL RESOURCES
Percentile values100%.........................0 95%.......................19 90%.......................33 85%.......................39 80%.......................48 75%.......................54 70%.......................62 65%.......................68 60%.......................77 55%.......................86 50%.......................92 45%.....................103 40%.....................119 35%.....................135 30%.....................158 25%.....................184 20%.....................210 15%.....................236 10%.....................295 5%.....................385 0%.....................837

64 PETROLEUM RESOURCE ASSESSMENT OF THE EAGLE PLAIN, YUKON TERRITORY, CANADA
DISCUSSION OF RESULTSThe probability charts for the Eagle Plain study area, showing the total potential marketable gas and the total undiscovered recoverable oil, are on the following pages; values are listed in Table 3. For gas, the range is from 9.0 billion m3 (316 Bcf) at 95% probability to 63.6 billion m3 (2.24 Tcf) at 5% probability with a mean of 28.5 billion m3 (1.01 Tcf) at a probability of 45%. For oil, the range is from 1.11 million m3 (7 MMBbls) at 95% probability to 11.13 million m3 (70 MMBbls) at 5% probability, with a mean of 4.5 million m3 (28.2 MMBbls) at 45% probability. In addition, the program generates values for by-products. At the mean gas value, there are estimated to be 2.4 million m3 (14.9 MMBbls) of natural gas liquids.
On a play basis, the Upper Carboniferous Hart River Formation members, the Chance Member sandstone and Canoe River Member limestone contain the vast majority of the oil potential with over 99% at the mean estimate. For gas, the distribution is more diverse. In total, carbonate reservoirs are expected to contain over 55% of the gas. The Devonian carbonates, namely the Ogilvie limestone and dolomite, are expected to contain about 36% of the total gas, with the older Bouvette Formation carbonate containing an additional 14% and the Canoe River Member an additional 6%. For clastic reservoirs, the distribution is: 23% of the total gas in the Chance Sandstone, 8% of the total in the Tuttle Formation and 10% of the total in the Cretaceous Sandstone.
DISCUSSION OF RESULTS
Recoverable Oil Marketable Gas Liquid By-Products MMbbls Bcf MMbblsAge Play Name Mean Std. Dev. Mean Std. Dev. Mean Std. Dev.Late Cretaceous Fishing Branch Sandstone 0.00 0.00 54.28 30.64 0.30 0.17
Permian Jungle Creek Sandstone 0.12 0.08 30.01 15.00 0.02 0.00
Carboniferous Ettrain Carbonate 0.00 0.00 18.05 14.65 0.15 0.13
Carboniferous Chance Sandstone Structural 1.29 0.73 90.82 37.57 1.93 0.82
Carboniferous Chance Sandstone Unconformity 13.38 8.56 79.63 39.10 2.86 1.43
Carboniferous Chance Sandstone Stratigraphic 12.37 7.07 56.16 28.81 1.53 0.81
Carboniferous Canoe River Member Limestone 1.02 0.97 55.75 47.17 2.21 1.92
Carboniferous Tuttle Formation 0.00 0.00 75.73 57.34 1.29 0.91
Devonian Ogilvie Carbonate 0.00 0.00 262.87 184.30 3.14 2.30
Devonian Ogilvie Structural 0.00 0.00 98.74 84.57 1.17 0.99
Cretaceous Triangle Zone Structural 0.00 0.00 46.51 33.61 0.26 0.19
Ordovician Bouvette Stratigraphic 0.00 0.00 137.50 129.22 0.03 0.02
Totals 28.17 1006.0 14.90
Total Chance Sandstone 27.04 226.61 6.33
Total Carboniferous 28.06 376.13 9.98
Total Devonian 361.61 4.31
Total Lower Paleozoic 545.62 4.60
Total Cretaceous 100.79 0.56
Table 3. Eagle Plain Potential
Resources

PETROLEUM RESOURCE ASSESSMENT OF THE EAGLE PLAIN, YUKON TERRITORY, CANADA 65
0 5 0 1 0 0 1 5 0 2 0 0 2 5 0 3 0 00
1 0
2 0
3 0
4 0
5 0
6 0
7 0
8 0
9 0
1 0 0Probabil i ty > %
Recoverable oil (MMbbls)
Mean = 28.2 MMbbls @ 44.9% Probabil i ty
0 1 0 0 0 2 0 0 0 3 0 0 0 4 0 0 0 5 0 0 0 6 0 0 0 7 0 0 0 8 0 0 00 %
1 0 %
2 0 %
3 0 %
4 0 %
5 0 %
6 0 %
7 0 %
8 0 %
9 0 %
1 0 0 %Probabil i ty > %
Marketable gas (Bcf)
Mean =1005.7 Bcf @ 44.9% Probabil i ty
DISCUSSION OF RESULTS
Percentile values100%.........................0 95%.....................316 90%.....................392 85%.....................454 80%.....................510 75%.....................563 70%.....................616 65%.....................669 60%.....................724 55%.....................781 50%.....................842 45%.....................908 40%.....................979 35%..................1,059 30%..................1,151 25%..................1,259 20%..................1,390 15%..................1,562 10%..................1,808 5%..................2,245 0%..................7,330
Percentile values100%.........................0 95%.........................7 90%.........................9 85%.......................11 80%.......................12 75%.......................14 70%.......................15 65%.......................17 60%.......................18 55%.......................20 50%.......................22 45%.......................24 40%.......................26 35%.......................29 30%.......................32 25%.......................35 20%.......................40 15%.......................46 10%.......................54 5%.......................70 0%.....................298
66 PETROLEUM RESOURCE ASSESSMENT OF THE EAGLE PLAIN, YUKON TERRITORY, CANADA
REFERENCESArctic Islands Offshore Group (now Suncor), 1968, Geological Evaluation: Peel River Area, Yukon
Territory, National Energy Board Report No. 054-03-02-00044
Arctic Islands Offshore Group, 1969, Geological Field Work: Bonnet Plume Basin, Yukon Territory, National Energy Board Report No. 054-01-02-00004
Amerada Hess Corporation, 1957, Geological Report: Eagle Plains, Yukon Territory, National Energy Board Report No. 001-01-02-00001
Amerada Hess Corporation, 1958, Geological Report: Peel Plateau, National Energy Board Report No. 001-01-02-00004
Amerada Hess Corporation, 1959, Geological Report: Eagle Plains-Richardson Mountains, National Energy Board Report No. 001-01-02-00013
Amerada Hess Corporation, 1959, Palentological Interpretation-Bear Anticline, Yukon Territory and Northwest Territories, National Energy Board Report No. 001-01-02-00012
Amerada Hess Corporation, 1959, Geological Report: Seminole Anticline,Yukon Territory, National Energy Board Report No. 001-01-02-00005
Amerada Hess Corporation, 1959, Geological Report: Mackenzie & Richardson Mountains, National Energy Board Report No. 001-01-02-00010
Amerada Hess Corporation, 1959, Geological Report: Bell River Area, Yukon Territory, National Energy Board Report No. 001-01-02-00009
Amerada Hess Corporation, 1960, Geophysical Report: Operations, National Energy Board Report No. 001-06-02-00019
Amerada Hess Corporation, 1960, Geological Report: Porcupine Basin Area, National Energy Board Report No. 001-01-02-00015
Amerada Hess Corporation, 1960, Geophysical Report: Hart River, Sid Lake and Bell Basin, National Energy Board Report No. 001-06-02-00020
Amerada Hess Corporation, 1960, Seismic Survey Report: Bell Area, National Energy Board Report No. 001-06-02-00029
Amerada Hess Corporation, 1960, Areal Geology of Eagle Plains Area, National Energy Board Report No. 001-02-02-00008
Amoco Canada Petroleum Company, 1959, Geology: Eagle Plain-Richardson Mountains, Northwest Territories, National Energy Board Report No. 060-01-02-00021
Amoco Canada Petroleum Company, 1959, Geology Report: Peel River Area, Yukon Territory, National Energy Board Report No. 060-01-02-00122
Amoco Canada Petroleum Company, 1960, Photogeological Report: Eagle Plain Area, Yukon Territory, National Energy Board Report No. 060-02-02-00007
Amoco Canada Petroleum Company, 1960, Photogeology: Porcupine Area, Yukon Territory, National Energy Board Report No. 060-02-02-00011
Amoco Canada Petroleum Company, 1960, Geology: Old Crow Area, Yukon Territory, National Energy Board Report No. 060-01-02-00009
Amoco Canada Petroleum Company, 1960, Geology: Porcupine Plateau Area, Northwest Territories, National Energy Board Report No. 060-01-02-00103
Amoco Canada Petroleum Company, 1971, Photogeology: Taiga Valley & Adjacent Areas, Yukon and Northwest Territories, National Energy Board Report No. 060-02-02-00135
Amoco Canada Petroleum Company, 1972, Mississippian Reconnaissance, Snake River, Yukon Territory, National Energy Board Report No. 060-01-02-00142
REFERENCES

PETROLEUM RESOURCE ASSESSMENT OF THE EAGLE PLAIN, YUKON TERRITORY, CANADA 67
Amoco Canada Petroleum Company, 1974, Geology of Dawson Range, Yukon Territory, National Energy Board Report No. 060-01-02-00147
Amoco Canada Petroleum Company, 1974, Geology: Bonnet Plume-South Richardson Mountains, Northwest Territories, National Energy Board Report No. 060-01-02-00146
Aquitance Company of Canada (now Husky), 1973, Surface Geology of Southeast Eagle Plain, Yukon Territory, National Energy Board Report No. 673-01-02-00067
Aquitane Company of Canada, 1974, Geology of Hungary Lake Area, Yukon Territory, National Energy Board Report No. 673-01-02-00066
Aquitance Company of Canada, 1974, Seismic Reflection & Gravity Survey-Eagle Plains Area, Yukon Territory, National Energy Board Report No. 673-06-02-00072
Bamber, E.W. and Waterhouse, J.B., 1971, Carboniferous and Permian Stratigraphy and Paleontology, Northern Yukon Territory, Canada. Bulletin of Canadian Petroleum Geology, Vol. 19
Bamber, E.W. and Waterhouse, J.W., 1973, Descriptions of Carboniferous and Permian Stratigraphic Sections, Northern Yukon Territory and Northwestern District of Mackenzie. Geological Survey of Canada Paper 72-19
Bullock, D.B., 1960, Geologic Report on Part of Ogilvie & Richardson Mountains. Amerada Petroleum Corporation, Report to Minister, Department of Indian & Northern Development, open file
Bullock, D.B., 1970, Surface Geology of Wernecke Mountains, Northwest Territories, National Energy Board Report No. 510-01-02-00001
Canada Trust Company, 1969, Geological Field Work: Western Peel Plateau, Yukon and Northwest Territories, National Energy Board Report No. 682-01-02-00006
Canadian Reserve Oil & Gas, 1970, Structural & Stratigraphic Report-Porcupine River-Franklin Mountains, National Energy Board Report No. 750-01-02-00007
Candel Oil Ltd., 1972, Seismic Survey Eagle Plains, Yukon Territory, National Energy Board Report No. 821-06-02-00014
Cecile, M.P., 1982, The Lower Paleozoic Misty Creek Embayment, Selwyn Basin, Yukon and Northwest Territories. Geological Survey of Canada Bulletin 335
Cecile, M.P., 1986, Lower Paleozoic Embayments, Troughs and Arches, Northern Canadian Cordillera. (Abstract) in Geological Survey of Canada Forum, Activities on Oil and Gas in Canada, Calgary
Chernoff, M.N., 1963, Results of Geological Investigations, Porcupine River Eagle Plains Area. California Standard Company, Report to Minister, Department of Indian Affairs and Northern Development, open file
Chevron Canada Ltd., 1958, Geological Report: Hungary Lake, Northwest Territories, National Energy Board Report No. 045-01-02-00010
Chevron Canada Ltd., 1958, Geological Report: Trevor Mountains, Northwest Territories, National Energy Board Report No. 045-01-02-00011
Chevron Canada Ltd., 1959, Geological Report: East Porcupine Block, Northwest Territories, National Energy Board Report No. 045-01-02-00012
Chevron Canada Ltd., 1959, Seismic Survey: Beaver Crow & Blackstone, Yukon and Northwest Territories, National Energy Board Report No. 045-06-02-00036
Chevron Canada Ltd., 1959, Geology of East Porcupine Block, Northwest Territories, National Energy Board Report No. 045-01-02-00019
Chevron Canada Ltd., 1959, Geology of East Porcupine Block, Yukon and Northwest Territories, National Energy Board Report No. 045-01-02-00022
REFERENCES

68 PETROLEUM RESOURCE ASSESSMENT OF THE EAGLE PLAIN, YUKON TERRITORY, CANADA
Chevron Canada Ltd., 1959, Geology of West Porcupine Block, West Ogilvie Mountains Northwest Territories, National Energy Board Report No. 045-01-02-00017
Chevron Canada Ltd., 1959, Geological Report: West Ogilvie Mountains, Northwest Territories, National Energy Board Report No. 045-01-02-00016
Chevron Canada Ltd., 1959, Geology Report: Blackstone River, Yukon Territory, National Energy Board Report No. 045-01-02-00015
Chevron Canada Ltd., 1959, Geology of Hungary Lake Block, Northwest Territories, National Energy Board Report No. 045-01-02-00018
Chevron Canada Ltd., 1960, Geology of Hungary Lake Block, Group 46, Northwest Territories, National Energy Board Report No. 045-01-02-00030
Chevron Canada Ltd., 1961, Geology of Redstone River Area, Northwest Territories, National Energy Board Report No. 045-01-02-00032
Chevron Canada Ltd., 1961, Seismic Survey: North Mammoth, Blackstone, & Honeymoon Areas, National Energy Board Report No. 045-06-02-00037
Chevron Canada Ltd., 1962, Results of Geological Investigations, Group 46, Northwest Territories, National Energy Board Report No. 045-01-02-00026
Chevron Canada Ltd., 1962, Results of Geological Investigations, Group 46, Northwest Territories, National Energy Board Report No. 045-01-02-00025/52
Chevron Canada Ltd., 1962, Geology of West Porcupine Area, Northwest Territories, National Energy Board Report No. 045-01-02-00028
Chevron Canada Ltd., 1964, Exploration Summary Blackstone River, National Energy Board Report No. 045-01-02-00031
Chevron Canada Ltd., 1965, Gravity Survey, Hungary Lake, National Energy Board Report No. 045-08-02-00061
Chevron Canada Ltd., 1965, Geology of the Bell Basin and Wind River Areas, Northwest Territories, National Energy Board Report No. 045-01-02-00046
Chevron Canada Ltd., 1965, Seismic Survey: Hungary Lake, Northwest Territories, National Energy Board Report No. 045-06-02-00057
Chevron Canada Ltd., 1965, Gravity Survey: Vittrekwa River, Northwest Territories, National Energy Board Report No. 045-08-02-00062
Chevron Canada Ltd., 1966, Progress Report: Vittrekwa River Area, Northwest Territories, National Energy Board Report No. 045-01-02-00051
Chevron Canada Ltd., 1966, Geology of the White Mountains Area, Yukon & Northwest Territories, National Energy Board Report No. 045-01-0-00050
Chevron Canada Ltd., 1969, Final Report: Geology of Road River Formation, National Energy Board Report No. 045-01-02-00143
Chevron Canada Ltd., 1970, Geology: Ogilvie-Mt. Burgess, West Ogilvie Mountains, Yukon Territory, National Energy Board Report No. 045-01-02-00092
Chevron Canada Ltd., 1971, Seismic Survey: Eagle Plains 1970-71-72, Northwest Territories, National Energy Board Report No. 045-06-02-00112
Chevron Canada Ltd., 1971, Geology: Eagle Plains, Yukon Territory, National Energy Board Report No. 045-01-02-00113
Chevron Canada Ltd., 1972, Geology: Eagle Plains Area, Yukon Territory, National Energy Board Report No. 045-01-02-00109
Clarcan Petroleum Corporation, 1971, Geophysical Program, Alder Anticline, Yukon Territory, National Energy Board Report No. 839-06-02-00001
REFERENCES

PETROLEUM RESOURCE ASSESSMENT OF THE EAGLE PLAIN, YUKON TERRITORY, CANADA 69
Dixon, J., 1992, Stratigraphy of Mesozoic Strata, Eagle Plain Area, Northern Yukon. Geological Survey of Canada, Bulletin 408
Eagle Plateau Syndicate, 1958, Geology of Eagle Plains, Yukon Territory, National Energy Board Report No. 527-01-02-00001
Energy, Mines and Resources Canada, 1977, Oil and Natural Gas Resources of Canada 1976, Report EP77-1
Esso Resources Canada (now Imperial Oil), 1961, Stratigraphy, Richardson Mountains Area, Northwest Territories, National Energy Board Report No. 007-01-02-00026
Esso Resources Canada, 1963, Ogilvie Mountains-Eagle Plains Area, National Energy Board Report No. 007-01-02-00046
Esso Resources Canada, 1969, Stratigraphic Party Activities, South Eagle Plains, National Energy Board Report No. 007-01-02-00088
Esso Resources Canada, 1972, Reflection Seismic Interpretation, Eagle Plains, National Energy Board Report No. 007-06-02-00168
Forward Resources Ltd., 1985, Reflection Seismic Survey, Eagle Plains, Yukon Territory, National Energy Board Report No. 9129-F009-1E
Gabrielse, H. & Yorath, C.J., 1992, Geology of the Cordilleran Orogen in Canada. Geology of Canada, No. 4. Geological Society of America, Decade of North American Geology Project Vol. G-2
Geophoto Services Ltd., 1963, Photogeologic Sheets & Maps-East Eagle Basin, National Energy Board Report No. 705-02-02-00007
Geophoto Services Ltd., 1963, Photogeological Evaluation-Peel Basin, Yukon & Northwest Territories, National Energy Board Report No. 705-02-02-00002
Geophoto Services Ltd., 1963, Photogeological Evaluation-Ogilvie Mountains, National Energy Board Report No. 705-02-02-00005
Geophoto Services Ltd., 1963, Photogrammetric Structural Evaluation-Eagle Plains, National Energy Board Report No. 705-03-02-00002
Golden Eagle Oil & Gas Ltd., 1971, Geology of Hart & Blackstone Rivers Areas, Yukon Territory, National Energy Board Report No. 339-01-02-00003
Graham, A.D., 1973, Carboniferous and Permian Stratigraphy, Southern Eagle Plain, Yukon Territory, Canada. in Aitken, J.D. & Glass, D.J. (Eds.), Symposium on Geology of the Canadian Arctic. Calgary, Geological Association of Canada and Canadian Society of Petroleum Geologists
Graham, A.D. & McCormack, W.J., 1975, The Chance Sandstone Member: A Carboniferous Delta Complex, Southern Eagle Plain, Yukon Territory, Canada. Paper presented to Joint Canadian Society of Petroleum Geologists-Canadian Society of Exploration Geophysists Convention, Calgary.
Guaranty Trust Company of Canada, 1957, Geology of Eagle Plains, Yukon Territory, National Energy Board Report No. 538-01-02-00001
Guaranty Trust Company of Canada, 1957, Geology of Eagle Plains, Yukon Territory, National Energy Board Report No. 538-01-02-00002
Guaranty Trust Company of Canada, 1957, Geology of Eagle Plains, Yukon Territory, National Energy Board Report No. 538-01-02-00003
Guaranty Trust Company of Canada, 1960, Progress Report : Geology of the Richardson Mountains, Northwest Territories, National Energy Board Report No. 538-01-02-00005
Gulf Canada Ltd., 1957, Surface Exploration, National Energy Board Report No. 002-01-02-00010
Gulf Canada Ltd., 1969, Seismic Survey, Peel River, Yukon Territory, National Energy Board Report No. 002-06-02-00042
REFERENCES

70 PETROLEUM RESOURCE ASSESSMENT OF THE EAGLE PLAIN, YUKON TERRITORY, CANADA
REFERENCES
Gulf Canada Ltd., 1974, Seismic Report, Satah River, Yukon & Northwest Territories, National Energy Board Report No. 002-06-02-00097
Hamblin, A.P., 1990, Upper Paleozoic Petroleum Geology and Potential, Southern Eagle Plain, Yukon Territory. Geological Survey of Canada Open File Report 2286
Hills, L.V., Sangster, E.V., & Suneby, L.B., Editors, 1981, Lexicon of Canadian Stratigraphy, Volume 2, Yukon-Mackenzie, Canadian Society of Petroleum Geologists
Hudson’s Bay Oil & Gas Company Limited (now Amoco), 1959, Geology of Porcupine-Eagle Plain & Driftwood River, Yukon Territory, National Energy Board Report No. 038-01-02-00032
Hudson’s Bay Oil & Gas Company Limited, 1959, Geology of Driftwood River Basin, Yukon Territory, National Energy Board Report No. 038-01-02-00028
Hudson’s Bay Oil & Gas Company Limited, 1960, Areal Geology & Interpretation, Porcupine Plain, Yukon & Northwest Territories, National Energy Board Report No. 038-01-02-00031
Hover, F.B., 1961, Geological Report on the Porcupine Basin & Surrounding Area, Yukon & Northwest Territories. Hudson’s Bay Oil & Gas Company Ltd., Amerada Petroleum Corporation, & Ohio Oil Company, Report to the Minister, Department of Northern Affairs & Natural Resources
Hunt Oil Company, 1960, Geology: Hungary Lake, Yukon Territory, National Energy Board Report No. 331-01-02-00004
Hunt Oil Company, 1960, Geology: Ogilvie Mountains-Southeast Porcupine, Yukon & Northwest Territories, National Energy Board Report No. 331-01-02-00005
Hunt Oil Company, 1960, Photogeology of Ogilvie Mountains, Porcupine, Northwest Territories, National Energy Board Report No. 331-02-02-00003
Husky Oils Ltd., 1958, Photogeological Evaluation of Peel Plateau Area, Northwest Territories, National Energy Board Report No. 086-02-02-00020
Husky Oils Ltd., 1958, Geology of Porcupine Plain Group-Eagle Plain, Yukon Territory, National Energy Board Report No. 086-01-02-00004
Husky Oils Ltd., 1958, Photogeology Ogilvie Basin Area Yukon Territory, National Energy Board Report No. 086-02-02-00003
Husky Oils Ltd., 1958, Geology Porcupine Plain Group-Eagle Area Yukon & Northwest Territories, National Energy Board Report No. 086-01-02-00001
Husky Oils Ltd., 1958, Geology North & South Ogilvie Groups-Ogilvie River Area, Yukon Territory, National Energy Board Report No. 086-01-02-00005
Husky Oils Ltd., 1958, Summary of Geology of Porcupine-Peel-Ogilvie Areas, Northwest Territories, National Energy Board Report No. 086-01-02-00006
Inexco Oil Company (now International Nuclear Corporation), 1969, Geological Data, Field Party, 1969-70, Kandik, Yukon Territory, National Energy Board Report No. 699-01-02-00009
Inexco Oil Company, 1969, Stratigraphic Maps, Mackenzie Basin, Yukon & Northwest Territories, National Energy Board Report No. 699-01-02-00012
Inexco Oil Company, 1969, Structural Evaluation, Kandik Basin, Yukon Territory, National Energy Board Report No. 699-01-02-00006
Inexco Oil Company, 1970, Surface Geology of Kandik Area, Yukon Territory, National Energy Board Report No. 699-01-02-00007
Inexco Oil Company, 1971, Operations Report on Seismic Survey, Kandik Area Yukon Territory, National Energy Board Report No. 699-06-02-00011
Inexco Oil Company, 1972, Seismic Report on Kandik Area, Yukon Territory, National Energy Board Report No. 699-06-02-00005

PETROLEUM RESOURCE ASSESSMENT OF THE EAGLE PLAIN, YUKON TERRITORY, CANADA 71
REFERENCES
Inexco Oil Company, 1972, Structural Geology of Kandik Area, Yukon Territory, National Energy Board Report No. 699-01-02-00008
Island Prince Copper, 1957, Geology of Permit 1435, Porcupine Plains, National Energy Board Report No. 545-01-02-00001
Jeletky, J.A., 1962, Pre-Cretaceous Richardson Mountain Trough: Its Place in the Tectonic Framework of Arctic Canada and its Bearing on Some Geosynclinal Concepts. Royal Society of Canada Transactions, Vol. LVI, Series III
Leska, F., 1957, Geology of Porcupine/Old Crow, National Energy Board Report No. 557-01-02-00001
Link, C.M. & Bustin, 1989, Organic Maturation and Thermal History of Phanerozoic Strata in Northern Yukon And Northwestern District of Mackenzie. Bulletin of Canadian Petroleum Geology, Vol. 37 No. 3
Link, C.M. & Bustin, 1989, Petroleum Source Rock Potential and Depositional Setting of Phanerozoic Strata in Northern Yukon and Northwestern District of Mackenzie. Bulletin of Canadian Petroleum Geology, Vol. 37 No. 3
MacDonald, J.S. & Mangus, M.D., 1960, Geological Report of the Richardson Mountains-Knorr Range Area. Atlantic Refining Company, Report to the Minister, Department of Indian Affairs and Northern Development, Open File
Martin, H.L., 1972, Upper Paleozoic Stratigraphy of the Eagle Plains Basin, Yukon Territory. Geological Survey of Canada, Paper 71-14
Martin, H.L., 1973, Eagle Plain, Yukon Territory. In McCrossan, R.G. (Ed.), The Future Petroleum Provinces of Canada. Canadian Society of Petroleum Geologists, Memoir I
Martin, L.J., 1959, Stratigraphy and Depositional Tectonics of North Yukon-Lower Mackenzie Area, Canada. Bulletin of American Association of Petroleum Geologists, Vol. 43, No. 10
Miall, A.D., 1973, Regional Geology of Northern Yukon. Bulletin of Canadian Petroleum Geology, Vol. 21, No. 10
Mobil Oil Canada Ltd., 1961, Geology of Eagle Plain, Yukon Territory, National Energy Board Report No. 057-01-02-00025
Mobil Oil Canada Ltd., 1963, Geology: Eagle Plain, Yukon Territory, National Energy Board Report No. 057-01-02-00030
Mobil Oil Canada Ltd., 1963, Seismic Exploration, Eagle Plain Area, Yukon Territory, National Energy Board Report No. 057-06-02-00033
Mobil Oil Canada Ltd., 1964, Seismic Exploration, Eagle Plain, Yukon Territory, National Energy Board Report No. 057-06-02-00032
Mobil Oil Canada Ltd., 1964, Blackie No. 1: Velocity Log and Geophone, National Energy Board Report No. 057-11-02-00034
Moorhouse, M.D., 1966, Eagle Plain of Yukon Territory. (Abs.) Bulletin of American Association of Petroleum Geologists, Vol. 50 No. 3
Morrow, D.W., 1999. Lower Paleozoic Stratigraphy of Northern Yukon Territory and Northwestern District of Mackenzie. Geological Survey of Canada Bulletin 538.
Nelson, S.J. & Johnson, C.E., 1968, Permo-Pennsylvanian Brachythyrid and Horridonid Brachipods from the Yukon Teritory, Canada. Journal of Paleontology, Vol. 42 No. 3
National Energy Board, 1993, Probabilistic Estimates of Hydrocarbon Volumes In Northern Canadian Frontier Discoveries, National Energy Board News Release No. 93/46
National Energy Board, 1994, Natural Gas Resource Assessment, Northeast British Columbia, National Energy Board Working Document

72 PETROLEUM RESOURCE ASSESSMENT OF THE EAGLE PLAIN, YUKON TERRITORY, CANADA
REFERENCES
Norford, B.S. et al, 1970, Biostratigraphic Determinations of Fossils from the Subsurface of the Yukon Territory and the Districts of Mackenzie and Franklin. Geological Survey of Canada, Paper 70-15
Norford, B.S. et al, 1971, Biostratigraphic Determinations of Fossils from the Subsurface of the Yukon Territory and the Districts of Mackenzie and Franklin. Geological Survey of Canada, Paper 71-15
Norris, A.W., 1985, Stratigraphy of Devonian Outcrop Belts in Northern Yukon Territory and Northwestern District of Mackenzie (Operation Porcupine Area). Geological Survey of Canada, Memoir 410
Norris, D.K., 1981a, Porcupine River, Yukon Territory. Geological Survey of Canada, Map 1522A, scale 1:250,000
Norris, D.K., 1981b, Eagle River, Yukon Territory. Geological Survey of Canada, Map 1523A, scale 1:250,000
Norris, D.K., 1982a, Ogilvie River, Yukon Territory. Geological Survey of Canada, Map 1526A, scale 1:250,000
Norris, D.K., 1982b, Hart River, Yukon Territory. Geological Survey of Canada, Map 1527A, scale 1:250,000
Norris, D.K., 1984, Geology of the Northern Yukon and Northwestern District of Mackenzie. Geological Survey of Canada, Map 1581A, scale 1:500,000
Northern Oil Explorers, 1970, Seismic & Gravity Survey, Old Crow, Yukon Territory, National Energy Board Report No. 695-06-02-00009
Paskevich, S.W., 1972, Geology: Eagle Plains, Yukon Territory, National Energy Board Report No. 537-01-02-00001
Peel Plateau Exploration, 1953, Geological Maps: Eagle Plains, Northwest Territories, National Energy Board Report No. 579-01-02-00001
Peel Plateau Exploration, 1953, Geology-Yukon & Northwest Territories, National Energy Board Report No. 579-01-02-00002
Peel Plateau Exploration, 1955, Preliminary Geophysical Work, Eagle Plains, Northwest Territories, National Energy Board Report No. 579-06-02-00003
Peel Plateau Exploration, 1955, Seismic Interim Report-Eagle Plains, Yukon & NorthwestTerritories, National Energy Board Report No. 579-06-02-00005
Peel Plateau Exploration, 1956, Geological & Seismic Evaluation Maps-Eagle Plains, National Energy Board Report No. 579-01-02-00004
Peel Plateau Exploration, 1956, Gravity & Magnetic Survey, Eagle Plains, Yukon & Northwest Territories, National Energy Board Report No. 579-08-02-00006
Peel Plateau Exploration, 1956, Continuous Velocity Log, Eagle Plains No. 1, National Energy Board Report No. 579-06-02-00014
Peel Plateau Exploration, 1958, Seismic Survey: Eagle Plains SE/4, Yukon & Northwest Territories, National Energy Board Report No. 579-06-02-00008
Peel Plateau Exploration, 1958, Aerial Gravity Survey: Peel River, Yukon & Northwest Territories, National Energy Board Report No. 579-08-02-0007
Peel Plateau Exploration, 1958, Geological Report on Chance No. 1 Location, National Energy Board Report No. 579-01-02-00009
Peel Plateau Exploration, 1958, Geology of Eagle Plains-Caribou Anticline, Yukon & Northwest Territories, National Energy Board Report No. 579-01-02-00013
Petcan Resources Ltd., 1957, Geology of Eagle Plains Area, Northwest Territories, National Energy Board Report No. 100-01-02-00003

PETROLEUM RESOURCE ASSESSMENT OF THE EAGLE PLAIN, YUKON TERRITORY, CANADA 73
REFERENCES
Petro-Canada, 1971, Geology of Eagle Plains Area, Northwest Territories, National Energy Board Report No. 246-01-02-00055
Petro-Canada, 1976, Geology of Mackenzie-Richardson-Ogilvie Mountains, Northwest Territories, National Energy Board Report No. 246-01-02-00076
Petrofina Canada Inc. (now Petro-Canada), 1971, Gravity Survey of Eagle Plains, Northwest Territories, National Energy Board Report No. 690-08-02-00008
Petrofina Canada Inc., 1973, Reflection Seismic Survey of Moose Lake, Yukon Territory, National Energy Board Report No. 690-06-02-00010
Pugh, D.C., 1983, Pre-Mesozoic Geology in the Subsurface of Peel River Map Area, Yukon Territory and District of Mackenzie. Geological Survey of Canada, Memoir 401
Ranger Oil (Canada) Ltd., 1967, Geological Report of Northern Yukon & Northwest Territories, National Energy Board Report No. 035-01-02-00001
Regal Petroleum Corporation, 1972, Geology, Oil & Gas Prospects North Ogilvie Mountains Yukon Territory, National Energy Board Report No. 612-01-02-00001
Reinson, G.E. et al, 1993, Devonian Gas Resources of Western Canada Sedimentary Basin, Geological Survey of Canada Bulletin 452
Resource Territorial Mining & Development Association Ltd., 1960, Geology of Hungary Lake-Palmer Lake Areas, Northwest Territories, National Energy Board Report No. 591-01-02-00002
Shell Canada Ltd., 1962, Report On Surface Mapping, Delta Area, Yukon Territory, National Energy Board Report No. 037-01-02-00039
Shulman, I., 1958, Geology: Porcupine Plain-Old Crow Areas, Northwest Territories, National Energy Board Report No. 599-01-02-00004
Simpson, W.E., 1957, Geology: Permit No. 1408, Old Crow, Yukon Territory, National Energy Board Report No. 600-01-02-00001
Skelly Oil Company, 1971, Seismic Survey of Johnson Creek, Yukon & Northwest Territories, National Energy Board Report No. 805-06-02-00003
Spres Exploration, 1958, Geology of Porcupine River Area, Eagle Plain, Northwest Territories, National Energy Board Report No. 603-01-02-00001/2
Sproule, J.C. & Associates, 1959, Geological Reconnaissance Report, Scurry-Rainbow Oil Ltd. P&NG Holdings Lower Mackenzie Basin Area, Northwest Territories, Report to Minister, Department of Northern Affairs-Natural Resources, open file
Texaco Canada Inc. (now Imperial Oil), 1958, Geological Reconnaissance-Peel Plateau & Porcupine Plateau, National Energy Board Report No. 017-01-02-00004
Texaco Canada Inc., 1969, Geological Reconnaissance of Porcupine Basin, Yukon Territory, National Energy Board Report No. 017-01-02-00034
TransOcean Oil Canada Ltd., 1968, Reflection Seismic Survey, Taylor Lake, National Energy Board Report No. 632-06-02-00011
TransOcean Oil Canada Ltd., 1970, Geological Reconnaissance Survey, Yukon Territory, National Energy Board Report No. 632-02-02-00015
TransOcean Oil Canada Ltd., 1971, Geology of Ogilvie Basin, Yukon Territory, National Energy Board Report No. 632-01-02-00010
Troy Oils Ltd., 1972, Geological Investigations-Porcupine River, Yukon Territory, National Energy Board Report No. 772-01-02-00002
Ulster Petroleums Ltd., 1969, Geology of South Eagle Plain-Noisy Creek Area, Yukon Territory, National Energy Board Report No. 775-01-02-00002
Ulster Petroleums Ltd., 1969, Geophysical Report on Alder Creek,South Eagle Plain, Yukon Territory, National Energy Board Report No. 775-06-02-00001
74 PETROLEUM RESOURCE ASSESSMENT OF THE EAGLE PLAIN, YUKON TERRITORY, CANADA
REFERENCES
Union Oil Company of Canada, 1960, Preliminary Geological Report on Porcupine Area, Yukon Territory, National Energy Board Report No. 028-01-02-00007
Union Oil Company of Canada, 1962, Summary of Areal Geology-Eagle Plain, Peel Plateau, & Mackenzie Mountains,Yukon Territory, National Energy Board Report No. 028-01-02-00037
Union Oil Company of Canada, 1962, Seismograph Appraisal of Eagle Plains Area, Yukon Territory, National Energy Board Report No. 028-06-02-00060
United Canso Oil & Gas Ltd., 1957, Geology of Eagle Plains Area, Yukon & Northwest Territories, National Energy Board Report No. 352-01-02-00001
United Canso Oil & Gas Ltd., 1957, Geology of Eagle Plains, Northwest Territories, National Energy Board Report No. 352-01-02-00002
Utting, J., 1989, Thermal Maturity of Lower Carboniferous Rocks in Northern Yukon Territory. Geological Survey of Canada Paper 89-1G
Veezay Geodata Ltd., 1970, Geologic Report on the Peel & Porcupine Plateaus-Arctic Coastal Area, District of Mackenzie & Yukon Territory
Veezay Geodata Ltd., 1975, Geologic Report on the Mackenzie-Beaufort Basin Area, Yukon & District of Mackenzie
Veezay Geodata Ltd., 1982, Mackenzie Basin Canada Lands Exploration Program
Webb International Minerals Inc., 1957, Geology & Photogeology Driftwood River Yukon Territory, National Energy Board Report No. 619-01-02-00001
Westcoast Petroleum Ltd. (now Numac), 1971, Seismic & Gravity Survey of Bell River Area,Yukon & Northwest Territories, National Energy Board Report No. 780-06-02-00004
Westcoast Petroleum Ltd., 1972, Seismic Survey of Old Crow, Yukon Territory, National Energy Board Report No. 780-06-02-00006
Westcoast Petroleum Ltd., 1973, Photogeology & Photogrammetry of Eagle Plain, Yukon & Northwest Territories, National Energy Board Report No. 780-02-02-00009
Western Minerals Ltd. (now Chevron), 1953, Geology of South Fort Good Hope, Northwest Territories, National Energy Board Report No. 271-01-02-00016
Western Minerals Ltd., 1958, Geological Evaluations of Eagle Plains Area, Yukon Territory, National Energy Board Report No. 271-03-02-00011
Western Minerals Ltd., 1961, Geology of Eagle Plains & Peel Bloc, Yukon & Northwest Territories, National Energy Board Report No. 271-01-02-00003
Western Minerals Ltd., 1961, Seismic Survey of Eagle Plains Area, Yukon & Northwest Territories, National Energy Board Report No. 271-06-02-00006
Western Minerals Ltd., 1961, Geology of Eagle Plains, Northwest Territories, National Energy Board Report No. 271-01-02-00004
Western Minerals Ltd., 1961, Geology of Eagle Plains, Yukon Territory, National Energy Board Report No. 271-01-02-00008
Western Minerals Ltd., 1961, Geology of Eagle Plains Area, Yukon Territory, National Energy Board Report No. 271-01-02-00002
Western Minerals Ltd., 1962, Seismic Survey of Eagle Plains Area, Northwest Territories, National Energy Board Report No. 271-06-02-00009
Western Minerals Ltd., 1962, Geology of Eagle Plain Area, Yukon Territory, National Energy Board Report No. 271-01-02-00010
Western Minerals Ltd., 1962, Geology on Ogilvie River Area, Northwest Territories, National Energy Board Report No. 271-01-02-00007
Western Minerals Ltd., 1967, Seismic of Eagle Plains Area, Yukon Territory, National Energy Board Report No. 271-06-02-00013
PETROLEUM RESOURCE ASSESSMENT OF THE EAGLE PLAIN BASIN, YUKON TERRITORY, CANADA
Figure 7.

PETROLEUM RESOURCE ASSESSMENT OF THE EAGLE PLAIN BASIN, YUKON TERRITORY, CANADA
Figure 8.

PETROLEUM RESOURCE ASSESSMENT OF THE EAGLE PLAIN BASIN, YUKON TERRITORY, CANADA
Figure 9.
PETROLEUM RESOURCE ASSESSMENT OF THE EAGLE PLAIN BASIN, YUKON TERRITORY, CANADA
Figure 10.