Embed Size (px)
Citation preview
National Center for Education Statistics2013 Mathematics Assessment Report Card: Summary Data Tables for National and State Sample Sizes, Participation Rates, and Proportions of SD and ELL Students Identified
Worksheet name Table title 1 M_G4_State_Sample Size Student sample sizes and target populations in NAEP mathematics at grade 4, by state/jurisdiction:
2013 2 M_G8_State_Sample Size Student sample sizes and target populations in NAEP mathematics at grade 8, by state/jurisdiction:
2013 3 M_G4_State_Participation
Rate School and student participation rates in NAEP mathematics at grade 4, by state/jurisdiction: 2013
4 M_G8_State_ParticipationRate
School and student participation rates in NAEP mathematics at grade 8, by state/jurisdiction: 2013
5 M_G4&8_State_Inclusion_All Inclusion rate and confidence interval in NAEP mathematics for fourth- and eighth-grade public and nonpublic school students, as a percentage of all students, by state/jurisdiction: 2013
6 M_G4&8_State_Inclusion_ Iden
Inclusion rate and standard error (S.E.) in NAEP mathematics for fourth- and eighth-grade public and nonpublic school students with disabilities (SD) and English language learners (ELL), as a percentage of identified SD or ELL students, by state/jurisdiction: 2013
7 M_G4_State_SDELL_All Percentage of fourth-grade public and nonpublic school students with disabilities (SD) and/or English language learners (ELL) identified, excluded, and assessed in NAEP mathematics, as a percentage of all students, by state/jurisdiction: 2013
8 M_G8_State_SDELL_All Percentage of eighth-grade public and nonpublic school students with disabilities (SD) and/or English language learners (ELL) identified, excluded, and assessed in NAEP mathematics, as a percentage of all students, by state/jurisdiction: 2013
9 M_G4_State_SD_All Percentage of fourth-grade public and nonpublic school students with disabilities (SD) identified, excluded, and assessed in NAEP mathematics, as a percentage of all students, by state/jurisdiction: 2013
10 M_G8_State_SD_All Percentage of eighth-grade public and nonpublic school students with disabilities (SD) identified, excluded, and assessed in NAEP mathematics, as a percentage of all students, by state/jurisdiction: 2013
11 M_G4_State_ELL_All Percentage of fourth-grade public and nonpublic school English language learners (ELL) identified, excluded, and assessed in NAEP mathematics, as a percentage of all students, by state/jurisdiction: 2013
12 M_G8_State_ELL_All Percentage of eighth-grade public and nonpublic school English language learners (ELL) identified, excluded, and assessed in NAEP mathematics, as a percentage of all students, by state/jurisdiction: 2013
13 M_G4_State_Iden Percentage of fourth-grade public and nonpublic school students identified as students with disabilities (SD) and/or English language learners (ELL) excluded and assessed in NAEP mathematics, as a percentage of identified SD and/or ELL students, by state/jurisdiction: 2013
14 M_G8_State_Iden Percentage of eighth-grade public and nonpublic school students identified as students with disabilities (SD) and/or English language learners (ELL) excluded and assessed in NAEP mathematics, as a percentage of identified SD and/or ELL students, by state/jurisdiction: 2013
15 M_G4_State_SDELL_Trend Percentage of fourth-grade public and nonpublic school students identified as students with disabilities (SD) and/or English language learners (ELL) excluded in NAEP mathematics, as a percentage of all students, by state/jurisdiction: Various years, 1992–2013
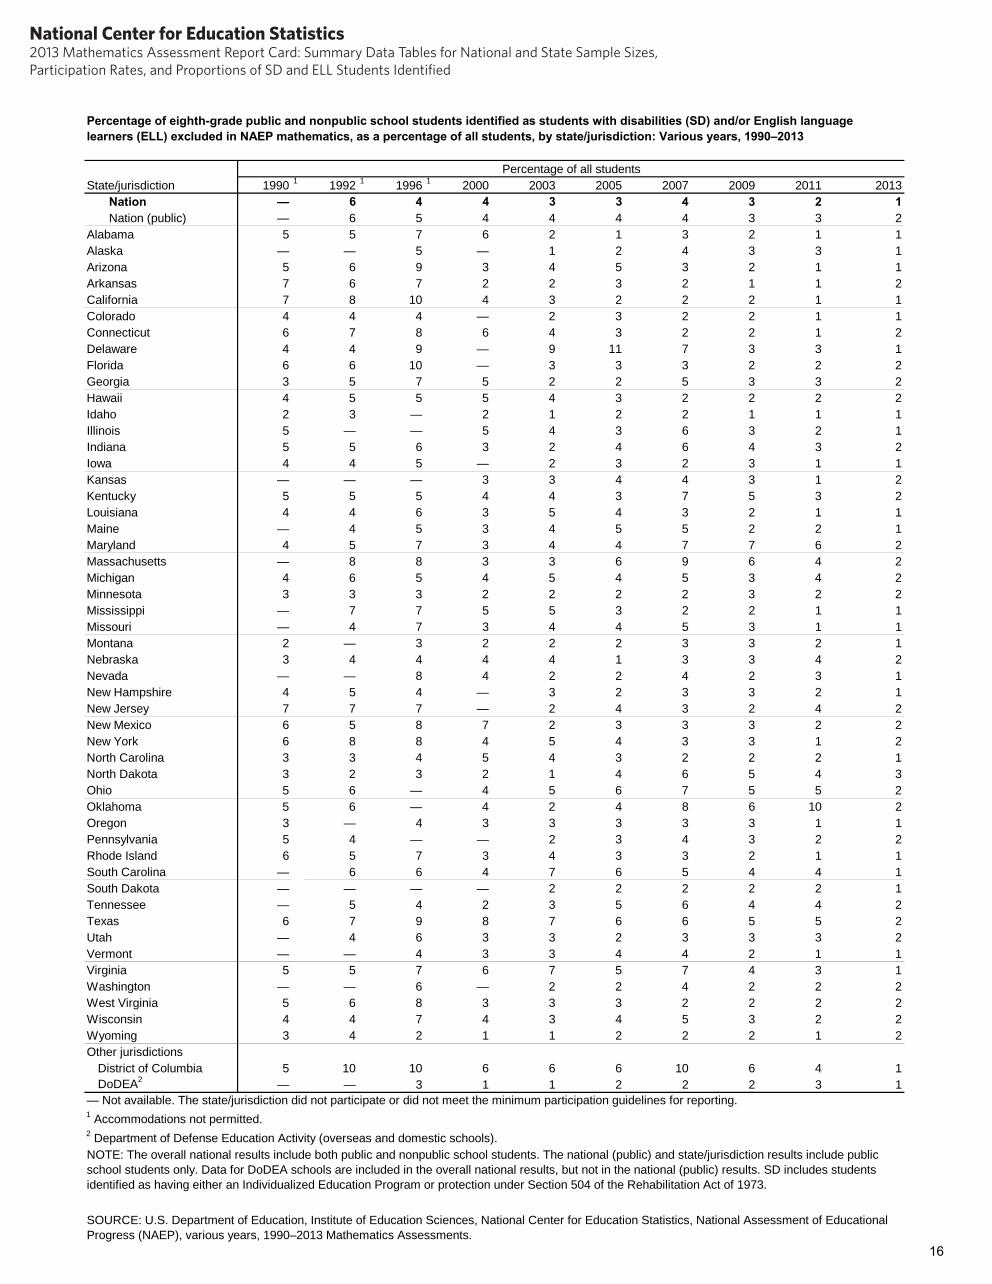
16 M_G8_State_SDELL_Trend Percentage of eighth-grade public and nonpublic school students identified as students with disabilities (SD) and/or English language learners (ELL) excluded in NAEP mathematics, as a percentage of all students, by state/jurisdiction: Various years, 1990–2013
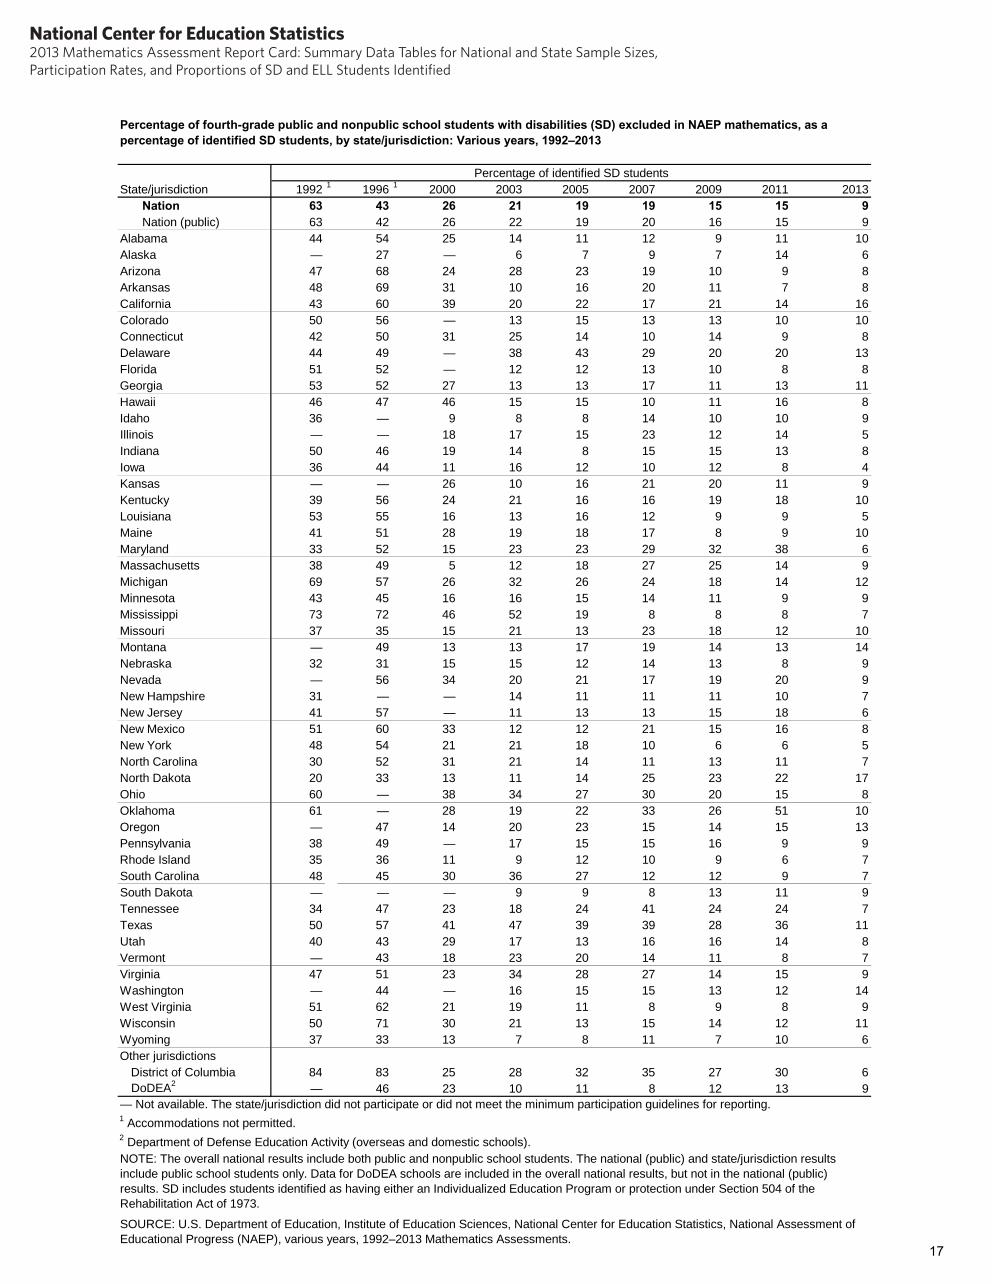
17 M_G4_State_SD_Trend Percentage of fourth-grade public and nonpublic school students with disabilities (SD) excluded in NAEP mathematics, as a percentage of identified SD students, by state/jurisdiction: Various years, 1992–2013
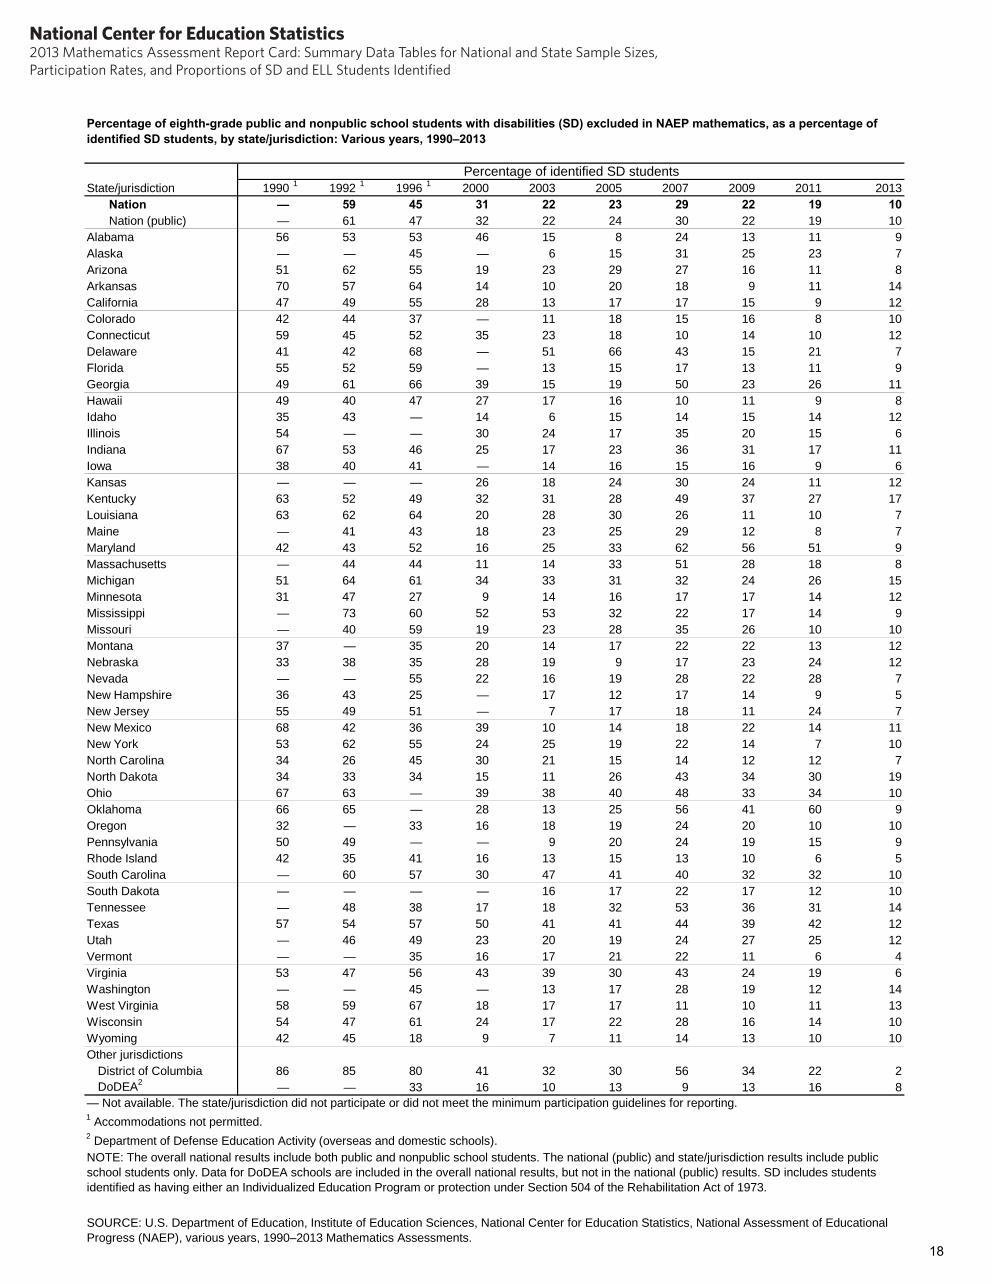
18 M_G8_State_SD_Trend Percentage of eighth-grade public and nonpublic school students with disabilities (SD) excluded in NAEP mathematics, as a percentage of identified SD students, by state/jurisdiction: Various years, 1990–2013
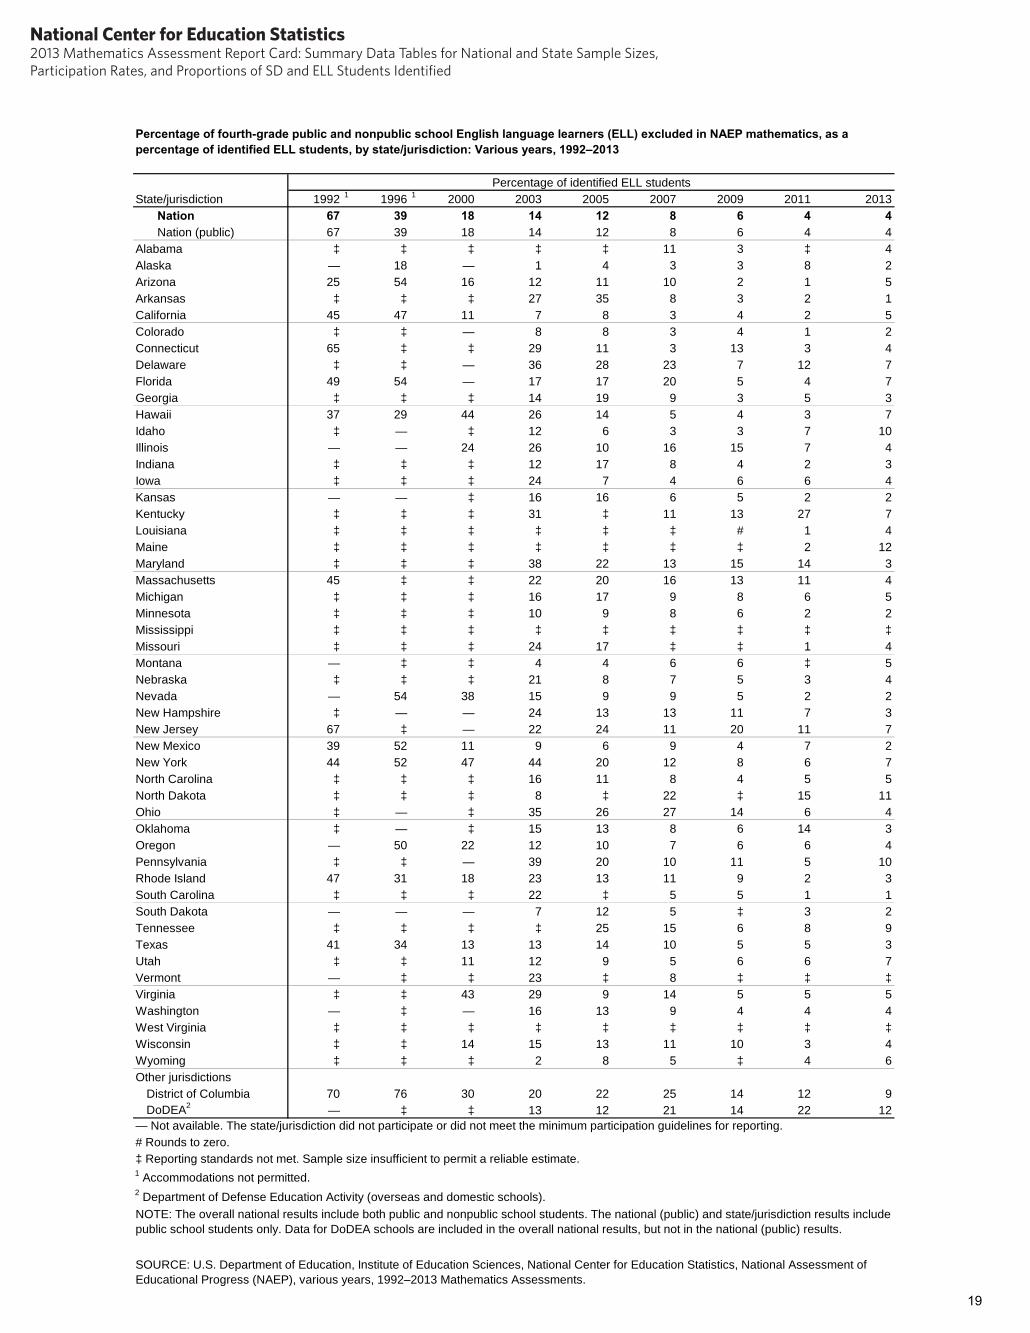
19 M_G4_State_ELL_Trend Percentage of fourth-grade public and nonpublic school English language learners (ELL) excluded in NAEP mathematics, as a percentage of identified ELL students, by state/jurisdiction: Various years, 1992–2013
20 M_G8_State_ELL_Trend Percentage of eighth-grade public and nonpublic school English language learners (ELL) excluded in NAEP mathematics, as a percentage of identified ELL students, by state/jurisdiction: Various years, 1990–2013
21 M_G4_Accommodations Percentage of fourth-grade public and nonpublic school students identified as students with disabilities (SD) and/or English language learners (ELL) assessed in NAEP mathematics with accommodations, by SD/ELL category and type of accommodation: 2013
22 M_G8_Accommodations Percentage of eighth-grade public and nonpublic school students identified as students with disabilities (SD) and/or English language learners (ELL) assessed in NAEP mathematics with accommodations, by SD/ELL category and type of accommodation: 2013
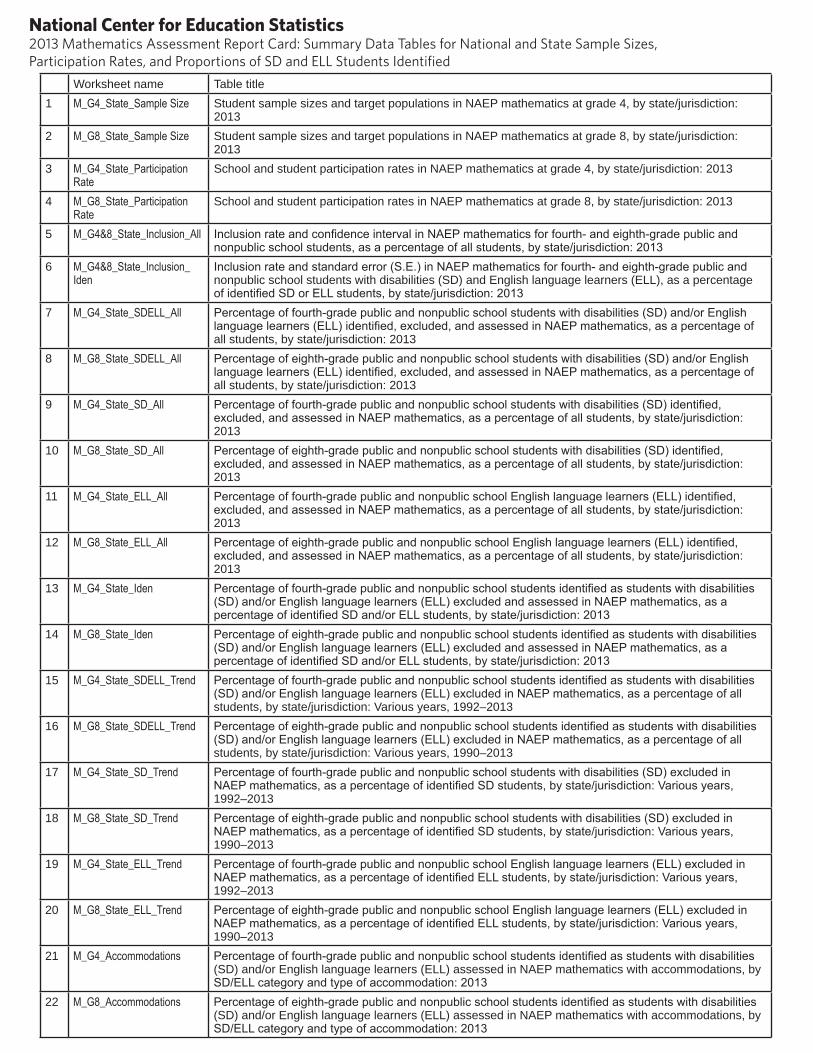
Student sample sizes and target populations in NAEP mathematics at grade 4, by state/jurisdiction: 2013
State/jurisdiction Sample size Target population Nation 189,600 3,895,000
Public 183,300 3,578,000 Private 3,100 307,000
Alabama 2,900 53,000 Alaska 2,700 9,000 Arizona 3,100 80,000 Arkansas 3,100 34,000 California 8,200 447,000 Colorado 3,000 60,000 Connecticut 3,000 41,000 Delaware 3,100 10,000 Florida 6,200 193,000 Georgia 4,700 122,000 Hawaii 3,100 14,000 Idaho 3,100 21,000 Illinois 4,700 150,000 Indiana 3,000 76,000 Iowa 2,800 33,000 Kansas 3,100 35,000 Kentucky 4,200 49,000 Louisiana 2,900 54,000 Maine 3,100 13,000 Maryland 4,300 63,000 Massachusetts 4,700 68,000 Michigan 4,100 106,000 Minnesota 3,200 62,000 Mississippi 3,000 35,000 Missouri 3,100 67,000 Montana 3,000 11,000 Nebraska 3,200 22,000 Nevada 3,200 32,000 New Hampshire 3,100 14,000 New Jersey 3,100 98,000 New Mexico 3,700 25,000 New York 4,100 186,000 North Carolina 4,400 115,000 North Dakota 3,400 7,000 Ohio 4,200 125,000 Oklahoma 3,200 50,000 Oregon 3,200 42,000 Pennsylvania 4,100 121,000 Rhode Island 3,100 11,000 South Carolina 2,900 50,000 South Dakota 3,200 10,000 Tennessee 3,000 71,000 Texas 8,400 376,000 Utah 3,200 46,000 Vermont 2,800 6,000 Virginia 3,000 93,000 Washington 3,200 81,000 West Virginia 2,900 19,000 Wisconsin 4,100 60,000 Wyoming 3,200 7,000 Other jurisdictions
BIE1 — — District of Columbia 2,100 5,000 DoDEA2 3,100 7,000
— Not available. 1 Bureau of Indian Education. 2 Department of Defense Education Activity (overseas and domestic schools). NOTE: The sample size is rounded to the nearest hundred. The target population is rounded to the nearest thousand. Data for BIE and DoDEA schools are counted in the overall national totals, but not in the public or private school totals. Data for the District of Columbia public schools are counted, along with the states, in the public school totals. Detail may not sum to totals because of rounding. SOURCE: U.S. Department of Education, Institute of Education Sciences, National Center for Education Statistics, National Assessment of Educational Progress (NAEP), 2013 Mathematics Assessment.
1
National Center for Education Statistics2013 Mathematics Assessment Report Card: Summary Data Tables for National and State Sample Sizes, Participation Rates, and Proportions of SD and ELL Students Identified
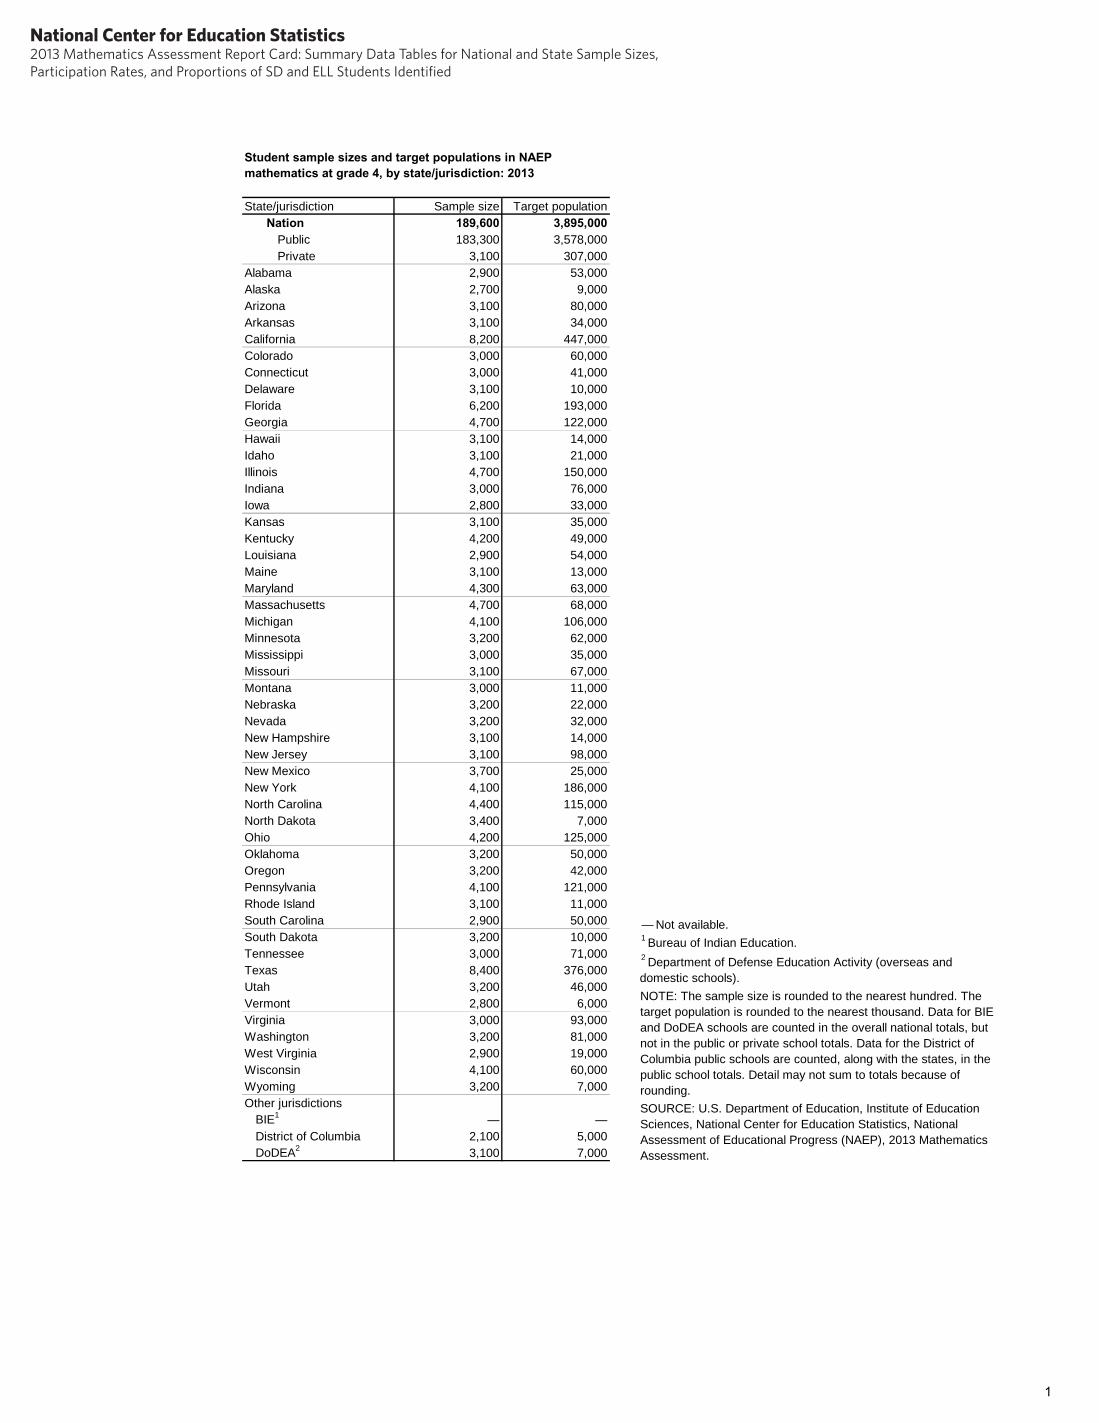
Student sample sizes and target populations in NAEP mathematics at grade 8, by state/jurisdiction: 2013
State/jurisdiction Sample size Target population Nation 173,000 3,881,000
Public 167,400 3,556,000 Private 3,200 317,000
Alabama 2,700 53,000 Alaska 2,600 9,000 Arizona 2,800 80,000 Arkansas 2,800 35,000 California 7,500 476,000 Colorado 2,800 57,000 Connecticut 2,800 41,000 Delaware 2,800 10,000 Florida 5,600 185,000 Georgia 4,200 121,000 Hawaii 2,800 12,000 Idaho 2,800 20,000 Illinois 4,400 146,000 Indiana 2,600 76,000 Iowa 2,800 33,000 Kansas 2,900 35,000 Kentucky 3,800 48,000 Louisiana 2,800 49,000 Maine 2,600 13,000 Maryland 3,800 60,000 Massachusetts 4,300 71,000 Michigan 3,700 112,000 Minnesota 2,600 58,000 Mississippi 2,800 34,000 Missouri 2,700 65,000 Montana 2,800 11,000 Nebraska 2,800 21,000 Nevada 2,900 33,000 New Hampshire 2,800 15,000 New Jersey 2,800 102,000 New Mexico 3,400 24,000 New York 3,900 199,000 North Carolina 4,000 111,000 North Dakota 3,300 7,000 Ohio 3,900 130,000 Oklahoma 2,700 45,000 Oregon 2,700 40,000 Pennsylvania 3,800 122,000 Rhode Island 3,000 10,000 South Carolina 2,800 50,000 South Dakota 2,900 9,000 Tennessee 2,800 70,000 Texas 7,700 353,000 Utah 3,000 44,000 Vermont 2,800 6,000 Virginia 2,900 89,000 Washington 2,800 76,000 West Virginia 2,800 20,000 Wisconsin 3,900 60,000 Wyoming 2,900 7,000 Other jurisdictions
BIE1 — — District of Columbia 1,800 4,000 DoDEA2 2,300 5,000
— Not available. 1 Bureau of Indian Education. 2 Department of Defense Education Activity (overseas and domestic schools). NOTE: The sample size is rounded to the nearest hundred. The target population is rounded to the nearest thousand. Data for BIE and DoDEA schools are counted in the overall national totals, but not in the public or private school totals. Data for the District of Columbia public schools are counted, along with the states, in the public school totals. Detail may not sum to totals because of rounding. SOURCE: U.S. Department of Education, Institute of Education Sciences, National Center for Education Statistics, National Assessment of Educational Progress (NAEP), 2013 Mathematics Assessment.
2
National Center for Education Statistics2013 Mathematics Assessment Report Card: Summary Data Tables for National and State Sample Sizes, Participation Rates, and Proportions of SD and ELL Students Identified
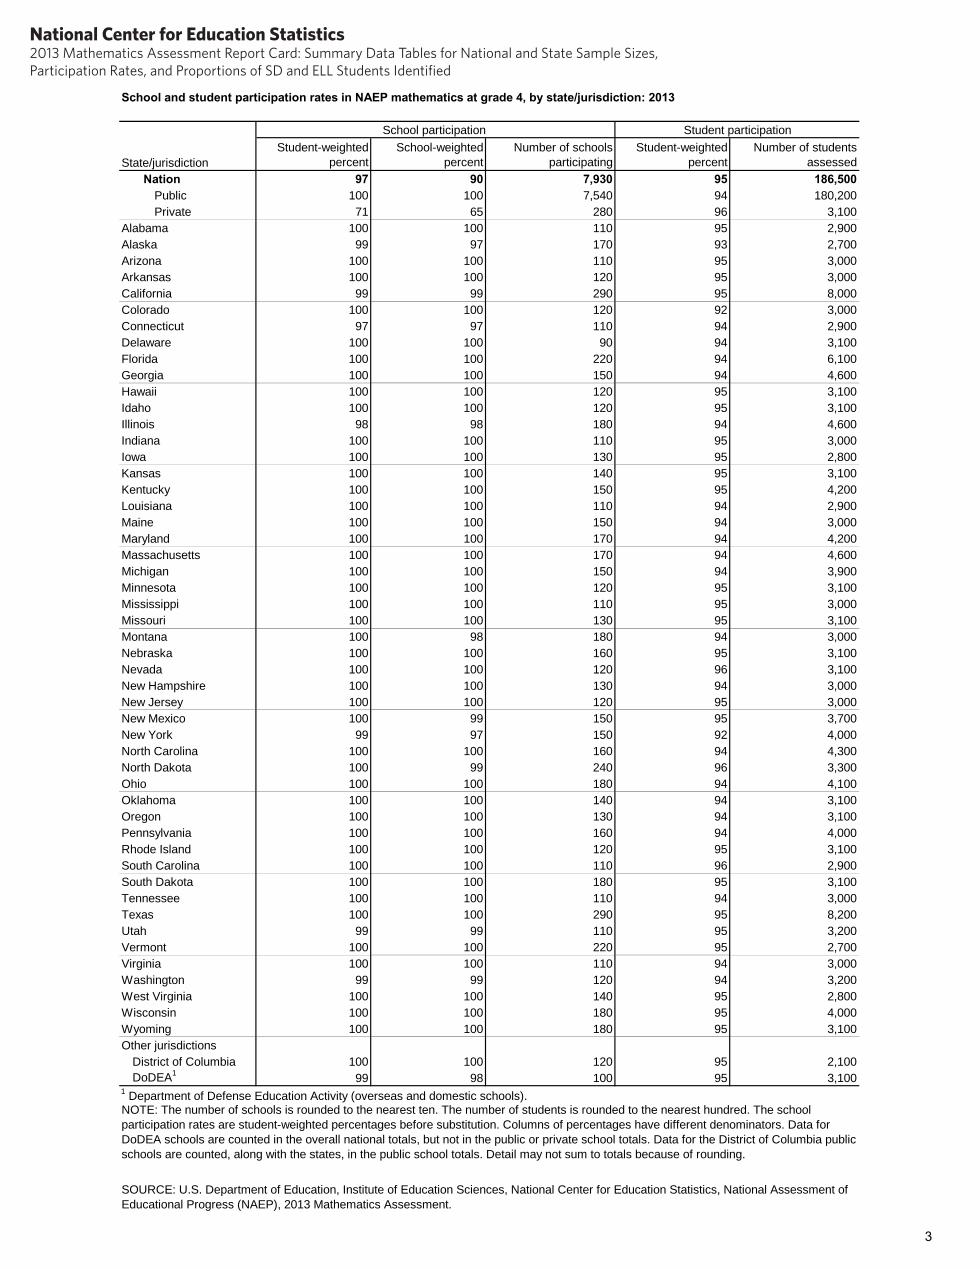
School and student participation rates in NAEP mathematics at grade 4, by state/jurisdiction: 2013
State/jurisdiction
School participation Student participation Student-weighted
percent School-weighted
percent Number of schools
participating Student-weighted
percent Number of students
assessed Nation 97 90 7,930 95 186,500
Public 100 100 7,540 94 180,200 Private 71 65 280 96 3,100
Alabama 100 100 110 95 2,900 Alaska 99 97 170 93 2,700 Arizona 100 100 110 95 3,000 Arkansas 100 100 120 95 3,000 California 99 99 290 95 8,000 Colorado 100 100 120 92 3,000 Connecticut 97 97 110 94 2,900 Delaware 100 100 90 94 3,100 Florida 100 100 220 94 6,100 Georgia 100 100 150 94 4,600 Hawaii 100 100 120 95 3,100 Idaho 100 100 120 95 3,100 Illinois 98 98 180 94 4,600 Indiana 100 100 110 95 3,000 Iowa 100 100 130 95 2,800 Kansas 100 100 140 95 3,100 Kentucky 100 100 150 95 4,200 Louisiana 100 100 110 94 2,900 Maine 100 100 150 94 3,000 Maryland 100 100 170 94 4,200 Massachusetts 100 100 170 94 4,600 Michigan 100 100 150 94 3,900 Minnesota 100 100 120 95 3,100 Mississippi 100 100 110 95 3,000 Missouri 100 100 130 95 3,100 Montana 100 98 180 94 3,000 Nebraska 100 100 160 95 3,100 Nevada 100 100 120 96 3,100 New Hampshire 100 100 130 94 3,000 New Jersey 100 100 120 95 3,000 New Mexico 100 99 150 95 3,700 New York 99 97 150 92 4,000 North Carolina 100 100 160 94 4,300 North Dakota 100 99 240 96 3,300 Ohio 100 100 180 94 4,100 Oklahoma 100 100 140 94 3,100 Oregon 100 100 130 94 3,100 Pennsylvania 100 100 160 94 4,000 Rhode Island 100 100 120 95 3,100 South Carolina 100 100 110 96 2,900 South Dakota 100 100 180 95 3,100 Tennessee 100 100 110 94 3,000 Texas 100 100 290 95 8,200 Utah 99 99 110 95 3,200 Vermont 100 100 220 95 2,700 Virginia 100 100 110 94 3,000 Washington 99 99 120 94 3,200 West Virginia 100 100 140 95 2,800 Wisconsin 100 100 180 95 4,000 Wyoming 100 100 180 95 3,100 Other jurisdictions
District of Columbia 100 100 120 95 2,100 DoDEA1 99 98 100 95 3,100
1 Department of Defense Education Activity (overseas and domestic schools). NOTE: The number of schools is rounded to the nearest ten. The number of students is rounded to the nearest hundred. The school participation rates are student-weighted percentages before substitution. Columns of percentages have different denominators. Data for DoDEA schools are counted in the overall national totals, but not in the public or private school totals. Data for the District of Columbia public schools are counted, along with the states, in the public school totals. Detail may not sum to totals because of rounding.
SOURCE: U.S. Department of Education, Institute of Education Sciences, National Center for Education Statistics, National Assessment of Educational Progress (NAEP), 2013 Mathematics Assessment.
3
National Center for Education Statistics2013 Mathematics Assessment Report Card: Summary Data Tables for National and State Sample Sizes, Participation Rates, and Proportions of SD and ELL Students Identified
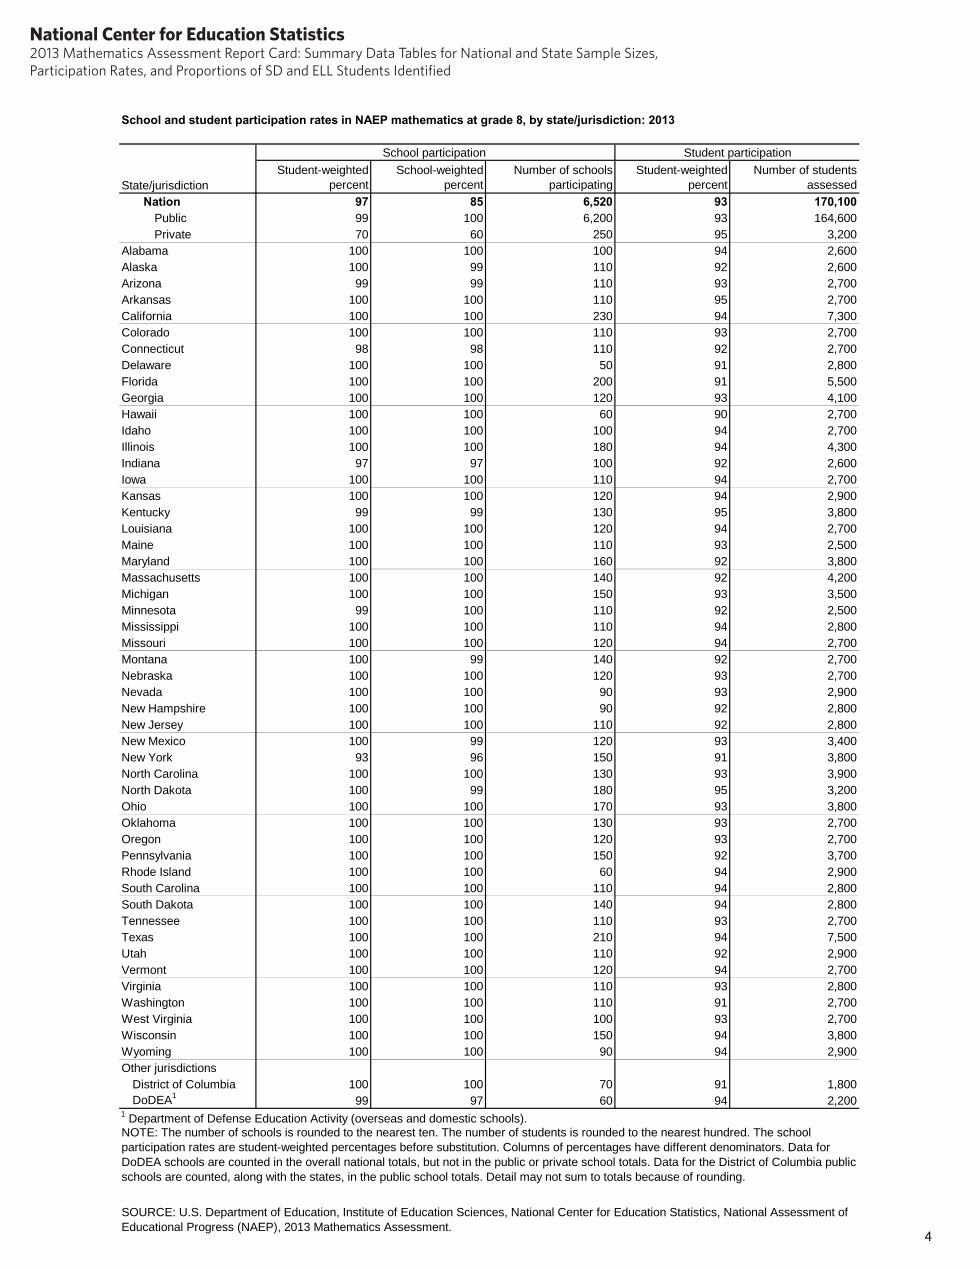
School and student participation rates in NAEP mathematics at grade 8, by state/jurisdiction: 2013
State/jurisdiction
School participation Student participation Student-weighted
percent School-weighted
percent Number of schools
participating Student-weighted
percent Number of students
assessed Nation 97 85 6,520 93 170,100
Public 99 100 6,200 93 164,600 Private 70 60 250 95 3,200
Alabama 100 100 100 94 2,600 Alaska 100 99 110 92 2,600 Arizona 99 99 110 93 2,700 Arkansas 100 100 110 95 2,700 California 100 100 230 94 7,300 Colorado 100 100 110 93 2,700 Connecticut 98 98 110 92 2,700 Delaware 100 100 50 91 2,800 Florida 100 100 200 91 5,500 Georgia 100 100 120 93 4,100 Hawaii 100 100 60 90 2,700 Idaho 100 100 100 94 2,700 Illinois 100 100 180 94 4,300 Indiana 97 97 100 92 2,600 Iowa 100 100 110 94 2,700 Kansas 100 100 120 94 2,900 Kentucky 99 99 130 95 3,800 Louisiana 100 100 120 94 2,700 Maine 100 100 110 93 2,500 Maryland 100 100 160 92 3,800 Massachusetts 100 100 140 92 4,200 Michigan 100 100 150 93 3,500 Minnesota 99 100 110 92 2,500 Mississippi 100 100 110 94 2,800 Missouri 100 100 120 94 2,700 Montana 100 99 140 92 2,700 Nebraska 100 100 120 93 2,700 Nevada 100 100 90 93 2,900 New Hampshire 100 100 90 92 2,800 New Jersey 100 100 110 92 2,800 New Mexico 100 99 120 93 3,400 New York 93 96 150 91 3,800 North Carolina 100 100 130 93 3,900 North Dakota 100 99 180 95 3,200 Ohio 100 100 170 93 3,800 Oklahoma 100 100 130 93 2,700 Oregon 100 100 120 93 2,700 Pennsylvania 100 100 150 92 3,700 Rhode Island 100 100 60 94 2,900 South Carolina 100 100 110 94 2,800 South Dakota 100 100 140 94 2,800 Tennessee 100 100 110 93 2,700 Texas 100 100 210 94 7,500 Utah 100 100 110 92 2,900 Vermont 100 100 120 94 2,700 Virginia 100 100 110 93 2,800 Washington 100 100 110 91 2,700 West Virginia 100 100 100 93 2,700 Wisconsin 100 100 150 94 3,800 Wyoming 100 100 90 94 2,900 Other jurisdictions
District of Columbia 100 100 70 91 1,800 DoDEA1 99 97 60 94 2,200
1 Department of Defense Education Activity (overseas and domestic schools). NOTE: The number of schools is rounded to the nearest ten. The number of students is rounded to the nearest hundred. The school participation rates are student-weighted percentages before substitution. Columns of percentages have different denominators. Data for DoDEA schools are counted in the overall national totals, but not in the public or private school totals. Data for the District of Columbia public schools are counted, along with the states, in the public school totals. Detail may not sum to totals because of rounding.
SOURCE: U.S. Department of Education, Institute of Education Sciences, National Center for Education Statistics, National Assessment of Educational Progress (NAEP), 2013 Mathematics Assessment.
4
National Center for Education Statistics2013 Mathematics Assessment Report Card: Summary Data Tables for National and State Sample Sizes, Participation Rates, and Proportions of SD and ELL Students Identified
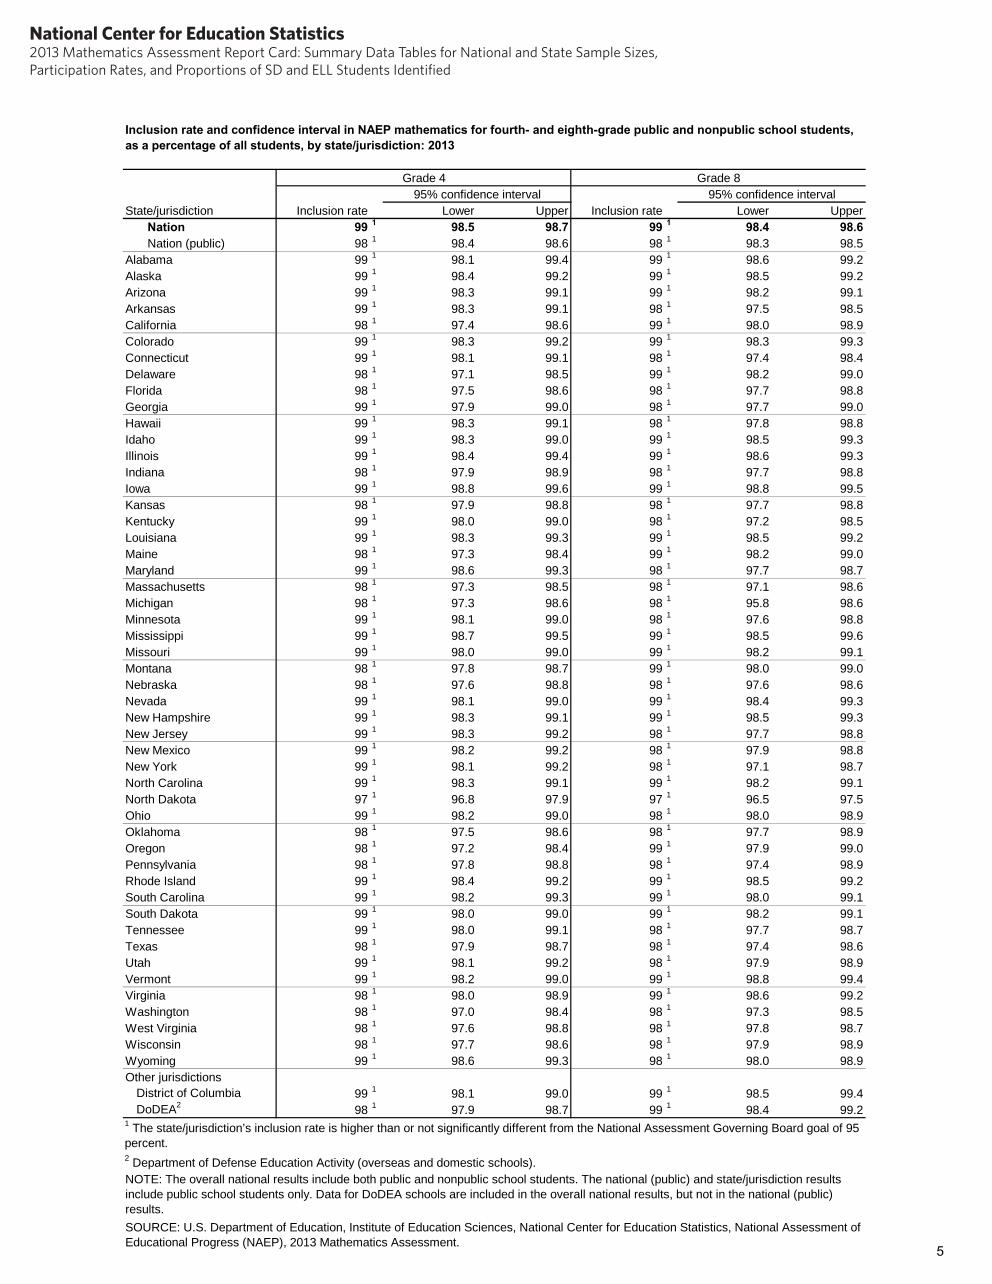
Inclusion rate and confidence interval in NAEP mathematics for fourth- and eighth-grade public and nonpublic school students, as a percentage of all students, by state/jurisdiction: 2013
State/jurisdiction
Grade 4 Grade 8
Inclusion rate 95% confidence interval
Inclusion rate 95% confidence interval
Lower Upper Lower Upper Nation 99 1 98.5 98.7 99 1 98.4 98.6 Nation (public) 98 1 98.4 98.6 98 1 98.3 98.5
Alabama 99 1 98.1 99.4 99 1 98.6 99.2 Alaska 99 1 98.4 99.2 99 1 98.5 99.2 Arizona 99 1 98.3 99.1 99 1 98.2 99.1 Arkansas 99 1 98.3 99.1 98 1 97.5 98.5 California 98 1 97.4 98.6 99 1 98.0 98.9 Colorado 99 1 98.3 99.2 99 1 98.3 99.3 Connecticut 99 1 98.1 99.1 98 1 97.4 98.4 Delaware 98 1 97.1 98.5 99 1 98.2 99.0 Florida 98 1 97.5 98.6 98 1 97.7 98.8 Georgia 99 1 97.9 99.0 98 1 97.7 99.0 Hawaii 99 1 98.3 99.1 98 1 97.8 98.8 Idaho 99 1 98.3 99.0 99 1 98.5 99.3 Illinois 99 1 98.4 99.4 99 1 98.6 99.3 Indiana 98 1 97.9 98.9 98 1 97.7 98.8 Iowa 99 1 98.8 99.6 99 1 98.8 99.5 Kansas 98 1 97.9 98.8 98 1 97.7 98.8 Kentucky 99 1 98.0 99.0 98 1 97.2 98.5 Louisiana 99 1 98.3 99.3 99 1 98.5 99.2 Maine 98 1 97.3 98.4 99 1 98.2 99.0 Maryland 99 1 98.6 99.3 98 1 97.7 98.7 Massachusetts 98 1 97.3 98.5 98 1 97.1 98.6 Michigan 98 1 97.3 98.6 98 1 95.8 98.6 Minnesota 99 1 98.1 99.0 98 1 97.6 98.8 Mississippi 99 1 98.7 99.5 99 1 98.5 99.6 Missouri 99 1 98.0 99.0 99 1 98.2 99.1 Montana 98 1 97.8 98.7 99 1 98.0 99.0 Nebraska 98 1 97.6 98.8 98 1 97.6 98.6 Nevada 99 1 98.1 99.0 99 1 98.4 99.3 New Hampshire 99 1 98.3 99.1 99 1 98.5 99.3 New Jersey 99 1 98.3 99.2 98 1 97.7 98.8 New Mexico 99 1 98.2 99.2 98 1 97.9 98.8 New York 99 1 98.1 99.2 98 1 97.1 98.7 North Carolina 99 1 98.3 99.1 99 1 98.2 99.1 North Dakota 97 1 96.8 97.9 97 1 96.5 97.5 Ohio 99 1 98.2 99.0 98 1 98.0 98.9 Oklahoma 98 1 97.5 98.6 98 1 97.7 98.9 Oregon 98 1 97.2 98.4 99 1 97.9 99.0 Pennsylvania 98 1 97.8 98.8 98 1 97.4 98.9 Rhode Island 99 1 98.4 99.2 99 1 98.5 99.2 South Carolina 99 1 98.2 99.3 99 1 98.0 99.1 South Dakota 99 1 98.0 99.0 99 1 98.2 99.1 Tennessee 99 1 98.0 99.1 98 1 97.7 98.7 Texas 98 1 97.9 98.7 98 1 97.4 98.6 Utah 99 1 98.1 99.2 98 1 97.9 98.9 Vermont 99 1 98.2 99.0 99 1 98.8 99.4 Virginia 98 1 98.0 98.9 99 1 98.6 99.2 Washington 98 1 97.0 98.4 98 1 97.3 98.5 West Virginia 98 1 97.6 98.8 98 1 97.8 98.7 Wisconsin 98 1 97.7 98.6 98 1 97.9 98.9 Wyoming 99 1 98.6 99.3 98 1 98.0 98.9 Other jurisdictions
District of Columbia 99 1 98.1 99.0 99 1 98.5 99.4 DoDEA2 98 1 97.9 98.7 99 1 98.4 99.2
1 The state/jurisdiction’s inclusion rate is higher than or not significantly different from the National Assessment Governing Board goal of 95 percent.
2 Department of Defense Education Activity (overseas and domestic schools). NOTE: The overall national results include both public and nonpublic school students. The national (public) and state/jurisdiction results include public school students only. Data for DoDEA schools are included in the overall national results, but not in the national (public) results. SOURCE: U.S. Department of Education, Institute of Education Sciences, National Center for Education Statistics, National Assessment of Educational Progress (NAEP), 2013 Mathematics Assessment.
5
National Center for Education Statistics2013 Mathematics Assessment Report Card: Summary Data Tables for National and State Sample Sizes, Participation Rates, and Proportions of SD and ELL Students Identified
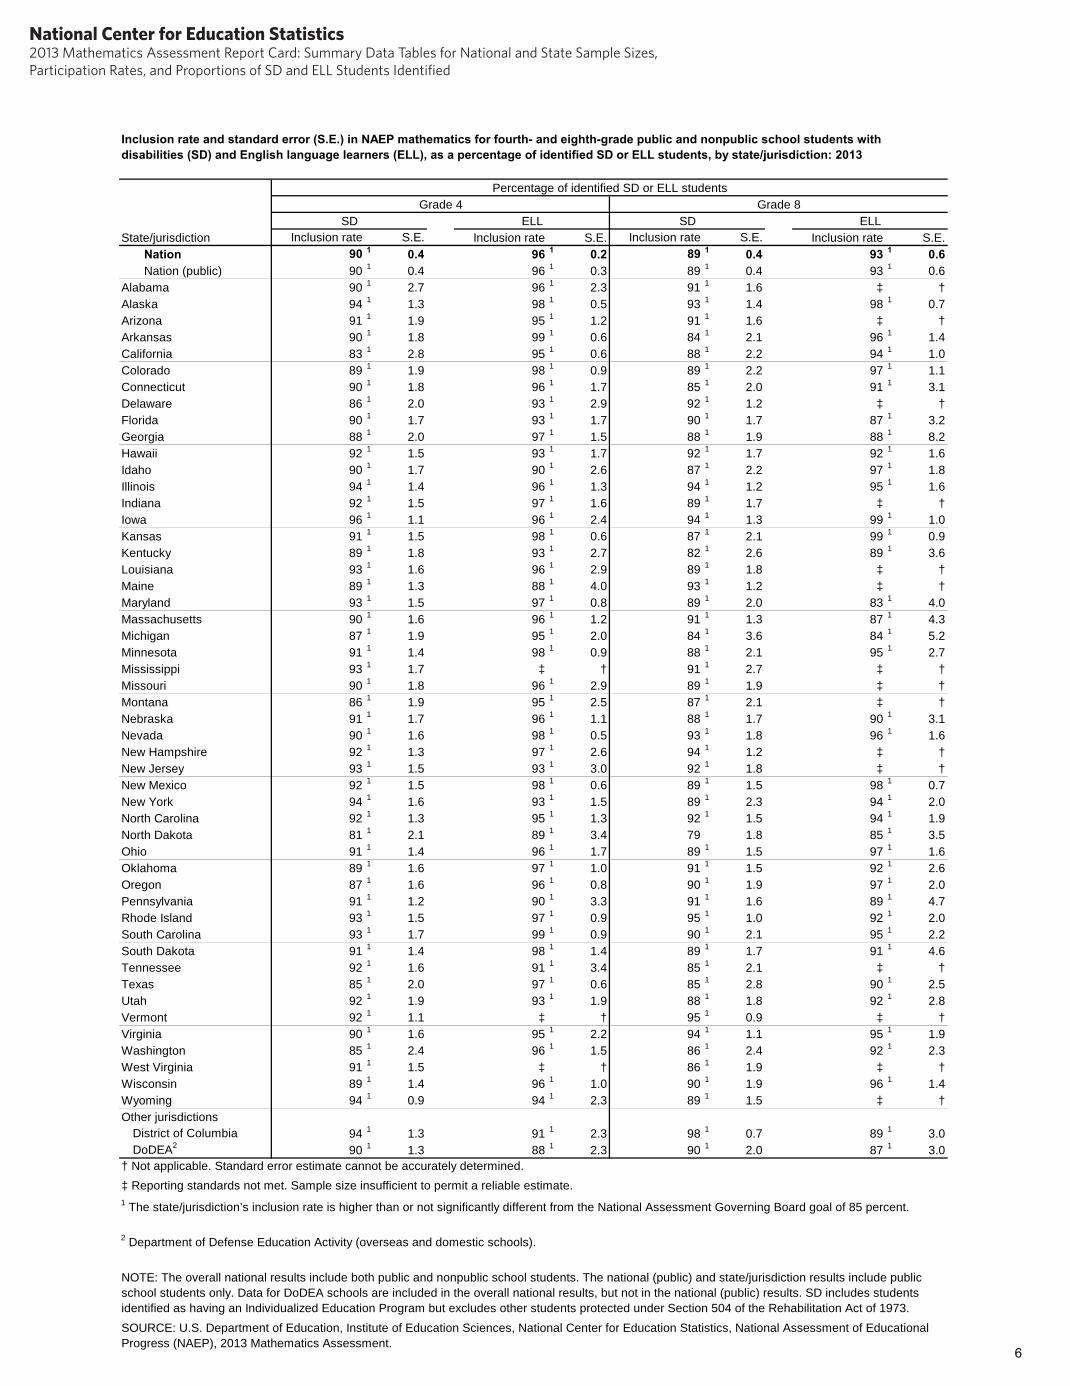
Inclusion rate and standard error (S.E.) in NAEP mathematics for fourth- and eighth-grade public and nonpublic school students with disabilities (SD) and English language learners (ELL), as a percentage of identified SD or ELL students, by state/jurisdiction: 2013
State/jurisdiction
Percentage of identified SD or ELL students Grade 4 Grade 8
SD ELL SD ELL Inclusion rate S.E. Inclusion rate S.E. Inclusion rate S.E. Inclusion rate S.E.
Nation 90 1 0.4 96 1 0.2 89 1 0.4 93 1 0.6 Nation (public) 90 1 0.4 96 1 0.3 89 1 0.4 93 1 0.6
Alabama 90 1 2.7 96 1 2.3 91 1 1.6 ‡ † Alaska 94 1 1.3 98 1 0.5 93 1 1.4 98 1 0.7 Arizona 91 1 1.9 95 1 1.2 91 1 1.6 ‡ † Arkansas 90 1 1.8 99 1 0.6 84 1 2.1 96 1 1.4 California 83 1 2.8 95 1 0.6 88 1 2.2 94 1 1.0 Colorado 89 1 1.9 98 1 0.9 89 1 2.2 97 1 1.1 Connecticut 90 1 1.8 96 1 1.7 85 1 2.0 91 1 3.1 Delaware 86 1 2.0 93 1 2.9 92 1 1.2 ‡ † Florida 90 1 1.7 93 1 1.7 90 1 1.7 87 1 3.2 Georgia 88 1 2.0 97 1 1.5 88 1 1.9 88 1 8.2 Hawaii 92 1 1.5 93 1 1.7 92 1 1.7 92 1 1.6 Idaho 90 1 1.7 90 1 2.6 87 1 2.2 97 1 1.8 Illinois 94 1 1.4 96 1 1.3 94 1 1.2 95 1 1.6 Indiana 92 1 1.5 97 1 1.6 89 1 1.7 ‡ † Iowa 96 1 1.1 96 1 2.4 94 1 1.3 99 1 1.0 Kansas 91 1 1.5 98 1 0.6 87 1 2.1 99 1 0.9 Kentucky 89 1 1.8 93 1 2.7 82 1 2.6 89 1 3.6 Louisiana 93 1 1.6 96 1 2.9 89 1 1.8 ‡ † Maine 89 1 1.3 88 1 4.0 93 1 1.2 ‡ † Maryland 93 1 1.5 97 1 0.8 89 1 2.0 83 1 4.0 Massachusetts 90 1 1.6 96 1 1.2 91 1 1.3 87 1 4.3 Michigan 87 1 1.9 95 1 2.0 84 1 3.6 84 1 5.2 Minnesota 91 1 1.4 98 1 0.9 88 1 2.1 95 1 2.7 Mississippi 93 1 1.7 ‡ † 91 1 2.7 ‡ † Missouri 90 1 1.8 96 1 2.9 89 1 1.9 ‡ † Montana 86 1 1.9 95 1 2.5 87 1 2.1 ‡ † Nebraska 91 1 1.7 96 1 1.1 88 1 1.7 90 1 3.1 Nevada 90 1 1.6 98 1 0.5 93 1 1.8 96 1 1.6 New Hampshire 92 1 1.3 97 1 2.6 94 1 1.2 ‡ † New Jersey 93 1 1.5 93 1 3.0 92 1 1.8 ‡ † New Mexico 92 1 1.5 98 1 0.6 89 1 1.5 98 1 0.7 New York 94 1 1.6 93 1 1.5 89 1 2.3 94 1 2.0 North Carolina 92 1 1.3 95 1 1.3 92 1 1.5 94 1 1.9 North Dakota 81 1 2.1 89 1 3.4 79 1.8 85 1 3.5 Ohio 91 1 1.4 96 1 1.7 89 1 1.5 97 1 1.6 Oklahoma 89 1 1.6 97 1 1.0 91 1 1.5 92 1 2.6 Oregon 87 1 1.6 96 1 0.8 90 1 1.9 97 1 2.0 Pennsylvania 91 1 1.2 90 1 3.3 91 1 1.6 89 1 4.7 Rhode Island 93 1 1.5 97 1 0.9 95 1 1.0 92 1 2.0 South Carolina 93 1 1.7 99 1 0.9 90 1 2.1 95 1 2.2 South Dakota 91 1 1.4 98 1 1.4 89 1 1.7 91 1 4.6 Tennessee 92 1 1.6 91 1 3.4 85 1 2.1 ‡ † Texas 85 1 2.0 97 1 0.6 85 1 2.8 90 1 2.5 Utah 92 1 1.9 93 1 1.9 88 1 1.8 92 1 2.8 Vermont 92 1 1.1 ‡ † 95 1 0.9 ‡ † Virginia 90 1 1.6 95 1 2.2 94 1 1.1 95 1 1.9 Washington 85 1 2.4 96 1 1.5 86 1 2.4 92 1 2.3 West Virginia 91 1 1.5 ‡ † 86 1 1.9 ‡ † Wisconsin 89 1 1.4 96 1 1.0 90 1 1.9 96 1 1.4 Wyoming 94 1 0.9 94 1 2.3 89 1 1.5 ‡ † Other jurisdictions
District of Columbia 94 1 1.3 91 1 2.3 98 1 0.7 89 1 3.0 DoDEA2 90 1 1.3 88 1 2.3 90 1 2.0 87 1 3.0
† Not applicable. Standard error estimate cannot be accurately determined. ‡ Reporting standards not met. Sample size insufficient to permit a reliable estimate. 1 The state/jurisdiction’s inclusion rate is higher than or not significantly different from the National Assessment Governing Board goal of 85 percent.
2 Department of Defense Education Activity (overseas and domestic schools).
NOTE: The overall national results include both public and nonpublic school students. The national (public) and state/jurisdiction results include public school students only. Data for DoDEA schools are included in the overall national results, but not in the national (public) results. SD includes students identified as having an Individualized Education Program but excludes other students protected under Section 504 of the Rehabilitation Act of 1973. SOURCE: U.S. Department of Education, Institute of Education Sciences, National Center for Education Statistics, National Assessment of Educational Progress (NAEP), 2013 Mathematics Assessment.
6
National Center for Education Statistics2013 Mathematics Assessment Report Card: Summary Data Tables for National and State Sample Sizes, Participation Rates, and Proportions of SD and ELL Students Identified
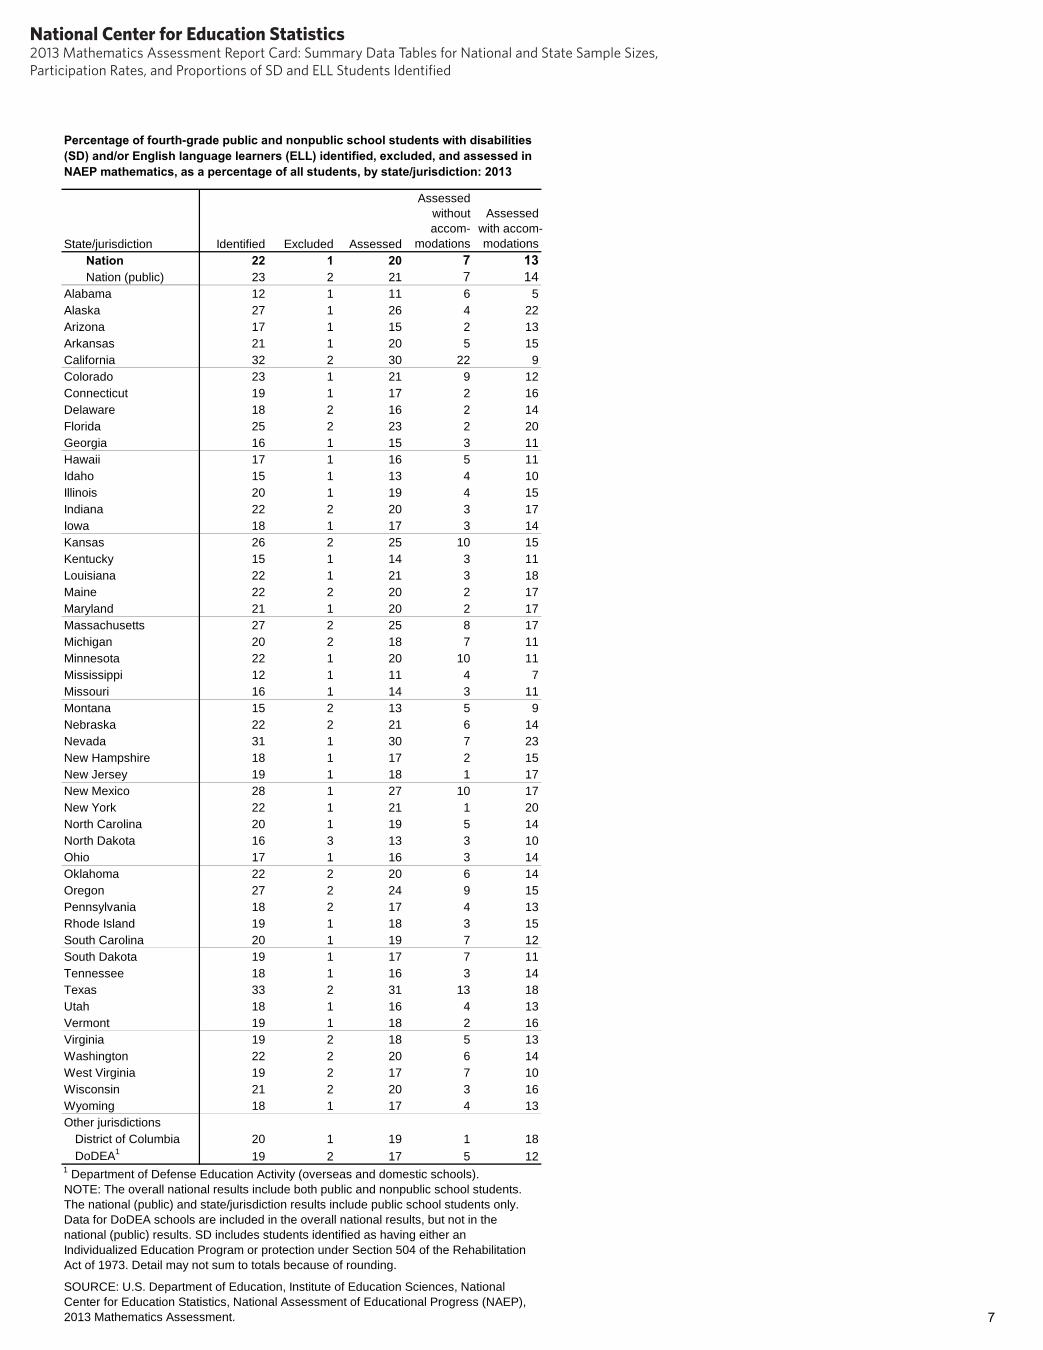
Percentage of fourth-grade public and nonpublic school students with disabilities (SD) and/or English language learners (ELL) identified, excluded, and assessed in NAEP mathematics, as a percentage of all students, by state/jurisdiction: 2013
State/jurisdiction Identified Excluded Assessed
Assessed without accom-
modations
Assessed with accommodations
Nation 22 1 20 7 13 Nation (public) 23 2 21 7 14
Alabama 12 1 11 6 5 Alaska 27 1 26 4 22 Arizona 17 1 15 2 13 Arkansas 21 1 20 5 15 California 32 2 30 22 9 Colorado 23 1 21 9 12 Connecticut 19 1 17 2 16 Delaware 18 2 16 2 14 Florida 25 2 23 2 20 Georgia 16 1 15 3 11 Hawaii 17 1 16 5 11 Idaho 15 1 13 4 10 Illinois 20 1 19 4 15 Indiana 22 2 20 3 17 Iowa 18 1 17 3 14 Kansas 26 2 25 10 15 Kentucky 15 1 14 3 11 Louisiana 22 1 21 3 18 Maine 22 2 20 2 17 Maryland 21 1 20 2 17 Massachusetts 27 2 25 8 17 Michigan 20 2 18 7 11 Minnesota 22 1 20 10 11 Mississippi 12 1 11 4 7 Missouri 16 1 14 3 11 Montana 15 2 13 5 9 Nebraska 22 2 21 6 14 Nevada 31 1 30 7 23 New Hampshire 18 1 17 2 15 New Jersey 19 1 18 1 17 New Mexico 28 1 27 10 17 New York 22 1 21 1 20 North Carolina 20 1 19 5 14 North Dakota 16 3 13 3 10 Ohio 17 1 16 3 14 Oklahoma 22 2 20 6 14 Oregon 27 2 24 9 15 Pennsylvania 18 2 17 4 13 Rhode Island 19 1 18 3 15 South Carolina 20 1 19 7 12 South Dakota 19 1 17 7 11 Tennessee 18 1 16 3 14 Texas 33 2 31 13 18 Utah 18 1 16 4 13 Vermont 19 1 18 2 16 Virginia 19 2 18 5 13 Washington 22 2 20 6 14 West Virginia 19 2 17 7 10 Wisconsin 21 2 20 3 16 Wyoming 18 1 17 4 13 Other jurisdictions
District of Columbia 20 1 19 1 18 DoDEA1 19 2 17 5 12
1 Department of Defense Education Activity (overseas and domestic schools). NOTE: The overall national results include both public and nonpublic school students. The national (public) and state/jurisdiction results include public school students only. Data for DoDEA schools are included in the overall national results, but not in the national (public) results. SD includes students identified as having either an Individualized Education Program or protection under Section 504 of the Rehabilitation Act of 1973. Detail may not sum to totals because of rounding.
SOURCE: U.S. Department of Education, Institute of Education Sciences, National Center for Education Statistics, National Assessment of Educational Progress (NAEP), 2013 Mathematics Assessment. 7
National Center for Education Statistics2013 Mathematics Assessment Report Card: Summary Data Tables for National and State Sample Sizes, Participation Rates, and Proportions of SD and ELL Students Identified
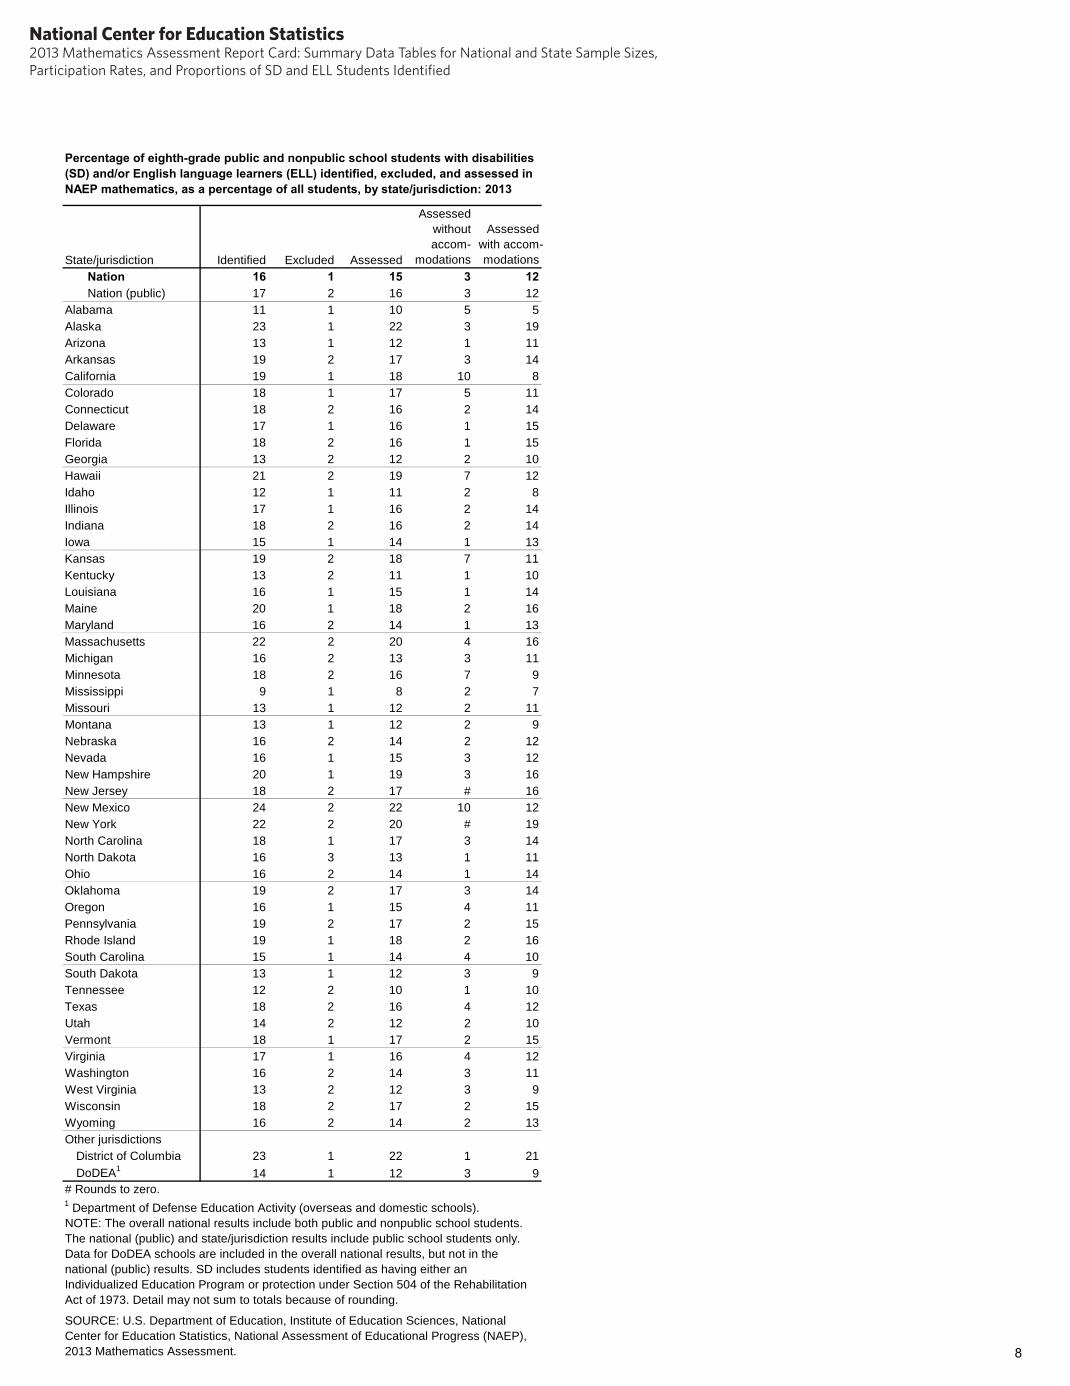
Percentage of eighth-grade public and nonpublic school students with disabilities (SD) and/or English language learners (ELL) identified, excluded, and assessed in NAEP mathematics, as a percentage of all students, by state/jurisdiction: 2013
State/jurisdiction Identified Excluded Assessed
Assessed without accom
modations
Assessed with accom-modations
Nation 16 1 15 3 12 Nation (public) 17 2 16 3 12
Alabama 11 1 10 5 5 Alaska 23 1 22 3 19 Arizona 13 1 12 1 11 Arkansas 19 2 17 3 14 California 19 1 18 10 8 Colorado 18 1 17 5 11 Connecticut 18 2 16 2 14 Delaware 17 1 16 1 15 Florida 18 2 16 1 15 Georgia 13 2 12 2 10 Hawaii 21 2 19 7 12 Idaho 12 1 11 2 8 Illinois 17 1 16 2 14 Indiana 18 2 16 2 14 Iowa 15 1 14 1 13 Kansas 19 2 18 7 11 Kentucky 13 2 11 1 10 Louisiana 16 1 15 1 14 Maine 20 1 18 2 16 Maryland 16 2 14 1 13 Massachusetts 22 2 20 4 16 Michigan 16 2 13 3 11 Minnesota 18 2 16 7 9 Mississippi 9 1 8 2 7 Missouri 13 1 12 2 11 Montana 13 1 12 2 9 Nebraska 16 2 14 2 12 Nevada 16 1 15 3 12 New Hampshire 20 1 19 3 16 New Jersey 18 2 17 # 16 New Mexico 24 2 22 10 12 New York 22 2 20 # 19 North Carolina 18 1 17 3 14 North Dakota 16 3 13 1 11 Ohio 16 2 14 1 14 Oklahoma 19 2 17 3 14 Oregon 16 1 15 4 11 Pennsylvania 19 2 17 2 15 Rhode Island 19 1 18 2 16 South Carolina 15 1 14 4 10 South Dakota 13 1 12 3 9 Tennessee 12 2 10 1 10 Texas 18 2 16 4 12 Utah 14 2 12 2 10 Vermont 18 1 17 2 15 Virginia 17 1 16 4 12 Washington 16 2 14 3 11 West Virginia 13 2 12 3 9 Wisconsin 18 2 17 2 15 Wyoming 16 2 14 2 13 Other jurisdictions
District of Columbia 23 1 22 1 21 DoDEA1 14 1 12 3 9
# Rounds to zero. 1 Department of Defense Education Activity (overseas and domestic schools). NOTE: The overall national results include both public and nonpublic school students. The national (public) and state/jurisdiction results include public school students only. Data for DoDEA schools are included in the overall national results, but not in the national (public) results. SD includes students identified as having either an Individualized Education Program or protection under Section 504 of the Rehabilitation Act of 1973. Detail may not sum to totals because of rounding.
SOURCE: U.S. Department of Education, Institute of Education Sciences, National Center for Education Statistics, National Assessment of Educational Progress (NAEP), 2013 Mathematics Assessment. 8
National Center for Education Statistics2013 Mathematics Assessment Report Card: Summary Data Tables for National and State Sample Sizes, Participation Rates, and Proportions of SD and ELL Students Identified
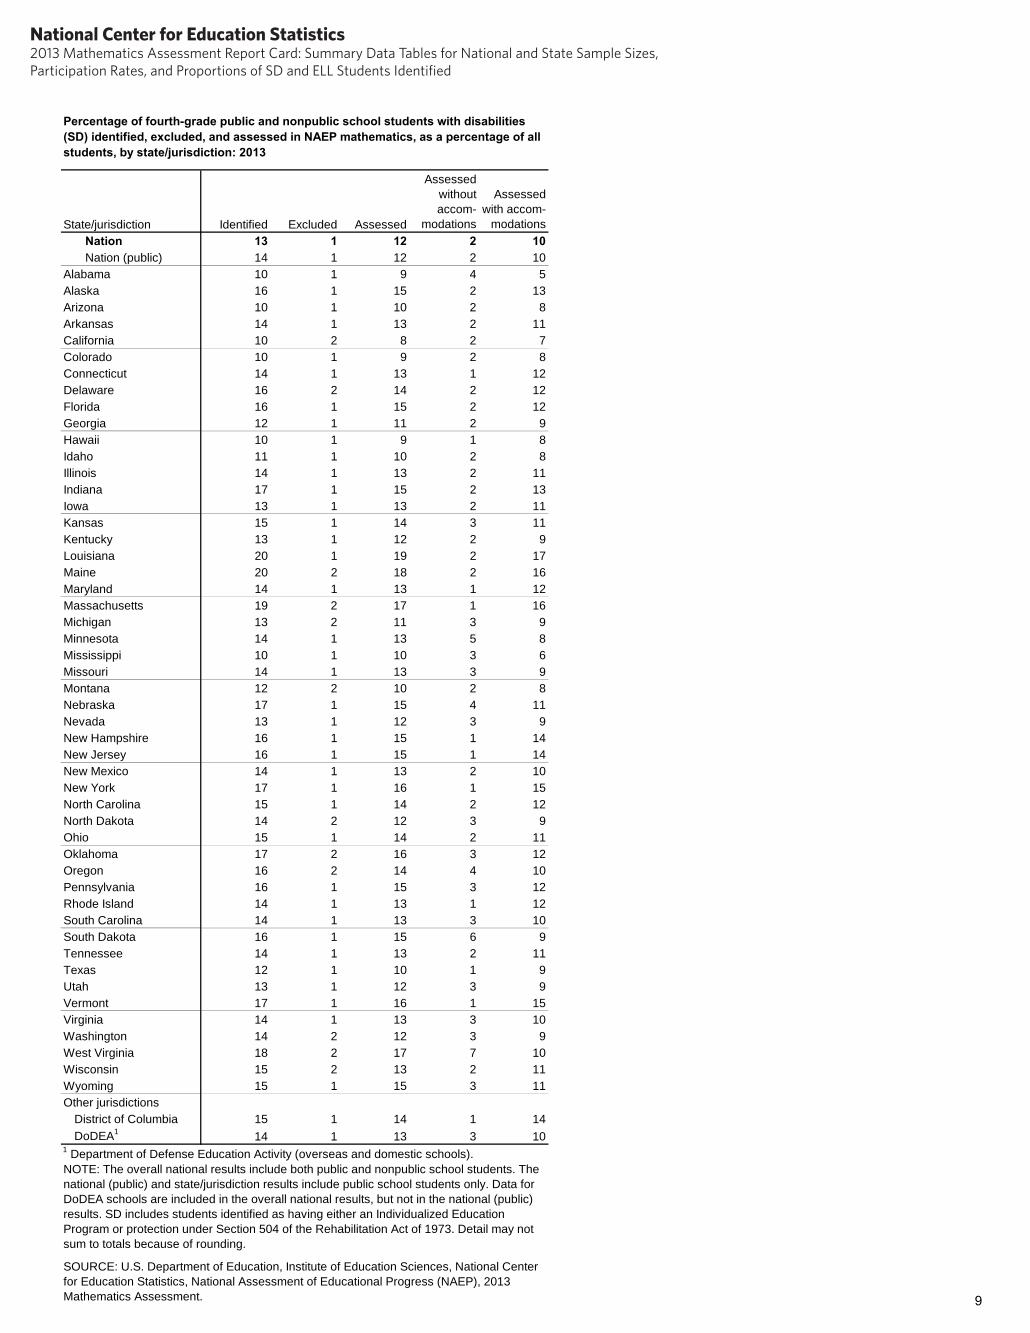
Percentage of fourth-grade public and nonpublic school students with disabilities (SD) identified, excluded, and assessed in NAEP mathematics, as a percentage of all students, by state/jurisdiction: 2013
State/jurisdiction Identified Excluded Assessed
Assessed without accom-
modations
Assessed with accom
modations Nation 13 1 12 2 10 Nation (public) 14 1 12 2 10
Alabama 10 1 9 4 5 Alaska 16 1 15 2 13 Arizona 10 1 10 2 8 Arkansas 14 1 13 2 11 California 10 2 8 2 7 Colorado 10 1 9 2 8 Connecticut 14 1 13 1 12 Delaware 16 2 14 2 12 Florida 16 1 15 2 12 Georgia 12 1 11 2 9 Hawaii 10 1 9 1 8 Idaho 11 1 10 2 8 Illinois 14 1 13 2 11 Indiana 17 1 15 2 13 Iowa 13 1 13 2 11 Kansas 15 1 14 3 11 Kentucky 13 1 12 2 9 Louisiana 20 1 19 2 17 Maine 20 2 18 2 16 Maryland 14 1 13 1 12 Massachusetts 19 2 17 1 16 Michigan 13 2 11 3 9 Minnesota 14 1 13 5 8 Mississippi 10 1 10 3 6 Missouri 14 1 13 3 9 Montana 12 2 10 2 8 Nebraska 17 1 15 4 11 Nevada 13 1 12 3 9 New Hampshire 16 1 15 1 14 New Jersey 16 1 15 1 14 New Mexico 14 1 13 2 10 New York 17 1 16 1 15 North Carolina 15 1 14 2 12 North Dakota 14 2 12 3 9 Ohio 15 1 14 2 11 Oklahoma 17 2 16 3 12 Oregon 16 2 14 4 10 Pennsylvania 16 1 15 3 12 Rhode Island 14 1 13 1 12 South Carolina 14 1 13 3 10 South Dakota 16 1 15 6 9 Tennessee 14 1 13 2 11 Texas 12 1 10 1 9 Utah 13 1 12 3 9 Vermont 17 1 16 1 15 Virginia 14 1 13 3 10 Washington 14 2 12 3 9 West Virginia 18 2 17 7 10 Wisconsin 15 2 13 2 11 Wyoming 15 1 15 3 11 Other jurisdictions
District of Columbia 15 1 14 1 14 DoDEA1 14 1 13 3 10
1 Department of Defense Education Activity (overseas and domestic schools). NOTE: The overall national results include both public and nonpublic school students. The national (public) and state/jurisdiction results include public school students only. Data for DoDEA schools are included in the overall national results, but not in the national (public) results. SD includes students identified as having either an Individualized Education Program or protection under Section 504 of the Rehabilitation Act of 1973. Detail may not sum to totals because of rounding.
SOURCE: U.S. Department of Education, Institute of Education Sciences, National Center for Education Statistics, National Assessment of Educational Progress (NAEP), 2013 Mathematics Assessment. 9
National Center for Education Statistics2013 Mathematics Assessment Report Card: Summary Data Tables for National and State Sample Sizes, Participation Rates, and Proportions of SD and ELL Students Identified
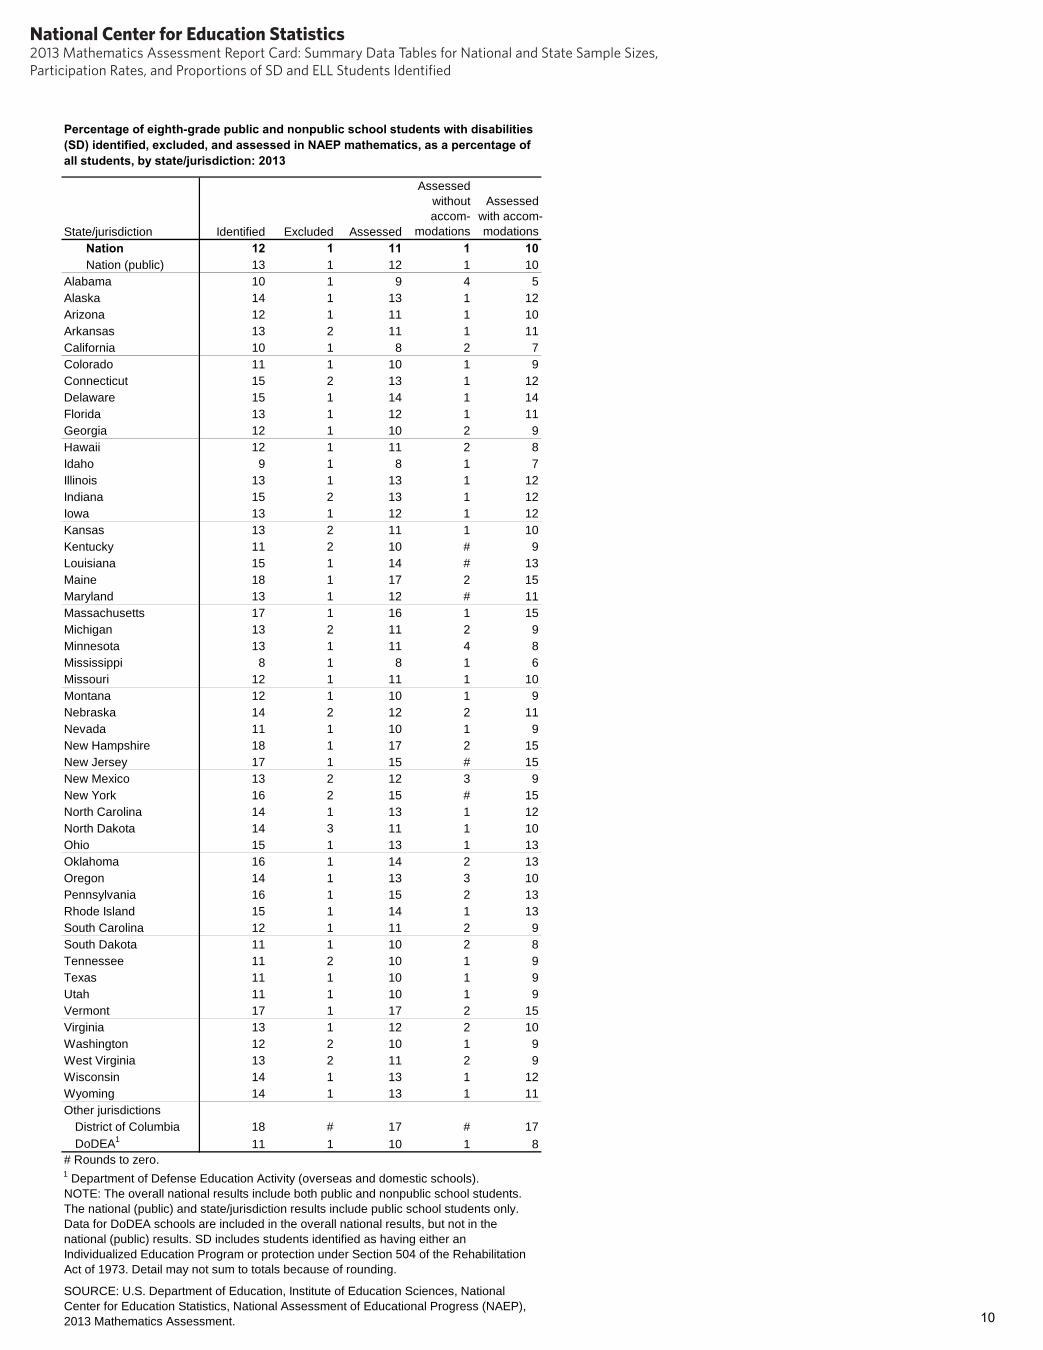
Percentage of eighth-grade public and nonpublic school students with disabilities (SD) identified, excluded, and assessed in NAEP mathematics, as a percentage of all students, by state/jurisdiction: 2013
State/jurisdiction Identified Excluded Assessed
Assessed without accom
modations
Assessed with accommodations
Nation Nation (public)
12 13
1 1
11 12
1 1
10 10
Alabama 10 1 9 4 5 Alaska 14 1 13 1 12 Arizona 12 1 11 1 10 Arkansas 13 2 11 1 11 California 10 1 8 2 7 Colorado 11 1 10 1 9 Connecticut 15 2 13 1 12 Delaware 15 1 14 1 14 Florida 13 1 12 1 11 Georgia 12 1 10 2 9 Hawaii 12 1 11 2 8 Idaho 9 1 8 1 7 Illinois 13 1 13 1 12 Indiana 15 2 13 1 12 Iowa 13 1 12 1 12 Kansas 13 2 11 1 10 Kentucky 11 2 10 # 9 Louisiana 15 1 14 # 13 Maine 18 1 17 2 15 Maryland 13 1 12 # 11 Massachusetts 17 1 16 1 15 Michigan 13 2 11 2 9 Minnesota 13 1 11 4 8 Mississippi 8 1 8 1 6 Missouri 12 1 11 1 10 Montana 12 1 10 1 9 Nebraska 14 2 12 2 11 Nevada 11 1 10 1 9 New Hampshire 18 1 17 2 15 New Jersey 17 1 15 # 15 New Mexico 13 2 12 3 9 New York 16 2 15 # 15 North Carolina 14 1 13 1 12 North Dakota 14 3 11 1 10 Ohio 15 1 13 1 13 Oklahoma 16 1 14 2 13 Oregon 14 1 13 3 10 Pennsylvania 16 1 15 2 13 Rhode Island 15 1 14 1 13 South Carolina 12 1 11 2 9 South Dakota 11 1 10 2 8 Tennessee 11 2 10 1 9 Texas 11 1 10 1 9 Utah 11 1 10 1 9 Vermont 17 1 17 2 15 Virginia 13 1 12 2 10 Washington 12 2 10 1 9 West Virginia 13 2 11 2 9 Wisconsin 14 1 13 1 12 Wyoming 14 1 13 1 11 Other jurisdictions
District of Columbia 18 # 17 # 17 DoDEA1 11 1 10 1 8
# Rounds to zero. 1 Department of Defense Education Activity (overseas and domestic schools). NOTE: The overall national results include both public and nonpublic school students. The national (public) and state/jurisdiction results include public school students only. Data for DoDEA schools are included in the overall national results, but not in the national (public) results. SD includes students identified as having either an Individualized Education Program or protection under Section 504 of the Rehabilitation Act of 1973. Detail may not sum to totals because of rounding.
SOURCE: U.S. Department of Education, Institute of Education Sciences, National Center for Education Statistics, National Assessment of Educational Progress (NAEP), 2013 Mathematics Assessment. 10
National Center for Education Statistics2013 Mathematics Assessment Report Card: Summary Data Tables for National and State Sample Sizes, Participation Rates, and Proportions of SD and ELL Students Identified
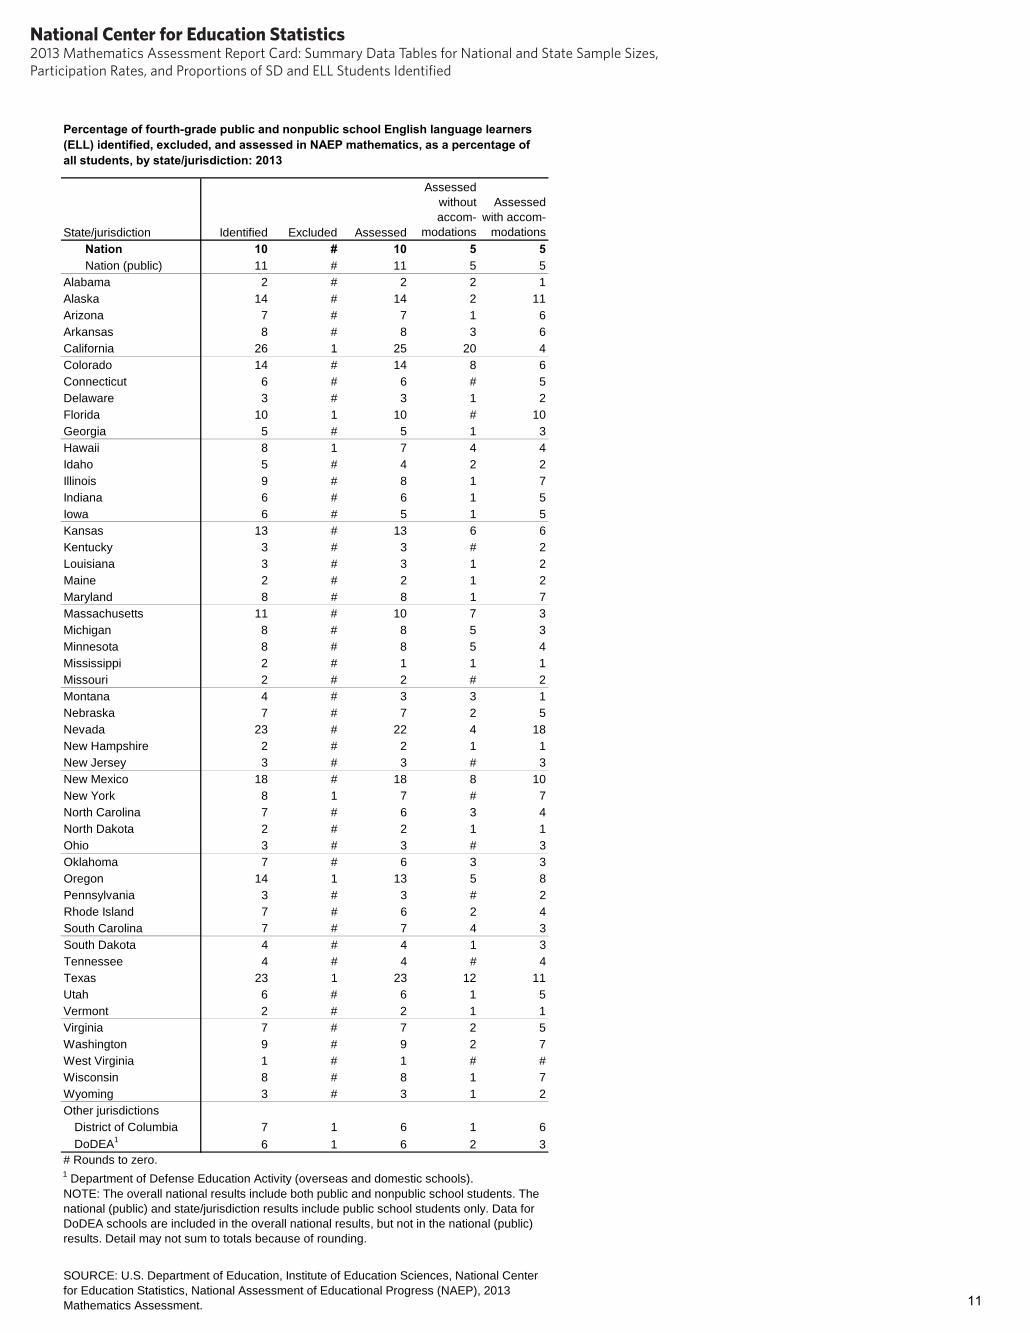
Percentage of fourth-grade public and nonpublic school English language learners (ELL) identified, excluded, and assessed in NAEP mathematics, as a percentage of all students, by state/jurisdiction: 2013
State/jurisdiction Identified Excluded Assessed
Assessed without accom
modations
Assessed with accom
modations Nation 10 # 10 5 5 Nation (public) 11 # 11 5 5
Alabama 2 # 2 2 1 Alaska 14 # 14 2 11 Arizona 7 # 7 1 6 Arkansas 8 # 8 3 6 California 26 1 25 20 4 Colorado 14 # 14 8 6 Connecticut 6 # 6 # 5 Delaware 3 # 3 1 2 Florida 10 1 10 # 10 Georgia 5 # 5 1 3 Hawaii 8 1 7 4 4 Idaho 5 # 4 2 2 Illinois 9 # 8 1 7 Indiana 6 # 6 1 5 Iowa 6 # 5 1 5 Kansas 13 # 13 6 6 Kentucky 3 # 3 # 2 Louisiana 3 # 3 1 2 Maine 2 # 2 1 2 Maryland 8 # 8 1 7 Massachusetts 11 # 10 7 3 Michigan 8 # 8 5 3 Minnesota 8 # 8 5 4 Mississippi 2 # 1 1 1 Missouri 2 # 2 # 2 Montana 4 # 3 3 1 Nebraska 7 # 7 2 5 Nevada 23 # 22 4 18 New Hampshire 2 # 2 1 1 New Jersey 3 # 3 # 3 New Mexico 18 # 18 8 10 New York 8 1 7 # 7 North Carolina 7 # 6 3 4 North Dakota 2 # 2 1 1 Ohio 3 # 3 # 3 Oklahoma 7 # 6 3 3 Oregon 14 1 13 5 8 Pennsylvania 3 # 3 # 2 Rhode Island 7 # 6 2 4 South Carolina 7 # 7 4 3 South Dakota 4 # 4 1 3 Tennessee 4 # 4 # 4 Texas 23 1 23 12 11 Utah 6 # 6 1 5 Vermont 2 # 2 1 1 Virginia 7 # 7 2 5 Washington 9 # 9 2 7 West Virginia 1 # 1 # # Wisconsin 8 # 8 1 7 Wyoming 3 # 3 1 2 Other jurisdictions
District of Columbia 7 1 6 1 6 DoDEA1 6 1 6 2 3
# Rounds to zero. 1 Department of Defense Education Activity (overseas and domestic schools). NOTE: The overall national results include both public and nonpublic school students. The national (public) and state/jurisdiction results include public school students only. Data for DoDEA schools are included in the overall national results, but not in the national (public) results. Detail may not sum to totals because of rounding.
SOURCE: U.S. Department of Education, Institute of Education Sciences, National Center for Education Statistics, National Assessment of Educational Progress (NAEP), 2013 Mathematics Assessment. 11
National Center for Education Statistics2013 Mathematics Assessment Report Card: Summary Data Tables for National and State Sample Sizes, Participation Rates, and Proportions of SD and ELL Students Identified
12
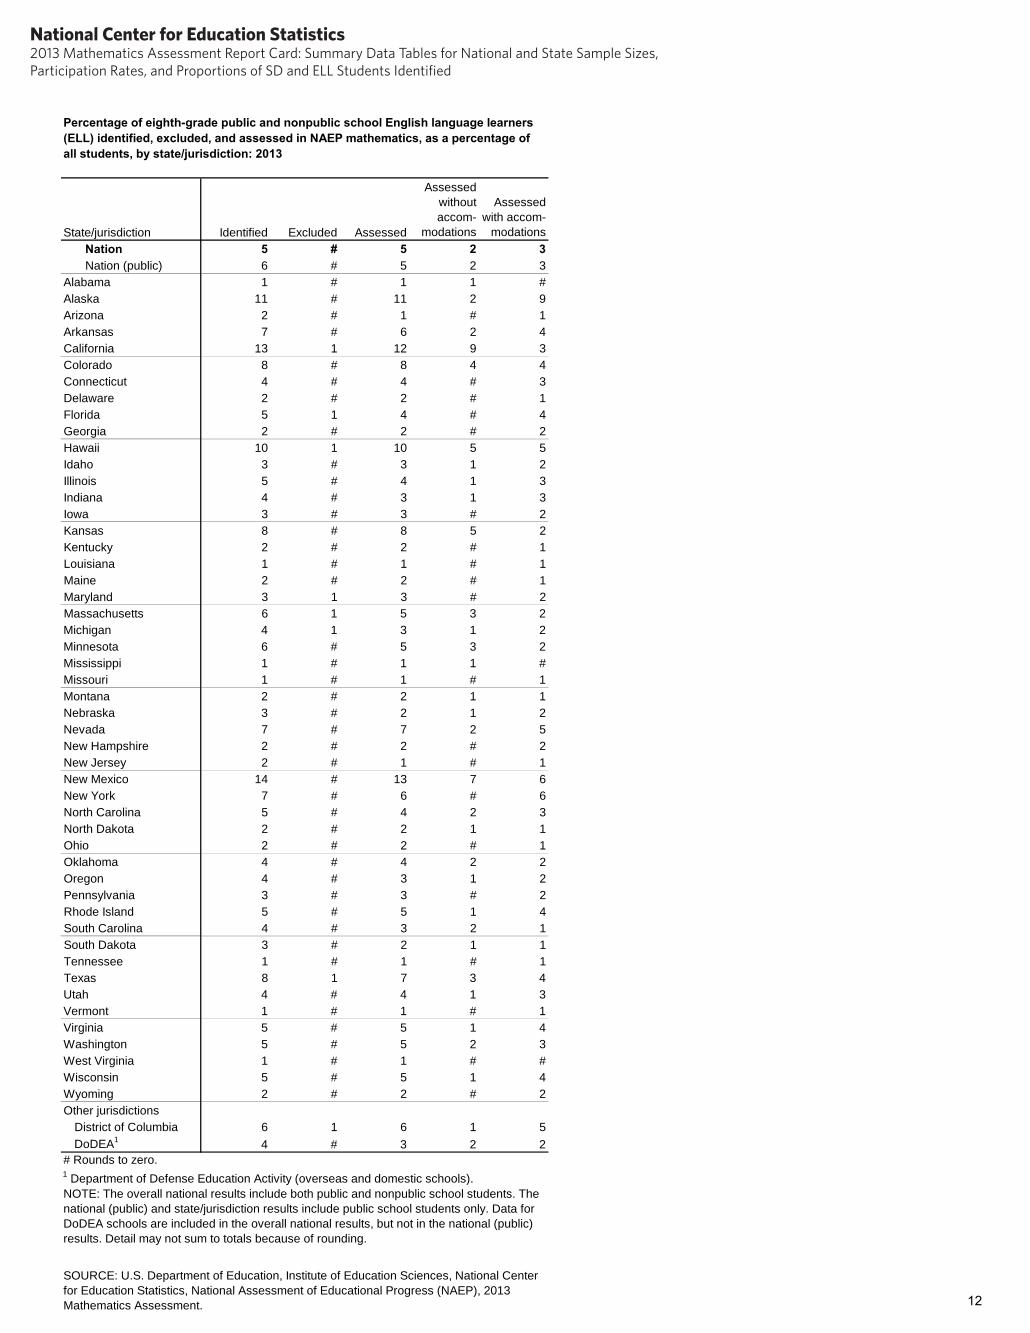
Percentage of eighth-grade public and nonpublic school English language learners (ELL) identified, excluded, and assessed in NAEP mathematics, as a percentage of all students, by state/jurisdiction: 2013
State/jurisdiction Identified Excluded Assessed
Assessed without
accommodations
Assessed with accom
modations Nation 5 # 5 2 3 Nation (public) 6 # 5 2 3
Alabama 1 # 1 1 # Alaska 11 # 11 2 9 Arizona 2 # 1 # 1 Arkansas 7 # 6 2 4 California 13 1 12 9 3 Colorado 8 # 8 4 4 Connecticut 4 # 4 # 3 Delaware 2 # 2 # 1 Florida 5 1 4 # 4 Georgia 2 # 2 # 2 Hawaii 10 1 10 5 5 Idaho 3 # 3 1 2 Illinois 5 # 4 1 3 Indiana 4 # 3 1 3 Iowa 3 # 3 # 2 Kansas 8 # 8 5 2 Kentucky 2 # 2 # 1 Louisiana 1 # 1 # 1 Maine 2 # 2 # 1 Maryland 3 1 3 # 2 Massachusetts 6 1 5 3 2 Michigan 4 1 3 1 2 Minnesota 6 # 5 3 2 Mississippi 1 # 1 1 # Missouri 1 # 1 # 1 Montana 2 # 2 1 1 Nebraska 3 # 2 1 2 Nevada 7 # 7 2 5 New Hampshire 2 # 2 # 2 New Jersey 2 # 1 # 1 New Mexico 14 # 13 7 6 New York 7 # 6 # 6 North Carolina 5 # 4 2 3 North Dakota 2 # 2 1 1 Ohio 2 # 2 # 1 Oklahoma 4 # 4 2 2 Oregon 4 # 3 1 2 Pennsylvania 3 # 3 # 2 Rhode Island 5 # 5 1 4 South Carolina 4 # 3 2 1 South Dakota 3 # 2 1 1 Tennessee 1 # 1 # 1 Texas 8 1 7 3 4 Utah 4 # 4 1 3 Vermont 1 # 1 # 1 Virginia 5 # 5 1 4 Washington 5 # 5 2 3 West Virginia 1 # 1 # # Wisconsin 5 # 5 1 4 Wyoming 2 # 2 # 2 Other jurisdictions
District of Columbia 6 1 6 1 5 DoDEA1 4 # 3 2 2
# Rounds to zero. 1 Department of Defense Education Activity (overseas and domestic schools). NOTE: The overall national results include both public and nonpublic school students. The national (public) and state/jurisdiction results include public school students only. Data for DoDEA schools are included in the overall national results, but not in the national (public) results. Detail may not sum to totals because of rounding.
SOURCE: U.S. Department of Education, Institute of Education Sciences, National Center for Education Statistics, National Assessment of Educational Progress (NAEP), 2013 Mathematics Assessment.
National Center for Education Statistics2013 Mathematics Assessment Report Card: Summary Data Tables for National and State Sample Sizes, Participation Rates, and Proportions of SD and ELL Students Identified
13
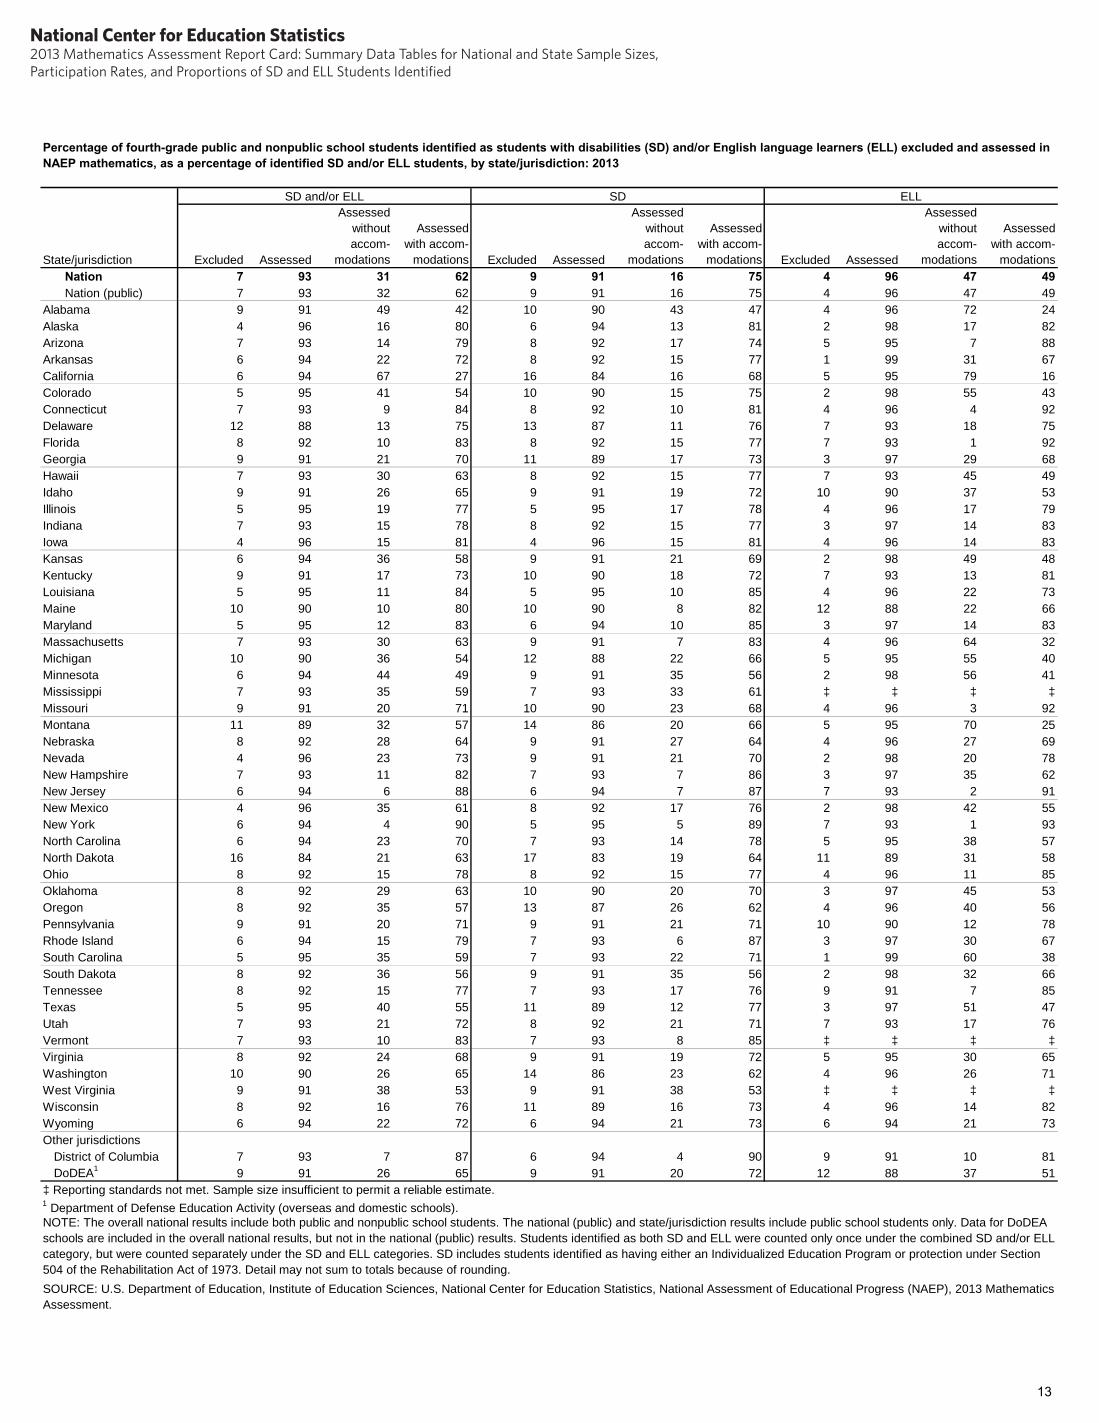
Percentage of fourth-grade public and nonpublic school students identified as students with disabilities (SD) and/or English language learners (ELL) excluded and assessed in NAEP mathematics, as a percentage of identified SD and/or ELL students, by state/jurisdiction: 2013
State/jurisdiction
SD and/or ELL SD ELL
Excluded Assessed
Assessed without accom
modations
Assessed with accom
modations Excluded Assessed
Assessed without accom
modations
Assessed with accom
modations Excluded Assessed
Assessed without accom
modations
Assessed with accom
modations Nation 7 93 31 62 9 91 16 75 4 96 47 49 Nation (public) 7 93 32 62 9 91 16 75 4 96 47 49
Alabama 9 91 49 42 10 90 43 47 4 96 72 24 Alaska 4 96 16 80 6 94 13 81 2 98 17 82 Arizona 7 93 14 79 8 92 17 74 5 95 7 88 Arkansas 6 94 22 72 8 92 15 77 1 99 31 67
California 6 94 67 27 16 84 16 68 5 95 79 16 Colorado 5 95 41 54 10 90 15 75 2 98 55 43 Connecticut 7 93 9 84 8 92 10 81 4 96 4 92 Delaware 12 88 13 75 13 87 11 76 7 93 18 75 Florida 8 92 10 83 8 92 15 77 7 93 1 92 Georgia 9 91 21 70 11 89 17 73 3 97 29 68 Hawaii 7 93 30 63 8 92 15 77 7 93 45 49 Idaho 9 91 26 65 9 91 19 72 10 90 37 53 Illinois 5 95 19 77 5 95 17 78 4 96 17 79 Indiana 7 93 15 78 8 92 15 77 3 97 14 83
Iowa 4 96 15 81 4 96 15 81 4 96 14 83 Kansas 6 94 36 58 9 91 21 69 2 98 49 48
Kentucky 9 91 17 73 10 90 18 72 7 93 13 81 Louisiana 5 95 11 84 5 95 10 85 4 96 22 73 Maine 10 90 10 80 10 90 8 82 12 88 22 66 Maryland 5 95 12 83 6 94 10 85 3 97 14 83 Massachusetts 7 93 30 63 9 91 7 83 4 96 64 32 Michigan 10 90 36 54 12 88 22 66 5 95 55 40 Minnesota 6 94 44 49 9 91 35 56 2 98 56 41 Mississippi 7 93 35 59 7 93 33 61 ‡ ‡ ‡ ‡ Missouri 9 91 20 71 10 90 23 68 4 96 3 92
Montana 11 89 32 57 14 86 20 66 5 95 70 25 Nebraska 8 92 28 64 9 91 27 64 4 96 27 69 Nevada 4 96 23 73 9 91 21 70 2 98 20 78 New Hampshire 7 93 11 82 7 93 7 86 3 97 35 62 New Jersey 6 94 6 88 6 94 7 87 7 93 2 91 New Mexico 4 96 35 61 8 92 17 76 2 98 42 55 New York 6 94 4 90 5 95 5 89 7 93 1 93 North Carolina 6 94 23 70 7 93 14 78 5 95 38 57
North Dakota 16 84 21 63 17 83 19 64 11 89 31 58 Ohio 8 92 15 78 8 92 15 77 4 96 11 85 Oklahoma 8 92 29 63 10 90 20 70 3 97 45 53 Oregon 8 92 35 57 13 87 26 62 4 96 40 56 Pennsylvania 9 91 20 71 9 91 21 71 10 90 12 78 Rhode Island 6 94 15 79 7 93 6 87 3 97 30 67 South Carolina 5 95 35 59 7 93 22 71 1 99 60 38 South Dakota 8 92 36 56 9 91 35 56 2 98 32 66
Tennessee 8 92 15 77 7 93 17 76 9 91 7 85 Texas 5 95 40 55 11 89 12 77 3 97 51 47 Utah 7 93 21 72 8 92 21 71 7 93 17 76 Vermont 7 93 10 83 7 93 8 85 ‡ ‡ ‡ ‡ Virginia 8 92 24 68 9 91 19 72 5 95 30 65
Washington 10 90 26 65 14 86 23 62 4 96 26 71 West Virginia 9 91 38 53 9 91 38 53 ‡ ‡ ‡ ‡ Wisconsin 8 92 16 76 11 89 16 73 4 96 14 82 Wyoming 6 94 22 72 6 94 21 73 6 94 21 73 Other jurisdictions
District of Columbia 7 93 7 87 6 94 4 90 9 91 10 81 DoDEA1 9 91 26 65 9 91 20 72 12 88 37 51
‡ Reporting standards not met. Sample size insufficient to permit a reliable estimate. 1 Department of Defense Education Activity (overseas and domestic schools). NOTE: The overall national results include both public and nonpublic school students. The national (public) and state/jurisdiction results include public school students only. Data for DoDEAschools are included in the overall national results, but not in the national (public) results. Students identified as both SD and ELL were counted only once under the combined SD and/or Ecategory, but were counted separately under the SD and ELL categories. SD includes students identified as having either an Individualized Education Program or protection under Section 504 of the Rehabilitation Act of 1973. Detail may not sum to totals because of rounding.
LL
SOURCE: U.S. Department of Education, Institute of Education Sciences, National Center for Education Statistics, National Assessment of Educational Progress (NAEP), 2013 MathematiAssessment.
cs
National Center for Education Statistics2013 Mathematics Assessment Report Card: Summary Data Tables for National and State Sample Sizes, Participation Rates, and Proportions of SD and ELL Students Identified

Percentage of eighth-grade public and nonpublic school students identified as students with disabilities (SD) and/or English language learners (ELL) excluded and assessed in NAEP mathematics, as a percentage of identified SD and/or ELL students, by state/jurisdiction: 2013
State/jurisdiction
SD and/or ELL SD ELL
Excluded Assessed
Assessed without accom
modations
Assessed with accom
modations Excluded Assessed
Assessed without accom
modations
Assessed with accom
modations Excluded Assessed
Assessed without accom
modations
Assessed with accom
modations Nation 9 91 19 72 10 90 10 80 7 93 40 53 Nation (public) 9 91 20 71 10 90 10 80 7 93 40 53
Alabama 9 91 44 47 9 91 41 50 ‡ ‡ ‡ ‡ Alaska 5 95 14 82 7 93 8 85 2 98 18 80 Arizona 10 90 8 82 8 92 9 83 ‡ ‡ ‡ ‡ Arkansas 10 90 16 74 14 86 5 81 4 96 34 62
California 8 92 52 41 12 88 18 69 6 94 69 26 Colorado 6 94 28 65 10 90 11 79 3 97 49 49 Connecticut 12 88 10 78 12 88 10 78 9 91 8 83 Delaware 8 92 5 87 7 93 4 89 ‡ ‡ ‡ ‡ Florida 10 90 3 87 9 91 4 87 13 87 1 87 Georgia 12 88 15 73 11 89 16 73 12 88 8 80 Hawaii 8 92 33 59 8 92 20 72 8 92 44 47 Idaho 9 91 18 72 12 88 11 77 3 97 34 63 Illinois 6 94 12 82 6 94 7 87 5 95 24 71 Indiana 9 91 11 80 11 89 9 80 ‡ ‡ ‡ ‡
Iowa 5 95 7 88 6 94 5 89 1 99 19 79 Kansas 9 91 34 58 12 88 11 77 1 99 68 30
Kentucky 16 84 6 78 17 83 4 79 11 89 15 74 Louisiana 7 93 5 88 7 93 3 90 ‡ ‡ ‡ ‡ Maine 7 93 12 81 7 93 11 83 ‡ ‡ ‡ ‡ Maryland 11 89 5 84 9 91 3 88 17 83 12 71 Massachusetts 9 91 17 74 8 92 4 87 13 87 53 34 Michigan 16 84 18 67 15 85 14 71 16 84 31 53 Minnesota 9 91 39 51 12 88 29 59 5 95 60 36 Mississippi 9 91 21 70 9 91 16 75 ‡ ‡ ‡ ‡ Missouri 10 90 12 79 10 90 9 81 ‡ ‡ ‡ ‡
Montana 11 89 18 70 12 88 13 75 ‡ ‡ ‡ ‡ Nebraska 12 88 13 75 12 88 11 77 10 90 21 69 Nevada 7 93 18 75 7 93 13 80 4 96 25 71 New Hampshire 5 95 14 81 5 95 13 82 ‡ ‡ ‡ ‡ New Jersey 9 91 2 89 7 93 1 91 ‡ ‡ ‡ ‡ New Mexico 7 93 42 51 11 89 24 64 2 98 53 45
New York 9 91 1 90 10 90 1 90 6 94 1 92 North Carolina 7 93 17 76 7 93 10 82 6 94 33 61
North Dakota 19 81 8 73 19 81 6 75 15 85 24 61 Ohio 9 91 6 85 10 90 5 85 3 97 17 80 Oklahoma 9 91 17 75 9 91 10 81 8 92 44 49 Oregon 9 91 25 66 10 90 21 69 3 97 33 63 Pennsylvania 9 91 12 79 9 91 12 80 11 89 13 77 Rhode Island 6 94 11 83 5 95 9 87 8 92 16 76 South Carolina 9 91 27 64 10 90 18 72 5 95 56 39 South Dakota 10 90 25 65 10 90 21 69 9 91 38 53
Tennessee 14 86 6 80 14 86 6 80 ‡ ‡ ‡ ‡ Texas 11 89 21 68 12 88 11 78 10 90 34 56 Utah 11 89 16 73 12 88 11 77 8 92 27 65 Vermont 5 95 11 85 4 96 10 86 ‡ ‡ ‡ ‡ Virginia 6 94 21 73 6 94 17 77 5 95 28 67
Washington 12 88 18 70 14 86 10 76 8 92 33 59 West Virginia 13 87 19 68 13 87 17 69 ‡ ‡ ‡ ‡ Wisconsin 8 92 11 81 10 90 8 82 4 96 17 80 Wyoming 10 90 10 80 10 90 9 81 ‡ ‡ ‡ ‡ Other jurisdictions
District of Columbia 4 96 4 91 2 98 1 97 11 89 14 75 DoDEA1 8 92 24 68 8 92 14 78 13 87 45 43
‡ Reporting standards not met. Sample size insufficient to permit a reliable estimate. 1 Department of Defense Education Activity (overseas and domestic schools). NOTE: The overall national results include both public and nonpublic school students. The national (public) and state/jurisdiction results include public school students only. Data for DoDEA schools are included in the overall national results, but not in the national (public) results. Students identified as both SD and ELL were counted only once under the combined SD and/or ELL category, but were counted separately under the SD and ELL categories. SD includes students identified as having either an Individualized Education Program or protection under Section 504 of the Rehabilitation Act of 1973. Detail may not sum to totals because of rounding. SOURCE: U.S. Department of Education, Institute of Education Sciences, National Center for Education Statistics, National Assessment of Educational Progress (NAEP), 2013 Mathematics Assessment.
14
National Center for Education Statistics2013 Mathematics Assessment Report Card: Summary Data Tables for National and State Sample Sizes, Participation Rates, and Proportions of SD and ELL Students Identified
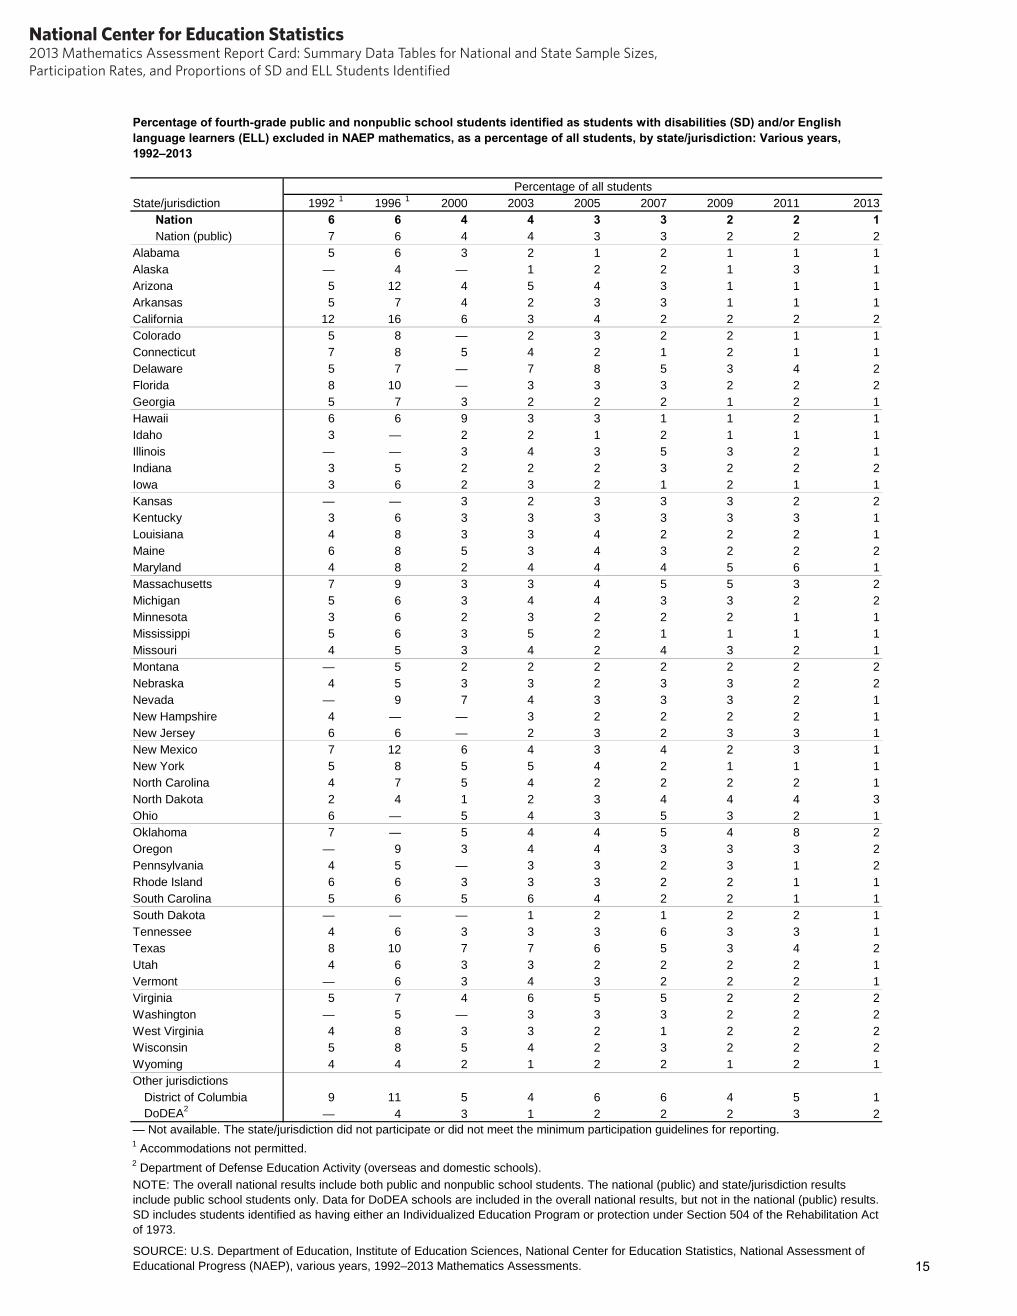
Percentage of fourth-grade public and nonpublic school students identified as students with disabilities (SD) and/or English language learners (ELL) excluded in NAEP mathematics, as a percentage of all students, by state/jurisdiction: Various years, 1992–2013
State/jurisdiction Percentage of all students
1992 1 1996 1 2000 2003 2005 2007 2009 2011 2013 Nation 6 6 4 4 3 3 2 2 1 Nation (public) 7 6 4 4 3 3 2 2 2
Alabama 5 6 3 2 1 2 1 1 1 Alaska — 4 — 1 2 2 1 3 1 Arizona 5 12 4 5 4 3 1 1 1 Arkansas 5 7 4 2 3 3 1 1 1 California 12 16 6 3 4 2 2 2 2 Colorado 5 8 — 2 3 2 2 1 1 Connecticut 7 8 5 4 2 1 2 1 1 Delaware 5 7 — 7 8 5 3 4 2 Florida 8 10 — 3 3 3 2 2 2 Georgia 5 7 3 2 2 2 1 2 1 Hawaii 6 6 9 3 3 1 1 2 1 Idaho 3 — 2 2 1 2 1 1 1 Illinois — — 3 4 3 5 3 2 1 Indiana 3 5 2 2 2 3 2 2 2 Iowa 3 6 2 3 2 1 2 1 1 Kansas — — 3 2 3 3 3 2 2 Kentucky 3 6 3 3 3 3 3 3 1 Louisiana 4 8 3 3 4 2 2 2 1 Maine 6 8 5 3 4 3 2 2 2 Maryland 4 8 2 4 4 4 5 6 1 Massachusetts 7 9 3 3 4 5 5 3 2 Michigan 5 6 3 4 4 3 3 2 2 Minnesota 3 6 2 3 2 2 2 1 1 Mississippi 5 6 3 5 2 1 1 1 1 Missouri 4 5 3 4 2 4 3 2 1 Montana — 5 2 2 2 2 2 2 2 Nebraska 4 5 3 3 2 3 3 2 2 Nevada — 9 7 4 3 3 3 2 1
New Hampshire 4 — — 3 2 2 2 2 1 New Jersey 6 6 — 2 3 2 3 3 1
New Mexico 7 12 6 4 3 4 2 3 1 New York 5 8 5 5 4 2 1 1 1
North Carolina 4 7 5 4 2 2 2 2 1 North Dakota 2 4 1 2 3 4 4 4 3 Ohio 6 — 5 4 3 5 3 2 1 Oklahoma 7 — 5 4 4 5 4 8 2 Oregon — 9 3 4 4 3 3 3 2 Pennsylvania 4 5 — 3 3 2 3 1 2 Rhode Island 6 6 3 3 3 2 2 1 1 South Carolina 5 6 5 6 4 2 2 1 1 South Dakota — — — 1 2 1 2 2 1 Tennessee 4 6 3 3 3 6 3 3 1 Texas 8 10 7 7 6 5 3 4 2 Utah 4 6 3 3 2 2 2 2 1 Vermont — 6 3 4 3 2 2 2 1 Virginia 5 7 4 6 5 5 2 2 2 Washington — 5 — 3 3 3 2 2 2
West Virginia 4 8 3 3 2 1 2 2 2 Wisconsin 5 8 5 4 2 3 2 2 2 Wyoming 4 4 2 1 2 2 1 2 1
Other jurisdictions District of Columbia 9 11 5 4 6 6 4 5 1
DoDEA2 — 4 3 1 2 2 2 3 2 — Not available. The state/jurisdiction did not participate or did not meet the minimum participation guidelines for reporting. 1 Accommodations not permitted. 2 Department of Defense Education Activity (overseas and domestic schools). NOTE: The overall nat ional r esults include both public and nonpublic school s tudents. The national ( public) and state/jurisdiction results include public school s tudents only. Data for DoDEA schools are included in the overall nat ional r esults, but not in the national ( public) results. SD i ncludes students identified as having either an Individualized Education Program or protection under Section 504 of the Rehabilitation Act of 1973.
SOURCE: U.S. Department of Education, Institute of Education Sciences, National C enter for Education Statistics, National A ssessment of Educational P rogress (NAEP), various years, 1992–2013 Mathematics Assessments. 15
National Center for Education Statistics2013 Mathematics Assessment Report Card: Summary Data Tables for National and State Sample Sizes, Participation Rates, and Proportions of SD and ELL Students Identified
Percentage of eighth-grade public and nonpublic school students identified as students with disabilities (SD) and/or English language learners (ELL) excluded in NAEP mathematics, as a percentage of all students, by state/jurisdiction: Various years, 1990–2013
State/jurisdiction Percentage of all students
1990 1 1992 1 1996 1 2000 2003 2005 2007 2009 2011 2013 Nation — 6 4 4 3 3 4 3 2 1 Nation (public) — 6 5 4 4 4 4 3 3 2
Alabama 5 5 7 6 2 1 3 2 1 1 Alaska — — 5 — 1 2 4 3 3 1 Arizona 5 6 9 3 4 5 3 2 1 1 Arkansas 7 6 7 2 2 3 2 1 1 2 California 7 8 10 4 3 2 2 2 1 1 Colorado 4 4 4 — 2 3 2 2 1 1 Connecticut 6 7 8 6 4 3 2 2 1 2 Delaware 4 4 9 — 9 11 7 3 3 1 Florida 6 6 10 — 3 3 3 2 2 2 Georgia 3 5 7 5 2 2 5 3 3 2 Hawaii 4 5 5 5 4 3 2 2 2 2 Idaho 2 3 — 2 1 2 2 1 1 1 Illinois 5 — — 5 4 3 6 3 2 1 Indiana 5 5 6 3 2 4 6 4 3 2 Iowa 4 4 5 — 2 3 2 3 1 1 Kansas — — — 3 3 4 4 3 1 2 Kentucky 5 5 5 4 4 3 7 5 3 2 Louisiana 4 4 6 3 5 4 3 2 1 1 Maine — 4 5 3 4 5 5 2 2 1 Maryland 4 5 7 3 4 4 7 7 6 2 Massachusetts — 8 8 3 3 6 9 6 4 2 Michigan 4 6 5 4 5 4 5 3 4 2 Minnesota 3 3 3 2 2 2 2 3 2 2 Mississippi — 7 7 5 5 3 2 2 1 1 Missouri — 4 7 3 4 4 5 3 1 1 Montana 2 — 3 2 2 2 3 3 2 1 Nebraska 3 4 4 4 4 1 3 3 4 2 Nevada — — 8 4 2 2 4 2 3 1 New Hampshire 4 5 4 — 3 2 3 3 2 1 New Jersey 7 7 7 — 2 4 3 2 4 2 New Mexico 6 5 8 7 2 3 3 3 2 2 New York 6 8 8 4 5 4 3 3 1 2 North Carolina 3 3 4 5 4 3 2 2 2 1 North Dakota 3 2 3 2 1 4 6 5 4 3 Ohio 5 6 — 4 5 6 7 5 5 2 Oklahoma 5 6 — 4 2 4 8 6 10 2 Oregon 3 — 4 3 3 3 3 3 1 1 Pennsylvania 5 4 — — 2 3 4 3 2 2 Rhode Island 6 5 7 3 4 3 3 2 1 1 South Carolina — 6 6 4 7 6 5 4 4 1 South Dakota — — — — 2 2 2 2 2 1 Tennessee — 5 4 2 3 5 6 4 4 2 Texas 6 7 9 8 7 6 6 5 5 2 Utah — 4 6 3 3 2 3 3 3 2 Vermont — — 4 3 3 4 4 2 1 1 Virginia 5 5 7 6 7 5 7 4 3 1 Washington — — 6 — 2 2 4 2 2 2 West Virginia 5 6 8 3 3 3 2 2 2 2 Wisconsin 4 4 7 4 3 4 5 3 2 2 Wyoming 3 4 2 1 1 2 2 2 1 2 Other jurisdictions
District of Columbia 5 10 10 6 6 6 10 6 4 1 DoDEA2 — — 3 1 1 2 2 2 3 1
— Not available. The state/jurisdiction did not participate or did not meet the minimum participation guidelines for reporting. 1 Accommodations not permitted. 2 Department of Defense Education Activity (overseas and domestic schools). NOTE: The overall national results include both public and nonpublic school students. The national (public) and state/jurisdiction results include public school students only. Data for DoDEA schools are included in the overall national results, but not in the national (public) results. SD includes students identified as having either an Individualized Education Program or protection under Section 504 of the Rehabilitation Act of 1973.
SOURCE: U.S. Department of Education, Institute of Education Sciences, National Center for Education Statistics, National Assessment of Educational Progress (NAEP), various years, 1990–2013 Mathematics Assessments.
16
National Center for Education Statistics2013 Mathematics Assessment Report Card: Summary Data Tables for National and State Sample Sizes, Participation Rates, and Proportions of SD and ELL Students Identified
Percentage of fourth-grade public and nonpublic school students with disabilities (SD) excluded in NAEP mathematics, as a percentage of identified SD students, by state/jurisdiction: Various years, 1992–2013
State/jurisdiction Percentage of identified SD students
1992 1 1996 1 2000 2003 2005 2007 2009 2011 2013 Nation 63 43 26 21 19
19 15 15 9
Nation (public) 63 42 26 19
22 20 16 15 9 Alabama 44 54 25 14 11 12 9 11 10 Alaska — 27 — 6 7 9 7 14 6 Arizona 47 68 24 28 23 19 10 9 8 Arkansas 48 69 31 10 16 20 11 7 8 California 43 60 39 20 22 17 21 14 16 Colorado 50 56 — 13 15 13 13 10 10 Connecticut 42 50 31 25 14 10 14 9 8 Delaware 44 49 — 38 43 29 20 20 13 Florida 51 52 — 12 12 13 10 8 8 Georgia 53 52 27 13 13 17 11 13 11 Hawaii 46 47 46 15 15 10 11 16 8 Idaho 36 — 9 8 8 14 10 10 9 Illinois — — 18 17 15 23 12 14 5 Indiana 50 46 19 14 8 15 15 13 8 Iowa 36 44 11 16 12 10 12 8 4 Kansas — — 26 10 16 21 20 11 9 Kentucky 39 56 24 21 16 16 19 18 10 Louisiana 53 55 16 13 16 12 9 9 5 Maine 41 51 28 19 18 17 8 9 10 Maryland 33 52 15 23 23 29 32 38 6 Massachusetts 38 49 5 12 18 27 25 14 9 Michigan 69 57 26 32 26 24 18 14 12 Minnesota 43 45 16 16 15 14 11 9 9 Mississippi 73 72 46 52 19 8 8 8 7 Missouri 37 35 15 21 13 23 18 12 10 Montana — 49 13 13 17 19 14 13 14 Nebraska 32 31 15 15 12 14 13 8 9 Nevada — 56 34 20 21 17 19 20 9 New Hampshire 31 — — 14 11 11 11 10 7 New Jersey 41 57 — 11 13 13 15 18 6 New Mexico 51 60 33 12 12 21 15 16 8 New York 48 54 21 21 18 10 6 6 5 North Carolina 30 52 31 21 14 11 13 11 7 North Dakota 20 33 13 11 14 25 23 22 17 Ohio 60 — 38 34 27 30 20 15 8 Oklahoma 61 — 28 19 22 33 26 51 10 Oregon — 47 14 20 23 15 14 15 13 Pennsylvania 38 49 — 17 15 15 16 9 9 Rhode Island 35 36 11 9 12 10 9 6 7 South Carolina 48 45 30 36 27 12 12 9 7 South Dakota — — — 9 9 8 13 11 9 Tennessee 34 47 23 18 24 41 24 24 7 Texas 50 57 41 47 39 39 28 36 11 Utah 40 43 29 17 13 16 16 14 8 Vermont — 43 18 23 20 14 11 8 7 Virginia 47 51 23 34 28 27 14 15 9 Washington — 44 — 16 15 15 13 12 14 West Virginia 51 62 21 19 11 8 9 8 9 Wisconsin 50 71 30 21 13 15 14 12 11 Wyoming 37 33 13 7 8 11 7 10 6 Other jurisdictions
District of Columbia 84 83 25 28 32 35 27 30 6 DoDEA2 — 46 23 10 11 8 12 13 9
— Not available. The state/jurisdiction did not participate or did not meet the minimum participation guidelines for reporting. 1 Accommodations not permitted. 2 Department of Defense Education Activity (overseas and domestic schools). NOTE: The overall national results include both public and nonpublic school students. The national (public) and state/jurisdiction results include public school students only. Data for DoDEA schools are included in the overall national results, but not in the national (public) results. SD includes students identified as having either an Individualized Education Program or protection under Section 504 of the Rehabilitation Act of 1973.
SOURCE: U.S. Department of Education, Institute of Education Sciences, National Center for Education Statistics, National Assessment of Educational Progress (NAEP), various years, 1992–2013 Mathematics Assessments.
17
National Center for Education Statistics2013 Mathematics Assessment Report Card: Summary Data Tables for National and State Sample Sizes, Participation Rates, and Proportions of SD and ELL Students Identified
Percentage of eighth-grade public and nonpublic school students with disabilities (SD) excluded in NAEP mathematics, as a percentage of identified SD students, by state/jurisdiction: Various years, 1990–2013
State/jurisdiction Percentage of identified SD students
1990 1 1992 1 1996 1 2000 2003 2005 2007 2009 2011 2013 Nation — 59 45 31 22 23 29 22 19 10 Nation (public) — 61 47 32 22 24 30 22 19 10
Alabama 56 53 53 46 15 8 24 13 11 9 Alaska — — 45 — 6 15 31 25 23 7 Arizona 51 62 55 19 23 29 27 16 11 8 Arkansas 70 57 64 14 10 20 18 9 11 14 California 47 49 55 28 13 17 17 15 9 12 Colorado 42 44 37 — 11 18 15 16 8 10 Connecticut 59 45 52 35 23 18 10 14 10 12 Delaware 41 42 68 — 51 66 43 15 21 7 Florida 55 52 59 — 13 15 17 13 11 9 Georgia 49 61 66 39 15 19 50 23 26 11 Hawaii 49 40 47 27 17 16 10 11 9 8 Idaho 35 43 — 14 6 15 14 15 14 12 Illinois 54 — — 30 24 17 35 20 15 6 Indiana 67 53 46 25 17 23 36 31 17 11 Iowa 38 40 41 — 14 16 15 16 9 6 Kansas — — — 26 18 24 30 24 11 12 Kentucky 63 52 49 32 31 28 49 37 27 17 Louisiana 63 62 64 20 28 30 26 11 10 7 Maine — 41 43 18 23 25 29 12 8 7 Maryland 42 43 52 16 25 33 62 56 51 9 Massachusetts — 44 44 11 14 33 51 28 18 8 Michigan 51 64 61 34 33 31 32 24 26 15 Minnesota 31 47 27 9 14 16 17 17 14 12 Mississippi — 73 60 52 53 32 22 17 14 9 Missouri — 40 59 19 23 28 35 26 10 10 Montana 37 — 35 20 14 17 22 22 13 12 Nebraska 33 38 35 28 19 9 17 23 24 12 Nevada — — 55 22 16 19 28 22 28 7 New Hampshire 36 43 25 — 17 12 17 14 9 5 New Jersey 55 49 51 — 7 17 18 11 24 7 New Mexico 68 42 36 39 10 14 18 22 14 11 New York 53 62 55 24 25 19 22 14 7 10 North Carolina 34 26 45 30 21 15 14 12 12 7 North Dakota 34 33 34 15 11 26 43 34 30 19 Ohio 67 63 — 39 38 40 48 33 34 10 Oklahoma 66 65 — 28 13 25 56 41 60 9 Oregon 32 — 33 16 18 19 24 20 10 10 Pennsylvania 50 49 — — 9 20 24 19 15 9 Rhode Island 42 35 41 16 13 15 13 10 6 5 South Carolina — 60 57 30 47 41 40 32 32 10 South Dakota — — — — 16 17 22 17 12 10 Tennessee — 48 38 17 18 32 53 36 31 14 Texas 57 54 57 50 41 41 44 39 42 12 Utah — 46 49 23 20 19 24 27 25 12 Vermont — — 35 16 17 21 22 11 6 4 Virginia 53 47 56 43 39 30 43 24 19 6 Washington — — 45 — 13 17 28 19 12 14 West Virginia 58 59 67 18 17 17 11 10 11 13 Wisconsin 54 47 61 24 17 22 28 16 14 10 Wyoming 42 45 18 9 7 11 14 13 10 10 Other jurisdictions
District of Columbia 86 85 80 41 32 30 56 34 22 2 DoDEA2 — — 33 16 10 13 9 13 16 8
— Not available. The state/jurisdiction did not participate or did not meet the minimum participation guidelines for reporting. 1 Accommodations not permitted. 2 Department of Defense Education Activity (overseas and domestic schools). NOTE: The overall national results include both public and nonpublic school students. The national (public) and state/jurisdiction results include public school students only. Data for DoDEA schools are included in the overall national results, but not in the national (public) results. SD includes students identified as having either an Individualized Education Program or protection under Section 504 of the Rehabilitation Act of 1973.
SOURCE: U.S. Department of Education, Institute of Education Sciences, National Center for Education Statistics, National Assessment of Educational Progress (NAEP), various years, 1990–2013 Mathematics Assessments.
18
National Center for Education Statistics2013 Mathematics Assessment Report Card: Summary Data Tables for National and State Sample Sizes, Participation Rates, and Proportions of SD and ELL Students Identified
Percentage of fourth-grade public and nonpublic school English language learners (ELL) excluded in NAEP mathematics, as a percentage of identified ELL students, by state/jurisdiction: Various years, 1992–2013
State/jurisdiction Percentage of identified ELL students
1992 1 1996 1 2000 2003 2005 2007 2009 2011 2013 Nation 67 39 18 14 12 8 6 4 4 Nation (public) 67 39 18 14 12 8 6 4 4
Alabama ‡ ‡ ‡ ‡ ‡ 11 3 ‡ 4 Alaska — 18 — 1 4 3 3 8 2 Arizona 25 54 16 12 11 10 2 1 5 Arkansas ‡ ‡ ‡ 27 35 8 3 2 1 California 45 47 11 7 8 3 4 2 5 Colorado ‡ ‡ — 8 8 3 4 1 2 Connecticut 65 ‡ ‡ 29 11 3 13 3 4 Delaware ‡ ‡ — 36 28 23 7 12 7 Florida 49 54 — 17 17 20 5 4 7 Georgia ‡ ‡ ‡ 14 19 9 3 5 3 Hawaii 37 29 44 26 14 5 4 3 7 Idaho ‡ — ‡ 12 6 3 3 7 10 Illinois — — 24 26 10 16 15 7 4 Indiana ‡ ‡ ‡ 12 17 8 4 2 3 Iowa ‡ ‡ ‡ 24 7 4 6 6 4 Kansas — — ‡ 16 16 6 5 2 2 Kentucky ‡ ‡ ‡ 31 ‡ 11 13 27 7 Louisiana ‡ ‡ ‡ ‡ ‡ ‡ # 1 4 Maine ‡ ‡ ‡ ‡ ‡ ‡ ‡ 2 12 Maryland ‡ ‡ ‡ 38 22 13 15 14 3 Massachusetts 45 ‡ ‡ 22 20 16 13 11 4 Michigan ‡ ‡ ‡ 16 17 9 8 6 5 Minnesota ‡ ‡ ‡ 10 9 8 6 2 2 Mississippi ‡ ‡ ‡ ‡ ‡ ‡ ‡ ‡ ‡ Missouri ‡ ‡ ‡ 24 17 ‡ ‡ 1 4 Montana — ‡ ‡ 4 4 6 6 ‡ 5 Nebraska ‡ ‡ ‡ 21 8 7 5 3 4 Nevada — 54 38 15 9 9 5 2 2 New Hampshire ‡ — — 24 13 13 11 7 3 New Jersey 67 ‡ — 22 24 11 20 11 7 New Mexico 39 52 11 9 6 9 4 7 2 New York 44 52 47 44 20 12 8 6 7 North Carolina ‡ ‡ ‡ 16 11 8 4 5 5 North Dakota ‡ ‡ ‡ 8 ‡ 22 ‡ 15 11 Ohio ‡ — ‡ 35 26 27 14 6 4 Oklahoma ‡ — ‡ 15 13 8 6 14 3 Oregon — 50 22 12 10 7 6 6 4 Pennsylvania ‡ ‡ — 39 20 10 11 5 10 Rhode Island 47 31 18 23 13 11 9 2 3 South Carolina ‡ ‡ ‡ 22 ‡ 5 5 1 1 South Dakota — — — 7 12 5 ‡ 3 2 Tennessee ‡ ‡ ‡ ‡ 25 15 6 8 9 Texas 41 34 13 13 14 10 5 5 3 Utah ‡ ‡ 11 12 9 5 6 6 7 Vermont — ‡ ‡ 23 ‡ 8 ‡ ‡ ‡ Virginia ‡ ‡ 43 29 9 14 5 5 5 Washington — ‡ — 16 13 9 4 4 4 West Virginia ‡ ‡ ‡ ‡ ‡ ‡ ‡ ‡ ‡ Wisconsin ‡ ‡ 14 15 13 11 10 3 4 Wyoming ‡ ‡ ‡ 2 8 5 ‡ 4 6 Other jurisdictions
District of Columbia 70 76 30 20 22 25 14 12 9 DoDEA2 — ‡ ‡ 13 12 21 14 22 12
— Not available. The state/jurisdiction did not participate or did not meet the minimum participation guidelines for reporting. # Rounds to zero. ‡ Reporting standards not met. Sample size insufficient to permit a reliable estimate. 1 Accommodations not permitted. 2 Department of Defense Education Activity (overseas and domestic schools). NOTE: The overall national results include both public and nonpublic school students. The national (public) and state/jurisdiction results include public school students only. Data for DoDEA schools are included in the overall national results, but not in the national (public) results.
SOURCE: U.S. Department of Education, Institute of Education Sciences, National Center for Education Statistics, National Assessment of Educational Progress (NAEP), various years, 1992–2013 Mathematics Assessments.
19
National Center for Education Statistics2013 Mathematics Assessment Report Card: Summary Data Tables for National and State Sample Sizes, Participation Rates, and Proportions of SD and ELL Students Identified
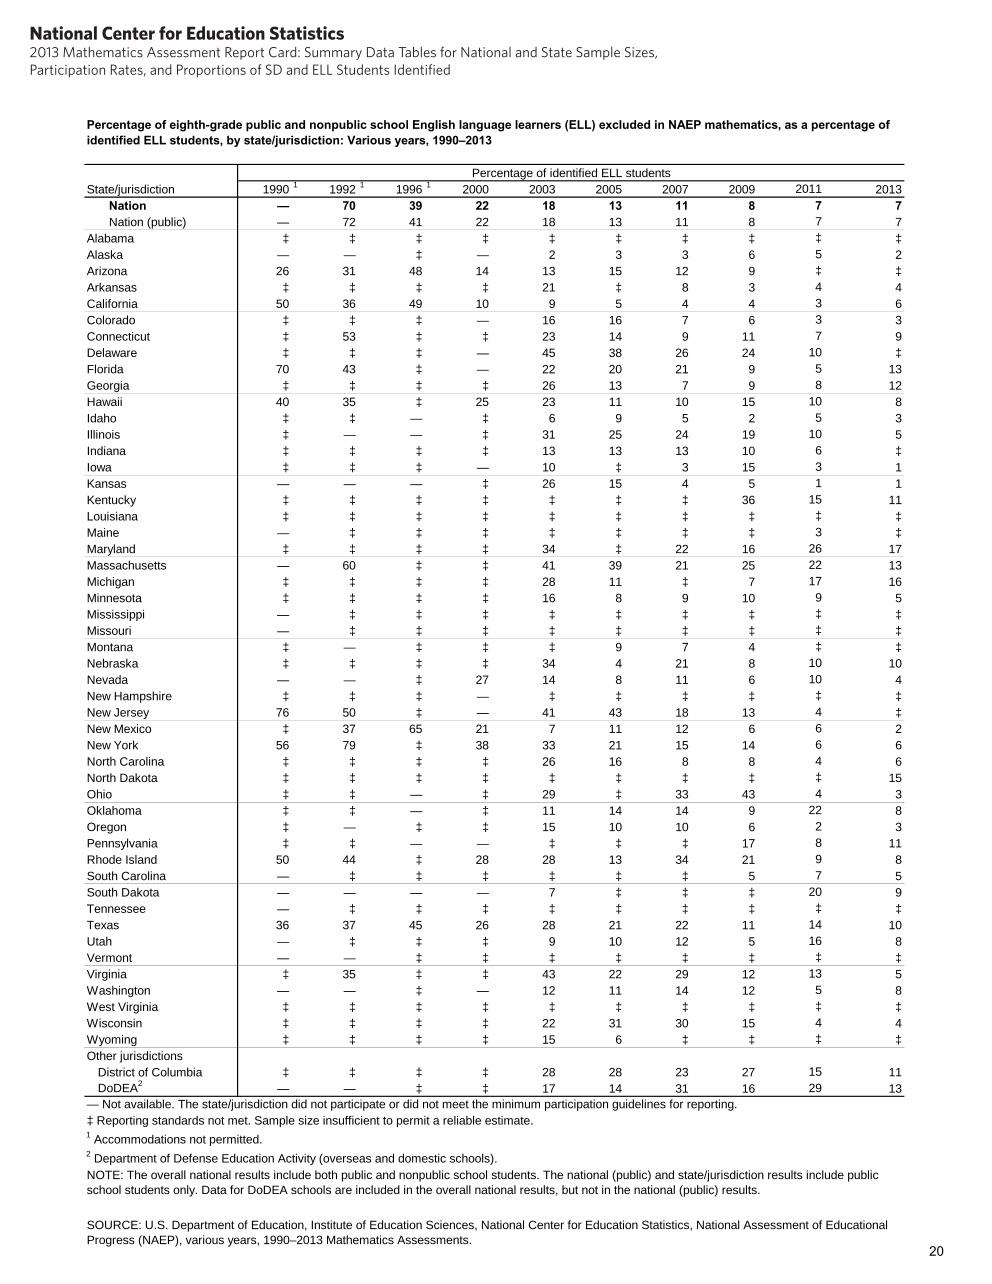
Percentage of eighth-grade public and nonpublic school English language learners (ELL) excluded in NAEP mathematics, as a percentage of identified ELL students, by state/jurisdiction: Various years, 1990–2013
State/jurisdiction Percentage of identified ELL students
1990 1 1992 1 1996 1 2000 2003 2005 2007 2009 2011 2013 Nation — 70 39 22 18 13 11 8 7 7 Nation (public) — 72 41 22 18 13 11 8 7 7
Alabama ‡ ‡ ‡ ‡ ‡ ‡ ‡ ‡ ‡ ‡ Alaska — — ‡ — 2 3 3 6 5 2 Arizona 26 31 48 14 13 15 12 9 ‡ ‡ Arkansas ‡ ‡ ‡ ‡ 21 ‡ 8 3 4 4 California 50 36 49 10 9 5 4 4 3 6 Colorado ‡ ‡ ‡ — 16 16 7 6 3 3 Connecticut ‡ 53 ‡ ‡ 23 14 9 11 7 9 Delaware ‡ ‡ ‡ — 45 38 26 24 10 ‡ Florida 70 43 ‡ — 22 20 21 9 5 13 Georgia ‡ ‡ ‡ ‡ 26 13 7 9 8 12 Hawaii 40 35 ‡ 25 23 11 10 15 10 8 Idaho ‡ ‡ — ‡ 6 9 5 2 5 3 Illinois ‡ — — ‡ 31 25 24 19 10 5 Indiana ‡ ‡ ‡ ‡ 13 13 13 10 6 ‡ Iowa ‡ ‡ ‡ — 10 ‡ 3 15 3 1 Kansas — — — ‡ 26 15 4 5 1 1 Kentucky ‡ ‡ ‡ ‡ ‡ ‡ ‡ 36 15 11 Louisiana ‡ ‡ ‡ ‡ ‡ ‡ ‡ ‡ ‡ ‡ Maine — ‡ ‡ ‡ ‡ ‡ ‡ ‡ 3 ‡ Maryland ‡ ‡ ‡ ‡ 34 ‡ 22 16 26 17 Massachusetts — 60 ‡ ‡ 41 39 21 25 22 13 Michigan ‡ ‡ ‡ ‡ 28 11 ‡ 7 17 16 Minnesota ‡ ‡ ‡ ‡ 16 8 9 10 9 5 Mississippi — ‡ ‡ ‡ ‡ ‡ ‡ ‡ ‡ ‡ Missouri — ‡ ‡ ‡ ‡ ‡ ‡ ‡ ‡ ‡ Montana ‡ — ‡ ‡ ‡ 9 7 4 ‡ ‡ Nebraska ‡ ‡ ‡ ‡ 34 4 21 8 10 10 Nevada — — ‡ 27 14 8 11 6 10 4 New Hampshire ‡ ‡ ‡ — ‡ ‡ ‡ ‡ ‡ ‡ New Jersey 76 50 ‡ — 41 43 18 13 4 ‡ New Mexico ‡ 37 65 21 7 11 12 6 6 2 New York 56 79 ‡ 38 33 21 15 14 6 6 North Carolina ‡ ‡ ‡ ‡ 26 16 8 8 4 6 North Dakota ‡ ‡ ‡ ‡ ‡ ‡ ‡ ‡ ‡ 15 Ohio ‡ ‡ — ‡ 29 ‡ 33 43 4 3 Oklahoma ‡ ‡ — ‡ 11 14 14 9 22 8 Oregon ‡ — ‡ ‡ 15 10 10 6 2 3 Pennsylvania ‡ ‡ — — ‡ ‡ ‡ 17 8 11 Rhode Island 50 44 ‡ 28 28 13 34 21 9 8 South Carolina — ‡ ‡ ‡ ‡ ‡ ‡ 5 7 5 South Dakota — — — — 7 ‡ ‡ ‡ 20 9 Tennessee — ‡ ‡ ‡ ‡ ‡ ‡ ‡ ‡ ‡ Texas 36 37 45 26 28 21 22 11 14 10 Utah — ‡ ‡ ‡ 9 10 12 5 16 8 Vermont — — ‡ ‡ ‡ ‡ ‡ ‡ ‡ ‡ Virginia ‡ 35 ‡ ‡ 43 22 29 12 13 5 Washington — — ‡ — 12 11 14 12 5 8 West Virginia ‡ ‡ ‡ ‡ ‡ ‡ ‡ ‡ ‡ ‡ Wisconsin ‡ ‡ ‡ ‡ 22 31 30 15 4 4 Wyoming ‡ ‡ ‡ ‡ 15 6 ‡ ‡ ‡ ‡ Other jurisdictions
District of Columbia ‡ ‡ ‡ ‡ 28 28 23 27 15 11 DoDEA2 — — ‡ ‡ 17 14 31 16 29 13
— Not available. The state/jurisdiction did not participate or did not meet the minimum participation guidelines for reporting. ‡ Reporting standards not met. Sample size insufficient to permit a reliable estimate. 1 Accommodations not permitted. 2 Department of Defense Education Activity (overseas and domestic schools). NOTE: The overall national results include both public and nonpublic school students. The national (public) and state/jurisdiction results include public school students only. Data for DoDEA schools are included in the overall national results, but not in the national (public) results.
SOURCE: U.S. Department of Education, Institute of Education Sciences, National Center for Education Statistics, National Assessment of Educational Progress (NAEP), various years, 1990–2013 Mathematics Assessments.
20
National Center for Education Statistics2013 Mathematics Assessment Report Card: Summary Data Tables for National and State Sample Sizes, Participation Rates, and Proportions of SD and ELL Students Identified
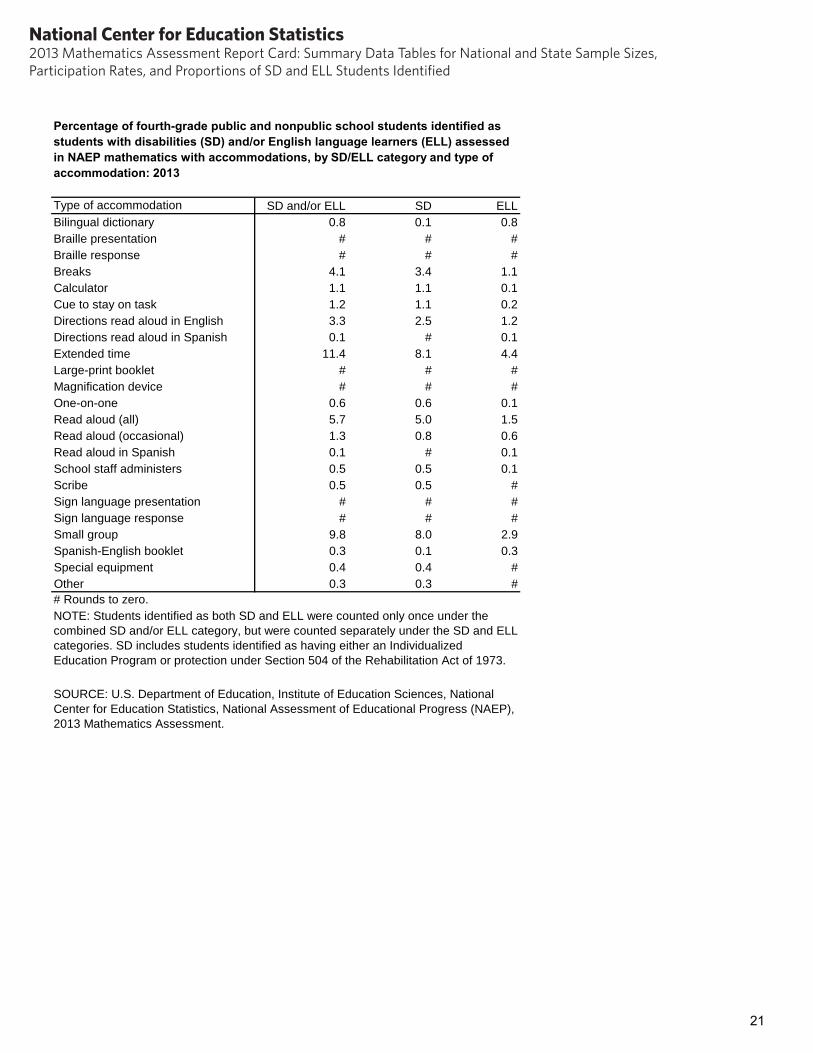
Percentage of fourth-grade public and nonpublic school students identified as students with disabilities (SD) and/or English language learners (ELL) assessed in NAEP mathematics with accommodations, by SD/ELL category and type of accommodation: 2013
Type of accommodation SD and/or ELL SD ELL Bilingual dictionary 0.8 0.1 0.8 Braille presentation # # # Braille response # # # Breaks 4.1 3.4 1.1 Calculator 1.1 1.1 0.1 Cue to stay on task 1.2 1.1 0.2 Directions read aloud in English 3.3 2.5 1.2 Directions read aloud in Spanish 0.1 # 0.1 Extended time 11.4 8.1 4.4 Large-print booklet # # # Magnification device # # # One-on-one 0.6 0.6 0.1 Read aloud (all) 5.7 5.0 1.5 Read aloud (occasional) 1.3 0.8 0.6 Read aloud in Spanish 0.1 # 0.1 School staff administers 0.5 0.5 0.1 Scribe 0.5 0.5 # Sign language presentation # # # Sign language response # # # Small group 9.8 8.0 2.9 Spanish-English booklet 0.3 0.1 0.3 Special equipment 0.4 0.4 # Other 0.3 0.3 # # Rounds to zero. NOTE: Students identified as both SD and ELL were counted only once under the combined SD and/or ELL category, but were counted separately under the SD and ELL categories. SD includes students identified as having either an Individualized Education Program or protection under Section 504 of the Rehabilitation Act of 1973.
SOURCE: U.S. Department of Education, Institute of Education Sciences, National Center for Education Statistics, National Assessment of Educational Progress (NAEP), 2013 Mathematics Assessment.
21
National Center for Education Statistics2013 Mathematics Assessment Report Card: Summary Data Tables for National and State Sample Sizes, Participation Rates, and Proportions of SD and ELL Students Identified
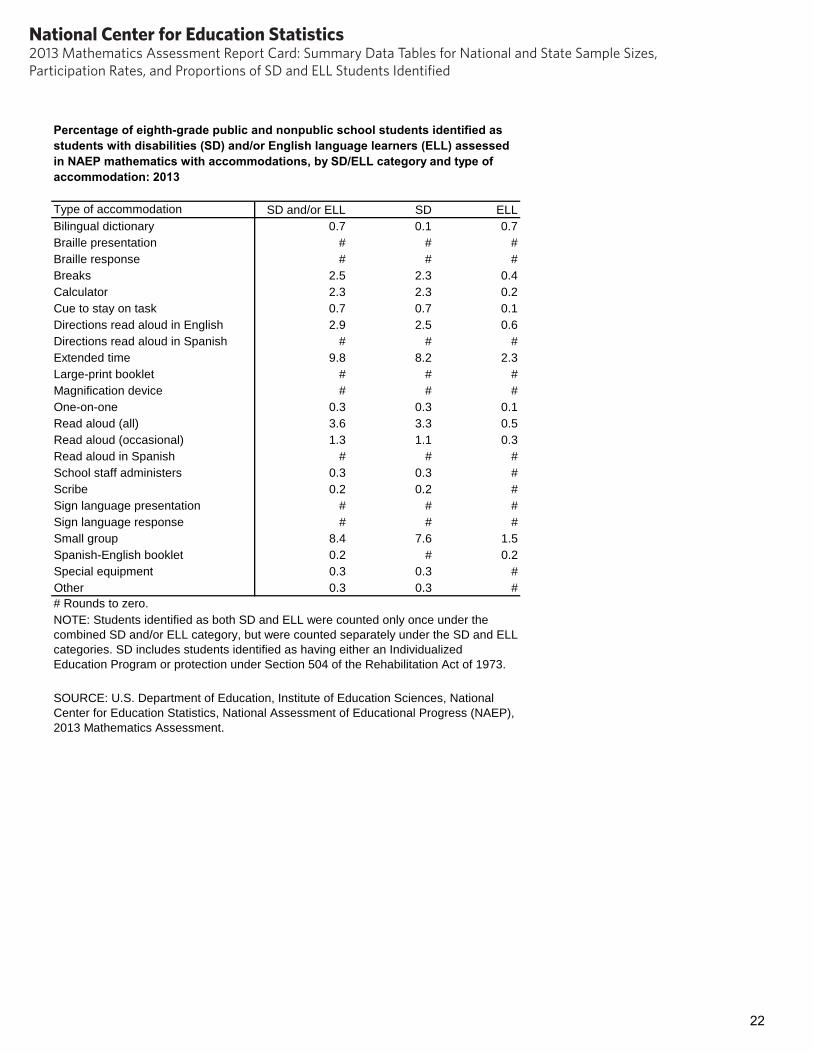
Percentage of eighth-grade public and nonpublic school students identified as students with disabilities (SD) and/or English language learners (ELL) assessed in NAEP mathematics with accommodations, by SD/ELL category and type of accommodation: 2013
Type of accommodation SD and/or ELL SD ELL Bilingual dictionary 0.7 0.1 0.7 Braille presentation # # # Braille response # # # Breaks 2.5 2.3 0.4 Calculator 2.3 2.3 0.2 Cue to stay on task 0.7 0.7 0.1 Directions read aloud in English 2.9 2.5 0.6 Directions read aloud in Spanish # # # Extended time 9.8 8.2 2.3 Large-print booklet # # # Magnification device # # # One-on-one 0.3 0.3 0.1 Read aloud (all) 3.6 3.3 0.5 Read aloud (occasional) 1.3 1.1 0.3 Read aloud in Spanish # # # School staff administers 0.3 0.3 # Scribe 0.2 0.2 # Sign language presentation # # # Sign language response # # # Small group 8.4 7.6 1.5 Spanish-English booklet 0.2 # 0.2 Special equipment 0.3 0.3 # Other 0.3 0.3 # # Rounds to zero. NOTE: Students identified as both SD and ELL were counted only once under the combined SD and/or ELL category, but were counted separately under the SD and ELL categories. SD includes students identified as having either an Individualized Education Program or protection under Section 504 of the Rehabilitation Act of 1973.
SOURCE: U.S. Department of Education, Institute of Education Sciences, National Center for Education Statistics, National Assessment of Educational Progress (NAEP), 2013 Mathematics Assessment.
22
National Center for Education Statistics2013 Mathematics Assessment Report Card: Summary Data Tables for National and State Sample Sizes, Participation Rates, and Proportions of SD and ELL Students Identified