Embed Size (px)
Citation preview
NBER WORKING PAPER SERIES
DOES PROFESSOR QUALITY MATTER? EVIDENCE FROM RANDOM ASSIGNMENTOF STUDENTS TO PROFESSORS
Scott E. CarrellJames E. West
Working Paper 14081http://www.nber.org/papers/w14081
NATIONAL BUREAU OF ECONOMIC RESEARCH1050 Massachusetts Avenue
Cambridge, MA 02138June 2008
Thanks go to USAFA personnel: J. Putnam, D. Stockburger, K. Carson and P. Egleston for assistancein obtaining the data for this project, and to Deb West for many hours entering data from archive. Thanks also go to F. Hoffmann, C. Hoxby, S. Imberman, L. Lefgren, M. Lovenheim, D. Miller, P.Oreopoulos, M. Page, J. Rockoff, and D. Staiger and all seminar participants at the AEFA Meetings,Clemson University, NBER Higher Ed Working Group, Stanford University, and UC Davis for theirhelpful comments. The views expressed in this article are those of the authors and do not necessarilyreflect the official policy or position of the U.S. Air Force, DoD, or the U.S. Government. The viewsexpressed herein are those of the author(s) and do not necessarily reflect the views of the NationalBureau of Economic Research.
NBER working papers are circulated for discussion and comment purposes. They have not been peer-reviewed or been subject to the review by the NBER Board of Directors that accompanies officialNBER publications.
© 2008 by Scott E. Carrell and James E. West. All rights reserved. Short sections of text, not to exceedtwo paragraphs, may be quoted without explicit permission provided that full credit, including © notice,is given to the source.
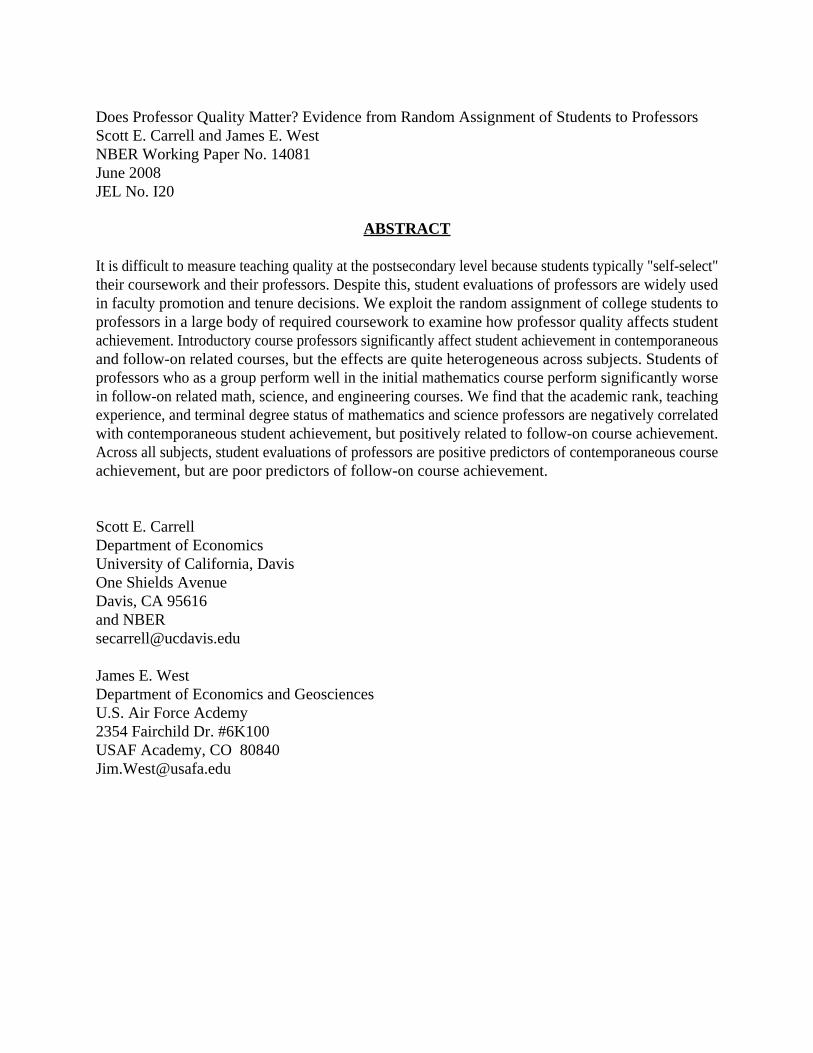
Does Professor Quality Matter? Evidence from Random Assignment of Students to ProfessorsScott E. Carrell and James E. WestNBER Working Paper No. 14081June 2008JEL No. I20
ABSTRACT
It is difficult to measure teaching quality at the postsecondary level because students typically "self-select"their coursework and their professors. Despite this, student evaluations of professors are widely usedin faculty promotion and tenure decisions. We exploit the random assignment of college students toprofessors in a large body of required coursework to examine how professor quality affects studentachievement. Introductory course professors significantly affect student achievement in contemporaneousand follow-on related courses, but the effects are quite heterogeneous across subjects. Students ofprofessors who as a group perform well in the initial mathematics course perform significantly worsein follow-on related math, science, and engineering courses. We find that the academic rank, teachingexperience, and terminal degree status of mathematics and science professors are negatively correlatedwith contemporaneous student achievement, but positively related to follow-on course achievement.Across all subjects, student evaluations of professors are positive predictors of contemporaneous courseachievement, but are poor predictors of follow-on course achievement.
Scott E. CarrellDepartment of EconomicsUniversity of California, DavisOne Shields AvenueDavis, CA 95616and [email protected]
James E. WestDepartment of Economics and GeosciencesU.S. Air Force Acdemy2354 Fairchild Dr. #6K100USAF Academy, CO [email protected]
“A weak faculty operates a weak program that attracts weak students.”(Koerner 1963)
1 Introduction
Conventional wisdom holds that “higher quality” teachers promote better educational outcomes.
Since teacher quality cannot be directly observed, the manner in which it is measured has largely
been driven by data availability. At the elementary and secondary level, scores on standardized
student achievement tests are the primary measure used and have been linked to teacher bonuses
and terminations (Figlio and Kenny 2007). At the post-secondary level, student evaluations of
professors are widely used in faculty promotion and tenure decisions. Both of these measures are
subject to moral hazard. Teachers can “teach to the test”. Professors can inflate grades or reduce
academic content to elevate student evaluations. Given this, how well do each of these measures
correlate with the desired outcome of actual student learning?
Studies have found only mixed evidence regarding the relationship between observable teacher
characteristics and student achievement at the elementary and secondary education levels.1 As
an alternative method, teacher “value-added” models have been used to measure the total teacher
input (observed and unobserved) to student achievement. Several studies find that a one stan-
dard deviation increase in teacher quality improves student test scores by roughly one-tenth of a
standard deviation (Aaronson, Barrow, and Sander 2007, Rockoff 2004, Rivkin, Hanushek, and
Kain 2005, Kane, Rockoff, and Staiger 2006). However, recent evidence from Jacob, Lefgren, and
Sims (2008) and Kane and Staiger (2008) suggests that these contemporaneous teacher effects may
decay relatively quickly over time2 and Rothstein (2008a) and Rothstein (2008b) finds that the
1Jacob and Lefgren (2004) find principal evaluations of teachers were the best predictor of student achievement;
Clotfelter, Ladd, and Vigdor (2006)and Clotfelter, Ladd, and Vigdor (2007) find evidence that National Board
Certification and teacher licensure test scores positively predict teacher effectiveness; Dee (2004) and Dee (2005)
finds students perform better with same race and gender teachers; and Harris and Sass (2007) find some evidence
that teacher professional development is positively correlated with student achievement in middle and high school
math. Goldhaber and Anthony (2007), Cavalluzzo (2004), Vandevoort, Amrein-Beardsley, and Berliner (2004) and
Summers and Wolfe (1977) find positive effects teachers certified by the National Board for Professional Teaching
Standards (NBPTS). Also see: Hanushek (1971), Ferguson and Ladd (1996), Murnane (1975), Summers and Wolfe
(1977), Ehrenberg and Brewer (1994), Aaronson, Barrow, and Sander (2007) and Boyd, Grossman, Lankford, Loeb,
and Wyckoff (2006).2Jacob, Lefgren, and Sims (2008) find that 20-percent of the contemporaneous effects persist into the subsequent
year. Kane and Staiger (2008) find that roughly 50-percent persists into year one and none persists into year two for
mathematics courses.
2
non-random placement of students to teachers may cause large biases in valued-added estimates of
teacher quality.
At the postsecondary level, even less is known about how the quality of instruction affects
student outcomes.3 Standardized achievement tests are not given at the postsecondary level and
grades are not typically a consistent measure of student academic achievement due to heterogeneity
of assignments/exams and the mapping of those assessment tools into final grades across individual
professors. Additionally, it is generally difficult to measure postsecondary outcomes due to issues
with self-selection. That is, in a typical university setting it is difficult to measure how profes-
sors affect student achievement because students generally “self-select” their coursework and their
professors. For example, if better students tend to select better professors, then it is difficult to
statistically separate the teacher effects from the selection effects. As a result, the primary tool used
by administrators to measure professor-teaching quality is scores on subjective student evaluations.
However, a major disadvantage of using student evaluations to measure professor quality is that
student evaluations are likely endogenous with respect to (expected) student grades.
To address these various measurement and selection issues in measuring teacher quality, our
study uses a unique panel dataset from the U.S. Air Force Academy (USAFA) where students are
randomly assigned to professors over a wide variety of standardized core courses.4 The random
assignment of students to professors, along with a vast amount of data on both professors and
students allow us to examine how professor quality affects student achievement free from the usual
problems of self-selection. Grades in USAFA core courses are a consistent measure of student
achievement because faculty members teaching the same course use an identical syllabus and give
the same exams during a common testing period.5 Additionally, USAFA students are required to
take and are randomly assigned to numerous follow-on courses in mathematics, humanities, basic
sciences, and engineering. Performance in these mandatory follow-on courses is arguably a more
relevant measurement of actual student learning. Thus, a distinct advantage of our dataset is that
even if a student has a particularly bad introductory course professor, they still are required to
3Hoffmann and Oreopoulos (Forthcoming) find that perceived professor quality, as measured by teaching evalua-
tions, affects the likelihood of a student dropping a course and taking subsequent courses in the same subject. Other
recent postsecondary studies have focused on the effectiveness of part-time (adjunct) professors. See for example
Ehrenberg and Zhang (2005) and Bettinger and Long (2006).4The USAFA Registrar assigns all students to classes/instructors without input from the affected students or
faculty. The algorithm used to assign students to classrooms ensures a fairly even distribution of females and athletes
across sections within the same course. The one exception is the introductory chemistry course, where the lowest
ability students were ability grouped into separate sections with the most experienced professors.5Common testing periods are used for 100 and 200-level courses.
3
take the follow-on related curriculum.6
These properties enable us to measure professor quality free from selection and attrition bias
using multiple methodologies. As is common in the primary and secondary literature, we first mea-
sure professor quality using a contemporaneous value-added model. We then exploit the random
reassignment of students into follow-on related courses to measure the persistence of the contem-
poraneous professor effects into follow-on achievement As a third methodology, we measure the
total contribution (as opposed to the persistence of the initial course effects) of introductory course
professors to follow-on course achievement using the value-added approach. Fourth, we examine
how professor observable attributes are correlated with both contemporaneous and follow-on stu-
dent achievement. Finally, we examine the correlation between student evaluations of professors
and student academic achievement (both contemporaneous and follow-on). This analysis gives us
a unique opportunity to compare the relationship between value-added models (currently used to
measure primary and secondary teacher quality) and student evaluations (currently used to measure
postsecondary teacher quality).
Our results show there are relatively large and statistically significant differences in student
achievement across professors in the contemporaneous course being taught. A one-standard de-
viation increase in the professor fixed effect results in a 0.08 to 0.21-standard deviation increase
in student achievement. We find that introductory course professors significantly affect student
achievement in follow-on related courses, but these effects are quite heterogeneous across subjects.
Students of professors who as a group perform well in the initial mathematics course also perform
significantly worse in the (mandatory) follow-on related math, science, and engineering courses.
For math and science courses we find that academic rank, teaching experience, and terminal
degree status of professors are negatively correlated with contemporaneous student achievement, but
positively related to follow-on course achievement. That is, students of less experienced instructors
who do not possess terminal degrees perform better in the contemporaneous course being taught,
but perform worse in the follow-on related courses. These results are consistent with recent evidence
by Bettinger and Long (2006) and Ehrenberg and Zhang (2005) who, respectively, find that the
use of adjunct professors have a positive effect on follow-on course interest, but a negative effect on
student graduation. That is, our results are consistent with the hypothesis that less academically
qualified instructors may spur (potentially erroneous) interest in a particular subject through higher
grades, but these students perform significantly worse in follow-on related courses that rely on the
6For example, students of particularly bad Calculus I instructors must still take Calculus II and six engineering
courses, even if they decide to be a humanities major.
4
initial course for content. For humanities courses, we find almost no relationship between professor
observable attributes and student achievement.
The manner in which student grades are determined at USAFA, particularly in the math de-
partment, allows us to rule out potential mechanisms for our results. First, math professors only
grade a small proportion of their own students’ exams, vastly reducing the ability of “easy” or
“hard” grading professors to affect their students’ grades. All math exams are jointly graded by all
professors teaching the course during that semester in “grading parties” where Professor A grades
question 1 and Professor B grades question 2 for all students taking the course. Additionally, all
professors are given copies of the exams for the course prior to the start of the semester. Third, all
final grades in all core courses at USAFA are determined on a single grading scale and are approved
by the chair of the department. These aspects of grading allow us to rule out the possibility that
professors have varying grading standards for equal student performance. Hence, our results are
likely driven by the manner in which the course is taught by each professor.
Finally, we find that student evaluations positively predict student achievement in contempo-
raneous courses, but are very poor predictors of follow-on student achievement. Since many U.S.
colleges and universities use student evaluations as a measurement of teaching quality for academic
promotion and tenure decisions, this latter finding draws into question the value and accuracy of
this practice.
We recognize that questions could be raised about the generalizeability of our findings given
USAFA students are a subset of traditional college students. However, our study would not be
possible without the random assignment of students into course sections and professors, and a large
body of required coursework with multiple follow-on courses. We are not aware of an institution
outside the military service academies with data that would allow a similar clean identification
strategy. Despite the military setting, much about USAFA is comparable to broader academia.
USAFA faculty have earned their graduate degrees from a broad sample of high quality programs in
their respective fields, as would be found in a comparable undergraduate liberal arts college. USAFA
students are drawn from each Congressional district in the US, insuring geographic diversity. In
economic experiments to investigate behavior in real and hypothetical referenda, Burton, Carson,
Chilton, and Hutchinson (2007) find the behavior of USAFA students and students at Queen’s
University, Belfast to be statistically indistinguishable.
The remainder of the paper proceeds as follows. Section II reviews the data. Section III presents
the methods and results for professor value-added models in the contemporaneous course being
taught. Section IV examines the persistence of professor quality into follow-on courses. Section
5
V examines how the observable attributes of professors are correlated with student achievement.
Section VI examines how student evaluations of instructors in correlated with student achievement.
Section VII concludes.
2 Data
The Air Force Academy is a fully accredited undergraduate institution of higher education with an
approximate enrollment of 4, 200 students. There are 32 majors offered including the humanities,
social sciences, basic sciences, and engineering. The average SAT for the 2005 entering class was
1309 with an average high school GPA of 3.60 (Princeton Review 2007). Applicants are selected
for admission on the basis of academic, athletic, and leadership potential. In addition, applicants
must receive a nomination from a legal nominating authority including Members of Congress, the
Vice President, or President of the United States, and other related sources. All students attending
the Air Force Academy receive 100 percent scholarship to cover their tuition, room, and board.
Additionally, each student receives a monthly stipend of $845 to cover books, uniforms, computer,
and other living expenses. All students are required to graduate within four years7 and serve a
five-year commitment as a commissioned officer in the United States Air Force following graduation.
2.1 The Dataset
Our dataset consists of 12, 568 students who attended USAFA from the fall of 1997 through the
spring of 2007. Data for each student’s high school (pre-treatment) characteristics and their achieve-
ment while at the USAFA were provided by USAFA Institutional Research and Assessment and
were stripped of individual identifiers by the USAFA Institutional Review Board. Approximately,
seventeen-percent of the sample is female, five-percent is black, seven-percent is Hispanic and five-
percent is Asian. Twenty-six percent are recruited athletes and 20-percent attended a military
preparatory school. Seven-percent of students at USAFA have a parent who graduated from a
service academy and seventeen-percent have a parent who previously served in the military.
Student-level pre-treatment data includes whether students were recruited as athletes, whether
they attended a military preparatory school, and measures of their academic, athletic and leader-
ship aptitude. Academic aptitude is measured through SAT verbal and SAT math scores and an
academic composite computed by the USAFA admissions office, which is a weighted average of an
7Special exceptions are given for religious missions, medical “set-backs”, and other instances beyond the control
of the individual.
6
individual’s high school GPA, class rank, and the quality of the high school attended. Additionally,
all entering students take a mathematics placement exam upon matriculation, which tests algebra,
trigonometry, and calculus. The sample mean SAT math and SAT verbal are 663 and 632, with
respective standard deviations of 62 and 66. The measure of pre-treatment athletic aptitude is a
score on a fitness test required by all applicants prior to entrance.8 The measure of pre-treatment
leadership aptitude is a leadership composite computed by the USAFA admissions office, which is a
weighted average of high school and community activities (e.g., student council offices, Eagle Scout,
captain of sports team, etc.).
Our outcome measure consists of final grades in core courses for each individual student by
course by section-semester-year. Students at USAFA are required to take a core set of approximately
30 courses in mathematics, basic sciences, social sciences, humanities, and engineering.9 Table 2
provides a complete list of the required core courses at USAFA. Grades are determined on an A,
A-, B+, B · · · C-, D, F scale where an A is worth 4 grade points, an A- is 3.7 grade points, a B+
is 3.3 grade points, etc. The average grade point average for our sample is 2.78. Over the ten-year
period of our study there were 13, 417 separate course-sections taught by 1, 462 different faculty
members. Average class size was 18 students per class and approximately 49 sections of each core
course were taught each year.
Individual professor-level data were obtained from USAFA historical archives and the USAFA
Center for Education Excellence and were matched to the student achievement data for each course
taught by section-semester-year.10 Individual-level professor data includes: academic rank, gender,
education level (M.A. or Ph.D.), years of teaching experience at USAFA, and scores on subjective
student evaluations. On average, each faculty member in our sample is observed teaching nine
different core course sections. Table 1 provides summary statistics of the data.
8Barron, Ewing, and Waddell (2000) found a positive correlation between athletic participation and educational
attainment and Carrell, Fullerton, and West (2008) found a positive correlation between fitness scores and academic
achievement.9Over the period of our study there were some changes made to the core curriculum at USAFA. In total, we
examine student achievement across the 43 different core courses that were taught from 1997-2007.10Due to the sensitivity of the data we were only able to obtain the professor observable data for the mathematics,
history, English, chemistry and physics departments. Due to the large number of faculty in these departments, a set
of demographic characteristics (e.g., female assistant professor, PhD with 3 years of experience) does not uniquely
identify an individual faculty member.
7
2.2 Student Placement into Courses and Sections
Prior to the start of the freshman academic year, students take course placement exams in mathe-
matics, chemistry, and select foreign languages. Scores on these exams are used to place students
into the appropriate starting core courses (i.e., remedial math, Calculus I, Calculus II, etc.). Condi-
tional on course placement, the USAFA Registrar randomly assigns students to core course sections
and with professors.11 Thus, students throughout their four years of study have no ability to choose
their professors in the required core courses. Faculty members teaching the same course use an
identical syllabus and give the same exams during a common testing period. Thus, grades in core
courses are a consistent measure of relative achievement across all students.12 These institutional
characteristics assure there is no self-selection of students into (or out of) courses or towards certain
professors.
To test the randomness of the data across professors teaching core courses, for each course by
semester we regressed individual academic composite on the average peer academic composite for
students in the same course and section while controlling for whether the individual was female or a
recruited athlete.13 If section placements were purely random within each course we would expect
zero correlation between these two variables. In total we estimated 557 course by semester selection
regressions of which 309 (55.5 percent) resulted in negative coefficients and 248 (44.5 percent) in
positive coefficients. Fifty of the 568 regressions (8.9 percent) were statistically significant at the
0.05-level and 15.4 percent at the 0.10-level.14
As a second randomness check, we regressed the mean academic composite for each section on
observable characteristics (e.g., experience, academic rank, etc.) of the professor for each of the
five initial core courses we have professor observable data.15 Again, under random assignment we
11The one exception is introductory chemistry, where the 92 lowest ability freshman students each year are ability
grouped into four separate sections and are taught by the most experienced professors. We excluded these observations
from the entire analysis; however, our results are not sensitive to this restriction. Additionally, students are also
allowed to choose their foreign language and students are not allowed to make any “convenience” changes to their
academic schedule.12The one exception is that in some core courses at USAFA, 5 to 10-percent of the overall course grade is earned
by professor/section specific quizzes and/or class participation.13We included indicator variables for athletes and females as these two groups are spread evenly across sections
within a given course. Standard errors were clustered by course section.14Upon examining the selection regressions we found no discernable pattern to the statistically significant coefficients
across courses or years.15Due to data availability limitations, we were only able to obtain professor attribute data for core courses in math,
English, chemistry, physics, and history. Each selection regression included a semester by year fixed effect to control
8
would expect zero correlation between student and professor pre-treatment characteristics. Table
3, Section A shows results from this analysis. In all courses the statistically insignificant coefficients
indicate there is no systematic relationship between professor and student characteristics.
In Table 3, Section B we also tested our data for any systematic placement of students into
follow-on course sections or with professors. To do so, we regressed student grades in the initial
course on the observable characteristics of the follow-on course professor. Again, results show
there are no systematic correlations between student grades in initial courses and follow-on course
professor characteristics.
3 Professor Value Added in Contemporaneous Courses
3.1 Methods
To measure the total professor value-added, we apply a professor fixed effects16 model similar to
those employed by Rivkin, Hanushek, and Kain (2005), Kane, Rockoff, and Staiger (2006) and
Hoffmann and Oreopoulos (Forthcoming). The professor fixed effects model measures the total
variance in professor inputs (observed and unobserved) measured in student academic achievement
by utilizing the panel structure of our data, where different professors teach multiple sections of
the same course across years. Our dataset includes 13, 417 core course sections taught by 1, 462
different professors. On average we observe each professor teaching 9.18 core-course sections over
the period of our study.
Consider the following model:
Yicjst = φ0 + φ2Xicst + φ3
∑m 6=i
Xmcst
ncst − 1+ λj + γct + εicjst (1)
for mean differences in student characteristics across semesters. We also ran these same regressions for other student
observables such as SAT scores, leadership composite, etc. and found qualitatively similar results.16Random effects estimators are minimum variance unbiased estimators where fixed effects estimators are unbiased
but not minimum variance in panel data models. The necessary condition for use of a random effects model in
this context, that an individual professor’s deviation from the overall effect of professors on student achievement be
uncorrelated with the model error term, is almost certainly violated when students can self-select into professors or
courses, hence the common usage of fixed effects models in this literature. Since self-selection into professors and
courses is not permitted at USAFA, our analysis could theoretically be carried out with random effects estimators.
So that our results can be more directly and easily compared with the existing literature, we chose to present our
main results using the fixed effect framework. However, results for our models are qualitatively similar when using a
random effects model. We show a subset of these results in Table 5. See Raudenbush and Bryk (2002) and McCaffrey,
J.R. Lockwood, Koretz, and Hamilton (2004) for more on this topic.
9
where Yicjst is the grade performance outcome measure for student i in course c with professor
j in section s in semester-year t. Grades are normalized in each course by semester to have a
mean zero and variance of one. Xicst is a vector of student-specific (pre-treatment) characteristics,
including SAT math, SAT verbal, academic composite, math placement test score, fitness score,
leadership composite, race/ethnicity, gender, recruited athlete, and whether they attended a mil-
itary preparatory school.
Pm 6=i
Xmcst
ncst−1 measures the average pre-treatment characteristics of all other
students in individual i’s course and section. This variable is included to control for any potential
classroom peer effects.17 γct are course by semester-year fixed effects, which control for unobserved
mean differences in academic achievement or grading standards across courses and time. Hence,
the model identifies professor quality using only the within course by semester-year variation in
student achievement. εicjst is the error term.
λj , the professor fixed effect, is the primary parameter of interest in our study. High values of
λj indicates that professor j’s students perform better on average and low values of λj indicates
lower average achievement. The variance of λj across professors is of much greater interest than the
actual magnitudes of the λj as it is a measure of the dispersion of professor quality, whether it be
observed or unobserved (Rivkin, Hanushek, and Kain 2005). However, λj must still be estimated.
We could do so directly within the fixed effect model. However, due to sampling error (Rockoff 2004)
and the inefficiency of fixed effects estimators, the estimated variance in the teacher fixed effects
will overstate the true variance in teacher quality. That is, due to the relatively small number
of sections (average of 9) taught by professors in the courses of interest, fixed effects estimators
of λj can be based off very few observations and hence imprecise. Instead, we estimate λj via
the pairwise covariances in professor classroom average residuals similar to Kane, Rockoff, and
Staiger (2006) and Hoffmann and Oreopoulos (Forthcoming). To do so, we estimate equation (1)
while excluding the parameter representing professor fixed effect. We then compute classroom
average residuals, ucjst, for professor j’s students in section s of course c in semester t, where
ucjst = 1ncst
ncst∑i=1
uicjst and uicjst = λj + εicjst. These course by section average residuals contain
individual section average sampling noise plus each professor’s average contribution to the education
production function for each class after controlling for all observable student characteristics. Similar
to previous studies in the primary and secondary literature, we find substantial variation across the
17The role of one’s peers have previously been shown to be an important component in academic achievement in
both primary and secondary education (Hoxby and Weingarth 2006, Graham 2005, Burke and Sass 2004, Betts and
Zau 2004, Lefgren 2004) as well as in both academic achievement (Sacerdote 2001, Zimmerman 2003, Foster 2006,
Lyle 2007, Stinebrickner and Stinebrickner 2006, Carrell, Fullerton, and West 2008) and social outcomes (Kremer
and Levy 2003, Carrell, Malmstrom, and West 2008) in postsecondary education.
10
instructor performance residuals as shown in Table 4. Row 1 shows the raw standard deviation of
the instructor performance residuals across all contemporaneous core courses is 0.28.
We decompose the variance in the course by section residuals (ucjst) into a persistent component,
λj , which is fixed across time and a non-persistent component which includes sampling error by
section, εcjst (Kane, Rockoff, and Staiger 2006). If the persistent and non-persistent components
are independent, then the variance of the section performance residual, ucjst = λj + εcjst, is
E[u2cjst] = σ2
λ + σ2εs (2)
As we are uninterested in the variance of the non-persistent component, we wish to isolate the
variance of professor quality in (2). To accomplish this, we compute the pairwise covariance of
residuals from the same instructor across different sections of the same course, s and s′
E[ucjstucjs′t] = σ2λ (3)
where s′ 6= s and E[εcjstεcjs′t] = 0 because the measurement error is uncorrelated across course
sections with random assignment of students into sections.18 To compute the covariance estimator
(i.e., persistent component) we implement a procedure as in Page and Solon (2003) and Hoffmann
and Oreopoulos (Forthcoming) as follows:
σ2λ =
T∑t=1
S∑s=1
∑s′ 6=s
C∑c=1
J∑j=1
ucjstucjs′t
/N (4)
where J is the total number of professors, C is the number of courses, S is the number of sections and
T is the number of years. This procedure computes the average pairwise covariance of the residuals
for each professor’s sections of the same course. The square root of the covariance estimate measures
the persistent component of the standard deviation in professor quality. Estimates of the standard
deviation in the persistent component are shown in Table 4, with standard errors estimated by
bootstrap.
Specification 1 shows results when weighting by covariance pair as shown in equation (4) and
Specification 2 shows results when re-weighting by course section.19 Overall, the estimates indicate
there is substantial variation in professor quality, although there is considerable heterogeneity
across course subjects. In Specification 1, for the entire sample, the standard deviation in the
persistent component is estimated to be 0.165 and is statistically significant at the 0.01-level. The
18See the mathematical appendix for a more detailed derivation of our identification strategy.19Re-weighting by course section puts less weight on the more experienced professors who have taught more sections
because a professor who teaches n sections, there aren−1Pi=1
i = (n− 1)n/2 pairwise covariance’s.
11
magnitude of the effect is similar to that found in elementary school teacher quality estimates
(Kane, Rockoff, and Staiger 2006). The estimated effects are somewhat smaller for math and
science courses (0.113) versus humanities and social sciences (0.195). Finally, we estimate separate
instructor effects for professors teaching calculus (0.081), science courses with a direct follow-on
course (0.099) and humanities courses with a direct follow-on course (0.213).20 We use these
estimates as a benchmark to estimate the persistence of the effect into follow-on related courses.
Results in Specification 2, weighted by section are very similar to those in Specification 1 with a
slight decrease in the magnitude of the effects.21
Results in Table 4 suggest there are relatively large and statistically significant differences in
professor quality in the contemporaneous course being taught. Our models identify the professor
effects using only the within course by semester variation in student achievement and indicate that
a one standard deviation increase in professor quality results in a 0.08 to 0.21 standard deviation
increase in student achievement. In terms of grades, these effects equate to roughly a 0.07 to 0.18
increase in student GPA.
4 Persistence in Value Added Effects
When evaluating achievement in the contemporaneous course being taught, one threat to identifi-
cation is the professor fixed effects model could be identifying a common treatment effect rather
than measuring the true quality of instruction. For example, if Professor A “teaches to the calculus
test” his students may perform better on exams and earn higher grades in calculus, but they may
not have learned any more actual calculus knowledge relative to Professor B who does not teach
to the test. In the aforementioned scenario, the contemporaneous model would identify Professor
A as a higher quality instructor compared to Professor B. The Air Force Academy’s comprehen-
sive core curriculum provides a unique opportunity to test for persistence in the contemporaneous
value-added effects in follow-on courses free from any potential selection bias.
All students are required to take follow-on related courses in several areas of study. Addition-
ally, the core curriculum includes two mathematics, two physics, and six engineering courses, all
of which require calculus as a prerequisite. We test for persistence in the professor quality effects
across three different sub-samples of our data. First, we examine whether the introductory calculus
20The core courses with a direct follow-on course are Chemistry 141 and 142, History 101 and 202, English 111
and 211, Physics 110 and 215, and Math 141 and 142.21In results not shown, we also estimated the effects when including an individual student fixed effect. Results for
these specifications also yielded qualitatively similar results.
12
professor effects persist into achievement in the follow-on advanced math-related curriculum. Sec-
ond, we examine science core courses (chemistry and physics) with a follow-on course and third, we
examine humanities courses (English and history) with a follow-on course. Thus, from the preced-
ing example, we estimate the effect of having Professor A in calculus on achievement in follow-on
mathematics and engineering courses while simultaneously controlling for the quality of instruction
in the follow-on courses.
Suppose there are two potential ways in which the initial course, c, professor (i.e., introductory
calculus professor) can affect follow-on course c′ achievement (i.e., Aeronautical Engineering): a
persistence of the effect measured in the initial course c and an effect on the follow-on course c′
that did not affect achievement in the initial course. An example of the latter effect would be “deep
knowledge” or understanding of calculus that may not be measured on a calculus exam, but would
increase achievement in more advanced mathematics and engineering courses.
To estimate the persistence in the professor value-added in the initial course to follow-on courses,
we first estimate equation (1) for the follow-on courses and include a (contemporaneous) course
by year by section fixed effect. We then compute the classroom average performance residuals in
the follow-on course, but at the initial course instructor-section level. The performance residual
is purged of any contemporaneous professor effects and is free from selection bias due to random
re-assignment of students from the initial courses to follow-on courses.
The average performance residual for initial professor j’s students now with professor k in
section s of course c′ in period t′ is22
νc′jkst′ = ρλj + βj + εc′jkst′ (5)
However, if a subset of the unobserved attributes that cause an individual student in section s to
perform better in course c also affect achievement in the follow-on course c′, then the expectation
of the sample covariance between the average residual for the same group of students from section s
in class c and follow-on class c′ captures both the persistence of professor j’s effect and the variance
of unobserved attributes (i.e., a randomly drawn extra “good” section of students). Hence,
E[ucjstνc′jkst′ ] = ρσ2λ + E[εcjstεc′jkst′ ] (6)
But, if the students in section s are different from those in section s′, then
E[ucjstνc′jks′t′ ] = ρσ2λ (7)
22In equation (5) we index the instructor k to denote the individuals in expectation will take course c′ from a
different instructor the course c.
13
where ρ measures the persistence of the initial course instructor fixed effect in follow-on course
performance.
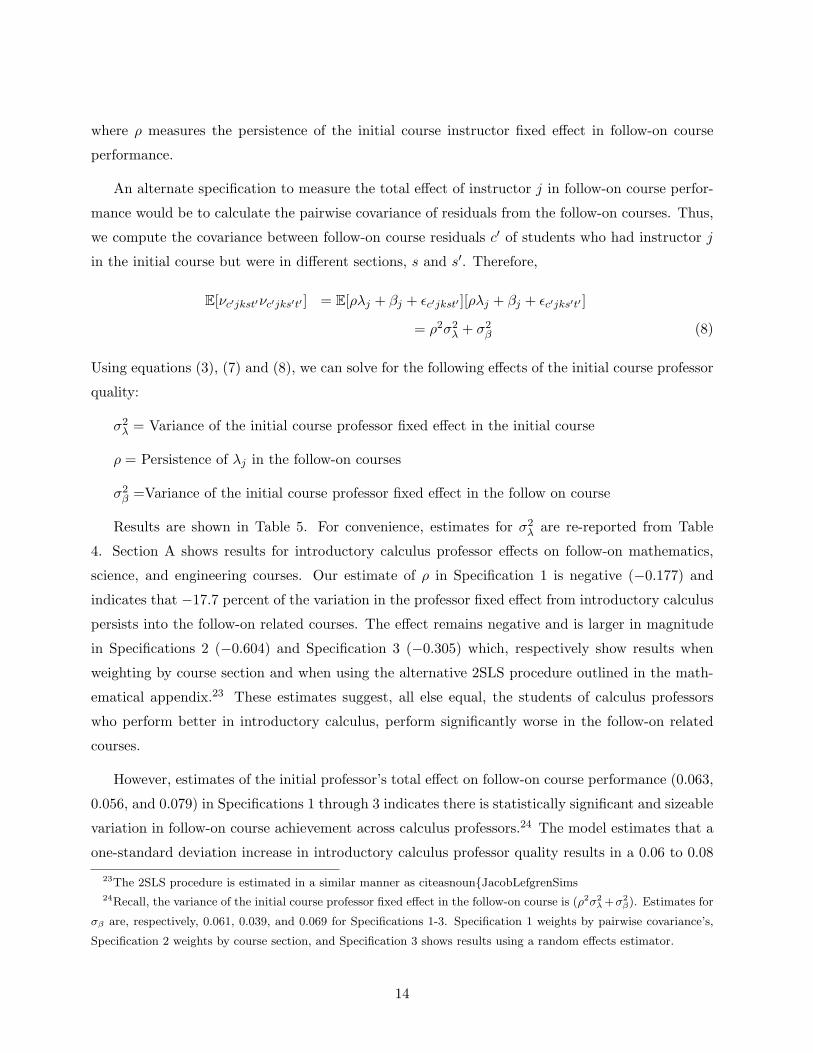
An alternate specification to measure the total effect of instructor j in follow-on course perfor-
mance would be to calculate the pairwise covariance of residuals from the follow-on courses. Thus,
we compute the covariance between follow-on course residuals c′ of students who had instructor j
in the initial course but were in different sections, s and s′. Therefore,
E[νc′jkst′νc′jks′t′ ] = E[ρλj + βj + εc′jkst′ ][ρλj + βj + εc′jks′t′ ]
= ρ2σ2λ + σ2
β (8)
Using equations (3), (7) and (8), we can solve for the following effects of the initial course professor
quality:
σ2λ = Variance of the initial course professor fixed effect in the initial course
ρ = Persistence of λj in the follow-on courses
σ2β =Variance of the initial course professor fixed effect in the follow on course
Results are shown in Table 5. For convenience, estimates for σ2λ are re-reported from Table
4. Section A shows results for introductory calculus professor effects on follow-on mathematics,
science, and engineering courses. Our estimate of ρ in Specification 1 is negative (−0.177) and
indicates that −17.7 percent of the variation in the professor fixed effect from introductory calculus
persists into the follow-on related courses. The effect remains negative and is larger in magnitude
in Specifications 2 (−0.604) and Specification 3 (−0.305) which, respectively show results when
weighting by course section and when using the alternative 2SLS procedure outlined in the math-
ematical appendix.23 These estimates suggest, all else equal, the students of calculus professors
who perform better in introductory calculus, perform significantly worse in the follow-on related
courses.
However, estimates of the initial professor’s total effect on follow-on course performance (0.063,
0.056, and 0.079) in Specifications 1 through 3 indicates there is statistically significant and sizeable
variation in follow-on course achievement across calculus professors.24 The model estimates that a
one-standard deviation increase in introductory calculus professor quality results in a 0.06 to 0.08
23The 2SLS procedure is estimated in a similar manner as citeasnoun{JacobLefgrenSims24Recall, the variance of the initial course professor fixed effect in the follow-on course is (ρ2σ2
λ+σ2β). Estimates for
σβ are, respectively, 0.061, 0.039, and 0.069 for Specifications 1-3. Specification 1 weights by pairwise covariance’s,
Specification 2 weights by course section, and Specification 3 shows results using a random effects estimator.
14
increase in student achievement in follow-on advanced mathematics-related courses. Taken jointly,
the estimates of σ2λ, ρ, and σ2
β indicate that some calculus professors produce students who perform
relatively better in calculus and other calculus professors produce students who perform well in
follow-on related courses, and these sets of professors are not the same. These results offer an
interesting puzzle and, at a minimum, suggest that using contemporaneous student achievement to
estimate professor quality may not measure the “true” professor input into the education production
function. To explore this result further we examine how the observable attributes of professors are
correlated with contemporaneous and follow-on courses in the next section.
Section B in Table 5 shows results science courses with a single follow-on related course. The
estimates for ρ (0.080, 0.014 and 0.051) are positive and indicate that only one to eight percent of the
initial course fixed effect persists into the follow-on courses. Estimates of the initial professor’s total
effect on follow-on course performance (zero25 and 0.014) indicate that the previous course professor
plays a statistically insignificant and very small, if any, role in follow-on course performance.
Section C shows results for humanities courses with a single follow-on related course. The
estimates for ρ (0.048, 0.020 and −0.053) are small and of varying signs, indicating that, at most,
only five percent of the initial course fixed effect persists into the follow-on courses. Likewise,
estimates of the initial professor’s total effect on follow-on course performance (0.030, 0.040 and
0.038) indicate that the previous course professor plays a small and statistically insignificant role
in follow-on course achievement.
5 Observable Professor Characteristics
One disadvantage of the professor fixed effects model is it is unable to measure which observable
professor characteristics actually predict student achievement. That is, the model provides lit-
tle or no information to administrators wishing to improve future hiring practices. To measure
whether observable professor characteristics are correlated with student achievement, we estimate
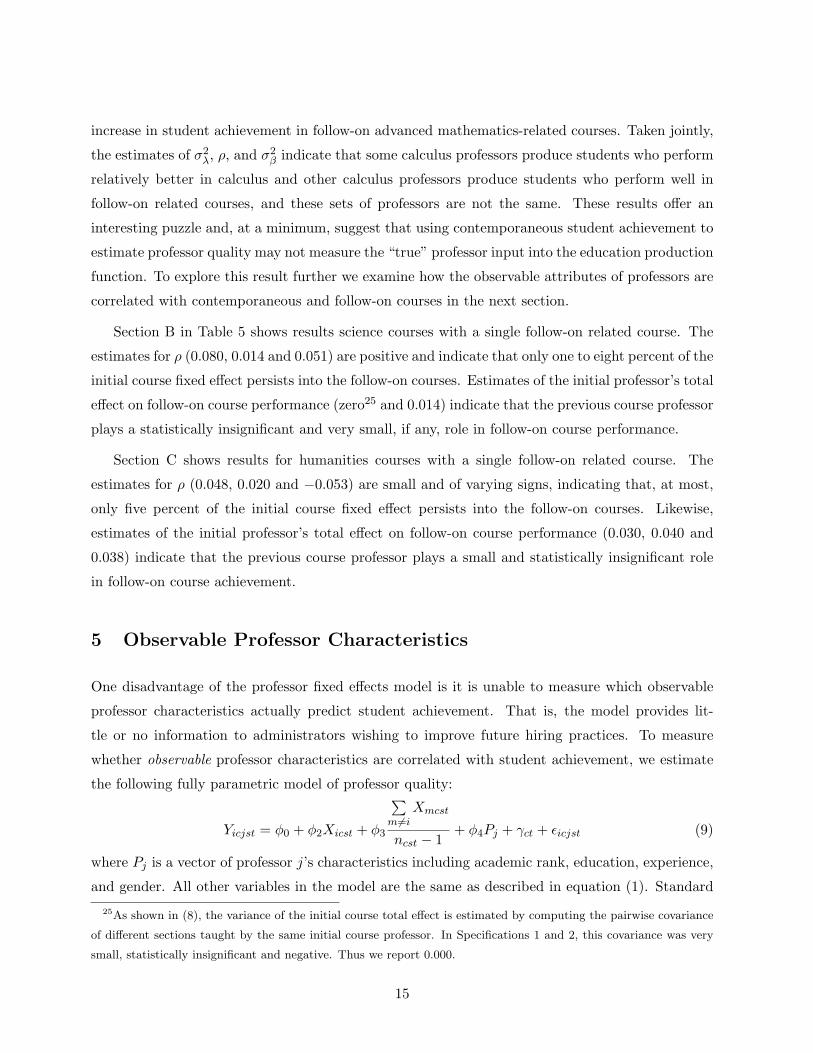
the following fully parametric model of professor quality:
Yicjst = φ0 + φ2Xicst + φ3
∑m 6=i
Xmcst
ncst − 1+ φ4Pj + γct + εicjst (9)
where Pj is a vector of professor j’s characteristics including academic rank, education, experience,
and gender. All other variables in the model are the same as described in equation (1). Standard
25As shown in (8), the variance of the initial course total effect is estimated by computing the pairwise covariance
of different sections taught by the same initial course professor. In Specifications 1 and 2, this covariance was very
small, statistically insignificant and negative. Thus we report 0.000.
15
errors are clustered by instructor. The model measures whether observable professor characteristics
are correlated with student achievement. Results for this analysis are shown in Tables 6 through
8, which respectively show results for calculus, science, and humanities professors.
Table 6, Specifications 1 through 3 shows results for contemporaneous course performance in
introductory calculus while including course by semester fixed effects.26 The course by semester
fixed effects control for any potential differences in grading standards across years and semesters.
Results indicate that academic rank, terminal degree status, and teaching experience are nega-
tively correlated with contemporaneous student performance. For Specification 1, the negative and
statistically significant coefficient for the full professor dummy variable (−0.140) indicates that stu-
dents taught by full professors earn grades, on average, 0.14 standard deviations lower than when
taught by lecturers in calculus. Additionally, the negative coefficients for the assistant professor
(−0.040) and associate professor (−0.017) dummy variables show that students, on average, earn
lower grades when taught by an assistant or associate professor compared to students taught by
a lecturer, although the estimated coefficient is outside conventional levels of statistical signifi-
cance.27 For Specification 2, the negative and statistically significant coefficient for the terminal
degree dummy variable (−0.063) indicates that students taught by professors with a Ph.D. earn
grades, on average, 0.063 standard deviations lower than when taught by instructors with only a
Masters degree. The negative and significant result (−0.007) for the experience variable in Spec-
ification 3 indicates student grades decline 0.007 standard deviations with each year of USAFA
teaching experience of the professor.
The manner in which student grades are determined in the USAFA Math Department as de-
scribed above (exams are made available to professors before the course begins, common exams
across professors, professors only grade a small part of their students exams, grades determined by
objective performance at course level and approved by department chair) allows us to rule out the
possibility that higher-ranking professors have higher grading standards for equal student perfor-
mance. Hence, the preceding results are likely driven by the manner in which the course is taught
by each professor.
Specifications 4 through 6 contain results for student achievement in the follow-on advanced
mathematics-related courses. The models include course by semester by section fixed effects to
control for any potential contemporaneous professor effects or other common shocks in the follow-
26Specification 1 and 4 present results for professor academic rank, Specifications 2 and 5 present results for terminal
degree status and Specifications 3and 6 present results for teaching experience at USAFA. These results are presented
separately due to the collinearity of academic rank, experience, and terminal degree status.27Lecturers at USAFA are typically younger military officers (Captains and Majors) with masters’ degrees.
16
on courses. Standard errors are clustered at the introductory calculus professor-level. Results
show that student achievement in the advanced follow-on math and engineering courses is posi-
tively related to the introductory calculus professor’s academic rank, terminal degree status, and
experience. For Specification 4, the three academic rank variables are all positive and jointly signif-
icant at the 0.10−level indicating that students taught by lecturers in calculus perform significantly
worse in the follow-on advanced math related courses. The coefficients are greater in magnitude
for each successive academic rank, with students taught by full professors in calculus performing
0.101 standard deviations higher in the follow-on courses compared to student taught by lecturers.
For Specification 5, the terminal degree variable is positive (0.007), but statistically insignificant
and for Specification 6, the experience variable is positive (0.007) and statistically significant.
In sum, these results examining observable characteristics of the introductory calculus professors
support the findings from the professor fixed effects models in the previous sections. Results show
the less experienced and less qualified (by education level) calculus professors produce students
who perform better in the contemporaneous course being taught, however, these students perform
significantly worse in the follow-on advanced mathematics-related courses. Although, we can only
speculate as to the mechanism by which these effects operate, one might surmise that the less
educated and experienced instructors may teach more strictly to the regimented curriculum being
tested, while the more experienced professors broaden the curriculum and produce students with a
deeper understanding of the material. This deeper understanding results in better achievement in
the follow-on courses.28
In Table 7 and 8, we repeat this analysis for courses with a single follow-on related course.
Results for the science courses in Table 7 show a similar pattern to the calculus professor results,
although the estimated coefficients are less precise, especially for the contemporaneous course re-
gressions. Results indicate that students of professors with at terminal degree (0.040) and with
more experience (0.002) perform significantly better in subsequent follow-on science courses. For
the humanities courses (English and history), there is no discernable pattern to the results. In
humanities courses, student achievement is lowest for associate professors in both the initial and
follow-on related courses. One potential explanation of this rather inconsistent finding is the fact
that grades in these humanities courses tend to be more subjective (i.e., essay and paper grading)
compared to the science and math courses. Additionally, humanities courses may be less sequential
28To test for possible attrition bias in our estimates, we tested whether the academic rank of the calculus professor
is correlated with students dropping out of USAFA. We found no correlation between students dropping out and the
academic rank of the professor.
17
relative to math and science courses.29
6 Student Evaluations of Professors
Next, we examine the relationship between student evaluations of professors and student academic
achievement. This analysis gives us a unique opportunity to compare the relationship between
value-added models (currently used to measure primary and secondary teacher quality) and stu-
dent evaluations (currently used to measure postsecondary teacher quality). However, one obvious
problem with measuring the correlation between student academic achievement and the student
evaluations of the professors is these two measures are simultaneously determined and are subject
to common shock bias. Therefore, to correct for the endogeneity of an individual’s grade and the
instructor evaluation, we use the fact that professors at USAFA typically teach multiple sections
of the same course each semester.
We estimate equation (9) where the dependent variable is professor i’s grade (normalized)
in section, s, of course, c, in semester, t, and the key explanatory variable is the mean student
evaluation given by students in other sections, s′, of the same course, c, during the same semester,
t, as student i. Standard errors are clustered at the professor level. Our main identifying assumption
is that student evaluations of an instructor given by students in other sections of the same course
during the same semester are exogenous to an individual’s own grade and are free of common shocks
(e.g., a particularly disruptive student within the section).
Table 9 presents results for this analysis. Each coefficient represents the result from a separate
regression where we examine the effect of various questions asked on the student evaluation form.30
Columns 1− 3 show results from regressing student grades in the contemporaneous course on the
initial course professor evaluations. Columns 4 − 6 show results when regressing follow-on course
achievement on these same initial course professor evaluations. Overall, results show that the initial
course student evaluations positively predict student achievement in contemporaneous courses, but
are very poor predictors of follow-on course student achievement. Results for contemporaneous
course achievement in Columns 1− 3 show that all 27 coefficients are positive, with 21 coefficients
statistically significant at the 0.05−level. The magnitudes of the effects are smallest for the intro-
ductory calculus course and largest for the humanities courses. For example, results for question
29For example, the English courses we examine are composition (English 111) and literature (English 211) which
likely have less overlap compared to the science and math curriculum.30For brevity, we only present results for a subset of questions; however, results were qualitatively similar across
all questions on the student evaluation form.
18
22, which asks students, “Amount you learned in this course was:” show that a 1-point (equivalent
to 1.8 standard deviations) increase in the mean professor evaluation resulted in a statistically
significant 0.077, 0.129, and 0.168 respective standard deviation increase in calculus, science, and
humanities contemporaneous student achievement.
Results in Columns 4−6 for follow-on course achievement show that professor evaluations in the
initial courses are very poor predictors of student achievement in the follow-on related courses. Of
the 27 coefficients estimated, 13 coefficients are negative and 14 are positive, with none statistically
significant at the 0.05−level. Again, results for question 22, which asks students, “Amount you
learned in this course was:” show that a 1-point (equivalent to 1.8 standard deviations) increase
in the mean professor evaluation resulted in a statistically insignificant 0.014, −0.008, and −0.018
respective standard deviation change in calculus, science, and humanities follow-on related course
achievement.
Since many U.S. colleges and universities use student evaluations as a measurement of teaching
quality for academic promotion and tenure decisions, this finding draws into question the value and
accuracy of this practice.
7 Conclusion
This study exploits the random assignment of students to 30+ core courses at the US Air Force
Academy to examine how professor quality affects student achievement free from selection bias into
course and section. Results show there are relatively large and statistically significant differences in
student achievement across professors in the contemporaneous course being taught. A one-standard
deviation increase in the professor fixed effect results in a 0.08 to 0.21−standard deviation increase
in student grade achievement. We find that introductory course professors significantly affect
student achievement in follow-on related courses, but these effects are quite heterogeneous across
subjects. For example, our results offer an interesting puzzle in mathematics courses as the students
of professors that perform well as a group in the initial mathematics course perform significantly
worse in the (mandatory) follow-on related math, science, and engineering courses.
To explore these finding further, we examine the correlation between the observable attributes of
professors and student grade achievement in both the initial and follow-on related courses. For math
and science courses we find that academic rank, teaching experience, and terminal degree status are
negatively correlated with contemporaneous student achievement, but positively related to follow-on
course achievement. That is, the less experienced instructors who do not possess terminal degrees
19
produce students who perform better in the contemporaneous course being taught, but perform
worse in the follow-on related courses. These results are consistent with recent evidence by Bettinger
and Long (2006) and Ehrenberg and Zhang (2005) who, respectively, find that the use of adjunct
professors have a positive effect on follow-on course interest, but a negative effect on student
graduation. That is, our results support the notion that less academically qualified instructors
may spur (potentially erroneous) interest in a particular subject through higher grades, but these
students perform significantly worse in follow-on related courses that rely on the initial course
for content. For humanities courses, we find almost no relationship between professor observable
attributes and student achievement.
The manner in which student grades are determined at USAFA, particularly in the math de-
partment, allows us to rule out potential mechanisms for our results. First, all math exams are
jointly graded by all professors teaching the course during that semester. For example, Professor A
grades question 1 and Professor B grades question 2 for all students taking the course. Addition-
ally, all professors are given copies of the exams for the course prior to the start of the semester.
Third, all final grades in all core courses at USAFA are determined on a single grading scale and
are approved by the chair of the department. These aspects of grading allow us to rule out the
possibility that professors have varying grading standards for equal student achievement. Hence,
our results are likely driven by the manner in which the course is taught by each professor.
We also examine the relationship between the student evaluations of professors and student aca-
demic achievement corrected for endogeneity and common shocks. We find that student evaluations
positively predict student achievement in contemporaneous courses, but are very poor predictors
of follow-on student achievement. This latter finding draws into question how one should mea-
sure professor quality as professor-teaching quality is primarily evaluated at most U.S. colleges and
universities by scores on subjective student evaluations.
References
Aaronson, D. B., L. Barrow, and W. Sander (2007): “Teachers and Student Achievement
in the Chicago Public Schools,” Journal of Labor Economics, 25(1), 95–135.
Barron, J. M., B. T. Ewing, and G. R. Waddell (2000): “The Effects of High School Par-
ticipation on Education and Labor Market Outcomes,” The Review of Economics and Statistics,
82(3), 409–421.
20
Bettinger, E., and B. T. Long (2006): “Does it Matter Who Teaches the Course? The Impact
of Adjuncts and Graduate Instructors,” Unpublished Manuscript.
Betts, J. R., and A. Zau (2004): “Peer Groups and Academic Achievement: Panel Evidence
from Administrative Data,” Unpublished Manuscript.
Boyd, D., P. Grossman, H. Lankford, S. Loeb, and J. Wyckoff (2006): “How Changes in
Entry Requirements Alter the Teacher Workforce and Affect Student Achievement,” Education
Finance and Policy, 1(2), 176–216.
Burke, M. A., and T. R. Sass (2004): “Classroom Peer Effects and student Achievement,” in
Presented at the American Economic Association Annual Meeting, January 2005.
Burton, A. C., K. S. Carson, S. M. Chilton, and W. G. Hutchinson (2007): “Resolv-
ing Questions About Bias in Real and Hypothetical Referenda,” Environmental and Resource
Economics, 38(4), 513–525.
Carrell, S. E., R. L. Fullerton, and J. E. West (2008): “Does Your Cohort Matter?
Estimating Peer Effects in College Achievement,” Unpublished Manuscript.
Carrell, S. E., F. V. Malmstrom, and J. E. West (2008): “Peer Effects in Academic
Cheating,” Journal of Human Resources, 43(1), 173–207.
Cavalluzzo, L. C. (2004): “Is National Board Certification an Effective Signal of Teacher Qual-
ity?,” CNA Corporation Working Paper.
Clotfelter, C. T., H. F. Ladd, and J. L. Vigdor (2006): “Teacher-Student Matching and
the Assessment of Teacher Effectiveness,” Journal of Human Resources, 41(4), 778–820.
(2007): “How and Why do Teacher Credentials Matter for Student Achievement?,” NBER
Working Papers 12828, National Bureau of Economic Research, Inc.
Dee, T. S. (2004): “Teachers, Race, and Student Achievement in a Randomized Experiment,”
Review of Economics and Statistics, 86(1), 195–210.
(2005): “A Teacher Like Me: Does Race, Ethnicity, or Gender Matter?,” American
Economic Review, 95(2), 158–165.
Ehrenberg, R. G., and D. J. Brewer (1994): “Do school and teacher characteristics matter?
Evidence from High School and Beyond,” Economics of Education Review, 13(1), 1–17.
21
Ehrenberg, R. G., and L. Zhang (2005): “Do Tenured and Tenure-Track Faculty Matter?,”
Journal of Human Resources, 40(3), 647–659.
Ferguson, R. F., and H. F. Ladd (1996): “How and Why Money Matters: An Analysis of
Alabama Schools,” in Holding Schools Accountable: Performance-Based Reform in Education.
Brookings Institution.
Figlio, D. N., and L. W. Kenny (2007): “Individual Teacher Incentives and Student Perfor-
mance,” Journal of Public Economics, 91(5-6), 901–914.
Foster, G. (2006): “It’s not your peers, and it’s not your friends: Some progress toward under-
standing the educational peer effect mechanism,” Journal of Public Economics, 90(8-9), 1455–
1475.
Goldhaber, D., and E. Anthony (2007): “Can Teacher Quality Be Effectively Assessed? Na-
tional Board Certification as a Signal of Effective Teaching,” Review of Economics and Statistics,
89(1), 134–150.
Graham, B. S. (2005): “Identifying Social Interactions through Excess Variance Contrasts,”
Unpublished Manuscript.
Hanushek, E. A. (1971): “Teacher Characteristics and Gains in Student Achievement: Estimation
using Micro Data,” American Economic Review, 61(2), 280–288.
Harris, D. N., and T. R. Sass (2007): “Teacher Training, Teacher Quality, and Student Achieve-
ment,” Working Paper.
Hoffmann, F., and P. Oreopoulos (Forthcoming): “Professor Qualities and Student Achieve-
ment,” Review of Economics and Statistics.
Hoxby, C. M., and G. Weingarth (2006): “Taking Race Out of the Equation: School Reas-
signment and the Structure of Peer Effects,” Working Paper.
Jacob, B. A., and L. Lefgren (2004): “The Impact of Teacher Training on Student Achieve-
ment: Quasi-Experimental Evidence from School Reform Efforts in Chicago,” Journal of Human
Resources, 39(1), 50–79.
Jacob, B. A., L. Lefgren, and D. Sims (2008): “The Persistence of Teacher-Induced Learning
Gains,” Working Paper.
22
Kane, T. J., J. E. Rockoff, and D. O. Staiger (2006): “What Does Certification Tell Us
About Teacher Effectiveness?: Evidence from New York City,” Economics of Education Review
(forthcoming).
Kane, T. J., and D. O. Staiger (2008): “Are Teacher-Level Value-Added Estimates Biased?
An Experimental Validation of Non-Experimental Estimates,” Working Paper.
Koerner, J. D. (1963): The Miseducation of American Teachers. Houghton Mifflin, Boston, MA.
Kremer, M., and D. M. Levy (2003): “Peer Effects and Alcohol Use Among College Students,”
NBER Working Paper 9876.
Lefgren, L. (2004): “Educational Peer Effects and the Chicago Public Schools,” Journal of Urban
Economics, 56(2), 169–191.
Lyle, D. S. (2007): “Estimating and Interpreting Peer and Role Model Effects from Randomly
Assigned Social Groups at West Point,” Review of Economics and Statistics, 89(2), 289–299.
McCaffrey, D. J., J. J.R. Lockwood, D. Koretz, and L. Hamilton (2004): “Evaluating
Value-Added Models for Teacher Accountability,” Santa Monica, CA: Rand Corporation.
Murnane, R. (1975): The Impact of School Resources on the Learning of Inner City Children.
Ballinger.
Page, M. E., and G. Solon (2003): “Correlations between Brothers and Neighboring Boys in
Their Adult Earnings: The Importance of Being Urban,” Journal of Labor Economics, 21(4),
831–856.
Princeton Review (2007): “Colleges and Careers,” Princeton Review, Accessed on 25 August
2006 at: http://www.princetonreview.com/college/default.asp.
Raudenbush, S. W., and A. S. Bryk (2002): Hierarchical Linear Models. Sage Publications,
second edn.
Rivkin, S. G., E. A. Hanushek, and J. F. Kain (2005): “Teachers, Schools and Academic
Achievement,” Econometrica, 73(2), 417–58.
Rockoff, J. E. (2004): “The Impact of Individual Teachers on Student Achievement: Evidence
from Panel Data,” American Economic Review, 94(2), 247–52.
Rothstein, J. (2008a): “On the Identification of Teacher Quality: Fixed Effects, Tracking, and
Causal Attribution,” Unpublished Manuscript.
23
(2008b): “Student sorting and bias in value added estimation: Selection on observables
and unobservables,” Unpublished Manuscript.
Sacerdote, B. L. (2001): “Peer Effects with Random Assignment: Results for Dartmouth Room-
mates,” Quarterly Journal of Economics, 116(2), 681–704.
Stinebrickner, R., and T. R. Stinebrickner (2006): “What can be learned about peer effects
using college reoomates? Evidence from new survey data and students form disadvantaged
backgrounds,” Journal of Public Economics, 90(8-9), 1435–54.
Summers, A. A., and B. L. Wolfe (1977): “Do Schools Make a Difference?,” The American
Economic Review, 67(4), 639–652.
Vandevoort, L. G., A. Amrein-Beardsley, and D. Berliner (2004): “National Board Cer-
tified Teachers and Their Students Achievement,” Education Policy Analysis Archives, 12(46).
Zimmerman, D. J. (2003): “Peer Effects in Academic Outcomes: Evidence From a Natural Ex-
periment,” The Review of Economics and Statistics, 85(1), 9–23.
24
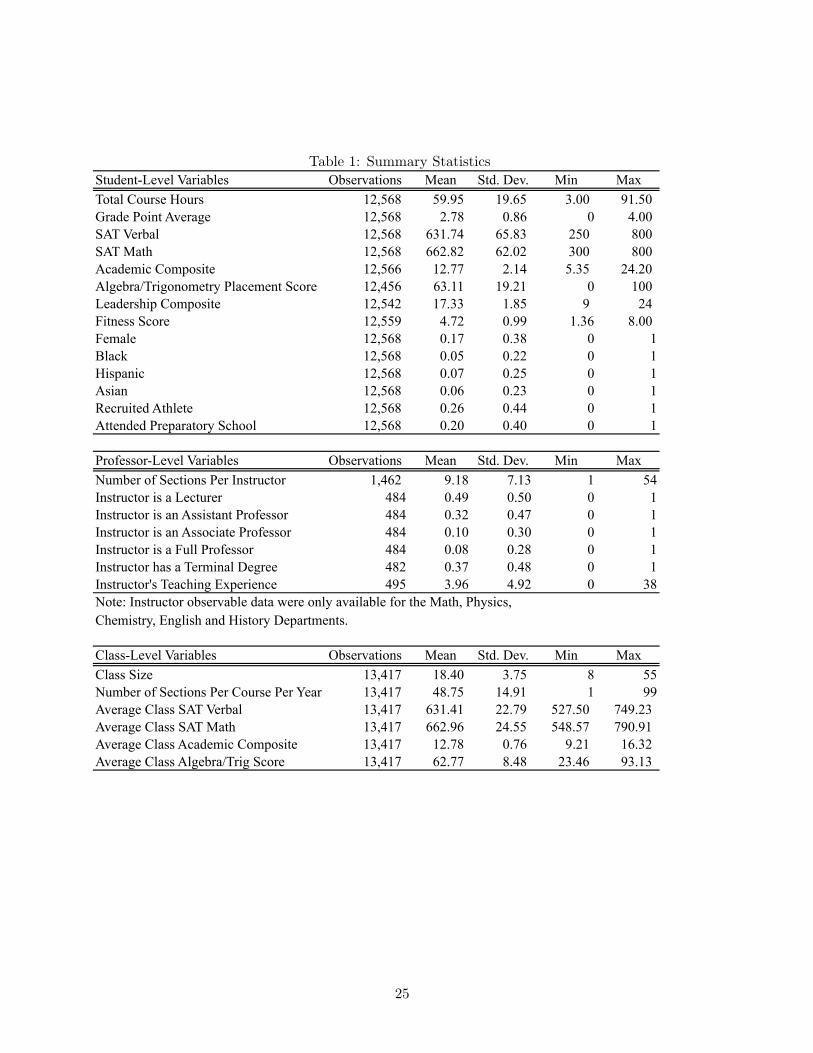
Table 1: Summary StatisticsStudent-Level Variables Observations Mean Std. Dev. Min MaxTotal Course Hours 12,568 59.95 19.65 3.00 91.50 Grade Point Average 12,568 2.78 0.86 0 4.00 SAT Verbal 12,568 631.74 65.83 250 800 SAT Math 12,568 662.82 62.02 300 800 Academic Composite 12,566 12.77 2.14 5.35 24.20 Algebra/Trigonometry Placement Score 12,456 63.11 19.21 0 100 Leadership Composite 12,542 17.33 1.85 9 24 Fitness Score 12,559 4.72 0.99 1.36 8.00 Female 12,568 0.17 0.38 0 1Black 12,568 0.05 0.22 0 1Hispanic 12,568 0.07 0.25 0 1Asian 12,568 0.06 0.23 0 1Recruited Athlete 12,568 0.26 0.44 0 1Attended Preparatory School 12,568 0.20 0.40 0 1
Professor-Level Variables Observations Mean Std. Dev. Min MaxNumber of Sections Per Instructor 1,462 9.18 7.13 1 54Instructor is a Lecturer 484 0.49 0.50 0 1Instructor is an Assistant Professor 484 0.32 0.47 0 1Instructor is an Associate Professor 484 0.10 0.30 0 1Instructor is a Full Professor 484 0.08 0.28 0 1Instructor has a Terminal Degree 482 0.37 0.48 0 1Instructor's Teaching Experience 495 3.96 4.92 0 38
Class-Level Variables Observations Mean Std. Dev. Min MaxClass Size 13,417 18.40 3.75 8 55Number of Sections Per Course Per Year 13,417 48.75 14.91 1 99Average Class SAT Verbal 13,417 631.41 22.79 527.50 749.23 Average Class SAT Math 13,417 662.96 24.55 548.57 790.91 Average Class Academic Composite 13,417 12.78 0.76 9.21 16.32 Average Class Algebra/Trig Score 13,417 62.77 8.48 23.46 93.13
Note: Instructor observable data were only available for the Math, Physics, Chemistry, English and History Departments.
25
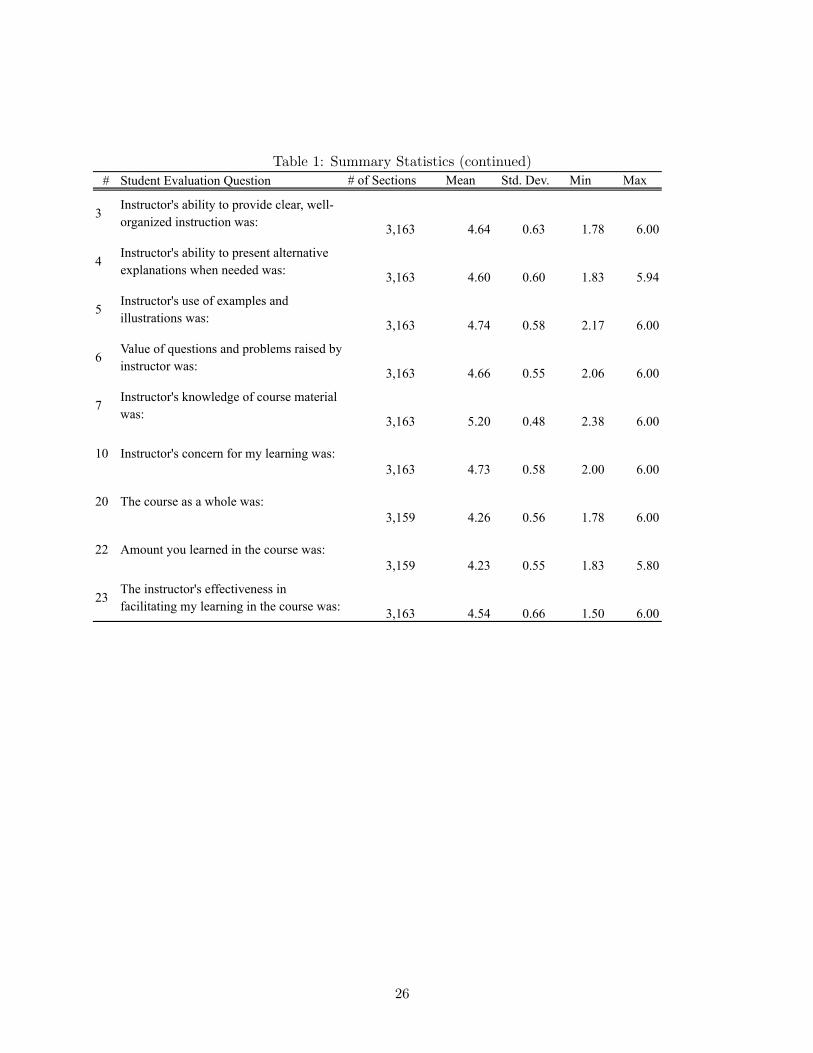
Table 1: Summary Statistics (continued)# Student Evaluation Question # of Sections Mean Std. Dev. Min Max
3Instructor's ability to provide clear, well-organized instruction was: 3,163 4.64 0.63 1.78 6.00
4Instructor's ability to present alternative explanations when needed was: 3,163 4.60 0.60 1.83 5.94
5Instructor's use of examples and illustrations was: 3,163 4.74 0.58 2.17 6.00
6Value of questions and problems raised by instructor was: 3,163 4.66 0.55 2.06 6.00
7Instructor's knowledge of course material was: 3,163 5.20 0.48 2.38 6.00
10 Instructor's concern for my learning was:3,163 4.73 0.58 2.00 6.00
20 The course as a whole was:3,159 4.26 0.56 1.78 6.00
22 Amount you learned in the course was:3,159 4.23 0.55 1.83 5.80
23The instructor's effectiveness in facilitating my learning in the course was: 3,163 4.54 0.66 1.50 6.00
26
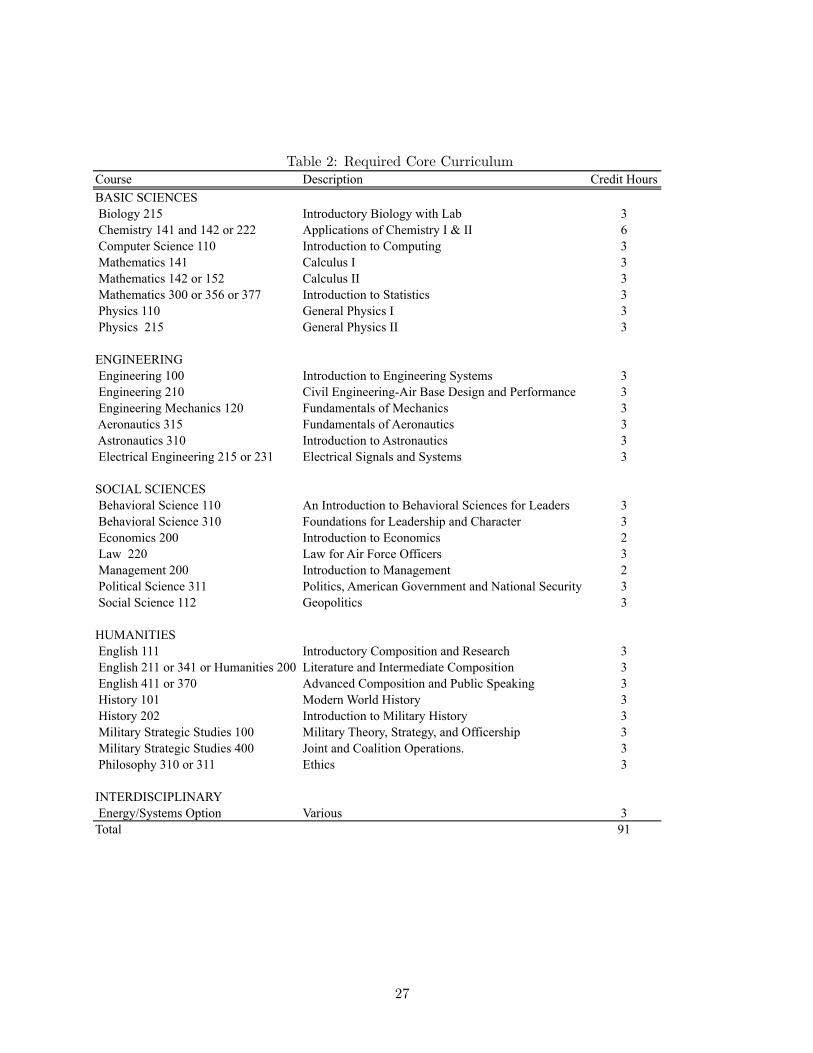
Table 2: Required Core CurriculumCourse Description Credit HoursBASIC SCIENCES Biology 215 Introductory Biology with Lab 3 Chemistry 141 and 142 or 222 Applications of Chemistry I & II 6 Computer Science 110 Introduction to Computing 3 Mathematics 141 Calculus I 3 Mathematics 142 or 152 Calculus II 3 Mathematics 300 or 356 or 377 Introduction to Statistics 3 Physics 110 General Physics I 3 Physics 215 General Physics II 3 ENGINEERING Engineering 100 Introduction to Engineering Systems 3 Engineering 210 Civil Engineering-Air Base Design and Performance 3 Engineering Mechanics 120 Fundamentals of Mechanics 3 Aeronautics 315 Fundamentals of Aeronautics 3 Astronautics 310 Introduction to Astronautics 3 Electrical Engineering 215 or 231 Electrical Signals and Systems 3
SOCIAL SCIENCES Behavioral Science 110 An Introduction to Behavioral Sciences for Leaders 3 Behavioral Science 310 Foundations for Leadership and Character 3 Economics 200 Introduction to Economics 2 Law 220 Law for Air Force Officers 3 Management 200 Introduction to Management 2 Political Science 311 Politics, American Government and National Security 3 Social Science 112 Geopolitics 3 HUMANITIES English 111 Introductory Composition and Research 3 English 211 or 341 or Humanities 200 Literature and Intermediate Composition 3 English 411 or 370 Advanced Composition and Public Speaking 3 History 101 Modern World History 3 History 202 Introduction to Military History 3 Military Strategic Studies 100 Military Theory, Strategy, and Officership 3 Military Strategic Studies 400 Joint and Coalition Operations. 3 Philosophy 310 or 311 Ethics 3 INTERDISCIPLINARY Energy/Systems Option Various 3Total 91
27
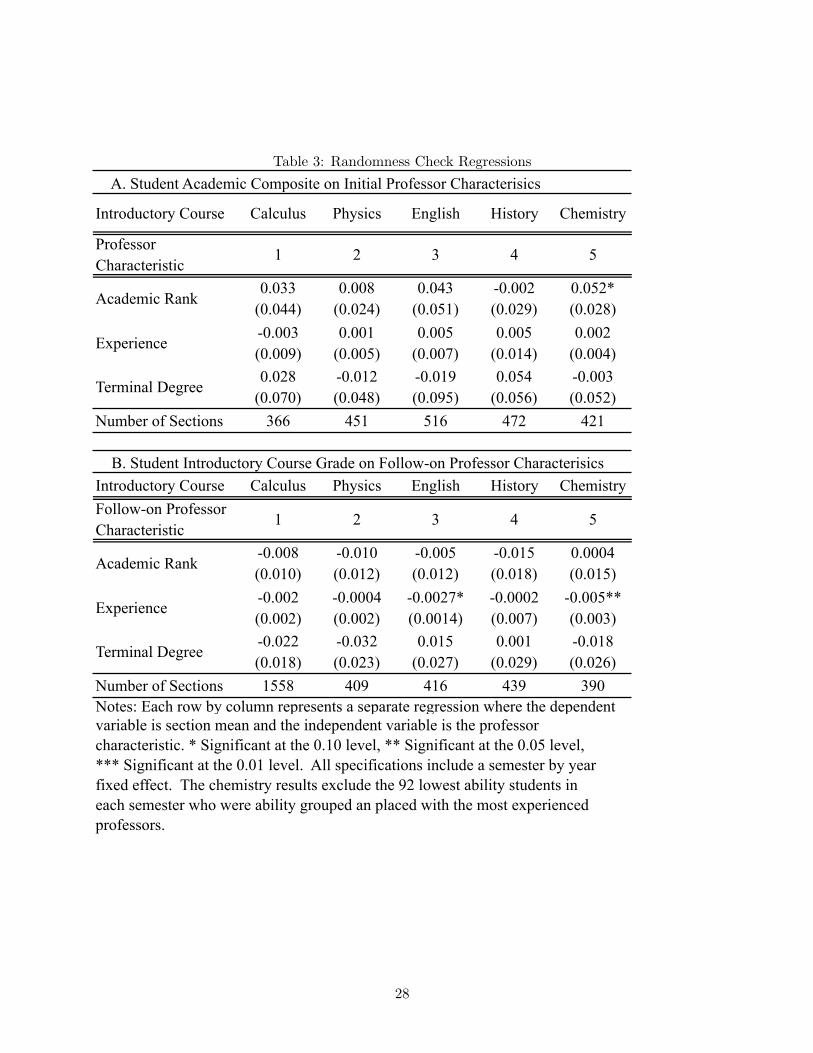
Table 3: Randomness Check Regressions
Introductory Course Calculus Physics English History Chemistry
Professor Characteristic
1 2 3 4 5
Academic Rank0.033
(0.044)0.008
(0.024)0.043
(0.051)-0.002 (0.029)
0.052* (0.028)
Experience-0.003 (0.009)
0.001 (0.005)
0.005 (0.007)
0.005 (0.014)
0.002 (0.004)
Terminal Degree0.028
(0.070)-0.012 (0.048)
-0.019 (0.095)
0.054 (0.056)
-0.003 (0.052)
Number of Sections 366 451 516 472 421
Introductory Course Calculus Physics English History Chemistry Follow-on Professor Characteristic
1 2 3 4 5
Academic Rank-0.008 (0.010)
-0.010 (0.012)
-0.005 (0.012)
-0.015 (0.018)
0.0004 (0.015)
Experience-0.002 (0.002)
-0.0004 (0.002)
-0.0027* (0.0014)
-0.0002 (0.007)
-0.005** (0.003)
Terminal Degree-0.022 (0.018)
-0.032 (0.023)
0.015 (0.027)
0.001 (0.029)
-0.018 (0.026)
Number of Sections 1558 409 416 439 390
professors.
B. Student Introductory Course Grade on Follow-on Professor Characterisics
A. Student Academic Composite on Initial Professor Characterisics
Notes: Each row by column represents a separate regression where the dependent variable is section mean and the independent variable is the professor characteristic. * Significant at the 0.10 level, ** Significant at the 0.05 level, *** Significant at the 0.01 level. All specifications include a semester by year fixed effect. The chemistry results exclude the 92 lowest ability students in each semester who were ability grouped an placed with the most experienced
28
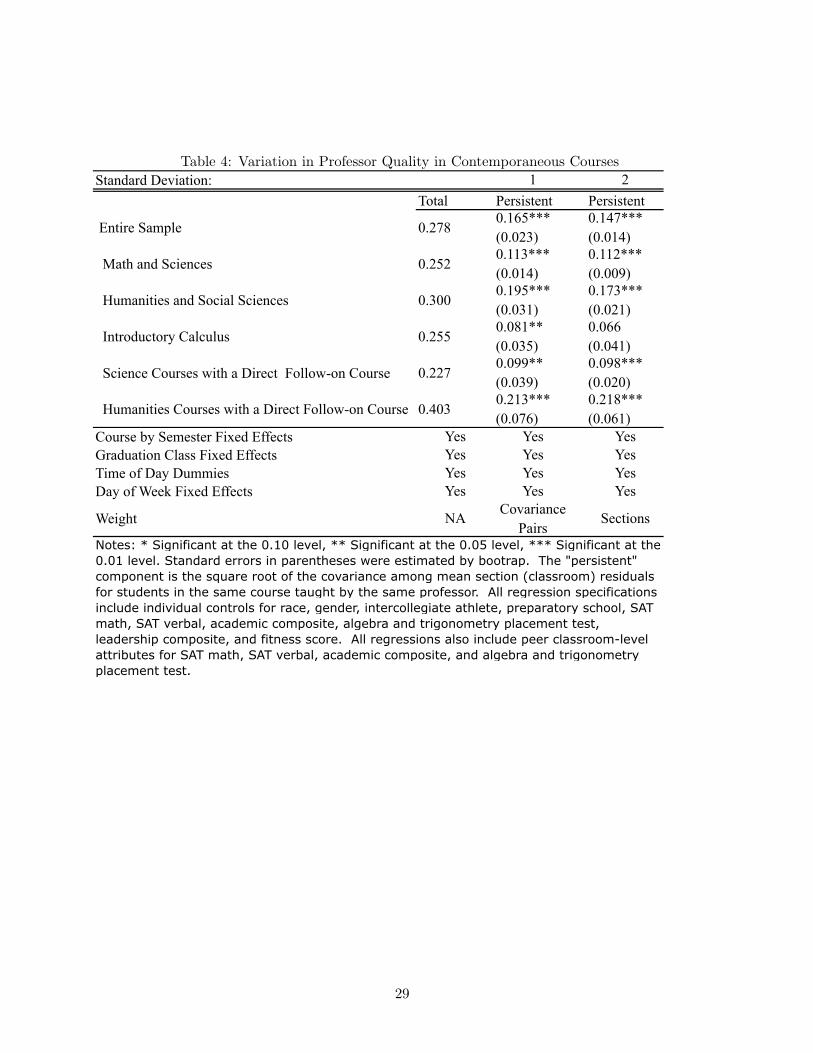
Table 4: Variation in Professor Quality in Contemporaneous CoursesStandard Deviation: 1 2
Total Persistent Persistent
Entire Sample 0.2780.165*** (0.023)
0.147*** (0.014)
Math and Sciences 0.2520.113*** (0.014)
0.112*** (0.009)
Humanities and Social Sciences 0.3000.195*** (0.031)
0.173*** (0.021)
Introductory Calculus 0.2550.081** (0.035)
0.066 (0.041)
Science Courses with a Direct Follow-on Course 0.2270.099** (0.039)
0.098*** (0.020)
Humanities Courses with a Direct Follow-on Course 0.4030.213*** (0.076)
0.218*** (0.061)
Course by Semester Fixed Effects Yes Yes YesGraduation Class Fixed Effects Yes Yes YesTime of Day Dummies Yes Yes YesDay of Week Fixed Effects Yes Yes Yes
Weight NA Covariance Pairs
Sections
leadership composite, and fitness score. All regressions also include peer classroom-level attributes for SAT math, SAT verbal, academic composite, and algebra and trigonometry
Notes: * Significant at the 0.10 level, ** Significant at the 0.05 level, *** Significant at the 0.01 level. Standard errors in parentheses were estimated by bootrap. The "persistent"component is the square root of the covariance among mean section (classroom) residualsfor students in the same course taught by the same professor. All regression specificationsinclude individual controls for race, gender, intercollegiate athlete, preparatory school, SAT math, SAT verbal, academic composite, algebra and trigonometry placement test,
placement test.
29
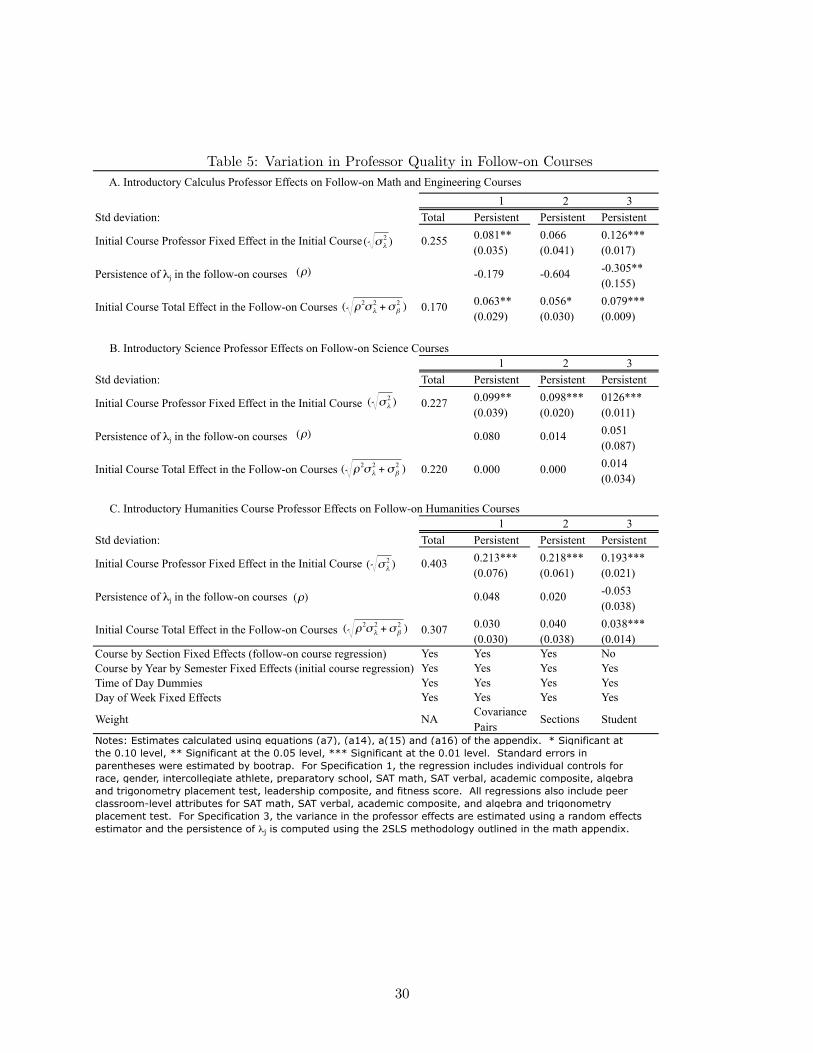
Table 5: Variation in Professor Quality in Follow-on Courses A. Introductory Calculus Professor Effects on Follow-on Math and Engineering Courses
1 2 3Std deviation: Total Persistent Persistent Persistent
Initial Course Professor Fixed Effect in the Initial Course 0.255 0.081** (0.035)
0.066 (0.041)
0.126*** (0.017)
Persistence of λj in the follow-on courses -0.179 -0.604 -0.305** (0.155)
Initial Course Total Effect in the Follow-on Courses 0.170 0.063** (0.029)
0.056* (0.030)
0.079*** (0.009)
B. Introductory Science Professor Effects on Follow-on Science Courses1 2 3
Std deviation: Total Persistent Persistent Persistent
Initial Course Professor Fixed Effect in the Initial Course 0.227 0.099** (0.039)
0.098*** (0.020)
0126*** (0.011)
Persistence of λj in the follow-on courses 0.080 0.014 0.051 (0.087)
Initial Course Total Effect in the Follow-on Courses 0.220 0.000 0.000 0.014 (0.034)
C. Introductory Humanities Course Professor Effects on Follow-on Humanities Courses1 2 3
Std deviation: Total Persistent Persistent Persistent
Initial Course Professor Fixed Effect in the Initial Course 0.403 0.213*** (0.076)
0.218*** (0.061)
0.193*** (0.021)
Persistence of λj in the follow-on courses 0.048 0.020 -0.053 (0.038)
Initial Course Total Effect in the Follow-on Courses 0.307 0.030 (0.030)
0.040 (0.038)
0.038*** (0.014)
Course by Section Fixed Effects (follow-on course regression) Yes Yes Yes NoCourse by Year by Semester Fixed Effects (initial course regression) Yes Yes Yes YesTime of Day Dummies Yes Yes Yes YesDay of Week Fixed Effects Yes Yes Yes Yes
Weight NA Covariance Pairs
Sections Student
and trigonometry placement test, leadership composite, and fitness score. All regressions also include peer classroom-level attributes for SAT math, SAT verbal, academic composite, and algebra and trigonometry placement test. For Specification 3, the variance in the professor effects are estimated using a random effects estimator and the persistence of λj is computed using the 2SLS methodology outlined in the math appendix.
Notes: Estimates calculated using equations (a7), (a14), a(15) and (a16) of the appendix. * Significant atthe 0.10 level, ** Significant at the 0.05 level, *** Significant at the 0.01 level. Standard errors in parentheses were estimated by bootrap. For Specification 1, the regression includes individual controls for race, gender, intercollegiate athlete, preparatory school, SAT math, SAT verbal, academic composite, algebra
€
( ρ2σλ2 +σβ
2 )€
(ρ)
€
( σλ2 )
€
( ρ2σλ2 +σβ
2 )
€
(ρ)€
( σλ2 )
€
( ρ2σλ2 +σβ
2 )€
(ρ)€
( σλ2 )
30

Table 6: Introductory Calculus Professor Effects on Contemporaneous and Follow-on Courses
Variable 1 2 3 4 5 6
Assistant Professor-0.040 (0.034)
0.037* (0.020)
Associate Professor-0.017 (0.058)
0.042 (0.044)
Full Professor-0.140** (0.069)
0.101** (0.050)
Terminal Degree-0.063* (0.033)
0.007 (0.019)
Experience-0.007** (0.003)
0.007*** (0.002)
Observations 6,679 6,679 6,679 39,953 39,953 39,953R2 0.2822 0.2825 0.2823 0.2919 0.2915 0.2918F-statistic (3, 195): academic rank 1.60 NA NA 2.30* NA NACourse by Semester Fixed Effects Yes Yes Yes No No NoCourse by Semester by Professor Fixed Effects No No No Yes Yes YesGraduation Class Fixed Effects Yes Yes Yes Yes Yes YesTime of Day Dummies Yes Yes Yes Yes Yes YesDay of Week Fixed Effects Yes Yes Yes Yes Yes Yes
Contemporaneous CourseFollow-on Math and Engineering Courses
Notes: * Significant at the 0.10 level, ** Significant at the 0.05 level, *** Significant at the 0.01 level. Robust standard errors in parentheses are clustered by instructor. All specifications include individual-level controls for students who are black, Hispanic, Asian, female, recruited athlete, and attended a preparatory school.
31
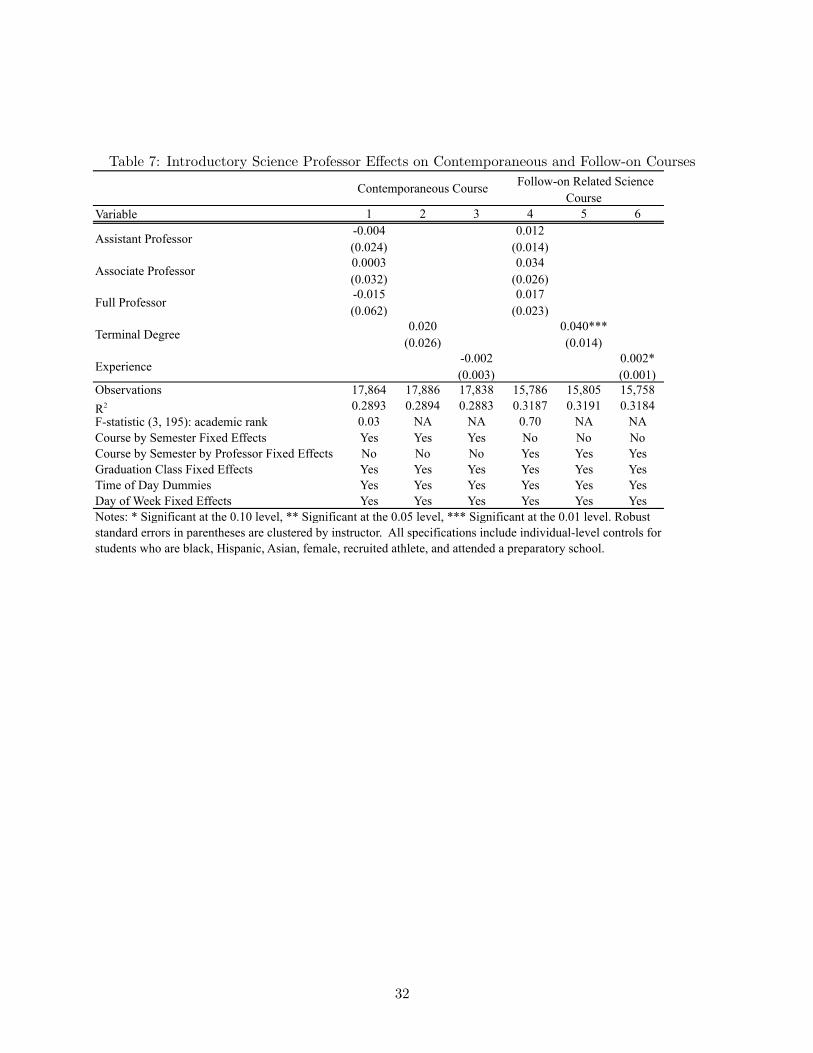
Table 7: Introductory Science Professor Effects on Contemporaneous and Follow-on Courses
Variable 1 2 3 4 5 6
Assistant Professor-0.004 (0.024)
0.012 (0.014)
Associate Professor0.0003 (0.032)
0.034 (0.026)
Full Professor-0.015 (0.062)
0.017 (0.023)
Terminal Degree0.020
(0.026)0.040*** (0.014)
Experience-0.002 (0.003)
0.002* (0.001)
Observations 17,864 17,886 17,838 15,786 15,805 15,758R2 0.2893 0.2894 0.2883 0.3187 0.3191 0.3184F-statistic (3, 195): academic rank 0.03 NA NA 0.70 NA NACourse by Semester Fixed Effects Yes Yes Yes No No NoCourse by Semester by Professor Fixed Effects No No No Yes Yes YesGraduation Class Fixed Effects Yes Yes Yes Yes Yes YesTime of Day Dummies Yes Yes Yes Yes Yes YesDay of Week Fixed Effects Yes Yes Yes Yes Yes Yes
Contemporaneous Course Follow-on Related Science Course
Notes: * Significant at the 0.10 level, ** Significant at the 0.05 level, *** Significant at the 0.01 level. Robust standard errors in parentheses are clustered by instructor. All specifications include individual-level controls for students who are black, Hispanic, Asian, female, recruited athlete, and attended a preparatory school.
32
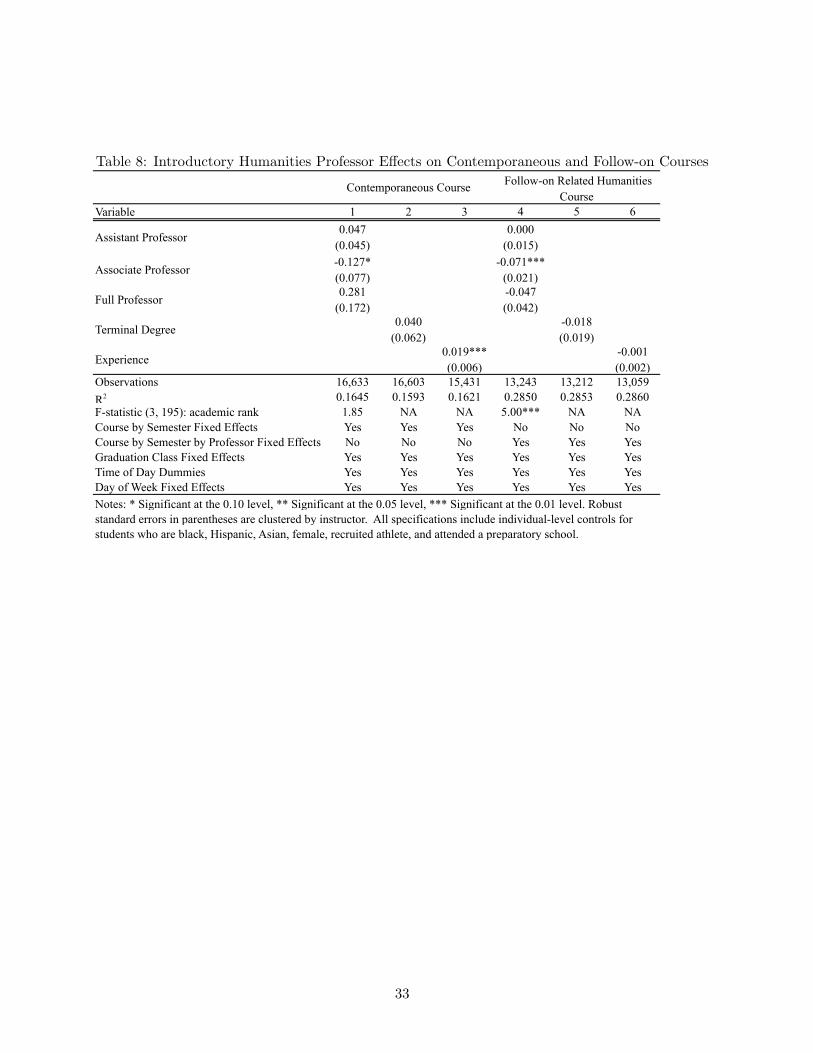
Table 8: Introductory Humanities Professor Effects on Contemporaneous and Follow-on Courses
Variable 1 2 3 4 5 6
Assistant Professor0.047
(0.045)0.000
(0.015)
Associate Professor-0.127* (0.077)
-0.071*** (0.021)
Full Professor0.281
(0.172)-0.047 (0.042)
Terminal Degree0.040
(0.062)-0.018 (0.019)
Experience0.019*** (0.006)
-0.001 (0.002)
Observations 16,633 16,603 15,431 13,243 13,212 13,059R2 0.1645 0.1593 0.1621 0.2850 0.2853 0.2860F-statistic (3, 195): academic rank 1.85 NA NA 5.00*** NA NACourse by Semester Fixed Effects Yes Yes Yes No No NoCourse by Semester by Professor Fixed Effects No No No Yes Yes YesGraduation Class Fixed Effects Yes Yes Yes Yes Yes YesTime of Day Dummies Yes Yes Yes Yes Yes YesDay of Week Fixed Effects Yes Yes Yes Yes Yes Yes
Contemporaneous Course Follow-on Related Humanities Course
Notes: * Significant at the 0.10 level, ** Significant at the 0.05 level, *** Significant at the 0.01 level. Robust standard errors in parentheses are clustered by instructor. All specifications include individual-level controls for students who are black, Hispanic, Asian, female, recruited athlete, and attended a preparatory school.
33
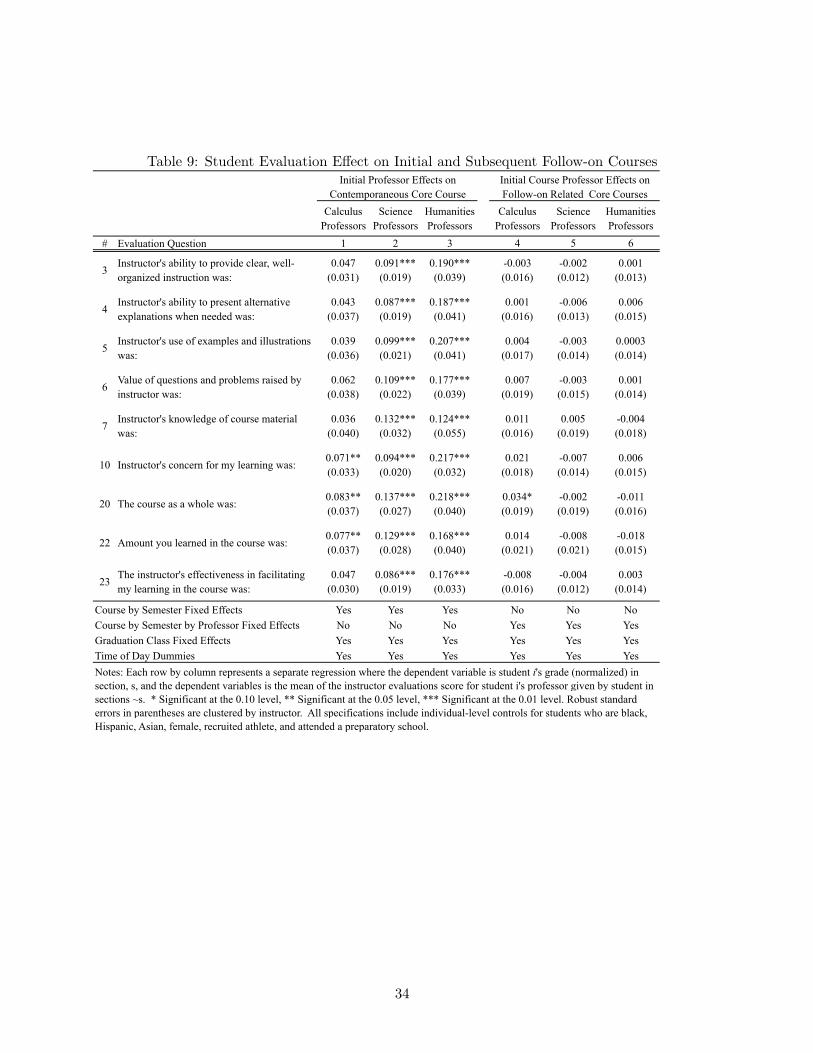
Table 9: Student Evaluation Effect on Initial and Subsequent Follow-on Courses
Calculus Professors
Science Professors
Humanities Professors
Calculus Professors
Science Professors
Humanities Professors
# Evaluation Question 1 2 3 4 5 6
3Instructor's ability to provide clear, well-organized instruction was:
0.047 (0.031)
0.091*** (0.019)
0.190*** (0.039)
-0.003 (0.016)
-0.002 (0.012)
0.001 (0.013)
4Instructor's ability to present alternative explanations when needed was:
0.043 (0.037)
0.087*** (0.019)
0.187*** (0.041)
0.001 (0.016)
-0.006 (0.013)
0.006 (0.015)
5Instructor's use of examples and illustrations was:
0.039 (0.036)
0.099*** (0.021)
0.207*** (0.041)
0.004 (0.017)
-0.003 (0.014)
0.0003 (0.014)
6Value of questions and problems raised by instructor was:
0.062 (0.038)
0.109*** (0.022)
0.177*** (0.039)
0.007 (0.019)
-0.003 (0.015)
0.001 (0.014)
7Instructor's knowledge of course material was:
0.036 (0.040)
0.132*** (0.032)
0.124*** (0.055)
0.011 (0.016)
0.005 (0.019)
-0.004 (0.018)
10 Instructor's concern for my learning was:0.071** (0.033)
0.094*** (0.020)
0.217*** (0.032)
0.021 (0.018)
-0.007 (0.014)
0.006 (0.015)
20 The course as a whole was:0.083** (0.037)
0.137*** (0.027)
0.218*** (0.040)
0.034* (0.019)
-0.002 (0.019)
-0.011 (0.016)
22 Amount you learned in the course was:0.077** (0.037)
0.129*** (0.028)
0.168*** (0.040)
0.014 (0.021)
-0.008 (0.021)
-0.018 (0.015)
23The instructor's effectiveness in facilitating my learning in the course was:
0.047 (0.030)
0.086*** (0.019)
0.176*** (0.033)
-0.008 (0.016)
-0.004 (0.012)
0.003 (0.014)
Course by Semester Fixed Effects Yes Yes Yes No No NoCourse by Semester by Professor Fixed Effects No No No Yes Yes YesGraduation Class Fixed Effects Yes Yes Yes Yes Yes YesTime of Day Dummies Yes Yes Yes Yes Yes YesNotes: Each row by column represents a separate regression where the dependent variable is student i's grade (normalized) in
Initial Course Professor Effects on Follow-on Related Core Courses
Initial Professor Effects on Contemporaneous Core Course
section, s, and the dependent variables is the mean of the instructor evaluations score for student i's professor given by student in sections ~s. * Significant at the 0.10 level, ** Significant at the 0.05 level, *** Significant at the 0.01 level. Robust standard errors in parentheses are clustered by instructor. All specifications include individual-level controls for students who are black, Hispanic, Asian, female, recruited athlete, and attended a preparatory school.
34
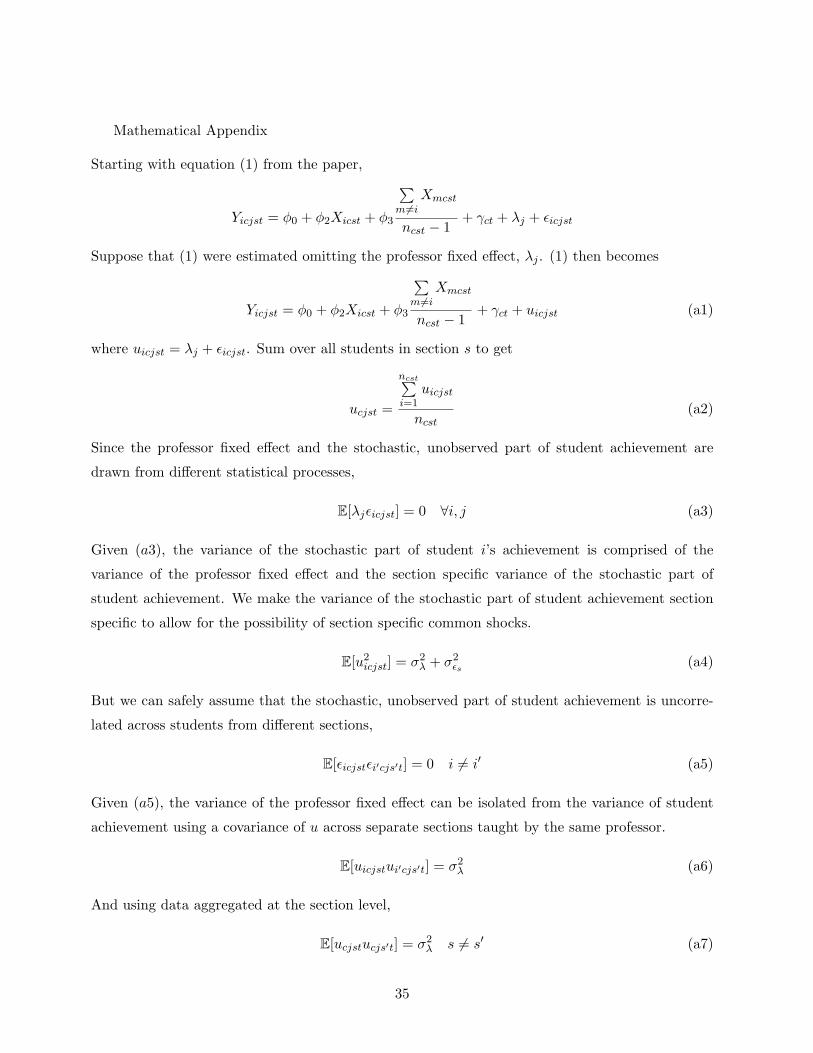
Mathematical Appendix
Starting with equation (1) from the paper,
Yicjst = φ0 + φ2Xicst + φ3
∑m 6=i
Xmcst
ncst − 1+ γct + λj + εicjst
Suppose that (1) were estimated omitting the professor fixed effect, λj . (1) then becomes
Yicjst = φ0 + φ2Xicst + φ3
∑m 6=i
Xmcst
ncst − 1+ γct + uicjst (a1)
where uicjst = λj + εicjst. Sum over all students in section s to get
ucjst =
ncst∑i=1
uicjst
ncst(a2)
Since the professor fixed effect and the stochastic, unobserved part of student achievement are
drawn from different statistical processes,
E[λjεicjst] = 0 ∀i, j (a3)
Given (a3), the variance of the stochastic part of student i’s achievement is comprised of the
variance of the professor fixed effect and the section specific variance of the stochastic part of
student achievement. We make the variance of the stochastic part of student achievement section
specific to allow for the possibility of section specific common shocks.
E[u2icjst] = σ2
λ + σ2εs (a4)
But we can safely assume that the stochastic, unobserved part of student achievement is uncorre-
lated across students from different sections,
E[εicjstεi′cjs′t] = 0 i 6= i′ (a5)
Given (a5), the variance of the professor fixed effect can be isolated from the variance of student
achievement using a covariance of u across separate sections taught by the same professor.
E[uicjstui′cjs′t] = σ2λ (a6)
And using data aggregated at the section level,
E[ucjstucjs′t] = σ2λ s 6= s′ (a7)
35
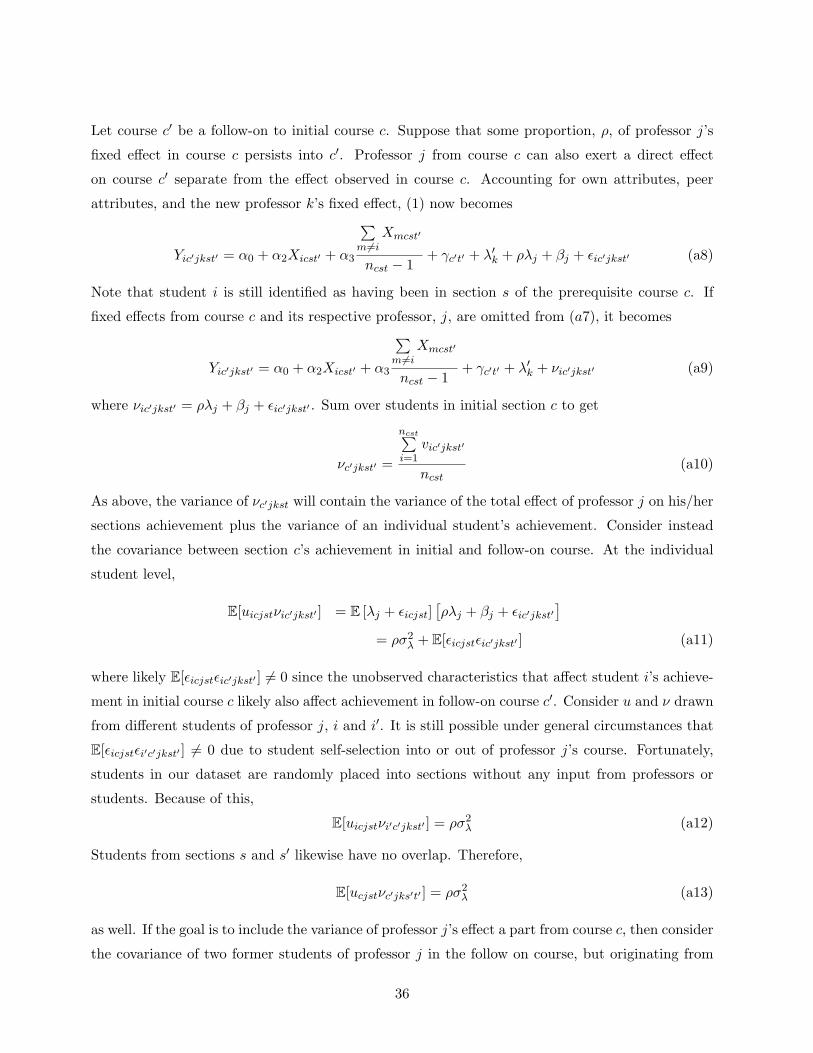
Let course c′ be a follow-on to initial course c. Suppose that some proportion, ρ, of professor j’s
fixed effect in course c persists into c′. Professor j from course c can also exert a direct effect
on course c′ separate from the effect observed in course c. Accounting for own attributes, peer
attributes, and the new professor k’s fixed effect, (1) now becomes
Yic′jkst′ = α0 + α2Xicst′ + α3
∑m 6=i
Xmcst′
ncst − 1+ γc′t′ + λ′k + ρλj + βj + εic′jkst′ (a8)
Note that student i is still identified as having been in section s of the prerequisite course c. If
fixed effects from course c and its respective professor, j, are omitted from (a7), it becomes
Yic′jkst′ = α0 + α2Xicst′ + α3
∑m6=i
Xmcst′
ncst − 1+ γc′t′ + λ′k + νic′jkst′ (a9)
where νic′jkst′ = ρλj + βj + εic′jkst′ . Sum over students in initial section c to get
νc′jkst′ =
ncst∑i=1
vic′jkst′
ncst(a10)
As above, the variance of νc′jkst will contain the variance of the total effect of professor j on his/her
sections achievement plus the variance of an individual student’s achievement. Consider instead
the covariance between section c’s achievement in initial and follow-on course. At the individual
student level,
E[uicjstνic′jkst′ ] = E [λj + εicjst][ρλj + βj + εic′jkst′
]= ρσ2
λ + E[εicjstεic′jkst′ ] (a11)
where likely E[εicjstεic′jkst′ ] 6= 0 since the unobserved characteristics that affect student i’s achieve-
ment in initial course c likely also affect achievement in follow-on course c′. Consider u and ν drawn
from different students of professor j, i and i′. It is still possible under general circumstances that
E[εicjstεi′c′jkst′ ] 6= 0 due to student self-selection into or out of professor j’s course. Fortunately,
students in our dataset are randomly placed into sections without any input from professors or
students. Because of this,
E[uicjstνi′c′jkst′ ] = ρσ2λ (a12)
Students from sections s and s′ likewise have no overlap. Therefore,
E[ucjstνc′jks′t′ ] = ρσ2λ (a13)
as well. If the goal is to include the variance of professor j’s effect a part from course c, then consider
the covariance of two former students of professor j in the follow on course, but originating from
36
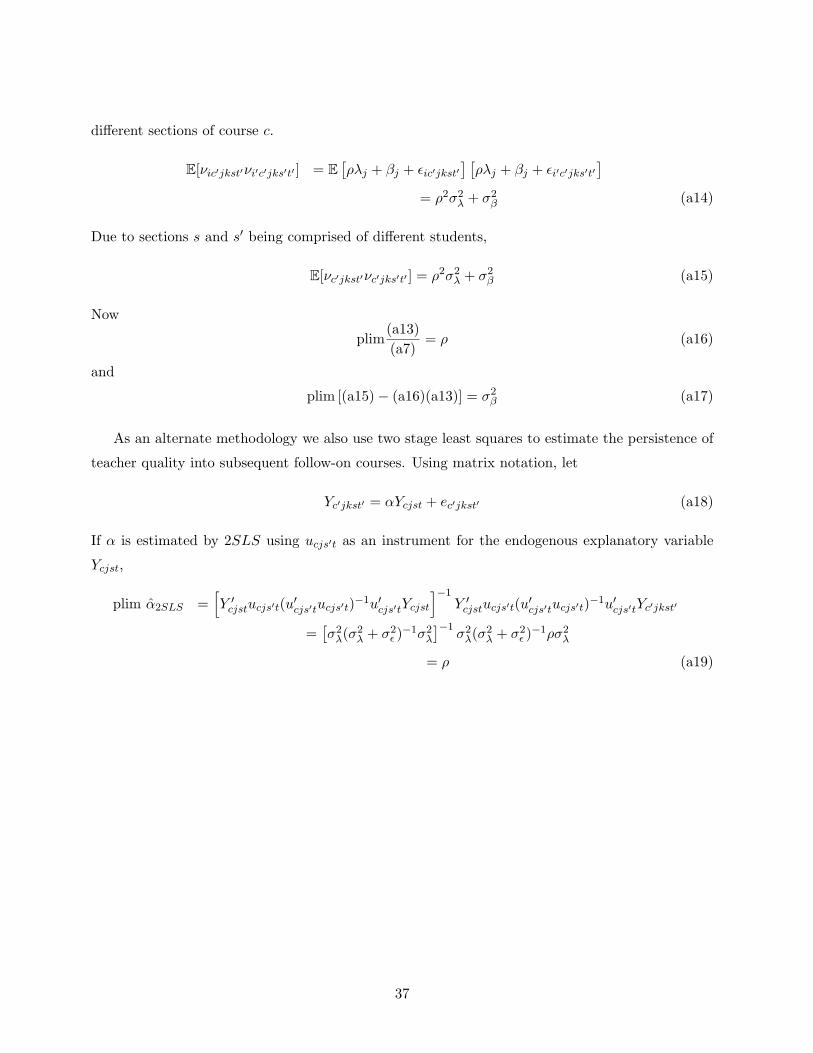
different sections of course c.
E[νic′jkst′νi′c′jks′t′ ] = E[ρλj + βj + εic′jkst′
] [ρλj + βj + εi′c′jks′t′
]= ρ2σ2
λ + σ2β (a14)
Due to sections s and s′ being comprised of different students,
E[νc′jkst′νc′jks′t′ ] = ρ2σ2λ + σ2
β (a15)
Now
plim(a13)(a7)
= ρ (a16)
and
plim [(a15)− (a16)(a13)] = σ2β (a17)
As an alternate methodology we also use two stage least squares to estimate the persistence of
teacher quality into subsequent follow-on courses. Using matrix notation, let
Yc′jkst′ = αYcjst + ec′jkst′ (a18)
If α is estimated by 2SLS using ucjs′t as an instrument for the endogenous explanatory variable
Ycjst,
plim α̂2SLS =[Y ′cjstucjs′t(u
′cjs′tucjs′t)
−1u′cjs′tYcjst
]−1Y ′cjstucjs′t(u
′cjs′tucjs′t)
−1u′cjs′tYc′jkst′
=[σ2λ(σ2
λ + σ2ε )−1σ2
λ
]−1σ2λ(σ2
λ + σ2ε )−1ρσ2
λ
= ρ (a19)
37