Embed Size (px)
Citation preview
NBER WORKING PAPER SERIES
INTENDED AND UNINTENDED EFFECTS OF YOUTH BICYCLE HELMET LAWS
Christopher S. CarpenterMark F. Stehr
Working Paper 15658http://www.nber.org/papers/w15658
NATIONAL BUREAU OF ECONOMIC RESEARCH1050 Massachusetts Avenue
Cambridge, MA 02138January 2010
We thank David Grabowski, Darren Grant, and Inas Rashad for useful comments on previous drafts. Seminar participants at the 2nd Biennial Conference of the American Society of Health Economists,UC Irvine, the University of Illinois at Chicago, and the University of Michigan School of Public Healthprovided very helpful comments. Greg Franz provided useful research assistance. Carpenter thanksThe Paul Merage School of Business at UC Irvine for financial support. We are grateful to Steve Kinchenand Shari Shanklin at the CDC for assistance with the YRBSS data. Results do not imply endorsementof the CDC or any other organization. The YRBSS microdata used in this paper are protected by aconfidentiality agreement. Interested readers can contact CDC for details on obtaining access. Allerrors are our own. The views expressed herein are those of the authors and do not necessarily reflectthe views of the National Bureau of Economic Research.
NBER working papers are circulated for discussion and comment purposes. They have not been peer-reviewed or been subject to the review by the NBER Board of Directors that accompanies officialNBER publications.
© 2010 by Christopher S. Carpenter and Mark F. Stehr. All rights reserved. Short sections of text,not to exceed two paragraphs, may be quoted without explicit permission provided that full credit,including © notice, is given to the source.
Intended and Unintended Effects of Youth Bicycle Helmet LawsChristopher S. Carpenter and Mark F. StehrNBER Working Paper No. 15658January 2010JEL No. I0,K0
ABSTRACT
Over 20 states have adopted laws requiring youths to wear a helmet when riding a bicycle. We confirmprevious research indicating that these laws reduced fatalities and increased helmet use, but we alsoshow that the laws significantly reduced youth bicycling. We find this result in standard two-wayfixed effects models of parental reports of youth bicycling, as well as in triple difference models ofself-reported bicycling among high school youths that explicitly account for bicycling by youths justabove the helmet law age threshold. Our results highlight important intended and unintended consequencesof a well-intentioned public policy.
Christopher S. CarpenterUniversity of California, IrvineThe Paul Merage School of Business428 SBIrvine, CA 92697-3125and [email protected]
Mark F. StehrDrexel UniversityLeBow College of BusinessMatheson Hall 504E3141 Chestnut StreetPhiladelphia, PA [email protected]
Intended and Unintended Effects of Youth Bicycle Helmet Laws p.2
1. Introduction
Every year, emergency departments in the United States treat hundreds of thousands of bicycle-
related injuries, with hundreds resulting in deaths – usually due to head injuries (Rodgers 2000).
Some large fraction of these deaths would likely have been preventable if the bicyclist had been
wearing a properly fitted bicycle helmet, as there is ample medical evidence that helmets reduce
the likelihood of serious head trauma and brain damage in bicycle accidents by as much as 85
percent, particularly among children (see, for example, Thompson, Rivara, and Thompson 1989).
Despite this evidence, however, rates of bicycle helmet use are low, particularly among youths:
about a third of youths age 5-15 in the United States who rode a bicycle in the past 12 months
did not wear a helmet; helmet use among older adolescents is particularly low. When asked why
they do not wear bicycle helmets, youths commonly complain about the “look” and “fit” of
bicycle helmets. A common complaint about the former is that bicycle helmets make youths
look like “geeks” or “nerds”, while “fit” problems generally include laments that helmets are too
tight and induce sweating (AAA 1995).
Because the technological efficacy of bicycle helmets is well-accepted in the medical
community, state and local governments have reason to try to increase helmet use. As with
many public health policies, state efforts in this area have reflected two distinct types of
approaches: “carrots” and “sticks”. Examples of the former include: bicycle helmet give-aways,
educational outreach about the life-saving effects of helmets, and media campaigns designed to
change social norms regarding bicycle helmets (e.g. to make it seem “cool” to wear a bike
helmet). The most direct example of the “stick” approach has been to adopt laws that require
youths to wear a helmet when riding a bicycle, a policy adopted by 21 US states over the past 15
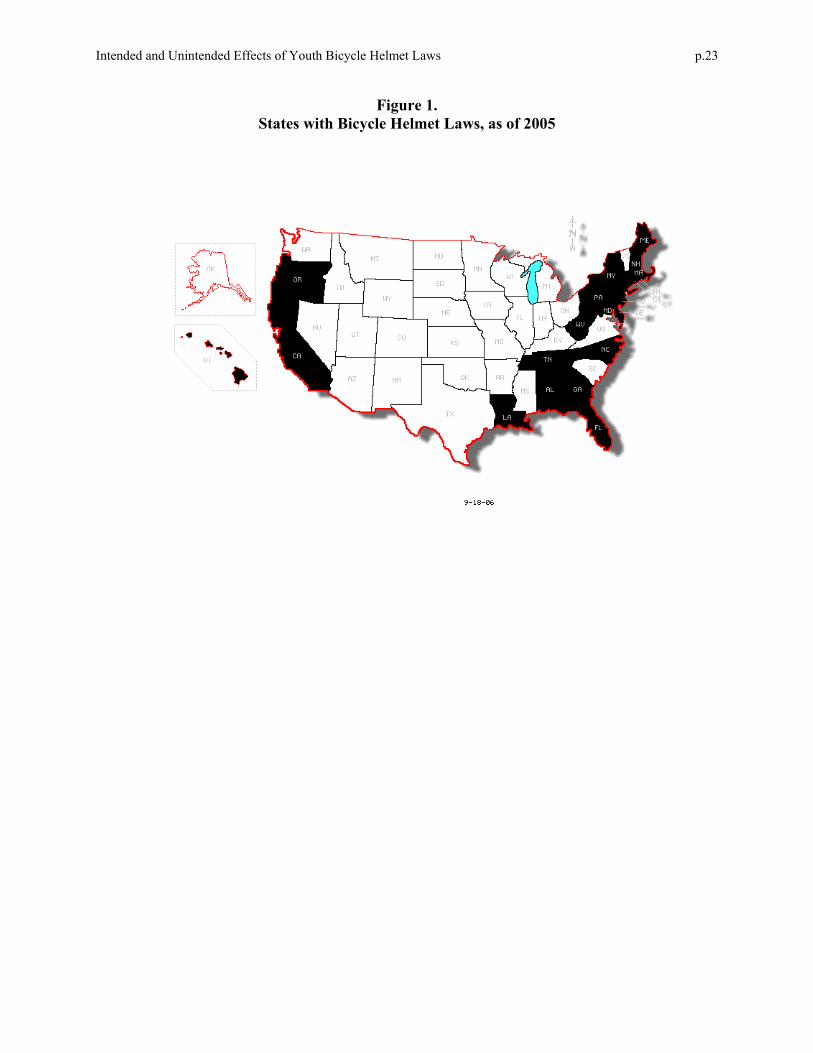
years. Figure 1 shows the geographic distribution of helmet laws as of 2005. Although helmet
Intended and Unintended Effects of Youth Bicycle Helmet Laws p.3
laws are largely coastal phenomena, over half of the US youth population is now covered by a
state bicycle helmet law. Most of these laws apply to youths under age 16 and impose modest
penalties for violations (e.g. verbal warnings, counseling, or a small fine). A recent quasi-
experimental study returned evidence that helmet laws significantly reduced juvenile bicycle
fatalities over the 1990s by about 11 percent (Grant and Rutner 2005).
How did helmet laws achieve these fatality reductions? One direct possibility
documented in previous public health research is that helmet laws increased youth helmet use.
Since there is general agreement in the medical community on the technological efficacy of
helmets at reducing serious brain injuries, an increase in helmet use is one plausible and
intuitively appealing mechanism (for reviews of the medical literature on the lifesaving effects of
helmets, see Towner et al. 2002 and Karkhaneh et al. 2006). Despite this, the literature has not
directly tested an alternative possibility: that mandatory helmet laws have reduced youth
bicycling by increasing its costs.1 Such a direct reduction in bicycling exposure would also be
expected to reduce fatalities even in the absence of any changes in youth helmet use.
In this paper we provide the first comprehensive quasi-experimental estimates of the
effects of mandatory bicycle helmet laws in the US on bicycling fatalities, helmet use, and
bicycling behaviors among youths. Our main empirical approach is based on the differential
timing of adoption of helmet laws across states, effectively identifying the helmet law effects
from within-state changes in outcomes for residents of states adopting laws compared to the
associated within-state changes in outcomes for youths in places that did not adopt a law in that
same year. We first confirm and extend previous fixed-effects research on bicycling fatalities by
showing that helmet laws significantly reduced bicycling fatalities among youths age 0-15 (i.e.,
1 We are not the first to consider the unintended consequences of safety regulations. Peltzman (1973) points out that policies designed to improve automotive safety may lead to more careless or aggressive driving.
Intended and Unintended Effects of Youth Bicycle Helmet Laws p.4
youths who were directly treated by most states’ age-16 helmet laws) by about 19 percent. As
expected, similarly specified fatality models among 16-30 year olds (who were not directly
affected by the helmet laws) return much smaller and statistically insignificant effects of helmet
laws. We also provide the first quasi-experimental evidence in the literature that an important
mechanism behind the fatality reductions was an increase in helmet use: fixed-effects models
using parental reports of child helmet use suggest that helmet laws significantly increased youth
helmet use by 29-35 percent. Similarly specified models using self-reports of high school age
youths also return evidence that helmet laws increase helmet use by 10-23 percent, though these
estimates are less precise.
Our main contribution is to show that in addition to the increase in helmet use, there is
also robust evidence for an unintended and previously undocumented mechanism: helmet laws
produced modest but statistically significant reductions in youth bicycling participation of 4-5
percent. As with our helmet use estimates, we find this result in fixed-effects models of both
parental reports of child bicycling and in self-reports of high school youths’ bicycling, and the
bicycling effects are statistically significant in both datasets. Moreover, our analysis of the
reduction in bicycling goes further by showing that this main result also obtains in triple
difference models that identify the effects of helmet laws by comparing changes in outcomes for
youths under each state’s helmet law age threshold (i.e., youths who were directly treated by the
laws) with the associated changes in outcomes for youths at or above each state’s helmet law age
threshold (i.e., youths who were not directly treated by the laws) coincident with policy adoption.
Estimates from these fully saturated models (with controls for age by state, age by year, and state
by year fixed effects) provide particularly strong evidence that the significant reductions in
bicycling associated with helmet law adoption are robust. Overall, our results highlight that a
Intended and Unintended Effects of Youth Bicycle Helmet Laws p.5
full cost benefit analysis of the laws should take into account the previously ignored reductions
in bicycling associated with helmet law adoption. More generally, our results highlight both the
intended and the unintended consequences of a well-meaning public health policy.
The paper proceeds as follows: Section 2 outlines the data and empirical approach,
Section 3 presents the results, and Section 4 concludes.2
2. Data Description and Empirical Framework
We use several different data sources to estimate the effects of mandatory helmet laws on youth
outcomes. We first revisit the relationship between helmet laws and bicycling fatalities by
updating Grant and Rutner’s (2005) estimates with data from 1991-2005 from Fatality Analysis
Reporting System (FARS).3 FARS contains data on a census of bicycle fatalities that involve an
accident with a motor vehicle within the 50 States and the District of Columbia. Using these
data, we create counts of the number of fatalities of bicycle riders among youths under age 16
(since most state helmet laws apply to children under age 16) and age 16-30 (as a specification
check) in each state and year from 1991 through 2005.
2 We do not provide a systematic review of the large public health and medical literatures that have examined the effects of bicycle helmet laws and bicycle helmets on helmet use, injuries, and bicycling using physical observations of cyclists and/or analyses of cross-sectional data. Multiple reviews of the literature have found that helmet laws have increased helmet use among the groups targeted by the laws (see, for example, Attwell et al. 2001, Towner et al. 2002, and Karkhaneh et al. 2006). Very few studies examine bicycle helmet laws in the United States; most research focuses on Australia or Canada (see, for example, Robinson 2003). An exception is Rodgers (2002) who used a telephone survey of approximately 900 young cyclists across several states that did and did not have helmet laws. That study found that, after controlling for individual demographic characteristics, state helmet laws were associated with statistically significant increases in the fraction of youths reporting that they “always” or “almost always” use a helmet when riding a bike, with effect sizes on the order of 18 percent. Notably, this study did not include non-cyclists, and as such could not address whether bicycling rates were different in states that had helmet laws compared to states that did not have these laws. Also, because the Rodgers (2002) study used a cross-sectional design, it could not address concerns about unobserved state specific characteristics that are correlated with both the presence of a helmet law and higher rates of helmet use. 3 From 2000-2005, four additional states adopted youth bicycle helmet laws.
Intended and Unintended Effects of Youth Bicycle Helmet Laws p.6
To model the count nature of the outcome variables we estimate negative binomial
models on annual state-specific fatality counts (Cameron and Trivedi 1998).4 In these models
we control for average per capita income and the state unemployment rate, and to account for
exposure we also enter the log of vehicle miles traveled per year in each state and the log of the
relevant state/year population.5 Our policy variable of interest is equal to one in states and years
when any helmet law for youths under age 16 is in place.6 To account for other state policies
that may have affected crash risk and driving and bicycling opportunities, we also controlled for
variables representing the presence of a state graduated driver licensing program with an
intermediate phase, the presence of a primary enforcement seatbelt law, the presence of a
secondary enforcement seatbelt law, the presence of a Zero Tolerance drunk driving law, the
presence of a .08 BAC per se drunk driving law, and the presence of various speed limits (65mph
and 70mph or greater) pertaining to cars on rural interstates. For all policy variables – including
the helmet law variable – we control for the fraction of the year that a policy was in effect. The
models also control for state and year effects, such that the coefficient of interest on the helmet
law variable is identified from within-state changes in fatalities coincident with adoption of a
helmet law, controlling for the associated changes in fatalities for residents of states that did not
adopt a helmet law in the same year. Throughout, we cluster standard errors at the state level
(Bertrand, Duflo, and Mullainathan 2004).
4 We used STATA 10.1’s nbreg procedure to estimate a fixed effects negative binomial model for the fatality analysis and interpret the coefficients as marginal effects. Although fixed effects negative binomial models can yield inconsistent parameter estimates due to the “incidental parameters” problem (Hausman, Hall, and Griliches 1984), fixed effects poisson models (which do not suffer from this problem) returned nearly identical results to those presented here (Cameron and Trivedi 1998). Moreover, our fixed effects negative binomial model is supported by recent research (Allison and Waterman 2002). 5 Vehicle miles traveled come from the 1991-2005 issues of the US Department of Transportation publication Highway Statistics. 6 Alternative fatality specifications that control for the relevant fraction of 0-15 year olds who should have been directly affected by each helmet law (e.g., defining the helmet law variable to equal 11/15 for laws that apply only to youths under age 12) returned very similar results.
Intended and Unintended Effects of Youth Bicycle Helmet Laws p.7
Our data on bicycling behaviors and helmet use for youths are from parental reports of
child outcomes from the Centers for Disease Control’s (CDC) Behavioral Risk Factor
Surveillance System (BRFSS) over the period 1995-2000. These data include parental reports of
bicycling behaviors and helmet use for youths as young as age 5. The BRFSS are random digit
dialing telephone surveys, and adult respondents are asked a series of questions about the safety
behaviors of the oldest child in their household between the ages of 5 and 15. Specifically,
adults are asked: “How often within the last year did [Child’s Name] wear a helmet when riding
a bicycle?” Response options included: “Never wears a helmet”, “Rarely wears a helmet”,
“Sometimes wears a helmet”, “Almost always wears a helmet”, and “Always wears a helmet”.7
Importantly, adults can also indicate that the youth never rides a bicycle. We exclude a small
number of adults who report that they don’t know or refused a response to the bicycle helmet
question, and we restrict attention to adults with no missing demographic information. We use
responses to this question to create a variable called Bicycle Rider that equals one if the parent
chose any of the latter five responses. To measure helmet use, we follow previous research by
creating a measure called Frequent Helmet Use that equals one if the parent reports that the
youth wore a helmet either “almost always” or “always”. We also created a continuous helmet
use measure that equals 1 for “always” wears a helmet, .75 for “almost always”, and so forth
through 0 for “never” wears a helmet.
We supplement the parental reports of child bicycling behaviors using restricted-use
versions of the national Youth Risk Behavior Surveillance System (YRBSS) over the period
1991-2005. These surveys are coordinated every other year by the Centers for Disease Control
and are administered by paper and pencil to high school students at schools in the spring. These
7 In the BRFSS data, the question about helmet use was in an Injury Control topical module that was only asked in a small handful of states for the even-numbered years between 1995 and 2000. For the odd-numbered years, however,
Intended and Unintended Effects of Youth Bicycle Helmet Laws p.8
data provide standard demographic characteristics, information on bicycle riding and helmet use,
and state of residence (provided by the CDC in a confidential request). For the YRBSS analysis
we restrict attention to youths with no missing data on demographic characteristics or helmet
use.8
Like the BRFSS, the core YRBSS questionnaire in each year since 1991 has included the
following question: “When you rode a bicycle during the past 12 months, how often did you
wear a helmet?”9 Response options include: “Did not ride a bicycle”, “Never”, “Rarely”,
“Sometimes”, “Most of the time”, and “Always”.10 We consider the same outcomes as in the
parental reports for the youth self-reports: Bicycle Rider and Frequent Helmet Use (“always” or
“most of the time” wore a helmet).
To estimate the effect of the mandatory helmet laws in the BRFSS and YRBSS data, we
first follow the basic approach in the fatality model described above and estimate two-way fixed
effects models on the group targeted by most helmet laws – those under age 16 in the YRBSS
(or, alternatively, parents of youths under age 16 in the BRFSS).11 The two-way fixed effects
model for 15 year olds and younger in both datasets amounts to OLS estimation of the following:
(1) Yist = β0 + β1Xist + β2(Mandatory Bicycle Helmet Law)st + β3Zst +β4S + β5T + εist
we observe large samples of adults across all 50 states and the District of Columbia. 8 Notably, the national YRBSS survey was not explicitly designed to produce estimates that are representative at the state level. Despite this, previous researchers have used these data in state policy evaluations such as ours (see, for example, Gruber and Zinman 2001, Carpenter and Cook 2008, Carpenter and Stehr 2008, and others). 9 In 1991-1997, the core YRBSS questionnaire also included a lead-in question about intensity of bicycle riding in the previous year. Specifically, youths were asked: “During the past 12 months, how many times did you ride a bicycle?,” with response options including: 0 times, 1 to 10 times, 11 to 20 times, 21 to 39 times, and 40 or more times. Unfortunately, over this shorter sample period we do not have enough state policy changes or sufficient statistical power to estimate precise helmet law effects. Models that were specified in a similar fashion to our main estimates returned results that were qualitatively similar to those we present below (i.e. state helmet laws were associated with reductions in youth bicycling intensity). 10 Note that these response options are worded in a slightly different fashion than those on the BRFSS questionnaire, though we treat them in a similar fashion. 11 Note that the BRFSS does not ask parents about outcomes for children age 16 and older.
Intended and Unintended Effects of Youth Bicycle Helmet Laws p.9
where Yist are the outcomes of interest (Frequent Helmet Use, Continuous Helmet Use, and
Bicycle Rider).12 Xist is a vector of individual student characteristics that includes: age dummies,
grade dummies, and race dummies in the YRBSS. In the BRFSS, Xist is a vector of parental
characteristics that includes: age dummies, marital status, and race dummies. Zst is a vector of
other potentially relevant state policies and characteristics, including: the state unemployment
rate, a dummy for the presence of a mandatory seatbelt law, and a dummy for any state
graduated driver licensing program with an intermediate phase. Mandatory Bicycle Helmet Law
is an indicator variable equal to one if the respondent lives in a state that had a mandatory helmet
law over the previous 12 months.13 The coefficient of interest, β2, captures the relative effect of
the mandatory helmet law on youth outcomes by comparing within state changes in outcomes for
youths in helmet adopting states coinciding with the law taking effect to the associated changes
in outcomes for youths in states that did not experience a policy change in that year. We include
unrestricted state and year fixed effects, and we cluster standard errors at the state level.
To complement the difference in differences specifications in the YRBSS data we also
explicitly take advantage of the age threshold in the helmet law statutes to estimate difference in
difference in differences (DDD) models (Gruber 1994). Specifically, we use changes in
bicycling for youths at or above the age cutoff coincident with helmet law adoption as controls
for the associated changes in outcomes for youths below the age cutoff. In practice, this amounts
12 Probit models returned very similar results. 13 This time window is chosen to account for the wording of the question. Note that in theory we would want to control for the fraction of the previous year the youth was covered by a helmet law. This is made difficult by the fact that we do not observe the actual date the surveys were administered; we simply know they were done in the spring. We choose to drop from the sample any observations from a state/year combination where this ‘fractional’ treatment status is uncertain. In practice, the timing of the effective dates of the laws combined with the fact that the surveys are only done in odd-numbered years means that this excludes very few observations. Creating such a “fractional” helmet law variable with the assumption that all youths are surveyed in, say, March, returned very similar results. In the BRFSS analyses we are able to account for a handful of state laws that set the relevant helmet law threshold at age 12 instead of age 16 due to the inclusion of parental reports for children as young as age 5. In
Intended and Unintended Effects of Youth Bicycle Helmet Laws p.10
to estimating a variant of equation (1) on the full sample of youths, augmented by including
interactions for a “treatment group” dummy (equal to one for all youths under the state’s helmet
law threshold) with each state dummy and each year dummy. Importantly, this model also
supports a full set of dummies for each state/year interaction. The key advantage to this model is
that the only assumption required for identification of the helmet law effect is that there are no
shocks to outcomes in experimental states that affect youths under the age threshold differently
than youths over the age threshold. We implement this model by estimating the following
equation:
(2) Yist = β0 + β1Xist + β2(Mandatory Bicycle Helmet Law*Treatment Group)st + β3S + β4T +
β5(Treatment Group * T) + β6(Treatment Group * S) + β7(S*T) + εist
where all variables are as defined above. Treatment Group is an indicator equal to one if the
youth is below her state’s relevant helmet law threshold. Note that in this model Zst, the vector
of state characteristics (such as the unemployment rate) that vary only at the state/year level, falls
out of the above specification since a full set of state by year interactions are included.
3. Results
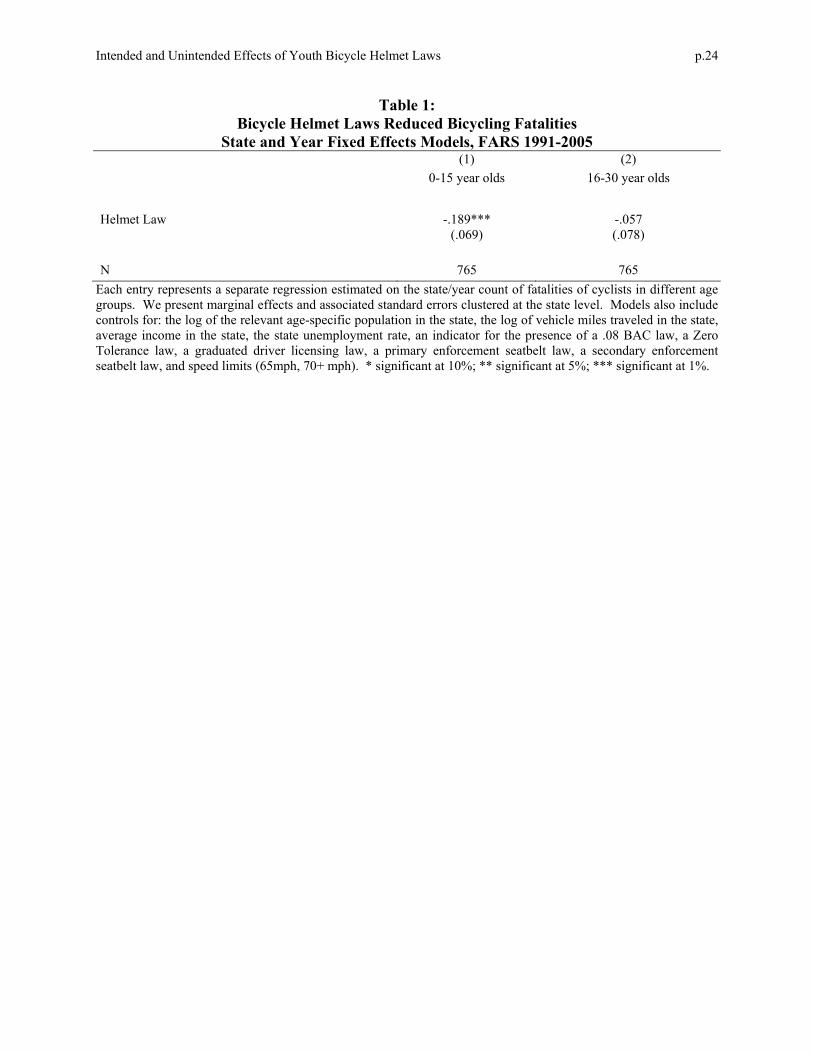
We begin by confirming and extending the result in Grant and Rutner (2004) that mandatory
bicycle helmet laws reduced bicycling fatalities. Recall that Grant and Rutner found that helmet
laws reduced juvenile fatalities by about 11 percent over the period 1990-2000. We present the
main results on bicycle fatalities among youths age 0-15 in the FARS data from 1991-2005 in
Table 1. Each entry in the table shows the coefficient and standard error on the Mandatory
Bicycle Helmet Law indicator from estimation of the fixed effects negative binomial model of
all the BRFSS models the Helmet Law variable is coded as “one” when the referenced youth is covered and “zero” otherwise.
Intended and Unintended Effects of Youth Bicycle Helmet Laws p.11
bicycle fatalities. These coefficients can be interpreted as percent changes in bicycling fatalities
associated with adoption of a helmet law. Column 1 presents the results for youths who should
have been most affected by helmet laws (youths age 0-15) while Column 2 presents the results
for young adults who should have been unaffected by the policies (age 16-30). The findings in
Table 1 confirm the key results from Grant and Rutner (2004) for the 1990s: state bicycle helmet
laws were associated with statistically significant reductions in youth bicycle fatalities among
youths age 0-15 on the order of 19 percent but were not significantly associated with bicycle
fatalities among 16-30 year olds.14
What factors contributed to the bicycling fatality reductions associated with helmet law
adoption documented in Table 1? We investigate this issue using helmet use and bicycling
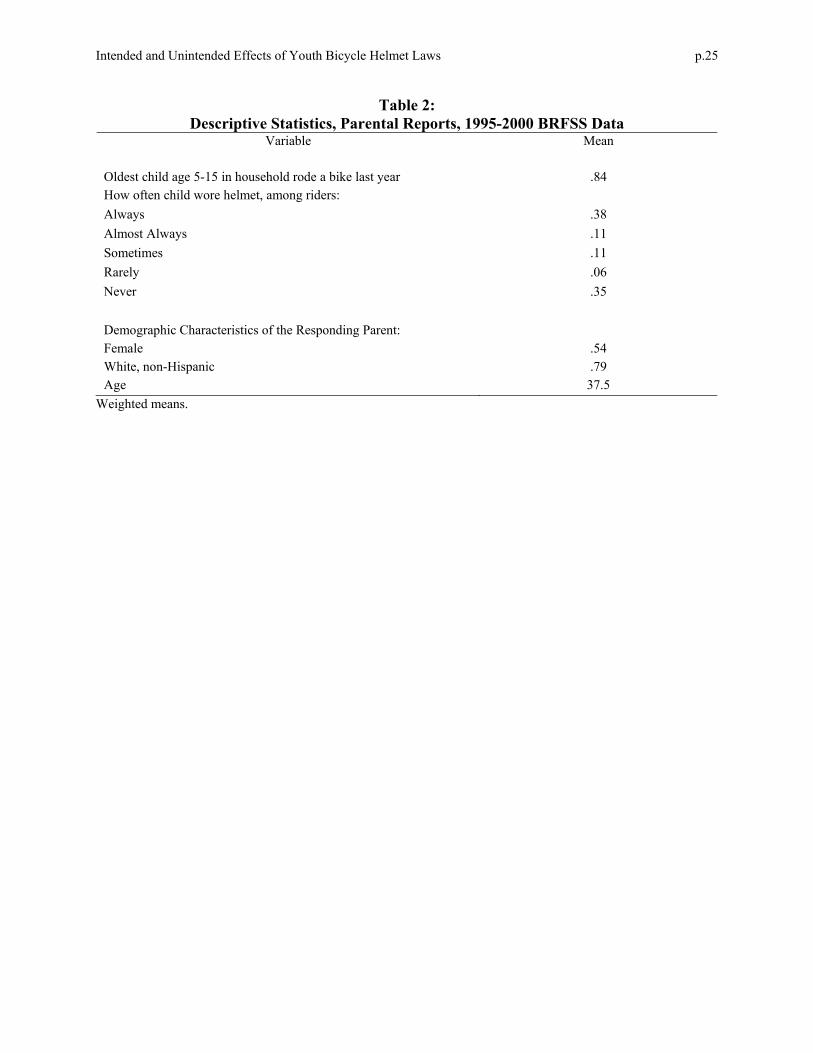
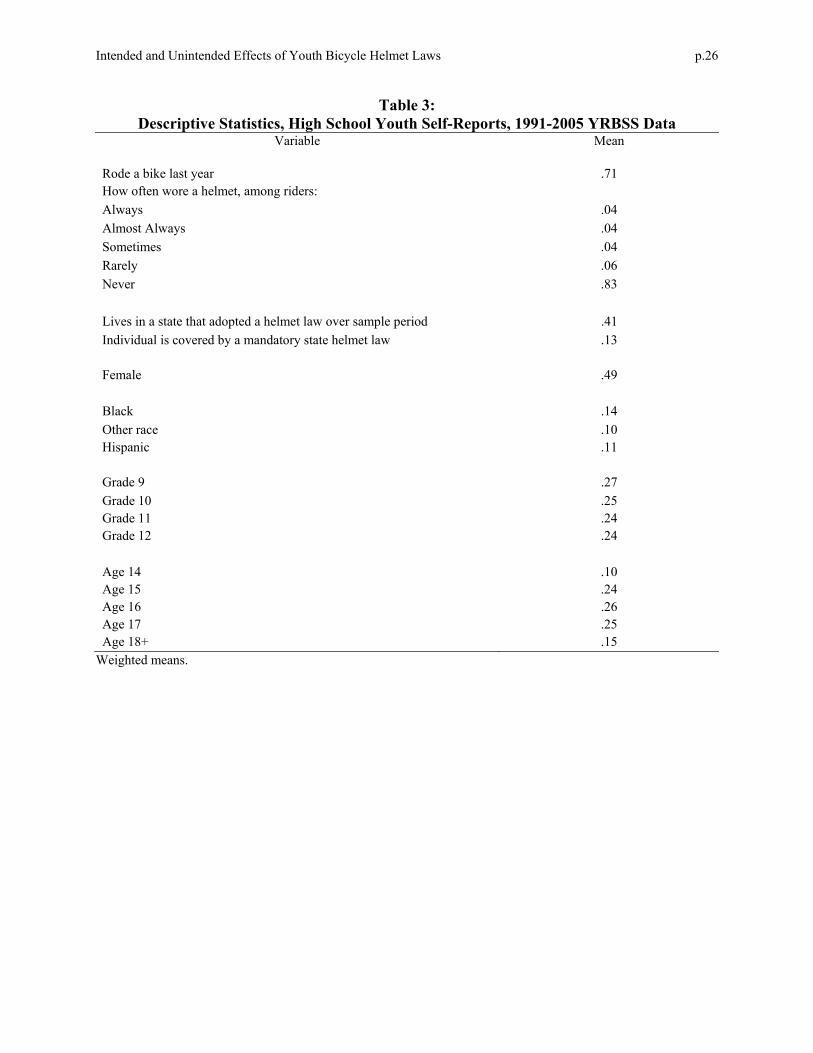
behaviors from the BRFSS and YRBSS. We begin by presenting key variable means for the
parental reports (BRFSS) in Table 2 and the youth self report data (YRBSS) in Table 3. The
BRFSS data reveal that about 84 percent of parents report their oldest child age 5-15 rode a bike
in the previous year, and about two thirds of bicycle riders wore a helmet when riding. The
YRBSS means in Table 3 show that 71 percent of high school age youths report that they rode a
bike in the previous year. Among past year high school-age cyclists in the YRBSS, however,
helmet use is rare: only about 16 percent of these youths report that they wore a helmet when
riding a bike. The differences in helmet use across the two datasets are largely a function of the
14 Our estimate of the effect of helmet laws on bicycling fatalities among youths is larger than that reported in Grant and Rutner (19 versus 11 percent). Personal correspondence with Darren Grant indicates that they examine deaths of all juveniles age 0-17 as their outcome variable of interest. We choose to focus on 0-15 year olds since the vast majority of state bicycle helmet laws explicitly apply only to those under age 16. Since we consider 16 and 17 year olds to be untreated by the laws, our estimate is less attenuated (i.e. larger). Indeed, when we estimate the same specification on deaths among 0-17 year olds, our estimate is 13 percent, considerably closer to that reported in Grant and Rutner (2004). We revisit the magnitude of the effect below, but for comparison purposes note that Dee (2009) finds that motorcycle helmet laws reduced motorcycle fatalities by about 27 percent over roughly this same time period.
Intended and Unintended Effects of Youth Bicycle Helmet Laws p.12
younger age distribution of children in the BRFSS, since bicycling and helmet wearing rates
strongly decline with age in this range.
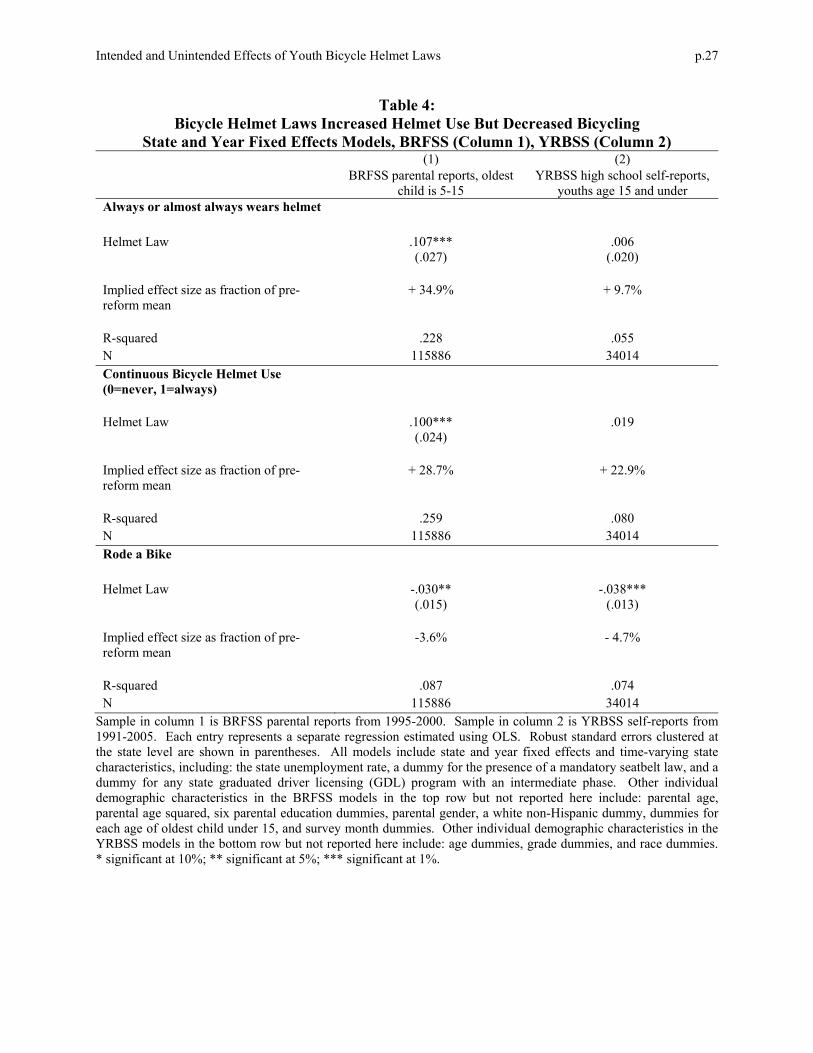
We provide direct evidence on the effects of helmet laws on helmet use in Table 4.
Specifically, we present the coefficients on the helmet law variable from two-way fixed effects
models estimated on the full sample (i.e., not conditional on past year bicycle riding) that control
for individual demographic characteristics, time-varying state characteristics, and a full set of
state and year fixed effects. We present the results for the parental reports of child helmet use
behaviors from the BRFSS in Column 1, and we present the associated results using the high
school youths’ self reports from the YRBSS in Column 2. In the top panel we present estimates
from a linear probability model where the outcome is an indicator for whether the youth always
or almost always wore a helmet when riding a bike. We complement these results in the middle
panel by presenting models where the outcome is a continuous measure of helmet use (where
“never” wore a helmet = 0 and “always” wore a helmet = 1). Finally, in the bottom panel we
show the two-way fixed effects results for the bicycling participation outcome that equals 1 if the
youth rode a bike in the past year. Each entry in the table reflects the coefficient on the helmet
law indicator, and reported standard errors have been clustered by state.
The results in Table 4 show that helmet laws did, in fact, increase helmet use. This is
particularly evident from the parental reports of child bicycling behaviors in Column 1 as
reported in the BRFSS. In the top panel of Column 1, for example, we estimate that adoption of
a helmet law increased frequent helmet use by 10.7 percentage points, or about 35 percent
relative to the pre-reform mean. We find a much smaller point estimate in Column 2 for the high
school youths’ self reports, though notably these are off a much smaller base, such that the
estimated proportional effect is nontrivial (about 10 percent). Results for the continuous measure
Intended and Unintended Effects of Youth Bicycle Helmet Laws p.13
of helmet use in the middle panel of Table 4 return more consistent evidence across the two
columns that helmet laws increased helmet use by 29 and 23 percent relative to pre-reform levels
in the BRFSS and YRBSS, respectively.
In the bottom panel of Table 4 we also present the first evidence for our main
contribution: namely, that helmet laws also reduced youth bicycling. Specifically, we find in
both the parental reports in Column 1 and in the high school youth self reports in Column 2 that
helmet laws reduced the probability a youth rode a bicycle in the previous year by 3-4 percentage
points, and both estimates are statistically significant at the five percent level. Relative to the
pre-reform means, the estimates in Columns 1 and 2 of the bottom panel of Table 4 suggest
helmet law effects on bicycling of about 4 and 5 percent, respectively.15
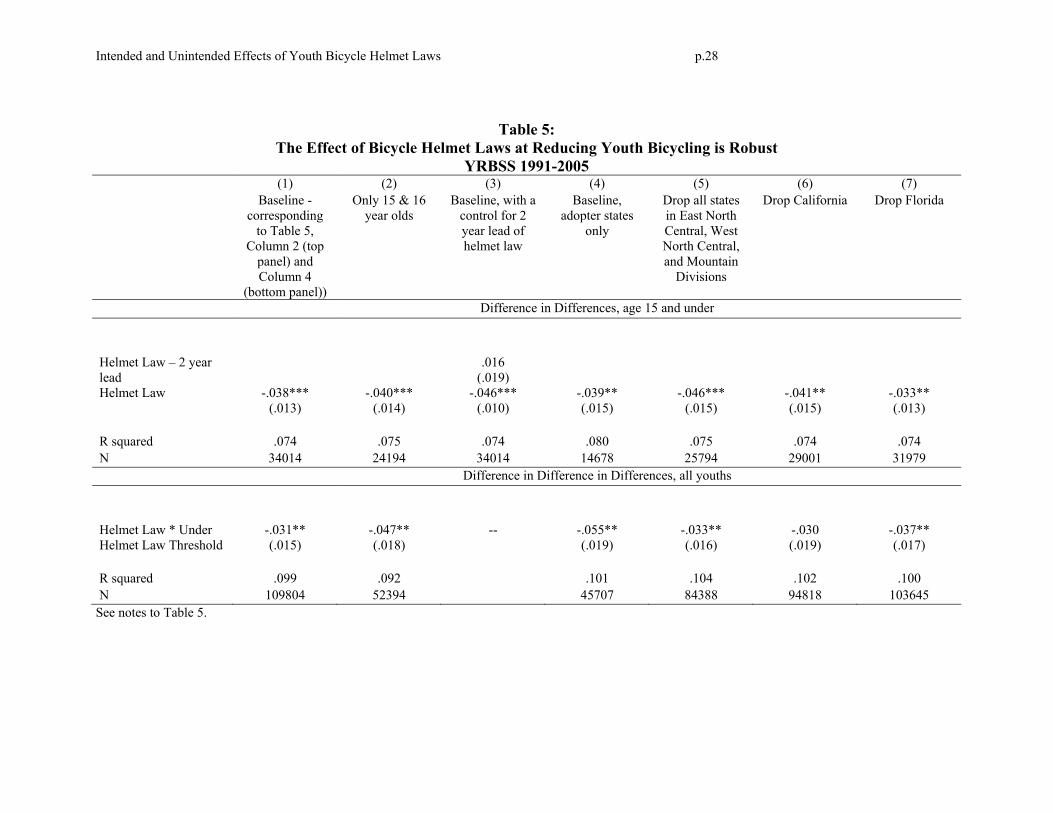
We further investigate the robustness of the main bicycling result for high school youths
in Table 5. The top panel of estimates shows results for the two-way fixed effects models, while
the bottom panel shows results for the augmented triple difference models with a full set of age
by state, age by year, and state by year fixed effects. The models in the bottom panel identify the
helmet law effects in youth bicycling by comparing the associated outcomes for high school
youths under the helmet law age threshold with those for youths at or above the age threshold
(who were therefore untreated) coincident with policy adoption, and we show the estimate on the
15 In results not reported but available upon request we found a small and statistically insignificant association between state graduated driver licensing (GDL) programs and youth bicycling in the YRBSS. This null finding is important, since it is inconsistent with a plausible confounding story: namely, that changes in driving availability (which are directly regulated by GDL program adoptions) might induce a substitution across modes of transportation that would bias our main bicycling result. See, for example, Dee et al. (2006) for a description of graduated driver licensing programs. In addition to the null empirical finding on GDL in the bicycling regression, it is also helpful to note that GDL programs were much more widespread than helmet laws over this time period. Moreover, GDL programs do not strictly adhere to the over/under 16 distinction in the same way that helmet laws do. This is because although GDL programs have common features (such as requiring intermediate phases for obtaining a driver’s license), states are still free to set the minimum age at which one can obtain her learner’s permit. This varies substantially across states, which further casts doubt on the ability of driving availability to explain our main bicycling result. Because we do not observe the respondent’s exact age, controlling for when the state adopted a GDL program is the best we can do to control for driving availability. Unfortunately, the YRBSS data do not contain consistent questions about driving behaviors or license status.
Intended and Unintended Effects of Youth Bicycle Helmet Laws p.14
coefficient of interest from equation (2) on the helmet law * treatment group interaction. In the
top panel of Column 1 of Table 5 we reprint the baseline DD estimate from the bottom panel of
Column 2 of Table 4 that helmet laws reduced bicycling among youths age 15 and under by a
statistically significant 3.8 percentage points. In the bottom panel of Column 1 of Table 5 we
show the associated DDD estimate for the full YRBSS sample which confirms that the DD
finding on bicycling we saw in Table 4 is robust to incorporating the bicycling behaviors of
slightly older youths. Specifically, our DDD estimate suggests that helmet laws reduced
bicycling by a statistically significant 3.1 percentage points.
The remaining columns of Table 5 confirm that the YRBSS bicycling reduction is robust
to other reasonable changes in specification and sample. In Column 2 we restrict attention to 15
and 16 year olds, who should be the most directly comparable, and we continue to find that
helmet laws significantly reduced youth bicycling. In the top panel of Column 3 we estimate a
DD model that in addition to the usual helmet law indicator also includes a variable that “turns
on” two years prior to each state’s actual helmet law. The use of this lead variable captures the
possibility that helmet laws were adopted in response to some systematic change in bicycling
behaviors within adopting states, potentially affecting the interpretation of our helmet law
effects. Despite this possibility, we find that including the two year lead variable does not
change our main result that helmet laws reduced bicycling, and the coefficient on the lead
variable is small and statistically insignificant. Column 4 restricts attention to youths living in
states that ever adopted a helmet law, another standard robustness check. This approach returns
similar DD and DDD estimates to the baseline, both of which are statistically significant. This
confirms that our bicycling estimates are not driven by offsetting changes in behavior in control
states coincident with helmet law adoptions.
Intended and Unintended Effects of Youth Bicycle Helmet Laws p.15
Columns 5-7 of Table 5 address concerns about potential outliers and the geographic
distribution of helmet law states. Figure 1 shows the set of states that adopted helmet laws over
our sample period. Notably, the states are largely concentrated on the coasts, with no states in
the Midwest or Mountain areas that ever adopted statewide helmet laws. In Column 5 we
estimate models on a sample that drops all states in divisions that contain no helmet law adopters
(East North Central, West North Central, and Mountain). The intuition here is that the set of
“control” states is arguably more like the set of “treatment” states when we restrict attention to
states within the same Census divisions; doing so has little effect on the bicycling estimates, and
they remain statistically significant. In Columns 6 and 7 we drop California and Florida,
respectively, from the sample. Each of these states adopted a helmet law over this time period
and contributes over 1,500 observations to the full sample. Ensuring that these large states are
not driving the bicycling estimates – as confirmed in Columns 6 and 7 – is an important
robustness check. In results not reported, we also found that excluding each other helmet law
adopter individually did not materially alter our main finding that helmet laws reduced youth
bicycle riding in the YRBSS.16
16 We also performed these same robustness checks on the fatality models presented in Table 1 and obtained similar results. In results not reported but available upon request we also examined a number of other “placebo” outcomes that should not have been directly affected by helmet laws (e.g., seatbelt use, motorcycle riding, smoking, drinking, sexual activity) to ensure that our observed effects are not simply proxying for contemporaneous changes in (un)healthy behaviors that – while unlikely in our empirical framework – could bias our estimated helmet law effects. We found no consistent evidence that bicycle helmet law adoption was associated with economically or statistically significant effects on any of the other risky behaviors. These null findings further reinforce our main result that helmet laws reduced bicycling. Finally, we also examined the possibility that helmet laws – by reducing bicycling – could have resulted in other negative health spillovers such as lack of exercise and increases in obesity. Unfortunately, we do not observe consistent measures of body weight or sedentary activity (such as hours of television viewing) over the entire sample period 1991-2005. Using the same empirical approach as in Table 5, however, we found no evidence that helmet laws reduced physical activity as measured by: 1) participation in hard physical exercise for at least 20 minutes in any day in the previous week; 2) participation in muscle strengthening activities (e.g. weight lifting or push-ups) on any days in the previous week; 3) exercising for the purpose of losing weight or maintaining current weight; and 4) participation in any sports teams. These results are available upon
Intended and Unintended Effects of Youth Bicycle Helmet Laws p.16
4. Discussion and Conclusion
The results above show that state laws adopted over past two decades that require youths to wear
helmets when riding a bicycle reduced youth bicycling fatalities by about 19 percent, increased
helmet use by 20-34 percent, and (unintentionally) reduced bicycling by 4-5 percent. Given that
the foregone utility of riding a bicycle would seem relatively substantial, why do helmet laws
lead to reduced cycling? There are several possibilities. First, the costs of helmet use are likely
nontrivial for some youths. In addition to the direct monetary costs of bicycle helmets (usually
between $10 and $40), there are likely to be substantial social costs (recall that survey evidence
shows that youths do not like wearing helmets primarily because they are “uncool”). These costs
are likely to be magnified if there are significant peer effects. Second, there is evidence that
youths have suboptimally high discount rates (Gruber 2001), such that some youths might place
too little weight on the expected gain in future utility from the prevention of injury or death
relative to the costs of wearing helmets today. Finally, note that there are several reasonably
close alternatives to bicycling (such as skateboarding and in-line skating) that are not regulated
in the same way with respect to mandated helmet use. Helmet laws change the relative prices
among these activities, such that the robust reduction in bicycling we observe may be at least
partially offset by increases in other related activities.17
Are the magnitudes of our results plausible given what we know about the technological
efficacy of bicycle helmets and the helmet law-induced changes in helmet use? To understand
what fatality reduction would be implied by our estimated increases in helmet use, we use Evans’
basic calculation for seat belt effectiveness that uses information on the technological efficacy of
request and suggest that although helmet laws reduced bicycling, they did not appear to have large spillovers to other measures of physical activity for youths. 17 Unfortunately, we do not observe measures of participation in these activities in our data, nor can we credibly identify fatalities from these activities in the FARS in order to directly test this risk compensation hypothesis.
Intended and Unintended Effects of Youth Bicycle Helmet Laws p.17
helmets (1987). This calculation shows that: F = [E Δh] / [1 – Eh], where F is the proportional
fatality reduction, E is the technological efficacy of bicycle helmets, and h is the helmet use rate.
Note that about 66 percent of our 5-15 year old sample from the BRFSS wears helmets, and
Table 4 showed that helmet laws increased helmet use by about .10 (using the continuous helmet
use measure). We are not aware of estimates from the public health or medical literatures that
directly estimate the technological efficacy of bicycle helmets at reducing fatalities, though
Thompson et. al. (1989) use case-control methods to find that bicycle helmets reduce serious
head and brain injuries by over 80 percent; they suggest the efficacy is likely even greater for
youths. Perhaps the closest comparison regarding helmet efficacy in the context of fatalities
comes from Dee’s motorcycle helmet study which uses Evans’ “double pairs” comparisons to
find that motorcycle helmets reduce motorcycle fatalities by 34 percent (2009). If bicycle
helmets were equally effective as motorcycle helmets, we would expect helmet laws to reduce
bicycling fatalities by about 4.4 percent [(.34*.1)/(1-.34*.66)] in the absence of any reduction in
risk exposure.
Our fatality estimate of 19 percent is substantially larger than this, though several points
are worth mentioning. First, our fatality estimate has a relatively large standard error, such that
we cannot rule out that the true fatality effect is substantially smaller than our reported estimate.
Second, the 4.4 percent implied fatality reduction does not take into account the direct reduction
in risk exposure associated with reduced bicycling which should independently reduce
fatalities.18 Third, if bicycle helmet laws increase police attention to bicycling routes, then we
18 Although we estimate that bicycling participation fell by about 5 percent, it is likely that overall bicycling miles travelled fell even more. Unfortunately, neither the YRBSS nor the BRFSS asked consistent questions about bicycling intensity over the full sample period. As noted previously, however, the YRBSS did ask about the number of instances of bike riding from 1991 to 1997. We estimated equation (1) on this outcome (using the midpoints of the ranges and coding the top category as 50 instances) and found that helmet laws reduced bicycling among high school youths age 15 and under by 2.34 instances, or about 11 percent relative to the pre-reform mean of 21.32 instances. This suggests that the true overall reduction in bicycling miles travelled – and thus exposure to potential
Intended and Unintended Effects of Youth Bicycle Helmet Laws p.18
would expect an additional fatality reduction associated with more careful driving along those
enforced routes that has nothing to do with helmet technology or helmet use per se. Fourth,
parents may purchase other safety equipment such as blinking lights or reflective clothing for
their children at the same time that they might buy their child a helmet to comply with a newly
passed helmet law. If such equipment actually prevents accidents or reduces their severity, then
its purchase could substantially augment the effectiveness of helmet laws. Finally, our estimated
fatality effect size is comparable in magnitude to credible estimates from public policy in related
settings; multiple recent evaluations of motorcycle helmet laws find that they reduce
motorcycling fatalities by 27-33 percent (see, for example, Dee 2009, Houston and Richardson
2008). Moreover, as in our setting for bicycle helmet laws, Dee shows that motorcycle helmet
laws induce larger changes in fatalities than can be directly implied by reasonable changes in
helmet use and estimates of helmet efficacy.
The current study has several important limitations. First, we did not control for the
arguably important effects of enforcement, outreach, or media campaigns because we are not
aware of a source that consistently tracks these efforts at the state level over our sample period.
Efforts of this type such as “helmet giveaways” are of concern if they are correlated with
adoption of a mandatory helmet law. Notably, however, this type of bias is not likely to be the
main determinant of our estimated effects on bicycling behavior, since helmet giveaways should,
if anything, increase bicycling behavior. Given that we find significant decreases in bicycling
participation, this suggests that our estimates on bicycling are likely understated with respect to
outreach campaigns. Second, all of the bicycling data are self-reported, either by parents (in the
BRFSS) or students (in the YRBSS). While we find it plausible that youths and parents might be
bicycling accidents – is larger than our bicycling participation estimates in Tables 3 and 4. These estimates are of course based on fewer state changes and as such are less precise than the results for bicycle riding, which we
Intended and Unintended Effects of Youth Bicycle Helmet Laws p.19
more likely to falsely report helmet use in the presence of a helmet law (perhaps because stigma
associated with not wearing a helmet has increased), this type of bias is unlikely to affect our
estimates on bicycling participation. Third, we lack important data that would allow us to
provide a more comprehensive assessment of helmet laws. Information on helmet ownership,
for example, would be extremely useful since research has shown a strong concordance between
ownership and use (Schieber et. al. 1996). This information could be important for
understanding the likely relative effectiveness of helmet “give-aways” versus media campaigns
to reduce the stigma of wearing a helmet (i.e., if the main effect is driven by helmet availability,
give-aways could be particularly effective). Finally, information on other adverse outcomes
(such as head injuries, emergency room visits, and hospitalizations) would be necessary for a
complete accounting of the costs and benefits of helmet laws.
Despite these limitations, our research has provided the first comprehensive quasi-
experimental evaluation of the effects of helmet laws on bicycling and helmet use behaviors
among youths. As other states consider helmet laws as a way to reduce bicycling related injuries
and fatalities, they should keep in mind that although the laws increase helmet use and reduce
fatalities, they are also likely to reduce bicycling among the targeted group. While it is possible
the public health benefits from mandating helmet laws may outweigh the reductions in utility
associated with less bicycling, future research evaluating the full costs and benefits of these
policies should acknowledge these effects.19
observe over the entire sample period from 1991 to 2005 in the YRBSS. 19 We provide here a very rough back of the envelope calculation of these effects. In 2005, there were 103 bicycle fatalities among 0-15 year olds in the 36 states without a helmet law applying to youths under age 16. We estimate that helmet laws would reduce these fatalities by 19 percent, or 19.57 bicycling fatalities per year. Using a value of a statistical life of about $8 million in 2005 dollars (Viscusi and Aldy 2003), the annual benefit from saving these additional lives would be roughly $157 million ($8 million * 19.57 lives). There are about 41.9 million youths age 0-15 in these states without helmet laws. Given that 84 percent of youths age 5-15 ride bicycles and 35 percent of these youths do not wear helmets, we estimate that a helmet law would potentially constrain about 12.3 million youths (41.9 million * .84 *.35). Alternatively, if we consider only those youths whose helmet use increases as
Intended and Unintended Effects of Youth Bicycle Helmet Laws p.20
having been actually constrained, then we estimate that helmet laws constrain about 3.5 million youths (41.9 million * .84 * .10). Assuming a real discount rate of 4 percent and a 30-year time horizon, we estimate the present discounted value of the benefit to be roughly $800 for each cyclist whose helmet use increases in response to the law. Note this calculation ignores other benefits from the laws (such as injury reductions) as well as other costs (such as the value of foregone cycling).
Intended and Unintended Effects of Youth Bicycle Helmet Laws p.21
REFERENCES American Automobile Association (AAA) (1995). Survey of attitudes about bicycle helmets of
school children age 8 to13. Reviewed by Consumer Products Safety Commission and as reported online at http://www.helmets.org/kidspeak.htm.
Allison, P. and R. Waterman (2002). “Fixed effects negative binomial regression models,”
Sociological Methodology, 32(1): 247-265. Atwell, R., K. Glase, and M. McFadden (2001). “Bicycle helmet efficacy: a meta-analysis,”
Accident Analysis and Prevention, 33(3): 345-352. Bertrand, M., E. Duflo, and S. Mullainathan (2004). “How Much Should We Trust Difference-
In-Differences Estimates?,” Quarterly Journal of Economics, 119(1): 249-275. Carpenter, C. and P. Cook (2008). “Cigarette Taxes and Youth Smoking: New Evidence from
Local, State, and National Youth Risk Behavior Surveys,” Journal of Health Economics, 27(2): 287-299.
Carpenter, C. and M. Stehr (2008). “The Effects of Mandatory Seatbelt Laws and Youth
Seatbelt Use on Traffic Fatalities and Nonfatal Injuries,” Journal of Health Economics, 27(3): 642-662.
Dee, T. (2009). “Motorcycle helmets and traffic safety,” Journal of Health Economics, 28: 398-
412. Dee, T., Grabowski, D., and M. Morrisey (2005). “Graduated driver licensing and teen traffic
fatalities,” Journal of Health Economics, 24: 571-589. Evans, L. (1987). “Estimating fatality reductions from increased safety belt use,” Risk Analysis,
7(1): 49-57. Grant, D. and S. Rutner (2004). “The Effect of Bicycle Helmet Legislation on Bicycling
Fatalities,” Journal of Policy Analysis and Management, 23(3): 595-611. Gruber, J. (2001). “Introduction” in Jonathan Gruber, ed., Risky Behavior Among Youths: An
Economic Analysis. Chicago: University of Chicago Press, 69-120. ----- (1994). “The Incidence of Mandated Maternity Benefits,” American Economic Review,
84(3): 622-641. Gruber, J. and J. Zinman (2001). “Youth smoking in the United States: Evidence and
implications” in Jonathan Gruber, ed., Risky Behavior Among Youths: An Economic Analysis. Chicago: University of Chicago Press, 69-120.
Intended and Unintended Effects of Youth Bicycle Helmet Laws p.22
Houston, D. and L. Richardson (2008). “Motorcyclist Fatality Rates and Mandatory Helmet-Use Laws,” Accident Analysis and Prevention, 40(1): 200-208.
Hausman, J., Hall, B., and Z. Griliches (1984). “Econometric Models for Count Data with an
Application to the Patents-R&D Relationship,” Econometrica, 52(4): 909-938. Karkhaneh, M., J. Kalenga, B. Hagel, and B. Rowe (2006). “Effectiveness of bicycle helmet
legislation to increase helmet use: a systematic review,” Injury Prevention, 12: 76-82. Lee, B., J. Schofer, and F. Koppelman (2005). “Bicycle safety helmet legislation and bicycle-
related non-fatal injuries in California,” Accident Analysis and Prevention, 37: 93-102. Macpherson, A., P. Parkin, and T. To (2001). “Mandatory helmet legislation and children’s
exposure to cycling,” Injury Prevention, 7: 228-230. Ni, H., J. Sacks, L. Curtis, P. Cieslak, and K. Hedberg (1997). “Evaluation of a statewide
bicycle helmet law via multiple measures of helmet use,” Archives of Pediatric & Adolescent Medicine, 151(1).
Robinson, D. (2003). “Helmet laws and cycle use,” Injury Prevention, 9: 380. Peltzman, S. (1975). “The effects of automobile safety regulations,” Journal of Political
Economy, 83: 677-725. Rodgers, G. (2002). “Effects of state helmet laws on bicycle helmet use by children and
adolescents,” Injury Prevention, 8: 42-46. Schieber, R., M. Kresnow, J. Sacks, E. Pledger, J. O’Neil, and K. Toomey (1996). “Effect of a
state law on reported bicycle helmet ownership and use,” Archives of Pediatrics & Adolescent Medicine, 150(7).
Thompson, R., F. Rivara, and D. Thompson (1989). “A case-control study of the effectiveness
of bicycle safety helmets,” New England Journal of Medicine, 320(21): 1361-1367. Towner, E., T. Dowswell, M. Burkes, H. Dickinson, J. Towner, and M. Hayes (2002). “Bicycle
helmets: review of effectiveness (No: 30)” report commissioned by the UK Department for Transport. Available online at: http://www.dft.gov.uk/stellent/groups/dft_rdsafety/documents/pdf/dft_rdsafety_pdf_507998.pdf.
Viscusi, K. and J. Aldy (2003). “The Value of a Statistical Life: A Critical Review of Market
Estimates Throughout the World,” Journal of Risk and Uncertainty, 27(1): 5-76.
Intended and Unintended Effects of Youth Bicycle Helmet Laws p.23
Figure 1. States with Bicycle Helmet Laws, as of 2005
Intended and Unintended Effects of Youth Bicycle Helmet Laws p.24
Table 1: Bicycle Helmet Laws Reduced Bicycling Fatalities
State and Year Fixed Effects Models, FARS 1991-2005 (1) (2) 0-15 year olds 16-30 year olds Helmet Law -.189***
(.069) -.057 (.078)
N 765 765
Each entry represents a separate regression estimated on the state/year count of fatalities of cyclists in different age groups. We present marginal effects and associated standard errors clustered at the state level. Models also include controls for: the log of the relevant age-specific population in the state, the log of vehicle miles traveled in the state, average income in the state, the state unemployment rate, an indicator for the presence of a .08 BAC law, a Zero Tolerance law, a graduated driver licensing law, a primary enforcement seatbelt law, a secondary enforcement seatbelt law, and speed limits (65mph, 70+ mph). * significant at 10%; ** significant at 5%; *** significant at 1%.
Intended and Unintended Effects of Youth Bicycle Helmet Laws p.25
Table 2: Descriptive Statistics, Parental Reports, 1995-2000 BRFSS Data
Variable Mean Oldest child age 5-15 in household rode a bike last year .84 How often child wore helmet, among riders: Always .38 Almost Always .11 Sometimes .11 Rarely .06 Never .35 Demographic Characteristics of the Responding Parent: Female .54 White, non-Hispanic .79 Age 37.5
Weighted means.
Intended and Unintended Effects of Youth Bicycle Helmet Laws p.26
Table 3: Descriptive Statistics, High School Youth Self-Reports, 1991-2005 YRBSS Data
Variable Mean Rode a bike last year .71 How often wore a helmet, among riders: Always .04 Almost Always .04 Sometimes .04 Rarely .06 Never .83 Lives in a state that adopted a helmet law over sample period .41 Individual is covered by a mandatory state helmet law .13 Female .49 Black .14 Other race .10 Hispanic .11 Grade 9 .27 Grade 10 .25 Grade 11 .24 Grade 12 .24 Age 14 .10 Age 15 .24 Age 16 .26 Age 17 .25 Age 18+ .15
Weighted means.
Intended and Unintended Effects of Youth Bicycle Helmet Laws p.27
Table 4: Bicycle Helmet Laws Increased Helmet Use But Decreased Bicycling
State and Year Fixed Effects Models, BRFSS (Column 1), YRBSS (Column 2) (1) (2) BRFSS parental reports, oldest
child is 5-15 YRBSS high school self-reports,
youths age 15 and under Always or almost always wears helmet Helmet Law .107***
(.027) .006
(.020) Implied effect size as fraction of pre-reform mean
+ 34.9% + 9.7%
R-squared .228 .055 N 115886 34014 Continuous Bicycle Helmet Use (0=never, 1=always)
Helmet Law
.100*** (.024)
.019
Implied effect size as fraction of pre-reform mean
+ 28.7% + 22.9%
R-squared .259 .080 N 115886 34014 Rode a Bike Helmet Law
-.030** (.015)
-.038*** (.013)
Implied effect size as fraction of pre-reform mean
-3.6% - 4.7%
R-squared .087 .074 N 115886 34014
Sample in column 1 is BRFSS parental reports from 1995-2000. Sample in column 2 is YRBSS self-reports from 1991-2005. Each entry represents a separate regression estimated using OLS. Robust standard errors clustered at the state level are shown in parentheses. All models include state and year fixed effects and time-varying state characteristics, including: the state unemployment rate, a dummy for the presence of a mandatory seatbelt law, and a dummy for any state graduated driver licensing (GDL) program with an intermediate phase. Other individual demographic characteristics in the BRFSS models in the top row but not reported here include: parental age, parental age squared, six parental education dummies, parental gender, a white non-Hispanic dummy, dummies for each age of oldest child under 15, and survey month dummies. Other individual demographic characteristics in the YRBSS models in the bottom row but not reported here include: age dummies, grade dummies, and race dummies. * significant at 10%; ** significant at 5%; *** significant at 1%.
Intended and Unintended Effects of Youth Bicycle Helmet Laws p.28
Table 5: The Effect of Bicycle Helmet Laws at Reducing Youth Bicycling is Robust
YRBSS 1991-2005 (1) (2) (3) (4) (5) (6) (7) Baseline -
corresponding to Table 5,
Column 2 (top panel) and Column 4
(bottom panel))
Only 15 & 16 year olds
Baseline, with a control for 2 year lead of helmet law
Baseline, adopter states
only
Drop all states in East North Central, West North Central, and Mountain
Divisions
Drop California Drop Florida
Difference in Differences, age 15 and under Helmet Law – 2 year lead
.016 (.019)
Helmet Law -.038*** (.013)
-.040*** (.014)
-.046*** (.010)
-.039** (.015)
-.046*** (.015)
-.041** (.015)
-.033** (.013)
R squared .074 .075 .074 .080 .075 .074 .074 N 34014 24194 34014 14678 25794 29001 31979 Difference in Difference in Differences, all youths Helmet Law * Under Helmet Law Threshold
-.031** (.015)
-.047** (.018)
-- -.055** (.019)
-.033** (.016)
-.030 (.019)
-.037** (.017)
R squared .099 .092 .101 .104 .102 .100 N 109804 52394 45707 84388 94818 103645
See notes to Table 5.
Intended and Unintended Effects of Youth Bicycle Helmet Laws p.29
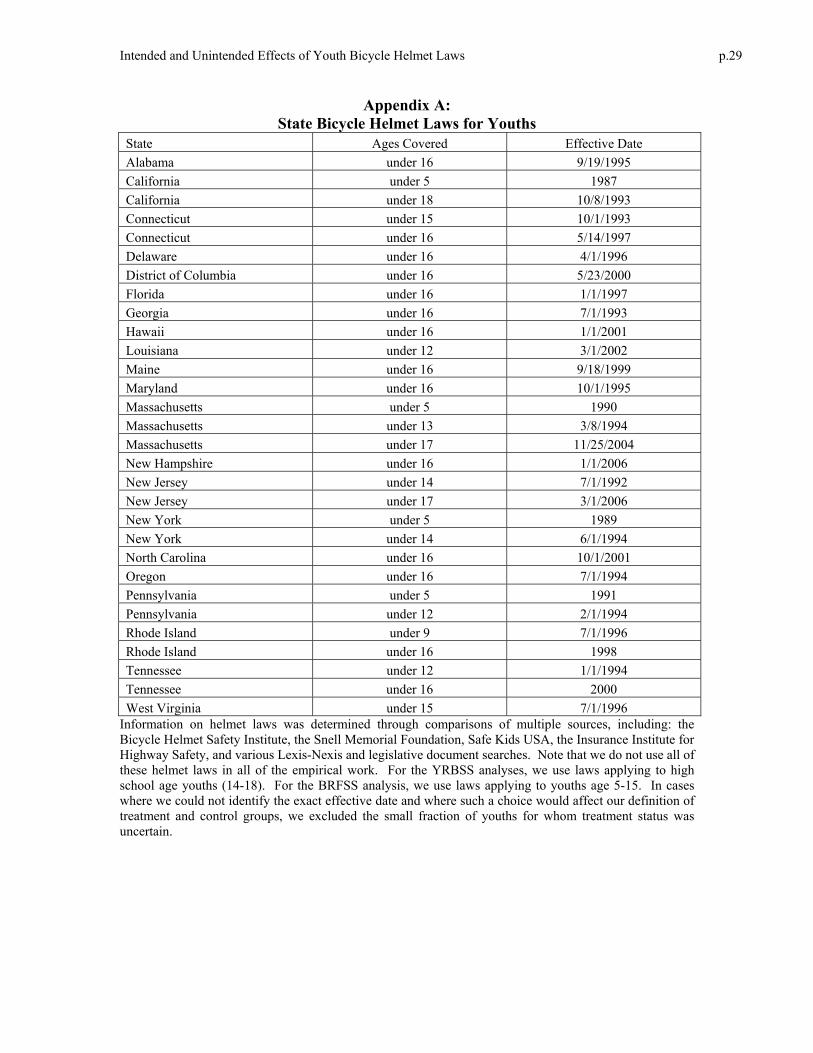
Appendix A: State Bicycle Helmet Laws for Youths
State Ages Covered Effective Date Alabama under 16 9/19/1995 California under 5 1987 California under 18 10/8/1993 Connecticut under 15 10/1/1993 Connecticut under 16 5/14/1997 Delaware under 16 4/1/1996 District of Columbia under 16 5/23/2000 Florida under 16 1/1/1997 Georgia under 16 7/1/1993 Hawaii under 16 1/1/2001 Louisiana under 12 3/1/2002 Maine under 16 9/18/1999 Maryland under 16 10/1/1995 Massachusetts under 5 1990 Massachusetts under 13 3/8/1994 Massachusetts under 17 11/25/2004 New Hampshire under 16 1/1/2006 New Jersey under 14 7/1/1992 New Jersey under 17 3/1/2006 New York under 5 1989 New York under 14 6/1/1994 North Carolina under 16 10/1/2001 Oregon under 16 7/1/1994 Pennsylvania under 5 1991 Pennsylvania under 12 2/1/1994 Rhode Island under 9 7/1/1996 Rhode Island under 16 1998 Tennessee under 12 1/1/1994 Tennessee under 16 2000 West Virginia under 15 7/1/1996
Information on helmet laws was determined through comparisons of multiple sources, including: the Bicycle Helmet Safety Institute, the Snell Memorial Foundation, Safe Kids USA, the Insurance Institute for Highway Safety, and various Lexis-Nexis and legislative document searches. Note that we do not use all of these helmet laws in all of the empirical work. For the YRBSS analyses, we use laws applying to high school age youths (14-18). For the BRFSS analysis, we use laws applying to youths age 5-15. In cases where we could not identify the exact effective date and where such a choice would affect our definition of treatment and control groups, we excluded the small fraction of youths for whom treatment status was uncertain.