Embed Size (px)
Citation preview

Summer 2017 was marred by two apparently anomalous events in the geosynchronous orbit (GEO) belt. Both incidents have been observed by commercial space situation awareness providers, but as of 26 December 2017 no debris from either event have entered the public catalog.
The GEO communications spacecraft AMC-9 (International Designator 2003-024A, U.S. Strategic Command [USSTRATCOM] Space Surveillance Network [SSN] catalog number 27820), formerly known as GE-12, experienced an energetic event estimated to have occurred at approximately 07:10 GMT on 17 June 2017, after approximately 14 years on-orbit. Fig. 1 depicts the orbital evolution of the spacecraft in 2017. SES, the spacecraft owner-operator, described this event as a “serious anomaly.” Following this event, the spacecraft began a westward drift in the GEO belt. Debris fragments have been observed in the vicinity of the AMC-9 spacecraft. SES has regained control of the spacecraft and has transferred AMC-9 to the so-called graveyard orbit, a long-term disposal orbit region located above the GEO belt. The NASA Orbital Debris Program Office (ODPO) characterizes this episode as an anomalous event.
The spacecraft bus is the popular Thales Alenia Space (formerly Alcatel Space) Spacebus-3000B3
platform. Spacecraft dry mass is estimated to be on the order of 2000 kg. On-board stored energy sources include fuel and pressurized components, as well as the battery subsystem.
The Indonesian GEO communications spacecraft TELKOM-1 (1999-042A, SSN catalog number 25880) experienced an energetic event on or about 25 August 2017, after over 18.1 years on-orbit—3 years past its nominal operational lifetime. An examination of the Two Line Element data indicates an observable change in spacecraft orbit between 26 and 29 August. At the beginning of this time interval, approximately
Space Debris Sensor Launches Aboard SpaceX-13 2
SEM Analysis Results of Returned ISS PMA-2 Cover 4
CubeSat Study Project Review 6
Space Debris Sensor Installation 8
Monthly Object Type Charts by Number and Mass 10
Space Missions and Satellite Box Score 12
Orbital DebrisQuarterly News
Volume 22, Issue 1February 2018
National Aeronautics and Space Administration
A publication ofthe NASA Orbital
Debris Program Office
Inside... Two Anomalous Events in GEO
continued on page 2
Figure 1. The 2017 orbital evolution of the AMC-9 spacecraft. Depicted are the subsatellite longitude, demonstrating a westward drift post-event, and the apogee/perigee altitude history. The altitude profile clearly indicates the abrupt nature of the 17 June 2017 event, recovery activities by the owner/operator, and the final boost to the so-called graveyard orbit above the GEO belt. Inclination control appears to have terminated in late June 2017.
35500
35600
35700
35800
35900
36000
36100
36200
36300
0
60
120
180
240
300
360
2017
.00
2017
.08
2017
.17
2017
.25
2017
.33
2017
.42
2017
.50
2017
.58
2017
.67
2017
.75
2017
.83
2017
.92
2018
.00
altitude [km]
subsatellite longitu
de [°]
time [YYYY.Y]
AMC‐9 (SSN 27820, 2003‐024A)
subsatellite longitude [o]
apogee alt [km]
perigee alt. [km]

Orbital Debris Quarterly News
2
The NASA Orbital Debris Program Office (ODPO) Space Debris Sensor (SDS) was launched to the International Space Station (ISS) aboard the Commercial Resupply mission CRS-13 (or SpaceX-13, SpX-13) vehicle on Friday, 15 December 2017, from Cape Canaveral Air Force Station's (CCAFS's) Launch Complex 40. Following the launch of a Space Exploration Technologies Corp. (SpaceX) Falcon 9 recoverable booster, Fig. 1, the Dragon vehicle separated from the Falcon 9’s second stage, Fig. 2, en route to the ISS. The launch featured, for the first time, the second use of both the Falcon 9 first stage and the Dragon capsule, and post-staging the Falcon 9 first stage landed at SpaceX's Landing Zone 1 at CCAFS. The Dragon capsule rendezvoused with the ISS on Sunday, 17 December, and was captured and docked that day.
The SDS was robotically extracted from the SpX-13 Dragon trunk and installed on 1 January 2018. As seen in Fig. 3, the SDS is hosted
at the ESA Columbus module’s External Payload Facility-Starboard Overhead-X (EPF-SOX)
location. Following a multi-week checkout period SDS is expected, as the ODQN goes to
press, to commence 3 years of operations at this location. Following completion of the SDS mission, the SDS is planned to be disposed of by reentry aboard a future CRS-series mission.
The SDS is the first flight demonstration of the Debris Resistive/Acoustic Grid
Orbital NASA-Navy Sensor (DRAGONS) developed and matured by the NASA
ODPO [1]. The DRAGONS concept combines several technologies to characterize the size, speed, direction, and density of small impacting objects. With a minimum 3-year operational lifetime, the SDS
is anticipated to collect statisticallysignificant information on orbital
debris ranging from 50 µm to 500 µmin size. Most impacts will be around the
threshold of 50 µm; the estimated number of 500 µm and larger impacts for a square meter
in an ISS orbit over 2018-2020 is 0.84. The development of the SDS has been chronicled
DEBR
IS RES
ISTIVE/ACOUSTIC GRID ORBITAL NASA-NAVY SENSOR
ISS DRAGONS SPACE DEBRIS SENSOR
Events in GEOcontinued from page 1
10:43 GMT on 26 August, TELKOM-1 was in a 35793 x 35781 km, 0.0112° orbit; afterwards, at approximately 19:36 GMT on 29 August, the orbit was 35838 x 35764 km at an inclination of 0.0237°. PT Telkom, the spacecraft owner-operator, declared on 30 August that the spacecraft could not be salvaged [1]. Following this event, the spacecraft began a westward drift in the GEO belt. As this ODQN goes to press, the spacecraft orbit has evolved as depicted in Fig. 2. The NASA Orbital Debris Program Office (ODPO) characterizes this episode as an anomalous event.
The spacecraft bus is the Lockheed Martin A2100 platform. Spacecraft dry mass is estimated to be on the order of 1640 kg. On-board stored energy sources include fuel and pressurized components as well as the battery subsystem.
Reference1. “Antenna glitch disconnects Telkom-1
satellite customers in Indonesia,” http://spacenews.com/antenna-glitch-disconnects-telkom-1-satellite-customers-in-indonesia/ when accessed December 2017. ♦Figure 2. The 2017 orbital evolution of the TELKOM-1 spacecraft. Depicted are the subsatellite longitudes, demonstrating
a westward drift post-event, and the apogee/perigee altitude history. The altitude profile clearly indicates the abrupt nature of the event and possible mitigation activities by the owner/operator. Inclination control apparently terminated in early September 2017.
35500
35550
35600
35650
35700
35750
35800
35850
35900
35950
36000
80
90
100
110
120
2017
.00
2017
.08
2017
.17
2017
.25
2017
.33
2017
.42
2017
.50
2017
.58
2017
.67
2017
.75
2017
.83
2017
.92
2018
.00
altitude [km]
subsatellite longitu
de [°]
time [YYYY.Y]
TELKOM‐1 (SSN 25880, 1999‐042A)
subsatellite longitude [o]
apogee alt [km]
perigee alt. [km]
Space Debris Sensor Launches Aboard SpaceX-13
continued on page 3

www.orbitaldebris.jsc.nasa.gov
3
in the ODQN (ODQN vol. 21, Issue 3, August 2017, p. 2, “Update on the Space Debris Sensor” and pp. 3-6 “Benefits of a High LEO In-situ Measurement Mission”; ODQN vol. 21, Issue 1, February 2017, p. 1, “Space Debris Sensor Waiting for Launch” and pp. 9-10 “SDS is Readied for Flight” photo feature; ODQN vol. 19, Issue 2, April 2015, p. 11, “Space Debris Sensor (SDS) testing in progress at NASA White Sands Test Facility”; ODQN vol. 19, Issue 1, January 2015, pp. 2-3, “DRAGONS to Fly on the ISS”; ODQN
vol. 16, Issue 3, July 2012, pp. 2-3, “Development of DRAGONS-An MMOD Impact Detection Sensor System”). Readers are further directed to these online and social media resources:
• https://www.nasa.gov/mission_pages/station/research/news/sensor_to_monitor_orbital_debris_outside_ISS
• @ISS_Research (Twitter)
• h t t p s : / / w w w. y o u t u b e . c o m /watch?v=O0i7-xqRF0s (launch recap accessed 19 December 2017)
ReferenceHamilton, J., Liou, J.-C., Anz-Meador, P.D.,
et al., “Development of the Space Debris Sensor,” 7th European Conference on Space Debris, Darmstadt, Germany, published by ESA Space Debris Office (April 2017). ♦
SDS Launchescontinued from page 2
Figure 2. The Dragon trunk following separation from the SpaceX Falcon 9 second stage; clearly visible are the trunk payloads SDS at the 9 o’clock position and the Total & Spectral solar Irradiance Sensor experiment at the 1 o’clock position. The Flight Releasable Attachment Mechanism station at the 5 o’clock position was fl wn empty for this flight Credit: NASA
Figure 1. The SpaceX Dragon spacecraft successfully launched to the International Space Station at 10:36 a.m. EST Dec. 15, 2017, from Cape Canaveral Air Force Station in Florida. Credits: NASA/Tony Gray and Sandra Joseph. Retrieved December 17 at https://www.nasa.gov/press-release/nasa-sends-new-research-to-space-station-aboard-spacex-resupply-mission .
Figure 3. Having been installed robotically, in this artist's concept, the SDS resides at the ESA Columbus module’s EPF-SOX location. Credit: NASA

Orbital Debris Quarterly News
4
J. HYDE, E. BERGER, D. LEAR, ANDE. CHRISTIANSEN
In a previous Orbital Debris Quarterly News (ODQN, vol. 20, issue 3, July 2016, pp. 4-6), we reported on results from post-flight inspection of the Pressurized Mating Adapter #2 (PMA-2) cover for micrometeoroid and orbital debris (MMOD) impacts [1, 2]. The PMA-2 cover was mounted on the forward-facing port of Node 2 which is the docking port that will by upcoming U.S. Commercial Crew vehicles. On 9 July 2013 a cover was installed to protect the exposed docking port. PMA-2 is located on the front of the ISS, with the cover facing directly into the velocity vector as shown in Fig. 1. The cover was removed in February 2015 during US EVA 30 (1.63 years exposure), and it was returned from ISS on SpaceX CRS-6 in May 2015. The cover consists of a beta cloth (Teflon coated fiberglass fabric) outer layer and internal layers of ballistic fabric.
A post-flight inspection of the returned space-exposed article revealed 26 sites with distinctive hypervelocity impact features. An idealized view of the approximately 2-m diameter cover with a surface area of 3.7 m2 is provided in Fig. 2, along with the location of the 26 impact sites. Intact samples were extracted at six locations for additional imaging via Scanning Electron Microscopy (SEM) and chemical analysis using Energy Dispersive X-ray Spectroscopy (EDS). The table summarizes the EDS characterizations of the impactor types. Four of the six analyzed samples displayed indications of high density orbital debris as the source of the impact.
An example SEM image of the entry hole in the beta cloth outer layer for feature #1 is shown in Fig. 3. Higher magnification images of an area with impact melt containing iron-rich deposits are provided in Figs. 4 and 5. The spectra associated with the iron deposit are shown in yellow in Fig. 6, with spectra from clean beta cloth shown in red. Extraction of most remaining impact sites on the PMA-2 cover for SEM/EDS analysis is planned for 2018.
A comparison between the observed MMOD impact feature sizes and the expected number of MMOD features calculated by the computer code Bumper 3 is shown in Fig. 7. The 26 individual observations of entry hole size are depicted as yellow circles in the figure. There is good comparison, down to a limiting size of approximate 300 µm, between the observed holes in the cover and results of the Bumper 3 calculations for the number of entry holes in
PMA-2 beta cloth of various diameters, shown in solid lines for MEM-R2 and ORDEM 3.0 and with a dashed line for the MMOD total.
References1. Hyde, J., Read, J., Lear, D., Christiansen,
E. “MMOD Impacts Found on a Returned ISSCover,” OrbitalDebris QuarterlyNews, vol. 20, issue 3, (July 2016).
2. Hyde, J., Christiansen, E., Lear, D., Nagy, K., Berger, E. “Surveys of Returned ISS
Hardware for MMOD Impacts,” 7th European Conference on Space Debris, Darmstadt, Germany, published by ESA Space Debris Office (April 2017). ♦
Figure 1. Location of PMA-2 cover. Source: NASA TV
PROJECT REVIEWSSEM Analysis Results of Returned ISS PMA-2 Cover
PMA-2 Cover SEM/EDS Results
Figure 2. Port and starboard views of MMOD impact observations on PMA-2 cover. Source: NASA HVIT
Feature # Hole Diameter (mm) Impactor Type/ Major Constituent Possible Impactor
1 0.60 OD: Zn, S, Fe, Ti Steel 2 1.01 OD: Ni Steel 10 0.80 OD: Fe Steel 12 0.57 MM: Ca, Mg, Fe, S Chondrite 13 0.73 MM: Fe, Ni, S Metal/sulfide‐rich MM 24 0.36 OD: Fe, Ti Steel
continued on page 5

www.orbitaldebris.jsc.nasa.gov
5
Figure 6. Impact # 1 – Spectra associated with iron oxide and Teflon on first layer (beta cloth) fibers shown in yellow. Clean beta cloth fiber spectra shown in red. Source: NASA e-beam lab
Figure 3. Impact #1 - SEM imagery of damage on first layer (beta cloth). Source: NASA e-beam lab
Figure 4. Impact #1 – SEM imagery of melted beta cloth components and iron rich deposits on first layer (beta cloth) fibers. Highlighted area shown in Fig. 5. Source: NASA e-beam lab
Figure 5. Impact #1 – Detail of iron oxide indication on first layer (beta cloth) fibers. Source: NASA e-beam lab
Figure 7. Comparison of 26 estimated particle sizes causing observed damage on the PMA-2 cover and Bumper 3 predictions. Source: NASA HVIT
SEM Analysis Resultscontinued from page 4

Orbital Debris Quarterly News
6
D. VAVRIN AND A. MANISThe NASA Orbital Debris Program Office
has conducted a series of low Earth orbit (LEO) to geosynchronous orbit (GEO) Environment Debris (LEGEND) model computations to investigate the long-term effects of adding CubeSats to the environment. These results are compared to a baseline “business-as-usual” scenario where launches are assumed to continue as in the past without major CubeSat deployments. Using these results, we make observations about the continued use of the 25-year rule and the importance of
the universal application of post-mission disposal (PMD).
The baseline population in this study depicts a future environment without the introduction of cluster deployments of CubeSats [1]. Actual historical launches and evolution from 1957 through 2014 are simulated as the initial condition for future traffic projection, which runs for 200 years starting in 2015. Future launches repeat the historical launch traffic cycle from 2007 to 2014 inclusive. The rate of future explosions is set to zero, assuming 100% passivation in the
future projection, and the mission lifetime for payloads is set at 8 years. A specified percentage of spacecraft and rocket bodies are repositioned in decay orbits following PMD maneuvers, where they will re-enter the atmosphere within 25 years. The baseline population is projected using two PMD success rates of 60% and 90%. Each simulation includes 100 Monte Carlo runs to ensure a thorough statistical sampling of the future environment. Results shown are averages over
2014 2034 2054 2074 2094 2114 2134 2154 2174 2194 2214
Year
20
40
60
80
100
120
# of
Cat
astr
ophi
c C
ollis
ions
, cum
ulat
ive
Baseline (Bkgrd PMD 60%)J1 (Bkgrd PMD 60%, CubeSat PMD 60%)J2 (Bkgrd PMD 60%, CubeSat PMD 0%)
2014 2034 2054 2074 2094 2114 2134 2154 2174 2194 2214
Year
20
40
60
80
100
120
# of
Cat
astr
ophi
c C
ollis
ions
, cum
ulat
ive
Baseline (Bkgrd PMD 90%)J1 (Bkgrd PMD 90%, CubeSat PMD 90%)J2 (Bkgrd PMD 90%, CubeSat PMD 0%)
2014 2034 2054 2074 2094 2114 2134 2154 2174 2194 2214
Year
10000
20000
30000
40000
50000
60000
70000
80000
90000
Effe
ctiv
e #
of O
bjec
ts, >
10
cm
Baseline (Bkgrd PMD 60%)J1 (Bkgrd PMD 60%, CubeSat PMD 60%)J2 (Bkgrd PMD 60%, CubeSat PMD 0%)
2014 2034 2054 2074 2094 2114 2134 2154 2174 2194 2214
Year
10000
20000
30000
40000
50000
60000
70000
80000
90000
Effe
ctiv
e #
of O
bjec
ts, >
10
cm
Baseline (Bkgrd PMD 90%)J1 (Bkgrd PMD 90%, CubeSat PMD 90%)J2 (Bkgrd PMD 90%, CubeSat PMD 0%)
continued on page 7
Figure 1. Effective number of objects in LEO, ≥10 cm, over 200-year projection with (1a, left) PMD success rate of 60%, and (1b, right) PMD success rate of 90%, baseline and scenarios J1 and J2. Note the steeper growth for scenario J2, where only non-CubeSats observe PMD, of both background and CubeSats.
Figure 2. Cumulative number of catastrophic collisions in LEO over 200-year projection with (2a, left) PMD success rate of 60%, and (2b, right) PMD success rate of 90%, scenarios J1 and J2 compared to baseline.
CubeSat Study Project Review

www.orbitaldebris.jsc.nasa.gov
7
all Monte Carlo runs. Only objects ≥10 cm are considered for collision assessment in this study.
The CubeSat traffic scenarios use the same initial conditions and launch traffic cycle for regular intact objects as the baseline scenario, and additionally deploy CubeSats (1U, 3U, and 6U configurations) from a small satellite deployment system in the LEO region (200 km to 2000 km altitude). The mission lifetime of each CubeSat deployed in LEO is assumed to be 2 years for all future scenarios, during which time each CubeSat will apply its own set of collision avoidance maneuvers. After its mission lifetime, the CubeSat is placed in a post-mission disposal orbit where it will decay within 25 years with a 0%, 60%, or 90% probability of success. This study makes the following assumptions: 1) there are no launch failures or explosions of any CubeSats in the future environment, 2) the deployment system can support the launch of hundreds of CubeSats at a given time, and 3) each CubeSat does not perform any collision avoidance once in a PMD orbit.
In scenario J1, CubeSats are deployed from the 600 – 1000 km altitude range and have PMD success rates of 60% and 90%, the same PMD rate of regular intacts. Scenario J2 follows the same scheme as scenario J1, except the deployed CubeSats do not follow any post-mission disposal compliance (0% PMD success rate for CubeSats).
Figs. 1a and Fig. 1b show the growth of the effective number of objects over the 200-year projection for baseline (solid black line), J1 (blue dash-dot line), J2 (purple dashed line) with PMD compliance rates of 60% and 90%, respectively. Notice how setting the PMD rate to 0% substantially increases the total number of objects in the future environment. All three scenarios exhibit the same sharp rate of growth until 2043, the year when CubeSats launched in 2016 begin to be removed from the environment after their 25-year PMD decay orbit expires. After this point, the rate of object growth slows for scenario J1 to approximately match that of the baseline population. However, scenario J2 exhibits a steady rise in the effective number of objects over the full 200 years due to the lack of PMD for CubeSat intacts. The growth of CubeSats in this case swamps the beneficial effects of other satellites observing the 25-year rule.
The cumulative number of catastrophic collisions (i.e., projectile energy-to-target mass ratio exceeds 40 J/g) in scenarios J1 and J2 over the 200-year projection with a PMD compliance rate of 60% is shown in Fig. 2a, while Fig. 2b illustrates the PMD 90% case. As realized with
the effective number of objects, increasing the PMD compliance rate from 60% to 90% for spacecraft and rocket bodies, while setting PMD rate for CubeSats to zero as in scenario J2, still yields a significant increase in the overall number of catastrophic collisions over the 200-year projection.
In the background population, collision fragments remain steady over future projection periods for both PMD cases. However, the CubeSat-related collisions comprise the majority of the number of catastrophic collisions. It is once again clear that scenario J2, with no PMD applied to CubeSats, produces the worst outcome – an increase in the cumulative number of catastrophic
collisions by more than a factor of 4 over the baseline population. A breakdown of the number of catastrophic collisions by altitude shows that this significant increase from the baseline population occurs at mid-LEO altitudes, around 600 – 1000 km, as seen in Fig. 3 for both 60% and 90% PMD compliance rates.
The effectiveness of PMD applied to CubeSats in addition to other payloads is evidenced by the significant difference in effective number of objects and cumulative catastrophic collisions seen between scenarios J1 (CubeSat PMD success rates of 60% and 90%) and J2 (0% PMD for CubeSats).
continued from page 6
CubeSat Study
200
300
400
500
600
700
800
900
1000
1100
1200
1300
1400
1500
1600
1700
1800
1900
2000
Altitude (km)
0
5
10
15
20
25
Cat
astro
phic
Col
lisio
ns, C
umul
ativ
e
Increase from BaselineBaseline Total (Regular I-I, I-F, F-F)
200
300
400
500
600
700
800
900
1000
1100
1200
1300
1400
1500
1600
1700
1800
1900
2000
Altitude (km)
0
5
10
15
20
25
Cat
astro
phic
Col
lisio
ns, C
umul
ativ
e
Increase from BaselineBaseline Total (Regular I-I, I-F, F-F)
Figure 3. Increase in cumulative number of collisions from baseline population, by altitude (200 – 2000 km, 50 km bins) at the end of 200-year projection for Scenario J2 with (2a, top) PMD compliance rate of 60% and (2b, bottom) PMD compliance rate of 90% (0% PMD for CubeSats in both cases). Note that the number of collisions in each altitude bin is an average over 100 Monte Carlo runs.
continued on page 8
Orbital Debris Quarterly News
8
continued from page 7CubeSat Study
Therefore, it is recommended that CubeSats follow the same 25-year rule as other payloads in order to avoid deterioration of mid-LEO altitudes (approximately 600-1000 km). At this time, it is not recommended that CubeSats be required to observe a different PMD standard than that applied to their larger cousins; specifically the 25-year
rule. While PMD capabilities for small satellites still are under development, the outcomes of this study indicate that such technology is critical for successful long-term use of satellites in near-Earth space.
Reference1. Matney, M., Vavrin, A., Manis, A.
“Effects of CubeSat Deployments in Low-Earth Orbit,” 7th European Conference on Space Debris, Darmstadt, Germany, published by ESA Space Debris Office, (17 April 2017). ♦
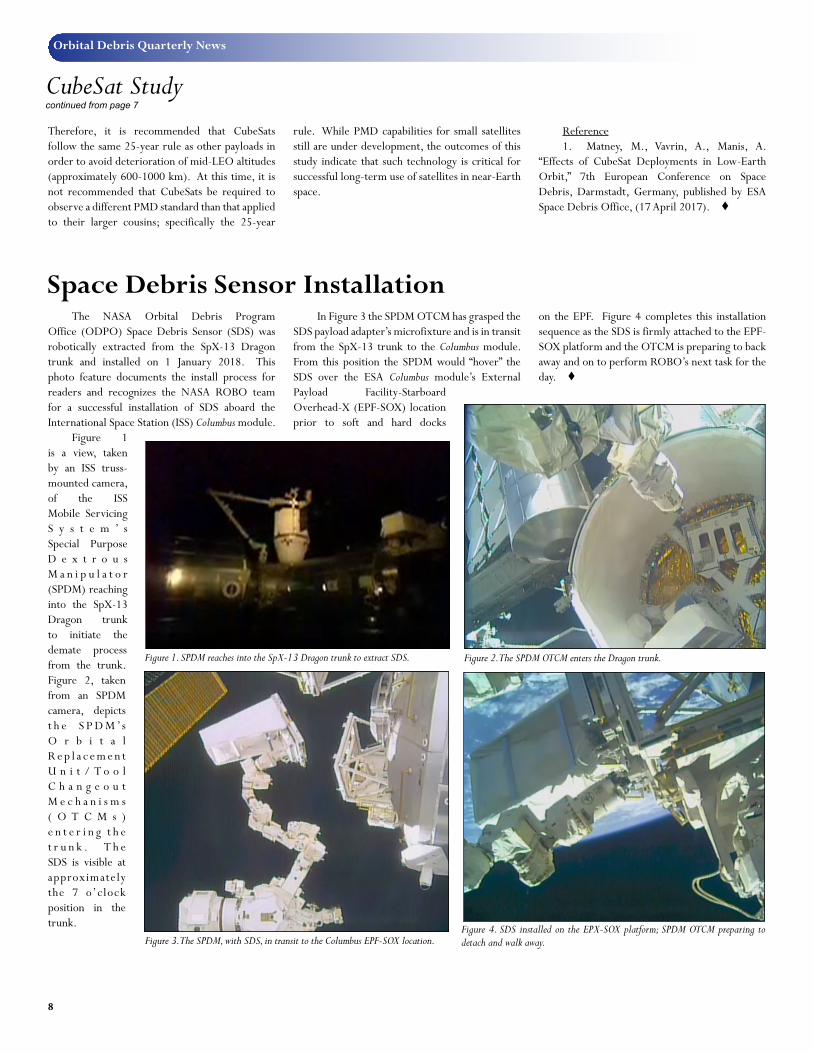
Space Debris Sensor InstallationThe NASA Orbital Debris Program
Office (ODPO) Space Debris Sensor (SDS) was robotically extracted from the SpX-13 Dragon trunk and installed on 1 January 2018. This photo feature documents the install process for readers and recognizes the NASA ROBO team for a successful installation of SDS aboard the International Space Station (ISS) Columbus module.
Figure 1 is a view, taken by an ISS truss-mounted camera, of the ISS Mobile Servicing S y s t e m ’ s Special Purpose D e x t r o u s M a n i p u l a t o r (SPDM) reaching into the SpX-13 Dragon trunk to initiate the demate process from the trunk. Figure 2, taken from an SPDM camera, depicts t h e S P D M ’s O r b i t a l R e p l a c e m e n t U n i t / T o o l C h a n g e o u t M e c h a n i s m s ( O T C M s ) e n t e r i n g t h e t r u n k . T h e SDS is visible at approximately the 7 o’clock position in the trunk.
In Figure 3 the SPDM OTCM has grasped the SDS payload adapter’s microfixture and is in transit from the SpX-13 trunk to the Columbus module. From this position the SPDM would “hover” the SDS over the ESA Columbus module’s External Payload Facility-Starboard Overhead-X (EPF-SOX) location prior to soft and hard docks
on the EPF. Figure 4 completes this installation sequence as the SDS is firmly attached to the EPF-SOX platform and the OTCM is preparing to back away and on to perform ROBO’s next task for the day. ♦
Figure 1. SPDM reaches into the SpX-13 Dragon trunk to extract SDS. Figure 2. The SPDM OTCM enters the Dragon trunk.
Figure 3. The SPDM, with SDS, in transit to the Columbus EPF-SOX location.Figure 4. SDS installed on the EPX-SOX platform; SPDM OTCM preparing to detach and walk away.

www.orbitaldebris.jsc.nasa.gov
9
25-27 June 2018: 5th International Workshop on Space Debris Modeling and Remediation, Paris, France
UPCOMING MEETINGS
CNES Headquarter will host the 5th Workshop on Space Debris Modeling and Remediation. Topics are anticipated to include, but are not necessarily limited to, modeling, including specificities coming from small satellites and constellations; high level actions and road-maps associated with debris remediation; remediation system studies,
including those relative to small debris; design of specific concepts, including new ideas relative to just-in-time collision avoidance and proposals devoted to large constellations and small satellites; concepts derived from current space tugs initiatives; GNC aspects, rendezvous sensors and algorithms, de-spin, control during de-boost; and policy, economics, insurance,
intellectual property, national security, and international cooperation aspects of debris remediation. The abstract submission deadline is 15 March 2018. Additional information about the conference, limited to 130 participants, is available from the ODQN editorial team.
14-22 July 2018: COSPAR 2018, Pasadena, CA, USAThe 42nd Assembly of the Committee
on Space Research (COSPAR) Scientific will convene in the Pasadena Convention Center on Saturday, 14 July 2018 and run through Sunday, 22 July. This assembly marks the 60th year of COSPAR. The COSPAR panel Potentially Environmentally Detrimental
Activities in Space (PEDAS) will conduct a program entitled “Space Debris – Providing the Scientific Foundation for Action.” PEDAS.1 sessions will include advances in ground- and space-based measurements of the orbital debris environment, micrometeoroid and orbital debris environment modeling,
risk assessment, mitigation and remediation, hypervelocity impact range developments, and protection. The abstract submission deadline is 9 February 2018. Please see the COSPAR website at https://cosparhq.cnes.fr/content/cospar-2018 and the Assembly website http://cospar2018.org/ for further information.
4-9 August 2018: 32nd Annual Small Satellite Conference, Logan, UT, USAUtah State University (USU) and the
AIAA will sponsor the 32nd Annual AIAA/USU Conference on Small Satellites at the university’s Logan campus, Utah, USA. With the theme of “Delivering Mission Success,” the 32nd conference will explore new technologies, design methods, processes,
operational constructs, and activities that enhance the probability of success for small satellite missions. Session topics include assuring the space ecosystem, which will emphasize the interplay of small satellites and mission success to the sustainability of space, space situational awareness, space traffic
management, and licensing and regulation. The abstract submission deadline is 8 February 2018. Additional information about the conference is available at https://www.smallsat.org .
11-14 September 2018: 19th Advanced Maui Optical and Space Surveillance Technologies Conference,Maui, Hawaii (USA)
The technical program of the 19th Advanced Maui Optical and Space Surveillance Technologies Conference (AMOS) is anticipated to focus on subjects that are mission critical to Space Situational
Awareness. The technical sessions include papers and posters on Orbital Debris, Space Situational Awareness, Adaptive Optics & Imaging, Astrodynamics, Non-resolved Object Characterization, and related topics.
Additional information about the conference is available at https://amostech.com and this announcement will be updated in the ODQN as details become available.
1-5 October 2018: 69th International Astronautical Congress (IAC), Bremen, GermanyThe IAC will convene in Bremen in
2018 with a theme of “IAC 2018 – involving everyone.” The IAA will organize the 16th Symposium on Space Debris as session A6 during the congress. Nine dedicated sessions
are planned to cover all aspects of orbital debris activities, including measurements, modeling, hypervelocity impact, mitigation, remediation, and policy/legal/economic challenges for environment management. An
additional joint session with the section C1.7 Astrodynamics will be conducted. The abstract submission deadline is 28 February 2018. Additional information for the 2018 IAC is available at: https://www.iac2018.org/ .
Orbital Debris Quarterly News
10
0
1000
2000
3000
4000
5000
6000
7000
8000
9000
10000
11000
12000
13000
14000
15000
16000
17000
18000
19000
1956
1958
1960
1962
1964
1966
1968
1970
1972
1974
1976
1978
1980
1982
1984
1986
1988
1990
1992
1994
1996
1998
2000
2002
2004
2006
2008
2010
2012
2014
2016
2018
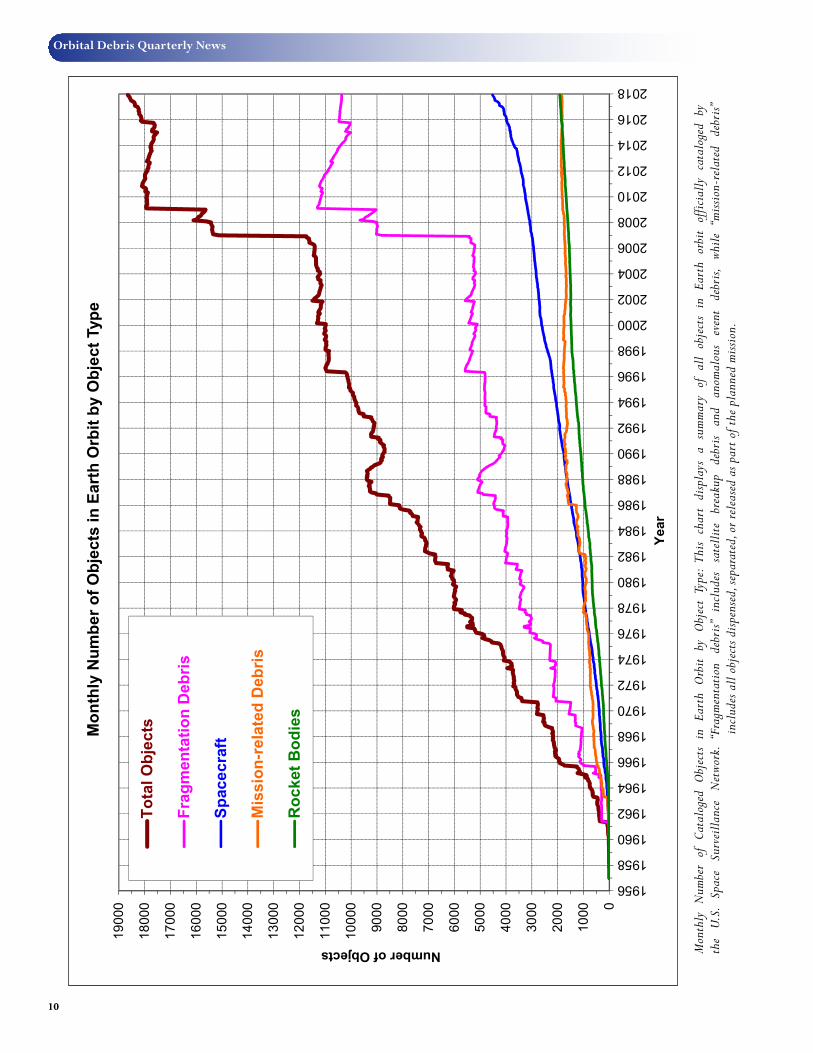
Number of Objects
Year
Mon
thly
Num
ber o
f Obj
ects
in E
arth
Orb
it by
Obj
ect T
ype
Tota
l Obj
ects
Frag
men
tatio
n D
ebris
Spac
ecra
ft
Mis
sion
-rel
ated
Deb
ris
Roc
ket B
odie
s
Mon
thly
Num
ber
of C
atal
oged
Obj
ects
in E
arth
Orb
it by
Obj
ect
Type
: Th
is ch
art
disp
lays
a s
umm
ary
of a
ll ob
ject
s in
Ear
th o
rbit
offic
ially
cat
alog
ed b
y th
e U.
S.
Spac
e Su
rvei
llanc
e N
etwo
rk.
“Fra
gmen
tatio
n de
bris”
in
clud
es
sate
llite
br
eaku
p de
bris
and
anom
alou
s ev
ent
debr
is,
while
“m
issio
n-re
late
d de
bris”
in
clud
es a
ll ob
ject
s disp
ense
d, se
para
ted,
or r
elea
sed
as p
art o
f the
pla
nned
miss
ion.

www.orbitaldebris.jsc.nasa.gov
11
Mon
thly
Mas
s of O
bjec
ts in
Ear
th O
rbit
by O
bjec
t Typ
e: T
his c
hart
disp
lays
the
mas
s of a
ll ob
ject
s in
Eart
h or
bit o
ffici
ally
cat
alog
ed b
y th
e U.
S. S
pace
Sur
veill
ance
Net
work
.
0.0
1000.0
2000.0
3000.0
4000.0
5000.0
6000.0
7000.0
8000.0
9000.01956
1958
1960
1962
1964
1966
1968
1970
1972
1974
1976
1978
1980
1982
1984
1986
1988
1990
1992
1994
1996
1998
2000
2002
2004
2006
2008
2010
2012
2014
2016
2018
Mass in Orbit (metric tons)
Year
Mon
thly
Mas
s of
Obj
ects
in E
arth
Orb
it by
Obj
ect T
ype
Tota
l Obj
ects
Spac
ecra
ft
Roc
ket B
odie
s
Frag
men
tatio
n D
ebris
Mis
sion
-rel
ated
Deb
ris

12
INTERNATIONAL SPACE MISSIONS01 October 2017 – 31 December 2017
International Designator
PayloadsCountry/
Organization
Perigee Altitude
(KM)
Apogee Altitude
(KM)
Inclination (DEG)
Earth Orbital Rocket Bodies
Other Cataloged
Debris
2017-060A VRSS-2 VENEZUELA 628 656 98.0 0 0
2017-061A IRIDIUM 133 USA 776 780 86.4 0 02017-061B IRIDIUM 100 USA 776 779 86.42017-061C IRIDIUM 122 USA 776 780 86.42017-061D IRIDIUM 129 USA 776 780 86.42017-061E IRIDIUM 119 USA 776 780 86.42017-061F IRIDIUM 107 USA 776 779 86.42017-061G IRIDIUM 132 USA 776 779 86.42017-061H IRIDIUM 136 USA 776 779 86.42017-061J IRIDIUM 139 USA 776 779 86.42017-061K IRIDIUM 125 USA 776 779 86.4
2017-062A QZS-4 JAPAN 32621 38948 40.5 1 0
2017-063A ECHOSTAR 105/SES 11 SES 35785 35789 0.0 1 0
2017-064A SENTINEL 5P ESA 826 828 98.7 1 0
2017-065A PROGRESS MS-07 RUSSIA 402 406 51.6 1 0
2017-066A USA 279 USA NO ELEMENTS AVAILABLE 0 0
1998-067NE KESTREL EYE 2M USA 398 403 51.6 0 01998-067NF SIMPL USA 400 404 51.6
2017-067A KOREASAT 5A SOUTH KOREA 35783 35791 0.0 1 0
2017-068A SKYSAT C11 USA 501 523 97.4 1 12017-068B SKYSAT C10 USA 500 521 97.42017-068C SKYSAT C9 USA 500 505 97.42017-068D SKYSAT C8 USA 499 525 97.42017-068E SKYSAT C7 USA 498 524 97.42017-068F SKYSAT C6 USA 493 511 97.42017-068J FLOCK 3M 1 USA 499 524 97.32017-068K FLOCK 3M 3 USA 499 523 97.32017-068L FLOCK 3M 4 USA 499 522 97.42017-068M FLOCK 3M 2 USA 500 520 97.4
2017-069A BEIDOU-3 M1 CHINA 21507 21548 55.0 2 02017-069B BEIDOU-3 M2 CHINA 21508 21548 55.0
2017-070A MOHAMMED VI-A MOROCCO 638 640 98.0 0 0
2017-071A CYGNUS 0A-8 &14 additional CubeSats USA 373 393 51.6 1 2
2017-072A FENGYUN 3D CHINA 825 828 98.7 1 02017-072B HEAD-1 CHINA 795 811 98.7
2017-073A JPSS 1 USA 826 828 98.7 0 02017-073B BUCCANEER RMM AUSTRALIA 458 821 97.72017-073C MIRATA USA 454 820 97.72017-073D MAKERSAT 0 USA 452 820 97.72017-073E AO-91 USA 452 820 97.72017-073F EAGLESAT 1 USA 452 820 97.7
1998-067NG ECAMSAT USA 398 405 51.6 0 01998-067NH ASTERIA USA 399 402 51.61998-067NJ DELLINGR (RBLE) USA 400 403 51.61998-067NK TECHEDSAT 6 USA 386 390 51.61998-067NL OSIRIS-3U USA 395 400 51.6
2017-074A JILIN-01-04 CHINA 531 550 97.5 1 02017-074B JILIN-01-05 CHINA 526 545 97.52017-074C JILIN-01-06 CHINA 529 547 97.5
2017-075A YAOGAN-30 D CHINA 598 602 35.0 1 02017-075B YAOGAN-30 E CHINA 596 603 35.02017-075C YAOGAN-30 F CHINA 597 602 35.0
2017-076A COSMOS 2524 RUSSIA 901 910 67.2 1 0
2017-077A LKW-1 CHINA 487 504 97.5 0 4
2017-078A ALCOMSAT 1 ALGERIA 35775 35799 0.0 1 0
2017-079A GALILEO 19 (2C5) ESA 23298 23316 57.0 1 02017-079B GALILEO 20 (2C6) ESA 23171 23183 56.92017-079C GALILEO 21 (2C7) ESA 23073 23096 56.92017-079D GALILEO 22 (2C8) ESA 23156 23157 56.9
2017-080A DRAGON CRS-13 USA 402 406 51.6 0 2
2017-081A SOYUZ MS-07 RUSSIA 402 406 51.6 1 0
2017-082A GCOM-C JAPAN 791 794 98.7 1 22017-082B SLATS JAPAN 458 628 98.3
2017-083A IRIDIUM 135 USA 664 681 86.6 0 02017-083B IRIDIUM 138 USA 610 628 86.72017-083C IRIDIUM 116 USA 610 627 86.72017-083D IRIDIUM 130 USA 702 703 86.52017-083E IRIDIUM 151 USA 610 627 86.72017-083F IRIDIUM 134 USA 697 698 86.52017-083G IRIDIUM 137 USA 609 627 86.72017-083H IRIDIUM 141 USA 609 627 86.72017-083J IRIDIUM 153 USA 608 627 86.72017-083K IRIDIUM 131 USA 699 700 86.5
2017-084A LKW-2 CHINA 489 503 97.5 0 3
2017-085A YAOGAN-30 G CHINA 585 596 35.0 1 02017-085B YAOGAN-30 H CHINA 594 603 35.02017-085C YAOGAN-30 J CHINA 604 611 35.0
2017-086A ANGOSAT 1 ANGOLA 35962 36117 0.1 2 5
SATELLITE BOX SCORE(as of 04 January 2018, cataloged by the
U.S. SPACE SURVEILLANCE NETWORK)
Country/Organization Payloads*
Rocket Bodies
& DebrisTotal
CHINA 269 3594 3863
CIS 1515 5003 6518
ESA 81 56 137
FRANCE 63 483 546
INDIA 85 115 200
JAPAN 170 100 270
USA 1634 4687 6321
OTHER 866 114 980
TOTAL 4683 14152 18835
Technical EditorPhillip Anz-Meador, Ph.D.
Managing EditorDebi Shoots
Correspondence concerning the ODQN can be sent to:
NASA Johnson Space CenterThe Orbital Debris Program OfficeAttn: JE104/Debi ShootsHouston, TX 77058
Visit the NASAOrbital Debris Program Office
Websitewww.orbitaldebris.jsc.nasa.gov
National Aeronautics and Space AdministrationLyndon B. Johnson Space Center2101 NASA ParkwayHouston, TX 77058
www.nasa.govhttp://orbitaldebris.jsc.nasa.gov/
* active and defunct
![Inclined Geosynchronous SAR - Semantic Scholar...Geosynchronous synthetic aperture radar (GEO SAR) [1] runs on an orbit height of around 36,000 km, has a revisit time of less than](https://img.pdfslide.us/doc/110x75/6109ec243d8c90733c7661cc/inclined-geosynchronous-sar-semantic-scholar-geosynchronous-synthetic-aperture.jpg)