Embed Size (px)
Citation preview

ILM Level 5 Certificate in Management
Making a Financial Case
Making a Financial
Case
1
Contents Page No.Module introduction 3Understanding costs and costing systemsDirect and indirect costs 4Fixed and variable costs 8Break even analysis 10The contribution method 13Costing systems: marginal and absorption costing 15Absorption costing 16Activity-based costing 21Profit improvement 22Investment decisions 25Investment appraisal methods 26The payback period method 27The accounting rate of return method 30Discounted cash flow methods: NPV and IRR 32Net present value 34Internal rate of return 37Risk in investment appraisal 39Risk analysis 40The criteria matrix 44Management and control of investment projects 47Summary 48
2
Unit Introduction
Welcome to the ‘Making a Financial Case’ unit. There are two key learning outcomes to this unit:
To understand the financial concepts used to inform management decisions
Be able to make a financial case to inform a management decision
In the first part of the unit, you will be introduced to a number of key principles in terms of understanding costs and costing systems. The second part of the unit is concerned with exploring a range of capital investment appraisal methods. The key focus for the assessment of this unit is an Improvement Report, not to be completed until you have attended “Managing Improvement”.
The specific areas to be covered are as follows:
Differentiate between the direct and indirect costs of the business Identify the fixed and variable costs of the business Use break-even and contribution analysis Understand the principles of three costing systems Consider some simple strategies for profit improvement Understand and apply the main investment methods used in business Discuss the strengths and weaknesses of each method Understand the importance of risk and the need for sensitivity analysis Identify a structure for controlling and reviewing capital projects
Understanding Costs and Costing Systems
Cost control and management is a key basis for competitive advantage. An understanding of how to categorise costs and how certain costs behave is, therefore, going to be of great value to you in your decision making role, and will be of significant value to your organisation. This is a key area covered in this section.
If you are going to survive and prosper as an organisation, you must ensure that all the business costs are covered by the fees that you charge for your service. This includes the direct costs of the product/service and the organisation’s overheads – but how do we deal with the overheads? In this section, you will look at three different costing methods, each of which has a specific purpose, and will serve to provide you with answers to this question.
The knowledge of how much the business needs to sell in order to cover the costs of operating and start making a profit would be of great value, providing a clear business target. In this section, you will see how ‘break-even analysis’ and ‘contribution analysis’ can be used to provide this information.
3
Within this section of the unit we will be covering the following topics:
Direct and indirect costs Fixed and variable costs Break even analysis Contribution analysis Marginal and absorption costing Activity-based costing Profit improvement
Direct and Indirect Costs
In order to charge an appropriate fee for the product/service provided and for the organisation to make a genuine profit/surplus, we need to be able to identify both the costs directly associated with providing that specific product/service (the direct costs) and those overhead costs which are incurred as a result of generally running the business (the indirect costs). If we assume that the key front line service of the University are the lectures, we could identify the direct costs as follows:
4
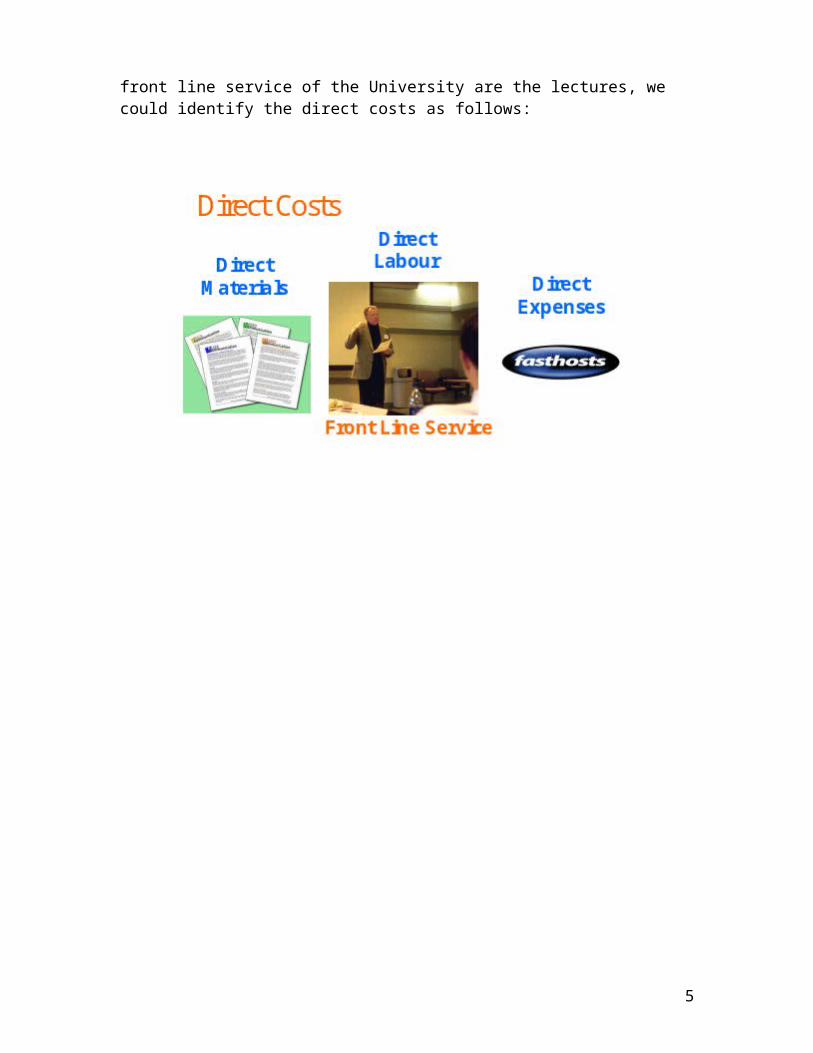
The direct labour would be the lecturers The direct materials would include a number of items but perhaps, most
obviously, the handouts provided to students during a lecture Whilst we may not always allocate direct expenses to the service, this
could include any specific equipment or service that we have had to buy in; in this example it is a web host provider – Fasthosts.
Now we need to consider the indirect (overhead) costs which could be as follows:
The property rates for the University Heating and lighting ... and, of course, administration and management support represented by
the typical manager above
These represent just some of the potentially huge indirect costs that are incurred in order to run the operation. The table below presents a general breakdown of these costs.
5
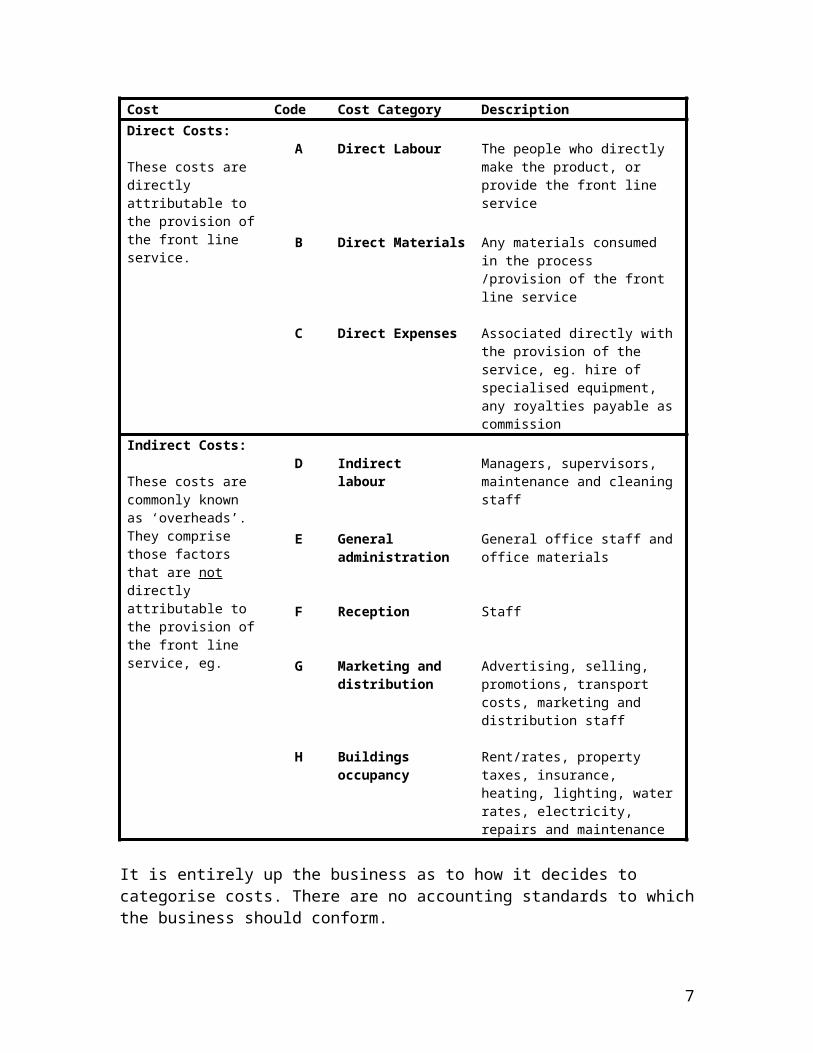
Cost Code Cost Category DescriptionDirect Costs:
These costs are directly attributable to the provision of the front line service.
A Direct Labour The people who directly make the product, or provide the front line service
B Direct Materials Any materials consumed in the process /provision of the front line service
C Direct Expenses Associated directly with the provision of the service, eg. hire of specialised equipment, any royalties payable as commission
Indirect Costs:
These costs are commonly known as ‘overheads’. They comprise those factors that are not directly attributable to the provision of the front line service, eg.
D Indirectlabour
Managers, supervisors, maintenance and cleaning staff
E General administration
General office staff and office materials
F Reception Staff
G Marketing and distribution
Advertising, selling, promotions, transport costs, marketing and distribution staff
H Buildings occupancy
Rent/rates, property taxes, insurance, heating, lighting, water rates, electricity, repairs and maintenance
It is entirely up the business as to how it decides to categorise costs. There are no accounting standards to which the business should conform.
6
Activity: Now consider your own operational area and see if you can divide it up into the front line service and support service and, consequently, make a brief list of the potential direct and indirect costs.
7
Direct Costs Indirect Costs

Fixed Costs: in the short-term stay the same each monthVariable Costs: vary with changes in activity
Fixed and Variable Costs
The ability to monitor and control costs requires an understanding of the nature of costs, ie how certain costs behave. The difference between fixed and variable costs is a case in point.
Fixed Costs are those costs which do not alter with changes in organisational activity, eg. the property rates will remain the same each month regardless of how well or how badly the organisation is doing.
Variable Costs are those costs which will vary directly with changes in organisational activity, eg. if the volume of work increases beyond the capacity of full time staff, then there may be a need for either overtime working, temporary staff, or casual staff etc. You may already have found that some costs have a fixed element and a variable element, eg. a phone bill may have a standing charge for the line rental, and a variable charge for the amount of phone useage; these cost are known as semi-variable.
8
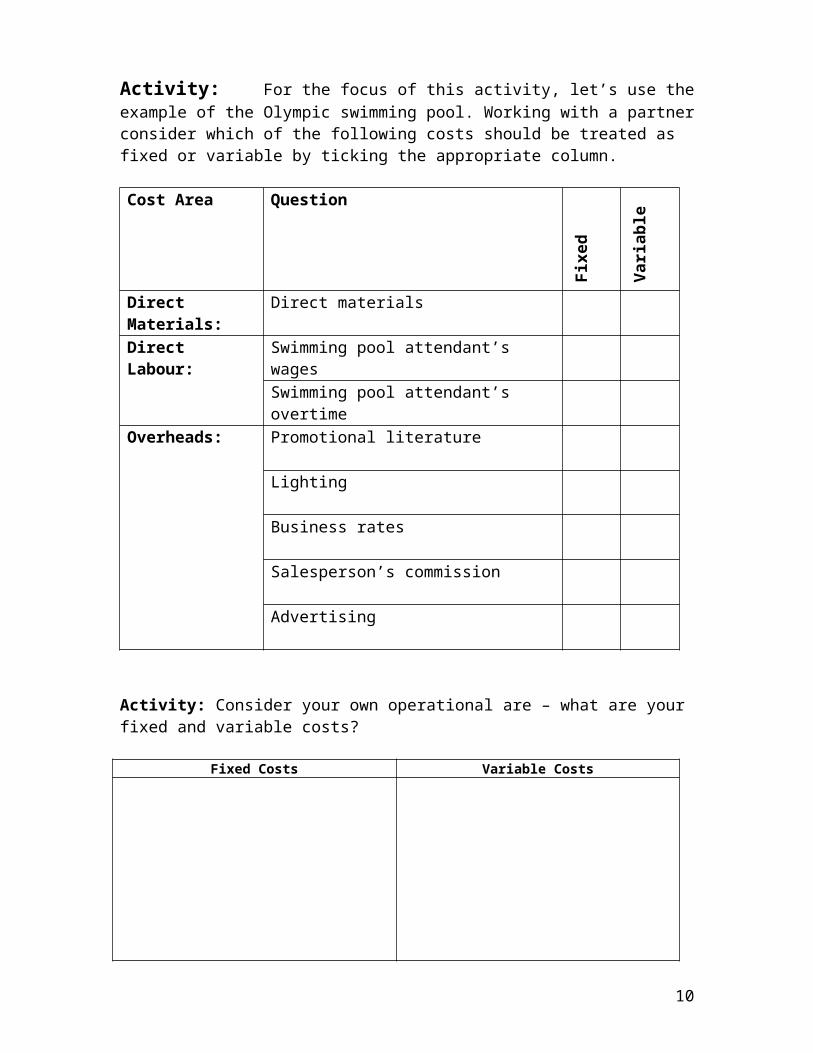
Activity: For the focus of this activity, let’s use the example of the Olympic swimming pool. Working with a partner consider which of the following costs should be treated as fixed or variable by ticking the appropriate column.
Cost Area Question
Fixe
d
Varia
ble
Direct Materials: Direct materials
Direct Labour: Swimming pool attendant’s wages
Swimming pool attendant’s overtime
Overheads: Promotional literature
Lighting
Business rates
Salesperson’s commission
Advertising
Activity: Consider your own operational are – what are your fixed and variable costs?
Fixed Costs Variable Costs
Break-Even Analysis
9
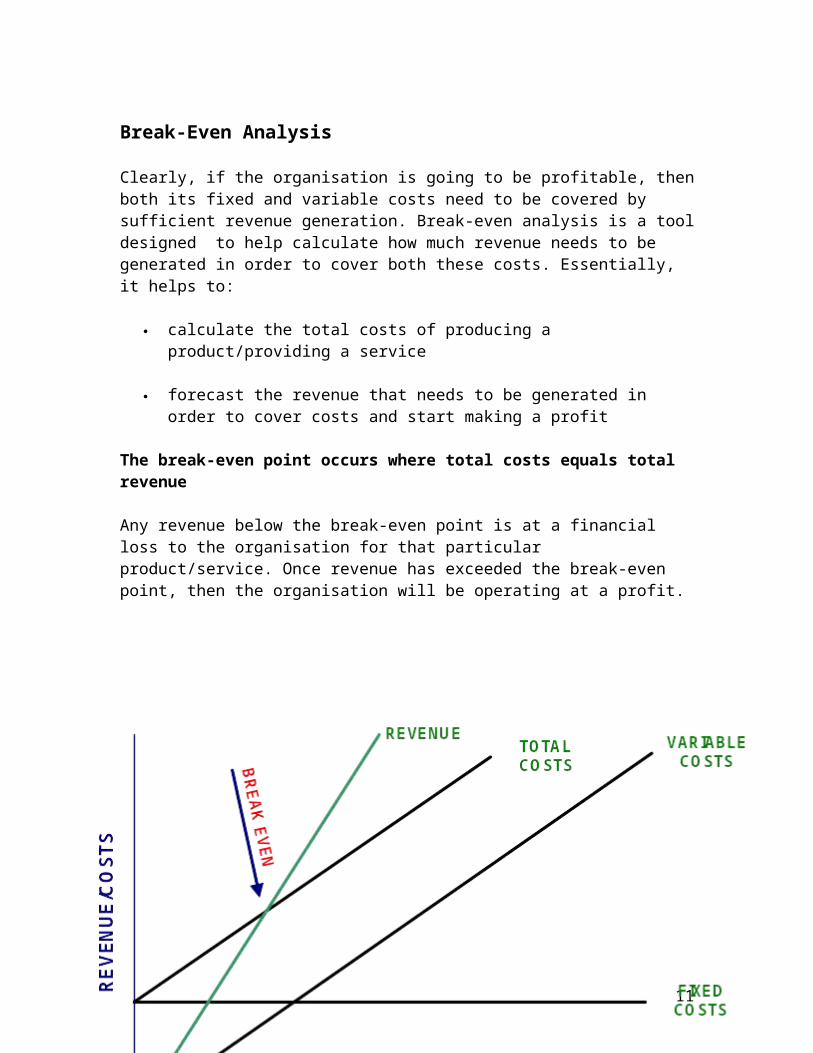
Clearly, if the organisation is going to be profitable, then both its fixed and variable costs need to be covered by sufficient revenue generation. Break-even analysis is a tool designed to help calculate how much revenue needs to be generated in order to cover both these costs. Essentially, it helps to:
calculate the total costs of producing a product/providing a service
forecast the revenue that needs to be generated in order to cover costs and start making a profit
The break-even point occurs where total costs equals total revenue
Any revenue below the break-even point is at a financial loss to the organisation for that particular product/service. Once revenue has exceeded the break-even point, then the organisation will be operating at a profit.
10
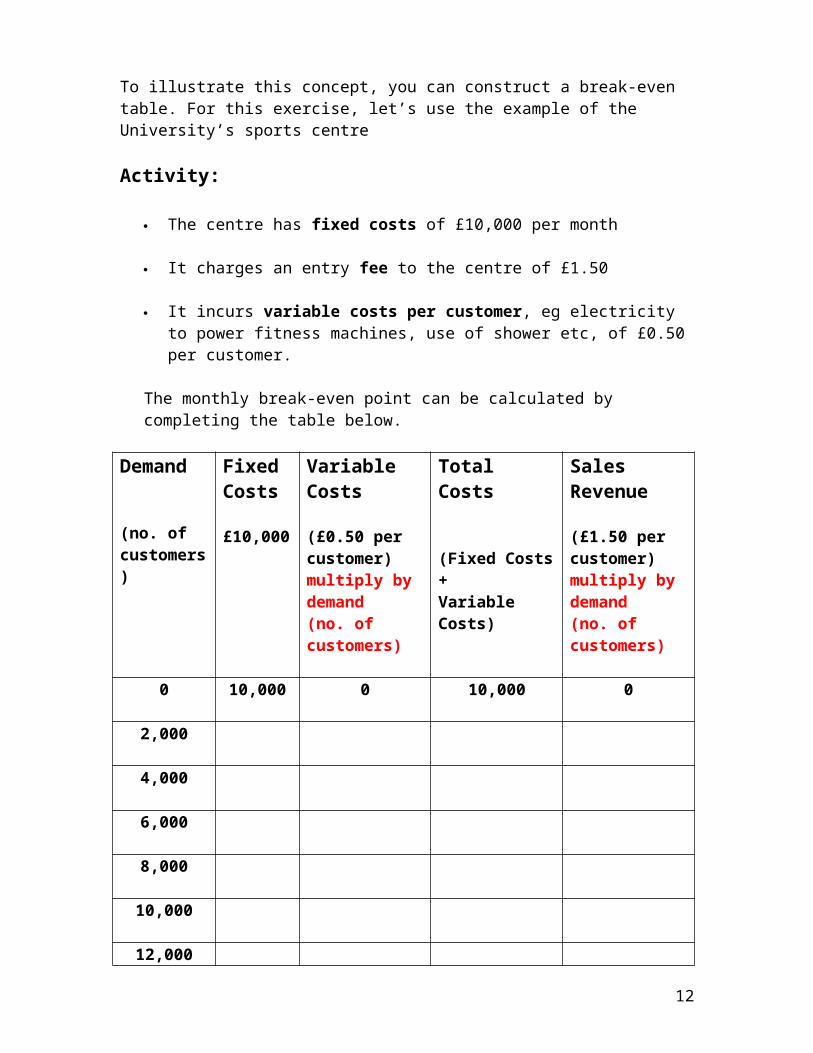
To illustrate this concept, you can construct a break-even table. For this exercise, let’s use the example of the University’s sports centre
Activity:
The centre has fixed costs of £10,000 per month
It charges an entry fee to the centre of £1.50
It incurs variable costs per customer, eg electricity to power fitness machines, use of shower etc, of £0.50 per customer.
The monthly break-even point can be calculated by completing the table below.
Demand
(no. of customers)
Fixed Costs
£10,000
Variable Costs
(£0.50 per customer)multiply by demand(no. of customers)
Total Costs
(Fixed Costs +Variable Costs)
Sales Revenue
(£1.50 per customer)multiply by demand(no. of customers)
0 10,000 0 10,000 0
2,000
4,000
6,000
8,000
10,000
12,000
The break-even point (BEP) = customers.
11
12

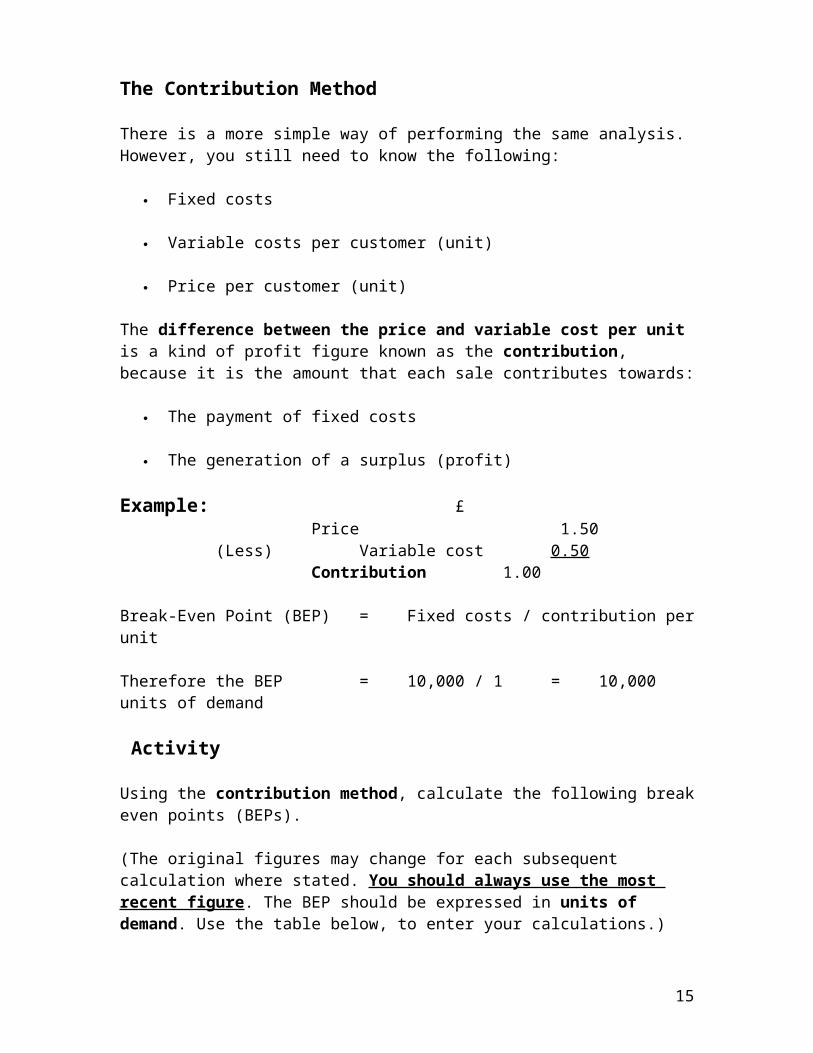
The Contribution Method
There is a more simple way of performing the same analysis. However, you still need to know the following:
Fixed costs
Variable costs per customer (unit)
Price per customer (unit)
The difference between the price and variable cost per unit is a kind of profit figure known as the contribution, because it is the amount that each sale contributes towards:
The payment of fixed costs
The generation of a surplus (profit)
Example: £Price 1.50
(Less) Variable cost 0.50Contribution 1.00
Break-Even Point (BEP) = Fixed costs / contribution per unit
Therefore the BEP = 10,000 / 1 = 10,000 units of demand
Activity
Using the contribution method, calculate the following break even points (BEPs).
(The original figures may change for each subsequent calculation where stated. You should always use the most recent figure. The BEP should be expressed in units of demand. Use the table below, to enter your calculations.)
The first BEP has been calculated for you. Follow exactly the same approach to calculate the BEPs for scenarios 2 to 6.
Scenario: The sports centre has expanded and it is now including some premium extra value added services in the price charged to the customer, hence the increased entry price. This decision is taken in a bid to compete with two new private leisure centres which have opened locally.
13

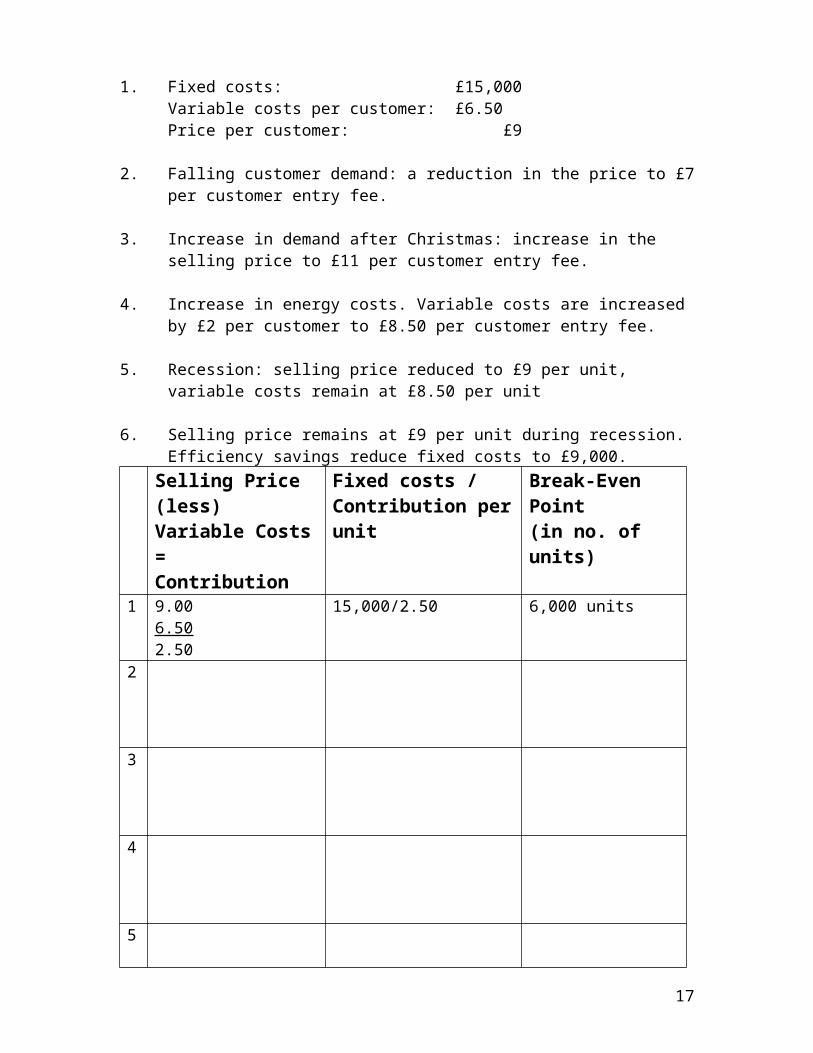
1. Fixed costs: £15,000Variable costs per customer: £6.50Price per customer: £9
2. Falling customer demand: a reduction in the price to £7 per customer entry fee.
3. Increase in demand after Christmas: increase in the selling price to £11 per customer entry fee.
4. Increase in energy costs. Variable costs are increased by £2 per customer to £8.50 per customer entry fee.
5. Recession: selling price reduced to £9 per unit, variable costs remain at £8.50 per unit
6. Selling price remains at £9 per unit during recession. Efficiency savings reduce fixed costs to £9,000.
Selling Price (less)Variable Costs =Contribution
Fixed costs /Contribution per unit
Break-Even Point(in no. of units)
1 9.006.502.50
15,000/2.50 6,000 units
2
3
4
5
6
14
As you can see, changes in the input variable costs, eg. increase in material, labour, energy costs, can have a significant effect on profit margins. The decision has to be taken as whether the business should absorb these increases thus shielding the customer, or increase the selling price, thus passing the costs onto the customer. This will depend upon a number of factors, including competitor activity, economic conditions, and the anticipated effect that pricing decisions will have on demand.
Costing Systems
The aim of a costing system is to ensure that all the costs of an organisation are recovered by being charged to that part of the organisation making the money.
The following are 3 different techniques used in cost accounting as an aid to management decision-making:
Marginal costing Absorption costing Activity-based costing
Marginal Costing
Marginal costing is a technique for dealing with variable costs. It recognises that fixed costs vary with time rather than activity and attempts to identify the cost of producing one extra unit, eg:
In theory, providing for one extra unit will incur an increase in the variable costs (direct materials, direct labour and, probably, direct expenses) – this increase is the marginal cost.
Absorption Costing
This method:
Absorbs all costs (both direct and a proportion of the indirect ‘overhead’ costs) into each unit
Remember – direct costs are directly attributable to the product/service being provided, eg. staff labour time
15

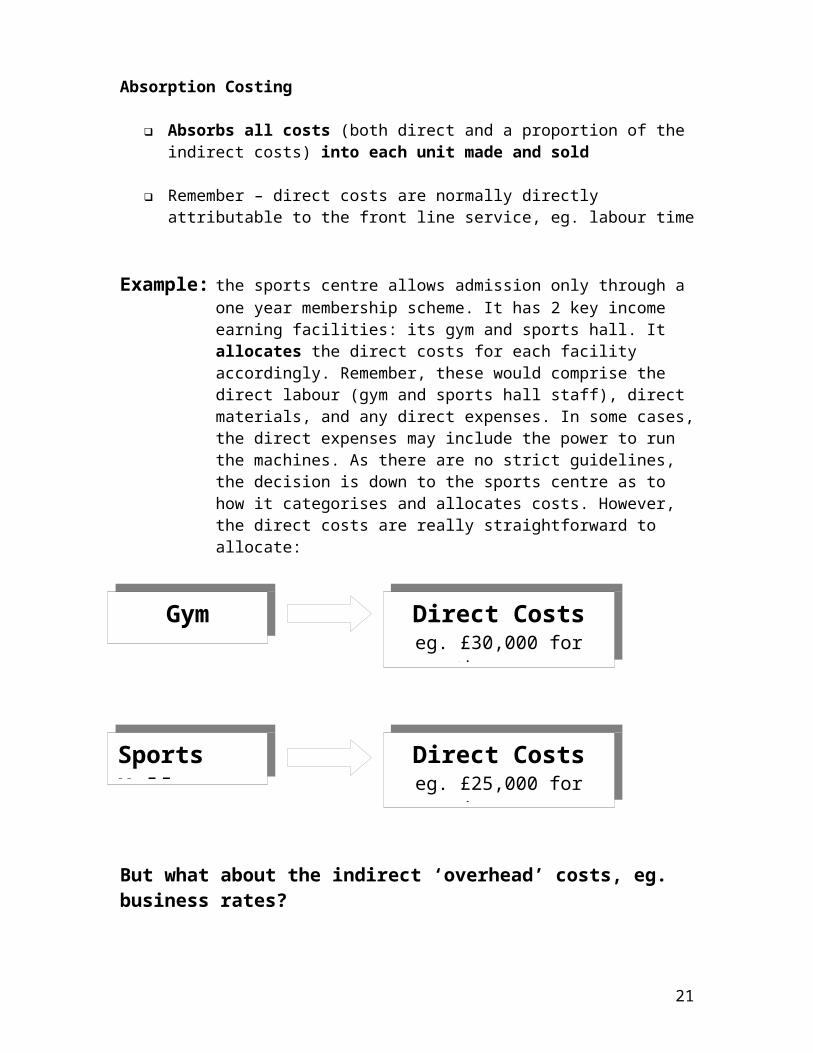
Absorption Costing
Absorbs all costs (both direct and a proportion of the indirect costs) into each unit made and sold
Remember – direct costs are normally directly attributable to the front line service, eg. labour time
Example: the sports centre allows admission only through a one year membership scheme. It has 2 key income earning facilities: its gym and sports hall. It allocates the direct costs for each facility accordingly. Remember, these would comprise the direct labour (gym and sports hall staff), direct materials, and any direct expenses. In some cases, the direct expenses may include the power to run the machines. As there are no strict guidelines, the decision is down to the sports centre as to how it categorises and allocates costs. However, the direct costs are really straightforward to allocate:
But what about the indirect ‘overhead’ costs, eg. business rates?
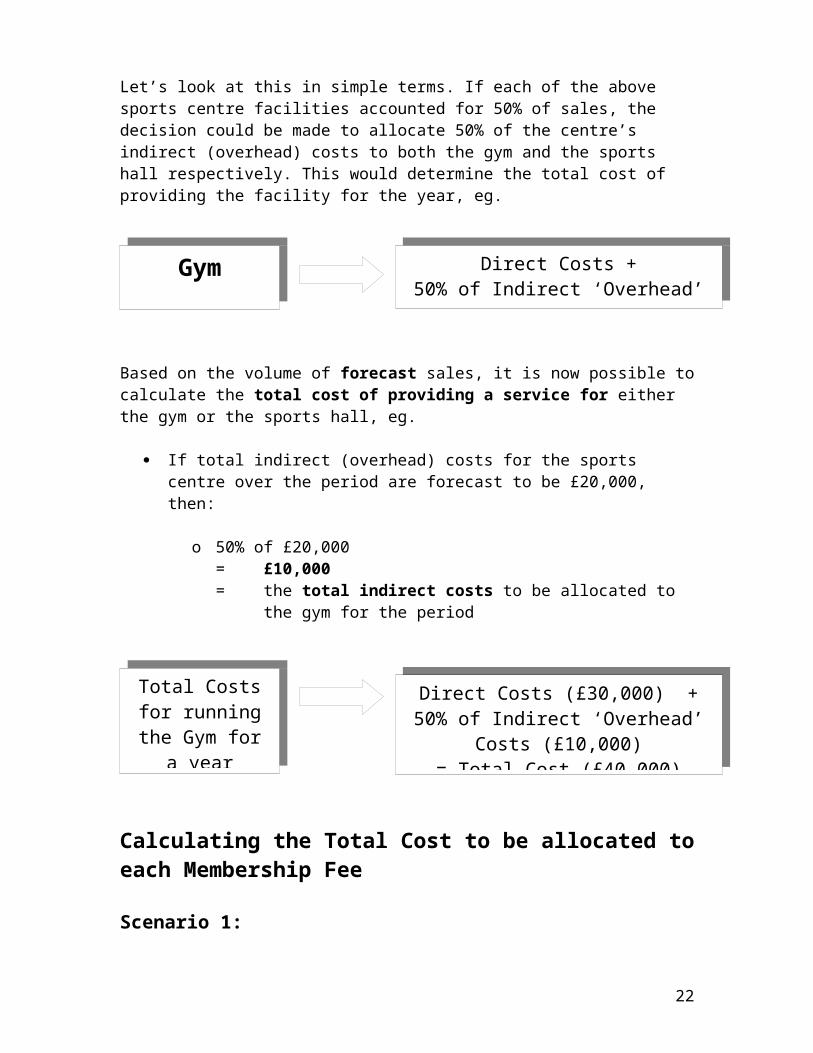
Let’s look at this in simple terms. If each of the above sports centre facilities accounted for 50% of sales, the decision could be made to allocate 50% of the centre’s indirect (overhead) costs to both the gym and the sports hall respectively. This would determine the total cost of providing the facility for the year, eg.
Gym Direct Costs +50% of Indirect ‘Overhead’ Costs
= Total Cost
Sports Hall Direct Costseg. £25,000 for the yearbased on 100 members
Gym Direct Costseg. £30,000 for the yearbased on 100 members
16
Based on the volume of forecast sales, it is now possible to calculate the total cost of providing a service for either the gym or the sports hall, eg.
If total indirect (overhead) costs for the sports centre over the period are forecast to be £20,000, then:
o 50% of £20,000 = £10,000 = the total indirect costs to be allocated to the gym for the
period
I
Calculating the Total Cost to be allocated to each Membership Fee
Scenario 1:
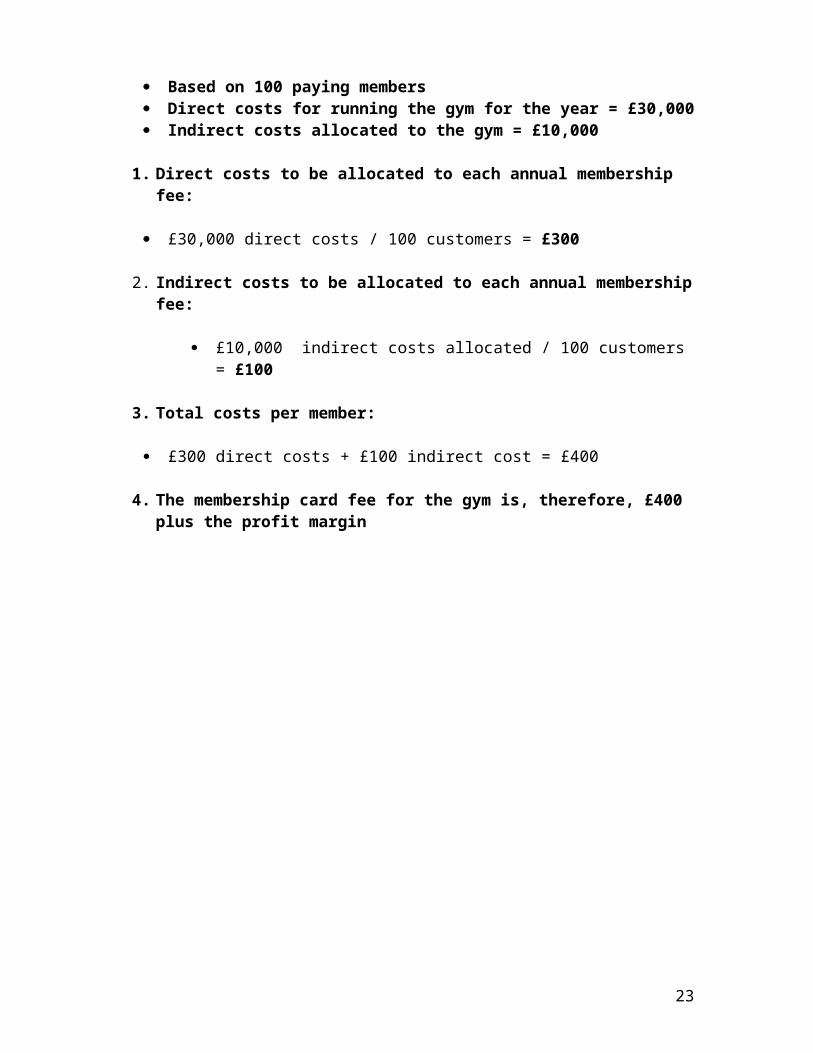
Based on 100 paying members Direct costs for running the gym for the year = £30,000 Indirect costs allocated to the gym = £10,000
1. Direct costs to be allocated to each annual membership fee:
£30,000 direct costs / 100 customers = £300
2. Indirect costs to be allocated to each annual membership fee:
£10,000 indirect costs allocated / 100 customers = £100
3. Total costs per member:
£300 direct costs + £100 indirect cost = £400
4. The membership card fee for the gym is, therefore, £400 plus the profit margin
Total Costs for running the Gym
for a year(based on 100
members)
Direct Costs (£30,000) +50% of Indirect ‘Overhead’ Costs
(£10,000)= Total Cost (£40,000)
17

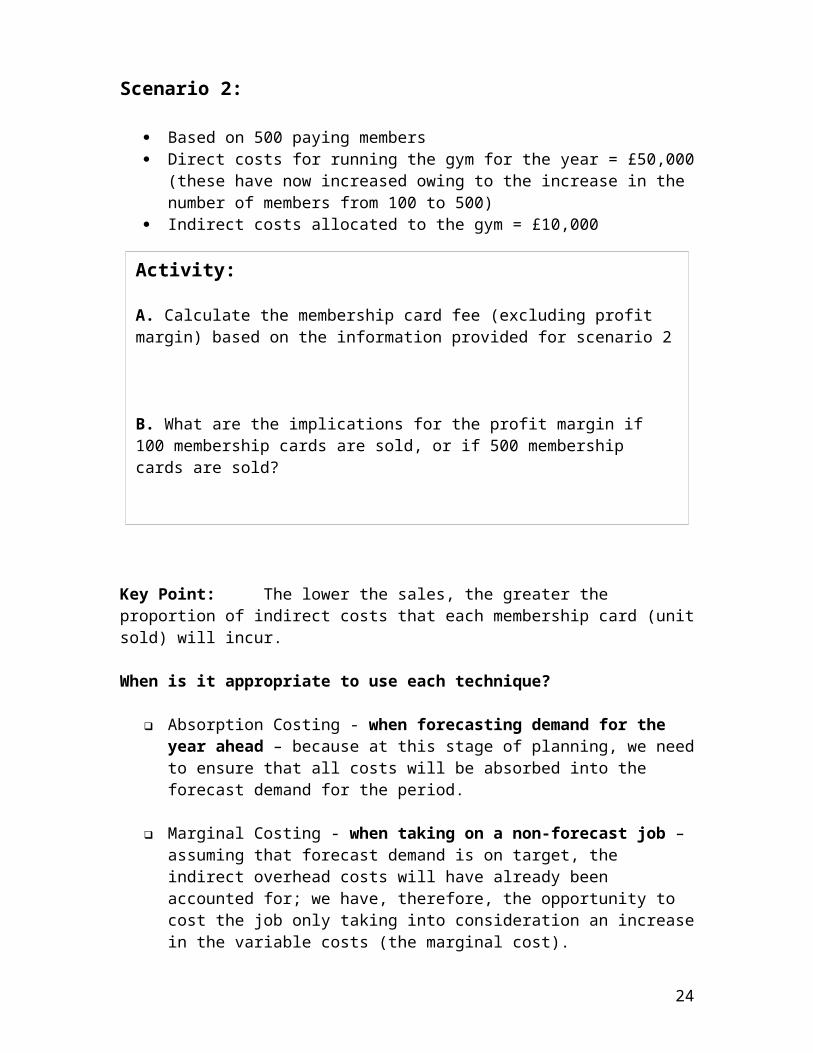
Scenario 2:
Based on 500 paying members Direct costs for running the gym for the year = £50,000
(these have now increased owing to the increase in the number of members from 100 to 500)
Indirect costs allocated to the gym = £10,000
Key Point: The lower the sales, the greater the proportion of indirect costs that each membership card (unit sold) will incur.
When is it appropriate to use each technique?
Absorption Costing - when forecasting demand for the year ahead – because at this stage of planning, we need to ensure that all costs will be absorbed into the forecast demand for the period.
Marginal Costing - when taking on a non-forecast job – assuming that forecast demand is on target, the indirect overhead costs will have already been accounted for; we have, therefore, the opportunity to cost the job only taking into consideration an increase in the variable costs (the marginal cost).
To compare both costing techniques in action let’s look at the following mini case study
Activity:
A. Calculate the membership card fee (excluding profit margin) based on the information provided for scenario 2
B. What are the implications for the profit margin if 100 membership cards are sold, or if 500 membership cards are sold?
18
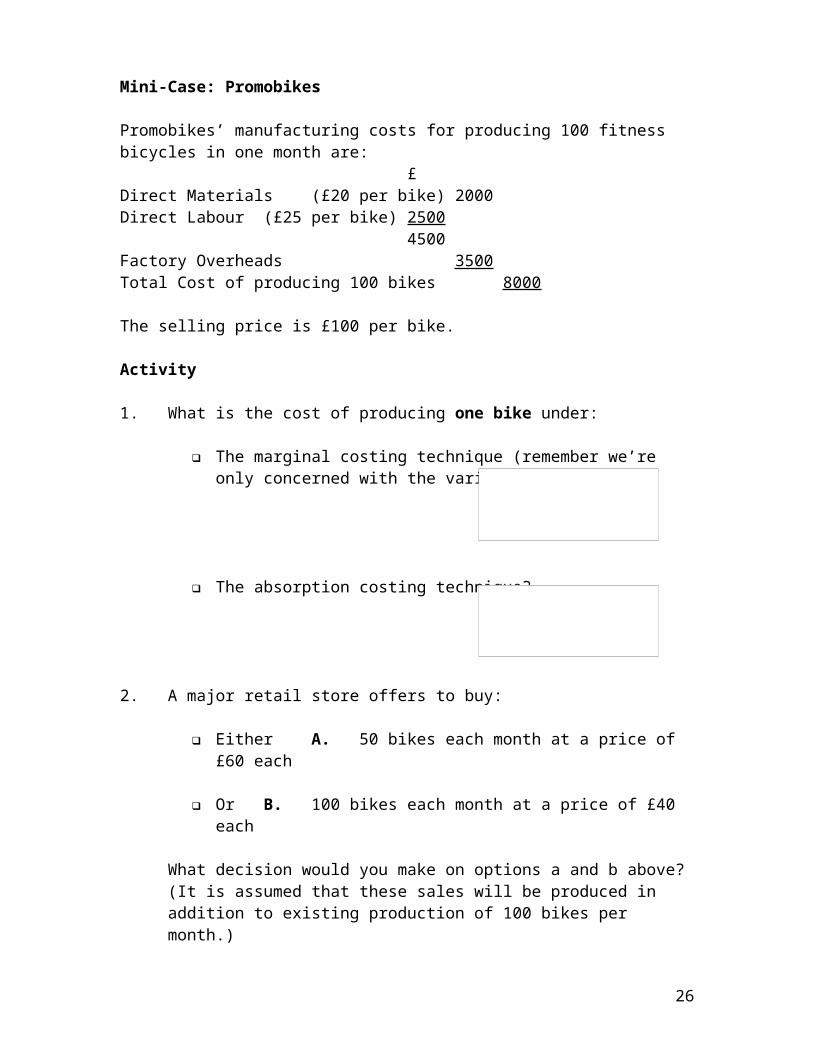
Mini-Case: Promobikes
Promobikes’ manufacturing costs for producing 100 fitness bicycles in one month are:
£Direct Materials (£20 per bike) 2000Direct Labour (£25 per bike) 2500
4500Factory Overheads 3500Total Cost of producing 100 bikes 8000
The selling price is £100 per bike.
Activity
1. What is the cost of producing one bike under:
The marginal costing technique (remember we’re only concerned with the variable costs)?
The absorption costing technique?
2. A major retail store offers to buy:
Either A. 50 bikes each month at a price of £60 each
Or B. 100 bikes each month at a price of £40 each
What decision would you make on options a and b above? (It is assumed that these sales will be produced in addition to existing production of 100 bikes per month.)
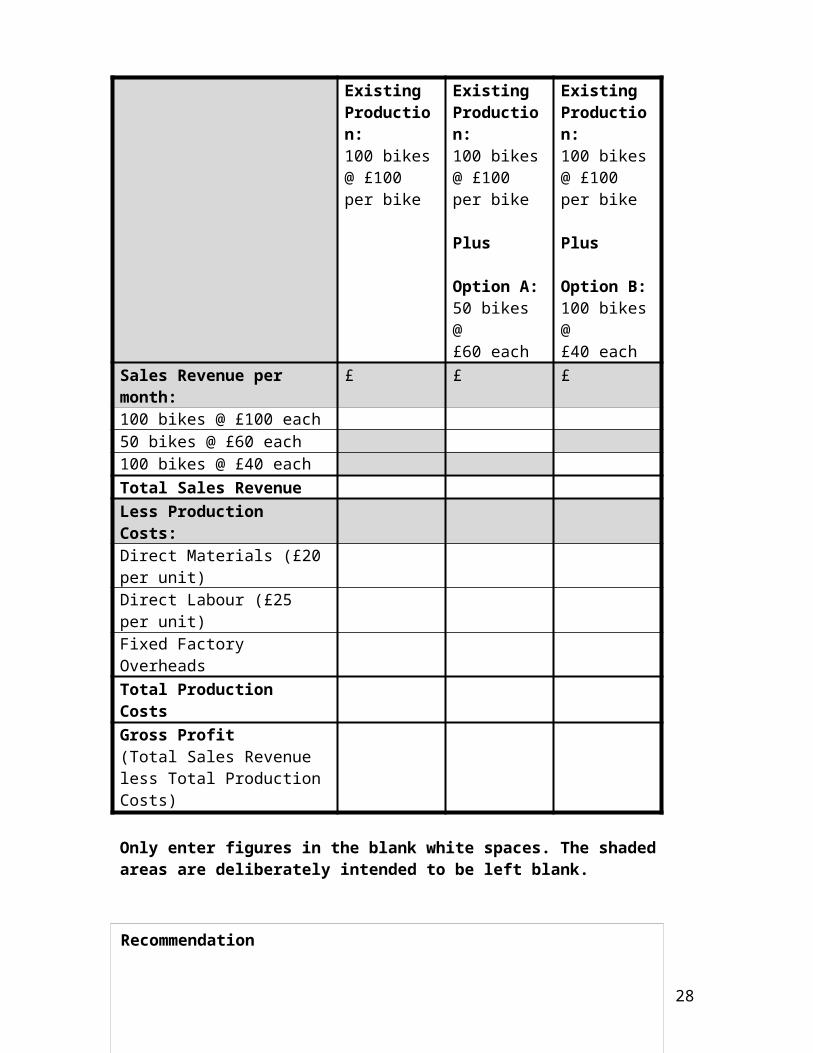
To do this, complete the summary profit statements table below:
19

ExistingProduction:100 bikes @ £100 per bike
ExistingProduction:100 bikes @ £100 per bike
Plus
Option A:50 bikes @£60 each
ExistingProduction:100 bikes @ £100 per bike
Plus
Option B:100 bikes @£40 each
Sales Revenue per month: £ £ £100 bikes @ £100 each50 bikes @ £60 each100 bikes @ £40 eachTotal Sales RevenueLess Production Costs:Direct Materials (£20 per unit)Direct Labour (£25 per unit)Fixed Factory OverheadsTotal Production CostsGross Profit(Total Sales Revenue less Total Production Costs)
Only enter figures in the blank white spaces. The shaded areas are deliberately intended to be left blank.
Recommendation
20
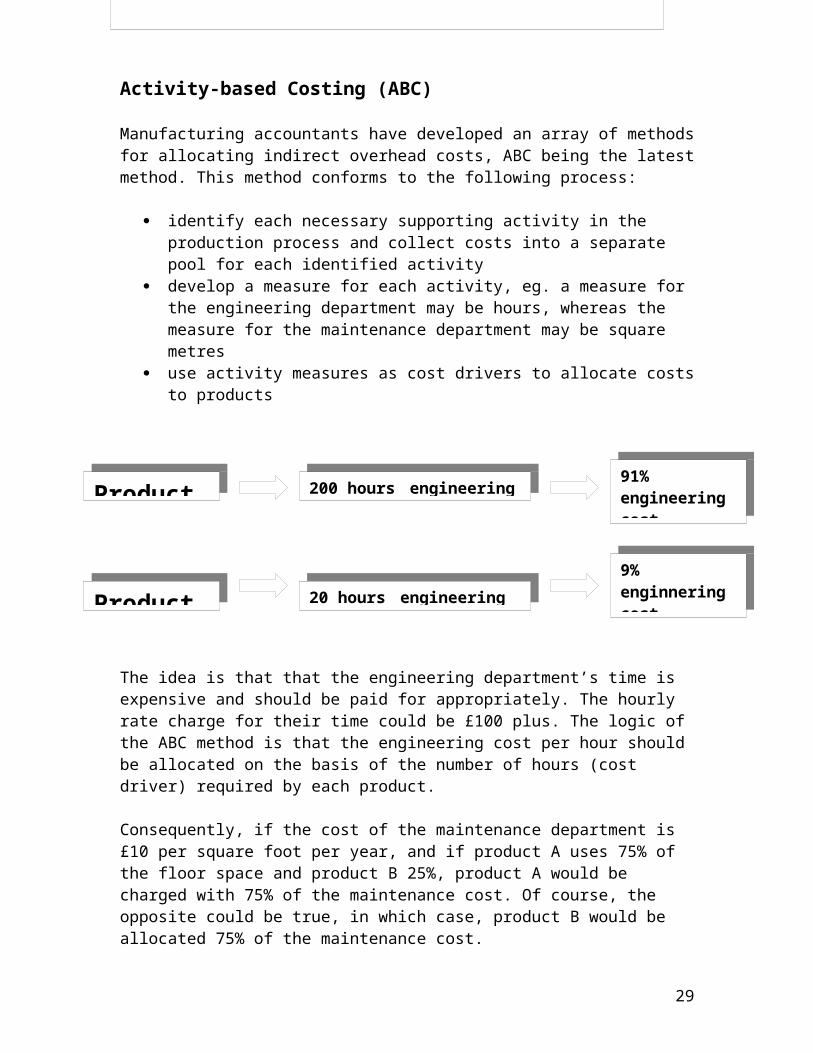
Activity-based Costing (ABC)
Manufacturing accountants have developed an array of methods for allocating indirect overhead costs, ABC being the latest method. This method conforms to the following process:
identify each necessary supporting activity in the production process and collect costs into a separate pool for each identified activity
develop a measure for each activity, eg. a measure for the engineering department may be hours, whereas the measure for the maintenance department may be square metres
use activity measures as cost drivers to allocate costs to products
The idea is that that the engineering department’s time is expensive and should be paid for appropriately. The hourly rate charge for their time could be £100 plus. The logic of the ABC method is that the engineering cost per hour should be allocated on the basis of the number of hours (cost driver) required by each product.
Consequently, if the cost of the maintenance department is £10 per square foot per year, and if product A uses 75% of the floor space and product B 25%, product A would be charged with 75% of the maintenance cost. Of course, the opposite could be true, in which case, product B would be allocated 75% of the maintenance cost.
Product A
Product B
200 hours engineering time
20 hours engineering time
91% engineering cost allocated
9% enginnering cost allocated
21
Profit Improvement
Activity: in what ways can the profitability of an organisation be improved?
There are, to the best of my knowledge, only three ways (legally!) to improve the profitability of a business
Sell more of your products and services Raise your prices (or reduce your discounts) Reduce your costs
How do you think your competitors would react to each of these scenarios?
They probably wouldn’t even know if you reduced costs and, even if they did, what could they do about it … your cost structure is exclusive to your business. So, cost reduction is probably the often the first consideration when trying to improve profitability.
To increase profits, you do not need to sell more, but operate efficiently through disciplined control of costs … by everyone in the organisation.
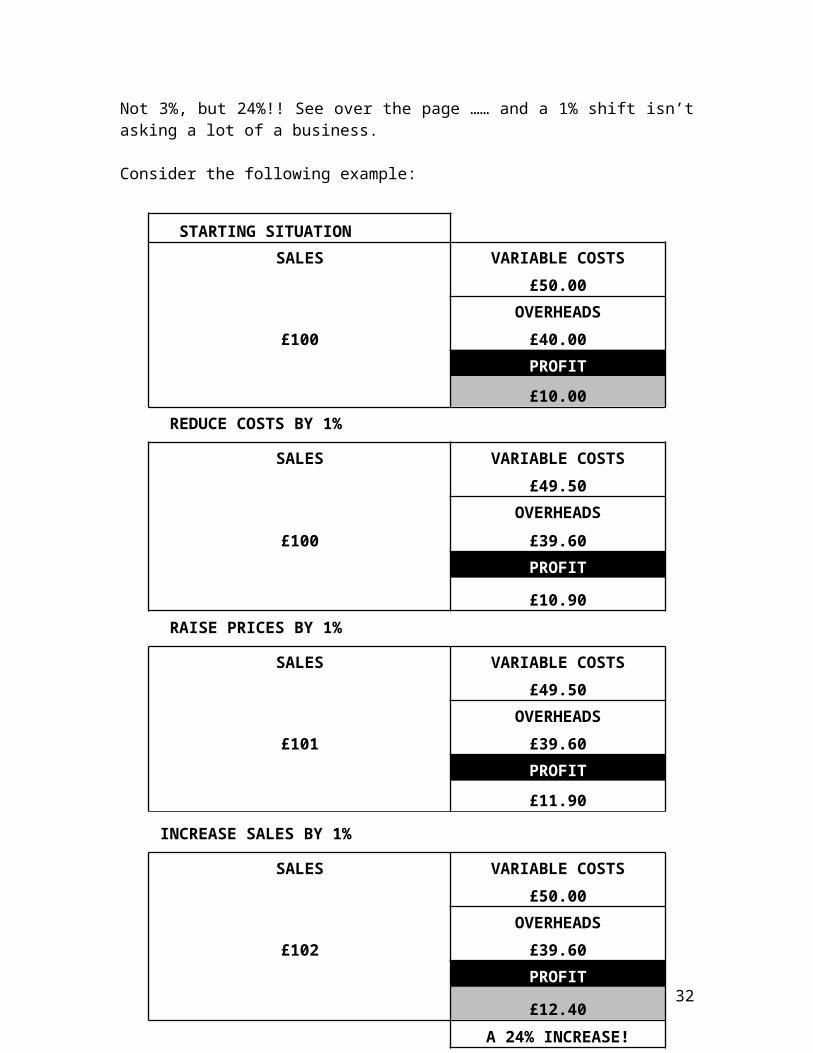
What if you could cut costs by 1%, sell 1% more and increase prices (or reduce discounts) by 1% … all at the same time? How much would you have increased net profitability by?
Not 3%, but 24%!! See over the page …… and a 1% shift isn’t asking a lot of a business.
Consider the following example:
22
23
STARTING SITUATIONSALES VARIABLE COSTS
£50.00OVERHEADS
£100 £40.00PROFIT
£10.00 REDUCE COSTS BY 1%
SALES VARIABLE COSTS£49.50
OVERHEADS
£100 £39.60PROFIT
£10.90 RAISE PRICES BY 1%
SALES VARIABLE COSTS£49.50
OVERHEADS£101 £39.60
PROFIT
£11.90
INCREASE SALES BY 1%
SALES VARIABLE COSTS£50.00
OVERHEADS£102 £39.60
PROFIT
£12.40A 24% INCREASE!
Cost Efficiency
Activity: using the post-it notes and flip chart pens provided in the workshop, identify opportunities for greater cost efficiency within your operational area or other areas in the University that you have observed. Note the outcome of this exercise below.
24

Investment Decisions
In this second key area of the module, we will be exploring a range of capital investment methods. But what is the difference between capital expenditure and revenue expenditure?
Revenue and Capital expenditure are slightly different items. Revenue expenditure is money that is spent on items that are only going to be used (or performed) once, such as printer paper, stock, repairs, petrol etc. These items would go under expenses in the profit and loss account.
Capital Expenditure is money spent by a business on items that are going to be used more than one time, for example machinery, buildings and vehicles. These items would appear on the Balance Sheet as a fixed asset and would be depreciated over their useful life, the depreciation being deducted as an expense in the Profit and Loss Account. We will be looking at Cash Flow, the Profit and Loss Account, and the Balance Sheet, in the next Finance module.
The focus of this module is on capital expenditure. To remind you of the objectives for this part of the module presented earlier, they are as follows:
Understand and apply the main investment methods used in business Discuss the strengths and weaknesses of each method Understand the importance of risk and the need for sensitivity analysis Identify a structure for controlling and reviewing capital projects
All expenditure within an organisation is made with a view to deriving a benefit from it. Some forms of expenditure are, by their nature, short-term with an expectation that their benefit is short-lived, eg. investment in stocks of raw materials or component parts.
Longer term investment involves what are termed as capital expenditure (capex) decisions. This inevitably necessitates significant payments at the outset with smaller returns over time which, hopefully, will achieve the desired, projected benefits. Wrong decisions can, of course, be disasterous.
Therefore, important decisions need to be made on whether to invest, what to invest in, when to make the investment, and how project viability will be determined.
But, why do you need to invest at all? There are many reasons why a business will want to make capital investment decisions. They range from the desire to expand the business, eg. increase capacity, the need to replace and/or modernise existing assets, or to comply with legislation, eg. environmental or health and safety requirements. In summary, ‘doing nothing’ is not an option as eventually all businesses need to invest, if only to survive!
25
Examples of capital expenditure could include:
The purchase of plant and machinery The purchase of land and/or buildings
The objectives of investment appraisal can be summarised as:
Whether a particular project is justified in terms of the expected benefits If there are alternative or competing projects, which one should be chosen If there is a shortage of funds available, which proposals should be
chosen
The methods that we will be looking at in this section are purely concerned with the financial aspects of a decision. Any decision should be based also on non-financial considerations such as, for example, supplier reliability.
Normally, a number of proposals will be evaluated to see which best meets the organisation’s objectives and is financially acceptable.
Project Evaluation
Before considering the various methods of project (investment) evaluation it is important for management to consider the following questions:
Does the project fit within overall objectives of the business? How will it be funded? What other resources will be required and timescales? How long will the project last and what are its key stages? What is the expected pattern of cash flows? What are the ‘key sensitivities’ and what if… scenarios? How does the investment compare with other opportunities available?
Investment Appraisal Methods
There are four key investment appraisal methods used in practice in UK businesses. These are:
Payback period (PP) Accounting rate of return (ARR) Net present value (NPV) Internal rate of return (IRR)
There is a fifth method, but I wouldn’t recommend it …gut-feeling!
The end goal of whichever method is used, is for the organisation to make an informed decision as to whether or not to accept a capital investment proposal.
26

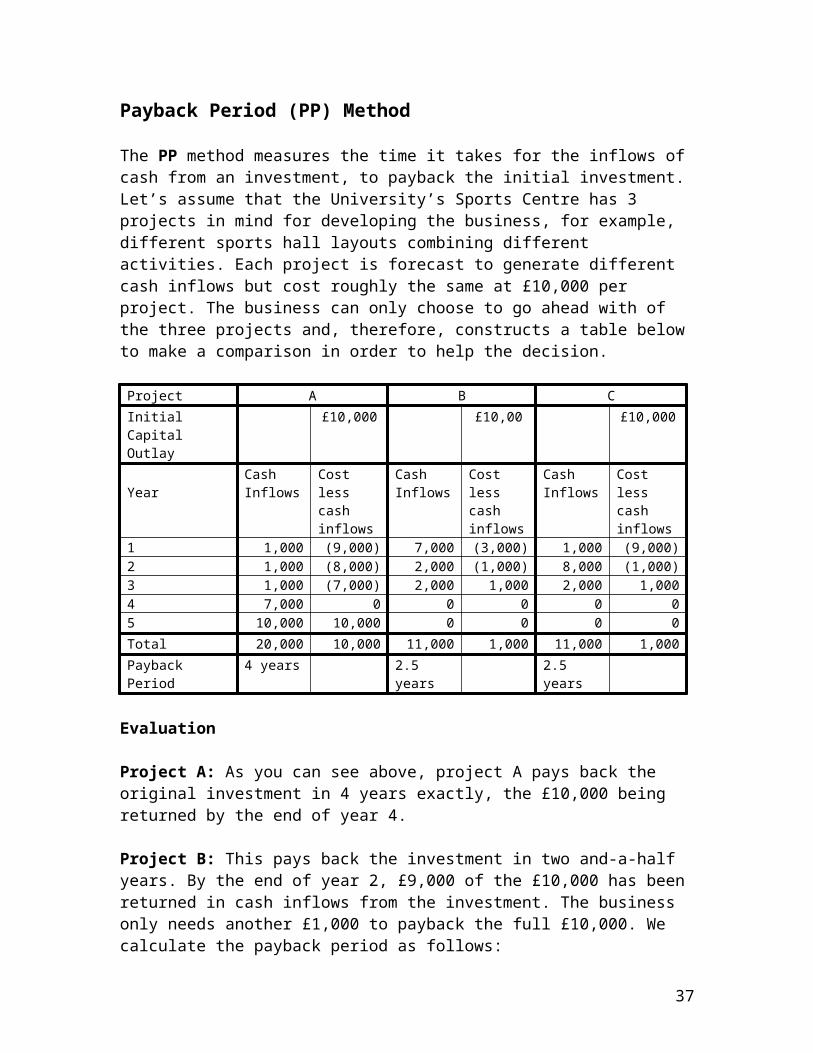
Payback Period (PP) Method
The PP method measures the time it takes for the inflows of cash from an investment, to payback the initial investment. Let’s assume that the University’s Sports Centre has 3 projects in mind for developing the business, for example, different sports hall layouts combining different activities. Each project is forecast to generate different cash inflows but cost roughly the same at £10,000 per project. The business can only choose to go ahead with of the three projects and, therefore, constructs a table below to make a comparison in order to help the decision.
Evaluation
Project A: As you can see above, project A pays back the original investment in 4 years exactly, the £10,000 being returned by the end of year 4.
Project B: This pays back the investment in two and-a-half years. By the end of year 2, £9,000 of the £10,000 has been returned in cash inflows from the investment. The business only needs another £1,000 to payback the full £10,000. We calculate the payback period as follows:
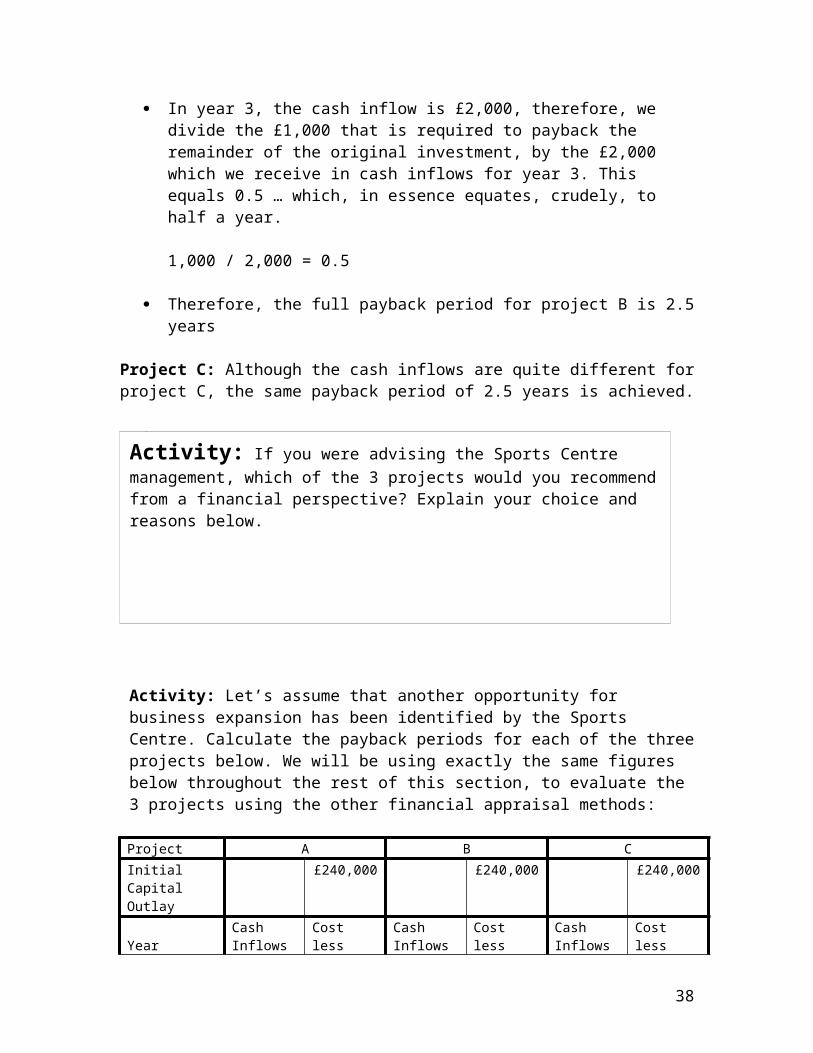
In year 3, the cash inflow is £2,000, therefore, we divide the £1,000 that is required to payback the remainder of the original investment, by the £2,000 which we receive in cash inflows for year 3. This equals 0.5 … which, in essence equates, crudely, to half a year.
1,000 / 2,000 = 0.5
Therefore, the full payback period for project B is 2.5 years
Project C: Although the cash inflows are quite different for project C, the same payback period of 2.5 years is achieved.
Activity: If you were advising the Sports Centre management, which of
the 3 projects would you recommend from a financial perspective? Explain your choice and reasons below. 27
Project A B CInitial Capital Outlay
£10,000 £10,00 £10,000
YearCash Inflows
Cost lesscash inflows
Cash Inflows
Cost lesscash inflows
Cash Inflows
Cost lesscash inflows
1 1,000 (9,000) 7,000 (3,000) 1,000 (9,000)2 1,000 (8,000) 2,000 (1,000) 8,000 (1,000)3 1,000 (7,000) 2,000 1,000 2,000 1,0004 7,000 0 0 0 0 05 10,000 10,000 0 0 0 0Total 20,000 10,000 11,000 1,000 11,000 1,000Payback Period 4 years 2.5 years 2.5 years
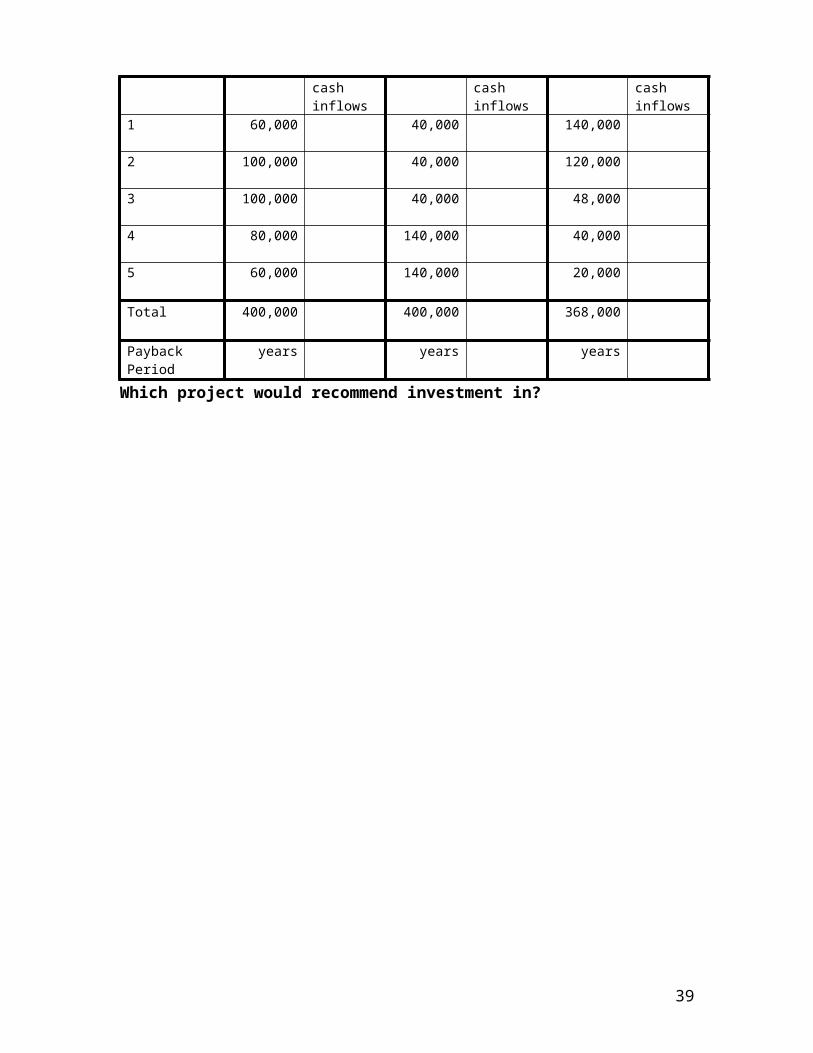
Activity: Let’s assume that another opportunity for business expansion has been identified by the Sports Centre. Calculate the payback periods for each of the three projects below. We will be using exactly the same figures below throughout the rest of this section, to evaluate the 3 projects using the other financial appraisal methods:
Which project would recommend investment in?
Activity: If you were advising the Sports Centre management, which of the 3 projects would you recommend from a financial perspective? Explain your choice and reasons below.
28
Project A B CInitial Capital Outlay
£240,000 £240,000 £240,000
YearCash Inflows
Cost lesscash inflows
Cash Inflows
Cost lesscash inflows
Cash Inflows
Cost lesscash inflows
1 60,000 40,000 140,000
2 100,000 40,000 120,000
3 100,000 40,000 48,000
4 80,000 140,000 40,000
5 60,000 140,000 20,000
Total 400,000 400,000 368,000
PaybackPeriod
years years years
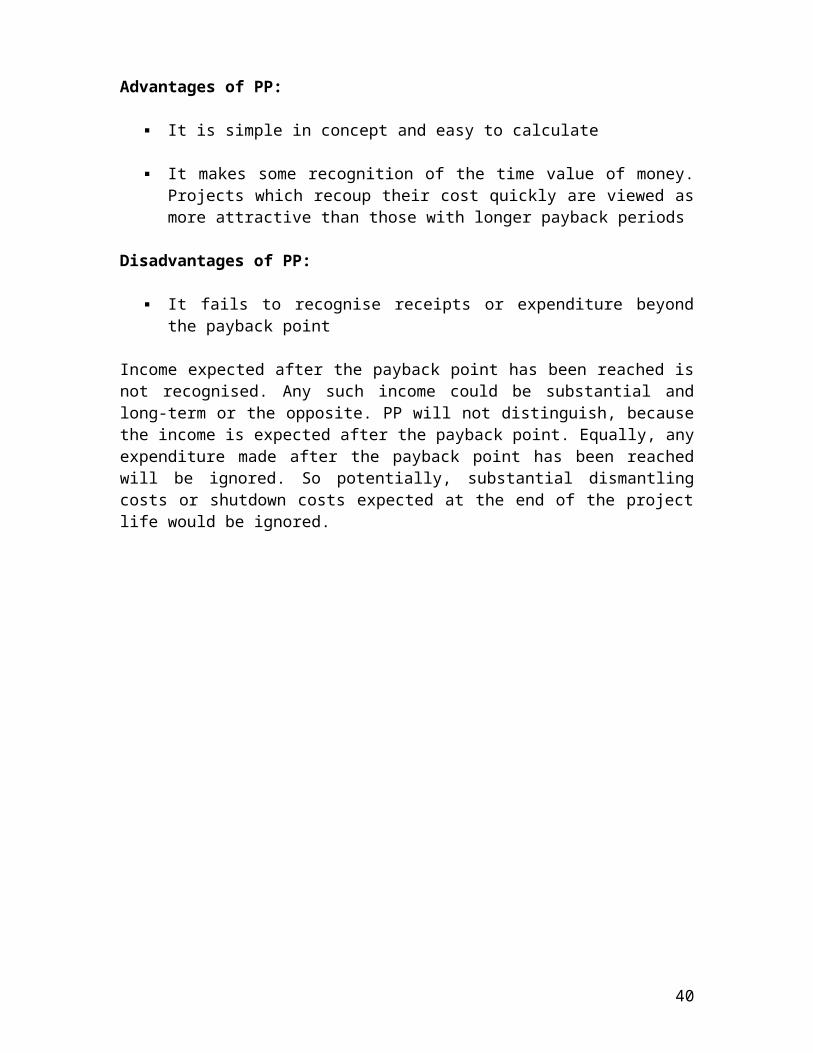
Advantages of PP:
It is simple in concept and easy to calculate
It makes some recognition of the time value of money. Projects which recoup their cost quickly are viewed as more attractive than those with longer payback periods
Disadvantages of PP:
It fails to recognise receipts or expenditure beyond the payback point
Income expected after the payback point has been reached is not recognised. Any such income could be substantial and long-term or the opposite. PP will not distinguish, because the income is expected after the payback point. Equally, any expenditure made after the payback point has been reached will be ignored. So potentially, substantial dismantling costs or shutdown costs expected at the end of the project life would be ignored.
29

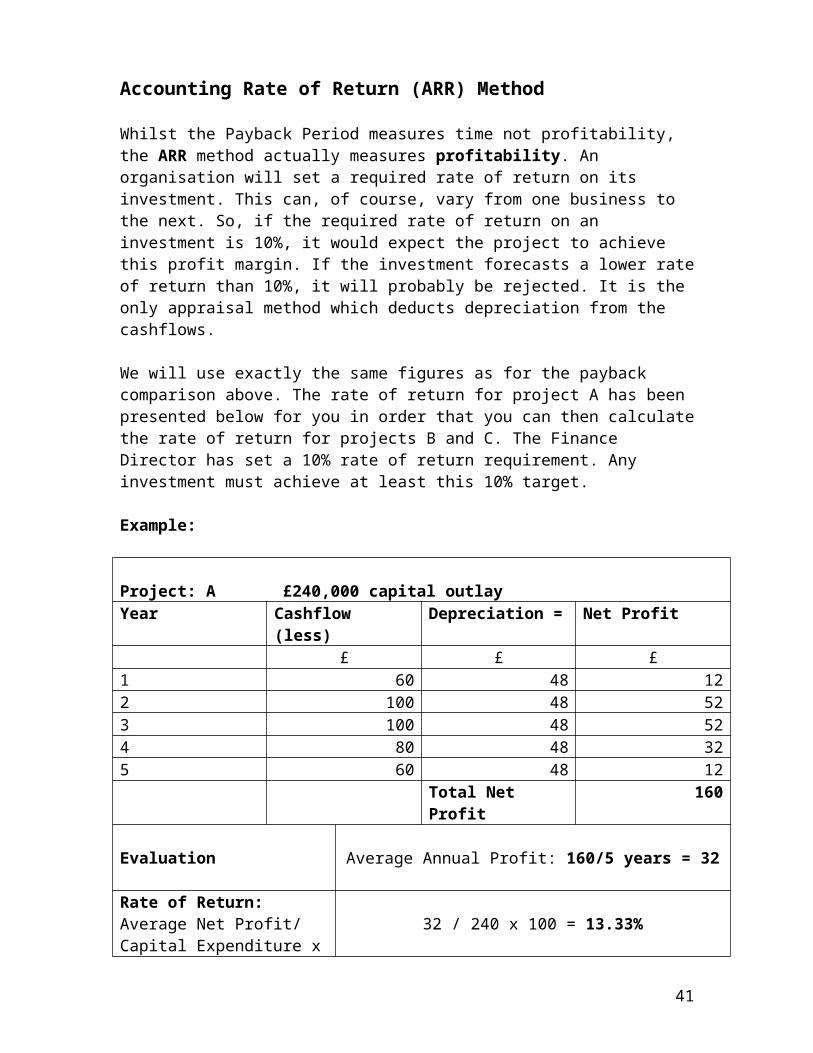
Accounting Rate of Return (ARR) Method
Whilst the Payback Period measures time not profitability, the ARR method actually measures profitability. An organisation will set a required rate of return on its investment. This can, of course, vary from one business to the next. So, if the required rate of return on an investment is 10%, it would expect the project to achieve this profit margin. If the investment forecasts a lower rate of return than 10%, it will probably be rejected. It is the only appraisal method which deducts depreciation from the cashflows.
We will use exactly the same figures as for the payback comparison above. The rate of return for project A has been presented below for you in order that you can then calculate the rate of return for projects B and C. The Finance Director has set a 10% rate of return requirement. Any investment must achieve at least this 10% target.
Example:
Project: A £240,000 capital outlayYear Cashflow (less) Depreciation = Net Profit
£ £ £1 60 48 122 100 48 523 100 48 524 80 48 325 60 48 12
Total Net Profit 160
Evaluation Average Annual Profit: 160/5 years = 32
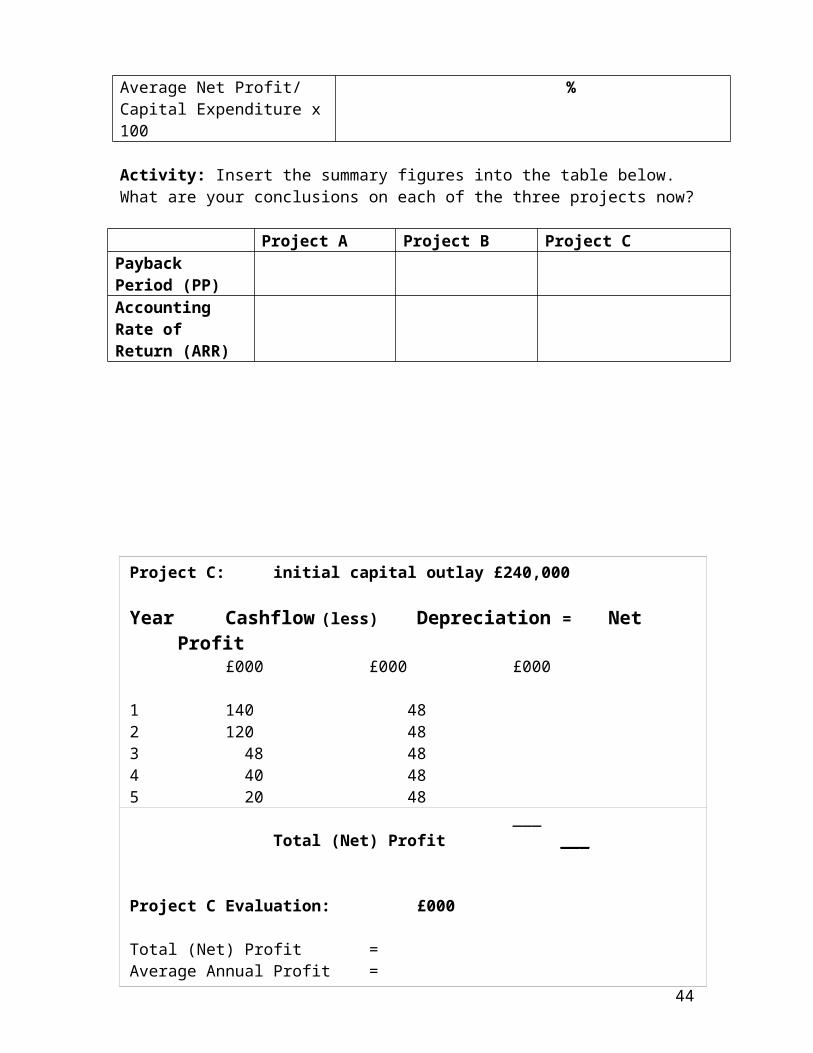
Rate of Return:Average Net Profit/Capital Expenditure x 100
32 / 240 x 100 = 13.33%
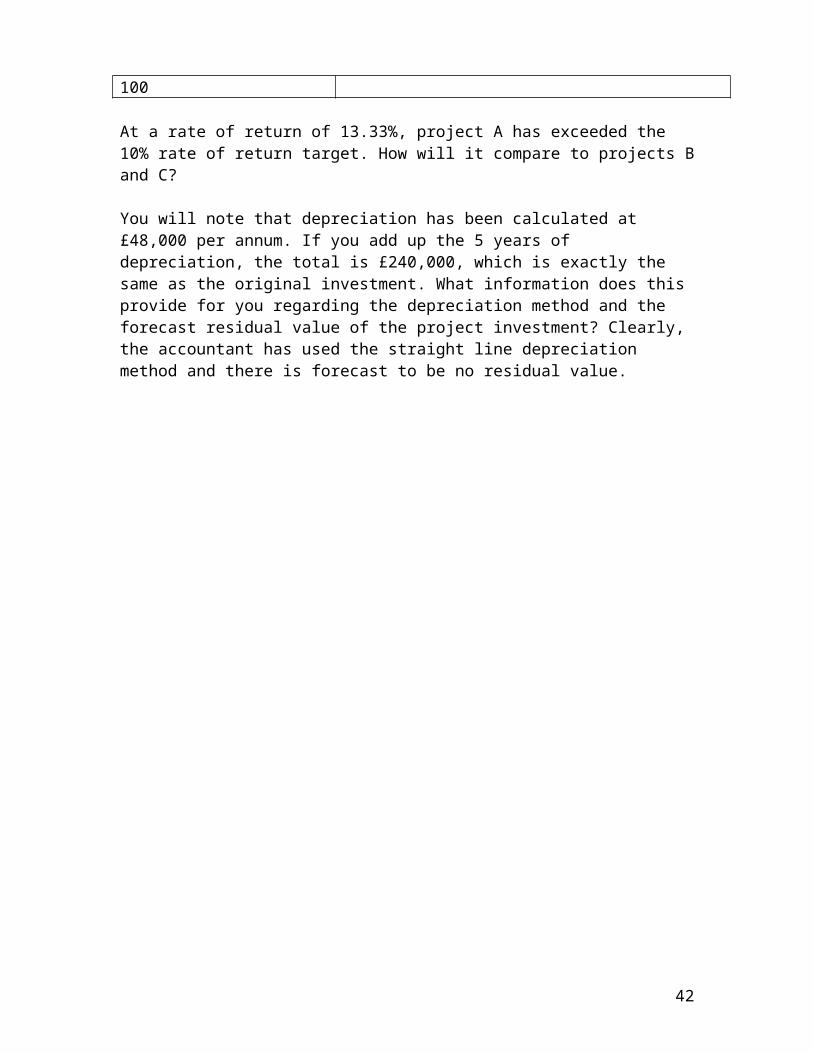
At a rate of return of 13.33%, project A has exceeded the 10% rate of return target. How will it compare to projects B and C?
You will note that depreciation has been calculated at £48,000 per annum. If you add up the 5 years of depreciation, the total is £240,000, which is exactly the same as the original investment. What information does this provide for you regarding the depreciation method and the forecast residual value of the project investment? Clearly, the accountant has used the straight line depreciation method and there is forecast to be no residual value.
30
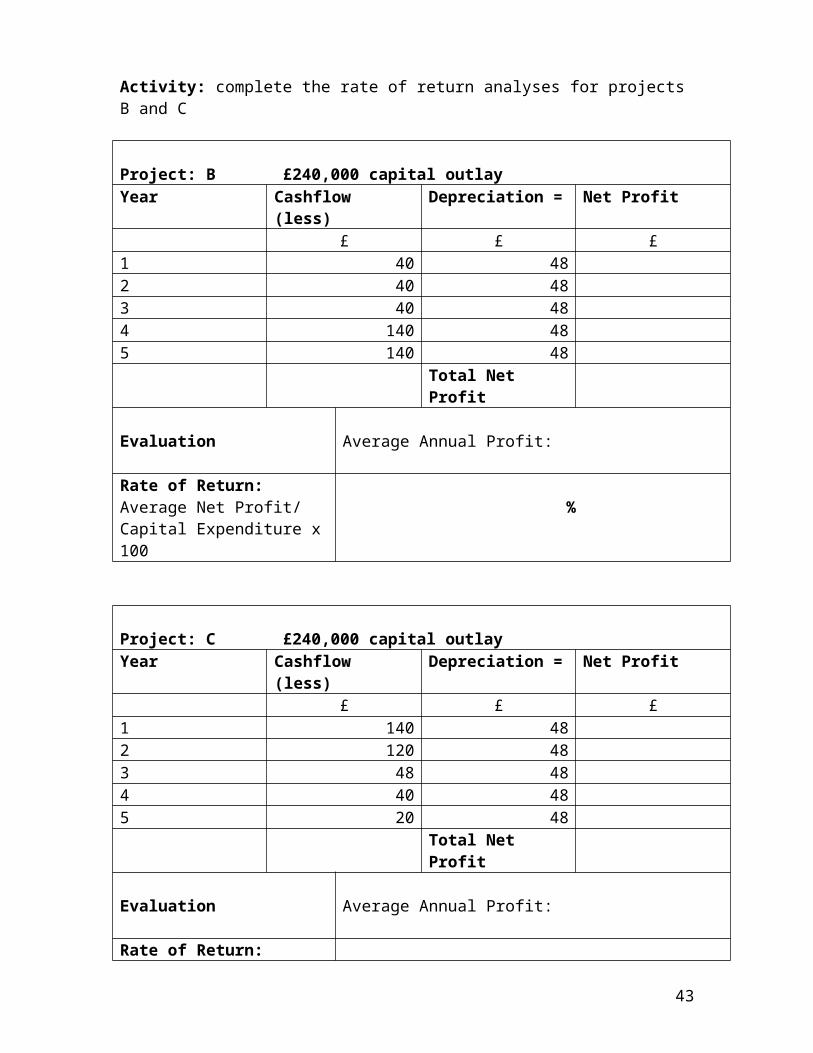
Activity: complete the rate of return analyses for projects B and C
Project: B £240,000 capital outlayYear Cashflow (less) Depreciation = Net Profit
£ £ £1 40 482 40 483 40 484 140 485 140 48
Total Net Profit
Evaluation Average Annual Profit:
Rate of Return:Average Net Profit/Capital Expenditure x 100
%
Project: C £240,000 capital outlayYear Cashflow (less) Depreciation = Net Profit
£ £ £1 140 482 120 483 48 484 40 485 20 48
Total Net Profit
Evaluation Average Annual Profit:
Rate of Return:Average Net Profit/Capital Expenditure x 100
%
Activity: Insert the summary figures into the table below. What are your conclusions on each of the three projects now?
Project A Project B Project CPayback Period (PP)Accounting Rate of Return (ARR)
31
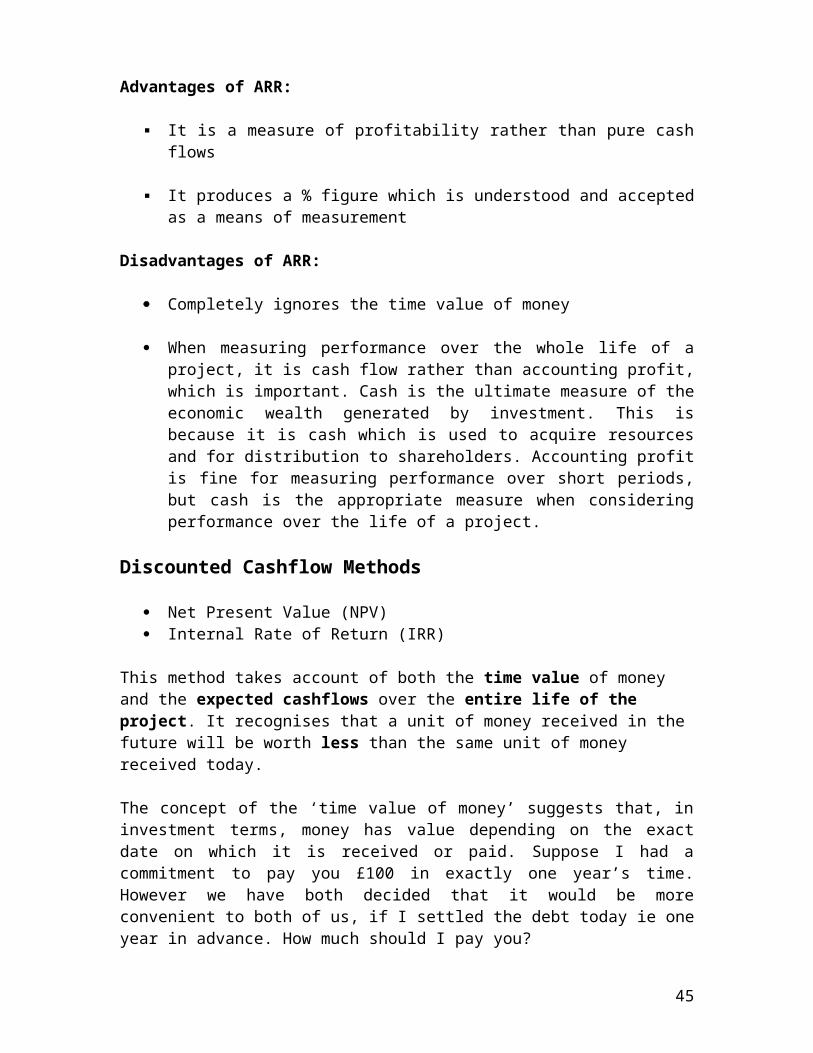
Advantages of ARR:
It is a measure of profitability rather than pure cash flows
It produces a % figure which is understood and accepted as a means of measurement
Disadvantages of ARR:
Completely ignores the time value of money
When measuring performance over the whole life of a project, it is cash flow rather than accounting profit, which is important. Cash is the ultimate measure of the economic wealth generated by investment. This is because it is cash which is used to acquire resources and for distribution to shareholders. Accounting profit is fine for measuring performance over short periods, but cash is the appropriate measure when considering performance over the life of a project.
Discounted Cashflow Methods
Net Present Value (NPV) Internal Rate of Return (IRR)
This method takes account of both the time value of money and the expected cashflows over the entire life of the project. It recognises that a unit of money received in the future will be worth less than the same unit of money received today.
The concept of the ‘time value of money’ suggests that, in investment terms, money has value depending on the exact date on which it is received or paid. Suppose I had a commitment to pay you £100 in exactly one year’s time. However we have both decided that it would be more convenient to both of us, if I settled the debt today ie one year in advance. How much should I pay you?
Clearly, I would not pay you £100 today, because I am settling the debt one year early and I will lose the investment value of that £100 for the year. Also you would gain an investment opportunity, since you would have the £100 one year early. If you could invest the money at 10% pa interest (perhaps a little unrealistic these days, but chosen for simplicity!), you would have £110 at the end of the year (ie the date I was due to repay you).
So, I would pay an amount less than £100 to settle the debt today recognising the investment opportunity to you and loss of investment opportunity to me. But exactly how much should I pay to settle the debt today?
The answer is £90.91(£100/1.1), which if you then invested at 10% pa would earn you £9.09 in interest and therefore give you a total £100 in one year’s time.
32

In investment terms, assuming that the best interest rate you could receive is 10% pa, you would not care whether I paid you £90.91 today or £100 in exactly one year’s time since both amounts would have the same value to you (that’s always assuming that you are confident that I will be able to repay in one year’s time!)
In ‘accountant speak’ we would refer to the amount due to be received or paid on a specific date as a future value (often abbreviated as FV). Similarly, the present-day amount that equates to that future value is called a present value (often abbreviated as PV).
In this example, we have an FV of £100, which we have converted into a PV of £90.91
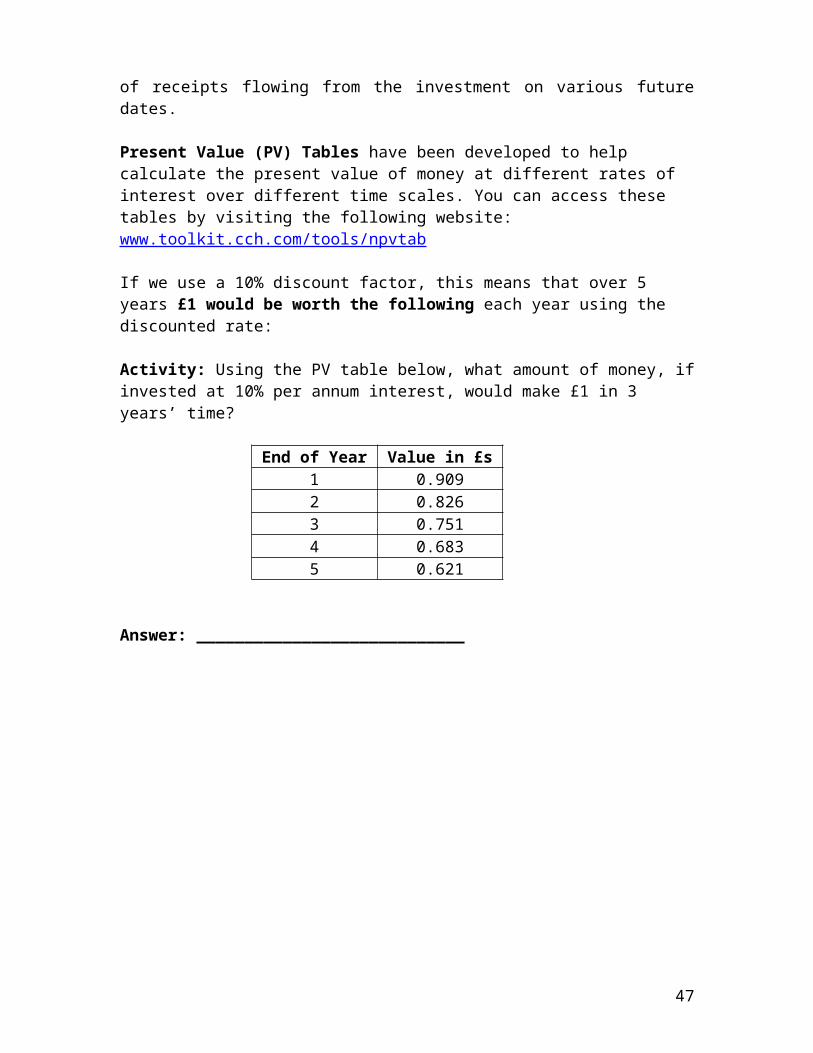
So far we have considered the ‘time value of money’ as applied to just one future payment. Investment Appraisal is far more complicated than that, in that the investment usually requires a payment at the beginning, possibly additional payments on future dates and (hopefully) a stream of receipts flowing from the investment on various future dates.
Present Value (PV) Tables have been developed to help calculate the present value of money at different rates of interest over different time scales. You can access these tables by visiting the following website: www.toolkit.cch.com/tools/npvtab
If we use a 10% discount factor, this means that over 5 years £1 would be worth the following each year using the discounted rate:
Activity: Using the PV table below, what amount of money, if invested at 10% per annum interest, would make £1 in 3 years’ time?
End of Year Value in £s1 0.9092 0.8263 0.7514 0.6835 0.621
Answer: ____________________________
33
Net Present Value
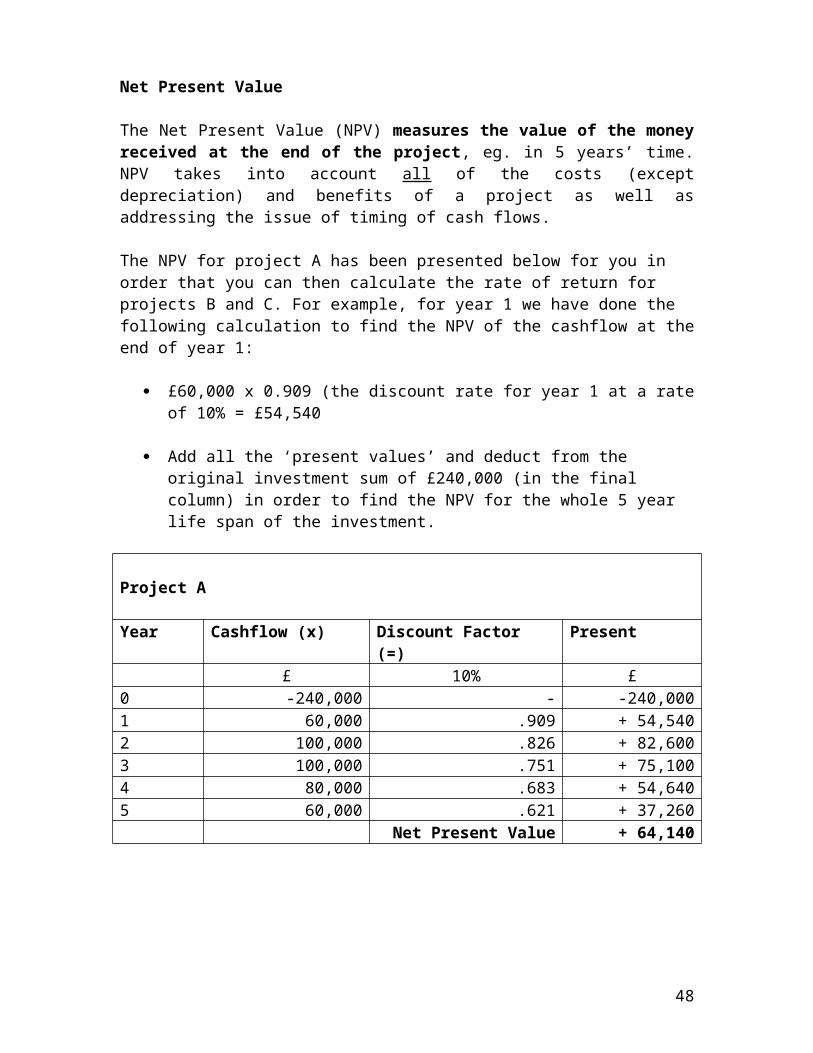
The Net Present Value (NPV) measures the value of the money received at the end of the project, eg. in 5 years’ time. NPV takes into account all of the costs (except depreciation) and benefits of a project as well as addressing the issue of timing of cash flows.
The NPV for project A has been presented below for you in order that you can then calculate the rate of return for projects B and C. For example, for year 1 we have done the following calculation to find the NPV of the cashflow at the end of year 1:
£60,000 x 0.909 (the discount rate for year 1 at a rate of 10% = £54,540
Add all the ‘present values’ and deduct from the original investment sum of £240,000 (in the final column) in order to find the NPV for the whole 5 year life span of the investment.
Project A
Year Cashflow (x) Discount Factor (=) Present£ 10% £
0 -240,000 - -240,0001 60,000 .909 + 54,5402 100,000 .826 + 82,6003 100,000 .751 + 75,1004 80,000 .683 + 54,6405 60,000 .621 + 37,260
Net Present Value + 64,140
34
Activity: now calculate the NPVs of projects B and C using a discounted cashflow rate of 10%.
Project B
Year Cashflow (x) Discount Factor (=) Present£ 10% £
0 -240,000 - -240,0001 40,000 .9092 40,000 .8263 40,000 .7514 140,000 .6835 140,000 .621
Net Present Value
Project C
Year Cashflow (x) Discount Factor (=) Present£ 10% £
0 -240,000 - -240,0001 140,000 .9092 120,000 .8263 48,000 .7514 40,000 .6835 20,000 .621
Net Present Value
Conclusions
All 3 projects have positive NPVs
If the business is able to raise funds for the investment at no more than 10% interest, then each project appears to be worthwhile because of the positive NPVs
35
Activity: Insert the summary figures into the table below. What are your conclusions on each of the three projects now?
Each method paints a slightly different picture of each project investment because of their different objectives. It is down to the business as to what it sees as being more important.
Advantages of NPV:
NPV fully takes account of the time value of money
The whole of the relevant cash flows are taken into account and they are treated differently according to their timing
The output of the NPV analysis has a direct bearing on the wealth of the shareholders of the business (positive NPVs enhance wealth, negative ones reduce it)
It enables projects to be ranked in order of attractiveness. Where a choice has to be made amongst projects, the business should select the project with the largest NPV, as this will enhance shareholder wealth more.
Disadvantages of NPV:
The NPV requires the business to calculate an interest rate to use
The NPV calculation is only valid for the interest rate that has been used
36
Project A Project B Project CPP
ARR
NPV
Internal Rate of Return (IRR)
IRR is similar to NPV in that it also involves discounting cash flows. The IRR is the discount rate which, when applied to future cash flows, will make them equate to the initial outlay.
In other words, the IRR is the discount rate, which will have the effect of producing an NPV equal to zero.
Therefore, if the discount rate is increased sufficiently, eventually a rate will be identified which will cause the NPV to exactly equal zero at the end of the project life. This is the IRR
When the discount rate is zero, the NPV will be the sum of all the cash flows ie no account is taken of the time value of money. However, as the discount rate increases, there is a corresponding decrease in the NPV. When the NPV crosses the horizontal axis there will be a zero NPV, which equates to the IRR.
Unfortunately, IRR can only be calculated using trial and error!
The calculations for the IRR for Project A have been calculated for you below. A discount rate of 20% has been identified as the rate which will almost equal zero by the end of the project life.
37
Project A
Year Cashflow (x) Discount Factor (=) Present£ 20% £
0 -240,000 - -240,0001 60,000 ..833 + 49,9802 100,000 ..694 + 69,4003 100,000 ..579 + 57,9004 80,000 .482 + 38,5605 60,000 ..402 + 24,120
Net Present Value + 40
Project B IRR = 15%
Project C IRR = 24%
Where there are competing projects, the one with the highest IRR should be preferred
Disadvantages of IRR
The main disadvantage of IRR is that it does not address the objective of wealth maximisation. IRR will always see a return of 30% being preferable to 25% (assuming that the opportunity cost of finance is lower than this). However the ‘scale of investment’ has been ignored. For example £1m invested at 20% would make you richer than £0.5m invested at 25%. IRR does not recognise this.
It is preferable to use NPV which is always more reliable and encompassing than IRR.
38
Project A Project B Project CPP
ARR
NPV
IRR
Risk in Investment Appraisal
Given the nature of capital investments ie typically large outlay with long periods before returns materialise, if the underlying assumptions are wrong the effect can be damaging or even catastrophic. So how do you asses the risk involved and react if it does not go as planned?
In terms of assessing the level of risk, sensitivity analysis should be considered. This involves a re-assessment of the key assumptions affecting the project to quantify how the financial performance of the project would be affected by changes (up and down) in these key assumptions.
The process is to test each of the key assumptions to see how changes would impact on the project, eg. a 10% reduction in the projected cash inflows. Obviously, these assumptions are not all mutually exclusive and therefore computer modelling of ‘what if’ is recommended. But, at the end of the day it will be your judgement (including a view on the non-financial factors) that decides the level of risk.
Project Investment
Cash Inflows
Project Life
Interest CostsOperational Costs
Sales Prices and Margins
39
Risk Analysis
An important component of capital investment appraisal is risk analysis. But what is risk analysis?
Risk analysis is the process of defining and analysing the dangers to individuals and businesses posed by potential natural and human-caused adverse events. Another interpretation could be: the chance of exposure to the adverse consequences of future events …
The following diagram sets out the process:
1. As a team we need to identify what are the potential risks of the project investment
2. Assess and classify the risk3. Decide on how we are going to respond to that risk 4. Review progress and implement measures as and when necessary.
Now let’s put this into action.
Activity: Within your group, identify a potential capital investment programme.
1. Identify the potential risks
2. Assess the risk using the following classification in the probability/impact matrix below:
40
41
3. Assess how you are going to respond to each risk by selecting one of the responses below
Response What this means Examples
Avoidance Taking the risk out of the project altogether
Generally used on RED status risks
Reduce the scope of the project to remove the risky task from it
Buy in specialists to eliminate a skills gap
Supplement a team to eliminate a capacity issue
Cancel the project!Transference Transfer the risk to a 3rd party
outside the organisation Could apply to any High
Impact Risk regardless of RAG status
Insure against the risk, we do this without thinking on our premises burning down!
Use fixed price or shared risk contracts with 3rd parties where risk of overspend is identified (which in turn leads to other risks)
Mitigation Do something to reduce the probability or impact of the risk
Good for reducing Red to Amber or Amber to Green
Introduce QA and Testing procedures to deal with product quality risks (Reduces probability)
Develop change management processes to reduce risk of resistance to the project (Reduces probability)
Bring tasks that could cause delay forward in the project schedule (Reduces Impact)
Acceptance Accept the risk could happen and either ignore it or put a contingency plan in place for when it occurs
“Ignore” should only be used for Green status risks
“Contingency” best for Green status risks but can be acceptable for Amber. Most common use is low probability, high impact risks.
Invest in backup and recovery solutions as a contingency for an IT system failure
4. Complete the risk assessment template below
42
Risk No.
Description ofRisk
RiskCategory
Probability:H, M, L
Impact:H, M, L
Response
5.
43
Screening Other Criteria: The Criteria Matrix
Another method for screening decisions is the criteria matrix. An example of this is presented on the next page. In this scenario, the purchasing department of an organisation has decided to renew its fleet of 4 wheel drive vehicles. It has shortlisted 4 vehicles from the original list of ten:
Honda CR –V
Nissan X-Trail
Toyota Rava
Land Rove Freelander
The purchasing team have decided upon the criteria against which each vehicle will be screened, eg. price, miles per gallon (on an urban basis) and so on. Each criteria has been weighted with a score out of 10 (ie. the importance attached to that criterion).
The team will meet together to discuss the 4 options and rate them against the criteria. Ratings will, in this case, be out of 4 (4 being high). The reason for this maximum rating is because all the criteria are quantifiable so the vehicle will either be rated:
Highest = 4 down to
Lowest = 1
Scores will then be awarded by multiplying the weighting against the rating.
Activity: working in pairs, complete the matrix and discuss the results. A note of caution; be mindful that each criteria needs to be scored in its own right, eg.
Price: the lowest price should achieve the highest rating 4
MPG (urban): the highest MPG should achieve the highest rating 4
Cost per mile: the lowest cost should achieve the highest rating 4
Service intervals: the highest service interval should achieve the highest rating 4
0 to 60 mph: the quickest acceleration should achieve the highest rating 4. Sorry ... it’s a bit of a ‘sad’ criterion isn’t it! We haven’t included ‘style’ as a
44
criterion here for obvious reasons, although there would be nothing stopping you.
45
Criterion
Wei
ghtin
g (W
)
Hon
da C
R –
V
Rat
ing
(R)
Out
of 4
Sco
re (W
x R
)
Nis
san
X-Tr
ail
Rat
ing
(R)
Out
of 4
Sco
re (W
x R
)
Toyo
ta R
ava
Rat
ing
(R)
Out
of 4
Sco
re (W
x R
)
Land
Rov
er
Free
land
er
Rat
ing
(R)
Out
of 4
Sco
re (W
x R
)
Price 10 £20,150 £19,800 £19,600 £22,000
MPG (Urban)
8 35 32 29 28
Cost per mile
7 45.7p 44.4p 46.0p 43.8p
Service Intervals
5 12,500 12,000 10,000 15,000
0 to 60 Mph
3 10.5 secs.
12.4 secs.
12.6 secs.
15.2 secs.
TOTAL SCORES
Criteria Matrix – (for screening financial and non-financial options)
46
Management and Control of Investment Projects
We have focused on the appraisal methods used to evaluate projects, but this is only part of the story. The overall management of projects is also a key role and often overlooked, particularly in evaluating what happened compared with the original assumptions (the post-audit).
The project investment process can be described in 5 steps as follows:
Step 1
Funds available for projects will be conditioned by borrowing capability as well as internal funds available.
Step 2
How do you identify profitable project opportunities? The search process should enable and incentivise staff who have good ideas. This is often dismissed or overlooked. You also need to look outside the business at technological developments, customer needs, market conditions etc.
Step 3
The screening of proposals to ensure that they meet the predetermined project criteria is vital. Key questions that will need addressing are:
Does the project fit within overall objectives? How will it be funded? What other resources will be required and timescales? How long will the project last and what are its key stages? What is the expected pattern of cash flows? What are the ‘key sensitivities’ and what if..? What are the NPV and IRR of the project and how does this compare with other
opportunities available? What impact will inflation and taxation have on the project?
47
Step 4
Projects that don’t meet the agreed criteria should be rejected, but remember the non-financial aspects. Also take into account the exhausted project team, staff morale etc and ensure they understand/accept why the project was rejected.
Step 5
The oft forgotten step! Managers will need to actively project manage and review progress at regular intervals. Information will need to be generated that compares actual versus planned expectations and corrective action taken if required. A number of project management techniques exist to support this step.
An important part of this step is the ‘post –audit’
Capital investment decisions are made on the basis of estimates (income, expenditure, timing etc). But how accurate are these estimates? Key questions might be
What was the actual expenditure? When did the expenditure occur? Are current estimates of future expenditure still valid? What was the actual income? When was the income realised? Are estimates of future income realistic? Have the non-financial benefits been realised? What have we learnt from this project?
Summary
The choice of project will depend on the relative importance to the business of: Liquidity Profitability Cost of capital investment
The PP method will be important where the liquidity characteristics of a project need to be reconciled with the liquidity position of the business, and speedy cash inflows are the key requirement for the business. The ARR method will be used where the profitability of a project is important. The discounted cashflow method will be used where the true economic value of an investment is important.
All investment methods are based on forecast cashflows – the difficulty is forecasting accurately.
Remember also that the non-financial features of a project should be taken into account.
48