Embed Size (px)
Citation preview
© 2013 Kantar Retail Specific, Relevant, Actionable Insight / Worldclass Speakers / Kantar Retail / Thought Leadership Grounded In Fact
NACDS 2013 Annual Meeting
501 Boylston Street, Suite 6101, Boston, MA 02116 (617) 912- 2828 [email protected]
No part of this material may be reproduced or transmitted in any form or by any means, electronic or mechanical, including photography, recording, or any information storage and retrieval system now known or to be invented, without the express written permission of Kantar Retail. The printing of any copies for back up is also strictly prohibited. DisclaimersThe analyses and conclusions presented in this seminar represent the opinions of Kan-tar Retail. The views expressed do not necessarily reflect the views of the management of the retailer(s) under discussion. This seminar is not endorsed or otherwise supported by the management of any of the companies covered during the course of the workshop or within the following slides.
Copyright© 2013 Kantar Retail All Rights Reserved.
Ahold USA
Alliance Boots
The Bartell Drug Company
BJ's Wholesale Club, Inc.
CARE Pharmacies Cooperative, Inc.
Chain Drug Consortium, LLC
Costco Wholesale dba Costco Pharmacies
CVS Caremark Corporation
Dollar General Corp.
drugstore.com
Family Dollar Stores
Farmacia Guadalajara S.A. de C.V.
Farmatodo, C.A.
Fruth Pharmacy
Genoa Healthcare Holdings, LLC
Good Neighbor Pharmacy
H-E-B
Hannaford Bros., Co.
Health Mart
Hi-School Pharmacy Services LLC
Hy-Vee Inc.
Implozia Pharmacy Network
Kerr Drug, Inc.
Kinney Drugs, Inc.
Lewis Drugs, Inc.
London Drugs Limited
Medicine Shoppe International, Inc.
Meijer, Inc.
Navarro Discount Pharmacies
99 Cents Only StoresOMNICARE, INC.
Pharmaca Integrative Pharmacy
Rexall Pharma Plus
Rite Aid Corporation
Roundy’s Supermarkets, Inc.
Safeway Inc.
Sam’s Club
Sav-On Drugs
Schnuck Markets, Inc.
Sears Holdings Corporation
7-Eleven, Inc.
Shoppers Drug Mart Corporation
SUPERVALU INC.
Target
Thriftway/Zitomer Drug
Thrifty White Pharmacy
Topco Associates LLC
Ulta Beauty
Wakefern Food Corp./ShopRite
Wal-Mart Stores, Inc.
Walgreen Co.
Walgreens Boots Alliance Development GmbH
Wegmans Food Markets, Inc.
2013 Participating Retailers
source: NACDS
Retail Trends
Having a Successful ConferenceAttireAttire for all NACDS events is resort casual- except for the NACDS Luncheon, dinner, and entertainment. Attire for the NACDS lunch-eon on Monday is dressy daywear for ladies and business for men. Attire for the Board of Direc-tors reception and dinner on Tuesday is cocktail for ladies and business for men.
Saturday Must Attend Events • “Meet the Retailer” program • Strategic Exchange Appointments • Inaugural Attendees Orientation • Opening CelebrationSunday Must Attend Events • Business Program I • Strategic Exchange AppointmentsMonday Must Attend Events • NACDS Chain Members & PAC Breakfast (Chain members, PAC tickets holders, invited guests only) • Strategic Exchange Appointments • NACDS Luncheon (spouses/companions, a ticketed event)Tuesday Must Attend Events • Business Program II • Strategic Exchange Appointments • Board of Directors Reception & Dinner • Board of Directors Awards & Entertainment
Are you talking to your accounts about these? Do you have a strategy?�� Retailers are investing in store refurbishment, relocation, and acquisitions: Store portfolios- formats to
address multiple shoppers rather than one store answering all needs
�� Retailers are investing in multichannel: Apps, websites, QR codes, mobile
�� Heightened focus on merchandising tactics: Creating and having relevant assortments; designing stores for shoppers rather than operations- enhanced use of elements like lighting, shelving, signage; segmentation of stores, shoppers
�� Loyalty program developments to increase shopper engagement
�� Health and Wellness plays an important role throughout the merchandising and store development process: Assortment implications, opportunities, multichannel opportunies
source: NACDS

Having a Successful Conference�� Start early soliciting appointments – as much as three months in advance
�� Develop a convincing proposition for each company as to why they will benefit from a meeting with you
�� Establish an individually specific agenda for each meeting
�� Make sure you have done your homework on the retailer - Check out their website and learn as much as you can about them
�� Develop a “one pager” summarizing the important points about your company, your key products, your point of difference, and any performance matrices that set you apart from the competition
�� Consider dropping an advance thank you for a planned meeting to remind the person of the appointment or an after-meeting thank you to recap what was accomplished
�� Take notes and follow-up after the meeting – this may be your most critical success factor
source: NACDS source: NACDS

Participating Drug Retailers
Alliance BootsKey Initiatives�� In Aug 2012: Walgreens acquired 45% stake in Alliance Boots. Merger has created the largest global
pharmacy led H&B retailer as well as the largest pharmaceutical wholesaler
�� Targeted procurement synergies amounting to $1 billion by 2016 (up from $100-150 million in 2012)
�� Potential investments towards geo-expansion in continental Europe & emerging markets
�� Best practice sharing from Walgreens around managing large scale supply chain and pharmacy cost optimization
�� Expansion of its wholesale business through acquisitions in Europe and partnerships/joint ventures in Asia and Middle East
Key Players�� Stefano Pessina- Executive Chairman
�� Ornella Barra- Chief Executive, Pharmaceutical Wholesale Division
�� Alex Gourlay- Chief Executive, Health & Beauty Division
�� George Fairweather- Group Finance Director
�� Gregory Wasson- President and Chief Executive Officer, Walgreens
�� Robert Zimmerman- Senior Vice President & Chief Executive Officer, Walgreens
�� Wade Miquelon- Executive Vice President & Chief Financial Officer, Walgreens
Stengths�� Increased negotiating power (procurement
savings) as a result of the merger�� No.1 H&B retailer in the UK aided by: �� Pharmacy-led business- high margin, footfalls �� Multi-format footprint �� Strong brand perception – private label�� Synergies driven through wholesale and business manufacturing divisions- vertical integration�� Loyalty card (Advantage card)
Weaknesses�� Perceived as a costlier (premium priced) brand as
compared to Superdrug�� Over promotional–complicated/ complex �� Jaded marketing�� Store design – cramped
�� Weak online business
Opportunities�� Availability of more funds that can be channelled
towards international expansion�� Best practice sharing from Walgreens especially
around managing supply chain, big format stores, and pharmacy cost optimisation
�� Food business �� Services such as in-store surgeries�� Manufacturing exports to international retailers
(such as Target, Carrefour, etc.)
Threats�� Increasing competition from grocers within
beauty space�� Declining average revenue per prescription (due
to lower reimbursement prices on generic drugs) can erode growth & margin
�� Loyalty card challenged by the launch of Super drug ,Tesco, H&B range
�� Crowded UK market - Limited ability to expand core high margin pharmacy business due to legislative restrictions
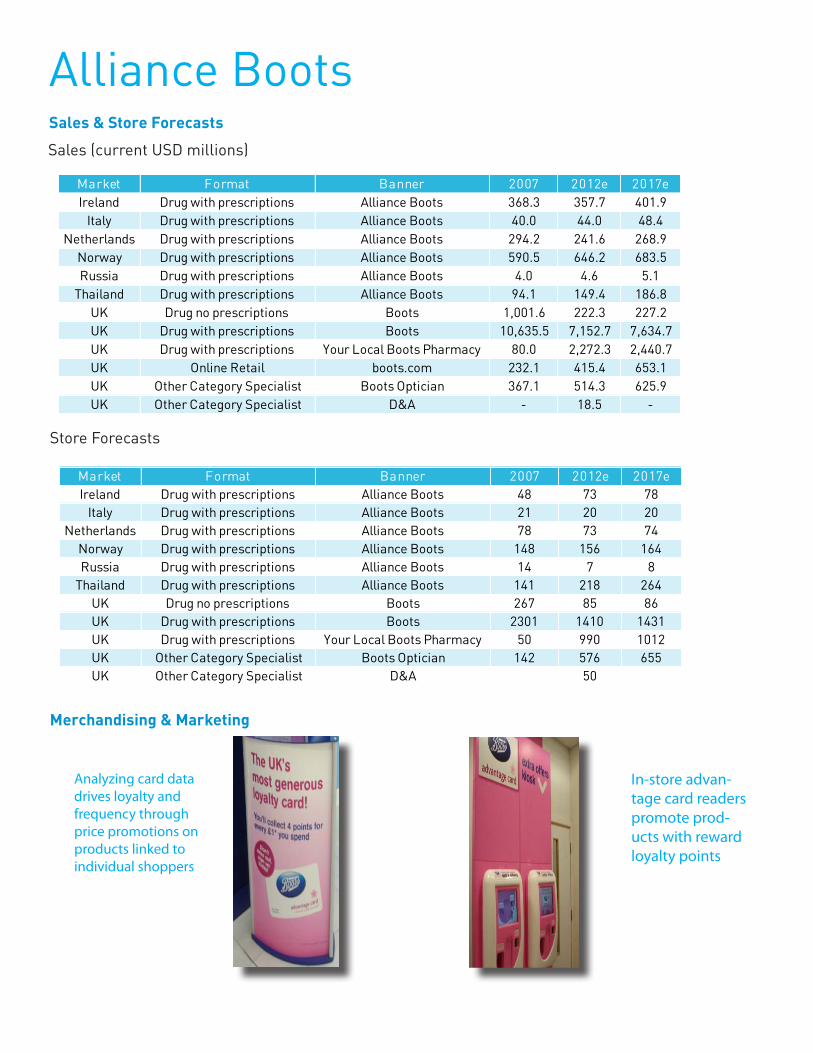
Alliance BootsSales & Store Forecasts
Sales (current USD millions)
Store Forecasts
Merchandising & Marketing
Analyzing card data drives loyalty and frequency through price promotions on products linked to individual shoppers
In-store advan-tage card readers promote prod-ucts with reward loyalty points
Market Format Banner 2007 2012e 2017eIreland Drug with prescriptions Alliance Boots 368.3 357.7 401.9
Italy Drug with prescriptions Alliance Boots 40.0 44.0 48.4 Netherlands Drug with prescriptions Alliance Boots 294.2 241.6 268.9
Norway Drug with prescriptions Alliance Boots 590.5 646.2 683.5 Russia Drug with prescriptions Alliance Boots 4.0 4.6 5.1
Thailand Drug with prescriptions Alliance Boots 94.1 149.4 186.8 UK Drug no prescriptions Boots 1,001.6 222.3 227.2 UK Drug with prescriptions Boots 10,635.5 7,152.7 7,634.7 UK Drug with prescriptions Your Local Boots Pharmacy 80.0 2,272.3 2,440.7 UK Online Retail boots.com 232.1 415.4 653.1 UK Other Category Specialist Boots Optician 367.1 514.3 625.9 UK Other Category Specialist D&A - 18.5 -
Market Format Banner 2007 2012e 2017eIreland Drug with prescriptions Alliance Boots 48 73 78
Italy Drug with prescriptions Alliance Boots 21 20 20Netherlands Drug with prescriptions Alliance Boots 78 73 74
Norway Drug with prescriptions Alliance Boots 148 156 164Russia Drug with prescriptions Alliance Boots 14 7 8
Thailand Drug with prescriptions Alliance Boots 141 218 264UK Drug no prescriptions Boots 267 85 86UK Drug with prescriptions Boots 2301 1410 1431UK Drug with prescriptions Your Local Boots Pharmacy 50 990 1012UK Other Category Specialist Boots Optician 142 576 655UK Other Category Specialist D&A 50
Bartell DrugsKey Initiatives�� New, customer-friendly website introduced
�� Convenient in-store health care awareness programs and services
�� State of the art in-store and online digital services
�� Commitment to community
�� Environmental leadership
Key Players�� George D. Bartell - Chairman and CEO
�� Jean Bartell Barber - Vice-Chairman and CFO
Retailer At-A-Glance�� Date Founded: 1890
�� Number of stores/Operating area: 58 stores located in Washington (King, Snohomish and Pierce counties)
�� Ownership: Privately owned & operated by the Bartell family of Seattle. George D. Bartell, Chairman and CEO; Jean Bartell Barber, Vice-Chairman and CFO.
�� Employees: 1,700 Employee Associates, all located in the Puget Sound region.
�� Notable: The company has only had three presidents, all members of the Bartell family, spanning three centuries of operation.
�� Website: Bartell Drugs introduced a completely redesigned website in January 2012. The easy-to-navigate site offers health & wellness resources, express prescription refills, digital photo orders, current sale and coupon offers, social media sharing and community involvement and store locator assistance.
Sales & Store Forecasts
Merchandising & Marketing
Sales in USD, millions 2007 2012E 2017E 07 - '12E
CAGR12E - '17E
CAGR
TOTAL USA 368 423.02 473.48 2.83% 2.28%
# of Stores 2007 2012E 2017E 07 - '12ECAGR
12E - '17E CAGR
TOTAL Bartell Drugs USA 56 58 61 0.70% 1.01%
CVSKey Initiatives�� Differentiating Front Store: Personalization featuring ExtraCare; myCVS store clustering; differentiating
private brands; converting existing customers
�� Driving Pharmacy Growth Through: WeCARE workflow and patient care excellence including pharmacist interventions to drive adherence and optimizing value of generics
�� Growing Store Base & Building Growth Culture: Expand footprint, stores own sales to shift accountability for sales to the stores
Key Players�� Larry Merlo- President and CEO, CVS Caremark
�� David M. Denton- Executive VP and CFO, CVS Caremark
�� Mark Cosby- Executive VP, CVS Caremark, President, CVS/Pharmacy
�� Per Lofberg- Executive VP, CVS Caremark, President, Caremark Pharmacy Services
�� Troyen Brennan, MD, MPH- Executive VP and Chief Medical Officer
Stengths�� ExtraCare loyalty card program �� Consumer-centric �� Open to new ideas and experimentation �� Format innovation �� Acquisition and integration are core capabilities �� Strong healthcare services portfolio: Caremark,
MinuteClinic�� Online services and offerings
Weaknesses�� Variance in store base �� Inconsistent execution �� Mindshare shift – Caremark �� Silo’d organization �� Less convenient real estate tha Walgreens�� High mix of sales from pharmacy �� Share losses at acquired
�� Debt leverage
Opportunities�� Increase use of loyalty card data �� Store clustering initiative �� Convenient health and beauty destination �� Leverage MinuteClinic �� Growth of Pharmacy Services Segment �� Increased market share gains from Express
Scripts/Walgreens dispute�� Healthcare reform�� Acquisition of Drogaria Onofre
Threats�� Direct competition with Walgreens�� Intensifying competitive pressure from alternative
pharmacy formats (mass, grocery) �� Growth of small box formats.�� Changing the fill-in, top-up trip and further
increase the need for differentiated destination branding
�� Regulatory and economic conditions
CVSSales & Store Forecasts
Retail Sales (USD Billions) 2007 2012E 2017E '07 - '12E CAGR
'12E - '17E CAGR
CVS 44.92 63.1 81.59 7.03% 5.27%Longs - 0.49 0.58 - 3.43%Pharmacare 0.14 0.21 0.39 8.45% 13.18%TOTAL DRUGSTORE 45.07 63.8 82.55 7.20% 5.29%cvs.com 0.16 0.35 0.79 16.95% 17.68%TOTAL CVS USA 45.23 64.14 83.35 7.24% 5.38%
Banner 2007 2012E 2017E '07 - '17E CAGR
'07 - '17E CAGR
CVS 6,245 7,435 8,122 3.5% 1.8%Longs - 50 55 - 1.9%Pharmacare 56 31 31 -11.2% 0.0%TOTAL US Stores 6,301 7,516 8,208 3.6% 1.8%
Merchandising, Marketing. & Kantar Retail ShopperScape® Data
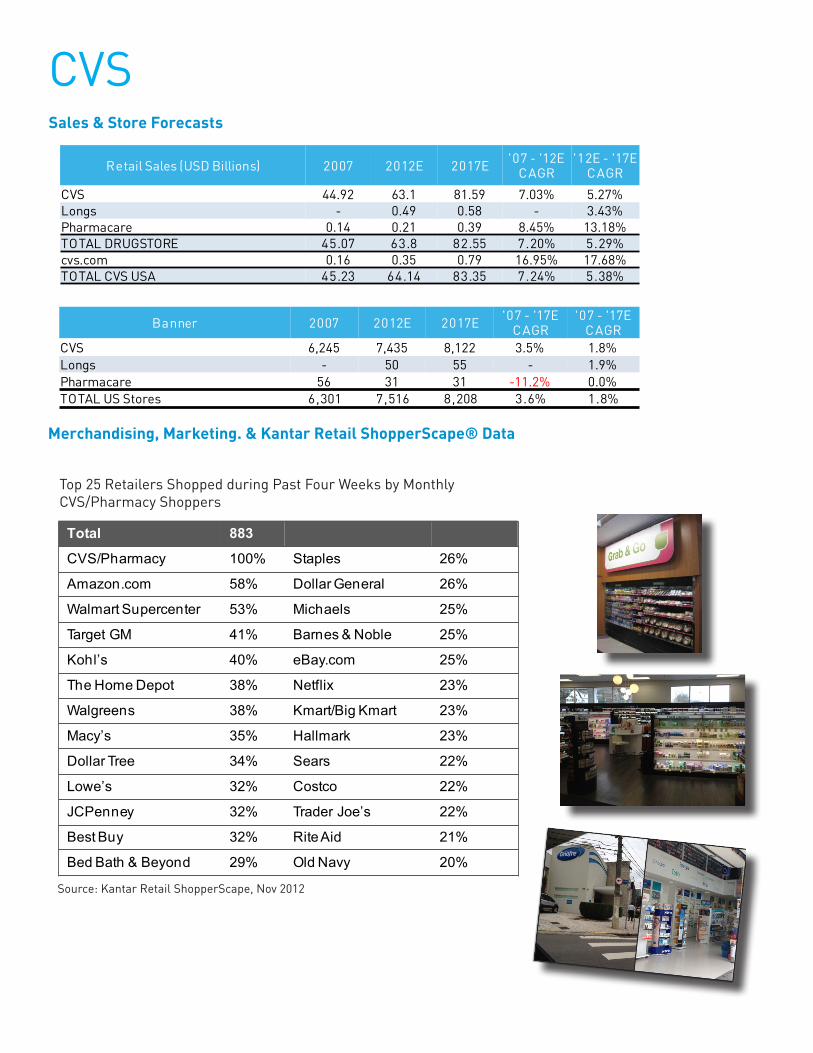
Total 883
CVS/Pharmacy 100% Staples 26%
Amazon.com 58% Dollar General 26%
Walmart Supercenter 53% Michaels 25%
Target GM 41% Barnes & Noble 25%
Kohl’s 40% eBay.com 25%
The Home Depot 38% Netflix 23%
Walgreens 38% Kmart/Big Kmart 23%
Macy’s 35% Hallmark 23%
Dollar Tree 34% Sears 22%
Lowe’s 32% Costco 22%
JCPenney 32% Trader Joe’s 22%
Best Buy 32% Rite Aid 21%
Bed Bath & Beyond 29% Old Navy 20%
Source: Kantar Retail ShopperScape, Nov 2012
Top 25 Retailers Shopped during Past Four Weeks by Monthly CVS/Pharmacy Shoppers
Kinney DrugsCorporate InfoKinney Drugs is a leading pharmacy across New York State and Vermont.
�� Kinney Drugs Value Card loyalty savings program
�� Kinney Cares prescription savings plan
Kinney Drugs is a leading pharmacy across New York State and Vermont.
�� Commitment to community
�� Environmental leadership
Sales in millions of US Dollar 2007 2012E 2017E 07 - '12E
CAGR12E - '17E
CAGR
Kinney 653.23 821.82 1,011.58 4.7% 4.2%
# of Stores 2007 2012E 2017E 07 - '12E CAGR
12E - '17E CAGR
Kinney 91 94 104 0.7% 2.0%
Kinney Drugs Value Card loyalty savings programKinney Cares prescription savings plan
Key Players�� Owen W. Halloran, R.Ph.- SVP of Pharmacy
Procurement�� Bridget-ann Hart, R.Ph.- President, Kinney
Healthcare Services�� Wayne C. Jone- VP of MIS�� Stephen P. McCoy- EVP, C.F.O�� David C. McClure- VP of Real Estate�� Craig Painter- C.E.O and Chairman of the Board�� David Warner- President of ProAct
�� James Spencer- COO Kinney Drug Store Division�� Michael Duteau, R.Ph.- VP of Pharmacy
Operations�� Jeffrey A. Rorick- VP Information Services, CIO�� John Dyer- General Manager Healthcare Services�� James R. Wuest- VP of Marketing�� Rich McNulty- VP of Human Resources�� Rick Cognetti, Jr.- VP of Marketing and
Merchandising�� Lew Kimball- VP of Corporate Asset Protection
Sales & Store Forecasts
Merchandising & Marketing
PharmacaKey Initiatives�� Prescription Services
�� Professional Staff
�� Professional Grade Supplements- i.e., Metagenics and Pure Encapsulation
�� Natural Beauty- i.e., high-quality brands available like Jurlique, Jane Iredale, Dr. Hauschka and many other Compact for Safe Cosmetics signers
�� Over-the-Counter MedicationsSustainable Philosophy- We believe that personal health is connected to environmental health. We ensure our stores are environmentally friendly by buying wind power offsets, installing recycled carpet and offering organic and sustainably harvested products.
Key Players�� Mark Panzer- President and Chief Executive Officer
�� Michael Kruteck- Chief Financial Officer
�� Laura Coblentz- Vice President of Marketing and Innovation
�� Stu Gratz- Vice President of Pharmacy Operations
�� David Janowicz- Vice President of Merchandising
�� Don Summerfield- Vice President of Integrative Medicine
�� Allison Janda- Vice President of Retail Store Operations
Sales & Store Forecasts
Sales in millions of US Dollar 2007 2012E 2017E '07 - '12E
CAGR'12E - '17E
CAGR
Pharmaca 72.08 104.59 132.62 7.7% 4.9%
TOTAL USA 72.08 104.59 132.62 7.7% 4.9%
# of Stores 2007 2012E 2017E 07 - '12E CAGR
12E - '17E CAGR
Pharmaca 22 24 28 1.8% 3.1%TOTAL USA 22 24 28 1.8% 3.1%
Merchandising & Marketing

RexallKey InitiativesRexall is the flagship chain of Katz Group Pharmacies in Canada:
�� In 2012, Katz sold its Drug Trading Company and Medicine Shoppe Canada
�� Management’s aim is to focus growth on corporately owned Rexall and Pharma Plus
Specifically, Rexall is:
�� Advancing patient care services
�� Elevating its store experience through store design
�� Expanding real estate reach via acquisitions of smaller, independent pharmacies
�� Expanding its private label offering
�� Developing its online presence
Key Players�� Daryl A. Katz- Chairman and Chief Executive of Katz Group Pharmacies
�� Frank Scorpiniti- Chief Executive Officer at Katz Group Canada / Rexall
�� Sharon Driscoll- Chief Financial Officer
�� Ken Keelor- Chief Merchandising Officer
Stengths�� Experience in the market�� Mail-order pharmacy- Rexall Direct�� Katz’s ProPharm�� Trusted, community-oriented provider�� Rexall private label
Weaknesses�� Varied store conditions�� Over-indexing on elderly shoppers �� Over-reliance on the pharmacy first proposition �� Under-development of higher margin and trip
driving categories (beauty, food)�� Lacking loyalty card, underdeveloped customer
data program
Opportunities�� Expand private label�� Further expand health services, role of the
pharmacist�� Real estate acquisitions – broaden domestic
presence�� eCommerce�� Advance customer insights�� Serving aging Boomers
Threats�� Regulation – margin pressure�� Increased competition from outside of channel
(e.g., Walmart, Loblaw, Target)�� Loss of relevance with younger shoppers
RexallSales & Store Forecasts
2007 2012E 2017E (2007 - 2012E)
(2012E- 2017E)
North America\Canada Katz Group (The) Drug Trading $1.65 n/a n/a
North America\Canada Katz Group (The) Medicine Shoppe $0.12 n/a n/a
North America\Canada Katz Group (The) Pharmx Rexall $2.06 $2.97 $3.81 7.6% 5.1%
Continent\Country Retailer BannerSales (CND Billions) CAGR
2007 2012E 2017E(2007 - 2012E)
(2012E- 2017E)
North America\Canada Katz Group (The) Drug Trading 645 - - n/a n/a
North America\Canada Katz Group (The) Medicine Shoppe 128 - - n/a n/a
North America\Canada Katz Group (The) Pharmx Rexall 670 900 1000 6.1% 2.1%
Continent\Country Retailer BannerStores CAGR
Store counts
Sales (CND)
Merchandising, Marketing. & Kantar Retail ShopperScape® Data
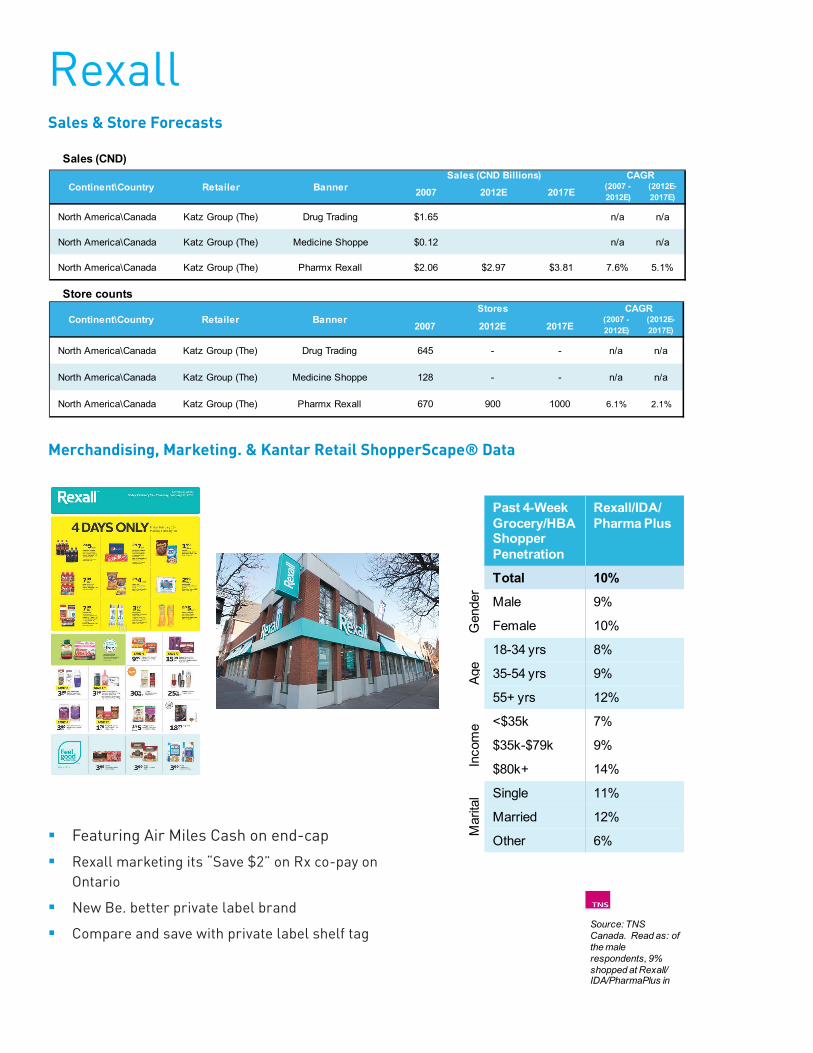
Source: TNS Canada. Read as: of the male respondents, 9% shopped at Rexall/ IDA/PharmaPlus in the past 4 weeks
Past 4-Week Grocery/HBAShopper Penetration
Rexall/IDA/Pharma Plus
Gen
der
Total 10%
Male 9%
Female 10%
Age
18-34 yrs 8%
35-54 yrs 9%
55+ yrs 12%
Inco
me <$35k 7%
$35k-$79k 9%
$80k+ 14%
Mar
ital
Stat
us
Single 11%
Married 12%
Other 6%�� Featuring Air Miles Cash on end-cap
�� Rexall marketing its “Save $2” on Rx co-pay on Ontario
�� New Be. better private label brand
�� Compare and save with private label shelf tag
Rite AidKey Initiatives�� Growth of Wellness+
�� Investing in best-performing stores
�� Continuing to find inefficiencies
�� Expanding health care offering
�� Improve customer service
Key Players�� John T. Standley- Chairman, President and CEO
�� Ken Martindale- Senior EVP & COO
�� Frank Vitrano- Senior EVP, CFO & CAO
�� Tony Montini- EVP, Merchandising
�� Robert I. Thompson- EVP, Pharmacy
�� Robert (Bob) K. Thompson- EVP, Store Operations
�� Christopher Hall- SVP, Pharmacy Services
�� Susan Henderson- SVP & Chief Communications Officer
�� David Kelly- SVP, Store Development
�� John Learish- SVP, Marketing
�� Wilson A Lester, Jr- SVP, Supply Chain
�� Daniel Miller- SVP, Pharmacy Operations
�� Jon Olson- SVP, Merchandising
�� Bill Bergin- Group Vice President, Category Management
�� Ernie Richardsen- Group Vice President, Pharmaceutical Purchasing and Clinical Services
Stengths�� Number three chain, leading East Coast presence �� Seasoned mgmt team�� Relationships with customers, Rx focus �� Health condition marketing platforms �� Collaborative vendor relationships �� Strategic partnerships with GNC, McKesson,
Lindora etc. �� Wellness store format
�� Wellness+ Loyalty program
Weaknesses�� Less convenient real-estate�� Lack #1 or #2 share in many markets�� Sales productivity (FE & Rx)�� Weaker credit profile �� Inconsistent operational execution�� Underdeveloped healthcare strategy, pricing and
promotional strategy
Opportunities�� Up-side opportunity to close sales and
profitability gap with peers �� Market share gains from the Express Scripts/
Walgreens split�� Mix of male and ethnic shoppers�� Wellness+ Loyalty Program�� Retain shoppers gained during the Walgreens/
Express Script dispute�� Wellness store remodels�� Mobile and Ecommerce expansion
Threats�� Exposure to economic, industry and competitive
pressures �� Pressure on Rx margins�� More direct and intense competition�� Failure to grow store base �� Staffing – both front-end and pharmacy �� Failure to meet customer expectations�� Low Rx volumes (further erosion)
Rite AidSales & Store Forecasts
Sales in billions of US Dollar 2007 2012E 2017E '07 - '12E
CAGR'12E - '17E
CAGRRite Aid 26.44 25.18 26.4 -0.97% 0.95%
TOTAL USA 26.44 25.18 26.4 -0.97% 0.95%
# of Stores 2007 2012E 2017E '07 - '12E CAGR
'12E - '17E CAGR
Rite Aid 5,059 4,609 4,525 -1.85% -0.37%
TOTAL USA 5,059 4,609 4,525 -1.85% -0.37%
Merchandising, Marketing. & Kantar Retail ShopperScape® Data
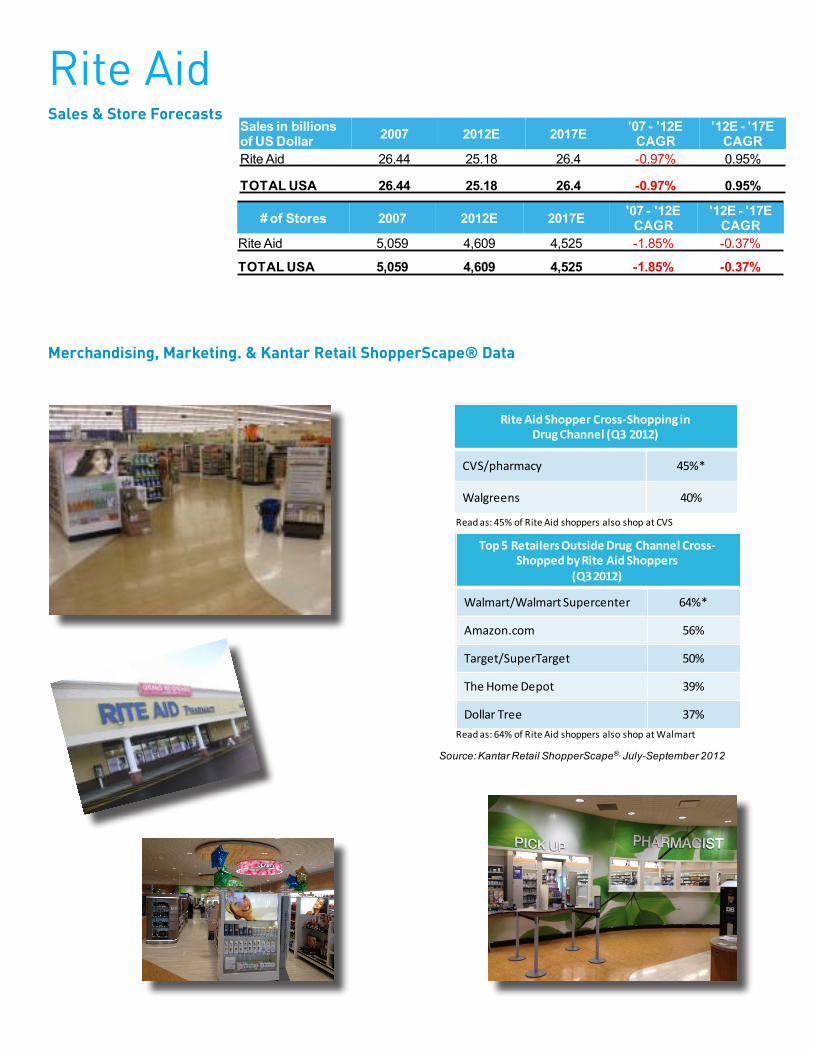
Rite Aid Shopper Cross-Shopping in Drug Channel (Q3 2012)
CVS/pharmacy 45%*
Walgreens 40%
Read as: 45% of Rite Aid shoppers also shop at CVS
Top 5 Retailers Outside Drug Channel Cross-Shopped by Rite Aid Shoppers
(Q3 2012)
Walmart/Walmart Supercenter 64%*
Amazon.com 56%
Target/SuperTarget 50%
The Home Depot 39%
Dollar Tree 37%
Read as: 64% of Rite Aid shoppers also shop at Walmart
Source: Kantar Retail ShopperScape®, July-September 2012
Shoppers Drug Mart
Key Players�� Domenic Pilla- President & Chief Executive Officer
�� Paul Damiani- Executive Vice-President, Operations
�� Dorian Lo- Executive Vice-President, Pharmacy and Healthcare
�� Bradley Lukow- Executive Vice-President & Chief Financial Officer
�� Michael Motz- Chief Merchandising Officer
�� Mary-Alice VuicicChief Administrative Officer & Executive Vice-President, Human Resources
�� Frank Pedinelli- Senior Vice-President, Legal Affairs & General Counsel
Stengths�� Strong brand, loyal shopper base�� Broad store presence, convenience trip�� Private label strength�� Optimum loyalty card program�� Authority in high-end beauty, wellness�� Merchandising, in-store aesthetics
Weaknesses�� Value perception on consumables�� Supply chain and backroom problems on high
velocity SKUs, out-of-stocks�� High mix of sales from pharmacy�� Inconsistent store execution
Opportunities�� Geographic store growth (i.e. QC, BC)�� Within channel competitors struggling –
acquisition opportunity�� Further diversify formats – Simply Pharmacy,
Home Health Care, etc.�� Expand services – financial products, the role of
the Pharmacist�� Serving the aging population�� Ecommerce development, particularly for beauty
Threats�� Reliance on Pharmacist operators in franchise
model may limit flexibility�� Rising competition (i.e., Walmart, Loblaw, Target)�� Added margin pressure from government
regulations, drug reform�� Over-indexing on private label vs. national brands
at the expense of the basket, trip�� Economic uncertainty, cautious consumers
Key Initiatives�� Front End
�� Beauty
�� Category Mgmt
�� Promotion Optimization / Optimum
�� New Services
�� Pharmacy
�� Seniors
�� Consolidation/Expansions
�� Long-term care/Specialty
�� Services- Scope of practice
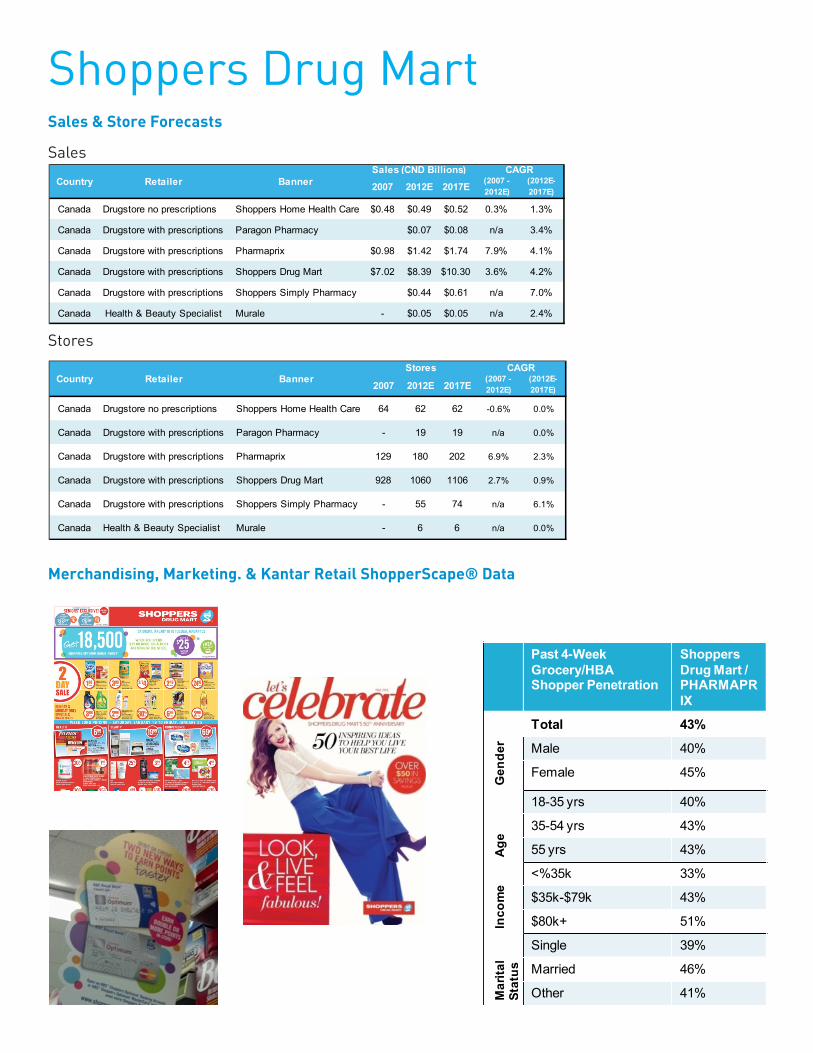
Shoppers Drug MartSales & Store Forecasts
Merchandising, Marketing. & Kantar Retail ShopperScape® Data
Sales
2007 2012E 2017E (2007 - 2012E)
(2012E- 2017E)
Canada Drugstore no prescriptions Shoppers Home Health Care $0.48 $0.49 $0.52 0.3% 1.3%
Canada Drugstore with prescriptions Paragon Pharmacy $0.07 $0.08 n/a 3.4%
Canada Drugstore with prescriptions Pharmaprix $0.98 $1.42 $1.74 7.9% 4.1%
Canada Drugstore with prescriptions Shoppers Drug Mart $7.02 $8.39 $10.30 3.6% 4.2%
Canada Drugstore with prescriptions Shoppers Simply Pharmacy $0.44 $0.61 n/a 7.0%
Canada Health & Beauty Specialist Murale - $0.05 $0.05 n/a 2.4%
Country Retailer BannerSales (CND Billions) CAGR
Stores
2007 2012E 2017E(2007 - 2012E)
(2012E- 2017E)
Canada Drugstore no prescriptions Shoppers Home Health Care 64 62 62 -0.6% 0.0%
Canada Drugstore with prescriptions Paragon Pharmacy - 19 19 n/a 0.0%
Canada Drugstore with prescriptions Pharmaprix 129 180 202 6.9% 2.3%
Canada Drugstore with prescriptions Shoppers Drug Mart 928 1060 1106 2.7% 0.9%
Canada Drugstore with prescriptions Shoppers Simply Pharmacy - 55 74 n/a 6.1%
Canada Health & Beauty Specialist Murale - 6 6 n/a 0.0%
Country Retailer BannerStores CAGR
Past 4-WeekGrocery/HBAShopper Penetration
ShoppersDrug Mart / PHARMAPRIX
Total 43%
Gen
der Male 40%
Female 45%
Age
18-35 yrs 40%
35-54 yrs 43%
55 yrs 43%
Inco
me
<%35k 33%
$35k-$79k 43%
$80k+ 51%
Mar
ital
Stat
us
Single 39%
Married 46%
Other 41%
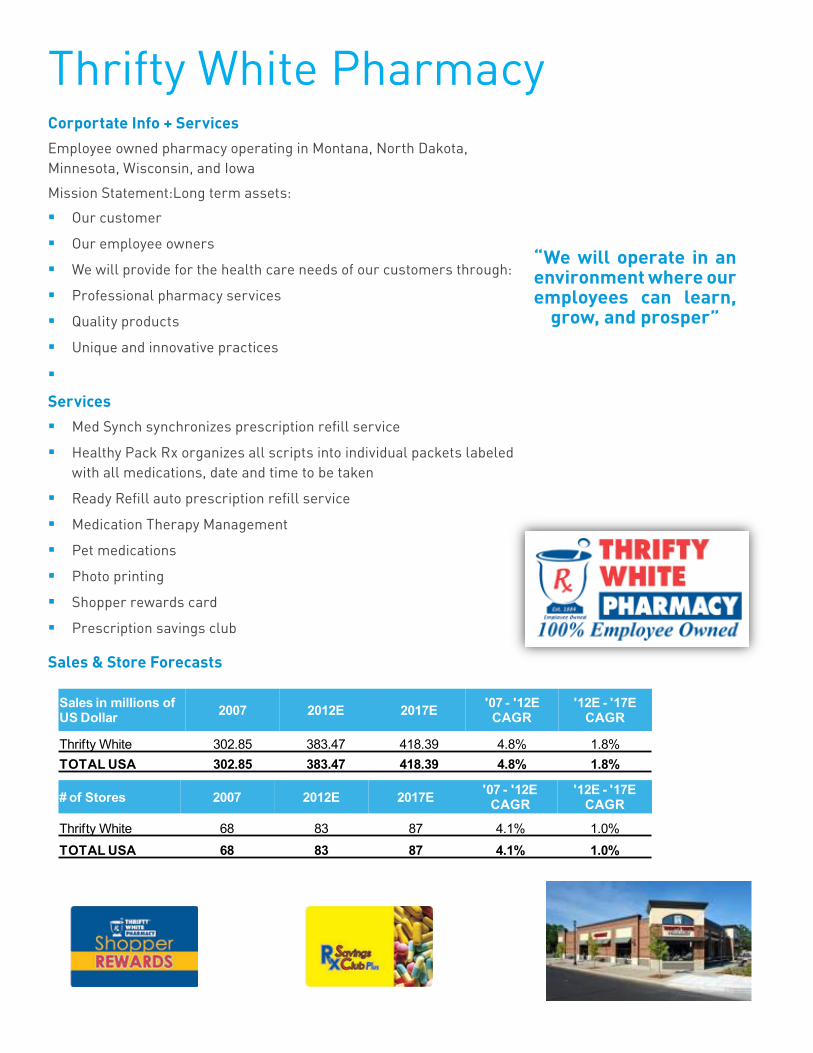
Thrifty White PharmacyCorportate Info + ServicesEmployee owned pharmacy operating in Montana, North Dakota, Minnesota, Wisconsin, and Iowa
Mission Statement:Long term assets:
�� Our customer
�� Our employee owners
�� We will provide for the health care needs of our customers through:
�� Professional pharmacy services
�� Quality products
�� Unique and innovative practices
��
Services�� Med Synch synchronizes prescription refill service
�� Healthy Pack Rx organizes all scripts into individual packets labeled with all medications, date and time to be taken
�� Ready Refill auto prescription refill service
�� Medication Therapy Management
�� Pet medications
�� Photo printing
�� Shopper rewards card
�� Prescription savings club
“We will operate in an environment where our employees can learn,
grow, and prosper”
Sales & Store Forecasts
Sales in millions of US Dollar 2007 2012E 2017E '07 - '12E
CAGR'12E - '17E
CAGR
Thrifty White 302.85 383.47 418.39 4.8% 1.8%TOTAL USA 302.85 383.47 418.39 4.8% 1.8%
# of Stores 2007 2012E 2017E '07 - '12E CAGR
'12E - '17E CAGR
Thrifty White 68 83 87 4.1% 1.0%TOTAL USA 68 83 87 4.1% 1.0%
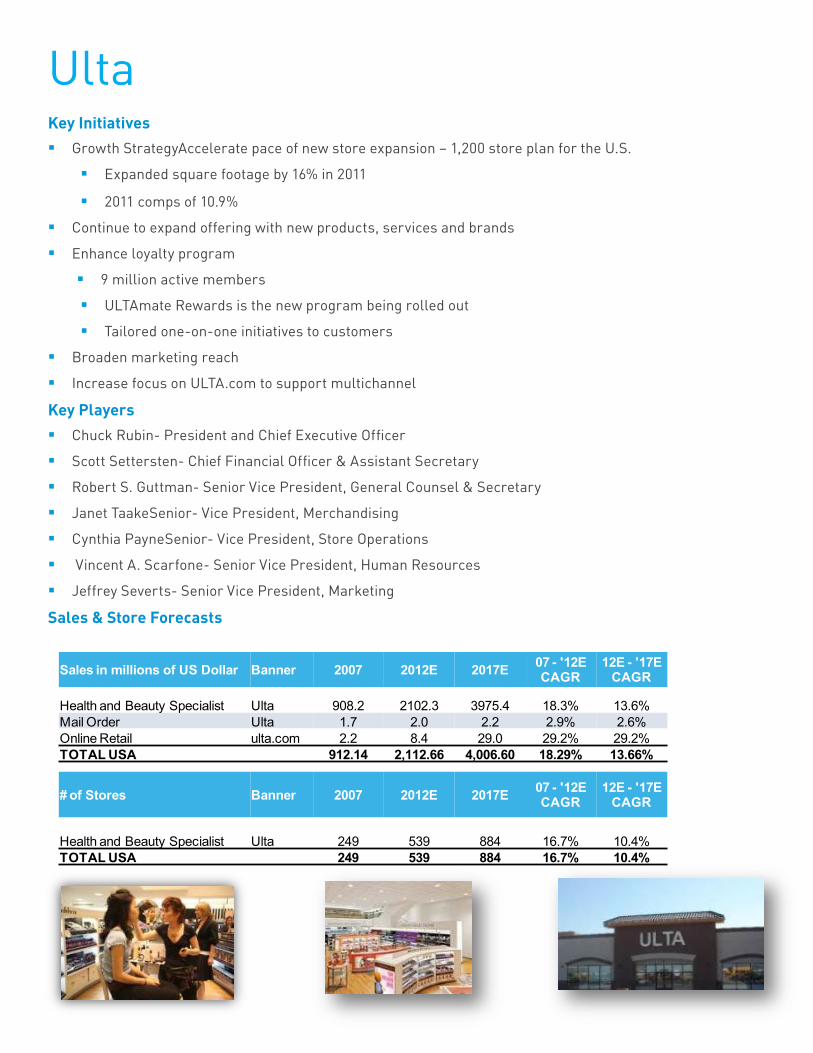
UltaKey Initiatives�� Growth StrategyAccelerate pace of new store expansion – 1,200 store plan for the U.S.
�� Expanded square footage by 16% in 2011
�� 2011 comps of 10.9%
�� Continue to expand offering with new products, services and brands
�� Enhance loyalty program
�� 9 million active members
�� ULTAmate Rewards is the new program being rolled out
�� Tailored one-on-one initiatives to customers
�� Broaden marketing reach
�� Increase focus on ULTA.com to support multichannel
Key Players�� Chuck Rubin- President and Chief Executive Officer
�� Scott Settersten- Chief Financial Officer & Assistant Secretary
�� Robert S. Guttman- Senior Vice President, General Counsel & Secretary
�� Janet TaakeSenior- Vice President, Merchandising
�� Cynthia PayneSenior- Vice President, Store Operations
�� Vincent A. Scarfone- Senior Vice President, Human Resources
�� Jeffrey Severts- Senior Vice President, Marketing
Sales & Store Forecasts
Sales in millions of US Dollar Banner 2007 2012E 2017E 07 - '12E CAGR
12E - '17E CAGR
Health and Beauty Specialist Ulta 908.2 2102.3 3975.4 18.3% 13.6%Mail Order Ulta 1.7 2.0 2.2 2.9% 2.6%Online Retail ulta.com 2.2 8.4 29.0 29.2% 29.2%TOTAL USA 912.14 2,112.66 4,006.60 18.29% 13.66%
# of Stores Banner 2007 2012E 2017E 07 - '12E CAGR
12E - '17E CAGR
Health and Beauty Specialist Ulta 249 539 884 16.7% 10.4%TOTAL USA 249 539 884 16.7% 10.4%
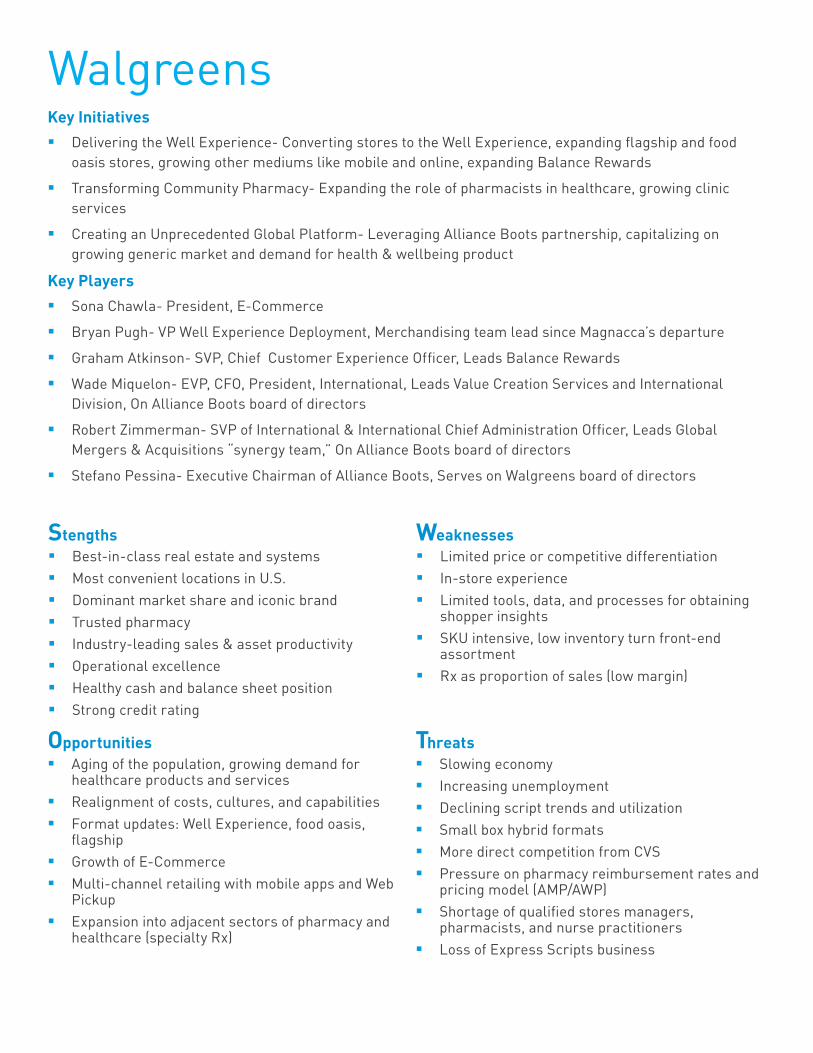
WalgreensKey Initiatives�� Delivering the Well Experience- Converting stores to the Well Experience, expanding flagship and food
oasis stores, growing other mediums like mobile and online, expanding Balance Rewards
�� Transforming Community Pharmacy- Expanding the role of pharmacists in healthcare, growing clinic services
�� Creating an Unprecedented Global Platform- Leveraging Alliance Boots partnership, capitalizing on growing generic market and demand for health & wellbeing product
Key Players�� Sona Chawla- President, E-Commerce
�� Bryan Pugh- VP Well Experience Deployment, Merchandising team lead since Magnacca’s departure
�� Graham Atkinson- SVP, Chief Customer Experience Officer, Leads Balance Rewards
�� Wade Miquelon- EVP, CFO, President, International, Leads Value Creation Services and International Division, On Alliance Boots board of directors
�� Robert Zimmerman- SVP of International & International Chief Administration Officer, Leads Global Mergers & Acquisitions “synergy team,” On Alliance Boots board of directors
�� Stefano Pessina- Executive Chairman of Alliance Boots, Serves on Walgreens board of directors
Stengths�� Best-in-class real estate and systems �� Most convenient locations in U.S.�� Dominant market share and iconic brand�� Trusted pharmacy�� Industry-leading sales & asset productivity �� Operational excellence �� Healthy cash and balance sheet position�� Strong credit rating
Weaknesses�� Limited price or competitive differentiation �� In-store experience�� Limited tools, data, and processes for obtaining
shopper insights �� SKU intensive, low inventory turn front-end
assortment�� Rx as proportion of sales (low margin)
Opportunities�� Aging of the population, growing demand for
healthcare products and services �� Realignment of costs, cultures, and capabilities�� Format updates: Well Experience, food oasis,
flagship�� Growth of E-Commerce �� Multi-channel retailing with mobile apps and Web
Pickup �� Expansion into adjacent sectors of pharmacy and
healthcare (specialty Rx)
Threats�� Slowing economy �� Increasing unemployment �� Declining script trends and utilization �� Small box hybrid formats �� More direct competition from CVS �� Pressure on pharmacy reimbursement rates and
pricing model (AMP/AWP) �� Shortage of qualified stores managers,
pharmacists, and nurse practitioners�� Loss of Express Scripts business
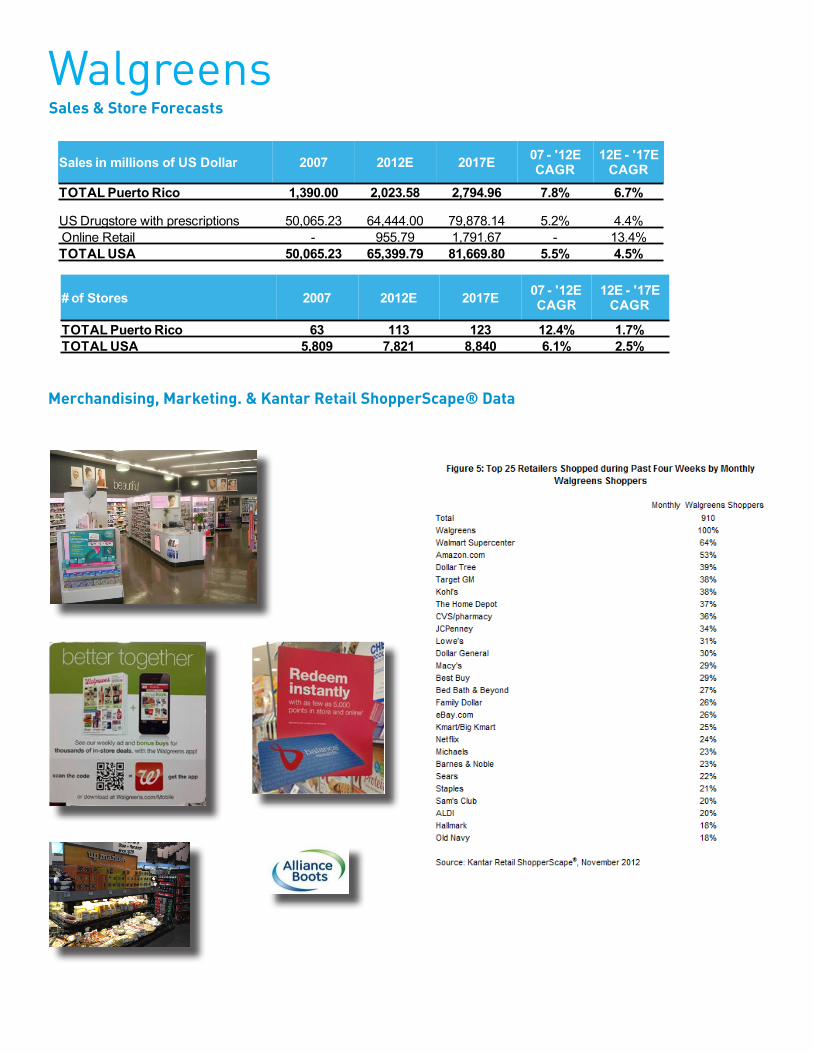
WalgreensSales & Store Forecasts
Sales in millions of US Dollar 2007 2012E 2017E 07 - '12E CAGR
12E - '17E CAGR
TOTAL Puerto Rico 1,390.00 2,023.58 2,794.96 7.8% 6.7%
US Drugstore with prescriptions 50,065.23 64,444.00 79,878.14 5.2% 4.4%Online Retail - 955.79 1,791.67 - 13.4%TOTAL USA 50,065.23 65,399.79 81,669.80 5.5% 4.5%
# of Stores 2007 2012E 2017E 07 - '12E CAGR
12E - '17ECAGR
TOTAL Puerto Rico 63 113 123 12.4% 1.7%TOTAL USA 5,809 7,821 8,840 6.1% 2.5%
Merchandising, Marketing. & Kantar Retail ShopperScape® Data

Participating Grocery Retailers
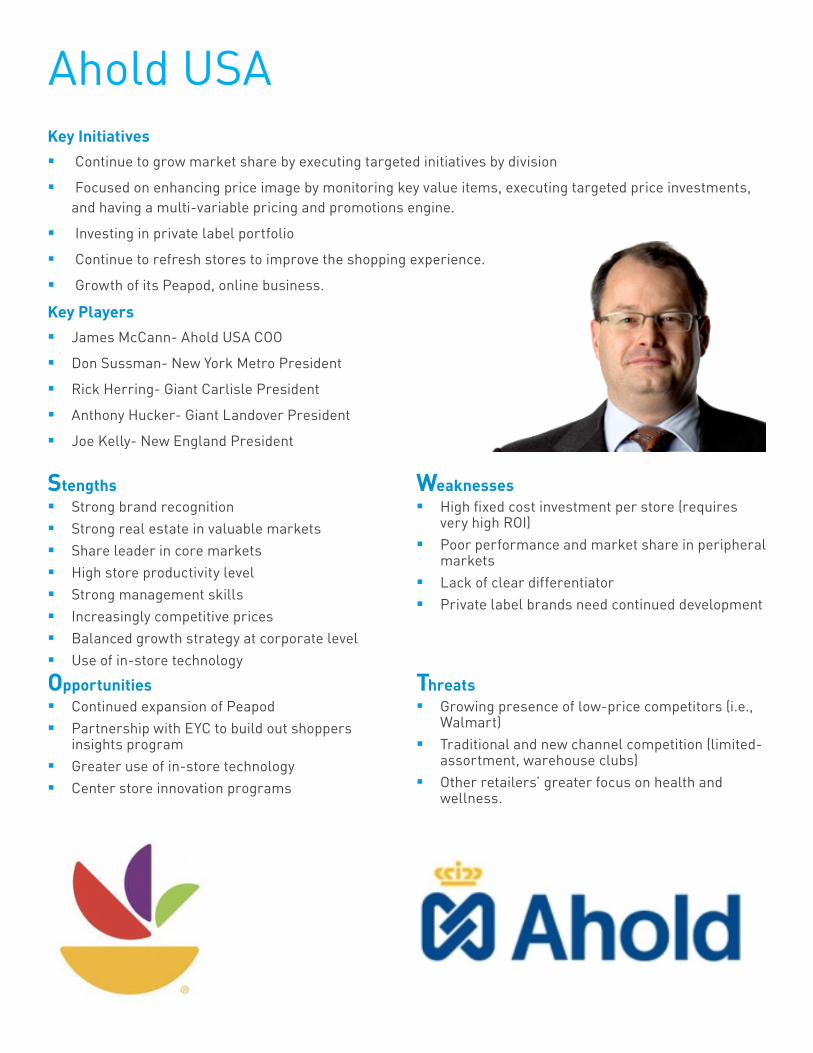
Key Initiatives�� Continue to grow market share by executing targeted initiatives by division
�� Focused on enhancing price image by monitoring key value items, executing targeted price investments, and having a multi-variable pricing and promotions engine.
�� Investing in private label portfolio
�� Continue to refresh stores to improve the shopping experience.
�� Growth of its Peapod, online business.
Key Players�� James McCann- Ahold USA COO
�� Don Sussman- New York Metro President
�� Rick Herring- Giant Carlisle President
�� Anthony Hucker- Giant Landover President
�� Joe Kelly- New England President
Ahold USA
Stengths�� Strong brand recognition �� Strong real estate in valuable markets �� Share leader in core markets�� High store productivity level �� Strong management skills �� Increasingly competitive prices �� Balanced growth strategy at corporate level�� Use of in-store technology
Weaknesses�� High fixed cost investment per store (requires
very high ROI) �� Poor performance and market share in peripheral
markets �� Lack of clear differentiator�� Private label brands need continued development
Opportunities�� Continued expansion of Peapod�� Partnership with EYC to build out shoppers
insights program�� Greater use of in-store technology �� Center store innovation programs
Threats�� Growing presence of low-price competitors (i.e.,
Walmart)�� Traditional and new channel competition (limited-
assortment, warehouse clubs)�� Other retailers’ greater focus on health and
wellness.
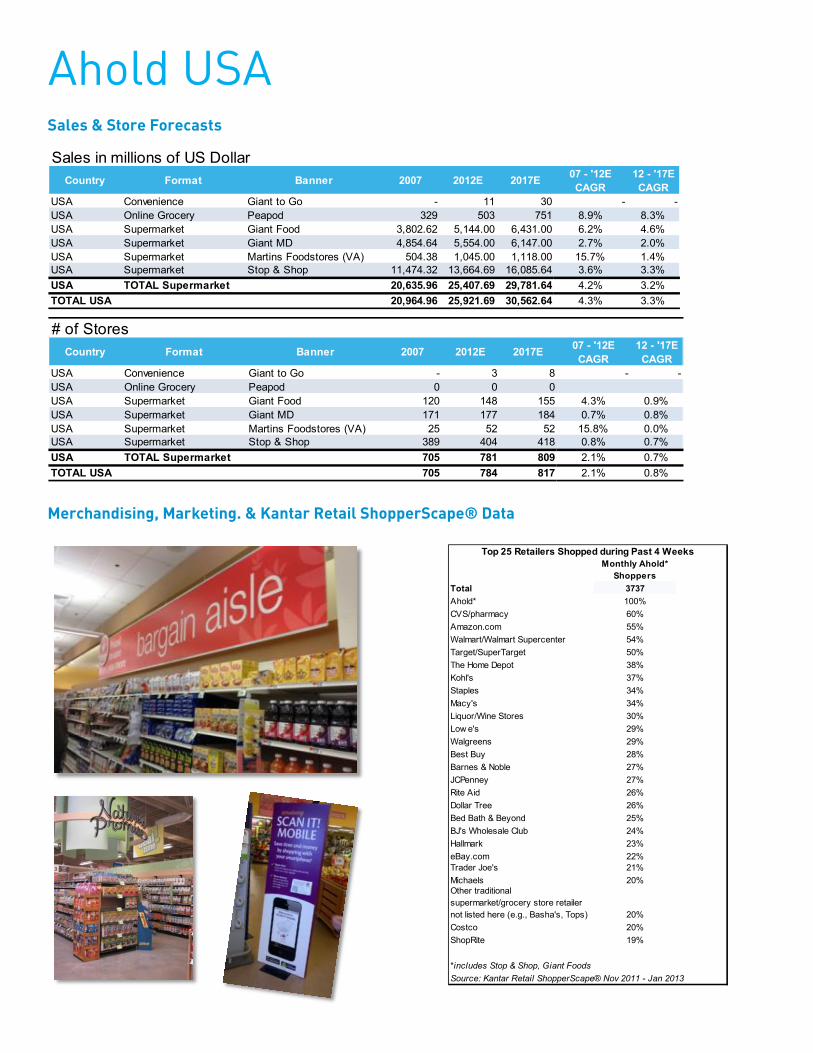
Ahold USASales & Store Forecasts
Country Format Banner 2007 2012E 2017E 07 - '12E CAGR
12 - '17E CAGR
USA Convenience Giant to Go - 11 30 - -USA Online Grocery Peapod 329 503 751 8.9% 8.3%USA Supermarket Giant Food 3,802.62 5,144.00 6,431.00 6.2% 4.6%USA Supermarket Giant MD 4,854.64 5,554.00 6,147.00 2.7% 2.0%USA Supermarket Martins Foodstores (VA) 504.38 1,045.00 1,118.00 15.7% 1.4%USA Supermarket Stop & Shop 11,474.32 13,664.69 16,085.64 3.6% 3.3%USA TOTAL Supermarket 20,635.96 25,407.69 29,781.64 4.2% 3.2%TOTAL USA 20,964.96 25,921.69 30,562.64 4.3% 3.3%
Sales in millions of US Dollar
Country Format Banner 2007 2012E 2017E 07 - '12E CAGR
12 - '17E CAGR
USA Convenience Giant to Go - 3 8 - -USA Online Grocery Peapod 0 0 0USA Supermarket Giant Food 120 148 155 4.3% 0.9%USA Supermarket Giant MD 171 177 184 0.7% 0.8%USA Supermarket Martins Foodstores (VA) 25 52 52 15.8% 0.0%USA Supermarket Stop & Shop 389 404 418 0.8% 0.7%USA TOTAL Supermarket 705 781 809 2.1% 0.7%TOTAL USA 705 784 817 2.1% 0.8%
# of Stores
Merchandising, Marketing. & Kantar Retail ShopperScape® Data
Monthly Ahold* Shoppers
Total 3737Ahold* 100%CVS/pharmacy 60%Amazon.com 55%Walmart/Walmart Supercenter 54%Target/SuperTarget 50%The Home Depot 38%Kohl's 37%Staples 34%Macy's 34%Liquor/Wine Stores 30%Low e's 29%Walgreens 29%Best Buy 28%Barnes & Noble 27%JCPenney 27%Rite Aid 26%Dollar Tree 26%Bed Bath & Beyond 25%BJ's Wholesale Club 24%Hallmark 23%eBay.com 22%Trader Joe's 21%Michaels 20%Other traditional supermarket/grocery store retailer not listed here (e.g., Basha's, Tops) 20%Costco 20%ShopRite 19%
*includes Stop & Shop, Giant FoodsSource: Kantar Retail ShopperScape® Nov 2011 - Jan 2013
Top 25 Retailers Shopped during Past 4 Weeks
HEBKey Initiatives�� Develop sophisticated marketing capabilities and a clearly defined brand.
�� Capitalizing on emerging health & wellness trends within the grocery channel.
�� Continue to push its value position through its “Compare our Prices to Anyone” campaign.
�� Relying more on customer loyalty in the face of increased competition. Focusing on tailoring stores and product assortment by market.
Key Players�� Charles Butt- CEO
�� Martin Otto- CFO
�� Craig Boyan- President & COO
�� Scott McClelland- President, Houston/Central Market Division
�� Suzanne Wade- President, San Antonio Food & Drug Division
Stengths�� Strong market share in Texas�� Market expertise�� Strong customer loyalty/brand recognition�� Strong presence in Hispanic segment�� International presence (stores in Mexico)�� Privately owned�� Willingness to experiment with new formats�� Culture of innovation
Weaknesses�� Consumer insight strategy under-developed at
operational levels�� Capital constrained (not public)�� Less transparency of company’s performance
and operations�� Most stores in Texas– risk not spread out if Texas
faces downturn
Opportunities�� Format expansion (Central Market, Plus!, Joe V)�� Increased penetration of Mexican market�� Additional expansion within Texas�� Increasing price optimization capabilities
Threats�� High levels of competition from highly skilled
retailers�� Challenged to move from ethnic expertise to local
expertise (e.g., in Mexico)
HEBSales & Store Forecasts
Merchandising, Marketing. & Kantar Retail ShopperScape® Data
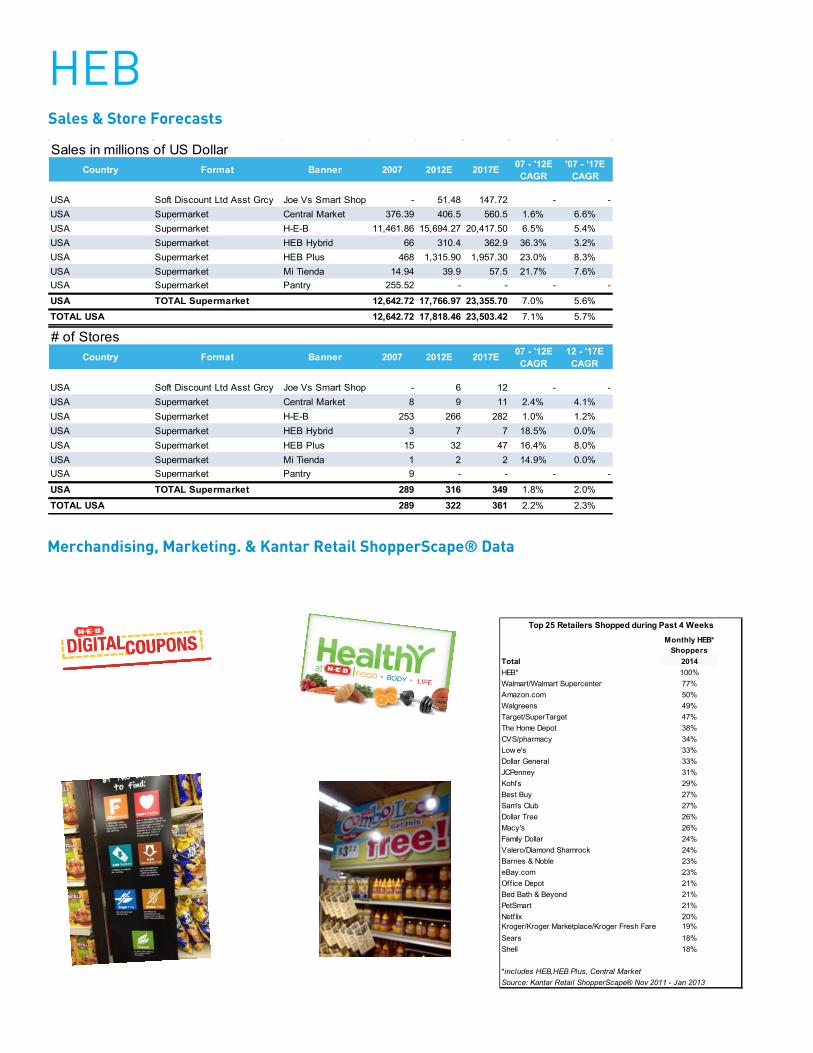
Country Format Banner 2007 2012E 2017E 07 - '12E CAGR
'07 - '17E CAGR
USA Soft Discount Ltd Asst Grcy Joe Vs Smart Shop - 51.48 147.72 - -USA Supermarket Central Market 376.39 406.5 560.5 1.6% 6.6%USA Supermarket H-E-B 11,461.86 15,694.27 20,417.50 6.5% 5.4%USA Supermarket HEB Hybrid 66 310.4 362.9 36.3% 3.2%USA Supermarket HEB Plus 468 1,315.90 1,957.30 23.0% 8.3%USA Supermarket Mi Tienda 14.94 39.9 57.5 21.7% 7.6%USA Supermarket Pantry 255.52 - - - -
USA TOTAL Supermarket 12,642.72 17,766.97 23,355.70 7.0% 5.6%
TOTAL USA 12,642.72 17,818.46 23,503.42 7.1% 5.7%
Sales in millions of US Dollar
Country Format Banner 2007 2012E 2017E 07 - '12E CAGR
12 - '17E CAGR
USA Soft Discount Ltd Asst Grcy Joe Vs Smart Shop - 6 12 - -USA Supermarket Central Market 8 9 11 2.4% 4.1%USA Supermarket H-E-B 253 266 282 1.0% 1.2%USA Supermarket HEB Hybrid 3 7 7 18.5% 0.0%USA Supermarket HEB Plus 15 32 47 16.4% 8.0%USA Supermarket Mi Tienda 1 2 2 14.9% 0.0%USA Supermarket Pantry 9 - - - -
USA TOTAL Supermarket 289 316 349 1.8% 2.0%
TOTAL USA 289 322 361 2.2% 2.3%
# of Stores
Monthly HEB* Shoppers
Total 2014HEB* 100%Walmart/Walmart Supercenter 77%Amazon.com 50%Walgreens 49%Target/SuperTarget 47%The Home Depot 38%CVS/pharmacy 34%Low e's 33%Dollar General 33%JCPenney 31%Kohl's 29%Best Buy 27%Sam's Club 27%Dollar Tree 26%Macy's 26%Family Dollar 24%Valero/Diamond Shamrock 24%Barnes & Noble 23%eBay.com 23%Office Depot 21%Bed Bath & Beyond 21%PetSmart 21%Netflix 20%Kroger/Kroger Marketplace/Kroger Fresh Fare 19%Sears 18%Shell 18%
*includes HEB,HEB Plus, Central MarketSource: Kantar Retail ShopperScape® Nov 2011 - Jan 2013
Top 25 Retailers Shopped during Past 4 Weeks
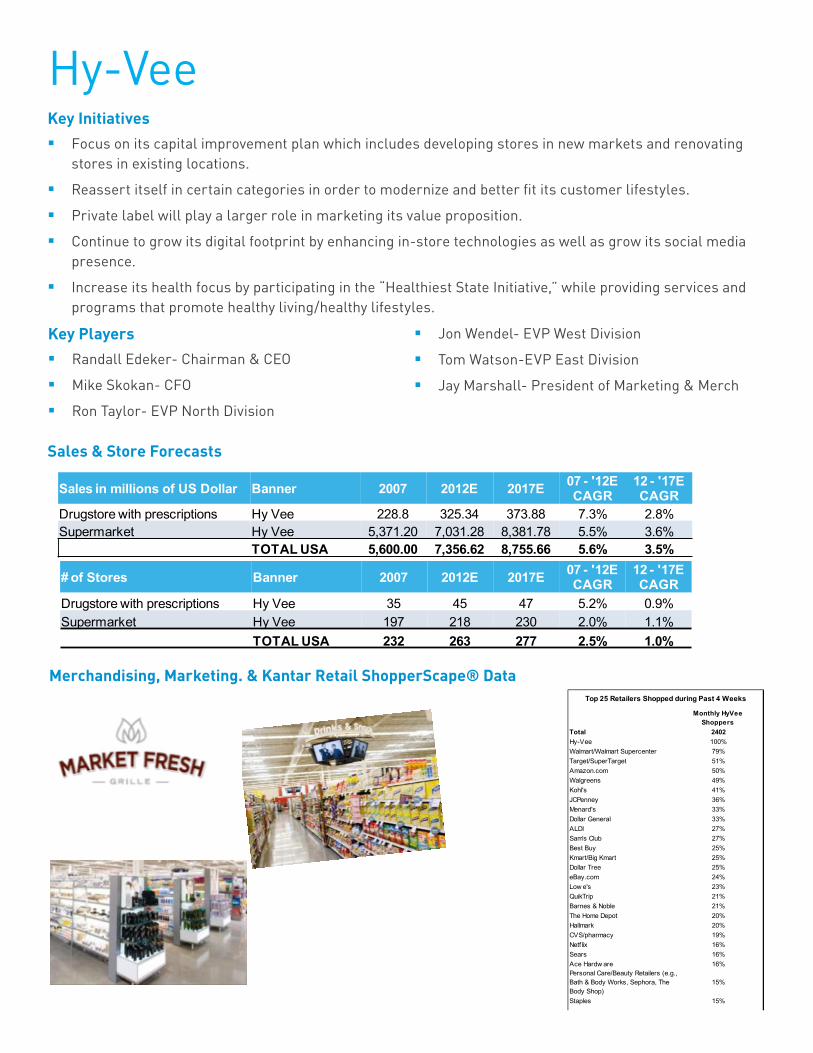
Hy-VeeKey Initiatives�� Focus on its capital improvement plan which includes developing stores in new markets and renovating
stores in existing locations.
�� Reassert itself in certain categories in order to modernize and better fit its customer lifestyles.
�� Private label will play a larger role in marketing its value proposition.
�� Continue to grow its digital footprint by enhancing in-store technologies as well as grow its social media presence.
�� Increase its health focus by participating in the “Healthiest State Initiative,” while providing services and programs that promote healthy living/healthy lifestyles.
Sales & Store Forecasts
Sales in millions of US Dollar Banner 2007 2012E 2017E 07 - '12E CAGR
12 - '17E CAGR
Drugstore with prescriptions Hy Vee 228.8 325.34 373.88 7.3% 2.8%Supermarket Hy Vee 5,371.20 7,031.28 8,381.78 5.5% 3.6%
TOTAL USA 5,600.00 7,356.62 8,755.66 5.6% 3.5%
# of Stores Banner 2007 2012E 2017E 07 - '12E CAGR
12 - '17E CAGR
Drugstore with prescriptions Hy Vee 35 45 47 5.2% 0.9%Supermarket Hy Vee 197 218 230 2.0% 1.1%
TOTAL USA 232 263 277 2.5% 1.0%
Merchandising, Marketing. & Kantar Retail ShopperScape® Data
Monthly HyVee Shoppers
Total 2402Hy-Vee 100%Walmart/Walmart Supercenter 79%Target/SuperTarget 51%Amazon.com 50%Walgreens 49%Kohl's 41%JCPenney 36%Menard's 33%Dollar General 33%ALDI 27%Sam's Club 27%Best Buy 25%Kmart/Big Kmart 25%Dollar Tree 25%eBay.com 24%Low e's 23%QuikTrip 21%Barnes & Noble 21%The Home Depot 20%Hallmark 20%CVS/pharmacy 19%Netflix 16%Sears 16%Ace Hardw are 16%Personal Care/Beauty Retailers (e.g., Bath & Body Works, Sephora, The Body Shop)
15%
Staples 15%
Source: Kantar Retail ShopperScape® Nov 2011 - Jan 2013
Top 25 Retailers Shopped during Past 4 Weeks
Key Players�� Randall Edeker- Chairman & CEO
�� Mike Skokan- CFO
�� Ron Taylor- EVP North Division
�� Jon Wendel- EVP West Division
�� Tom Watson-EVP East Division
�� Jay Marshall- President of Marketing & Merch
MeijerKey Initiatives�� Leveraging digital and online tools that allow Meijer to offer targeted deals and create a personalized
shopping experience.
�� Continue to develop strategies that help promote Meijer’s commitment to offering healthy living solutions for its shoppers.
�� Grow its footprint in existing and new markets.
�� Continue to experiment with social media to push marketing messages.
Stengths�� Privately owned-longer term vision compared to
publicly owned retailers�� Strong brand recognition and loyal customer base�� Strong track record of successful food operations�� Prime real estate locations�� Strong supply chain�� Will negotiate hard to get the right product at the
right price �� Price leadership and strong value perception
Weaknesses�� Private ownership constrains capital availability�� Smaller company wields less leverage in global
sourcing than larger competitors like Walmart�� Primary markets’ economies vulnerable to
declining base of manufacturing jobs, including the US automakers
�� Meijer has a defined EDLP strategy, but has multiple messages which may confuse shoppers
Opportunities�� Experimentation with destination departments�� Further improve price perception in the market�� Format experimentation and innovation�� Develop health and wellness theme�� Senior management interaction with other best-
in-class privately owned grocers�� Shopper data mining
Threats�� Competitive environment: Walmart, Costco,
Kroger�� Shopability: Not as convenient to navigate�� Undiversified business model�� Operates unionized markets�� Losing share of wallet due to changing economic
conditions and trends away from stock up trips�� Known as a promotional supercenter which
conflicts with edlp strategy.
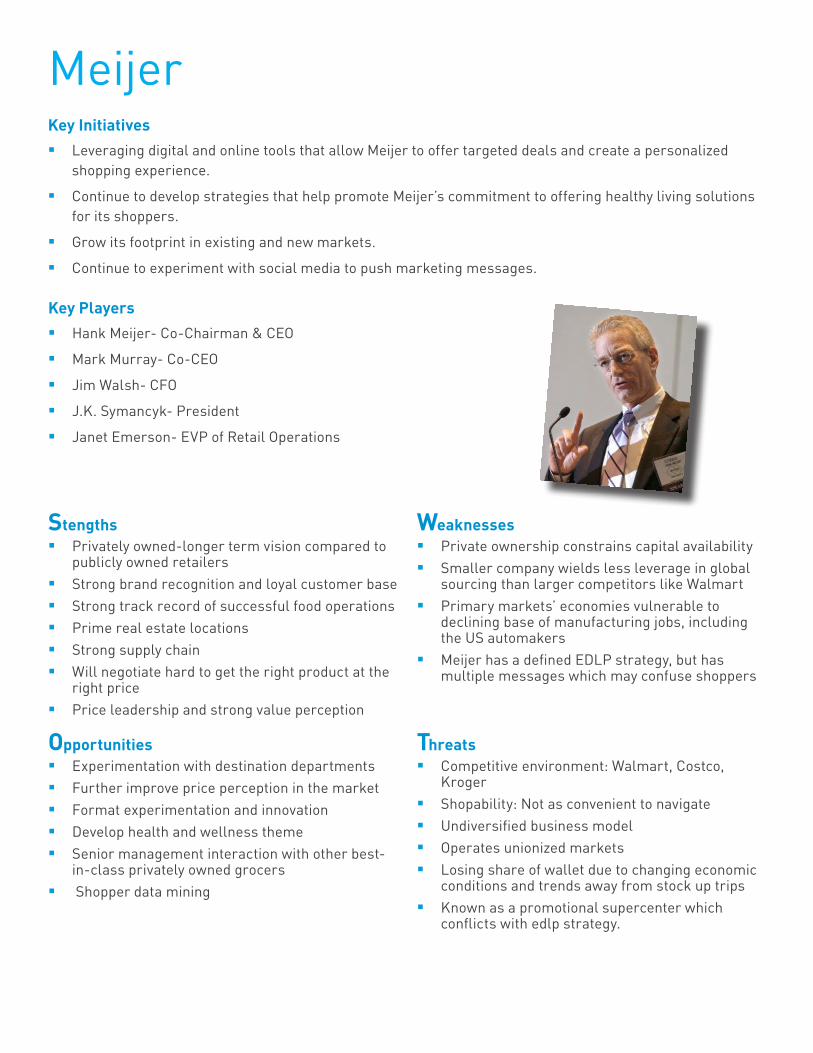
Key Players�� Hank Meijer- Co-Chairman & CEO
�� Mark Murray- Co-CEO
�� Jim Walsh- CFO
�� J.K. Symancyk- President
�� Janet Emerson- EVP of Retail Operations
MeijerSales & Store Forecasts
Merchandising, Marketing. & Kantar Retail ShopperScape® Data
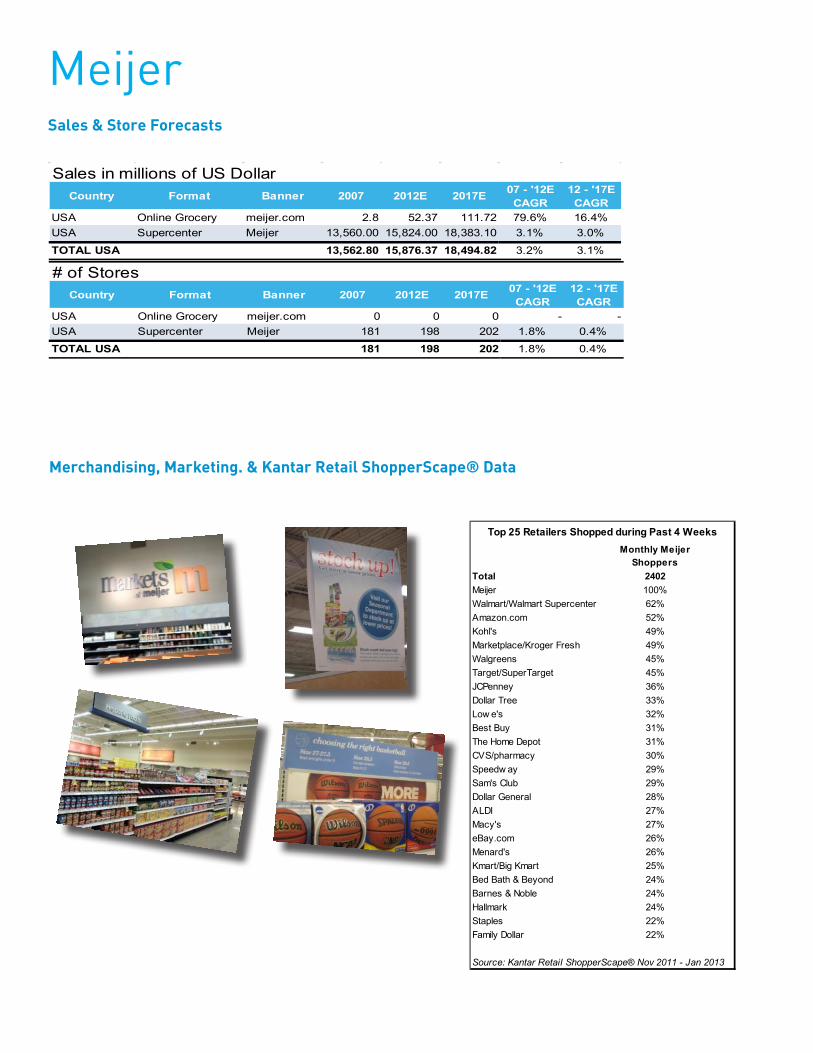
Country Format Banner 2007 2012E 2017E 07 - '12E CAGR
12 - '17E CAGR
USA Online Grocery meijer.com 2.8 52.37 111.72 79.6% 16.4%USA Supercenter Meijer 13,560.00 15,824.00 18,383.10 3.1% 3.0%
TOTAL USA 13,562.80 15,876.37 18,494.82 3.2% 3.1%
Sales in millions of US Dollar
Country Format Banner 2007 2012E 2017E 07 - '12E CAGR
12 - '17E CAGR
USA Online Grocery meijer.com 0 0 0 - -USA Supercenter Meijer 181 198 202 1.8% 0.4%
TOTAL USA 181 198 202 1.8% 0.4%
# of Stores
Monthly Meijer Shoppers
Total 2402Meijer 100%Walmart/Walmart Supercenter 62%Amazon.com 52%Kohl's 49%Kroger/Kroger Marketplace/Kroger Fresh 49%Walgreens 45%Target/SuperTarget 45%JCPenney 36%Dollar Tree 33%Low e's 32%Best Buy 31%The Home Depot 31%CVS/pharmacy 30%Speedw ay 29%Sam's Club 29%Dollar General 28%ALDI 27%Macy's 27%eBay.com 26%Menard's 26%Kmart/Big Kmart 25%Bed Bath & Beyond 24%Barnes & Noble 24%Hallmark 24%Staples 22%Family Dollar 22%
Source: Kantar Retail ShopperScape® Nov 2011 - Jan 2013
Top 25 Retailers Shopped during Past 4 Weeks
SafewayKey Initiatives�� Develop a wellness platform aimed to grow ID sales and build Safeway’s brand.
�� Expanding its fuel, loyalty program to enhance its value proposition.
�� Continue to enhance its just for U digital saving platform to increase shopper loyalty.
�� Re-inventing the Lifestyle format by adding new innovative, merchandising initiatives on top of newly designed marketing and promotions.
Stengths�� Significant market share in major markets�� Real estate (locations) and high percentage of
stores are Lifestyle format�� Strong Corporate Brands program�� Financially minded�� Blackhawk Network�� Social media/digital marketing competencies�� Use of social media and digital marketing
Weaknesses�� Profitability issues�� Margins remain high�� Declines in traffic counts and basket size�� No clear strategic response to current sales
challenges�� Fixed cost structure is high�� Centralized merchandising strategy�� Expansion markets under-perform relative to
chain�� Pricing Image
Opportunities�� Continued development of Optura• Price
optimization�� Alternative growth engines (Blackhawk, Safeway
Health)�� Third-party distribution of private label items�� Private label development that aligns with
shopper trends�� Continued expansion of online/digital platforms
and growing online sales
�� Continued expansion in health initiatives
Threats�� Competition from Walmart, Costco, Target,
Kroger, and more regional operators�� Competitors’ shopper insight programs�� Questionable long-term commitment to value-
conscious shoppers�� Labor disputes/talent retention�� Continued high price perception amongst
shoppers
Key Players�� Steve Burd- Chairman & CEO (retiring May 2013-successor unknown)
�� Robert Edwards- President
�� Peter Bocian- EVP &CFO
�� Diane Dietz- EVP Chief Marketing Officer
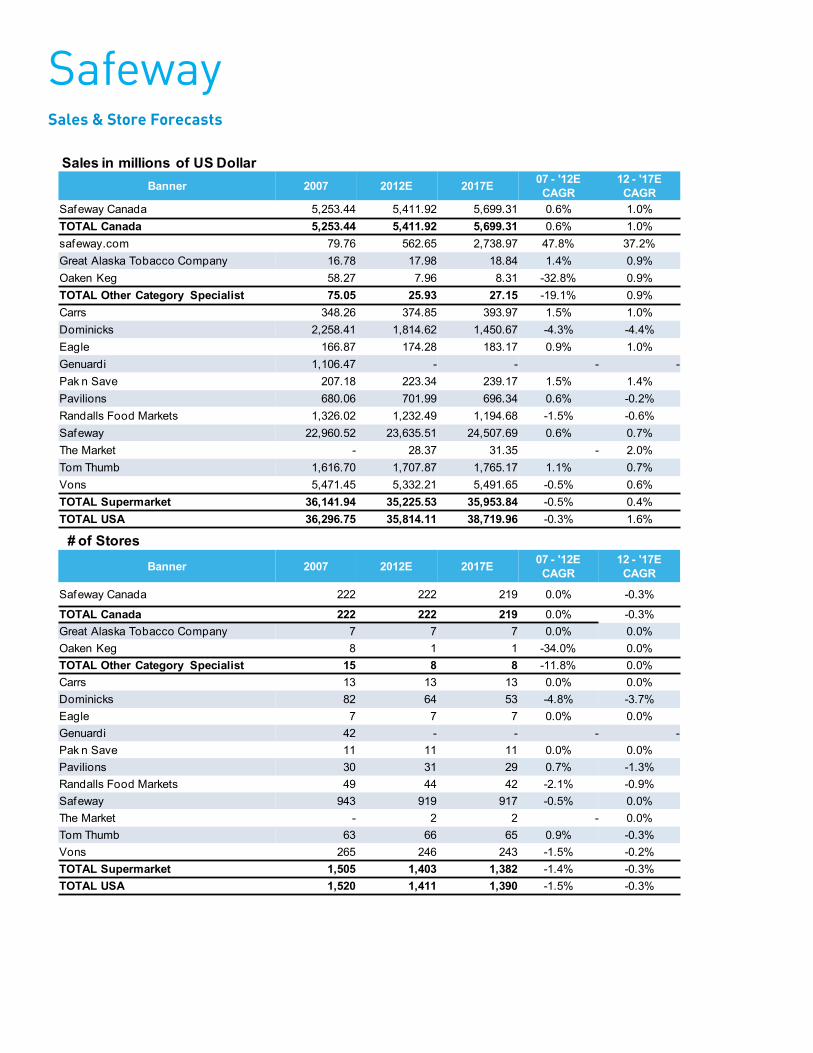
Sales & Store Forecasts
Banner 2007 2012E 2017E 07 - '12E CAGR
12 - '17E CAGR
Safeway Canada 5,253.44 5,411.92 5,699.31 0.6% 1.0%TOTAL Canada 5,253.44 5,411.92 5,699.31 0.6% 1.0%safeway.com 79.76 562.65 2,738.97 47.8% 37.2%Great Alaska Tobacco Company 16.78 17.98 18.84 1.4% 0.9%Oaken Keg 58.27 7.96 8.31 -32.8% 0.9%TOTAL Other Category Specialist 75.05 25.93 27.15 -19.1% 0.9%Carrs 348.26 374.85 393.97 1.5% 1.0%Dominicks 2,258.41 1,814.62 1,450.67 -4.3% -4.4%Eagle 166.87 174.28 183.17 0.9% 1.0%Genuardi 1,106.47 - - - -Pak n Save 207.18 223.34 239.17 1.5% 1.4%Pavilions 680.06 701.99 696.34 0.6% -0.2%Randalls Food Markets 1,326.02 1,232.49 1,194.68 -1.5% -0.6%Safeway 22,960.52 23,635.51 24,507.69 0.6% 0.7%The Market - 28.37 31.35 - 2.0%Tom Thumb 1,616.70 1,707.87 1,765.17 1.1% 0.7%Vons 5,471.45 5,332.21 5,491.65 -0.5% 0.6%TOTAL Supermarket 36,141.94 35,225.53 35,953.84 -0.5% 0.4%TOTAL USA 36,296.75 35,814.11 38,719.96 -0.3% 1.6%
Banner 2007 2012E 2017E 07 - '12E CAGR
12 - '17E CAGR
Safeway Canada 222 222 219 0.0% -0.3%
TOTAL Canada 222 222 219 0.0% -0.3%Great Alaska Tobacco Company 7 7 7 0.0% 0.0%Oaken Keg 8 1 1 -34.0% 0.0%TOTAL Other Category Specialist 15 8 8 -11.8% 0.0%Carrs 13 13 13 0.0% 0.0%Dominicks 82 64 53 -4.8% -3.7%Eagle 7 7 7 0.0% 0.0%Genuardi 42 - - - -Pak n Save 11 11 11 0.0% 0.0%Pavilions 30 31 29 0.7% -1.3%Randalls Food Markets 49 44 42 -2.1% -0.9%Safeway 943 919 917 -0.5% 0.0%The Market - 2 2 - 0.0%Tom Thumb 63 66 65 0.9% -0.3%Vons 265 246 243 -1.5% -0.2%TOTAL Supermarket 1,505 1,403 1,382 -1.4% -0.3%TOTAL USA 1,520 1,411 1,390 -1.5% -0.3%
Sales in millions of US Dollar
# of Stores
Safeway
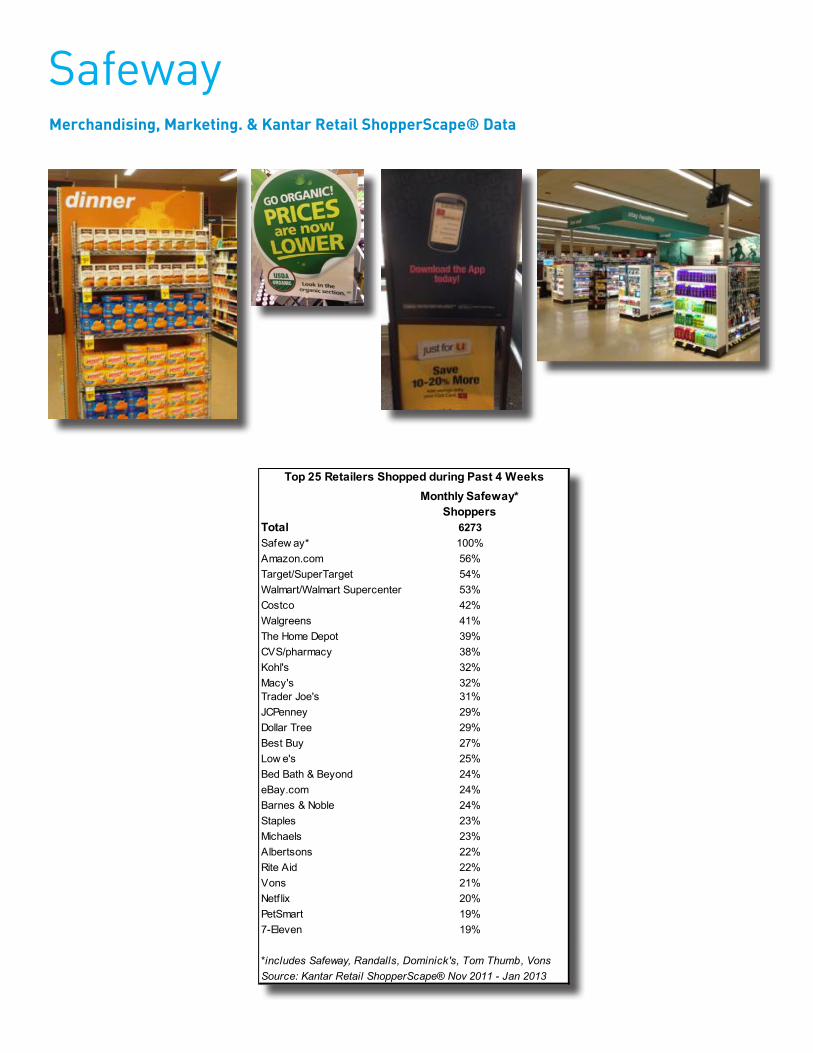
SafewayMerchandising, Marketing. & Kantar Retail ShopperScape® Data
Monthly Safeway* Shoppers
Total 6273Safew ay* 100%Amazon.com 56%Target/SuperTarget 54%Walmart/Walmart Supercenter 53%Costco 42%Walgreens 41%The Home Depot 39%CVS/pharmacy 38%Kohl's 32%Macy's 32%Trader Joe's 31%JCPenney 29%Dollar Tree 29%Best Buy 27%Low e's 25%Bed Bath & Beyond 24%eBay.com 24%Barnes & Noble 24%Staples 23%Michaels 23%Albertsons 22%Rite Aid 22%Vons 21%Netflix 20%PetSmart 19%7-Eleven 19%
*includes Safeway, Randalls, Dominick's, Tom Thumb, VonsSource: Kantar Retail ShopperScape® Nov 2011 - Jan 2013
Top 25 Retailers Shopped during Past 4 Weeks
SchnucksKey Initiatives�� Expansion via new store growth and single store acquisition
�� Offering value added services, i.e., cooking school, special order service, fuel rewards, recipe ideas, etc.
�� Offering full pharmacy services such as online refills, generic drugs, health screenings, immunizations
�� In May 2012 it opened its first full-service standalone pharmacy on the site of the St. John’s Hospital in Springfield, Illinois
�� “Piece of Mind Quality” initiative that highlights above standard food safety and quality guidelines pertaining to perishable categories
�� Development and launch of Culinaria, hybrid urban grocery store combining an upscale experience and high end assortment with Schnucks pharmacy and HBA offer
Key Players�� Scott C. Schnuck: Chairman of the Board and CEO
�� Todd R. Schnuck: President and COO
�� Mark J. Schnuck: VP Shopping Center Development
�� Edwin H. Schnuck: Co-Founder
�� Anna Donovan Schnuck: Co-Founder
�� David Bell: CFO
Sales & Store Forecasts
Sales in millions of US Dollar 2007 2012E 2017E 07 - '12E
CAGR12E - '17E
CAGRschnucks.com 32.26 59.55 122.94 13.04% 15.60%Hilander - 143.64 247.73 - 12%Logli 258.1 267.39 280.75 0.71% 0.98%Schnucks 2,043.11 2,198.85 2,056.35 1.48% -1.33%TOTAL Supermarket 2,301.21 2,609.88 2,584.83 2.55% -0.19%TOTAL USA 2,333.47 2,669.43 2,707.77 2.73% 0.29%
# of Stores 2007 2012E 2017E 07 - '12E CAGR
12E - '17E CAGR
Hilander - 6 8 - 6%Logli 5 5 5 0.00% 0.00%Schnucks 99 98 86 -0.20% -2.58%TOTAL USA 104 109 99 0.94% -1.91%
SuperValuKey InitiativesOn 10 January 2013, Supervalu announced that it had entered an agreement to sell five of its traditional retail banners to Cerberus affiliate AB Acquisition LLC for approximately USD 3.3 billion. Additionally, a Cerberus-led investor consortium called Symphony Investors will conduct a tender offer on up to 30% of Supervalu’s outstanding common stock. Details are below:
Sale of Retail Banners
�� The retail banners to be sold to AB Acquisition LLC include Albertsons, Acme, Jewel-Osco, Shaw’s and Star Market along with associated Osco and Sav-On in store pharmacies.
�� The Albertsons banner will be recombined with existing Cerberus owned Albertsons LLC.
�� These five banners, covering 877 stores, will comprise the New Albertsons, Inc. (NAI) entity.
�� Total size of the transaction is approximately 3.2 billion
�� The transaction is expected to close the week of March 18, 2013
Sale of Retail Banners
�� Upon completion of the sale, Supervalu will consist of its Independent Businesses segment, Save-A-Lot, and the Cub, Farm Fresh, Shoppers, Shop ‘n Save, and Hornbacher’s banners.
�� The new Supervalu is expected to generate revenues of approximately USD 17 billion.
Key Players�� Sam K. Duncan- Chief Executive Officer and President
�� Michael Moore- Executive Vice President, Chief Marketing Officer
�� Janel S. Haugarth- President Independent Business and Business Optimization
�� Santiago Roces- President and Chief Executive Officer Save-A-Lot
�� Sherry M. Smith- Executive Vice President, Chief Financial Officer
�� Kevin Holt- President, Supervalu Retail
Stengths�� National supply chain capabilities�� Knowledge of distribution and logistics�� Local market relevance�� Relatively stronger performance at Save-A-Lot
and Independent Businesses segment�� Greater store level autonomy
Weaknesses�� Long standing financial constraints�� Poor price/value message�� Retail store systems integration�� HQ and divisional misalignment�� Criticism of senior management�� Poor cash flow
Opportunities�� New technology & analytic tools for store
managers�� Growing private label sophistication�� Ongoing “value transformation” efforts�� Actionable insights from Project THOR initiative �� Realigned senior management structure�� Divestiture of assets should free up company to
focus on core business units
Threats�� Debt level remains high�� Strong competition (in and outside of channel)
expanding in key markets�� Inconsistent management across all levels of
operations�� Continuing difficulties with execution�� Disruptive management changes adversely
impact internal culture
Sales & Store Forecasts
SuperValu
Merchandising, Marketing. & Kantar Retail ShopperScape® Data
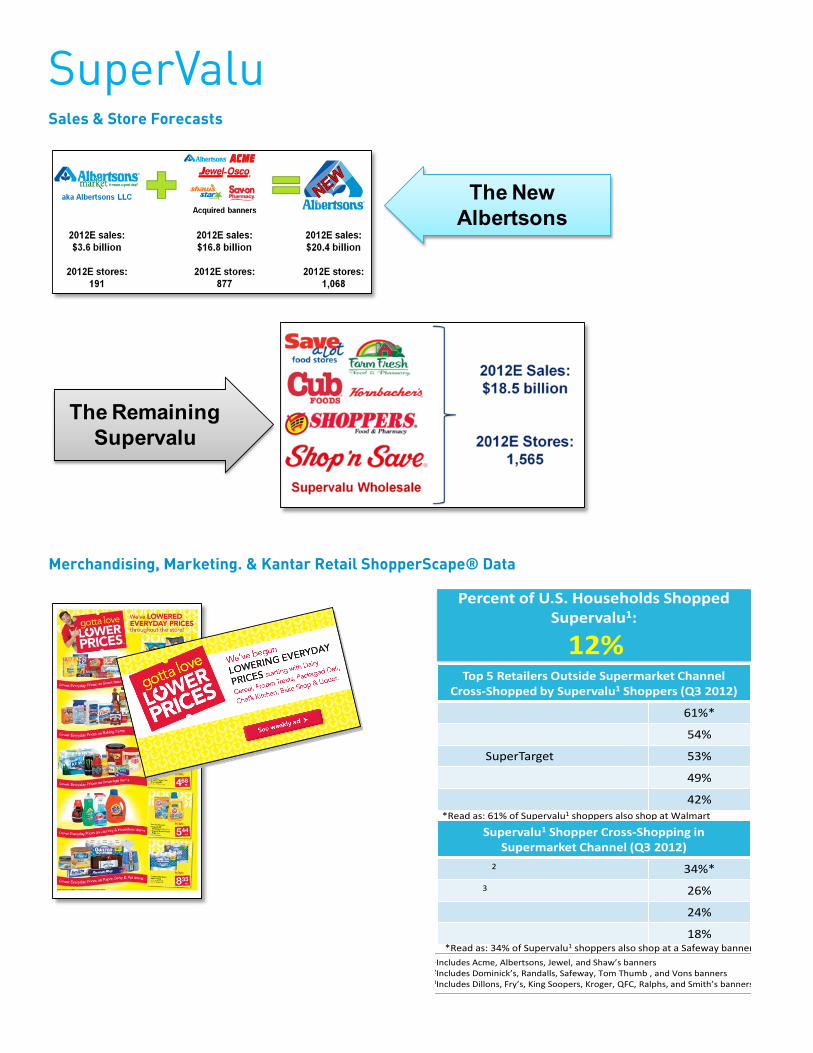
The New Albertsons
The Remaining Supervalu
Top 5 Retailers Outside Supermarket Channel Cross-Shopped by Supervalu1 Shoppers (Q3 2012)
Walmart/Walmart Supercenter 61%*
Amazon.com 54%
Target/SuperTarget 53%
Walgreens 49%
CVS/pharmacy 42%*Read as: 61% of Supervalu1 shoppers also shop at Walmart
Percent of U.S. Households Shopped Supervalu1:
12%
1Includes Acme, Albertsons, Jewel, and Shaw’s banners2Includes Dominick’s, Randalls, Safeway, Tom Thumb , and Vons banners3Includes Dillons, Fry’s, King Soopers, Kroger, QFC, Ralphs, and Smith’s banners
Supervalu1 Shopper Cross-Shopping in Supermarket Channel (Q3 2012)
Safeway2 34%*
Kroger3 26%
Trader Joe’s 24%
Whole Foods 18%*Read as: 34% of Supervalu1 shoppers also shop at a Safeway banner
Wakefern (PriceRite + ShopRite)Key InitiativesWakefern is committed to providing entrepreneurs and independent retailers with the necessary tools to succeed in a competitive market. This goal is especially vital to the independent grocer today as it becomes increasingly difficult to compete with multi-national chains. Wakefern’s core values - integrity, innovation and teamwork - provide a strong foundation upon which the company has built its business.
Key Players�� Joseph Colalillo- Chairman and CEO
�� Joseph Sheridan- President and COO
�� Douglas Wille- CFO
�� Neil Duffy- President, PriceRite
�� David Figurelli- President, ShopRite Supermarkets, Inc.
�� Chris Lane- SVP, Non-Perishables
�� Bill Mayo- SVP, Perishables
Stengths�� Ownership model allows for a high level of
autonomy at the store�� Very price competitive�� Stores have low operating expenses�� High velocity�� Strong brand clarity�� Divestiture of assets by competitors
Weaknesses�� Ownership model means in-store conditions can
vary widely by location�� Limited opportunities for partnering�� Promotional programs tend to be basic�� Execution can be an issue�� Coordination can be a challenge
Opportunities�� Glut of commercial real estate makes for
favorable expansion environment�� Tailoring assortment to local shopper base�� Continued development of co-branding efforts
(e.g. Kashi)�� Divestiture of assets by competitors
Threats�� Shopper base exposed to economic downturn�� Competition from multiple channels�� Operates in a crowded market�� Other value oriented, ethnic oriented retailers
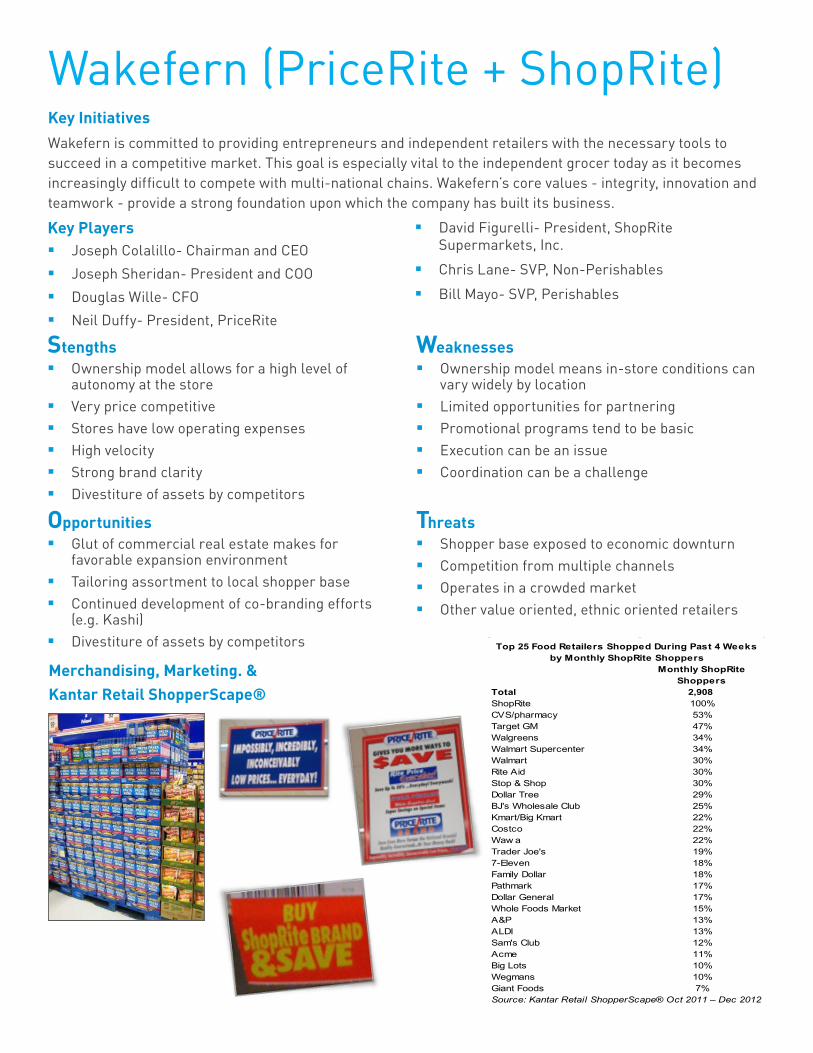
Merchandising, Marketing. & Kantar Retail ShopperScape®
Monthly ShopRite Shoppers
Total 2,908ShopRite 100%CVS/pharmacy 53%Target GM 47%Walgreens 34%Walmart Supercenter 34%Walmart 30%Rite Aid 30%Stop & Shop 30%Dollar Tree 29%BJ's Wholesale Club 25%Kmart/Big Kmart 22%Costco 22%Waw a 22%Trader Joe's 19%7-Eleven 18%Family Dollar 18%Pathmark 17%Dollar General 17%Whole Foods Market 15%A&P 13%ALDI 13%Sam's Club 12%Acme 11%Big Lots 10%Wegmans 10%Giant Foods 7%Source: Kantar Retail ShopperScape® Oct 2011 – Dec 2012
Top 25 Food Retailers Shopped During Past 4 Weeks by Monthly ShopRite Shoppers
WegmansKey Initiatives�� Emphasize green and local initiatives by maintaining energy efficient stores and selling organic and eco-
friendly products.
�� Focus on value image by clearly communicating edlp and consistent prices to shoppers.
�� Offer unique and exciting shopping experience through a European Open-Air Market format, SWAS concepts, wide-variety product mix, etc.
�� Heightened-levels of customer and in-store services.
�� Store growth opportunities in newly-entered and under developed markets.
Key Players�� Danny Wegman- CEO
�� Colleen Wegman- President
Stengths�� Strong local brand and loyal shoppers�� People: empowered, well-trained staff�� Excellent customer service�� EDLP pricing strategy �� Operating margin ~7.5%�� Technology: supply chain, Web�� High volume per store: sales per square foot 50%
higher than industry average�� Emphasis on innovation
Weaknesses�� Stores not efficient to shop- huge footprint, hard
to get in and out quickly�� Slow overall navigation�� Marginalized center store categories�� High prices on prepared gourmet foods
Opportunities�� Roll out new ideas and test results to other stores�� Expand culinary education program�� Enhance wine and beer offering, educate
shoppers about wine and food pairings�� Data-driven shopper insight strategy
Threats�� Number of SKUs�� Price competition from Walmart�� High-end prepared food competition from Whole
Foods�� Macroeconomic uncertainty: EDLP relies on price
stability
Wegmans
Merchandising, Marketing. & Kantar Retail ShopperScape® Data
Sales & Store Forecasts
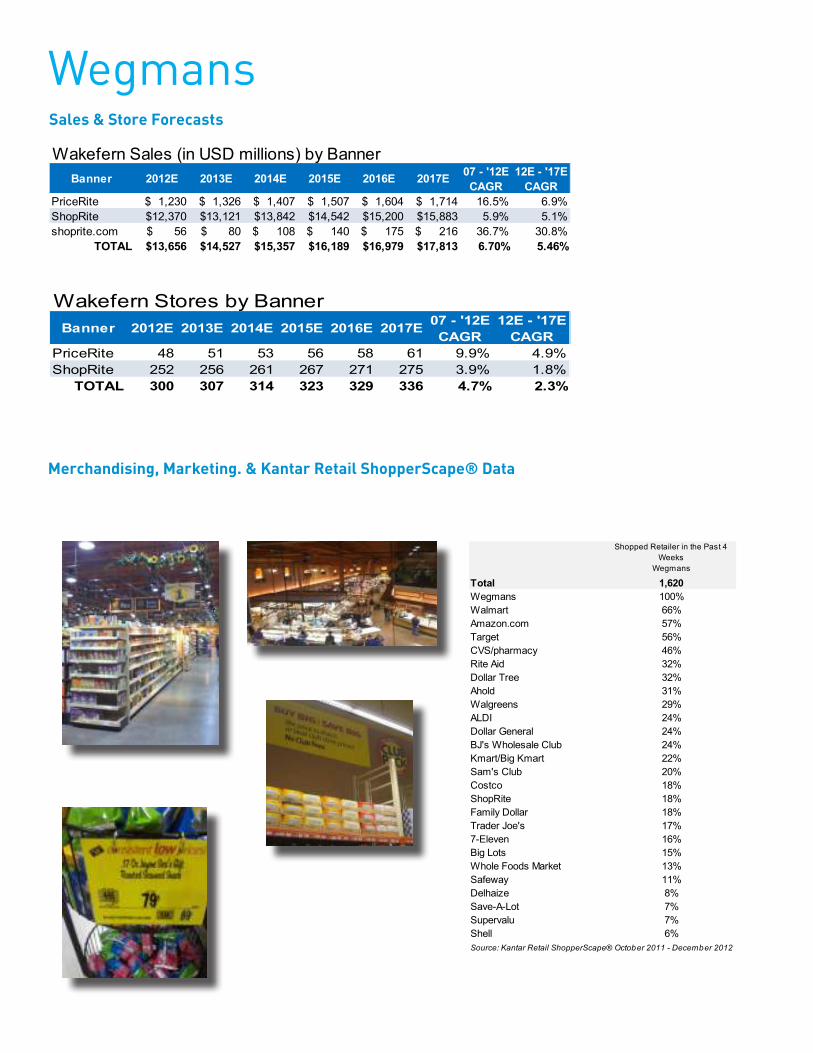
Shopped Retailer in the Past 4 Weeks
Wegmans
Total 1,620Wegmans 100%Walmart 66%Amazon.com 57%Target 56%CVS/pharmacy 46%Rite Aid 32%Dollar Tree 32%Ahold 31%Walgreens 29%ALDI 24%Dollar General 24%BJ's Wholesale Club 24%Kmart/Big Kmart 22%Sam's Club 20%Costco 18%ShopRite 18%Family Dollar 18%Trader Joe's 17%7-Eleven 16%Big Lots 15%Whole Foods Market 13%Safeway 11%Delhaize 8%Save-A-Lot 7%Supervalu 7%Shell 6%Source: Kantar Retail ShopperScape® October 2011 - December 2012
Banner 2012E 2013E 2014E 2015E 2016E 2017E 07 - '12E CAGR
12E - '17E CAGR
PriceRite $ 1,230 $ 1,326 $ 1,407 $ 1,507 $ 1,604 $ 1,714 16.5% 6.9%ShopRite $12,370 $13,121 $13,842 $14,542 $15,200 $15,883 5.9% 5.1%shoprite.com $ 56 $ 80 $ 108 $ 140 $ 175 $ 216 36.7% 30.8%
TOTAL $13,656 $14,527 $15,357 $16,189 $16,979 $17,813 6.70% 5.46%
Wakefern Sales (in USD millions) by Banner
Banner 2012E 2013E 2014E 2015E 2016E 2017E 07 - '12E CAGR
12E - '17E CAGR
PriceRite 48 51 53 56 58 61 9.9% 4.9%ShopRite 252 256 261 267 271 275 3.9% 1.8%
TOTAL 300 307 314 323 329 336 4.7% 2.3%
Wakefern Stores by Banner

Participating Discount Retailers
Dollar GeneralKey Initiatives�� Category management
�� Phase 5 expansion
�� Cooler additions
�� Tobacco
Stengths�� Clear and easy to understand value proposition�� Consistent traffic and basket growth via strategic
focus on consumables (particularly edible grocery)
�� Assortment concentrated on high velocity, need based items
�� Solution selling�� Low capital investment required for store base
expansion�� E-commerce and social media platform
Weaknesses�� Rapid expansion puts pressure on supply chain�� Needs to build out capabilities around perishables
distribution�� Lean in store labor model makes execution of
programs a challenge�� Still viewed as “emerging” by many suppliers
coupled with low levels of resource investment
Opportunities�� Growing attention from middle and higher income
shoppers�� Grocery-centric DG Market format has potential
to make DG a primary outlet for shoppers�� Expansion into new markets�� Private label getting increasingly sophisticated
Threats�� Family Dollar is starting to gain speed as a real
alternative�� Increased competition from Walmart via its
Neighborhood Market format�� Growing inventory levels could disrupt supply
chain�� Senior management’s contracts up for renewal
soon
Key Players�� Richard W. Dreiling- Chief Executive Officer and
Chairman of the Board
�� David M. Tehle- Executive Vice President and Chief Financial Officer
�� John W. Flanigan- Executive Vice President, Global Supply Chain
�� Susan S. Lanigan- Executive Vice President, General Counsel
�� Bob Ravener- Executive Vice President and Chief People Officer
�� Gregory A. Sparks- Executive Vice President, Store Operations
�� Todd Vasos- Executive Vice President, Division President and Chief Merchandising Officer
�� Beer & wine
�� Private label expansion
�� Zone pricing
�� Out-of-stock reduction
Dollar General
Merchandising, Marketing. & Kantar Retail ShopperScape® Data
Sales & Store Forecasts
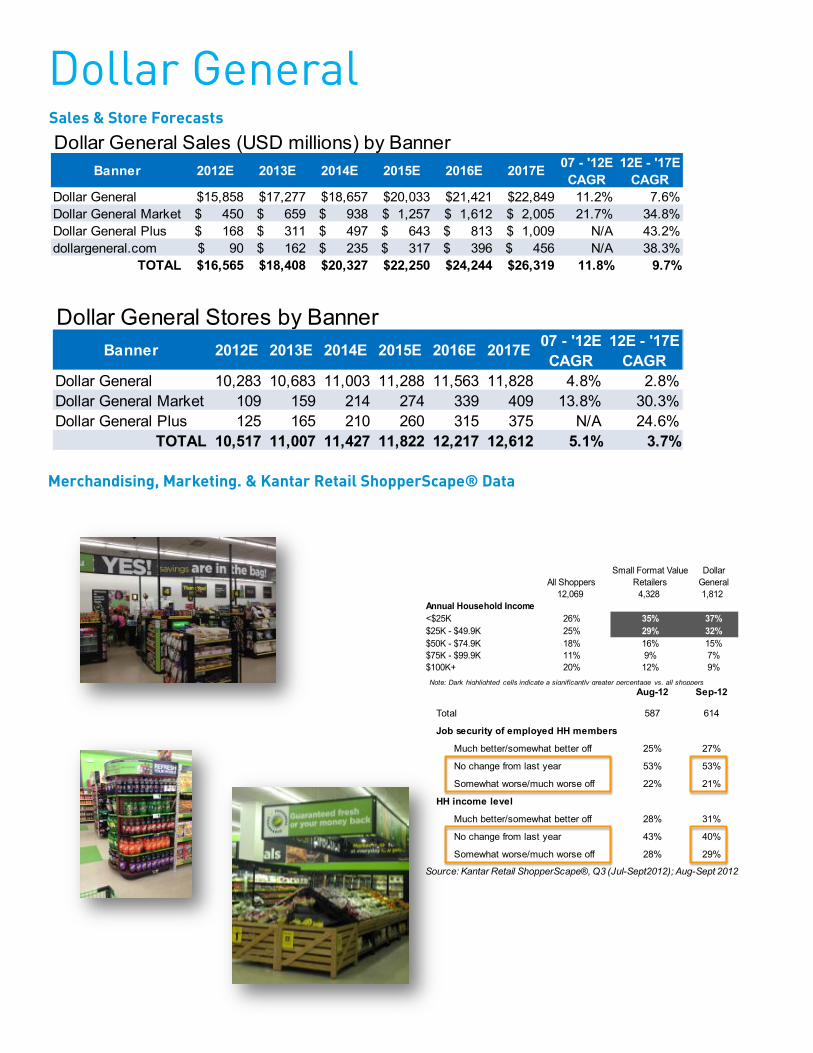
Banner 2012E 2013E 2014E 2015E 2016E 2017E 07 - '12E CAGR
12E - '17E CAGR
Dollar General $15,858 $17,277 $18,657 $20,033 $21,421 $22,849 11.2% 7.6%Dollar General Market $ 450 $ 659 $ 938 $ 1,257 $ 1,612 $ 2,005 21.7% 34.8%Dollar General Plus $ 168 $ 311 $ 497 $ 643 $ 813 $ 1,009 N/A 43.2%dollargeneral.com $ 90 $ 162 $ 235 $ 317 $ 396 $ 456 N/A 38.3%
TOTAL $16,565 $18,408 $20,327 $22,250 $24,244 $26,319 11.8% 9.7%
Dollar General Sales (USD millions) by Banner
Banner 2012E 2013E 2014E 2015E 2016E 2017E 07 - '12E CAGR
12E - '17E CAGR
Dollar General 10,283 10,683 11,003 11,288 11,563 11,828 4.8% 2.8%Dollar General Market 109 159 214 274 339 409 13.8% 30.3%Dollar General Plus 125 165 210 260 315 375 N/A 24.6%
TOTAL 10,517 11,007 11,427 11,822 12,217 12,612 5.1% 3.7%
Dollar General Stores by Banner
Note: Dark highlighted cells indicate a significantly greater percentage vs. all shoppers
All ShoppersSmall Format Value
RetailersDollar
General12,069 4,328 1,812
Annual Household Income<$25K 26% 35% 37%$25K - $49.9K 25% 29% 32%$50K - $74.9K 18% 16% 15%$75K - $99.9K 11% 9% 7%$100K+ 20% 12% 9%
Aug-12 Sep-12
Total 587 614
Job security of employed HH members
Much better/somewhat better off 25% 27%
No change from last year 53% 53%
Somewhat worse/much worse off 22% 21%
HH income level
Much better/somewhat better off 28% 31%
No change from last year 43% 40%
Somewhat worse/much worse off 28% 29%
Source: Kantar Retail ShopperScape®, Q3 (Jul-Sept2012); Aug-Sept 2012
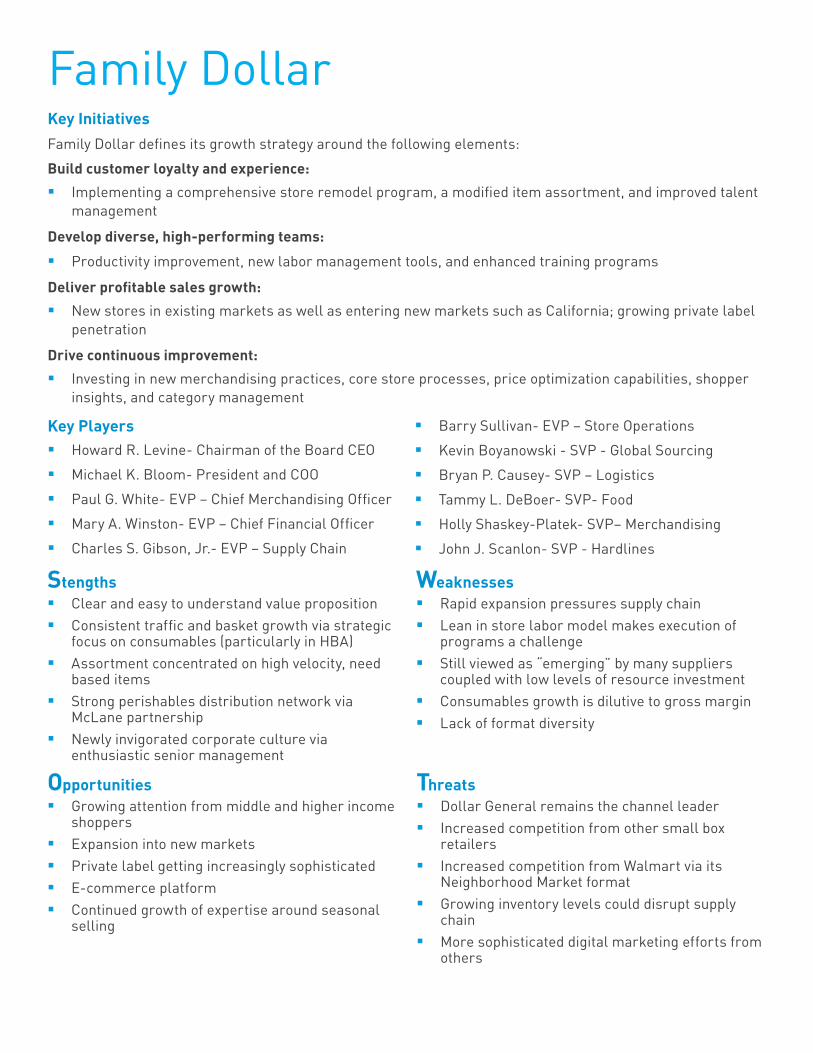
Family DollarKey InitiativesFamily Dollar defines its growth strategy around the following elements:
Build customer loyalty and experience:
�� Implementing a comprehensive store remodel program, a modified item assortment, and improved talent management
Develop diverse, high-performing teams:
�� Productivity improvement, new labor management tools, and enhanced training programs
Deliver profitable sales growth:
�� New stores in existing markets as well as entering new markets such as California; growing private label penetration
Drive continuous improvement:
�� Investing in new merchandising practices, core store processes, price optimization capabilities, shopper insights, and category management
Key Players�� Howard R. Levine- Chairman of the Board CEO
�� Michael K. Bloom- President and COO
�� Paul G. White- EVP – Chief Merchandising Officer
�� Mary A. Winston- EVP – Chief Financial Officer
�� Charles S. Gibson, Jr.- EVP – Supply Chain
�� Barry Sullivan- EVP – Store Operations
�� Kevin Boyanowski - SVP - Global Sourcing
�� Bryan P. Causey- SVP – Logistics
�� Tammy L. DeBoer- SVP- Food
�� Holly Shaskey-Platek- SVP– Merchandising
�� John J. Scanlon- SVP - Hardlines
Stengths�� Clear and easy to understand value proposition�� Consistent traffic and basket growth via strategic
focus on consumables (particularly in HBA)�� Assortment concentrated on high velocity, need
based items�� Strong perishables distribution network via
McLane partnership�� Newly invigorated corporate culture via
enthusiastic senior management
Weaknesses�� Rapid expansion pressures supply chain�� Lean in store labor model makes execution of
programs a challenge�� Still viewed as “emerging” by many suppliers
coupled with low levels of resource investment�� Consumables growth is dilutive to gross margin�� Lack of format diversity
Opportunities�� Growing attention from middle and higher income
shoppers�� Expansion into new markets�� Private label getting increasingly sophisticated�� E-commerce platform�� Continued growth of expertise around seasonal
selling
Threats�� Dollar General remains the channel leader�� Increased competition from other small box
retailers�� Increased competition from Walmart via its
Neighborhood Market format�� Growing inventory levels could disrupt supply
chain�� More sophisticated digital marketing efforts from
others
Family Dollar
Merchandising, Marketing. & Kantar Retail ShopperScape® Data
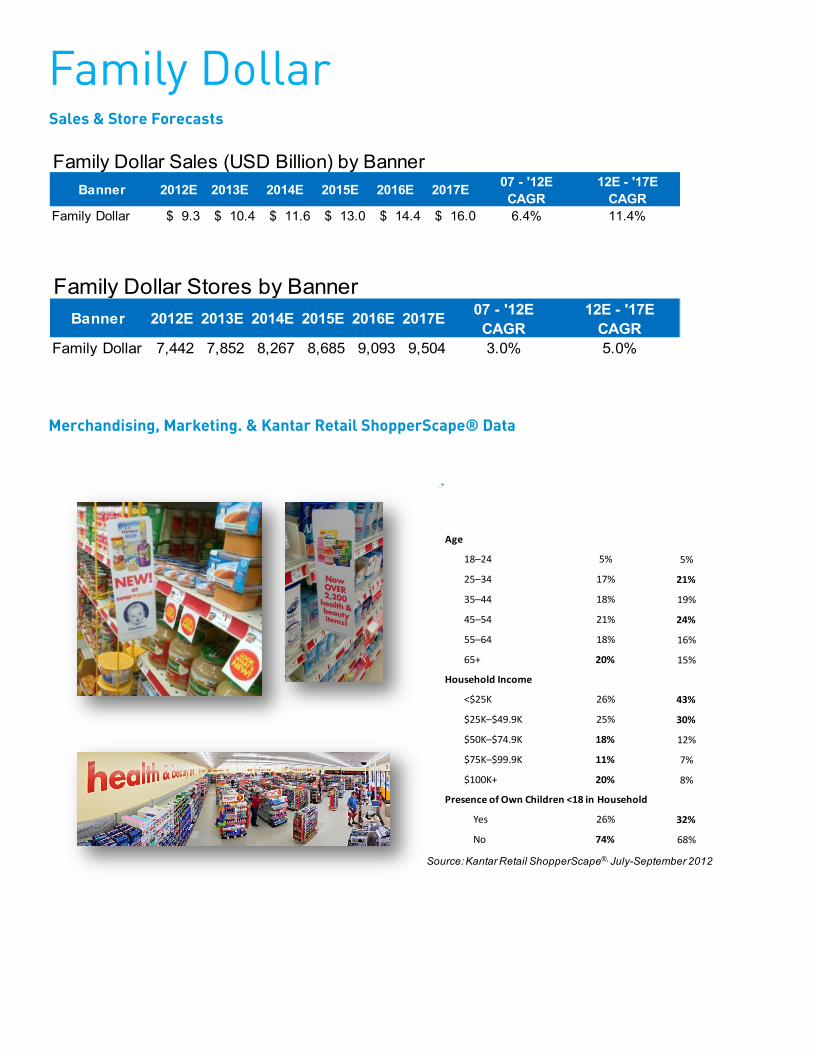
Sales & Store Forecasts
Banner 2012E 2013E 2014E 2015E 2016E 2017E 07 - '12E CAGR
12E - '17E CAGR
Family Dollar $ 9.3 $ 10.4 $ 11.6 $ 13.0 $ 14.4 $ 16.0 6.4% 11.4%
Family Dollar Sales (USD Billion) by Banner
Banner 2012E 2013E 2014E 2015E 2016E 2017E 07 - '12E CAGR
12E - '17E CAGR
Family Dollar 7,442 7,852 8,267 8,685 9,093 9,504 3.0% 5.0%
Family Dollar Stores by Banner
Q3 2012 Shopper Profile
All PrimaryHousehold Shoppers
Monthly Family Dollar
Shoppers
Age
18–24 5% 5%
25–34 17% 21%
35–44 18% 19%
45–54 21% 24%
55–64 18% 16%
65+ 20% 15%
Household Income
<$25K 26% 43%
$25K–$49.9K 25% 30%
$50K–$74.9K 18% 12%
$75K–$99.9K 11% 7%
$100K+ 20% 8%
Presence of Own Children <18 in Household
Yes 26% 32%
No 74% 68%
Source: Kantar Retail ShopperScape®, July-September 2012

Participating Mass Retailers
Key Initiatives�� PFresh
�� 5% Rewards
�� Target Canada
�� CityTarget
�� Multichannel + mobile
Key Players�� Gregg Steinhafel- President & CEO
�� John Mulligan- EVP & CFO
�� Kathee Tesija- EVP Merchandising & Supply Chain
�� Tony Fisher- President, Target Canada
�� Jeff Jones- EVP & CMO
Target
Stengths�� Strong brand & reputation for innovation�� Market positioning leader�� Strong popular exclusive/PL brands�� Good real estate�� Loyal core consumer with higher disposable
income vs. competitors�� Clean stores, wide aisles, very shopable�� Strongly coordinated social media campaign
capabilities�� Excellent reputation for charitable giving
Weaknesses�� Very narrow margin of error, small deviations
become expensive�� Planning calendar can limit ability to make last
minute changes�� Margin implications of growing food share, price
comping, & 5% Rewards�� OOS more problematic with lean inventory
management�� Multichannel integration is still very limited; no
site-to-store yet�� Shopper penetration continues to trend
downward, signaling a shrinking base
Opportunities�� CityTarget format as the base for next wave of US
expansion in urban areas�� Target Canada begins international expansion,
possibility other countries later�� New segmentation processes & tools to optimize
assortment�� Improving shopper visit frequency via food, then
pick up discretionary purchases�� Capturing Millennial shoppers via mobile tools,
social media, & other digital vehicles�� Developing greater multichannel integration
Threats�� Management transitions may lead to uncertainty
on strategic continuity�� Markdown risks with rotational goods,
particularly if the trend is “missed“�� Focus on “best” guests narrows base and
increases exposure to economic effects�� Increasingly tight inventory potentially restrict
sales and limit flexibility �� OOS may frustrate shoppers who may dismiss
PFresh’s fill-in value proposition�� Competitors are further along ideveloping site-
to-store and e-commerce solutions
Target
Merchandising, Marketing. & Kantar Retail ShopperScape® Data
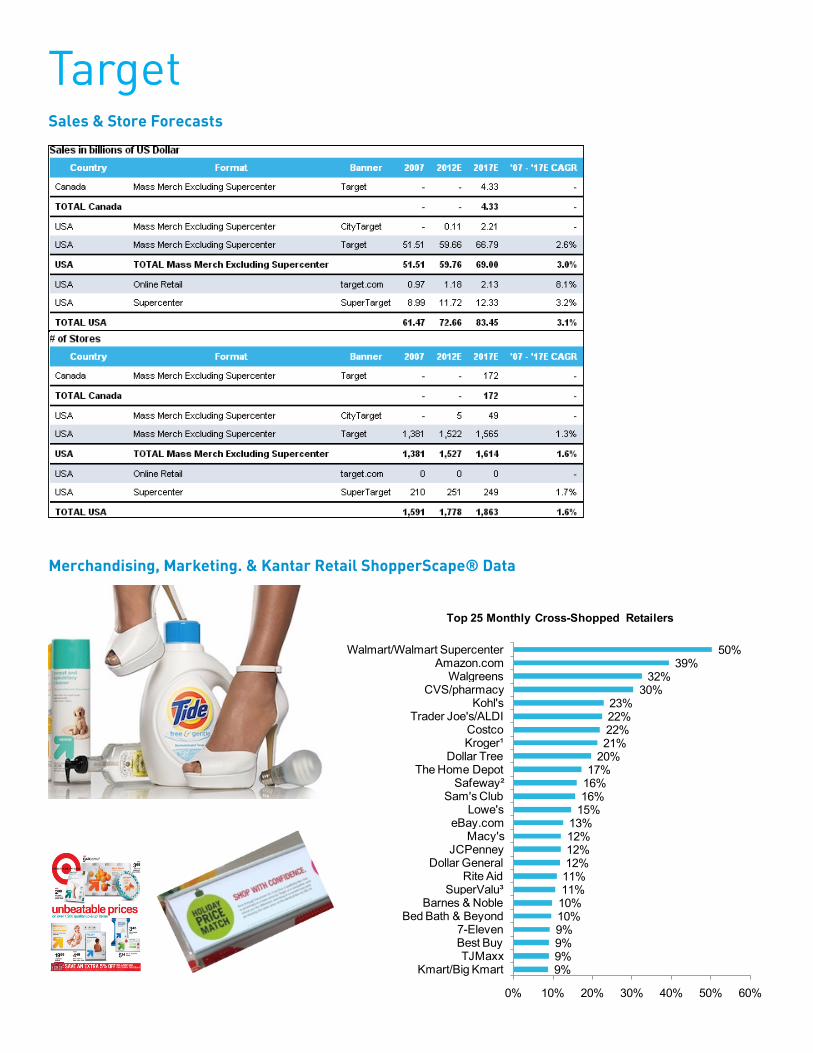
Sales & Store Forecasts
9%9%9%9%10%10%11%11%12%12%12%13%
15%16%16%17%
20%21%22%22%23%
30%32%
39%50%
0% 10% 20% 30% 40% 50% 60%
Kmart/Big KmartTJMaxx
Best Buy7-Eleven
Bed Bath & BeyondBarnes & Noble
SuperValu³Rite Aid
Dollar GeneralJCPenney
Macy'seBay.com
Lowe'sSam's Club
Safeway²The Home Depot
Dollar TreeKroger¹Costco
Trader Joe's/ALDIKohl's
CVS/pharmacyWalgreens
Amazon.comWalmart/Walmart Supercenter
Top 25 Monthly Cross-Shopped Retailers
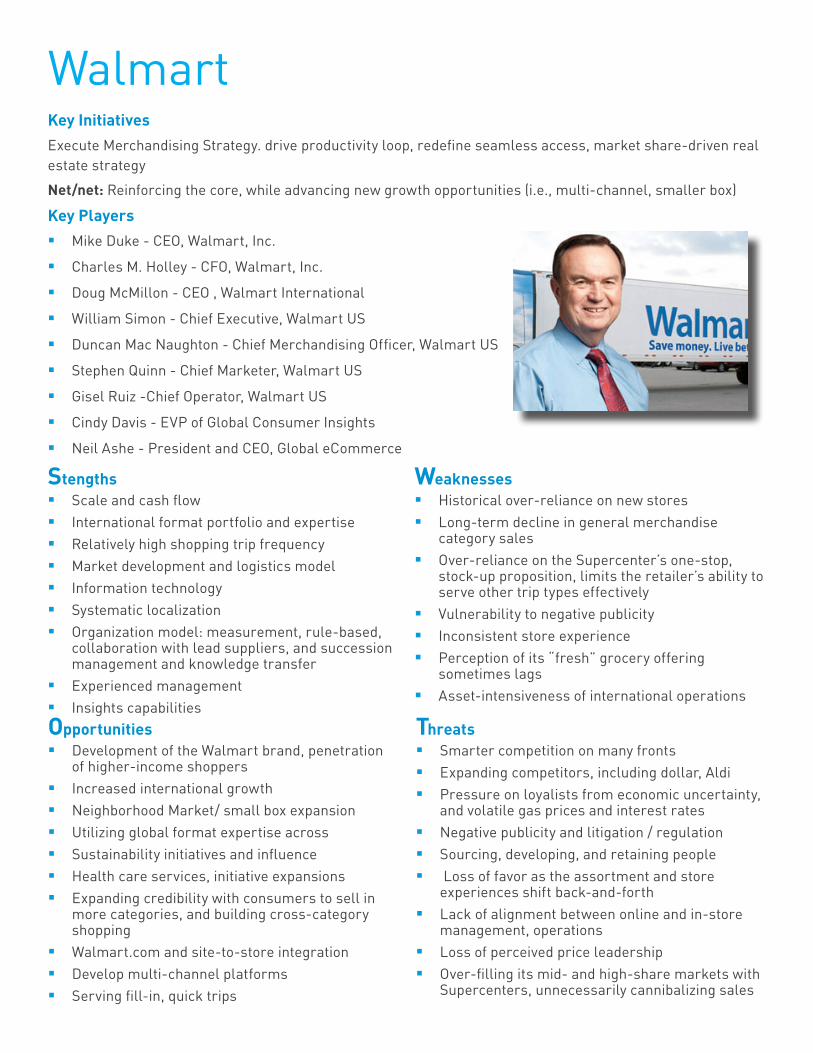
WalmartKey InitiativesExecute Merchandising Strategy. drive productivity loop, redefine seamless access, market share-driven real estate strategy
Net/net: Reinforcing the core, while advancing new growth opportunities (i.e., multi-channel, smaller box)
Key Players�� Mike Duke - CEO, Walmart, Inc.
�� Charles M. Holley - CFO, Walmart, Inc.
�� Doug McMillon - CEO , Walmart International
�� William Simon - Chief Executive, Walmart US
�� Duncan Mac Naughton - Chief Merchandising Officer, Walmart US
�� Stephen Quinn - Chief Marketer, Walmart US
�� Gisel Ruiz -Chief Operator, Walmart US
�� Cindy Davis - EVP of Global Consumer Insights
�� Neil Ashe - President and CEO, Global eCommerce
Stengths�� Scale and cash flow�� International format portfolio and expertise�� Relatively high shopping trip frequency�� Market development and logistics model�� Information technology�� Systematic localization�� Organization model: measurement, rule-based,
collaboration with lead suppliers, and succession management and knowledge transfer
�� Experienced management�� Insights capabilities
Weaknesses�� Historical over-reliance on new stores�� Long-term decline in general merchandise
category sales�� Over-reliance on the Supercenter’s one-stop,
stock-up proposition, limits the retailer’s ability to serve other trip types effectively
�� Vulnerability to negative publicity�� Inconsistent store experience�� Perception of its “fresh” grocery offering
sometimes lags �� Asset-intensiveness of international operations
Opportunities�� Development of the Walmart brand, penetration
of higher-income shoppers�� Increased international growth�� Neighborhood Market/ small box expansion�� Utilizing global format expertise across �� Sustainability initiatives and influence�� Health care services, initiative expansions�� Expanding credibility with consumers to sell in
more categories, and building cross-category shopping
�� Walmart.com and site-to-store integration�� Develop multi-channel platforms �� Serving fill-in, quick trips
Threats�� Smarter competition on many fronts�� Expanding competitors, including dollar, Aldi�� Pressure on loyalists from economic uncertainty,
and volatile gas prices and interest rates�� Negative publicity and litigation / regulation�� Sourcing, developing, and retaining people�� Loss of favor as the assortment and store
experiences shift back-and-forth�� Lack of alignment between online and in-store
management, operations�� Loss of perceived price leadership �� Over-filling its mid- and high-share markets with
Supercenters, unnecessarily cannibalizing sales
Walmart
Merchandising, Marketing. & Kantar Retail ShopperScape® Data
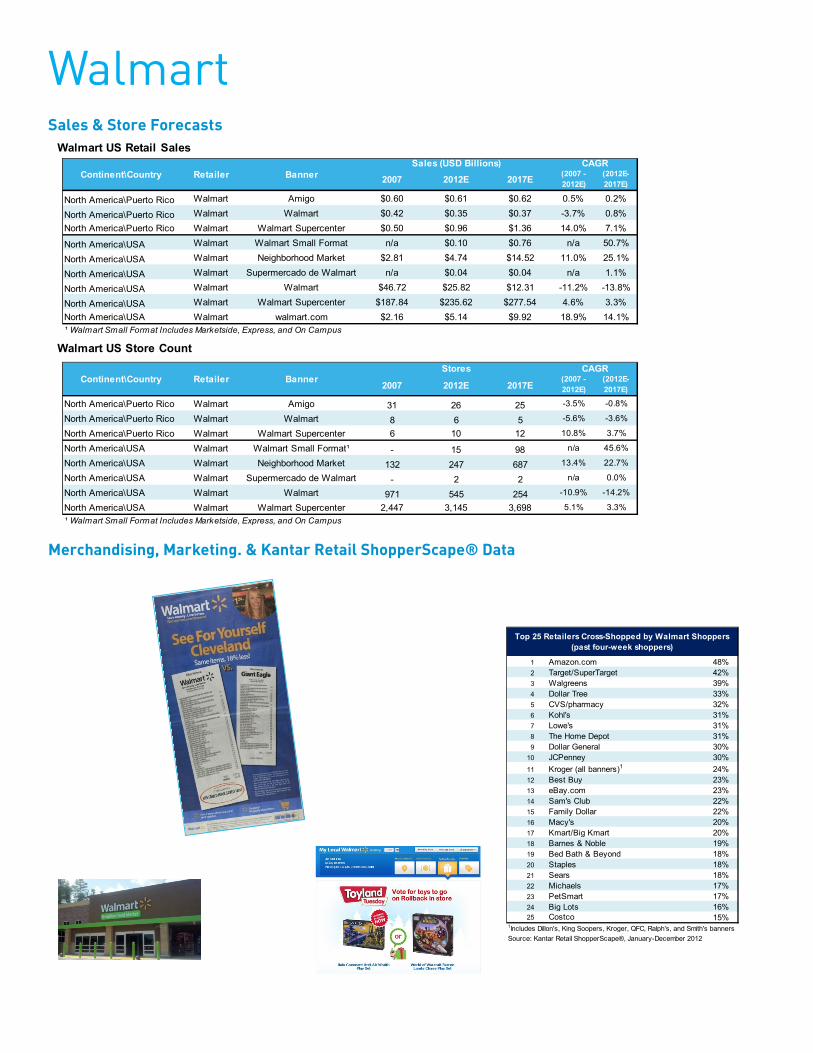
Sales & Store ForecastsWalmart US Retail Sales
Walmart US Store Count
2007 2012E 2017E (2007 - 2012E)
(2012E- 2017E)
North America\Puerto Rico Walmart Amigo $0.60 $0.61 $0.62 0.5% 0.2%
North America\Puerto Rico Walmart Walmart $0.42 $0.35 $0.37 -3.7% 0.8%North America\Puerto Rico Walmart Walmart Supercenter $0.50 $0.96 $1.36 14.0% 7.1%
North America\USA Walmart Walmart Small Format n/a $0.10 $0.76 n/a 50.7%
North America\USA Walmart Neighborhood Market $2.81 $4.74 $14.52 11.0% 25.1%
North America\USA Walmart Supermercado de Walmart n/a $0.04 $0.04 n/a 1.1%
North America\USA Walmart Walmart $46.72 $25.82 $12.31 -11.2% -13.8%
North America\USA Walmart Walmart Supercenter $187.84 $235.62 $277.54 4.6% 3.3%North America\USA Walmart walmart.com $2.16 $5.14 $9.92 18.9% 14.1%¹ Walmart Small Format Includes Marketside, Express, and On Campus
Continent\Country Retailer BannerSales (USD Billions) CAGR
2007 2012E 2017E(2007 - 2012E)
(2012E- 2017E)
North America\Puerto Rico Walmart Amigo 31 26 25 -3.5% -0.8%
North America\Puerto Rico Walmart Walmart 8 6 5 -5.6% -3.6%
North America\Puerto Rico Walmart Walmart Supercenter 6 10 12 10.8% 3.7%
North America\USA Walmart Walmart Small Format¹ - 15 98 n/a 45.6%
North America\USA Walmart Neighborhood Market 132 247 687 13.4% 22.7%
North America\USA Walmart Supermercado de Walmart - 2 2 n/a 0.0%
North America\USA Walmart Walmart 971 545 254 -10.9% -14.2%
North America\USA Walmart Walmart Supercenter 2,447 3,145 3,698 5.1% 3.3%¹ Walmart Small Format Includes Marketside, Express, and On Campus
CAGRContinent\Country Retailer Banner
Stores
1 Amazon.com 48%2 Target/SuperTarget 42%3 Walgreens 39%4 Dollar Tree 33%5 CVS/pharmacy 32%6 Kohl's 31%7 Lowe's 31%8 The Home Depot 31%9 Dollar General 30%
10 JCPenney 30%11 Kroger (all banners)1 24%12 Best Buy 23%13 eBay.com 23%14 Sam's Club 22%15 Family Dollar 22%16 Macy's 20%17 Kmart/Big Kmart 20%18 Barnes & Noble 19%19 Bed Bath & Beyond 18%20 Staples 18%21 Sears 18%22 Michaels 17%23 PetSmart 17%24 Big Lots 16%25 Costco 15%
1Includes Dillon's, King Soopers, Kroger, QFC, Ralph's, and Smith's bannersSource: Kantar Retail ShopperScape®, January-December 2012
Top 25 Retailers Cross-Shopped by Walmart Shoppers (past four-week shoppers)
Participating Club Retailers
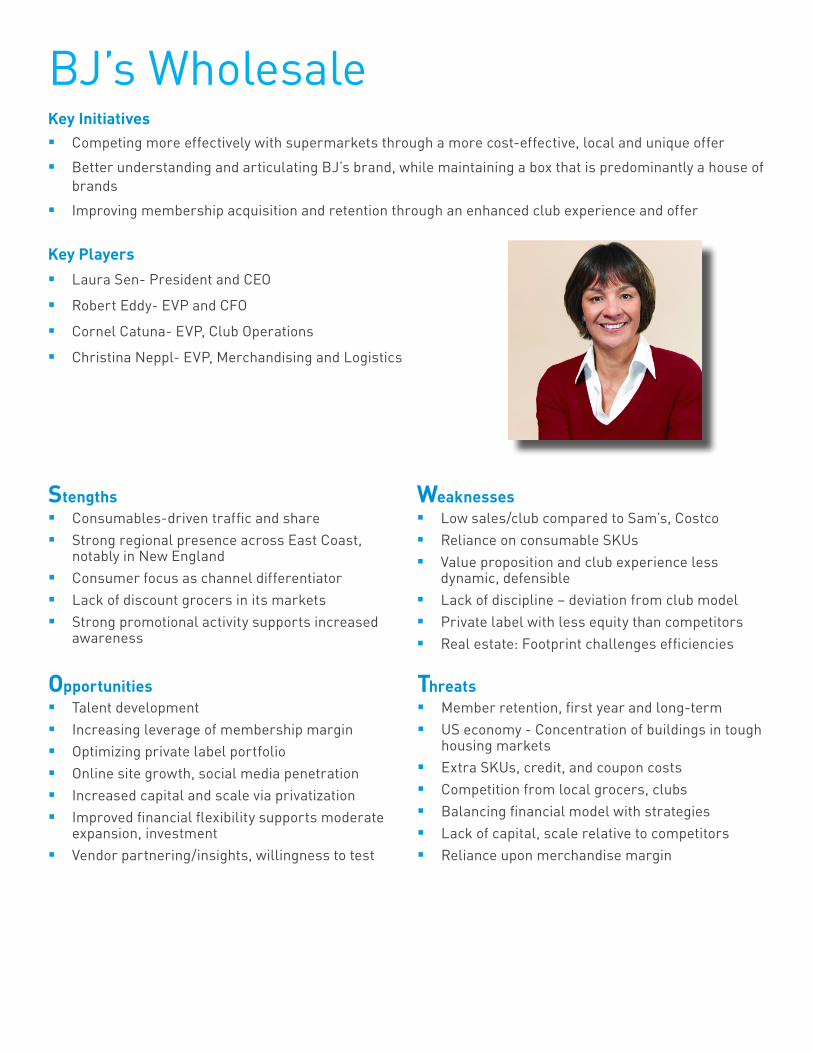
BJ’s WholesaleKey Initiatives�� Competing more effectively with supermarkets through a more cost-effective, local and unique offer
�� Better understanding and articulating BJ’s brand, while maintaining a box that is predominantly a house of brands
�� Improving membership acquisition and retention through an enhanced club experience and offer
Key Players�� Laura Sen- President and CEO
�� Robert Eddy- EVP and CFO
�� Cornel Catuna- EVP, Club Operations
�� Christina Neppl- EVP, Merchandising and Logistics
Stengths�� Consumables-driven traffic and share �� Strong regional presence across East Coast,
notably in New England�� Consumer focus as channel differentiator�� Lack of discount grocers in its markets �� Strong promotional activity supports increased
awareness
Weaknesses�� Low sales/club compared to Sam’s, Costco�� Reliance on consumable SKUs �� Value proposition and club experience less
dynamic, defensible �� Lack of discipline – deviation from club model �� Private label with less equity than competitors �� Real estate: Footprint challenges efficiencies
Opportunities�� Talent development �� Increasing leverage of membership margin �� Optimizing private label portfolio�� Online site growth, social media penetration�� Increased capital and scale via privatization�� Improved financial flexibility supports moderate
expansion, investment �� Vendor partnering/insights, willingness to test
Threats�� Member retention, first year and long-term�� US economy - Concentration of buildings in tough
housing markets�� Extra SKUs, credit, and coupon costs�� Competition from local grocers, clubs�� Balancing financial model with strategies�� Lack of capital, scale relative to competitors�� Reliance upon merchandise margin
BJ’s Wholesale
Merchandising, Marketing. & Kantar Retail ShopperScape® Data
Sales & Store Forecasts
*US only, includes membership fee income
Banner Sales (USD, Billions)*2011 2012E 2013E 2014E 2015E 2016E 2017E
BJs11.7 12.4 13.0 13.7 14.4 15.2 16.0
bjs.com0.1 0.1 0.1 0.1 0.2 0.2 0.2
BannerNumber of Stores
2011 2012E 2013E 2014E 2015E 2016E 2017E
BJs 195 200 205 209 214 219 223
bjs.com 0 0 0 0 0 0 0
Source: Kantar Retail ShopperScape®, January–December 2012
Top Retailers Shopped During Past 4 Weeks, Among Past 4-Week BJ's Shoppers
2012 IndexSample size 2822Walmart / Walmart Supercenter 66% 93Target / SuperTarget 53% 90CVS/pharmacy 56% 109The Home Depot 48% 98Lowe's 39% 102Kohl's 43% 112Walgreens 39% 107Best Buy 32% 90JCPenney 32% 96Staples 35% 105Macy's 34% 104Hallmark 34% 105Amazon.com 56% 174Bed Bath & Beyond 30% 92Rite Aid 28% 96Barnes & Noble 31% 108Toys "R" Us 24% 93eBay.com 26% 105Michaels 25% 105Stop & Shop 23% 98Kmart/Big Kmart 25% 106Dollar Tree 31% 180
CostcoKey Initiatives�� International expansion, especially in Asia and Australia and extending to new markets like France
�� Leveraging health and wellness, to appeal to its aging memberbase as well as its increasingly health conscious shoppers
�� Maximizing the club experience to better attract, engage and retain members
�� Turning more attention to Gen Y, especially ramping up digital strategy to maintain relevance with evolving member preferences, younger member appeals
Key Players�� Craig Jelinek- President and CEO
�� Richard Galanti- EVP and CFO
�� James Murphy- EVP, International
�� Douglas Schutt-EVP, Merchandising
Opportunities�� Co- and multi-vendor branding�� New markets, including online�� Margin enhancement via exclusives �� Going green�� Business focus�� Hispanic, Gen Y and more localized markets �� Collaboration on item innovation�� Refinement of promotional activity
Threats�� Exposure to West Coast given concentration�� Increasing competition, especially from online�� Changing sales mix to more consumables �� Vulnerability to gas, FX�� Sam’s gaining brand strength�� Efficiency management �� Growth of Kirkland Signature brand�� Memberbase potentially aging out of the box
Stengths�� Management continuity �� Adherence to model �� Member loyalty/trust and resilience�� Commitment to members/employees �� American Express partnership�� Resilience across business cycles �� Brand equity, experience and private brand
Weaknesses�� Management continuity�� Pace of decision-making�� Information value chain management�� Reliance on word of mouth�� Adherence to model�� Next generation appeals and relevance�� Convenience in the traditional sense
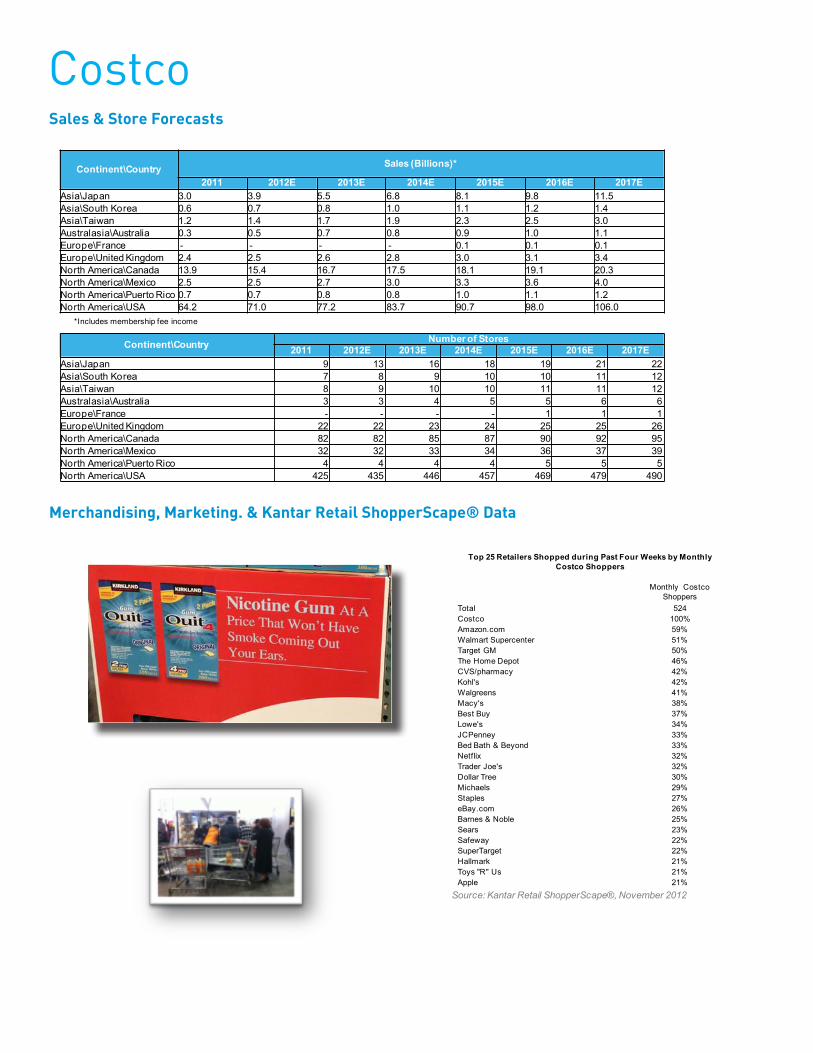
Merchandising, Marketing. & Kantar Retail ShopperScape® Data
Sales & Store Forecasts
Costco
*Includes membership fee income
Continent\Country Sales (Billions)*
2011 2012E 2013E 2014E 2015E 2016E 2017EAsia\Japan 3.0 3.9 5.5 6.8 8.1 9.8 11.5 Asia\South Korea 0.6 0.7 0.8 1.0 1.1 1.2 1.4 Asia\Taiwan 1.2 1.4 1.7 1.9 2.3 2.5 3.0 Australasia\Australia 0.3 0.5 0.7 0.8 0.9 1.0 1.1 Europe\France - - - - 0.1 0.1 0.1 Europe\United Kingdom 2.4 2.5 2.6 2.8 3.0 3.1 3.4 North America\Canada 13.9 15.4 16.7 17.5 18.1 19.1 20.3 North America\Mexico 2.5 2.5 2.7 3.0 3.3 3.6 4.0 North America\Puerto Rico 0.7 0.7 0.8 0.8 1.0 1.1 1.2 North America\USA 64.2 71.0 77.2 83.7 90.7 98.0 106.0
Continent\Country Number of Stores2011 2012E 2013E 2014E 2015E 2016E 2017E
Asia\Japan 9 13 16 18 19 21 22Asia\South Korea 7 8 9 10 10 11 12Asia\Taiwan 8 9 10 10 11 11 12Australasia\Australia 3 3 4 5 5 6 6Europe\France - - - - 1 1 1Europe\United Kingdom 22 22 23 24 25 25 26North America\Canada 82 82 85 87 90 92 95North America\Mexico 32 32 33 34 36 37 39North America\Puerto Rico 4 4 4 4 5 5 5North America\USA 425 435 446 457 469 479 490
Top 25 Retailers Shopped during Past Four Weeks by Monthly Costco Shoppers
Monthly Costco Shoppers
Total 524Costco 100%Amazon.com 59%Walmart Supercenter 51%Target GM 50%The Home Depot 46%CVS/pharmacy 42%Kohl's 42%Walgreens 41%Macy's 38%Best Buy 37%Lowe's 34%JCPenney 33%Bed Bath & Beyond 33%Netflix 32%Trader Joe's 32%Dollar Tree 30%Michaels 29%Staples 27%eBay.com 26%Barnes & Noble 25%Sears 23%Safeway 22%SuperTarget 22%Hallmark 21%Toys "R" Us 21%Apple 21%
Source: Kantar Retail ShopperScape®, November 2012
Sam’s ClubKey Initiatives�� Leading in Digital, as the most tech- and digital-savvy of the clubs, Sam’s goal is get and stay ahead of the
pack here
�� Leveraging health and wellness and services, to appeal to aging and health conscious shoppers while maximizing its member value proposition
�� Better engaging members, across platforms and boundaries by increasingly integrating online and mobile with the box
�� Maximizing member insights, to better understand , attract, retain and appeal to club shoppers and prospective members
Key Players�� Rosalind Brewer – President and CEO
�� Charles Redfield, EVP, Merchandising
�� Todd Harbaugh, EVP, Operations
�� John Boswell, SVP Marketing, Member Insights, and eCommerce
�� Michael Dastugue, SVP, CFO
�� Don Frieson, SVP, Replenishment and Planning
Opportunities�� Personalized promotions via Instant Savings�� Expanded marketing efforts to build engagement,
especially via new media, H&W�� Sustainability as emotional connector and for
added efficiencies�� Growing private label penetration�� Format innovation to target specific subgroups�� “Gen Y” family formation = rising audience
Threats�� Price perception versus key club competitors�� Competition from other channel retailers, such as
mass and online, esp. Amazon�� Significant shopper overlap with Walmart�� Channel blurring in club packs with Walmart�� Newer senior leaders risk not foreseeing nuanced
challenges to implementing change�� Growing private label penetration�� Straying too far from the club model
Stengths�� Insights and analytics capabilities�� Walmart corporate oversight, resources�� Digital platforms and capabilities�� Fresh leadership talent�� Aligned mission, clear go-to-market strategy�� Vendor collaboration�� Openness to testing and implementing novel
marketing and merchandising approaches
Weaknesses�� Low membership renewal, growth rates�� Sales per club – asset productivity�� SKU productivity performance�� Confusion due to historical pendulum swings
between business & individual member focus�� Inconsistency of format locations, in-club
presence, and sales volumes across US�� Underdeveloped private brand equity
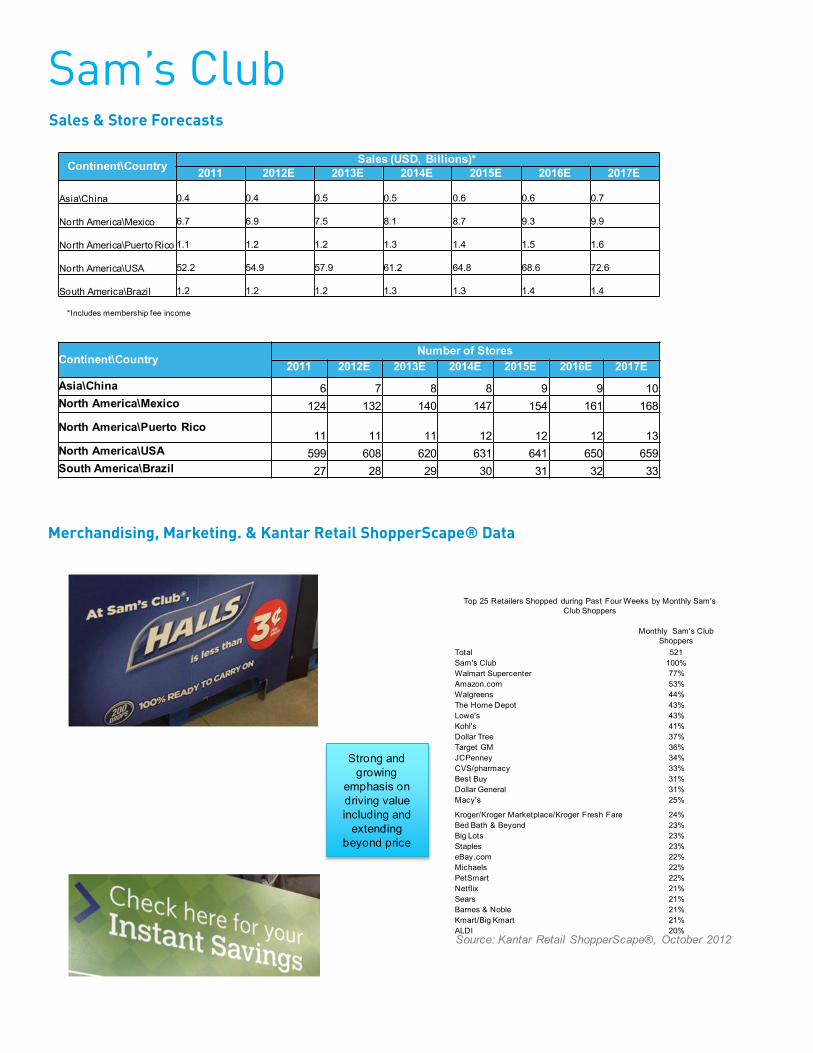
Merchandising, Marketing. & Kantar Retail ShopperScape® Data
Sales & Store Forecasts
Sam’s Club
*Includes membership fee income
Continent\Country Sales (USD, Billions)*2011 2012E 2013E 2014E 2015E 2016E 2017E
Asia\China 0.4 0.4 0.5 0.5 0.6 0.6 0.7
North America\Mexico 6.7 6.9 7.5 8.1 8.7 9.3 9.9
North America\Puerto Rico 1.1 1.2 1.2 1.3 1.4 1.5 1.6
North America\USA 52.2 54.9 57.9 61.2 64.8 68.6 72.6
South America\Brazil 1.2 1.2 1.2 1.3 1.3 1.4 1.4
Continent\CountryNumber of Stores
2011 2012E 2013E 2014E 2015E 2016E 2017EAsia\China 6 7 8 8 9 9 10North America\Mexico 124 132 140 147 154 161 168
North America\Puerto Rico11 11 11 12 12 12 13
North America\USA 599 608 620 631 641 650 659South America\Brazil 27 28 29 30 31 32 33
Strong and growing
emphasis on driving value including and
extending beyond price
Top 25 Retailers Shopped during Past Four Weeks by Monthly Sam's Club Shoppers
Monthly Sam's Club Shoppers
Total 521Sam's Club 100%Walmart Supercenter 77%Amazon.com 53%Walgreens 44%The Home Depot 43%Lowe's 43%Kohl's 41%Dollar Tree 37%Target GM 36%JCPenney 34%CVS/pharmacy 33%Best Buy 31%Dollar General 31%Macy's 25%
Kroger/Kroger Marketplace/Kroger Fresh Fare 24%Bed Bath & Beyond 23%Big Lots 23%Staples 23%eBay.com 22%Michaels 22%PetSmart 22%Netflix 21%Sears 21%Barnes & Noble 21%Kmart/Big Kmart 21%ALDI 20%Source: Kantar Retail ShopperScape®, October 2012

Jessica Campbell / Drug Retailers [email protected] / 617.912.2874
Mike Pagalia / Supermarket + Value RetailersSenior [email protected] / 617.912.2855Alida Destrempe / Supermarket [email protected] / 614.355.4030Sara Al-Tukhaim / Club RetailersPrincipal [email protected] / 617.912.2859Robin Sherk / WalmartDirector, Retail [email protected] / 212.896.8191Amy Koo / TargetSenior [email protected] / 617.912.2872Rachel McGuire/ Shopper DataSenior [email protected] / 614.355.4036Kate Senzamici/ Shopper [email protected] / 617.912.2866
Bryan Gildenbert Chief Knowledge [email protected] / 617.912.2862
Authors + Contributors
Kantar Retail501 Boylston Street, Suite 6101Boston, MA 02116www.kantarretail.comwww.kantarretailiQ.comT 617 912 2828F 630 245 5647
Sources: Kantar Retail analysis, KRiQ, Kantar Retail ShopperScape® NACDS, company reports + material