Embed Size (px)
Citation preview

N°44 May 2014
EX-POST EVALUATION OF THE KYOTO PROTOCOL:
FOUR KEY LESSONS FOR THE 2015 PARIS AGREEMENT
Romain Morel1 and Igor Shishlov2
Signed in 1997, following the 1992 United Nations Framework Convention on Climate Change
(UNFCCC), the Kyoto Protocol (KP) is the first international tool focused on greenhouse gas (GHG)
mitigation involving as many countries: in its final configuration, thirty-six developed countries
committed to reduce their emissions by 4% between 1990 and 2008-2012 – the first commitment
period (CP1). In April 2014, the data from the CP1 was officially published. This report thus presents
the first comprehensive ex-post analysis of the first period of the KP.
In terms of emission reductions – and the effectiveness of the agreement – countries party to the
protocol globally surpassed their commitment reducing their emissions by 24%. While positive, this
“overachievement” appears to be mainly due to the highly-criticized “hot air” – or the emission
reductions that already occurred in economies in transition before 1997 – equivalent to 18.5% of total
base-year emissions. Nevertheless, other developed countries would have complied even without the
“hot air”, as they have globally seen economic growth coupled with declining emissions. This low-
carbon growth can be explained by better primary energy-mix, the continued expansion of the service
sector, declining GHG intensity of industries and outsourcing the production of goods overseas.
Despite a low need to use flexibility mechanisms, KP countries actively embraced all of them.
Based on the results of this report, it is possible to draw four key lessons from the Kyoto experience for
the establishment of a new global agreement that is expected to be signed in Paris in 2015:
1. The GHG emission coverage of the KP was insufficient to stop the growth of global GHG emissions.
Thus, expanding the coverage is a priority. The KP included rules tailored for specific sectors’ or
countries’ contexts that helped ensure their participation. In that perspective, it can be strategic to
implement specific rules as long as it does not jeopardize the global environmental integrity.
2. The KP is presented as an internationally binding agreement on GHG emissions. However, its
binding nature is rather limited and virtual in practice. Extensive negotiations and resources were
dedicated in demarcating the boundaries of compliance and dedicated tools that in some instances
were not really used by countries. Dedicating significant negotiation resources and time, as it has been
the case until now, on emissions reduction commitments and their legally binding nature may thus not
be the most efficient approach.
3. Implementing Monitoring, Reporting and Verification (MRV) procedures is essential to build trust
among countries and to recognize various domestic policies implemented. Therefore, it is an essential
characteristic for any global agreement on climate change. The KP initiated the development and
implementation of several MRV frameworks providing reliable and transparent information on GHG
emissions and emission reductions.
4. Flexibility should be integrated both in the adoption process and the agreement itself. Similar to the
KP, a new treaty could be adopted in two steps: a framework agreement in Paris and eventually the
detailed rules and mechanisms in the following years.
1 CDC Climat Research, [email protected]
2 CDC Climat Research, [email protected]

Climate Report n°44 – Ex-post evaluation of the Kyoto protocol:
Four key lessons for the 2015 Paris Agreement
2
ACKNOWLEDGEMENTS
The authors would like to thank all those who helped with preparing this report and in
particular Yves André (CDC), Cécile Hanoune (European Commission), Sylvie Lemmet,
Dimitar Nikov, Baptiste Perrissin-Fabert, Paul Watkinson (French Ministry of Environment)
and Thomas Roulleau (French Ministry of Finance) for their precious technical inputs and
clarifications provided. They also deeply thank Valentin Bellassen (CDC Climat Research)
for his valuable inputs and challenging ideas.
The authors take sole responsibility for findings or ideas presented in this report as
well as any errors or omissions.
Publication director: Benoît Leguet - ISSN 2101-4663
To receive regular updates on our publications, send your contact information to [email protected]
Press contact: Maria Scolan - + 33 1 58 50 32 48 - [email protected]
This publication is fully-funded by Caisse des Dépôts, a public institution. CDC Climat does not contribute to the financing of
this research.
Caisse des Dépôts is not liable under any circumstances for the content of this publication.
This publication is not a financial analysis as defined by current regulations.
The dissemination of this document does not amount to (i) the provision of investment or financial advice of any kind, (ii) or of
an investment or financial service, (iii) or to an investment or financial proposal of any kind.
There are specific risks linked to the markets and assets treated in this document. Persons to whom this document is directed
are advised to request appropriate advice (including financial, legal, and/or tax advice) before making any decision to invest in
said markets.
The research presented in this publication was carried out by CDC Climat Research on an independent basis. Organisational
measures implemented at CDC Climat have strengthened the operational and financial independence of the research
department. The opinions expressed in this publication are therefore those of the employees of CDC Climat Research alone,
and are independent of CDC Climat’s other departments, and its subsidiaries.
The findings of this research are in no way binding upon, nor do they reflect, the decisions taken by CDC Climat’s operational
teams, or by its subsidiaries. CDC Climat is not a provider of investment or financial services.

Climate Report n°44 – Ex-post evaluation of the Kyoto protocol:
Four key lessons for the 2015 Paris Agreement
3
TABLE OF CONTENTS
TABLE OF CONTENTS 3
INTRODUCTION 4
I. COUNTRIES HAVE GLOBALLY FULFILLED THEIR MITIGATION TARGET UNDER THE KYOTO
PROTOCOL 5
A. Countries participating in the KP have reduced their emissions by 24%, surpassing their commitment
of a 4% decrease 5
B. Emission reductions can be explained by structural changes in the economies of industrialized
countries and minor changes in their energy mix 11
II. COUNTRIES EMBRACED ALL FLEXIBILITY MECHANISMS, ALBEIT USING DIFFERENT
STRATEGIES 15
A. Thanks to the “Bubbling”, all countries are in a position to comply with their commitments 15
B. The trade of carbon units was mainly driven by European companies thanks to the EU ETS 17
C. Japan and New Zealand, two ways of building domestic policies using the Kyoto Protocol framework
22
D. Eastern European countries attempted to maximize the economic benefits of the surplus 23
III. DOHA DECISIONS HAVE SOFTENED THE IMPACT ON THE CP2 OF THE
OVERACHIEVEMENT UNDER THE CP1 BUT MAY NOT HAVE BEEN SUFFICIENT 26
A. Countries will be able to carry-over up to 7 billion units but private entities may lose around 70 million
units 26
B. If it wants to use its surplus, Ukraine should officially review its commitment 28
CONCLUSION AND POLICY LESSONS FOR AN INTERNATIONAL AGREEMENT IN 2015 30
APPENDICES 32
REFERENCES 35
LATEST PUBLICATIONS IN CDC CLIMAT’S “CLIMATE REPORTS” SERIES 37

Climate Report n°44 – Ex-post evaluation of the Kyoto protocol:
Four key lessons for the 2015 Paris Agreement
4
INTRODUCTION
The Kyoto Protocol, which was adopted in 1997, is the first and so far the only tool dedicated to tackling
the issue of anthropogenic climate change at a global level. It follows the 1992 United Nations Framework
Convention on Climate Change (UNFCCC). The Kyoto Protocol established greenhouse gas (GHG)
emissions reduction targets for 37 developed countries and economies in transition – Annex B parties to
the Protocol3 – which pledged to reduce their total GHG emissions during the first Kyoto commitment
period (2008-2012) by 5% compared to the 1990 baseline. These mitigation targets are enounced in
countries’ emissions quotas – Assigned Amount Units (AAU). Besides the emissions reduction targets,
the Kyoto Protocol incorporated so-called “flexibility mechanisms” aimed at containing the cost of
compliance:
“Bubbling” (article 4 of the Protocol) allows a group of Annex B countries to take a collective GHG
emissions reduction commitment and then to share it among them, as it was done by the
European Union countries;
Joint Implementation (JI, Article 6 of the Protocol) allows Annex B countries to offset their
emissions by investing into emission reductions projects in other Annex B countries. JI projects,
thus, generate Emission Reduction Units (ERU), which have to be converted from the AAUs of
the host country. Therefore, JI does not affect the total cap of Annex B countries, but only
redistributes the emissions reduction efforts among them.
Clean Development Mechanism (CDM, Article 12 of the Protocol) allows Annex B countries to
offset their emissions by investing into emissions reduction projects in non-Annex B countries,
which do not have emission caps. Emission reductions from these projects have to be “additional
to any that would occur in the absence of the certified project activity” (Kyoto Protocol 1997). The
CDM projects, thus, generate Certified Emission Reductions (CER) – carbon credits that can be
used by Annex B countries for compliance with their Kyoto targets in addition to their AAUs.
International Emissions Trading (IET, Article 17 of the Protocol) allows Annex B countries to
directly trade their AAUs. Thus, IET does not affect the total cap of Annex I countries, but only
redistributes the AAUs among them. AAU transactions are overseen by the UNFCCC through the
International Transaction Log (ITL).
The roots of the Kyoto Protocol date back to 1992 when the United Nations Framework Convention on
Climate Change (UNFCCC) was adopted at the “Earth Summit” in Rio de Janeiro. The most notable
package of rules for the implementation of the Kyoto Protocol was established at the seventh Conference
of the Parties to the UNFCCC (COP7) in Marrakech in 2001, and is therefore often referred to as the
“Marrakesh Accords”. In order for the Kyoto Protocol to enter into force, at least 55 Annex B countries,
responsible for at least 55% of the CO2 emissions of all Annex B countries in 1990, had to be covered by
instruments of ratification. After the withdrawal of the USA from the Kyoto Protocol, its ratification by
Russia was crucial for reaching this threshold, which eventually happened in 2005. The first Commitment
Period (CP1) spanned from 2008 through 2012 and the roadmap to negotiate a new climate treaty to
succeed the Kyoto Protocol after the end of the CP1 was adopted at the COP13 in Bali in 2007.4 The
COP15 that took place in Copenhagen in 2009 however failed to produce a new agreement and the CP2
(2013-2020) was consequently agreed upon at the COP17 in Durban in 2011 while the implementation
details were signed at the COP18 in Doha in 2012. According to the “Durban Platform”, the new
international climate agreement is planned to be adopted at the COP21 in Paris in 2015 and enter into
force in 2020 (Figure 0-1).
3 Annex B refers to the annex to the Kyoto Protocol, while Annex I refers to the annex to the UNFCCC. Both annexes include
developed countries and economies in transition that have binding emission reduction targets. In order to avoid confusion only
the term “Annex B” will be used throughout this paper. See Appendix 2 for the list of Annex B countries.
4 The negotiations about the second commitment period (CP2) of the Kyoto Protocol started in Montreal in 2005.

Climate Report n°44 – Ex-post evaluation of the Kyoto protocol:
Four key lessons for the 2015 Paris Agreement
5
Figure 0-1 – Key milestones in international climate negotiations
Source: CDC Climat Research.
The CP1 under the Kyoto Protocol ended on 31 December 2012; however, complete and detailed official
data regarding the countries’ emissions and transactions of carbon credits in 2008-2012 was not available
until April 2014. This data now makes it possible to conduct a comprehensive ex-post analysis of the
Kyoto Protocol and draw lessons for the new international climate treaty, which is the main objective of
this research report.
The paper is structured as follows: section I analyses the fulfillment of the emissions reduction targets
under the Kyoto Protocol and explains the underlying causes, section II reviews the use of the Kyoto
flexibility mechanisms and different countries’ compliance strategies, while section III looks at the CP2
and implications of the Doha Amendments for the Protocol. Conclusions are organized to highlight
lessons that can be drawn from the KP experience for a new global agreement expected in Paris in 2015.
I. COUNTRIES HAVE GLOBALLY FULFILLED THEIR MITIGATION TARGET UNDER THE KYOTO PROTOCOL
A. Countries participating in the KP have reduced their emissions by 24%, surpassing the initial
commitment of a 4% decrease
Under the Kyoto Protocol, thirty-eight developed countries – accounting for 39% of 2010 global GHG
emissions – committed to a 5% decrease of their emissions between 2008 and 2012 in comparison with
their base-year emissions – most often 1990. With the non-ratification of the KP by the USA and
withdrawal of Canada, the commitment of the 36 remaining countries – accounting for 24% of global GHG
emissions in 2010 – is equivalent to a 4% decrease of their emissions.
The majority of countries reduced their emissions more than required
Among the 36 countries that fully participated to the first commitment period of the Kyoto Protocol (CP1),
only eight countries emitted higher levels of GHGs than initially committed (Figure I-1). These countries
represented 20% of emissions of Annex B-20125 countries during the CP1. Thus, to comply with their
commitment, they had to use the flexibility mechanisms (see section II).
Furthermore, all “economies in transition” (EIT) countries reduced their emissions more than committed.
The resulting surplus allowances are often called “hot air” as the majority of these emission reductions
occurred before 1997 (Figure I-2). Even though these emission reductions are not due to the Kyoto
Protocol, they result from strong changes in these countries’ economies (see below). The two countries
that eventually did not participate in the KP – the USA and Canada – have higher emissions than their
target.
At a broader level, the underachievement of some countries is more than offset by other KP-countries.
This result is true even without accounting for the surplus from EITs. The emissions data show also that,
even if the USA and Canada had participated in the KP, developed countries would have globally
complied with their commitments (Figure I-1).
5 Annex B countries as of 31 December 2012, i.e. excluding the USA and Canada.

Climate Report n°44 – Ex-post evaluation of the Kyoto protocol:
Four key lessons for the 2015 Paris Agreement
6
Figure I-1 – 2008-2012 emissions compared with targets under the Kyoto Protocol by country
Note: The emission data include the LULUCF with the application of articles 3.3, 3.4 and 3.7 of the Kyoto Protocol as it is
reported in countries’ inventories
Source: CDC Climat Research calculations based on UNFCCC and national inventories data.
Climate Report n°44 – Ex-post evaluation of the Kyoto protocol:
Four key lessons for the 2015 Paris Agreement
7
“Hot air” and the non-participation of the USA and Canada reduced the need for further
efforts6
Usually, the overachievement of the global Kyoto target is explained by three main factors:
1. “Hot air” from economies in transition;
2. The non-participation of the USA and Canada;
3. The international economic crisis that decreased GHG emissions.
On the one hand, in 1997, negotiators were aware of the “hot air” and expected large transfers of units
between the USA and EITs. On the other hand, the non-participation of the USA and the withdrawal of
Canada were allowed under the Kyoto Protocol. Thus, it is possible to assess the decisions made during
the Kyoto conference surrounding factors 1 and 2.
Concerning factor 1, Figure I-2 shows that most of emissions reductions occurred in EITs before 1997.
Thus, to cancel the “hot air” effect, we “cancel” the emission reductions that occurred in EITs before
1997.7 The value of the “hot air” is then the difference of emissions between base-year emissions and
1997 in EITs, totaling 2.22 GtCO2e per annum.
This cancellation is translated in a new KP target, artificially decreasing the annual cap by 2.22 GtCO2e
per annum. It illustrates a new target integrating already-achieved emission reductions when the KP was
signed. While for Annex B-2012 countries, the official target is -4%, the target cancelling hot air would
have been -22.5%.
Figure I-2 – Evolution of absolute annual emissions for KP countries
Reading notes: All Annex B-2012 emissions for the base-year are represented in purple with diagonal lines. 1997 emissions
for these countries were 9.7 GtCO2e and annual emissions decreased by 2.22 GtCO2e in EITs and by 0.08 GtCO2e in other
countries between the base-year and 1997.
Source: CDC Climat Research calculations based on UNFCCC and national inventories data.
Figure I-2 illustrates that in case of cancelling hot air, a very small amount (32 MtCO2e) of further
emissions reductions would have been needed by KP countries to comply. Adding the LULUCF rules (see
p.8) would be enough to make KP countries globally compliant in case of cancelling “hot air”. Moreover,
the CDM would have further reinforced the compliance by adding new units (see section II).
Concerning factor 2, as seen in Figure I-3, if all the initial signatories would have participated in the KP,
the global emission reduction objective would have already been achieved in 1997 at the moment of
6 For methodological reasons and issues with the lack of data, this section does not take into account the LULUCF emissions.
As shown on p. 9, this estimate should not have a significant impact on the overall global balance.
7 It is coherent with the fact that the KP was signed in 1997 and it is approximately the date when the GDP of EITs started to
recover.

Climate Report n°44 – Ex-post evaluation of the Kyoto protocol:
Four key lessons for the 2015 Paris Agreement
8
signature. As emissions increased to 2007, these countries would have had just to stabilize emissions
levels, at the beginning of the CP1 to comply. Moreover, in case of participation of the USA and Canada,
the 2008-2009 crisis would have given a comfortable margin to countries. Nevertheless, in terms of the
compliance of individual countries, this would have required significant transfers of carbon units between
countries (see Figure I-1).
Figure I-3 also shows that the cancellation of “hot air” would have necessitated substantial further efforts
from countries to comply globally. Indeed, the deficit of carbon quotas would have been around
1.2 GtCO2e per year on average, representing 6.4% of base-year emissions. In its current development
level, the CDM would not have been sufficient to satisfy this demand of credits.
The 2008-2009 crisis had a comparable impact on developed countries emissions to the fall of the USSR:
annual emissions declined by 1.5 GtCO2e in developed countries between 2007 and 2009 while annual
emissions declined by 2.22 GtCO2e in EITs between the base-year and 1997.
Thus, four ex-post lessons can be extracted from this analysis:
1. As soon as the “hot air” was included, the participation of North-American countries was essential
but not sufficient to make the KP’s target lower than business-as-usual (BAU) emissions;
2. If North-American countries had participated, the unplanned crisis would have given a margin to
countries. Thus, no further efforts above those realized would have been needed;
3. In order to globally trigger further efforts than observed, it would have been necessary to –
partially or totally – cancel the “hot air” by setting more ambitious mitigation targets to EITs;
4. Fixing absolute reduction targets leaves the system vulnerable to the impact of economic shocks
even for developed countries.
Figure I-3 – Absolute annual evolution of emissions for KP countries including the USA and
Canada
Source: CDC Climat Research calculations based on UNFCCC and national inventories data.
One of the data that was obviously not available in 1997 was the evolution of emissions between 1997
and 2007 and especially the impact of the recovery of former USSR and Eastern European countries. The
generosity of the “hot air” would have been limited by rising GHG emissions in EITs. The rise of GHG
emissions in EITs has eventually been limited, especially compared with the growth of emissions in North-
American countries during the same period.
While specific accounting rules may be game-changing at the country level, the global
impact was limited
When the Kyoto Protocol was signed in 1997, the accounting rules for Land-Use, Lad-Use Change and
Forestry (LULUCF) emissions were not finalized. Nevertheless, their inclusion in the KP was made
through the articles 3.3, 3.4 and 3.7.

Climate Report n°44 – Ex-post evaluation of the Kyoto protocol:
Four key lessons for the 2015 Paris Agreement
9
Article 3.4 allows countries to optionally include in their national inventories the carbon emissions and
sequestration related to the management of forests, croplands and grasslands. In practice, this mainly
concerns forests and includes all changes in the carbon stocks of lands that have been forests since
1990. The Kyoto Protocol caps the quantity of Removal Units (RMUs) that a country can receive from a
positive "3.4 budget", in principle to factor out effects linked to the normal aging of forests and the
acceleration of their growth because of climate change. In practice however, the generosity of this cap is
not clearly related to these effects.
Article 3.3 requires an accounting for emissions and sinks linked to reforestation and deforestation
resulting in land use changes. The net variation between 2008 and 2012 of the carbon stock of these
lands, the use of which has changed since 1990, constitutes the "3.3 budget".
Article 3.7 only concerns countries for which LULUCF was a net source of emissions in 1990. For these
countries, LULUCF emissions in 1990 give right to AAUs as well as for other sectors. In principle, this was
intended to reward a potential decrease in LULUCF emissions over the CP1.
Only 5 countries decided to use article 3.7: Australia, Ireland, the Netherlands, Portugal and the United
Kingdom. Australia and Portugal benefited the most from this article – an increase of 31.6% and 1.6% of
their base-year emissions respectively while it was negligible (<0.1%) for the three other countries.
To assess the impact of LULUCF rules, we compared the evolution of emissions excluding LULUCF with
the position of countries including all Kyoto rules (Figure I-4). We observe that LULUCF articles were
game-changing for a few countries. In particular, Australia, Italy, New Zealand and Slovenia become
compliant thanks to the integration of LULUCF emissions.
The impact of LULUCF rules is beneficial for most countries. At the global level, emissions excluding
LULUCF decreased by -21.4% in Annex B-2012 countries while emissions including KP LULUCF rules
decreased by -24.3%. LULUCF rules’ impact on the general balance of the Kyoto Protocol is therefore
limited. The difference is roughly 70% due to the article 3.4 and 30% due to the article 3.7. The aggregate
contribution of the article 3.3 is almost neutral.
On the global scale LULUCF emission reductions were less valued with KP rules than with usual
accountability in UNFCCC inventories for Annex B-2012 countries. However, certain countries have been
largely advantaged – such as New Zealand – or largely disadvantaged – such as Latvia by the KP rules
compared with the classical accountability of LULUCF in UNFCCC inventories (Figure I-5).
The decision 14/CP7 (see Box I-1), tailor-made for small countries, have also a global limited impact even
if it enables Iceland to be compliant without the use of flexibility mechanisms.
Box I-1 – A decision enables Iceland not to report 14% of its emissions
In Marrakech, at the COP7, the decision 14/CP7 introduced an exemption:
Iceland did not report on average 0.66 Mt CO2e/year, representing 14% of its emission excluding
LULUCF, for 4 installations under this rule. This exemption could have concerned up to 26% of Iceland’s
emissions. Without this decision, Iceland would need to purchase carbon units to comply with its KP
commitment. Monaco also originally planned to use this decision but there is no reference about it in its
National Inventory Reports.
Source: Decision 14/CP7 (http://unfccc.int/resource/docs/cop7/13a01.pdf), Submissions from Monaco and Iceland
(http://unfccc.int/resource/docs/cop8/misc02.pdf) and Iceland’s National Inventory Reports.
“for the first commitment period, industrial process carbon dioxide emissions from a single project
which adds in any one year of that period more than 5 per cent to the total carbon dioxide
emissions in 1990 of a Party listed in Annex B to the Protocol shall be reported separately and
shall not be included in national totals to the extent that it would cause the Party to exceed its
assigned amount”

Climate Report n°44 – Ex-post evaluation of the Kyoto protocol:
Four key lessons for the 2015 Paris Agreement
10
Figure I-4 – Impact of LULUCF rules under the Kyoto Protocol on the achievement of emissions
targets
Notes: LULUCF was not integrated for USA and Canada as those countries did not provide any LULUCF-related information
under KP. A large black bar on the left side or below of a grey bar, means that the given country could be compliant without
the use of flexibility mechanisms.
Source: CDC Climat Research calculations based on UNFCCC and national inventories data.

Climate Report n°44 – Ex-post evaluation of the Kyoto protocol:
Four key lessons for the 2015 Paris Agreement
11
Figure I-5 – Impact of LULUCF rules under the Kyoto Protocol compared with LULUCF accounting
in UNFCCC inventories
Notes: USA and Canada are not represented as those countries did not provide any LULUCF-related information under the
KP.
Source: CDC Climat Research calculations based on UNFCCC and national inventories data.
B. Emission reductions can be explained by structural changes in the economies of industrialized
countries and by minor changes in their energy mix
Annex B-2012 countries managed not only to decrease their emissions by 20% between 1990 and 20118
but they also managed to increase their GDP by 36% in the same time period.9 Thus, a decorrelation
between GHG emissions and GDP has been observed for these specific countries while, at the global
level, GDP and GHG emissions grew respectively by 89% and 37% between 1990 and 2010.
Without assessing the role of the Kyoto Protocol in these evolutions, it is however possible to identify the
underlying causes. Countries’ pathways on GDP and GHG emissions can be roughly divided in three
groups: “Annex B-2012 without EITs”, “EITs” and “USA & Canada”.
While the USA and Canada did not considerably improve their energy-mix, countries
participating in the KP did
By comparing the evolution of GHG emissions, energy consumption and GDP since 1990, it is possible to
understand the sources of the decorrelation between GDP and GHG emissions. Indeed, the decorrelation
can be explained by two main phenomena: a less energy-intensive growth and a less polluting energy
consumption that is a consequence of a change in the primary energy mix. The IPCC (2014)10
shows that
growth tends to be less energy-intensive for all groups of countries even if the rate of decrease may differ
between different groups of countries.
8 Contrary to section I.A, all emissions in this section are emissions excluding LULUCF. In this paragraph, part of the analysis
may not include 2011 and 2012 due to lack of data for these years.
9 Annex B-1997 countries decreased their emissions by 10 % between 1990 and 2011 while increasing their GDP by 47%.
10 The IPCC (2014) explains the global evolution of CO2 emissions with four factors: carbon intensity of energy, energy
intensity of GDP, GDP per capita and population. Our analysis differs from the IPCC by focusing on the decorrelation between
GDP and GHG emissions.
Climate Report n°44 – Ex-post evaluation of the Kyoto protocol:
Four key lessons for the 2015 Paris Agreement
12
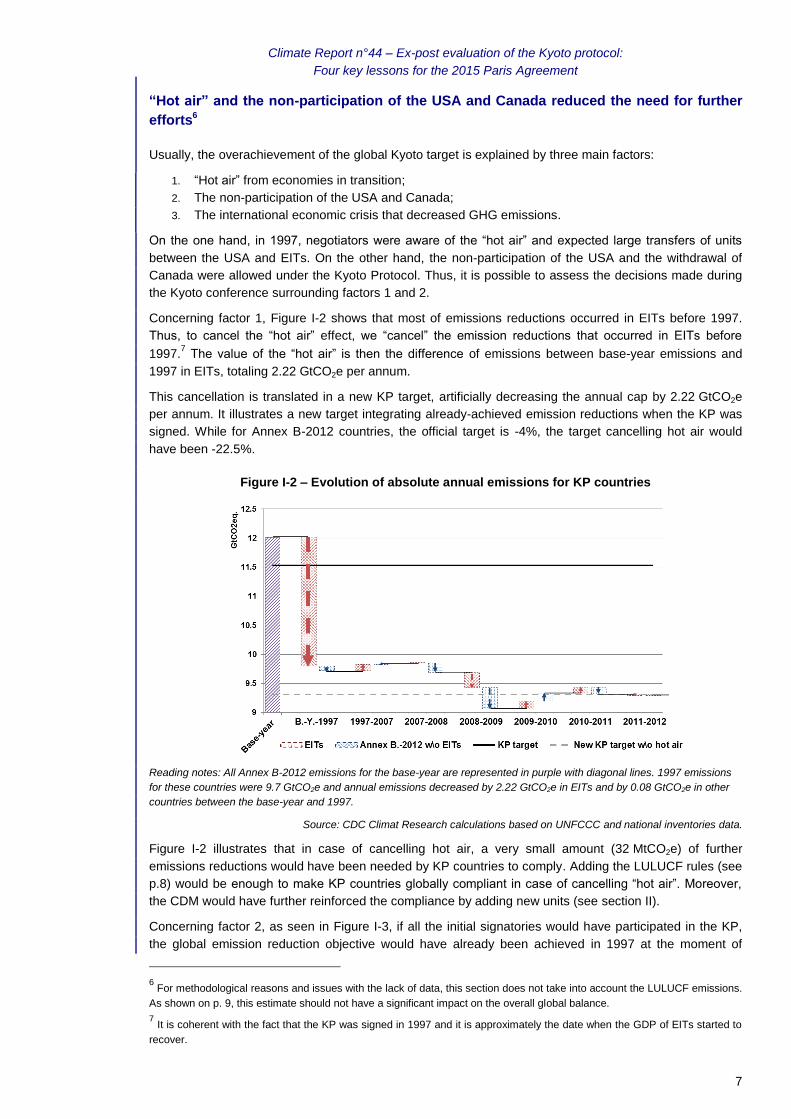
Figure I-6 – Decorrelation between GDP and GHG emissions with less energy-intensive growth
and change in the primary energy mix
Note: Energy consumption data is not available for all countries in 2012 and data are not available for Liechtenstein and
Monaco for the whole period. Estonia, Croatia and Ireland are not counted either due to incomplete data series.
Source: CDC Climat Research calculations based on UNFCCC, national inventories and World Bank data.
Figure I-6 shows that these two phenomena do not play the same role in the observed low-carbon growth.
In the USA and Canada, the change in the energy mix is marginal compared with a less energy-intensive
growth. On the contrary, the role of the change in the energy-mix is much more important in countries that
participated in the KP. For example, on the Figure I-6, for EU15 countries, the red area illustrating the
impact of the change in the energy mix represents 45% of the total area (blue and red) representing this
decorrelation. This share goes up to 80% for Japan. Nevertheless, the change in the Japanese primary
energy mix after Fukushima almost canceled the improvement of the primary energy mix compared with
1990.
The reduction in the carbon intensity of the energy mix in Western countries is mainly due to a switch from
oil to gas. A small decrease in the share of coal and a small increase in the share of renewable energy in
the primary energy mix can also be observed. This is the general overview for Western countries and
energy mix may have changed differently at the national level.
A less energy-intensive growth can be explained by two main factors: a more efficient economy and a
shift of the economy from emissive activities (e.g. industry) to less emissive activities (e.g. services).
The low-carbon growth is mainly due to the expansion of the service sector…
The evolution in the sectors contributing to growth since 1990 (Figure I-7) shows that all the cumulated
growth of annex B-2012 countries comes from services. The contribution of agriculture and industry to
growth is almost neutral for these countries between 1990 and 2010. In EITs, these sectors did not
manage to fully recover in terms of GDP from their decline post-fall of the USSR.
Without taking into account its electricity consumption, the industry sector represented 23% of annex B-
2012 countries’ GHG emissions in 1990 and 37% of their GDP. In 2010, it represented 20 % of their
emissions and 27% of their GDP.
Figure I-8 shows that direct emissions of the industry sector – including combustion and fugitive emissions
but not indirect emissions from electricity consumption – have globally declined in every group of
countries. However, energy industries and transports increased their emissions in western countries.
60%
70%
80%
90%
100%
110%
120%
130%
140%
150%
160%
170%
1990 1991 1992 1993 1994 1995 1996 1997 1998 1999 2000 2001 2002 2003 2004 2005 2006 2007 2008 2009 2010 2011
2012 Annex B
Decorrelation due to change in the primary energy mix Decorrelation due to less energy-intensive growth
GHG emissions evolution GDP evolution
Energy consumption evolution
60%
70%
80%
90%
100%
110%
120%
130%
140%
150%
160%
170%Annex B-2012 w\o EITs
60%
70%
80%
90%
100%
110%
120%
130%
140%
150%
160%
170%EITs
60%
70%
80%
90%
100%
110%
120%
130%
140%
150%
160%
170%
USA & Canada
60%
70%
80%
90%
100%
110%
120%
130%
140%
150%
160%
170%Annex B-2012

Climate Report n°44 – Ex-post evaluation of the Kyoto protocol:
Four key lessons for the 2015 Paris Agreement
13
Figure I-7 – The contribution of sectors to cumulated economic growth since 1990 is dominated by
services
Source: CDC Climat Research calculations based on World Bank data.
Figure I-8 – Evolution of sectoral emissions since 1990
Note: Transport only includes domestic transport and not international transport (see Box I-2).
Source: CDC Climat Research calculations based on UNFCCC and national inventories data.
0
1
2
3
4
5
6
Tri
llio
ns (in
$2005 P
PP
)
Annex B-2012 w\o EITs
-1
0
1
2
3
4
5
6
7
Tri
llio
ns (in
$2005 P
PP
)
USA & Canada
0
1
2
3
4
5
6
Tri
llio
ns 2012 w\o EIT
Services Industry Agriculture Cumulated growth
-1
0
1
2
3
4
5
6
7
Tri
llio
ns (in
$2005 P
PP
) Annex B-2012
-1,5
-1
-0,5
0
0,5
1
1,5
Tri
llio
ns (in
$2005 P
PP
)
EITs
0
1
2
3
4
5
6
7
1990 1997 2008 2009 2010 2011 2012
Mill
ion
s
Energy industries Manufacturing Industry and Construction Transport Agriculture Waste Solvent Buildings and others
0
1
2
3
4
5
6
7
1990 1997 2008 2009 2010 2011 2012
GtC
O2e
Annex B-2012 w\o EITs
+ 6.7%
- 23.2%
+ 10.9%
0
1
2
3
4
5
6
1990 1997 2008 2009 2010 2011 2012
GtC
O2e
EITs
- 26.2%
- 43.1%- 20.2%
0
2
4
6
8
10
12
14
1990 1997 2008 2009 2010 2011 2012
GtC
O2e
Annex B-2012
- 12.6%
- 32.8%
+ 0.6%
0
1
2
3
4
5
6
7
8
9
1990 1997 2008 2009 2010 2011 2012
GtC
O2e USA & Canada
+ 7.7%
- 2.4%
+ 17.9%

Climate Report n°44 – Ex-post evaluation of the Kyoto protocol:
Four key lessons for the 2015 Paris Agreement
14
Box I-2 – The missing passenger: international transport
In 1997, international air and maritime transports – known as international bunkers – were not included in
the KP. This choice was based on two technical reasons were advanced: a lack of reliable data and a lack
of consensus on how to attribute responsibility. The threat to global trade and development of non-Annex I
countries is also generally suggested as an argument when climate policies on international transports are
evocated.
However, emissions from international transport increased by 52% between 1990 and 2012 in Annex B-
2012 countries and its share increased from 2.1% of GHG emissions excluding LULUCF in 1990 to 4.4%
in 2012.
Source: UNFCCC and national inventories.
… but is accompanied by less-emitting industry and outsourced production to
developing countries
Part of the decorrelation explained by the decrease of industry’s emissions is due to the outsourcing of the
production of manufactured goods. Indeed, every subgroup of developed countries increased its
“consumption-based emissions/domestic emission” ratio (Figure I-9). CO2 emissions11
based on
consumption decreased by 5.7% in Annex B-2012 countries between 1990 and 2011. However, this
decrease is due principally to EITs as the consumption-based CO2 emissions increased by 5.9% in other
Annex B-2012 countries between 1990 and 2011.
Figure I-9 – Evolution of domestic and consumption-based emissions from energy combustion
and cement since 1990
Source: CDC Climat Research based on Global Carbon Project data.
The increase in consumption-based emissions is a consequence of the increasing use of imported goods
in developed countries. Nevertheless, at the global level, the energy intensity of GDP declined by a
quarter. It shows that the dynamics are more complex than a simple outsourcing of industrial production
from developed to developing countries.
Moreover, it does not necessarily mean that emission reductions that have been observed in developed
countries’ industries are a consequence of this outsourced production, and therefore outsourced
emissions.
11 Any extrapolation to all GHG emissions would be mistaken. Indeed in 2011, CO2 emissions accounted by the Global
Carbon Project (GCP) represented 75% of GHG emissions excluding LULUCF in Annex B-2012 countries. In Annex B
countries, whilst CO2 emissions accounted in the GCP decreased by 17.6% between 1990 and 2011, GHG emissions
decreased by 22.1% in national inventories.

Climate Report n°44 – Ex-post evaluation of the Kyoto protocol:
Four key lessons for the 2015 Paris Agreement
15
Indeed, these emission reductions are largely explained by less-emissive industries rather than a decline
in the production. The Table I-1 illustrates that, in western countries, all the emission reductions observed
in the industry sector are due to the decrease of the emission-intensity of industry sectors. For EITs, this
contribution amounts to roughly 70%.
It is unclear whether the evolution in the emission-intensity of the industry is due to improved efficiency,
changes in the primary energy mix of the industry or increasing role of less energy-intensive industries.
Further country-level analysis would be needed to assess the role of these different factors. At the global
level, the energy intensity of GDP declined by a quarter.
Table I-1 – Assessing the role of GDP decline and less-emissive industries in emission reductions
that occurred in the industry sector
Source: CDC Climat Research calculations based on national inventories and World Bank data.
II. COUNTRIES EMBRACED ALL FLEXIBILITY MECHANISMS, ALBEIT USING DIFFERENT STRATEGIES
Section I shows that even though Kyoto countries should achieve their aggregate Kyoto target, some
individual parties may not be compliant without the use of flexibility mechanisms (Figure I-1). Therefore,
this part reviews the use of the Kyoto flexibility mechanisms and different countries’ compliance
strategies.
A. Thanks to “bubbling”, all countries are in a position to comply with their commitments
To comply with their commitment under the Kyoto Protocol, Annex B countries must surrender as many
carbon units as they emitted tCO2e during the CP1.12,13
Eligible units are AAUs – distributed or
transferred –, ERUs, CERs, RMUs, t-CERs and l-CERs.14
All units are listed in national registries whose
annual data is published every year. It is therefore possible, based on 2008-2012 emissions15
, to assess
which countries have enough units in their accounts to cover all their emissions (Figure II-1).
Figure II-1 illustrates the use of different flexibility mechanisms by countries. Indeed, EITs in general –
except for Croatia – partially valorized their surplus of AAUs by transferring them to other countries or
converting them into ERUs, and then transferring ERUs to Annex B countries or private entities.
12 In this section, only countries that actually took part in the KP during the first commitment period are considered. Therefore,
“Annex B” countries refers to “Annex B-2012” countries in the precedent section.
13 The deadline is fixed at the end of the “true-up period“, a 100-days period following the end of the review of the final annual
report (UNFCCC, 2008).
14 See Appendix 1 for definitions. “Carbon credits” refers to CERs/ERUs while “Carbon units” refers to all kinds of KP units.
15 Emissions between 2008 and 2011 are verified. Only 2012 emissions and, in most cases, application of articles 3.3 and 3.4
are not verified yet. Modifications can still happen by the end of the true-up period mid-2015.
Group of countries
Evolution of industry
value added
between 1990 and
2010
Evolution of the ratio
"emissions / value
added" for the
industry between
1990 and 2010
Evolution of direct
GHG emissions from
the industry between
1990 and 2010
Annex B-2012 -2.0% -29.1% -30.5%
EITs -14.9% -35.7% -45.3%
Annex B-2012 w\o EITs 2.9% -22.8% -20.6%
USA & Canada 20.3% -21.4% -5.5%

Climate Report n°44 – Ex-post evaluation of the Kyoto protocol:
Four key lessons for the 2015 Paris Agreement
16
Figure II-1 – Comparison between emissions and units in countries’ account, as of 31 December
2013
Notes:
A country with a black line over the line “0%” should have enough units in its registry to comply under the CP1. A country with
a black line below the line “0%” would need to purchase units from other countries or use the “bubbling”.
As some countries postponed the application of articles 3.3 and 3.4 to the end of the CP1, the amount of RMUs listed in
countries’ accounts does not reflect precisely the expected amount of usable RMUs for the compliance. Therefore, it is
preferable to estimate of usable RMUs based on inventories. Only units listed in “Party holding accounts”, “Entity holding
accounts” and “Retirement account” were accounted. All data – units and emissions – are annualized.
The EU15 figure is the aggregated data from 15 member-states of the EU-15. It does not take into account and the difference
between the EU15 commitment and AAUs to distributed EU15 countries (19 M AAUs), which has been transferred to the
European community registry nor subtract the non-EU part of EU15 countries such as Greenland for example.
Source: CDC Climat Research calculations based on UNFCCC, national inventories and national registries data.
Contribution to compliance in percentage of base-year
emissions

Climate Report n°44 – Ex-post evaluation of the Kyoto protocol:
Four key lessons for the 2015 Paris Agreement
17
Only two EU-15 countries lack enough units for compliance at the time of writing, namely Italy and
Luxembourg. In both cases, the deficit of units is partly a consequence of the transfer of units to the
European Union registry. In any case, these countries could use the “bubbling” to comply. Based on the
article 4 of Kyoto Protocol, when EU-15 as a whole has enough units to cover its engagements, every
country within the EU-15 is considered to be compliant. As the EU-15 should comply globally (Figure II-1),
there is theoretically no need for these countries to purchase units to comply under the KP.16
As there is
no agreed rule on which EU15 countries would provide missing units, it seems nevertheless probable that,
Italy and Luxembourg would purchase units from other countries if they are still in deficit by early-2015.17
The impact of the emission trading schemes (ETSs) cannot be fully observed in Figure II-1. The impact of
ETSs on the emissions and carbon assets balance is twofold. First, under the EU ETS, which covers
various Annex B countries, the cross-border exchange of an EU allowance (EUA) between two EU
Annex B countries automatically implied the simultaneous exchange of an AAU. It is a direct consequence
of the link between the KP and the EU ETS (Point Carbon, 2012). While the trade of AAUs was normally
reserved to countries and not companies, it is therefore mainly driven by the private sector (see below).
Second, countries that have implemented domestic ETSs and allowed entities included in the ETS to use
Kyoto units for compliance have entities-specific accounts in their registry. In particular, countries under
the EU-ETS, Japan and New Zealand are concerned. The role of Switzerland as a hub for carbon credits
trading is illustrated by an over-proportionally high rate of entity-owned units.
When a company surrenders a credit under the EU ETS, the country “retires” this credit and uses it for its
own compliance under the KP. Therefore, these credits are in retirement accounts and are accounted in
solid bars and not hatched bars.
B. The trade of carbon units was mainly driven by European companies thanks to the EU ETS
As seen in sections I.A and II.A, despite national AAU allocations being ultimately above their GHG
emissions creating a surplus of AAUs, countries have used project mechanisms and the transfer of units.
Therefore, a deeper look into the role of different countries in unit transfers seems warranted.
The European Union and Japan were major players in trading units
Trades of carbon units between parties to the Kyoto Protocol are recorded in the registry. It is thus
possible to assess the movement of units (Figure II-2). Two main sources of demand can be observed:
Europe and Japan.
The EU ETS is the main driver of carbon units trading under the Kyoto Protocol
The European case is a bit different of Japan which needed to purchase units to comply and played the
game by constantly buying different kinds of units during the CP1.18
Even if some countries may have
needed to purchase units in order to comply, the transactions within and towards of European countries
were mainly driven by the EU ETS. As seen above, it is directly linked with the trading of EUAs and the
eligibility of CERs and ERUs under the EU ETS.19
The trading volumes of carbon units on Figure II-2 are dominated by AAUs transfer within EU ETS
countries. Looking at Figure II-3 shows that within EU ETS countries, the main destination of transfers of
CERs and ERUs are EU15 countries. Indeed, these countries purchased more than 1 billion carbon
credits. The high level of AAU transactions within the EU is mainly an illustration of trading volumes under
16 For further information on the interaction between bubbling, EU emissions and EU ETS, see (EEA, 2013).
17 European Legislation is vague about not complying countries within a globally complying bubble: “The European
Community and its Member States shall take the necessary measures to comply with the emission levels” (EC, 2002).
18 The Japanese context is detailed in section II.C.
19 To better understand how carbon credits are used by companies under the EU ETS, see Stephan et al. (2014)

Climate Report n°44 – Ex-post evaluation of the Kyoto protocol:
Four key lessons for the 2015 Paris Agreement
18
the EU ETS. The data also shows that this level has also been artificially increased by the VAT fraud
which happened in 2008-2009 (European Commission, 2010).
Figure II-2 – World map of carbon unit trades as of 31 December 2013: Europe and Japan as the
principal sources of demand
Reading notes: Flows of AAUs are in blue, flows of CERs/ERUs are in orange. Figures in parentheses represent volumes
traded. Figures outside parentheses represent the net transfer. The direction of the arrow indicates the net transfer of all
carbon units. A positive figure represents a net transfer in the same direction as the arrow.
E.g.: the volume of carbon units exchanged between EU ETS countries and Switzerland is 271 million AAUs and
1.8 billion CERs/ERUs. The net result of trades between these countries is that Switzerland received 25 million AAUs from EU
ETS countries and EU ETS countries received 455 million CERs/ERUs from Switzerland.
Only exchange volumes higher than 1 million are represented. Australia and Canada transferred units but for small amounts.
Thus, these transfers are not represented.
Source: CDC Climat Research calculations based on UNFCCC, national inventories and national registries data.
In any case, EU15 countries are the principal actors of Kyoto units trading – first trader and first
purchaser. While it is not surprising – as it was a group of major emitters –, it is mainly due to the EU ETS
and more broadly the EU legislation. Indeed, Figure II-1 shows that, with the bubbling, EU15 countries
would have been compliant even without trading carbon units. Therefore, all this trading is not a result of a
“Kyoto strategy” but an “EU ETS strategy” and is therefore company-driven rather than state-driven.
However, when a group of countries are part of the same ETS which is directly linked with the KP throught
the transfer of AAUs/CERs/ERUs – such as the EU ETS –, it seems preferable to include all particpating
countries under the same “bubble” as it is the case for the second period of the KP. Indeed, a country
achieving its target under both KP and EU ETS may, nevertheless, need to purchase units if domestic

Climate Report n°44 – Ex-post evaluation of the Kyoto protocol:
Four key lessons for the 2015 Paris Agreement
19
installations sold too many EUAs.20
In that case, the profit of private entities – by selling EUAs – would
create a loss for the State.
Switzerland as a hub, Canada as a dead end
Compared to its own emissions, the role of Switzerland is also remarkable. Indeed, the trading volume of
Switzerland represents 11 times its base-year emissions. Even the net position of the country is unusual
with a surplus of more than one third of its base-year emissions. Switzerland was thus a hub for carbon
units trading and an entry door for carbon units in Europe (Figure II-3). This may be explained by the fact
that many CDM/JI project developers and traders are located in Switzerland and that the Swiss legislation
encouraged carbon offsetting (Stephan et al., 2014 and Shishlov and Bellassen, 2012). The prior
connection of the Swiss registry with the International Transaction Log (ITL) have probably also played a
role as it ensured delivery of the Kyoto credits to the national accounts of European investors before 2008
(Alberola and Stephan, 2010).
The Swiss position is at the very opposite of Canada’s behavior during its participation in the KP (Box II-1)
as few units were traded despite high GHG emissions.
Box II-1 Remaining in the KP would have cost much less than estimated by Canada
In late 2011, Canada announced its withdrawal from the KP, in compliance with article 27 of the Protocol.
The decision entered into force one year later. Despite a large deficit of units (see Figure I-1), Canada did
not purchase a significant amount of units from other countries.
The only visible trades in its accounts are the purchase of 441,302 primary CERs that have since been
cancelled. As these credits were probably contracted prior to the country’s withdrawal, 110,271 CERs
were nevertheless transferred to the Canadian account in 2012, after the announcement of Canada’s
withdrawal.
Based on Canadian emissions inventories, it is short of 728 million units for the whole period – excluding
the impact of LULUCF as it was not reported. In its withdrawal announcement, the Canadian government
explained that not withdrawing would have cost Canada “the loss of thousands of jobs or the transfer of
$14 Billion from Canadian taxpayers to other countries”.
The Canadian estimate seems to be based on a price around 20$/tCO2e. The current average market-
price of CERs/ERUs is around 0.10$/tCO2e. The minimum market cost of compliance would then have
been around $70-80M. Potentially, a higher market cost could have been expected as Canadian demand
would most likely have increased the prices. However, as the additional demand would not have been
sufficient to balance the global market – which would have remained long – the expected increase would
most likely have remained limited. Moreover, another option for Canada was to trade over-the-counter
with other Annex B countries to buy allowances and credits; this option may have further decreased the
cost of compliance.
Source: CDC Climat Research based on Statement by Minister Kent (2011) and Canadian inventories and registries.
20 Example: a country’s emissions are 50 from ETS sectors and 50 non-ETS sectors for the base year. Its target is to stabilize
emissions for both ETS and non-ETS sectors. Verified emissions are 40 for ETS sectors and 60 for non-ETS sectors. If
domestic installations sold their 10 of EUA surplus, the country would lack 10 AAUs, transferred to other EU-ETS countries.

Climate Report n°44 – Ex-post evaluation of the Kyoto protocol:
Four key lessons for the 2015 Paris Agreement
20
Figure II-3 - European map of carbon unit trades as of 31 December 2013: a Western rush
Notes: same reading notes as Figure II-2. Iceland did not trade any unit during the CP1.
The European Registry is both the KP registry of the EU as a Party to the Kyoto Protocol and also the EU ETS registry.
Therefore it cannot be attributed to EU15 or EU10.
Source: CDC Climat Research calculations based on UNFCCC, national inventories and national registries data.
The advanced developing countries and transition economies are the main sources of
carbon credits traded under the Kyoto Protocol
As of 1 January 2014 the 7,418 CDM and 603 JI projects that were registered had issued 1,419 million
CERs and 830 million ERUs respectively (UNEP Risoe 2014). Total CERs represent additional allowed
emissions equivalent to 2.4% of base-year emissions for the CP1. Both CER and ERU supplies are
largely concentrated in advanced developing countries and transition economies respectively. Indeed,
over 90% of all issued CERs come from 5 largest CDM countries: China, India, South Korea, Brazil and
Mexico, while African countries account for less than 2%. Similarly, over 90% of all issued ERUs come
from Russia and Ukraine, while Western Europe accounts for only 3% (Figure II-4).
Such a concentrated distribution of CDM and JI projects can be primarily explained by larger absolute and
relative levels of GHG emissions in advanced developing countries and in transition economies and,
hence, larger economically attractive emissions reduction potential. Moreover, in the case of the CDM,
advanced developing countries in Asia and South America provided relatively strong institutional capacity
and relatively favorable investment climate compared to less developed countries in Africa (Shishlov and
Bellassen 2012).
In the case of JI, large AAU surpluses in Russia and Ukraine meant that these countries could pursue the
maximum potential of the offset mechanism without putting their Kyoto compliance position at risk.
Conversely, countries with tighter AAU positions had to be more cautious in approving JI projects in order
to ensure that emissions reductions credited with ERUs were truly additional. Furthermore, potential
projects in Europe in such sectors as renewable power generation or energy efficiency could not be
registered under the JI scheme. This is due to the risk of double counting of emissions reduced under the
EU ETS, unless a special “JI reserve” was created (Shishlov, Bellassen, and Leguet 2012).

Climate Report n°44 – Ex-post evaluation of the Kyoto protocol:
Four key lessons for the 2015 Paris Agreement
21
Figure II-4 – CER and ERU issuance by host country as of 1 January 2014
Source: CDC Climat Research based on UNEP Risoe (2014).
From the sectoral perspective both offset mechanisms are also relatively concentrated, albeit in different
sectors (Figure II-5). Indeed, about 55% of all issued CERs originated from projects focused on reducing
industrial gases emissions – HFC-23 and N2O. This dominance can be explained by the earlier start of
HFC-23 and N2O projects, as well as their high returns on investment. Additionally, the large size of these
projects – the 10 biggest projects, all focused on destruction of industrial gases, have issued 45% of all
CERs – enables them to benefit from the economy of scale and submit their monitoring reports more
often. Conversely smaller projects might tend to wait until a large number of emissions reductions is
accumulated in order to reduce transaction costs. Other important sectors in the CDM are renewable
energy, especially hydro and wind power, energy efficiency, waste (landfill gas destruction or utilization)
and fossil fuel switch (Shishlov and Bellassen 2012). Investments in CDM projects amounted to over
USD200 billion (UNFCCC 2012).
For JI, the leading project types accounting for almost two thirds of all issued ERUs are reducing fugitive
emissions in gas pipelines and coal mines and industrial energy efficiency, which can be explained by
high emissions reductions potential in these sectors in Ukraine and Russia (Shishlov, Bellassen, and
Leguet 2012).
Figure II-5 – CER and ERU issuance by project type as of 1 January 2014
Source: CDC Climat Research based on UNEP Risoe (2014).
Climate Report n°44 – Ex-post evaluation of the Kyoto protocol:
Four key lessons for the 2015 Paris Agreement
22
C. Japan and New Zealand, two examples of building domestic policies using the Kyoto Protocol
framework
Japan: anticipating the need for carbon units
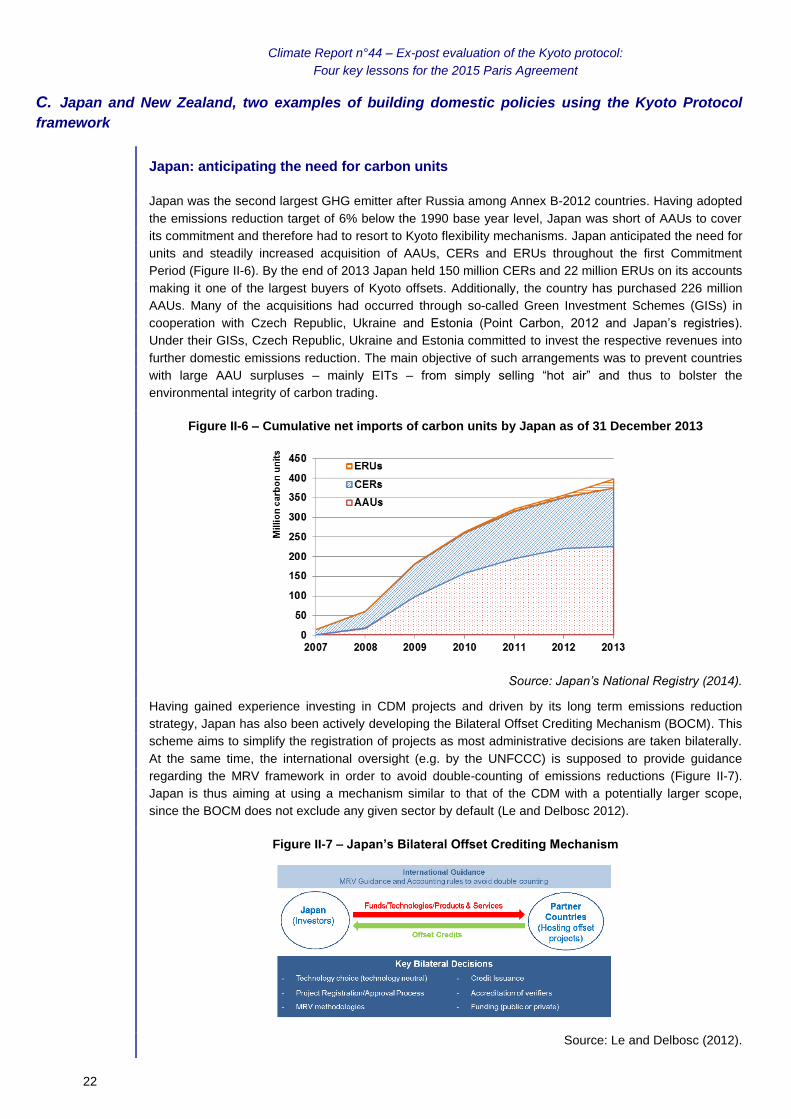
Japan was the second largest GHG emitter after Russia among Annex B-2012 countries. Having adopted
the emissions reduction target of 6% below the 1990 base year level, Japan was short of AAUs to cover
its commitment and therefore had to resort to Kyoto flexibility mechanisms. Japan anticipated the need for
units and steadily increased acquisition of AAUs, CERs and ERUs throughout the first Commitment
Period (Figure II-6). By the end of 2013 Japan held 150 million CERs and 22 million ERUs on its accounts
making it one of the largest buyers of Kyoto offsets. Additionally, the country has purchased 226 million
AAUs. Many of the acquisitions had occurred through so-called Green Investment Schemes (GISs) in
cooperation with Czech Republic, Ukraine and Estonia (Point Carbon, 2012 and Japan’s registries).
Under their GISs, Czech Republic, Ukraine and Estonia committed to invest the respective revenues into
further domestic emissions reduction. The main objective of such arrangements was to prevent countries
with large AAU surpluses – mainly EITs – from simply selling “hot air” and thus to bolster the
environmental integrity of carbon trading.
Figure II-6 – Cumulative net imports of carbon units by Japan as of 31 December 2013
Source: Japan’s National Registry (2014).
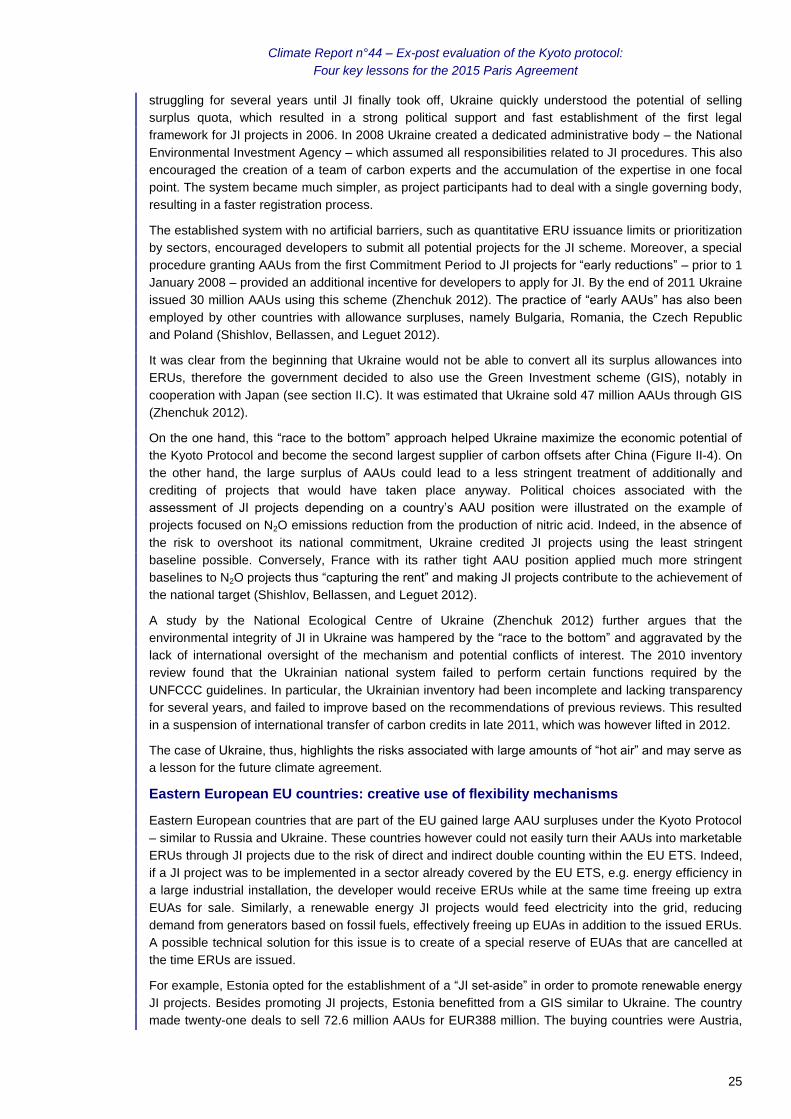
Having gained experience investing in CDM projects and driven by its long term emissions reduction
strategy, Japan has also been actively developing the Bilateral Offset Crediting Mechanism (BOCM). This
scheme aims to simplify the registration of projects as most administrative decisions are taken bilaterally.
At the same time, the international oversight (e.g. by the UNFCCC) is supposed to provide guidance
regarding the MRV framework in order to avoid double-counting of emissions reductions (Figure II-7).
Japan is thus aiming at using a mechanism similar to that of the CDM with a potentially larger scope,
since the BOCM does not exclude any given sector by default (Le and Delbosc 2012).
Figure II-7 – Japan’s Bilateral Offset Crediting Mechanism
Source: Le and Delbosc (2012).

Climate Report n°44 – Ex-post evaluation of the Kyoto protocol:
Four key lessons for the 2015 Paris Agreement
23
New Zealand JI tenders: maximizing the crediting leveraging
New Zealand has been an active player on the carbon market since its ratification of the Kyoto Protocol in
2002, principally through the creation of a special framework: Projects to Reduce Emissions (PRE). The
scheme encouraged voluntary early offset projects that could later be included into the JI scheme and
used in the national emissions trading scheme that began operation in 2008. Under the PRE scheme New
Zealand conducted two tenders – in 2003 and 2004 – which resulted in the registration of 34 projects with
a total emissions reduction potential of around 10 Mt CO2e. 19 of these projects were completed and
generated 5.5 million carbon offsets (Ministry for the Environment of New Zealand, 2013).
The prioritization of the projects that contribute to energy security defined the sectoral scope of the
selected projects – they were all focused on renewable energy generation, namely wind, hydro,
geothermal and landfill gas utilization. At the same time, the projects were evaluated based on the ratio
between the amount of ERUs requested for the first Kyoto commitment period and the amount of planned
emission reductions since the beginning of a project until the end of 2012.
The PRE ranking system encouraged early movers, since they could declare emission reductions prior to
2008, thus improving their ERU-to-emission-reductions ratio compared to projects that started later. For
example, if a project that started in 2007 and resulted in stable emissions reduction until the end of 2012,
claimed the maximum amount of ERUs amounting to the reduction achieved between 2008 and 2012, it
would have a ratio of 5/6=0.833. A similar project that started in 2005 would have a ratio of 5/8=0.625
and, hence, a higher rating. In order to further improve its ranking a project could also claim fewer ERUs
than its actual emission reductions in 2008-2012. However, in reality most projects claimed 1:1 ratio for
the compensation of the abatement during the first commitment period. Therefore the main driver that
defined a project’s final ranking was the project’s start date rather than the amount of the ERU bid
(Shishlov, Bellassen, and Leguet 2012).
These domestic projects provided a valuable opportunity to learn and develop understanding of carbon
markets among relevant actors. Furthermore, it enabled New Zealand to receive additional funding for
local authorities to finance emission reduction projects (Clapp et al., 2010).
D. Eastern European countries attempted to maximize the economic benefits of the surplus
Total net exports of units from Eastern European countries amount to 800 million AAUs and 630 million
ERUs, which could be translated into net revenues around a few billion euros.21
Different countries,
however, employed different strategies towards flexibility mechanisms.
Russia: a slow start followed by last-minute sprint of JI
Russia’s position towards the Kyoto Protocol has always appeared cautious, with the international climate
agreement being ratified only in 2004 arguably in exchange for the EU backing Russia’s WTO bid.
Paradoxically, Russia could potentially be the biggest beneficiary of the Kyoto Protocol, as it granted the
fourth largest GHG-emitting country with a vast surplus of AAUs. This “hot air” occurred due to the
economy contraction following the collapse of the Soviet Union. Since the potential to market this surplus,
in the form of AAUs was quite vague, the JI mechanism seemed like a reasonable instrument to take
advantage of the Kyoto Protocol.
Despite being a promising mechanism to capitalize on the country’s AAU surplus and to attract foreign
investments, the development of JI in Russia was restrained by the unclear division of responsibilities
between ministries, constantly changing legislation and lack of political support. Over 100 projects with a
total emissions reduction potential of around 240 million tons of CO2e entered the pipeline by 2009. More
21 Most of AAUs transferred come from EU10 countries to other EU ETS countries. They are probably the consequence of a
trade of EUA. It is very tricky to assess at which price all units have been sold. “A few billion euros” seems to be a good order
of magnitude given the prices of carbon units in past years. To have a better overview of disclosed AAU transactions, see
Point Carbon (2012).
Climate Report n°44 – Ex-post evaluation of the Kyoto protocol:
Four key lessons for the 2015 Paris Agreement
24
than 40 projects submitted their Project Design Documents (PDD) to the Ministry for Economic
Development. However, none of them had been registered by late 2009 (Shishlov 2011).
This situation changed during the presidency of Dmitry Medvedev when the government of Russia started
paying attention to JI as a tool for promoting innovations and attracting private capital for economy
modernization. Sberbank was appointed as the operator of carbon units in 2009 and empowered to
conduct tenders for projects seeking JI registration. The first two tenders were carried out in 2010 in
accordance with the updated legislation resulting in registration of the first 32 projects with a total
emissions reduction potential of 60 Mt CO2e. Nevertheless, the development of the mechanism was still
constrained by the quantitative limits set for JI tenders.
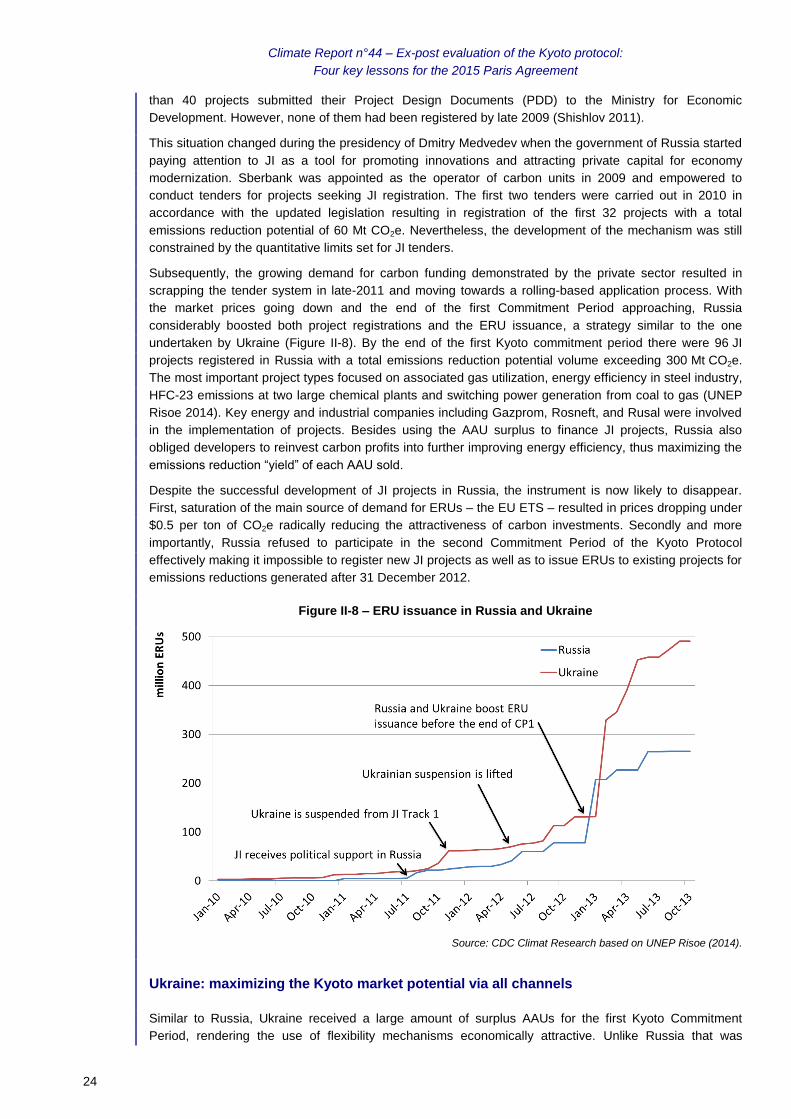
Subsequently, the growing demand for carbon funding demonstrated by the private sector resulted in
scrapping the tender system in late-2011 and moving towards a rolling-based application process. With
the market prices going down and the end of the first Commitment Period approaching, Russia
considerably boosted both project registrations and the ERU issuance, a strategy similar to the one
undertaken by Ukraine (Figure II-8). By the end of the first Kyoto commitment period there were 96 JI
projects registered in Russia with a total emissions reduction potential volume exceeding 300 Mt CO2e.
The most important project types focused on associated gas utilization, energy efficiency in steel industry,
HFC-23 emissions at two large chemical plants and switching power generation from coal to gas (UNEP
Risoe 2014). Key energy and industrial companies including Gazprom, Rosneft, and Rusal were involved
in the implementation of projects. Besides using the AAU surplus to finance JI projects, Russia also
obliged developers to reinvest carbon profits into further improving energy efficiency, thus maximizing the
emissions reduction “yield” of each AAU sold.
Despite the successful development of JI projects in Russia, the instrument is now likely to disappear.
First, saturation of the main source of demand for ERUs – the EU ETS – resulted in prices dropping under
$0.5 per ton of CO2e radically reducing the attractiveness of carbon investments. Secondly and more
importantly, Russia refused to participate in the second Commitment Period of the Kyoto Protocol
effectively making it impossible to register new JI projects as well as to issue ERUs to existing projects for
emissions reductions generated after 31 December 2012.
Figure II-8 – ERU issuance in Russia and Ukraine
Source: CDC Climat Research based on UNEP Risoe (2014).
Ukraine: maximizing the Kyoto market potential via all channels
Similar to Russia, Ukraine received a large amount of surplus AAUs for the first Kyoto Commitment
Period, rendering the use of flexibility mechanisms economically attractive. Unlike Russia that was
Climate Report n°44 – Ex-post evaluation of the Kyoto protocol:
Four key lessons for the 2015 Paris Agreement
25
struggling for several years until JI finally took off, Ukraine quickly understood the potential of selling
surplus quota, which resulted in a strong political support and fast establishment of the first legal
framework for JI projects in 2006. In 2008 Ukraine created a dedicated administrative body – the National
Environmental Investment Agency – which assumed all responsibilities related to JI procedures. This also
encouraged the creation of a team of carbon experts and the accumulation of the expertise in one focal
point. The system became much simpler, as project participants had to deal with a single governing body,
resulting in a faster registration process.
The established system with no artificial barriers, such as quantitative ERU issuance limits or prioritization
by sectors, encouraged developers to submit all potential projects for the JI scheme. Moreover, a special
procedure granting AAUs from the first Commitment Period to JI projects for “early reductions” – prior to 1
January 2008 – provided an additional incentive for developers to apply for JI. By the end of 2011 Ukraine
issued 30 million AAUs using this scheme (Zhenchuk 2012). The practice of “early AAUs” has also been
employed by other countries with allowance surpluses, namely Bulgaria, Romania, the Czech Republic
and Poland (Shishlov, Bellassen, and Leguet 2012).
It was clear from the beginning that Ukraine would not be able to convert all its surplus allowances into
ERUs, therefore the government decided to also use the Green Investment scheme (GIS), notably in
cooperation with Japan (see section II.C). It was estimated that Ukraine sold 47 million AAUs through GIS
(Zhenchuk 2012).
On the one hand, this “race to the bottom” approach helped Ukraine maximize the economic potential of
the Kyoto Protocol and become the second largest supplier of carbon offsets after China (Figure II-4). On
the other hand, the large surplus of AAUs could lead to a less stringent treatment of additionally and
crediting of projects that would have taken place anyway. Political choices associated with the
assessment of JI projects depending on a country’s AAU position were illustrated on the example of
projects focused on N2O emissions reduction from the production of nitric acid. Indeed, in the absence of
the risk to overshoot its national commitment, Ukraine credited JI projects using the least stringent
baseline possible. Conversely, France with its rather tight AAU position applied much more stringent
baselines to N2O projects thus “capturing the rent” and making JI projects contribute to the achievement of
the national target (Shishlov, Bellassen, and Leguet 2012).
A study by the National Ecological Centre of Ukraine (Zhenchuk 2012) further argues that the
environmental integrity of JI in Ukraine was hampered by the “race to the bottom” and aggravated by the
lack of international oversight of the mechanism and potential conflicts of interest. The 2010 inventory
review found that the Ukrainian national system failed to perform certain functions required by the
UNFCCC guidelines. In particular, the Ukrainian inventory had been incomplete and lacking transparency
for several years, and failed to improve based on the recommendations of previous reviews. This resulted
in a suspension of international transfer of carbon credits in late 2011, which was however lifted in 2012.
The case of Ukraine, thus, highlights the risks associated with large amounts of “hot air” and may serve as
a lesson for the future climate agreement.
Eastern European EU countries: creative use of flexibility mechanisms
Eastern European countries that are part of the EU gained large AAU surpluses under the Kyoto Protocol
– similar to Russia and Ukraine. These countries however could not easily turn their AAUs into marketable
ERUs through JI projects due to the risk of direct and indirect double counting within the EU ETS. Indeed,
if a JI project was to be implemented in a sector already covered by the EU ETS, e.g. energy efficiency in
a large industrial installation, the developer would receive ERUs while at the same time freeing up extra
EUAs for sale. Similarly, a renewable energy JI projects would feed electricity into the grid, reducing
demand from generators based on fossil fuels, effectively freeing up EUAs in addition to the issued ERUs.
A possible technical solution for this issue is to create of a special reserve of EUAs that are cancelled at
the time ERUs are issued.
For example, Estonia opted for the establishment of a “JI set-aside” in order to promote renewable energy
JI projects. Besides promoting JI projects, Estonia benefitted from a GIS similar to Ukraine. The country
made twenty-one deals to sell 72.6 million AAUs for EUR388 million. The buying countries were Austria,

Climate Report n°44 – Ex-post evaluation of the Kyoto protocol:
Four key lessons for the 2015 Paris Agreement
26
Spain, Luxembourg, as well as Japanese corporations (Environmental Investment Centre of Estonia,
2014).
Another example of creative use of JI is the biomass energy portfolio in the Czech Republic. The lack of
funds for capital investments created significant obstacles in implementing small projects on the level of
municipalities and the national government was unable or unwilling to provide sufficient support. In this
situation, JI enabled municipalities to tap directly into foreign capital and removed the budgetary
constraint. This case demonstrates that JI allows the financing of public policies aimed at emissions
reductions through AAUs – converted into ERUs – rather than euros direct from the national budget
(Shishlov, Bellassen, and Leguet 2012).
Although the use of flexibility mechanisms in Eastern European EU countries was limited in terms of
emissions reductions traded, it demonstrates, how new opportunities may emerge in a given country
context.
III. DOHA DECISIONS HAVE SOFTENED THE IMPACT OF THE CP1OVERACHIEVEMENT ON THE CP2 – BUT MAY
NOT HAVE BEEN SUFFICIENT
A. Countries will be able to carry-over up to 7 billion units, but private entities may lose around
70 million units
A second commitment period with a limited perimeter
The principle of a second commitment period of the Kyoto Protocol (CP2) was agreed upon in Durban in
late-2011. Technical details and countries’ commitments were finalized in Doha in late-2012.22
Major
countries such as Russia, Japan and New Zealand announced that their participation in the KP would not
be renewed for the CP2. On the other hand, Belarus and Kazakhstan whose participation in the CP1 was
not ratified, announced their willingness to be part of the CP2.
Based on Doha’s declarations, 37 countries – representing less than 15% of current global emissions –
committed to the second commitment period of the Kyoto Protocol between 2013 and 2020. These
countries have committed to reduce their emissions during this period by 18% compared with the base-
year – which remains the same as for the CP1, most often 1990 (Table III-1).
However, rules were decided in Doha to avoid the creation of new “hot air” and the carrying-over of “CP1
hot air” to CP2 (Morel et al., 2012 and Morel, 2013). For example, whatever the official commitment taken
by countries for the CP2, the usable distributed AAUs for the CP2 are limited, for each country, at the
average 2008-2010 annual GHG emissions level. The rule is particularly critical for non-EU economies in
transition: Belarus, Kazakhstan and Ukraine. These countries have announced that these rules and the
manner in which the amendment was adopted – i.e. ignoring their objections – could question their
participation in the CP223
. It is not yet known whether they will ratify the amendment.
22 For further details on Durban and Doha decisions, read Morel et al. (2011 and 2012).
23 http://www.rtcc.org/belarus-ukraine-kazakhstan-and-russia-meet-to-discuss-kyoto/

Climate Report n°44 – Ex-post evaluation of the Kyoto protocol:
Four key lessons for the 2015 Paris Agreement
27
Table III-1 – Commitments for the second period of the Kyoto Protocol based on Doha decisions
Notes: 1 Compared to the reference year, generally 1990.
2 Economies in Transition. Only non-EU countries are included. The participation of Belarus, Kazakhstan and Ukraine is still
uncertain. 3 For CP2, Croatia and Iceland will fulfill their commitments jointly with the EU in accordance with Article 4 of the Kyoto
Protocol known as “the bubbling”. 4 The EU-27 countries have differentiated commitments under the CP1. The provided data therefore aggregates those of the
concerned countries.
Source: CDC Climat Research calculations based on UNFCCC and national inventories data.
Doha decisions had the objective to tackle the question of “hot air”…
Doha decisions about the carrying-over of units could be summed up in four points. For each country:
1. All the AAUs surplus from CP1 can be carried-over to the CP2;
2. CERs/ERUs surplus from CP1 can be carried-over to the CP2 up to an amount equivalent to 2.5% of
its distributed AAUs for the CP1;
3. All units carried-over from CP1 to CP2 must be transferred to a Previous Period Surplus Reserve
(PPSR) and can be traded with other countries up to an amount equivalent to 2% of its distributed
AAUs for the CP1;
4. Countries can use their PPSR to comply under CP2 only for emissions above their official
commitment.
The fourth point is particularly applicable to Ukraine (Morel, 2013 – see section III.B). If the second point
did not attract much attention, it can be very constraining for specific countries that involved private
entities to purchase CERs/ERUs. On the one hand, countries may logically prioritize the retirement of
CERs and ERUs they retain to comply under the CP1 rather than AAUs. Indeed, no limit on carrying-over
is set on AAUs.
On the other hand, countries are not in position to surrender privately held CERs and ERUs except if
these credits were surrendered under national or regional legislation such as the EU ETS to offset 2008-
2012 emissions. Therefore, if private entities that decide to keep CERs/ERUs to use them after 2012
represent more than 2.5% of distributed AAUs, it is possible that a share of these credits could not be
carried-over to the CP2. This is particularly critical for EU ETS countries and Switzerland.
… but the main weapon against the surplus may be EU legislation
Indeed, the table in Appendix 3 (p. 34) shows that up to 72 MtCO2e held by entities may be “lost” if they
are not transferred or retired by the end of the true-up period. These units are concentrated in
Switzerland.
Finally, the surplus that can be carried-over to the CP2 represents up to 7 GtCO2e (see p. 34) or the
equivalent of 11% of base-year emissions offset during the CP2 for all participating countries. Applying all
Doha decisions and assuming that the entire carried-over surplus will be used by countries, CP2
Country
Commitment
CP1 (2008-
2012)
compared to
base-year1
Commitment CP2
pledged by
countries (2013-
2020) compared to
base-year1
Commitment CP2
pledged by countries
(2013-2020)
compared to 2008-
2010 emissions
Commitment CP2
compared to base-year1
after applying new rules
Commitment CP2
compared to 2008-2011
emissions after applying
new rules and carrying-
over surplus2
Australia + 8% -0,5% -5% -0,5% -2,9%
Belarus2 n.a. -12% + 37% -36% + 1%
Croatia3 -5% -20% -12% -20% -8,4%
EU-274 -7,9% -20% -2% -20% -0,1%
Iceland3 + 10% -20% -33% -20% -32,3%
Kazakhstan2 n.a. -5% + 34% -29% -1,8%
Liechtenstein -8% -16% -22% -16% -20,4%
Monaco -6% -22% -8% -22% -1,0%
Norway + 1% -16% -19% -16% -19,8%
Switzerland -8% -15,8% -16% -15,8% -12,5%
Ukraine 0% -24% + 81% -58% + 85%5
TOTAL -5,6% -18% + 5% -24% + 5%
TOTAL excl. non-EU EITs2 -6,4% -18% -2% -18% -1%

Climate Report n°44 – Ex-post evaluation of the Kyoto protocol:
Four key lessons for the 2015 Paris Agreement
28
committed to reduce their emissions by between 10% and 11% compared to the base-year. However,
some countries committed not to buy surplus from CP1 from other countries (Doha decisions, 2012).
Moreover, these objectives can be strengthened with domestic legislation. Indeed, the emission
reductions commitment under the European Climate and Energy Package shall be fulfilled without the use
of CP1 surplus (EC, 2009). That would mean that 70% of the carried-over surplus could end up not being
used if EU countries respect their 2020 European commitments. Nevertheless, the EU could decide to
use its surplus to take a more ambitious target under the KP (see Box III-1).
Box III-1 – What if the EU changed its international commitment to -30% without changing its
domestic legislation?
The European Climate and Energy Package (CEP) engages EU countries to reduce by 2020 their
emissions by 20% compared with 2005 (EC, 2009). The commitment engages countries on a specific
2013-2020 pathway. The EU27 commitment under CP2 is the translation of this pathway in a KP
perimeter (see EU, 2012).
However, the CEP does not stipulate using any kind of surplus from years before 2013 for non-ETS
sectors. ETS sectors are aggregated at the European level and may use EUAs for the EU-ETS’s phase 2
(2008-2012) – and thus use CP1 AAUs. The use of CERs/ERUs is also planned but limited.
European countries may then fulfill their CEP commitment only with emission reductions occurring
between 2013 and 2020. In 2009, the EU also promised to review its -20% commitment and envisage
strengthening it up to a -30% commitment in case of an ambitious global agreement. The discussion of
strengthening the EU’s 2020 ambition is also raised with the review of CP2 commitments planned in 2014
and the “pre-2020 ambition” track under the Durban Platform.
As seen on p.32, EU27 countries have a large amount of surplus from CP1 that they would be “officially”
allowed to use during the CP2 under the KP. The surplus represents more than 10% of base-year
emissions for the 8 years of the CP2.24
Therefore, the EU could take, under the Kyoto Protocol, the
commitment to reduce its emissions by 30% instead of 20% without a need to implement new actions as
the difference would be offset by the carried-over surplus. Therefore, the Kyoto -30% commitment would
not necessitate changing the -20% domestic commitment.
The main consequence would be to “use” the surplus, which would not necessarily imply any additional
costs. Indeed, a change of international regime is expected from 2020 and any surplus from CP1 and CP2
may become useless from then. Moreover, it would be a way to clear the inheritance of the
overachievement of the first commitment period. Thus, if the environmental impact of such a decision
would be neutral, it can be a political argument in the context of negotiating a new post-2020 global
agreement.
Source: CDC Climat Research.
B. To use its surplus, Ukraine should officially review its commitment25
As seen above, Ukraine expressed its intention to participate in CP2. During the first commitment period,
Ukraine benefited of a large surplus (2,612 MtCO2e). Part of this surplus was valued thanks to project
mechanisms (see p.24). Finally, as of 31 December 2013, Ukraine is expected to have a surplus of
2,060 MtCO2e. For each of the eight years of the CP2, this amount represents 257 MtCO2e or more than
65% of Ukraine’s average 2008-2010 emissions.
On the other hand, Ukraine took an official emission reduction target of -24% compared to the base-year
for the CP2. Doha decisions limit the distribution of AAUs at level of 2008-2010 emissions. Thus, Ukraine
will receive CP2-units equivalent to a commitment of -58% compared to the base-year.
24 7.8% if we subtract 1,425 MtCO2e of surplus under the EU ETS.
25 This paragraph sums up a deeper analysis detailed in Morel (2013). The only notable difference with this note is the
estimation of the surplus integrating the past transfer of units.

Climate Report n°44 – Ex-post evaluation of the Kyoto protocol:
Four key lessons for the 2015 Paris Agreement
29
As the Doha decisions allow the use of carried-over CP1-units only above the official commitment taken
by countries – -24% for Ukraine – Ukraine would need to purchase the difference from other countries
before being able to use its CP1 surplus. This would represent up to 310 MtCO2e per year over 8 years.
In that case, Ukraine would be able to start using part of its surplus, only if its emissions would be – on
average over the 2013-2020 period – 79% higher than during the 2008-2010 period. It appears thus very
unlikely.
The only way for Ukraine to be able to use part of its surplus would be to officially endorse the
commitment of decreasing its emissions by 58% compared with its base-year over 2013-2020. In that
case, the available surplus would allow Ukraine to offset an increase of 65% of its emissions. A
participation in the CP2 would then be manageable for Ukraine but at two costs: a political cost of
endorsing a target much lower than initially planned and the consumption of part of its surplus. The last
point can be linked with the possible EU strategy for the CP2 (see Box III-1). Even if some countries –
especially EITs – have struggled to keep the right to use their surplus of units after 2020 (Morel et al.,
2012), the usability of AAUs after 2020 is still very uncertain.

Climate Report n°44 – Ex-post evaluation of the Kyoto protocol:
Four key lessons for the 2015 Paris Agreement
30
CONCLUSION AND POLICY LESSONS FOR AN INTERNATIONAL AGREEMENT IN 2015
The Kyoto Protocol is the first international mechanism aimed at mitigating climate change. Although its
direct impact on global emissions remains modest, participating countries surpassed their aggregate
commitments and reduced emissions by 24%. While the level of overachievement is mainly linked to a
generous allocation to former USSR countries – known as “hot air” – participating countries would have
nevertheless fulfilled their objectives without this “gift”. Countries implemented different strategies to
comply and take benefit of flexibility mechanisms: purchasing carbon units abroad, stimulating the
domestic use of offset credits and incentivizing domestic emission reductions.
Among them, the EU ETS is the largest example of national policy incentivizing both domestic emission
reductions and the use of KP’s flexibility mechanisms. It has thus been the main driver of carbon units
trading and the main demand for CERs and ERUs. Nevertheless, while the international commitment
taken by EU15 countries in Kyoto in 1997 definitely stimulated the implementation of the EU policy on
GHG emissions, the EU ETS was approved in 2003 when the KP’s entrance into force was still uncertain.
Therefore, the causal link between the KP and the EU ETS remains unclear.
By decreasing GHG emissions and increasing GDP in the same period, developed countries have
experienced low-carbon growth since 1990. Without judging the role of the KP, it is possible to assess that
part of this low-carbon growth is linked with a less energy-intensive growth which can be explained by
three main factors: a growing share of the service sector; a less-emissive industrial sector; and a higher
use of imported goods – often known as “outsourced emissions”. Additionally, countries participating in
the agreement appear to have directly addressed the issue of decarbonizing their energy mix to stabilize
and reduce emissions.
The second commitment period (2013-2020), on the one hand, appears today to be rather symbolic as its
coverage is limited to less than 15% of global emissions and its ambition is hampered by an accumulated
surplus from the first commitment period. On the other hand, the second commitment period will allows
the continuation of useful mechanisms and MRV processes and keep the continuity with the
implementation of the new international agreement expected by 2020.
This first ex-post analysis of the results of the Kyoto Protocol offers several key lessons for the new global
agreement to be negotiated in Paris in late 2015:
Expanding the coverage: striking a balance between overall environmental integrity and
flexibility for specific circumstances
While the KP targets on emissions were overachieved, emissions grew globally at an unprecedented rate
– particularly in non-Annex B countries. Therefore, as total global emission levels are at stake to halt
climate change, increasing the emissions coverage of an agreement improves its chance to mitigate
climate change. This thus demonstrates the importance of including more countries and sectors.
During the elaboration of the KP, specific rules were negotiated to incentivize the inclusion of more parties
and a total of more emissions: LULUCF rules, exclusion of part of emissions (Iceland) and even hot air.
These specificities were responses to national or sectoral contexts. However, some specific sectors
remained untreated given contentions and the potential to jeopardize the larger agreement – such as
international transport.
Except for “hot air”, these choices had little impact on the global environmental integrity of commitments
and led to the inclusion of more countries (e.g. Australia and Iceland) and sectors (e.g. forest
management).
This demonstrates how specific rules – when used appropriately – could help to unlock dead-ends.
However, this should not become a mainstream strategy as it seems more reasonable to limit the number
of specific rules in order to keep readability and decrease the risk of windfall profits and specific rules
jeopardizing the global environmental integrity of an agreement.
The impact of “hot air” cancellation on the participation of some countries during the CP2 is a reminder of
how the tradeoff between better emission coverage and environmental integrity may remain hard to

Climate Report n°44 – Ex-post evaluation of the Kyoto protocol:
Four key lessons for the 2015 Paris Agreement
31
balance. In addition, the KP shows that having different base-years – which could be seen as “specific
rules” – is not an issue when there is a common and reliable reporting process and that emission
commitments can be translated into absolute emissions.26
Removing the virtual specter of internationally legally binding commitments and limiting the
focus on methods of compliance
Historically, the KP was defined as “legally binding” because of the written obligation to comply with
emission targets. However, in practice, enforcement was limited to “name and shame” as illustrated by the
Canadian withdrawal and the lack of credible sanctions.27
Furthermore, the seemingly binding nature of
the KP may have led to a decreased coverage as illustrated by the non-ratification by the USA - or the
non-participation of Japan in the CP2 for instance.
Extensive negotiations and resources were dedicated in demarcating the boundaries of compliance and
dedicated tools. However, in the end, part of the rules and tools implemented were not extensively used
by countries – such as the trade of AAUs between States. This is partly due to the low need to use
flexibility mechanisms (i.e. lack of a stringent emissions cap), but also the mistrust surrounding them.
Dedicating significant resource and time as has been the case until now on emissions reduction
commitments and their legally binding nature may thus not be the most efficient approach. Nevertheless,
a new agreement should leverage “international pressure” for compliance, as domestic policies alone are
much more sensitive to change in national contexts such as a change of governments.
Focusing on MRV processes
Obligations behind the KP – and more generally the UNFCCC – are broader than the compliance on
emissions. Indeed, all MRV processes about emissions, policies implemented and use of mechanisms did
give the tools to build trust. The transparency induced by the KP, based on agreed common reporting
rules, enables the comparison and monitoring on an annual basis the actions taken by countries – even if
they differ – as well as impact on emissions.
The MRV processes are the basis of any international agreement. Therefore, the “legally binding”
characteristics of a new agreement could prioritize MRV requirements over the legally binding form of
commitments to reduce emissions. Improving the existing MRV requirements and extending them to more
countries or policy areas would be a useful way to build upon one of the key successes of the KP. The
recent moves since the COP17 in Durban to develop MRV requirements for developing countries should
move in this direction
Providing flexibility in the agreement and its adoption process
The Kyoto Protocol was established in two steps: a political framework agreement in 1997 establishing
commitments and tools; and technical rules agreed in Marrakesh in 2001 (although detailed rules were
continuously amended throughout the KP’s history). Therefore, the Paris agreement could be a framework
agreement creating tools and flexibility mechanisms with detailed rules to be determined by 2020.
Despite this plasticity in designing the KP, its rigidness – the ratification process, defined commitment
periods – was one of the sources of its limitations: risk of non-ratification from signing countries, risk of not
designing new rules on time for the second commitment period, etc. Therefore, flexibility should be
included both in the way the agreement is designed – potentially one framework agreement and another
agreement focused on detailed rules – and in agreement itself in order to avoid renegotiating it almost
entirely for each commitment period.
26 It is the case for the different kinds of voluntary targets taken by countries in Copenhagen and Cancun except notably when
the target is defined in emissions per GDP (China and India).
27 The Marrakesh accords specified a suspension of being able to trade units and less AAU distributed in the second
commitment period (CP2) but the requested amendments were never adopted under the KP.

Climate Report n°44 – Ex-post evaluation of the Kyoto protocol:
Four key lessons for the 2015 Paris Agreement
32
APPENDICES
Appendix 1 - Acronyms and definitions
AAU: Assigned Amount Units; quotas distributed to countries equivalent to their allowed emissions
Annex B: Annex B of the Kyoto Protocol detailing developed countries and their commitment subject
to the KP.
Annex B-1997: Annex B as it was defined in 1997, including the USA and Canada
Annex B-2012: Annex B as it is actually at the end of the first commitment period, i.e. Annex B-1997
excluding the USA and Canada
CER: Certified Emission Reductions; tradable carbon credits stemming from emission reductions in
CDM projects
CDM: Clean Development Mechanism; project mechanism in non-Annex B countries
CEP: Climate and Energy Package
tCO2e: metric ton CO2 equivalent; method of measuring greenhouse gases based on the global
warming potential of each gas relative to CO2
CP: Commitment Period
CP1: First Commitment Period (2008-2012)
CP2: Second Commitment Period (2013-2020)
EUA: European Union Allowance; quota used under the EU ETS
EIT: Economies in Transition. (see the list in the Appendix 2)
ERU: Emission Reduction Units; tradable carbon credit stemming from emission reductions in JI
projects
ETS: Emissions Trading Scheme
EU: European Union
EU10: Eastern EU countries; countries member of the EU27 but not of the EU15 expect Cyprus and
Malta
EU15: Western EU countries
GHG: Greenhouse Gas
JANZ: Group of countries
JI: Joint implementation; project mechanism in Annex B countries
KP: Kyoto Protocol
l-CER: Long-term CER issued for an afforestation or reforestation project activity which expires at
the end of its crediting period
LULUCF: land use, land-use change and forestry
MRV: Monitoring, Reporting and Verification
RMU: Removal Unit; carbon units generated on the basis of LULUCF activities such as reforestation
t-CER: Temporary CER issued for an afforestation or reforestation project activity under the CDM
which expires at the end of the commitment period following the one during which it was issued.
UNFCCC: United Nations Framework Convention on Climate Change

Climate Report n°44 – Ex-post evaluation of the Kyoto protocol:
Four key lessons for the 2015 Paris Agreement
33
Appendix 2 – List of countries by group and position for the CP1
Source: CDC Climat Research calculations based on UNFCCC and national inventories data.
CountryKyoto CP1 Target
(in %)
Evolution of GHG
emissions in 2008-
2012 compared to
the base-year (in %)
Distance to
Kyoto objective
(in % points)
Austria -13.0 3.2 -16.2
Belgium -7.5 -13.9 6.4
Denmark -21.0 -17.3 -3.7
Finland 0.0 -5.5 5.5
France 0.0 -10.5 10.5
Germany -21.0 -24.3 3.3
Greece 25.0 11.5 13.5
Ireland 13.0 5.1 7.9
Italy -6.5 -7.1 0.6
Luxembourg -28.0 -9.3 -18.7
Netherlands -6.0 -6.2 0.2
Portugal 27.0 3.5 23.5
UK -12.5 -23.4 10.9
Spain 15.0 20.0 -5.0
Sweden 4.0 -18.3 22.3
EU15 -8.1 -13.2 5.1
Australia 8.0 3.2 4.8
Japan -6.0 -2.5 -3.5
New Zealand 0.0 -2.7 2.7
JANZ -1.7 -0.8 -0.9
Iceland 10.0 10.0 0.0
Liechtenstein -8.0 2.5 -10.5
Monaco -8.0 -12.5 4.5
Norway 1.0 8.2 -7.2
Switzerland -8.0 -4.0 -4.0
Others An. B-2012 -3.2 2.2 -5.4
Annex B-2012 w\o EITs -6.1 -9.2 3.1
Bulgaria -8.0 -53.5 45.5
Croatia -5.0 -10.9 5.9
Czech Republic -8.0 -30.6 22.6
Estonia -8.0 -54.2 46.2
Hungary -6.0 -43.7 37.7
Lithuania -8.0 -57.9 49.9
Latvia -8.0 -61.2 53.2
Poland -6.0 -29.5 23.5
Romania -8.0 -57.0 49.0
Russian Federation 0.0 -36.4 36.4
Slovakia -8.0 -37.5 29.5
Slovenia -8.0 -9.7 1.7
Ukraine 0.0 -57.2 57.2
EITs -1.9 -40.6 38.7
Annex B-2012 -4.1 -24.3 20.2
United States -7.0 9.5 -16.5
Canada -6.0 18.5 -24.5
USA & Canada -6.9 10.3 -17.2
Annex B-1997 -5.1 -11.8 6.7
US
A &
Can
ad
a
An
nex B
-2012
An
nex B
-1997
EU
15
JA
NZ
Oth
ers
An
. B
-
2012
An
nex B
-2012 w
\o E
ITs
EIT
s

Climate Report n°44 – Ex-post evaluation of the Kyoto protocol:
Four key lessons for the 2015 Paris Agreement
34
Appendix 3 – Evaluation of carried-over surplus and its impact on CP2
Notes:
It is still unclear if the PPSR will be common to EU15 countries or if each country will have its own specific PPSR. This would have a direct impact on
the limitation of carrying-over CERs/ERUs. The first case would limit the loss of credits.
EITs refer to Economies in Transition. Here, only non-EU countries are included. The participation of Belarus, Kazakhstan and Ukraine is still
uncertain.
To be able to use its surplus, Ukraine shall modify officially its commitment (see p.28) into -58%. This is not exactly, but closed, to the combination of
original Ukrainian target (-24%) combined with the CP1 surplus: -54% in total.
Source: CDC Climat Research calculations based on UNFCCC, national inventories and registries data.
Country
Surplus/lack of units (in
ktCO2e) usable for KP
compliance
Surplus of entity-owned
credits that can be
carried-over (in ktCO2e)
Amount of credits that
could not be carried-
over as of 31 December
2013 (in ktCO2e)
Total surplus that can be
carried-over per year of
CP2 (in % base-year
emissions)
Effective CP2 commitment
taking into account Doha
rules without using carried-
over surplus (% B-Y
emissions)
New possible CP2 commitment
without making new effort than
taken by countries and using
surplus (% B-Y emissions)
Austria - 2,572 4,952 - 0.4%
Belgium - 1,292 16,850 1,870 1.3%
Denmark 2,710 392 - 0.6%
Finland 12,909 261 - 2.3%
France 174,702 2,093 - 3.9%
Germany 226,048 1,471 - 2.3%
Greece 44,569 0 - 5.2%
Ireland 6,574 6,407 - 2.9%
Italy - 25,690 5,785 - -0.5%
Luxembourg - 965 63 - -0.9%
Netherlands 17,560 25,032 624 2.5%
Portugal 48,441 5,623 - 11.2%
UK 397,687 78,747 - 7.6%
Spain 23,793 5,892 - 1.3%
Sweden 71,767 1,380 - 12.7%
European community 2,129,865 - - n.a
EU15 if common carrying-over 3,126,106 157,441 0 9.6% -20% -30%
Bulgaria 264,440 24 - 24.9%
Czech Republic 48,245 19 - 3.1%
Estonia 37,652 - - 11.0%
Hungary 180,015 25 - 19.5%
Lithuania 72,686 5,167 - 19.7%
Latvia 28,250 21 - 13.6%
Poland 509,734 5,928 - 11.4%
Romania 558,771 131 - 25.1%
Slovakia 36,822 4 - 6.4%
Slovenia 1,241 0 - 0.8%
Cyprus
Malta
EU27 4,863,962 168,761 0 10.9% -20% -31%
Croatia 9,264 - - 3.7% -20% -24%
Iceland 5 - - 0.0% -20% -20%
European CP2 Bubble 4,873,231 168,761 0 10.9% -20% -31%
Australia 25,091 45 - 0.6% -1.0% -1.1%
Liechtenstein 51 3 - 3.0% -16% -19%
Monaco 24 - - 2.8% -22% -25%
Norway 24,627 1,267 - 6.5% -16% -23%
Switzerland 10,537 6,071 71,738 3.9% -15.8% -20%
Ukraine 2,059,251 - - 28.0% -57% -52%
Belarus -36% -12%
Kazakhstan -27% -5%
TOTAL incl. non-EU EITs 6,992,812 176,147 71,738 11.4% -24% -30%
TOTAL excl. non-EU EITs 4,933,561 176,147 71,738 9.9% -18% -28%

Climate Report n°44 – Ex-post evaluation of the Kyoto protocol:
Four key lessons for the 2015 Paris Agreement
35
REFERENCES
Alberola, E. and Stephan, N. (2010). Carbon funds in 2010: Investment in Kyoto credits and
emission reductions. Climate report n°23. http://www.cdcclimat.com/Climate-Report-no23-
Carbon-funds.html
Clapp C., Leseur A., Sartor O., Briner G., Corfee-Morlot, J. (2010). Cities and Carbon Market
Finance: Taking Stock of Cities‟ Experience with Clean Development Mechanism (CDM) and
Joint Implementation (JI). OECD Environmental Working Paper No. 29, OECD Publishing.
http://www.cdcclimat.com/Cities-and-Carbon-Market-Finance.html
Doha decisions (2012). http://unfccc.int/resource/docs/2012/cmp8/eng/13a01.pdf
Dupont, M., Morel, R., Bellassen, V. and Deheza, M. (2013). International Climate Negotiations –
COP 19: do not underestimate the MRV breakthrough. Climate Brief n°33.
http://www.cdcclimat.com/Climate-Brief-no33-International.html
EC – European Council (2002). 2002/358/EC: Council Decision of 25 April 2002 concerning the
approval, on behalf of the European Community, of the Kyoto Protocol to the United Nations
Framework Convention on Climate Change and the joint fulfilment of commitments thereunder.
http://eur-lex.europa.eu/legal-content/EN/TXT/PDF/?uri=CELEX:32002D0358&from=EN
EC – European Council (2009). Decision No 406/2009/EC of the European Parliament and of the
Council of 23 April 2009 on the effort of Member States to reduce their greenhouse gas emissions
to meet the Community’s greenhouse gas emission reduction commitments up to 2020. http://eur-
lex.europa.eu/legal-content/EN/TXT/PDF/?uri=CELEX:32009D0406&from=EN
EEA – European Environment Agency (2013). Trends and projections in Europe 2013. Tracking
progress towards Europe's climate and energy targets until 2020.
http://www.eea.europa.eu/publications/trends-and-projections-2013/full-report-ghg-trends-and-1
Environmental Investment Centre of Estonia (2014). Green Investment Scheme. [Online]
http://kik.ee/en/green-investment-scheme
EU – European Union (2012). Information on the quantified emission limitation or reduction
objectives (QELROs) for the second commitment period under the Kyoto Protocol.
http://unfccc.int/files/meetings/ad_hoc_working_groups/kp/application/pdf/awgkp_eu_19042012.p
df
European Commission (2010). Towards an enhanced market oversight framework for the EU
Emissions Trading Scheme. COM(2010) 796. http://eur-
lex.europa.eu/LexUriServ/LexUriServ.do?uri=COM:2010:0796:FIN:EN:PDF
IPCC – Intergovernmental Panel on Climate Change (2014). Working group III. Mitigation of
Climate Change. http://mitigation2014.org/report/final-draft/
Global Carbon Project (2013). www.globalcarbonatlas.org
Kyoto Protocol (1997). http://unfccc.int/resource/docs/convkp/kpeng.pdf
Le, H. and Delbosc, A. (2012). Japan’s Bilateral Offset Crediting Mechanism: A Bilateral Solution
to a Global Issue? Climate Brief n°11. http://www.cdcclimat.com/Climate-Brief-no11-Japan-s.html
Marrakesh Accords (2001). http://unfccc.int/resource/docs/cop7/13a01.pdf and
http://unfccc.int/resource/docs/cop7/13a02.pdf
Ministry for the Environment of New Zealand (2013). Projects to reduce emissions (PRE). [Online]
http://www.mfe.govt.nz/issues/climate/policies-initiatives/projects/
Morel, R., Bellassen, V., Deheza, M., Delbosc, A. and Leguet, B. (2011). Durban: one small
promising step for climate... by 2020. Climate Brief n°10. http://www.cdcclimat.com/Climate-Brief-
no10-Durban-one.html

Climate Report n°44 – Ex-post evaluation of the Kyoto protocol:
Four key lessons for the 2015 Paris Agreement
36
Morel, R. Leguet, B. and Bellassen, V. (2012). International climate negotiations at COP 18: the
art of the Doha-ble. Climate Brief n°24. http://www.cdcclimat.com/Climate-Brief-no24-
International-climate-negotiations-at-COP-18-the-art-of-the-Doha-ble,1237.html
Morel, R. (2013). How the negotiators tackled the “hot air” issue for the second commitment
period of the Kyoto Protocol. http://www.cdcclimat.com/How-the-negotiators-tackled-the.html
Point Carbon (2012). Carry-over of AAUs from CP1 to CP2 – Future implications for the climate
regime. http://carbonmarketwatch.org/wp-content/uploads/2012/11/AAU-banking-briefing-paper-
Point-Carbon.pdf
Shishlov, I. (2011). Joint Implementation in Russia: on track to overtake Brazil as the third largest
supplier of Kyoto offsets. http://www.cdcclimat.com/Climate-Brief-no8-Joint.html
Shishlov, I. (2012). The CDM: let’s not discard a tool that raised over US$200 billion. Tendances
Carbone n°75. http://www.cdcclimat.com/Tendances-Carbone-no75-The-CDM-let-s-not-discard-
a-tool-that-raised-over-US-200-billion.html
Shishlov, I. and Bellassen, V. (2012). 10 lessons from 10 years of the CDM. Climate Report n°37.
http://www.cdcclimat.com/Climate-Report-no37-10-lessons-from-10-years-of-the-CDM.html
Shishlov, I., Bellassen, V. and Leguet, B. (2012). Joint Implementation: a frontier mechanism
within the borders of an emissions cap. Climate Report n°33. http://www.cdcclimat.com/Climate-
Report-no33-Joint-Implementation-a-frontier-mechanism-within-the-borders-of-an-emissions-
cap.html
Statement by Minister Kent (2011). 12, December 2011.
http://www.ec.gc.ca/default.asp?lang=En&n=FFE36B6D-1&news=6B04014B-54FC-4739-B22C-
F9CD9A840800
Stephan, N., Bellassen, V. and Alberola, E. (2014). Use of Kyoto credits by European
installations: from an efficient market to a burst bubble. http://www.cdcclimat.com/Climate-Report-
no43-Use-of-Kyoto.html
UNEP Risoe (2012). CDM/JI Pipeline Analysis and Database. UNEP Risoe. [Online] February
2014. http://www.cdmpipeline.org
UNFCCC (2008). Kyoto Protocol Reference Manual on accounting of emissions and assigned
amount. http://unfccc.int/resource/docs/publications/08_unfccc_kp_ref_manual.pdf
UNFCCC GHG Inventories and registries under the Kyoto Protocol (2014).
http://unfccc.int/national_reports/annex_i_ghg_inventories/national_inventories_submissions/item
s/8108.php
World Bank (2014). GDP, PPP (constant 2005 international $); Energy use (ktoe); agriculture,
industry and services value added (% of GDP). http://data.worldbank.org/indicator
Zhenchuk, M. (2012). The integrity of Joint Implementation projects in Ukraine. The national
ecological centre of Ukraine. http://en.necu.org.ua/files/2012/11/JIUkrainian_IntegrityStudy_en.pdf

Climate Report n°44 – Ex-post evaluation of the Kyoto protocol:
Four key lessons for the 2015 Paris Agreement
37
LATEST PUBLICATIONS IN CDC CLIMAT’S “CLIMATE REPORTS” SERIES
No. 43 Use of Kyoto credits by European installations: from an efficient market to a burst bubble
NICOLAS STEPHAN, VALENTIN BELLASSEN & EMILIE ALBEROLA - January 2014
No. 42 Power sector in Phase 2 of the EU ETS: fewer CO2 emissions, but just as much coal
NICOLAS BERGHMANS & EMILIE ALBEROLA - November 2013
No. 41 Combating Fuel Poverty: Policies in France and the United Kingdom
JOHAN TYSZLER, CECILE BORDIER & ALEXIA LESEUR - September 2013
No. 40 Forests and climate change mitigation in the European policies: priority to fuel wood
FREDERIC BARON, VALENTIN BELLASSEN & MARIANNA DEHEZA - April 2013
No. 39 More than 800 agricultural and agri-food sites are affected by the EU ETS
CLAUDINE FOUCHEROT & VALENTIN BELLASSEN - March 2013
No. 38 The economic tools of Chinese climate and energy policy at the time of the 12th
five-year plan
DI ZHOU & ANAÏS DELBOSC –January 2013
No. 37 Ten lessons from 10 years of the CDM
IGOR SHISHLOV & VALENTIN BELLASSEN - October 2012
No. 36 Regional Climate, Air and Energy Plans: a tool for guiding the energy and climate transition in French regions
JEREMIE DE CHARENTENAY, ALEXIA LESEUR & CECILE BORDIER - September 2012
No. 35 Delivering REDD+ incentives to local stakeholders: lessons from forest carbon frameworks in developed countries
MARIANA DEHEZA & VALENTIN BELLASSEN - August 2012
No. 34 Including international aviation in the EU ETS: a first step towards a global scheme?
EMILIE ALBEROLA & BORIS SOLIER - May 2012
No. 33 Joint implementation: a frontier mechanism within the borders of an emissions cap
IGOR SHISHLOV, VALENTIN BELLASSEN & BENOÎT LEGUET - February 2012
No. 32 Financing climate actions in developing countries: what role is there for NAMAs?
ROMAIN MOREL & ANAÏS DELBOSC -February 2012
No. 31 Carbon offset projects in the agricultural sector
CLAUDINE FOUCHEROT & VALENTIN BELLASSEN -December 2011
No. 30 The role of regional authorities in public support for renewable energies: examples in Europe and France
MARION JEULIN & ANAÏS DELBOSC -November 2011
No. 29 Voluntary carbon offsetting by local authorities: practices and lessons
AMADOU KEBE, VALENTIN BELLASSEN & ALEXIA LESEUR -September 2011
No. 28 Design of multi-sector Emission Trading Schemes: a comparison of European and US experiences
CECILE GOUBET & ANAÏS DELBOSC - May 2011
All CDC Climat Research publications are available from:
http://www.cdcclimat.com/Publications