Embed Size (px)
Citation preview
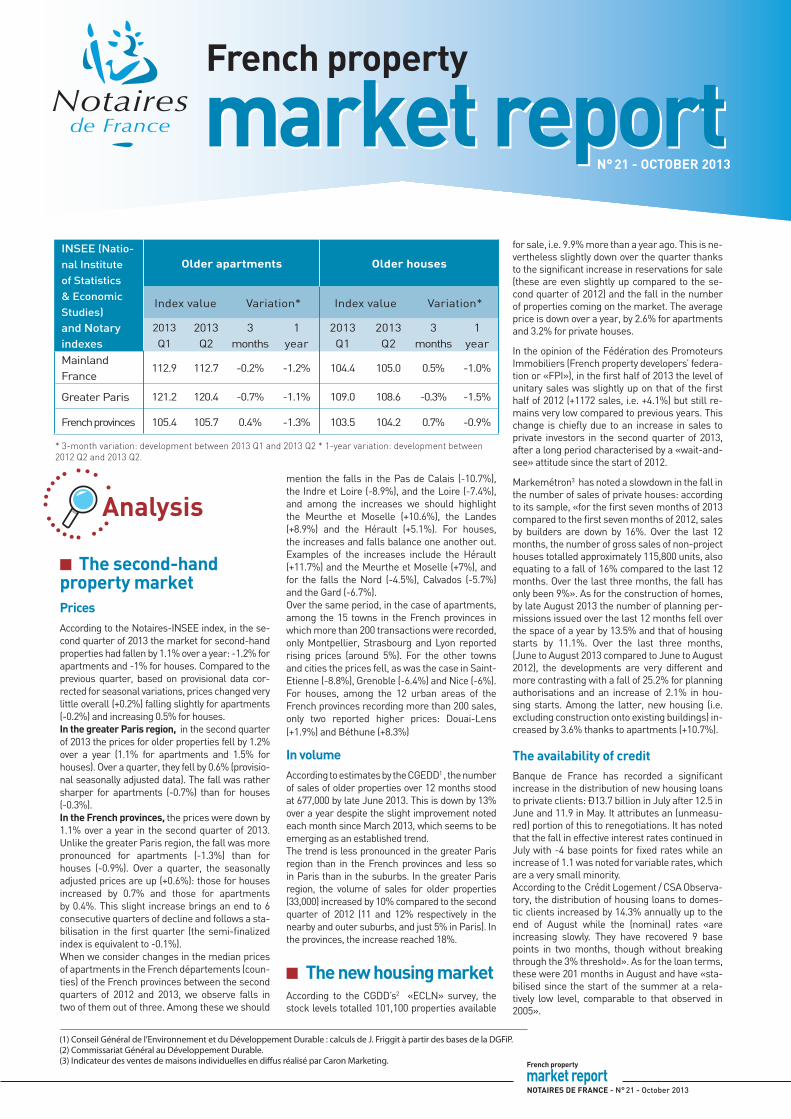
■ The second-hand property marketPricesAccording to the Notaires-INSEE index, in the se-cond quarter of 2013 the market for second-hand properties had fallen by 1.1% over a year: -1.2% for apartments and -1% for houses. Compared to the previous quarter, based on provisional data cor-rected for seasonal variations, prices changed very little overall (+0.2%) falling slightly for apartments (-0.2%) and increasing 0.5% for houses.In the greater Paris region, in the second quarter of 2013 the prices for older properties fell by 1.2% over a year (1.1% for apartments and 1.5% for houses). Over a quarter, they fell by 0.6% (provisio-nal seasonally adjusted data). The fall was rather sharper for apartments (-0.7%) than for houses (-0.3%).In the French provinces, the prices were down by 1.1% over a year in the second quarter of 2013. Unlike the greater Paris region, the fall was more pronounced for apartments (-1.3%) than for houses (-0.9%). Over a quarter, the seasonally adjusted prices are up (+0.6%): those for houses increased by 0.7% and those for apartments by 0.4%. This slight increase brings an end to 6 consecutive quarters of decline and follows a sta-bilisation in the first quarter (the semi-finalized index is equivalent to -0.1%).When we consider changes in the median prices of apartments in the French départements (coun-ties) of the French provinces between the second quarters of 2012 and 2013, we observe falls in two of them out of three. Among these we should
mention the falls in the Pas de Calais (-10.7%), the Indre et Loire (-8.9%), and the Loire (-7.4%), and among the increases we should highlight the Meurthe et Moselle (+10.6%), the Landes (+8.9%) and the Hérault (+5.1%). For houses, the increases and falls balance one another out. Examples of the increases include the Hérault (+11.7%) and the Meurthe et Moselle (+7%), and for the falls the Nord (-4.5%), Calvados (-5.7%) and the Gard (-6.7%).Over the same period, in the case of apartments, among the 15 towns in the French provinces in which more than 200 transactions were recorded, only Montpellier, Strasbourg and Lyon reported rising prices (around 5%). For the other towns and cities the prices fell, as was the case in Saint-Etienne (-8.8%), Grenoble (-6.4%) and Nice (-6%). For houses, among the 12 urban areas of the French provinces recording more than 200 sales, only two reported higher prices: Douai-Lens (+1.9%) and Béthune (+8.3%)
In volumeAccording to estimates by the CGEDD1 , the number of sales of older properties over 12 months stood at 677,000 by late June 2013. This is down by 13% over a year despite the slight improvement noted each month since March 2013, which seems to be emerging as an established trend.The trend is less pronounced in the greater Paris region than in the French provinces and less so in Paris than in the suburbs. In the greater Paris region, the volume of sales for older properties (33,000) increased by 10% compared to the second quarter of 2012 (11 and 12% respectively in the nearby and outer suburbs, and just 5% in Paris). In the provinces, the increase reached 18%.
■ The new housing marketAccording to the CGDD’s2 «ECLN» survey, the stock levels totalled 101,100 properties available
for sale, i.e. 9.9% more than a year ago. This is ne-vertheless slightly down over the quarter thanks to the significant increase in reservations for sale (these are even slightly up compared to the se-cond quarter of 2012) and the fall in the number of properties coming on the market. The average price is down over a year, by 2.6% for apartments and 3.2% for private houses.
In the opinion of the Fédération des Promoteurs Immobiliers (French property developers’ federa-tion or «FPI»), in the first half of 2013 the level of unitary sales was slightly up on that of the first half of 2012 (+1172 sales, i.e. +4.1%) but still re-mains very low compared to previous years. This change is chiefly due to an increase in sales to private investors in the second quarter of 2013, after a long period characterised by a «wait-and-see» attitude since the start of 2012.
Markemétron3 has noted a slowdown in the fall in the number of sales of private houses: according to its sample, «for the first seven months of 2013 compared to the first seven months of 2012, sales by builders are down by 16%. Over the last 12 months, the number of gross sales of non-project houses totalled approximately 115,800 units, also equating to a fall of 16% compared to the last 12 months. Over the last three months, the fall has only been 9%». As for the construction of homes, by late August 2013 the number of planning per-missions issued over the last 12 months fell over the space of a year by 13.5% and that of housing starts by 11.1%. Over the last three months, (June to August 2013 compared to June to August 2012), the developments are very different and more contrasting with a fall of 25.2% for planning authorisations and an increase of 2.1% in hou-sing starts. Among the latter, new housing (i.e. excluding construction onto existing buildings) in-creased by 3.6% thanks to apartments (+10.7%).
The availability of creditBanque de France has recorded a significant increase in the distribution of new housing loans to private clients: €13.7 billion in July after 12.5 in June and 11.9 in May. It attributes an (unmeasu-red) portion of this to renegotiations. It has noted that the fall in effective interest rates continued in July with -4 base points for fixed rates while an increase of 1.1 was noted for variable rates, which are a very small minority.According to the Crédit Logement / CSA Observa-tory, the distribution of housing loans to domes-tic clients increased by 14.3% annually up to the end of August while the (nominal) rates «are increasing slowly. They have recovered 9 base points in two months, though without breaking through the 3% threshold». As for the loan terms, these were 201 months in August and have «sta-bilised since the start of the summer at a rela-tively low level, comparable to that observed in 2005».
N° 21 - OCTOBER 2013
Analysis
* 3-month variation: development between 2013 Q1 and 2013 Q2 * 1-year variation: development between 2012 Q2 and 2013 Q2.
INSEE (Natio-nal Institute of Statistics & Economic Studies) and Notary indexes
Older apartments Older houses
Index value Variation* Index value Variation*
2013 Q1
2013 Q2
3 months
1 year
2013 Q1
2013 Q2
3 months
1 year
Mainland France
112.9 112.7 -0.2% -1.2% 104.4 105.0 0.5% -1.0%
Greater Paris 121.2 120.4 -0.7% -1.1% 109.0 108.6 -0.3% -1.5%
French provinces 105.4 105.7 0.4% -1.3% 103.5 104.2 0.7% -0.9%
(1) Conseil Général de l’Environnement et du Développement Durable : calculs de J. Friggit à partir des bases de la DGFiP.(2) Commissariat Général au Développement Durable.(3) Indicateur des ventes de maisons individuelles en diffus réalisé par Caron Marketing.
market reportFrench property
NOTAIRES DE FRANCE - N° 21 - October 2013
French property
market report

Less than 0 % From 0 % to 5 % 5 % and more
ns = not significant (the volume of sales is insufficient to calculate relevant statistics) Source: Property databases from Notaires de France (the prices for greater Paris are a valuation of the notaries’–INSEE index for the 2nd quarter of 2013).
Median prices per m2 of older apartments in the 2nd quarter of 2013 Developments over a year: 1 April 2013 to 30 June 2013 / 1 April 2012 to 30 June 2012
Strasbourg2 400 €
4.7 %Tours 2 270 €-4.6 %
Nîmes 1 710 €
2.2 %
Saint-Étienne 1 090 €-8.8 %
Orléans 1 980 € -1.7 %
Grenoble2 220 €-6.4 %
Clermont-Ferrand1 710 €6.6 %Bordeaux
2 820 €-3.8 %
Bayonne2 720 €-4.2 %
Montpellier2 680 €
4.3 %
Toulouse2 480 €-2.7 %
Nantes2 570 €-1.7 %
Dijon2 070 €-0.7 %
Lyon 3 330 €
5.1 %Limoges1 180 € -6.8%
Poitiers1 540 €-4.9 %
Rennes2 350 €-0.9 %
Caen1 960 €-5.2 %
Mulhouse1 130 €-6.6 %
Besançon1 690 €-2.7 %
Marseille2 320 €-5.9 %
Nice3 510 €-6.0 %
La Réunion 2 240€
-0.5 %
Toulon 2 290 €-2.5 %
Corse-du-Sud 3 100 €
-2.2%
Haute-Corse 2 190 € -5.9 %
Reims2 020 €-3.2 %
Nancy1 880 €
2.4 %
Metz1 730 €-4.9 %
Outlook
With the draft law on access to housing (the «ALUR» law) recently adopted by the National Assembly on its first reading and now being examined in the Senate, what is the outlook for developments in the property market over the coming months? The answer to this question is dependent on several factors:- Psychological factors: household confidence is largely dependent on the economic climate and particularly on employment. The most recent economic survey from INSEE provides an initial response, noting that ‘the business climate is continuing to improve3. - Economic factors: the health of the property market is related to interest rates. Are we heading towards a period of rising rates? The decision by the American Federal Reserve to maintain an accommodating monetary policy would suggest otherwise, for at least the year to come. Moreover, in the new property market, for which marketing times and stock levels remain high, the so-called «Duflot» tax-exemption measure is not generating much enthusiasm.-Legal and fiscal factors: the temporary reduction in the capital gains tax should inject new dynamism into the market for second
homes over the months to come (please see the detailed example on page 4). On the other hand, the increase in the departmental (county) portion of the transfer tax from 3.8% to a maximum of 4.5% authorised for 24 months as from 1 March 2014 has further added to buyers’ costs. This increase nevertheless remains hypothetical at this stage as the departmental councils have the option of using this measure or otherwise. In all circumstances, the measure should not have a significant impact on the market. We must also wait the application of the new provisions of the ALUR law concerning the regulation of rents or the universal rent guarantee to measure the possible impact on owners and investors.
Are we heading for a land shortage?Building land, both for the construction of apartment buildings or private homes, does not qualify for the reduction of taxation on real estate capital gains. On the contrary, the capital gains generated will become 100% taxable on 1 January 2014. Real estate professionals have constantly warned the public authorities of the obstacles such a measure could generate. During the last quarter, will sellers be tempted to put their
building plots on the market more quickly to benefit from the current scheme before the brutal stoppage expected on 1 January? Apart from forced sales, on this date there is a risk that the market will be limited to on-going / in progress (?) land development operations from the professional sector.
Furthermore, will the increase from 20 to 25% in the minimal required percentage of social housing in a certain number of communities adversely affect the fluidity of the property market? Indeed, the costs generated by the resulting increase in the proportion of social housing in property developments may be mechanically carried over to the prices of apartments sold to other buyers.
Amiens2 070 €-7.1 %
Paris 8 200 € -1.9 %
Lille3 050 €-0.5%
Rouen 2 310 €
3.6 %
Annual change in prices per sq.m
La GuyaneLa GuadeloupeLa Martinique
NS
Average prices per m² for new apartments in the 2nd quarter of 2013 Developments over a year: 1 April 2013 to 30 June 2013 / 1 April 2012 to 30 June 2012
Changes in prices per m²
Less than 0 %
From 0 % to 5 %
5 % and morens = not significant (the volumeof sales is insufficient to calculaterelevant statistics) Source:FPI France / CGDD
Picardie3 225 €
5.4 %
Île-de-France4 696 €-5.4 %
Haute-Normandie3 321 €-3.6 %
Champagne-Ardennes3 266 €
7.8 %
Basse-Normandie3 527 € -1.6 %
Nord-Pas- de-Calais3 200 €
4.3 %
Bretagne3 119 €-1.6 %
Pays-de- la-Loire3 536 €
2.6 %
Limousin2 510 €
7.0 %
Poitou-Charentes3 911 €11.8 %
Aquitaine3 516 €
0.0 %
Midi-Pyrénées3 446 €-3.3 %
Languedoc-Roussillon
3 513 €-0.8 %
Centre3 255 € 2.4 %
PACA4 085 €-4.7 %
Rhône-Alpes3 666 €-0.7 %
Franche-Comté2 760 €-5.1 %
Lorraine2 654 €-6.0 %
Alsace3 109 € 2.0 %
Bourgogne2 840 €
2.2 %
Auvergne2 855 €-2.1 %
Corse3 566 €
1.0 %
Median sales prices of older houses in the 2nd quarter of 2013 Developments over a year: 1 April 2013 to 30 June 2013 / 1 April 2012 to 30 June 2012
The statistics for houses concern the whole urban area (town centre + suburbs)
Annual change in sales prices
Less than 0 % From 0 % to 5 % 5 % and more
ns = not significant (the volume of sales is insufficient to calculate relevant statistics) Source: Property databases from Notaires de France (the prices for greater Paris are a valuation of the notaries’–INSEE index for the 2nd quarter of 2013).
Amiens146 500 €
-10.9 %Rouen
166 000 €-3.5 %
Reims199,300 €
-2.8 %
Lille171 000 €
-6.7 %
Brest 161 200 €
-6.3 %
Nantes235 000 €
-4.1 %
Poitiers164 000 €
4.6 %
Nîmes221 500 €
-8.1 %Bordeaux249 400 €
-1.2 %
Angers207 000 €
-1.4 %
Montauban158 500 €
-9.5 %
Toulouse259 000 €
-4.8 %Montpellier301 100 €
2.1 %
Marseille / Aix-en-Provence
294 200 €-3.5 %
Orléans198 000 €
-1.0 %
Toulon349 600 €
-2.0 %
Tours 209 000 €
2.0 %
Chartres 200 000 €
-4.8 %
Lyon303 500 €
-2.4 %
Le Havre167 300 €
-1.6 %
Grenoble306 500 €
-3.0 %
Saint-Étienne173 700 €
-7.1 %
Metz192 500 €
5.8 %
Nancy179 000 €
5.3 %Troyes
150 000 €0.0%
La GuyaneLa Guadeloupe
La MartiniqueNS
La GuyaneLa GuadeloupeLa Martinique
La RéunionNS
La Réunion167 000 €
Châteauroux120 000 €
-5.5 %
Île-de-France302 300 €
-1.5 %
Caen208 000 €
-3.0 %
Dijon213 500 €
-9.1 %
Limoges136 500 €
-15.7%
NOTAIRES DE FRANCE - N° 21 - October 2013
French property
market report
Haute-CorseNS
Corse-du-SudNS
Contact : Andrée Sénès, Business Development manager – Training & Development Department - Conseil supérieur du notariat. Editorial committee: Bruno Delabre, Philippe Laborde, Vincent Chauveau, Andrée Sénès and Claude Taffin, Scientific director of DINAMIC. Published by: Conseil supérieur du notariat - 60 bd de La Tour-Maubourg -75007 Paris - Tel. +33 (0)1.44.90.30.00 - www.notaires.fr – Design and creation: Bureau de Création - ISSN: 2100-241X
The new taxation rules for real estate capital gains
You will find the complete press kit for the annual conference on property data at notaires.fr
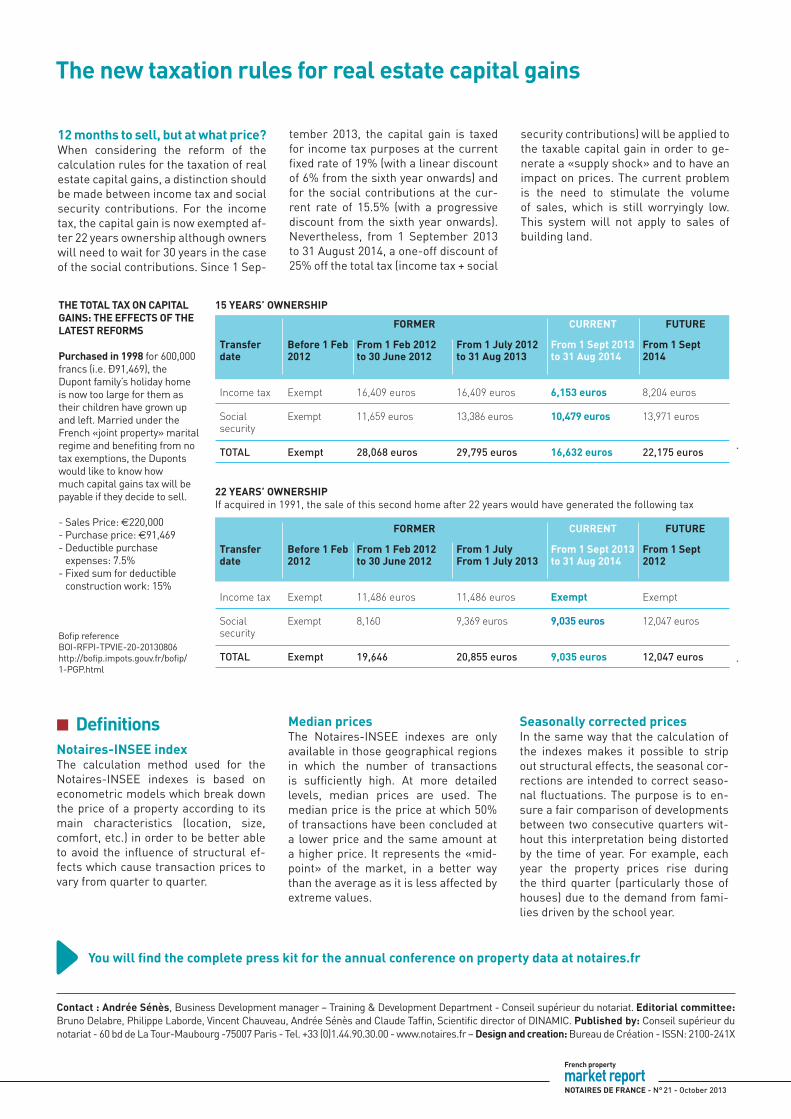
12 months to sell, but at what price?When considering the reform of the calculation rules for the taxation of real estate capital gains, a distinction should be made between income tax and social security contributions. For the income tax, the capital gain is now exempted af-ter 22 years ownership although owners will need to wait for 30 years in the case of the social contributions. Since 1 Sep-
tember 2013, the capital gain is taxed for income tax purposes at the current fixed rate of 19% (with a linear discount of 6% from the sixth year onwards) and for the social contributions at the cur-rent rate of 15.5% (with a progressive discount from the sixth year onwards). Nevertheless, from 1 September 2013 to 31 August 2014, a one-off discount of 25% off the total tax (income tax + social
security contributions) will be applied to the taxable capital gain in order to ge-nerate a «supply shock» and to have an impact on prices. The current problem is the need to stimulate the volume of sales, which is still worryingly low. This system will not apply to sales of building land.
■ DefinitionsNotaires-INSEE indexThe calculation method used for the Notaires-INSEE indexes is based on econometric models which break down the price of a property according to its main characteristics (location, size, comfort, etc.) in order to be better able to avoid the influence of structural ef-fects which cause transaction prices to vary from quarter to quarter.
Median prices The Notaires-INSEE indexes are only available in those geographical regions in which the number of transactions is sufficiently high. At more detailed levels, median prices are used. The median price is the price at which 50% of transactions have been concluded at a lower price and the same amount at a higher price. It represents the «mid-point» of the market, in a better way than the average as it is less affected by extreme values.
Seasonally corrected pricesIn the same way that the calculation of the indexes makes it possible to strip out structural effects, the seasonal cor-rections are intended to correct seaso-nal fluctuations. The purpose is to en-sure a fair comparison of developments between two consecutive quarters wit-hout this interpretation being distorted by the time of year. For example, each year the property prices rise during the third quarter (particularly those of houses) due to the demand from fami-lies driven by the school year.
THE TOTAL TAX ON CAPITAL GAINS: THE EFFECTS OF THE LATEST REFORMS
Purchased in 1998 for 600,000 francs (i.e. €91,469), the Dupont family’s holiday home is now too large for them as their children have grown up and left. Married under the French «joint property» marital regime and benefiting from no tax exemptions, the Duponts would like to know how much capital gains tax will be payable if they decide to sell.
- Sales Price: e220,000- Purchase price: e91,469- Deductible purchase
expenses: 7.5%- Fixed sum for deductible
construction work: 15%
Bofip referenceBOI-RFPI-TPVIE-20-20130806http://bofip.impots.gouv.fr/bofip/ 1-PGP.html
15 YEARS’ OWNERSHIP
FORMER
FORMER
CURRENT
CURRENT
FUTURE
FUTURE
22 YEARS’ OWNERSHIP If acquired in 1991, the sale of this second home after 22 years would have generated the following tax
Transfer Before 1 Feb From 1 Feb 2012 From 1 July 2012 From 1 Sept 2013 From 1 Septdate 2012 to 30 June 2012 to 31 Aug 2013 2014
to 31 Aug 2014
Income tax Exempt 16,409 euros 16,409 euros 6,153 euros 8,204 euros
Social security
Exempt 11,659 euros 13,386 euros 10,479 euros 13,971 euros
TOTAL Exempt 28,068 euros 29,795 euros 16,632 euros 22,175 euros
Transfer Before 1 Feb From 1 Feb 2012 From 1 July From 1 Sept 2013 From 1 Sept date 2012 to 30 June 2012 From 1 July 2013 to 31 Aug 2014 2012
Income tax Exempt 11,486 euros 11,486 euros Exempt Exempt
Social security
Exempt 8,160 9,369 euros 9,035 euros 12,047 euros
TOTAL Exempt 19,646 20,855 euros 9,035 euros 12,047 euros
NOTAIRES DE FRANCE - N° 21 - October 2013
French property
market report


![LISTE DES NOTAIRES - eRegulations Sénégal1]_1.pdf · Serigne Mbaye BADIANE 5-7 ... (221) 33 889 30 00 (221) 33 823 96 58 SCP KA & KA associés 94 rue Félix Faure BP 2899 Dakar](https://img.pdfslide.us/doc/110x75/5a7e171f7f8b9a4d628e2972/liste-des-notaires-eregulations-sngal-11pdfserigne-mbaye-badiane-5-7-221.jpg)