Embed Size (px)
Citation preview

MY TOP 5 EARNINGS TACTICS FOR OPTIONS TRADERS...
INCLUDING MY #1 OPTIONS STRATEGY FOR EARNINGS SEASON
Introduction
Why trade around earnings? Any option buyer knows that the ultimate options purchase is one that
moves sharply in the least amount of time possible in order to minimize time erosion in the option.
Earnings provide opportunities for sharp price gaps, in some cases instantly or usually overnight.
In this report, I will detail the times where I like to trade options in front of, as well as after, the earnings
event. You want to make sure you line yourself up for the best opportunities for big moves but relative
to the market's expectations. If the market already expects a big move, you have to be careful buying
options and in this report, you will learn how opportunities exist for a rarely used options strategy when
expectations for a big move get overdone.
Overview of My Top 5 Tactics
There are many potential strategies for earnings season and here are my top 5 favorite techniques to
consider. I will overview each of these strategies in this report, and then share with you my #1 favorite
earnings strategy to consistently profit from earnings reports over time.
1. Buy well in front of earnings, sell before the event
2. Know the stock's history of gaps, and find relatively cheap options to trade the average gap
3. Buy straddles or strangles to play a big move in either direction
4. Consider an options spread, where you sell relatively high implied volatility in short-term options right
before earnings and then you bet the move will be less than the market’s high expectations
5. Buy after earnings and follow the trend

First, A Quick Primer on Volatility
While "volatility" is often thrown around as a broader term relative to market risk, it actually is a specific
measurement of movement in the options markets. Historical Volatility (HV) is the actual movement
that the stock has had over the “lookback” period. Implied Volatility (IV) is how much the market
expects the stock to move going forward. The tendency is for the IV to rise ahead of an event, and then
revert back down after the event has passed as you can see in the chart below.
So we want to make sure that if we are buying an option ahead of earnings, that we don't buy too much
IV that's well ahead of HV. There are times when IV has not spiked much and the coming volatility from
the earnings news is actually greater, sometimes much greater, than the market expects. Therein lies
the opportunity.

Straddle Pricing Ahead of Earnings
I like to look at the total cost of the shortest-term options, closest to expiration, to see how the options
are priced. The straddle is if you bought BOTH a call and a put near the current price of the stock, known
as the "at-the-money" or "near-the-money" straddle. So look at the chart below as an example:
If you were buying the Apple (AAPL) April 11th (weekly options) 530 call AND also buying the 530 put,
that near-the-money 530 straddle would cost a total of 11.50 to purchase immediately (6.75 asked for
the call plus 4.75 asked for the put). That means that the buyer of this straddle has to expect the stock
will move up or down by more than 11.50 points above or below 530. Why? Because if the stock doesn't
move and finishes at the April 11th expiration right at the strike price of 530, then the worst case
happens where both the call and the put expire worthless. The best case is a monster move in either
direction. The effective breakeven on this straddle at the expiration is 11.50 points above 530, or 541.50
(call is worth 11.50 and put is worth 0), or 11.50 points below 530 at 518.50 (put is then worth 11.50
and the call is worth 0).
We break this down in percentage terms for every example we look at, so 11.50 points divided by the
strike price of 530 is a 2.17% move in either direction. So if you actually see a 4.3% move, you're looking
at doubling your investment on the straddle. Note in this case that AAPL does not have earnings
anticipated laterin April, but this straddle pricing approach can be used to estimate the expected implied
volatility for a stock based on the option's market pricing.
As a side note, how does the option's market reach this expectation of how much the stock will move?
Based on market participants' interest in buying or selling those premiums. If the market maker initially
set the straddle pricing at 4% implied volatility and other players thought the actual move would be 2%,

traders would sell the straddle and the pricing of the options would adjust downward. So over time, you
are looking at the consensus expectations for the entire market on how the stock should move based on
the options pricing.

Gap History
So you're thinking about buying an option on Google (GOOG) ahead of its next earnings.
A first step is to look back at least 6 quarters, and see how much the stock has gapped in the past:
Gap from Prior Day's Close to Next Day's Open
October 2013 +9.88%
July 2013 -3.70%
April 2013 +0.50%
January 2013 +4.71%
October 2012 NA (company accidentally released real-time 1 day before!)
July 2012 +2.65%
AVERAGE +2.81%
So if you see the upcoming earnings quarter's options priced like this, what would you do?
Given that the April 545 straddle is priced at a total of 38.10 points, or 7.01%, I'd say the market has
potentially overreacted to the big move last quarter, and with volatility expectations more than double
the average of +2.81%, it's certainly not a straddle I'd want to buy. So should you sell it? Over time, net
sellers should benefit, but individual situations can still have big gaps (against you if you did a selling
strategy), so I don't tend to sell these options in front of events, unless I want to create a time spread.
P.S. I did tell my workshop students ahead of GOOG's prior report that the at-the-money straddle was
too cheap, priced around 4% move expected. The end result was a move more than double expected, as

the straddle gained around +150% on the 10% gap up. So clearly the market tends to remember (and
perhaps overly adjust to) what just recently happened in the prior quarter.

What Options Spread Strategy Makes The Most Sense In Front of Earnings?
I’m a fan of the Iron Condor options strategy right in front of earnings, which involves selling options for
a net credit on both sides of the market. Here's how it works:
Let's say you're not expecting much from Nike (NKE) into its earnings, and the options market is
expecting the stock to move 2.25 points in either direction from the current level at 54.50. You could sell
the shortest-term weekly options which expire at the end of the current week, about 2.50 points or
more on either side of the stock’s closing price right before the earnings are announced. In this case you
would consider selling the 57 call and then buying the call right above it, in this case at 57.50 (usually we
will give at least the market’s expected move, and sometimes some extra breathing room on top of that
as well). At the same time, you are also selling the 52 put and buying the strike price right below that at
51.50, which is meant to protect your maximum risk in case of a bigger than expected gap in either
direction.
In my alert service called BigTrends Earnings Extravaganza, I actually sent this NKE trade as a new
opportunity to my subscribers, and here’s how the trade was called out:
What scenarios could occur? A big gap up, a milder than expected move up, a flat market, a slight edging
down or a bigger down move. Remember that selling the 57 call and protecting by buying the 57.50 call
is like saying I think the stock will not go over 57.00 at the expiration at the end of this week. So
obviously a big move above that is not desired in this strategy, though if the stock does test the upper or
lower boundary in our iron condor, remember that the other side is winning as you want the options to

ideally go out with no value at expiration with a stock finish between 52.00 and 57.00 at the expiration.
That allows you to pocket the initial premium you collected, in this case $20 per iron condor contract
minus your opening commissions. So a 10-lot would be $200 collected against a net risk of $300 (since
the maximum risk would be $500 on 10 contracts but you collected $200 up front. Your broker would
then require you to hold the net risk of $300 as margin in case the worst case scenario unfolds where
NKE shares finish above 57.50 or below 51.50 at expiration). You can’t lose any more than that if NKE
shares crash to 45 or if they skyrocket to 60.
NKE in actuality gapped down less than 1 point and then edged down a bit above 52.00 to stay in the
expected range. THE P&L graph looked like this on expiration morning:

Buying After Earnings to Ride a Trend
While perhaps not as thrilling to buy after a potential gap, it's often lower risk with still plenty of reward
potential. Check out this example of Facebook (FB) which offered numerous opportunities.
As you can see with FB shares, the initial breakout using my indicators like Percent R and Acceleration
Bands (I also use others to confirm a move, but let's focus on these) show that FB broke out first with
Percent R in early July 2013 and confirmed that move about 2 weeks before the earnings hit. The stock
was around 25.50, and it even gave a first retest just 1 week after the first buy. The retest shows a spot
where the stock's trend should hold. This was 3 days before the earnings. Upon the earnings, the stock
gapped up from 26 to 33, giving those willing to play the bull trend a profit of over 150% on the August
26 calls.
But for those who missed the gap, there were more opportunities. The confirmed breakout above the
gap day high now around 35 gave the chance to ride the September 35 calls up to the mid-40s, again
offering more than 100% returns on average on the whole position (we often exit half of our position
earlier than 100% and then try to ride the rest up to 100% or more).

And if you missed this first “After Earnings” opportunity, you still had not one but two retests to hop
back on the uptrend. Retest #1 went from 43 in mid-September to 50 two weeks later, while Retest #2
in early October gave a chance to position ahead of the next earnings two weeks after that. That move
went from 48 to 55. Generally, if I'm in well advance of the earnings date, I like to sell off half my
position at a double if I can to get my risk capital back before the event. The rest of the trade is
essentially a free trade at that point, which can lead to even bigger potential profits while not stressing
the account if the gap goes the wrong way.
As far as downside examples, check out this chart of retailer Best Buy (BBY):
BBY was already breaking down on percent R for starters (Percent R will usually lead Acceleration Bands)
with a confirmed sell at $37 per share. The stock edged lower for 3 sessions then bounced the day
before earnings, showing what I call a Bear Retest. This bar's high must hold as resistance, and it often
shows a good entry point within the evolving downtrend. The next day BBY gapped down on
disappointing earnings from the Christmas season, falling from 37 to 26 overnight! Put buyers had the
opportunity to clean up on the February 37 puts which went up more than 300%. The stock did show
some “After Earnings” potential as well (though I would always book at least half of my gain on the
windfall gap move in my favor).

This leads me to my #1 favorite strategy for trading options around the earnings report:
Trading Options immediately AFTER the earnings are released.
The primary considerations to merit making a quick post-earnings trade are these:
1) Only trade in the direction of the reaction - We're not going to try to fade or go against the market's
initial reaction, but rather will watch the initial gap and then use short-term technical analysis to show if
the market is supporting the stock by buying more after a gap up, or selling more after an initial decline.
2) Buy Options that are Deep In the Money - The high implied volatility we discussed earlier in front of
the news will start to normalize at lower levels fairly quickly, but it may take several hours to truly adjust
fully. This makes the at the money and out of the money options still speculative and higher-risk choices
compared to the in-the-money (ITM) options where a vast majority of the ITM is based on the stock
price rather than the remaining time until expiration. This vastly neutralizes the IV effect and allows us
to trade options as a stock substitute for a leveraged effect that is often around 10 times the percentage
move in the underlying stock.
3) Buy Options with a bit more time than you need - While our average holding period for our
BigTrends Earnings Explosion trades is roughly 3 trading days, we find the liquidity in the monthly
options to allow us to have more favorable prices than the shortest-term weekly options. This gives up a
little leverage but it is well worth it for the greater stability and tighter bid/ask prices on the monthly
options, allowing us to lower our execution costs over time.
4) Be ruthless about exiting on patterns that are not continuing after the gap - We've found that for
the quick trades after earnings, the proper pattern is a steady and persistent uptrend as evidenced by
the 5-minute Percent Range (%R) indicator. If a stock is making higher highs (or lower lows), then the
indicator will stay overbought (or oversold) longer than most would expect. But once we violate that
overbought or oversold period, a stock can go into a range or a reversal. So we always alert our clients in
real time when it's time not just to get in, but also when to get out.
Let's look at a couple of examples, starting with a bullish call purchase on Stratasys (SSYS).
You can see from the chart that the stock gapped up, so the market's initial reaction was positive. That
would only let us consider a call and not a put. We've created an upper and lower band we call Bigtrends
Bands, which tracks the overbought and oversold levels of the Williams Percent Range (%R) indicator.
You will notice we were comfortable buying the first dip back under the upper band as this is often a
good risk/reward spot to buy the "retest" that Price Headley has gained acclaim for, showing traders
how to hop on a trend move at an optimal risk/.ward entry point near the likely support within the
evolving uptrend. You can also see that the best moves for the stock occur outside the upper band, as
there is no natural resistance while the uptrend is working its way higher. We like to take a first half of
the position at a healthy profit target around +30%, as our stop is usually around -30%. Then we'll seek
to stretch to as much as +100%. This trade made a bit more at +115% on the second half position. We
call these big intraday trend trades "runners" as the trend continues to run, and helps run up your

portfolio as well.
Note that this was indeed a day trade, which is not our intent but does happen on some quick profits or
quick stops. We have a rule to not have more than 3 day trades in a 5 consecutive day period, to avoid
any risk of being classified as a pattern day trader (which thus allows even small accounts to benefit
from our After Earnings strategy).
Next let's examine a bearish put buy we recommended on Monsanto (MON):
You can see the initial reaction on the downside, and while the stock had a sharp move up to fill a good
part of the gap down, this was an ideal retest situation. The beauty of retests is that if the downtrend is
going to continue, the retracement should stall at the retest resistance and then start heading lower.
The additional benefit of buying an In The Money Put here is that we can afford to wait through the
initial stall as the upside bounce rolls over, compared to more pressure felt by more aggressive options
buyers who risk losing great time and volatility premiums through a flattish retracement. MON puts hit
their first target at +30% and then made a bit more on paper which caused us to tighten our trailing
stop, resulting in a 26% gain on the second half of the trade when the stock started to reverse higher.

2016 UPDATE:
You will notice from the chart below of the first quarter 2016 BigTrends Earnings Explosion (BEX) trades
that they are exclusively In the Money options purchases. Why not do any other earnings strategies?
Because ITM Options after earnings accomplish a double goal: consistency with healthy upside
potential. That's why the "After Earnings" Options Purchase has become my #1 favorite "go to" options
strategy for earnings season.
While most know the main earnings periods as January, April, July and October, the fact is that many
companies have fiscal years that are not aligned with the calendar quarters. So I expect to do these
trades at any time throughout the year, right in front of an earnings report.
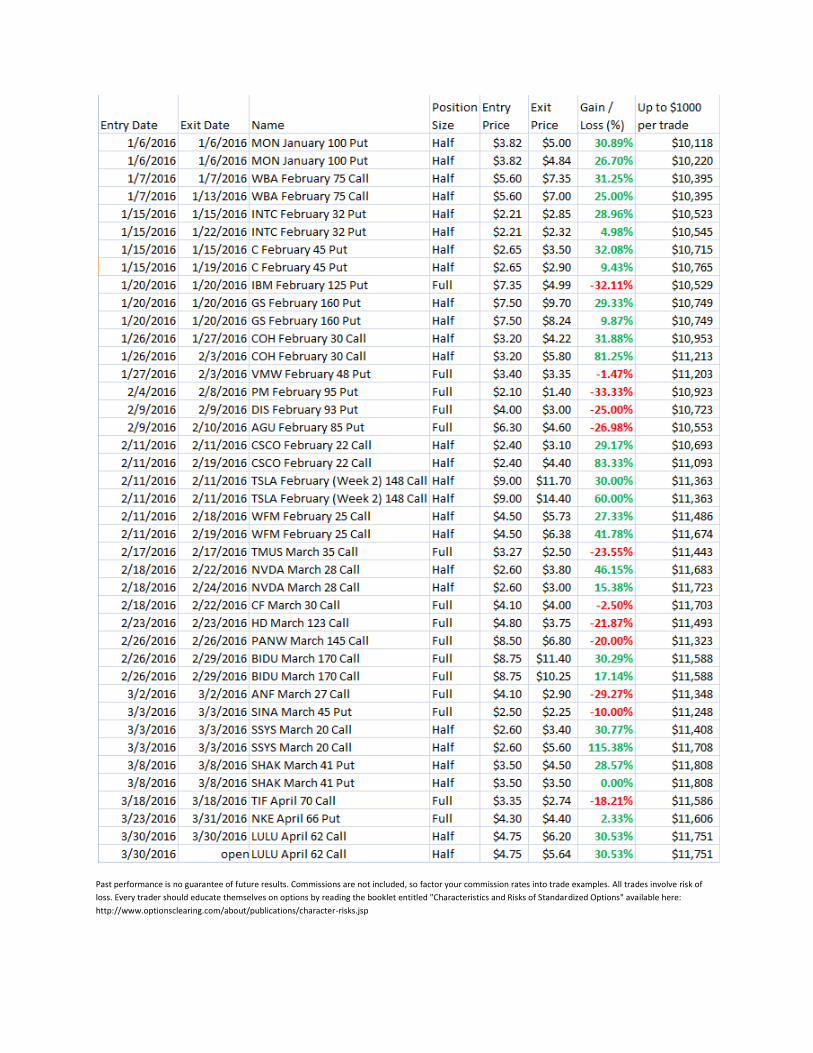
Past performance is no guarantee of future results. Commissions are not included, so factor your commission rates into trade examples. All trades involve risk of
loss. Every trader should educate themselves on options by reading the booklet entitled "Characteristics and Risks of Standardized Options" available here:
http://www.optionsclearing.com/about/publications/character-risks.jsp
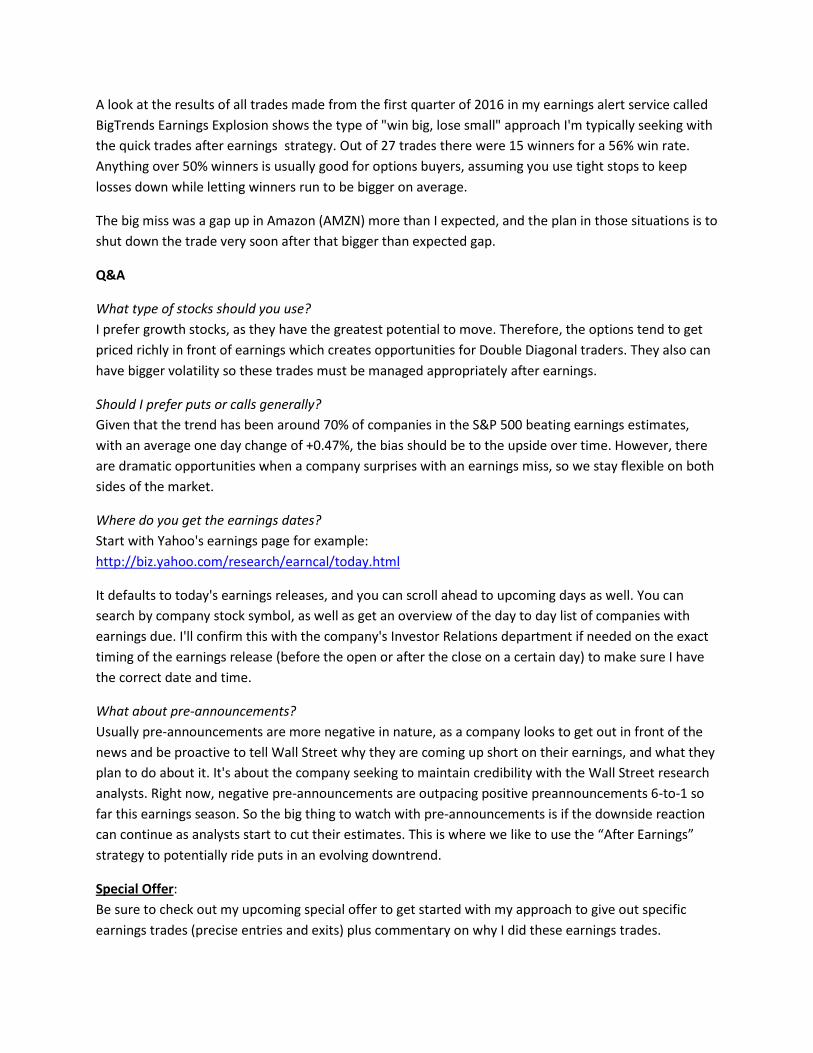
A look at the results of all trades made from the first quarter of 2016 in my earnings alert service called
BigTrends Earnings Explosion shows the type of "win big, lose small" approach I'm typically seeking with
the quick trades after earnings strategy. Out of 27 trades there were 15 winners for a 56% win rate.
Anything over 50% winners is usually good for options buyers, assuming you use tight stops to keep
losses down while letting winners run to be bigger on average.
The big miss was a gap up in Amazon (AMZN) more than I expected, and the plan in those situations is to
shut down the trade very soon after that bigger than expected gap.
Q&A
What type of stocks should you use?
I prefer growth stocks, as they have the greatest potential to move. Therefore, the options tend to get
priced richly in front of earnings which creates opportunities for Double Diagonal traders. They also can
have bigger volatility so these trades must be managed appropriately after earnings.
Should I prefer puts or calls generally?
Given that the trend has been around 70% of companies in the S&P 500 beating earnings estimates,
with an average one day change of +0.47%, the bias should be to the upside over time. However, there
are dramatic opportunities when a company surprises with an earnings miss, so we stay flexible on both
sides of the market.
Where do you get the earnings dates?
Start with Yahoo's earnings page for example:
http://biz.yahoo.com/research/earncal/today.html
It defaults to today's earnings releases, and you can scroll ahead to upcoming days as well. You can
search by company stock symbol, as well as get an overview of the day to day list of companies with
earnings due. I'll confirm this with the company's Investor Relations department if needed on the exact
timing of the earnings release (before the open or after the close on a certain day) to make sure I have
the correct date and time.
What about pre-announcements?
Usually pre-announcements are more negative in nature, as a company looks to get out in front of the
news and be proactive to tell Wall Street why they are coming up short on their earnings, and what they
plan to do about it. It's about the company seeking to maintain credibility with the Wall Street research
analysts. Right now, negative pre-announcements are outpacing positive preannouncements 6-to-1 so
far this earnings season. So the big thing to watch with pre-announcements is if the downside reaction
can continue as analysts start to cut their estimates. This is where we like to use the “After Earnings”
strategy to potentially ride puts in an evolving downtrend.
Special Offer:
Be sure to check out my upcoming special offer to get started with my approach to give out specific
earnings trades (precise entries and exits) plus commentary on why I did these earnings trades.

I call these 2 services BigTrends Earnings Extravganza (for the iron condors before earnings) and
BigTrends Earnings Explosion (for the options buying strategy right after earnings).
Here you will "Learn While You Earn" during earnings season and beyond. Just give us a call at
1-800-BIGTRENDS (800-244-8736) or send an email to [email protected]
and we will send you all the details on these earnings alert services.