Embed Size (px)
Citation preview

MUSE International Tuesday Workshop – Session 805June 2, 2010, 1:00P – 3:30P
Glen D’Abate & Jamie McDonald
DR Reporting Made Easy with SQL Server
BI Tools

Introductions
Instructors
Acmeware
Course Participants

Course Overview
Objective
The objective of this workshop is to provide an overview and
demonstration of SQL Server 2005’s Business Intelligence
capabilities, specifically with Report Models and the Report Builder
tools. We will construct SSRS Report Models and that allow non-
technical staff to dynamically develop ad-hoc MEDITECH reports
using the SSRS Report Builder application.
Workshop Overview Overview of DR reporting strategies in context of Report
Builder
Identification of DR data and strategies for extracting to a Report Model datamart
SSRS Report Model Projects
Creating Data Source Views
Creating Report Models
Using Report Builder to access Report Model, reporting basics and saved reports
Filtering and grouping
Formatting and developing a tabular report
Advanced filters, creating formulas, and Help
Matrix and graph reports (time permitting)

Glossary of Terms
MEDITECH Application database – Proprietary database structures (NPR or Advanced Technology - AT) in which MEDITECH applications directly file data
Data Repository (DR) – Replications of data from Application Database into an open (ODBC or OLE DB) accessible SQL Server RDMS
SQL Server Databases (livedb, testdb, livefocdb, testfocdb) – DR databases in which application data (test or live, NPR or AT) is stored
SQL Server Reporting Services (SSRS) – Feature of SQL Server RDMS that allows reports to be designed, developed and deployed for consumption
Datamart – Extraction, transformation, filtering, and indexing of data into
structures specifically formatted for construction of Report Models SSRS Report Manager – Web based application for hosting and managing
reports. Also the application from which the Report Builder tool is launched.
SSRS Report Models – Data structure on which the Report Builder tool runs
SSRS Report Builder – Tool for non-technical staff to develop ad hoc reports

Course Format
Modular sections
Lecture on topic with slide presentation
Provide example demonstration building Report Models and reports as we go
Each section builds on previous section
We encourage interactive discussion throughout!
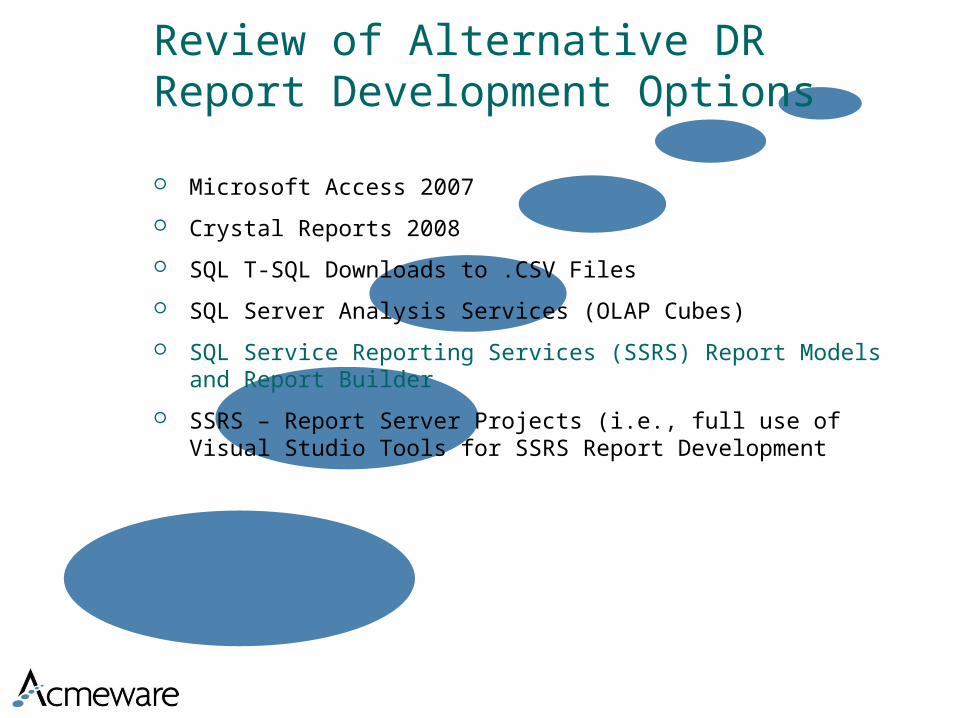
Review of Alternative DR Report Development Options
Microsoft Access 2007
Crystal Reports 2008
SQL T-SQL Downloads to .CSV Files
SQL Server Analysis Services (OLAP Cubes)
SQL Service Reporting Services (SSRS) Report Models and Report Builder
SSRS – Report Server Projects (i.e., full use of Visual Studio Tools for SSRS Report Development

Flexibility / Complexity Trade-off
SSAS is easiest to use. Drag & Drop, Slice & Dice. Only provides numeric analysis. Difficult to develop & modify data.
Report Builder allows non-technical users to build and format custom ad-hoc reports. Report developers need not understand data relationships. Requires IT to build Report Models which limit available data columns. Complex data analysis / manipulation is not possible.
Report Projects require programmer-level technical skill set to develop reports. Uses Visual Studio programmer environment for report development. Most flexibility in report design and can link to complex T-SQL statements for reports requiring data manipulation and analysis.
Too Hot!
Too Cold!
Just Right!

Report Model / Designer Approach
Allows reports to be dynamically generated by “end-users.” No need to come to IT for “one more column” on a report
Web-based reports can be nicely designed and formatted
Report Models can be indexed for excellent performance
Report Manager provides secure access to report execution
No software to load / support on developer’s systems
PROs
CONs Requires technical staff to develop and maintain underlying SSRS
Report Models
Another copy of data (in application db, in DR, now in Report Model datamart)
Cannot address more complex reports (e.g., reports that require multiple passes at HCIS data to produce result set of interest)
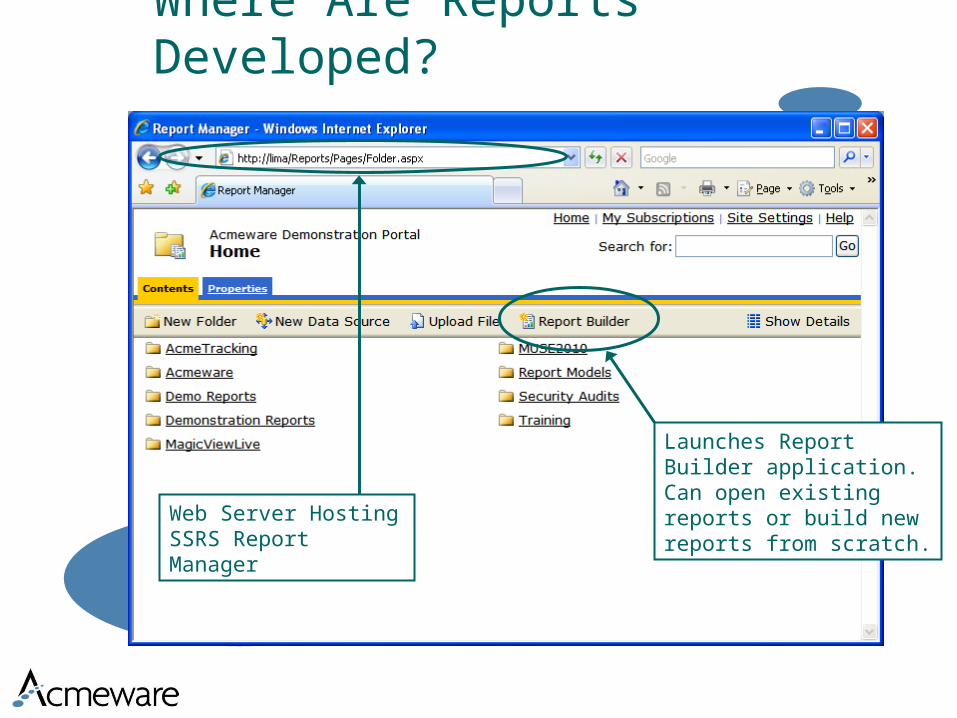
Where Are Reports Developed?
Launches Report Builder application. Can open existing reports or build new reports from scratch.
Web Server Hosting SSRS Report Manager
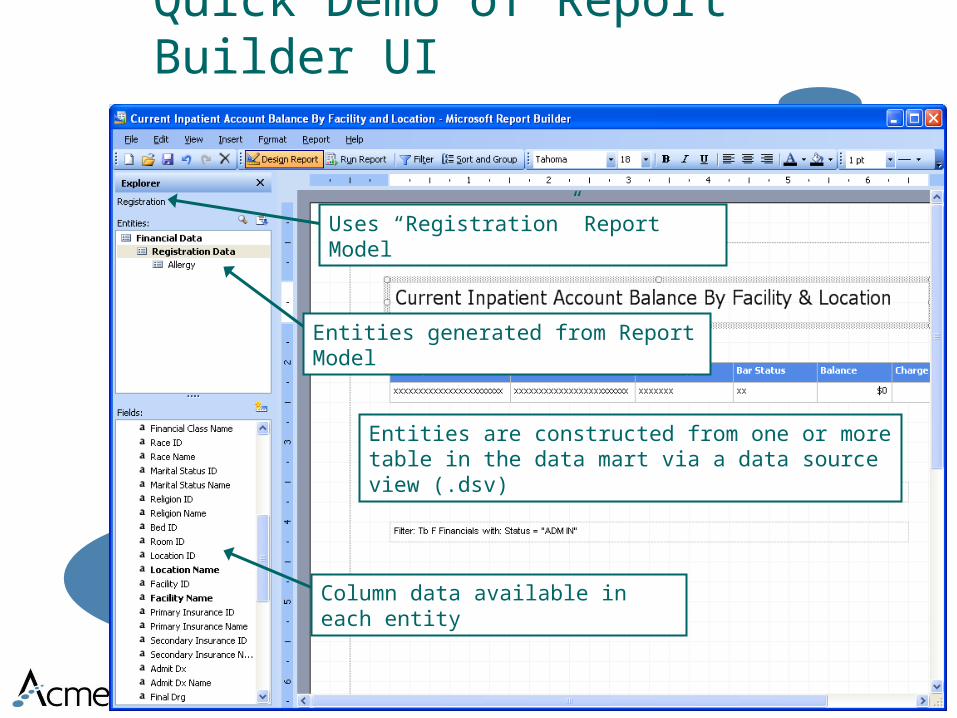
Quick Demo of Report Builder UI
Entities generated from Report Model
Uses “Registration” Report Model
Column data available in each entity
Entities are constructed from one or more table in the data mart via a data source view (.dsv)

Identification of DR Data & Strategies for
Extracting to a Datamart
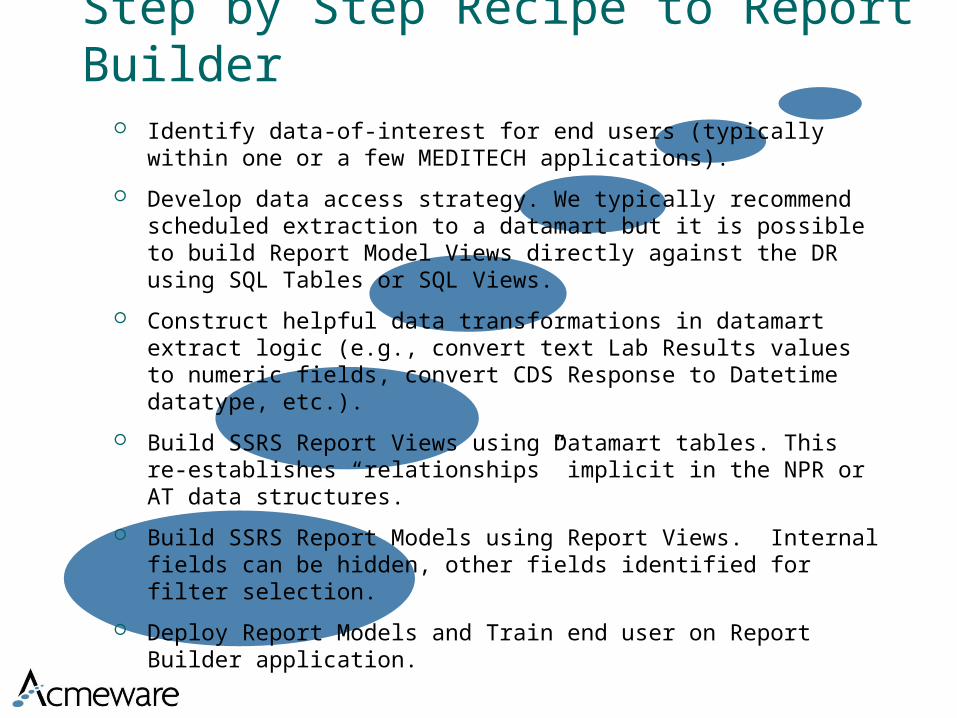
Step by Step Recipe to Report Builder Identify data-of-interest for end users (typically within one or
a few MEDITECH applications).
Develop data access strategy. We typically recommend scheduled extraction to a datamart but it is possible to build Report Model Views directly against the DR using SQL Tables or SQL Views.
Construct helpful data transformations in datamart extract logic (e.g., convert text Lab Results values to numeric fields, convert CDS Response to Datetime datatype, etc.).
Build SSRS Report Views using Datamart tables. This re-establishes “relationships” implicit in the NPR or AT data structures.
Build SSRS Report Models using Report Views. Internal fields can be hidden, other fields identified for filter selection.
Deploy Report Models and Train end user on Report Builder application.
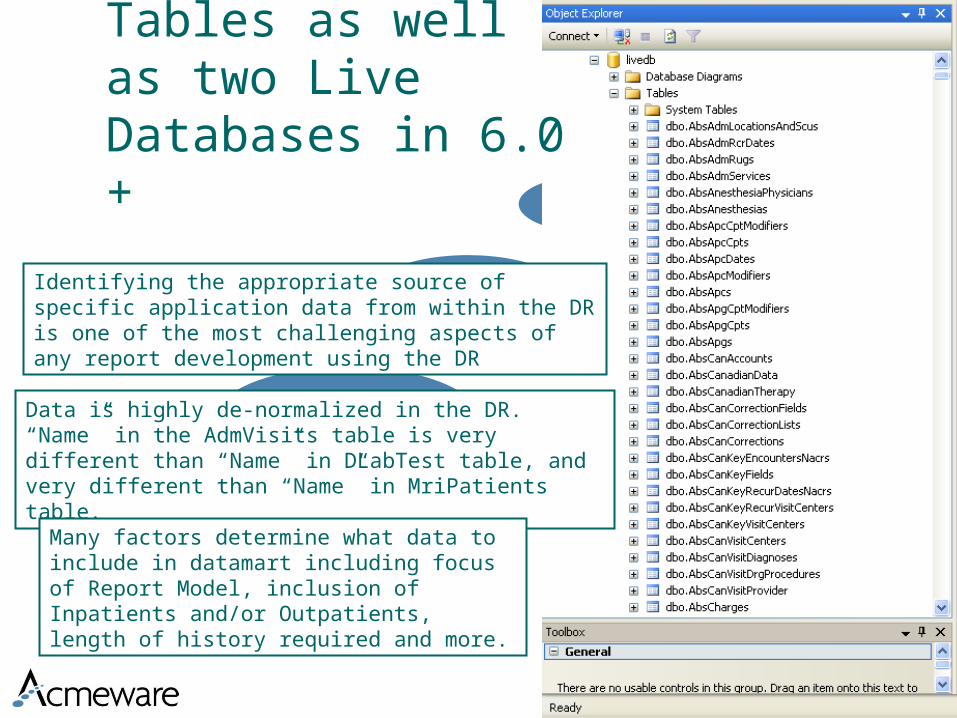
DR has 6000+ Tables as well as two Live Databases in 6.0 +
Identifying the appropriate source of specific application data from within the DR is one of the most challenging aspects of any report development using the DR
Data is highly de-normalized in the DR. “Name” in the AdmVisits table is very different than “Name” in DLabTest table, and very different than “Name” in MriPatients table.
Many factors determine what data to include in datamart including focus of Report Model, inclusion of Inpatients and/or Outpatients, length of history required and more.

Issues Addressed in SQL Datamart Extract
Multiple related DR tables have data combined into a single table (e.g., visit level admission and abstracting data combined)
Default values can be entered where NULL data (e.g., replaced with “N/A”)
Text values, common in MEDITECH fields are converted to move useful data types (e.g., Numeric Response to SQL Numeric datatype)
Data can be filtered to a smaller set than in the DR (do you really need the ND test results from 1998?)
Data can be filtered to meet reporting criteria (e.g., remove confidential patients)
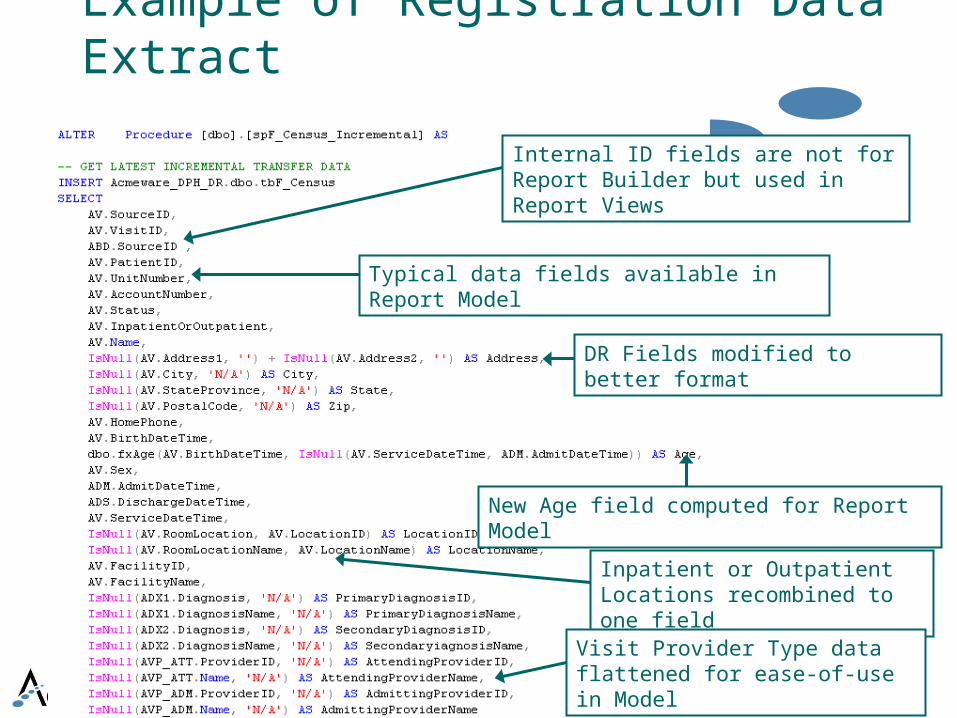
Example of Registration Data Extract
Internal ID fields are not for Report Builder but used in Report Views
Typical data fields available in Report Model
DR Fields modified to better format
New Age field computed for Report Model
Inpatient or Outpatient Locations recombined to one field
Visit Provider Type data flattened for ease-of-use in Model

Data Extract DR Table Consolidation
Optional data (using LEFT JOINs) is included in Registration Data Model when available. Data from many tables in the DR are combined to a single table “entity” to be used in the Report View and Report Model.
Example of identifying only the most current entry associated with a patient visit

Data Extract using Incremental Data
The DR table column RowUpdateDateTime can be used to identify “changes” to data for incremental updates
Cancelled Admissions or other filtering (e.g., remove confidential patients) can be include in datamart extract

Primary Key Fields and Their Function
There may be multiple AllergyID entries for any given VisitIDSourceID omitted for sites with
single SourceID throughout DR
Example Datamart Tables
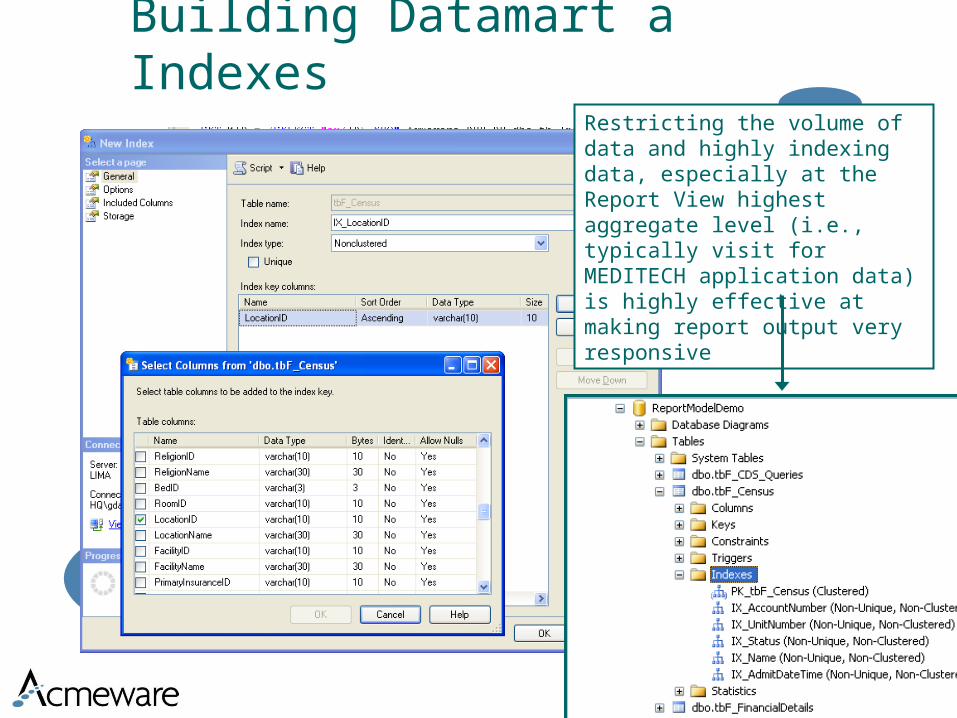
Building Datamart a IndexesRestricting the volume of data and highly indexing data, especially at the Report View highest aggregate level (i.e., typically visit for MEDITECH application data) is highly effective at making report output very responsive
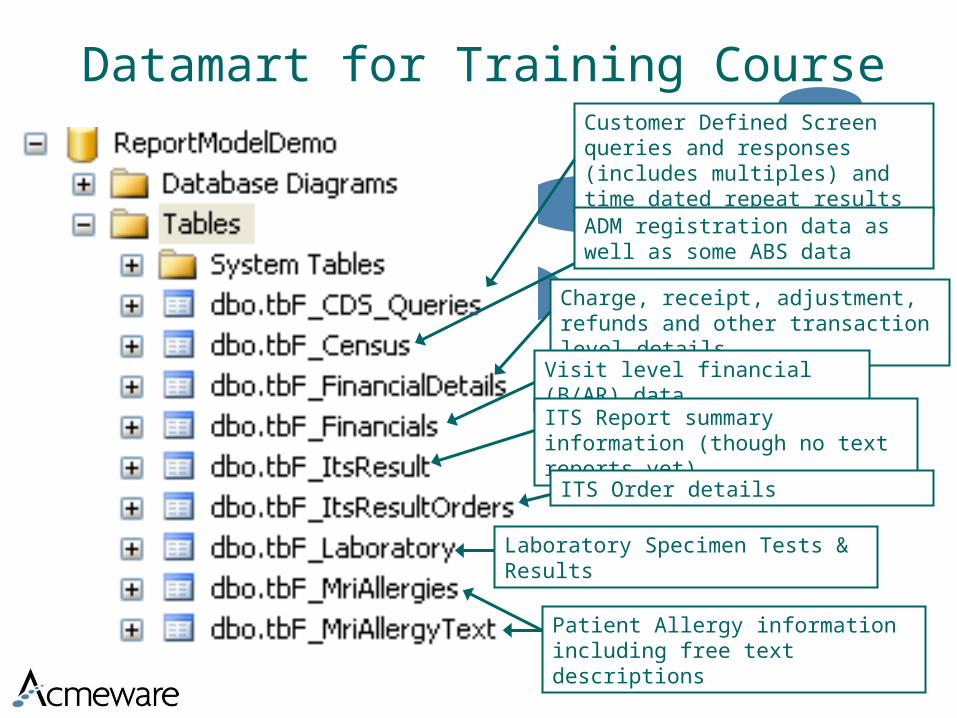
Datamart for Training CourseCustomer Defined Screen queries and responses (includes multiples) and time dated repeat resultsADM registration data as well as some ABS data
Charge, receipt, adjustment, refunds and other transaction level details
Visit level financial (B/AR) dataITS Report summary information (though no text reports yet)
ITS Order details
Laboratory Specimen Tests & Results
Patient Allergy information including free text descriptions

Creating SSRS Report Model Projects

What is a Report Model Project
In order to build a Report Model, you need to create a Report Model Project using Visual Studio 2005 (or 2008)
A Report Model Project contains the components or objects that are used to build and deploy Report Models to the Report Manager web site
A Report Model Project is comprised of one or more Data Source (.ds) files, one or more Data Source View (.dsv) files, and one or more Report Model file (.smdl) files
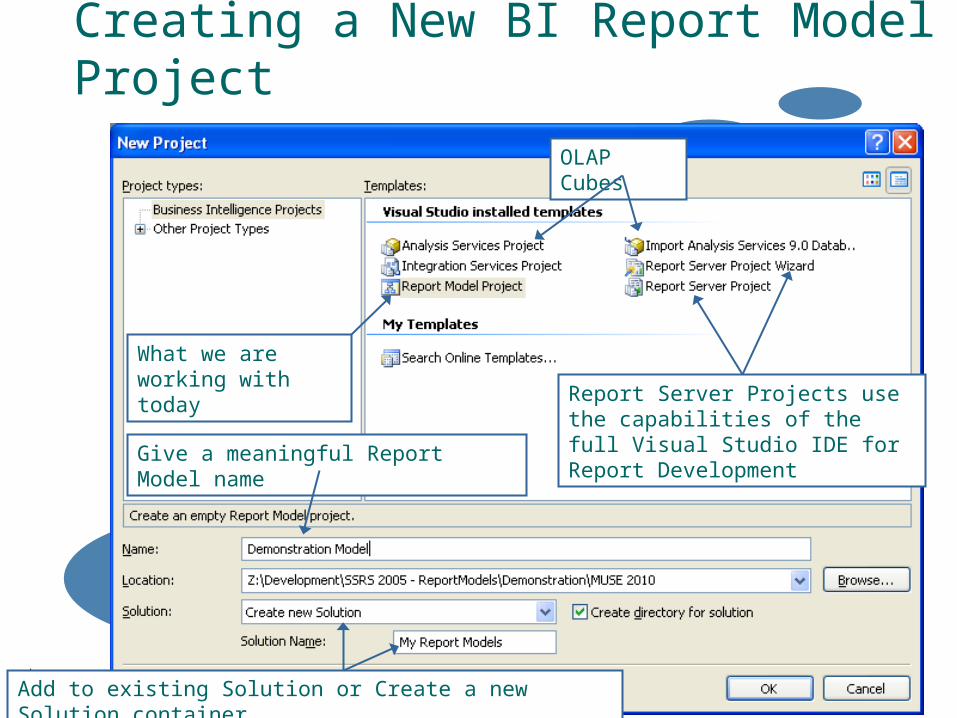
Creating a New BI Report Model Project
OLAP Cubes
Report Server Projects use the capabilities of the full Visual Studio IDE for Report Development
What we are working with today
Give a meaningful Report Model name
Add to existing Solution or Create a new Solution container
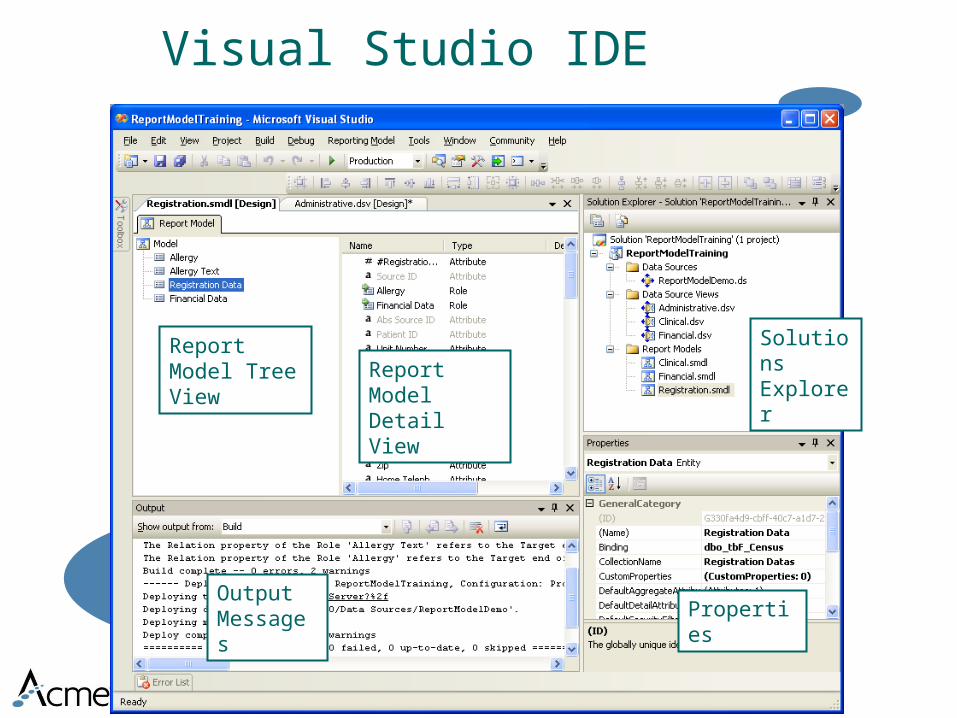
Visual Studio IDE
Report Model Tree View
Report Model Detail View
Output Messages
Properties
Solutions Explorer
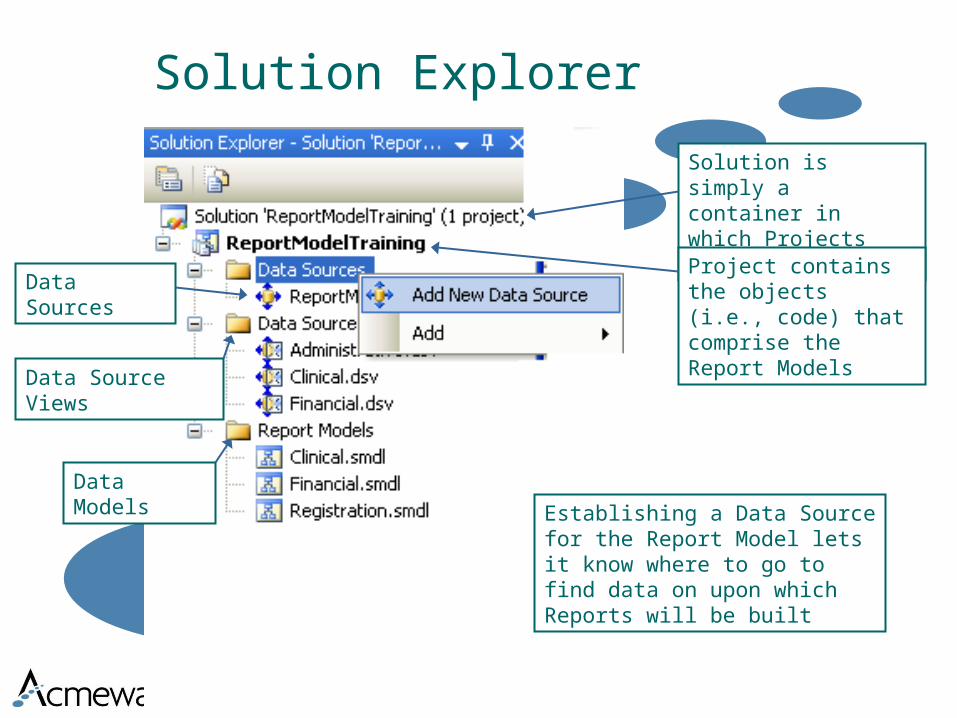
Solution Explorer
Solution is simply a container in which Projects are loaded
Project contains the objects (i.e., code) that comprise the Report Models
Data Sources
Data Source Views
Data Models
Establishing a Data Source for the Report Model lets it know where to go to find data on upon which Reports will be built
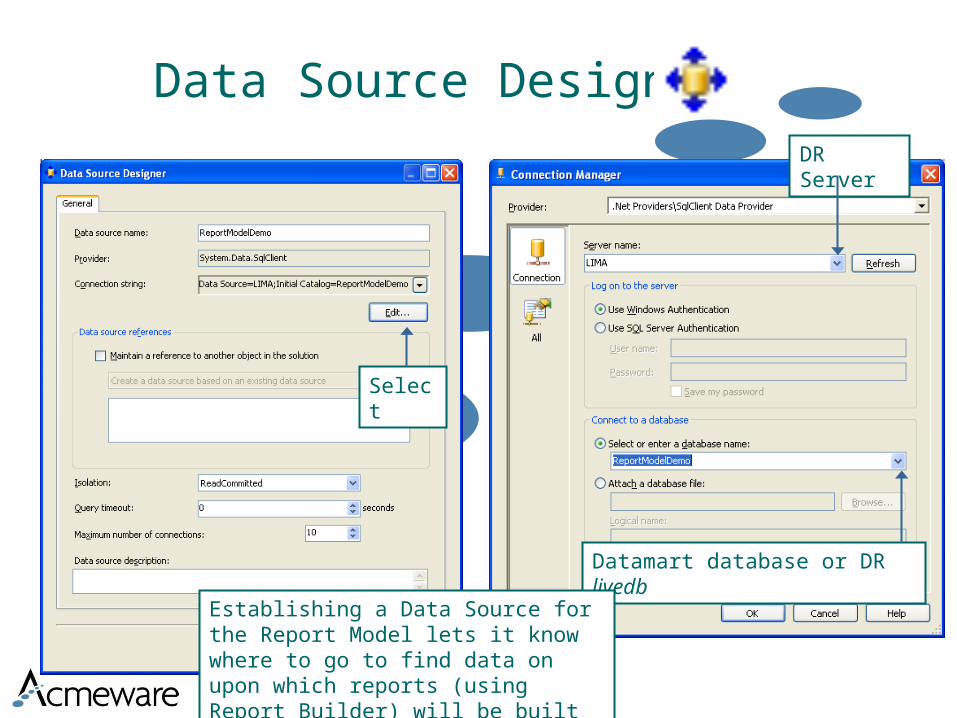
Data Source DesignerDR Server
Datamart database or DR livedb
Select
Establishing a Data Source for the Report Model lets it know where to go to find data on upon which reports (using Report Builder) will be built
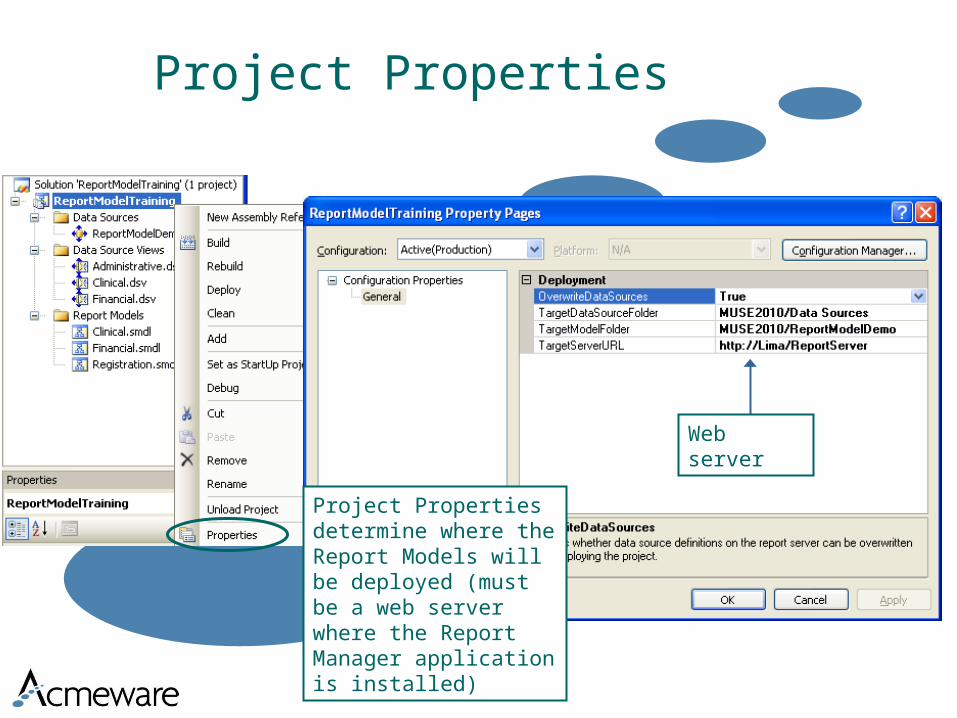
Project Properties
Project Properties determine where the Report Models will be deployed (must be a web server where the Report Manager application is installed)
Web server

Creating Data Source Views

Data Source View Features A Data Source View is a description of components of
the database to which the Data Source is pointing
This Data Source View describes the selected DR tables, their contents, and the relationships between them
Table in a Data Source View MUST have primary keys defined explicitly to determine uniqueness of records in the table
Table relationships established in the Data Source View are critical to the correct output being generated in Report Builder developed reports
Typically, defined relationships reconstruct the data relationships that exist in the MEDITECH applications
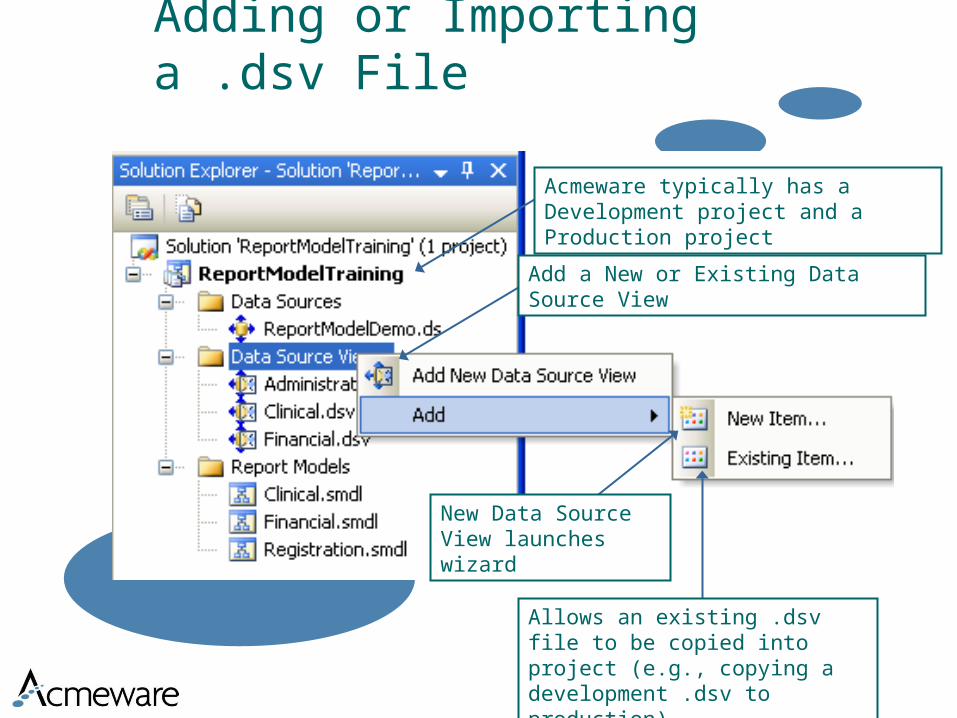
Adding or Importing a .dsv File
Acmeware typically has a Development project and a Production project
Add a New or Existing Data Source View
New Data Source View launches wizard
Allows an existing .dsv file to be copied into project (e.g., copying a development .dsv to production)
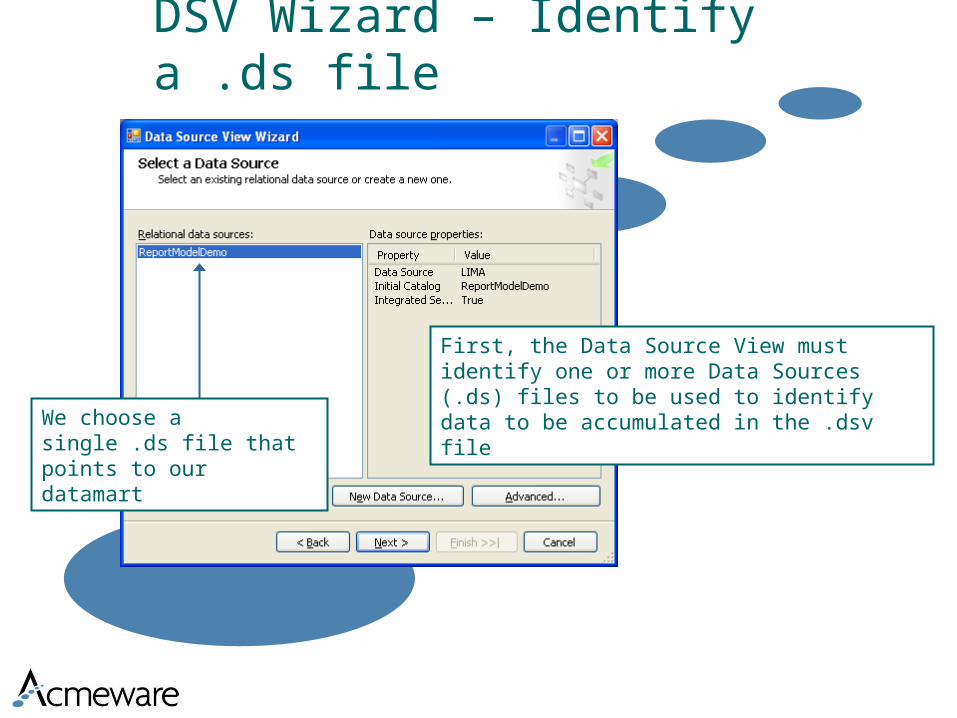
DSV Wizard – Identify a .ds file
First, the Data Source View must identify one or more Data Sources (.ds) files to be used to identify data to be accumulated in the .dsv fileWe choose a single .ds
file that points to our datamart
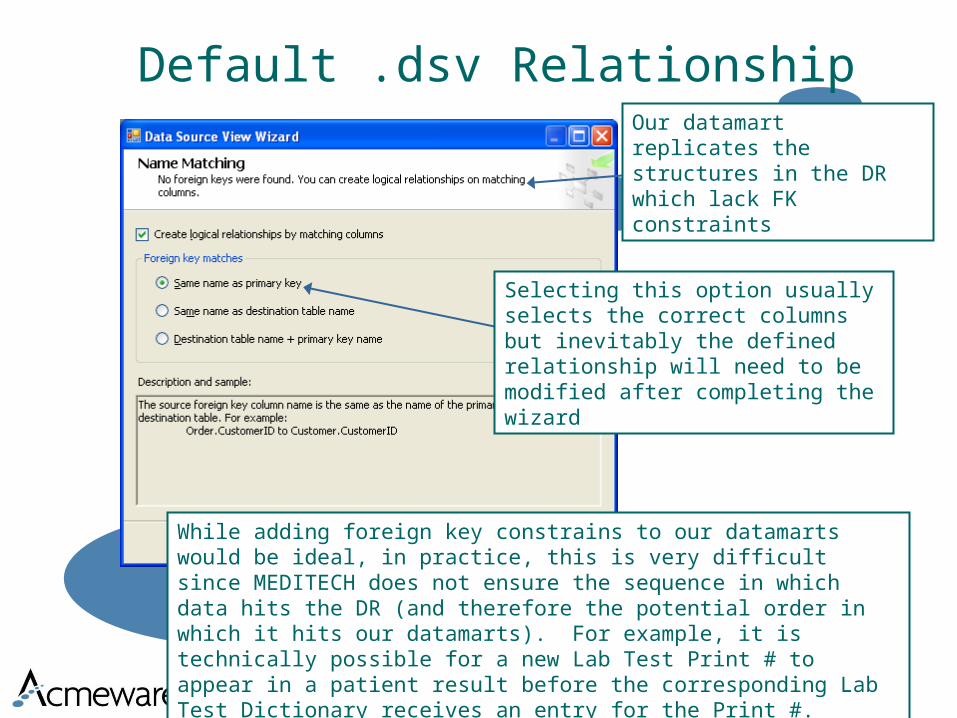
Default .dsv Relationship Our datamart replicates the structures in the DR which lack FK constraints
Selecting this option usually selects the correct columns but inevitably the defined relationship will need to be modified after completing the wizard
While adding foreign key constrains to our datamarts would be ideal, in practice, this is very difficult since MEDITECH does not ensure the sequence in which data hits the DR (and therefore the potential order in which it hits our datamarts). For example, it is technically possible for a new Lab Test Print # to appear in a patient result before the corresponding Lab Test Dictionary receives an entry for the Print #.
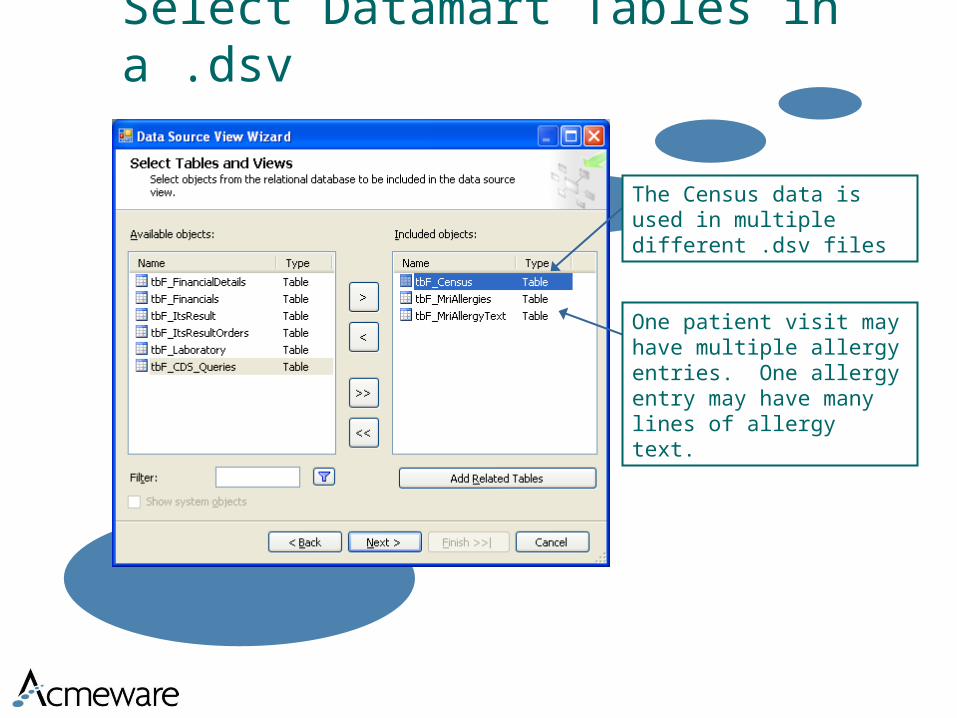
Select Datamart Tables in a .dsv
The Census data is used in multiple different .dsv files
One patient visit may have multiple allergy entries. One allergy entry may have many lines of allergy text.
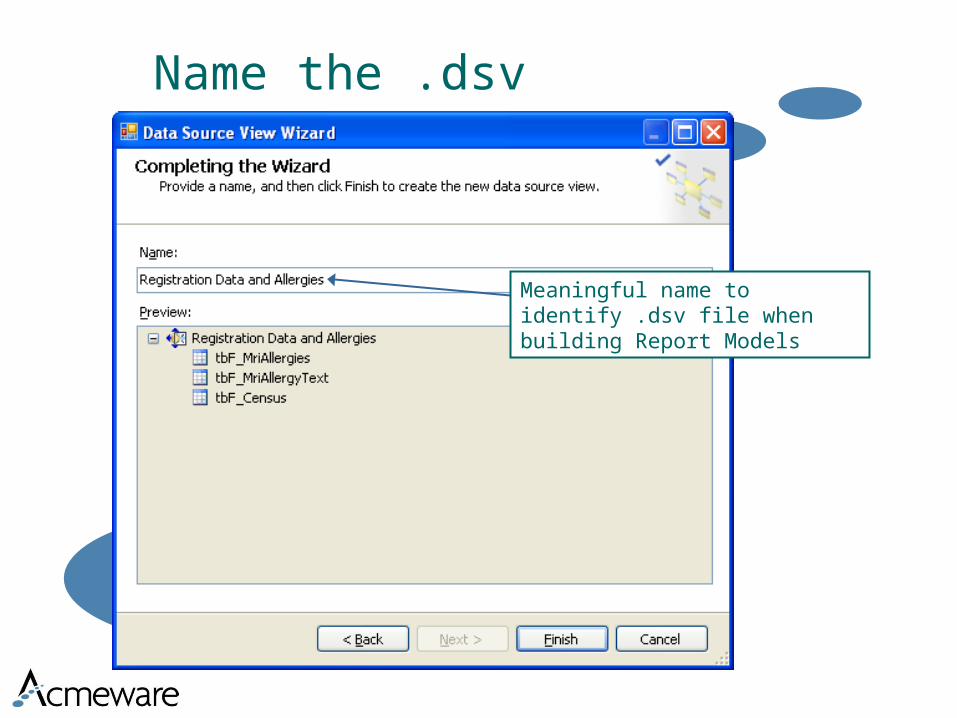
Name the .dsv
Meaningful name to identify .dsv file when building Report Models

View Default Relationships Are Wrong
Default relationship created by wizard is often incorrect in the context of MEDITECH DR (and corresponding datamart) schema design
All three keys are required to identify a unique record in this table. This is not typical to a relational database schema.
Arrows must point from summary table to detail table
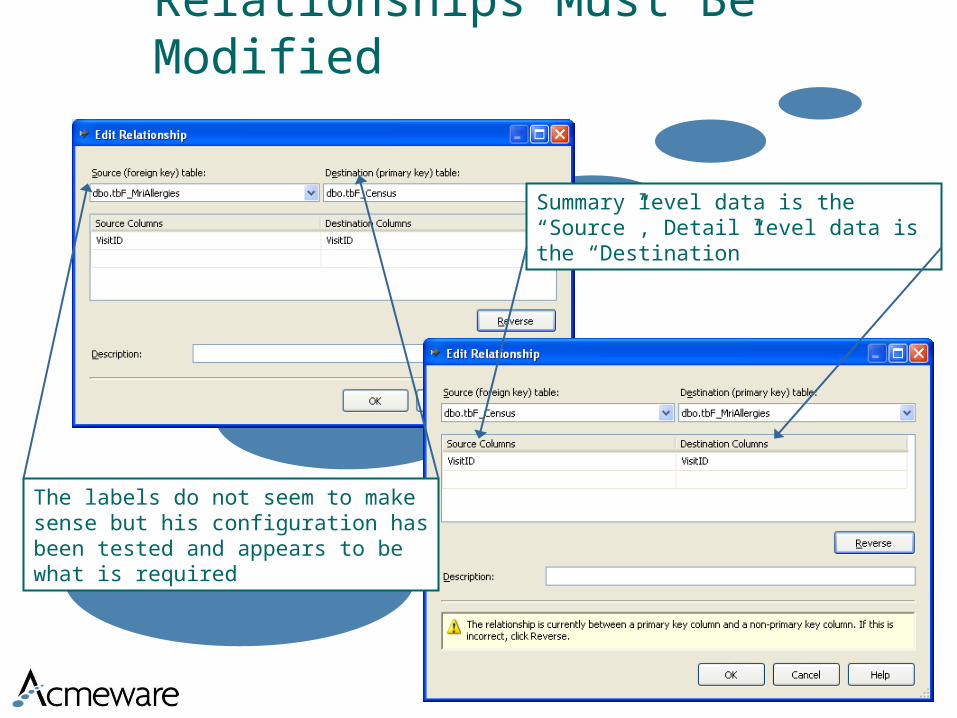
Relationships Must Be Modified
The labels do not seem to make sense but his configuration has been tested and appears to be what is required
Summary level data is the “Source”, Detail level data is the “Destination”
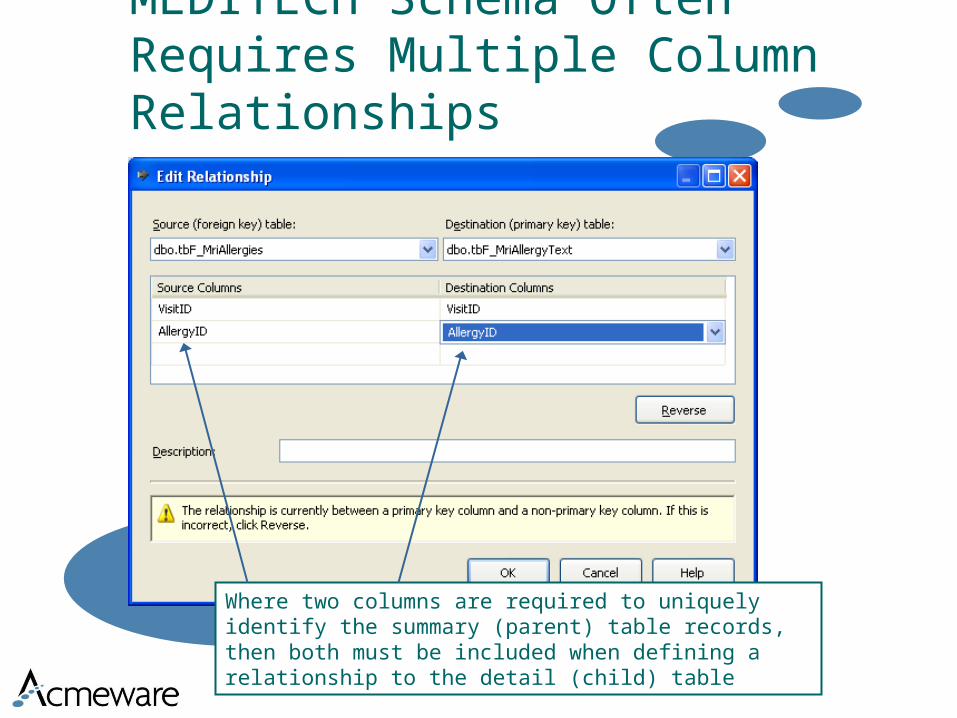
MEDITECH Schema Often Requires Multiple Column Relationships
Where two columns are required to uniquely identify the summary (parent) table records, then both must be included when defining a relationship to the detail (child) table
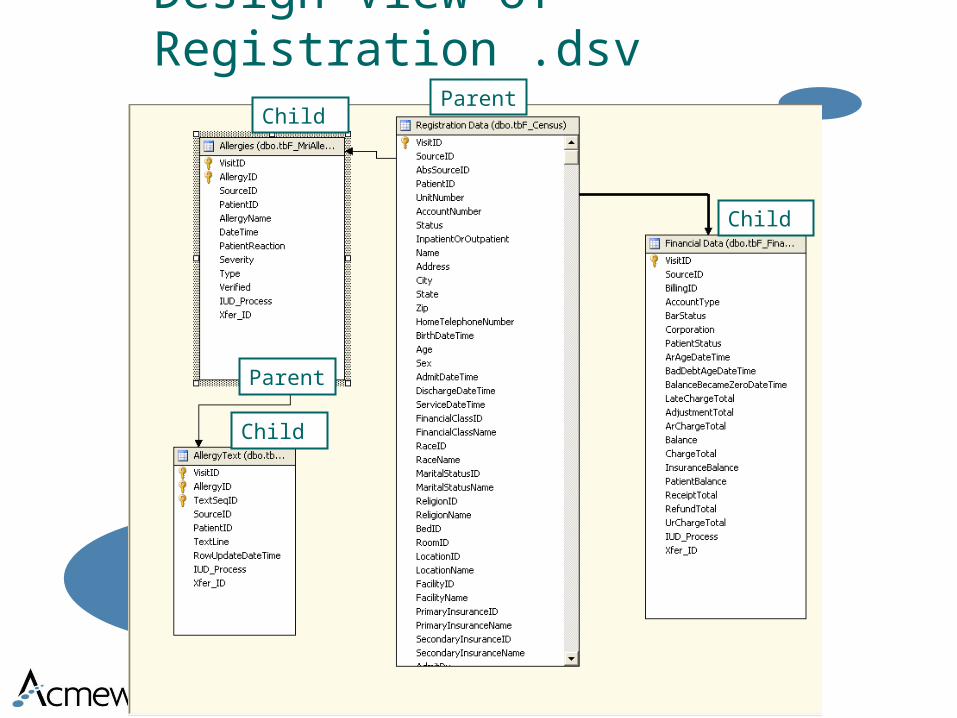
Design View of Registration .dsvParent
Parent
Child
Child
Child
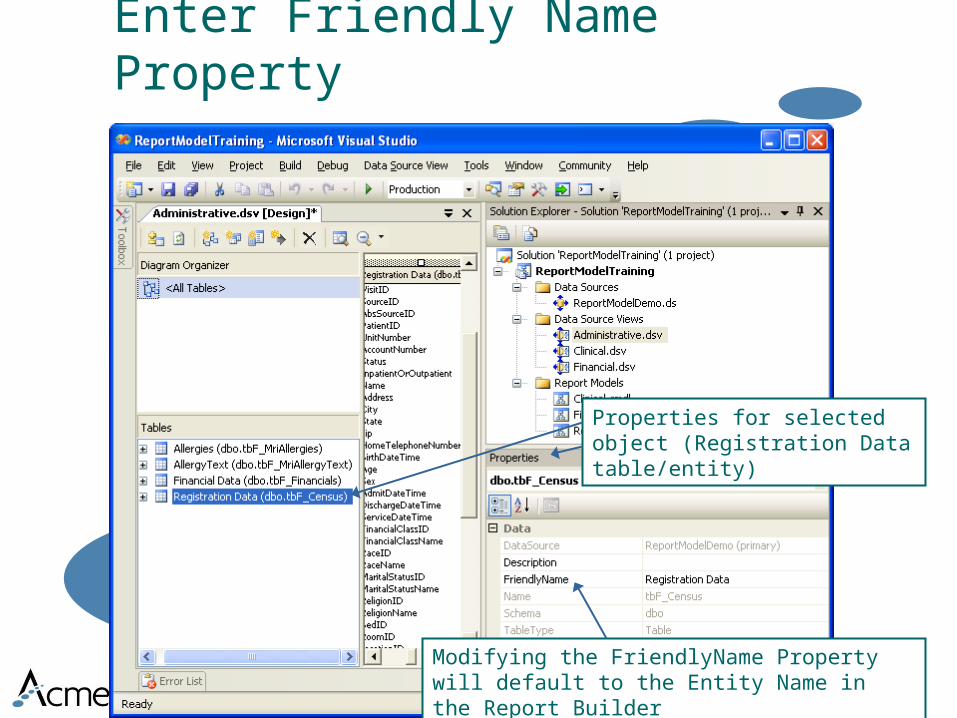
Enter Friendly Name Property
Properties for selected object (Registration Data table/entity)
Modifying the FriendlyName Property will default to the Entity Name in the Report Builder
Creating Report Models

Report Model Features
A Report Model (.smdl file) provides metadata (data about data) for the data being referenced by the Data Source View.
When the Report Model file is generated, entities, roles, and fields are automatically created
Typically, these entities and fields relate back to the datamart columns and their data within the database
Field properties are automatically generated based on the system’s analysis of the data in a .dsv field
A Report Model Design wizard steps through each option and setting required to build a .smdl file from a .dsv file
After running the Report Model Design wizard, the model can be published to the report catalog, assigned the appropriate role permissions, and then used in Report Builder
To make it even easier for users to create reports using this model, it can be further refined after the wizard is completed
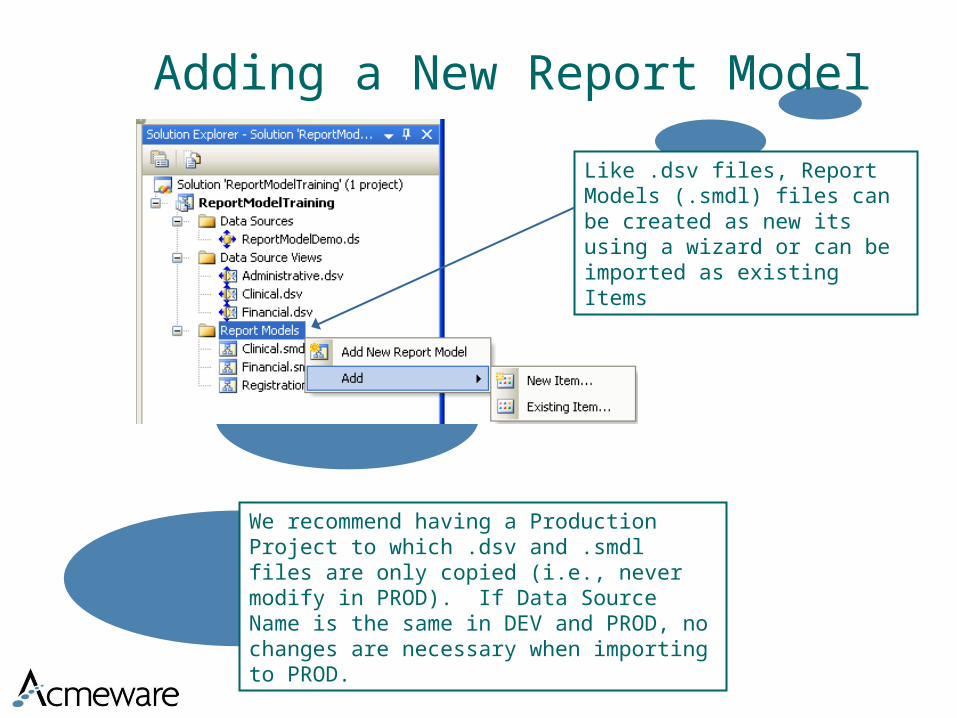
Adding a New Report Model
Like .dsv files, Report Models (.smdl) files can be created as new its using a wizard or can be imported as existing Items
We recommend having a Production Project to which .dsv and .smdl files are only copied (i.e., never modify in PROD). If Data Source Name is the same in DEV and PROD, no changes are necessary when importing to PROD.
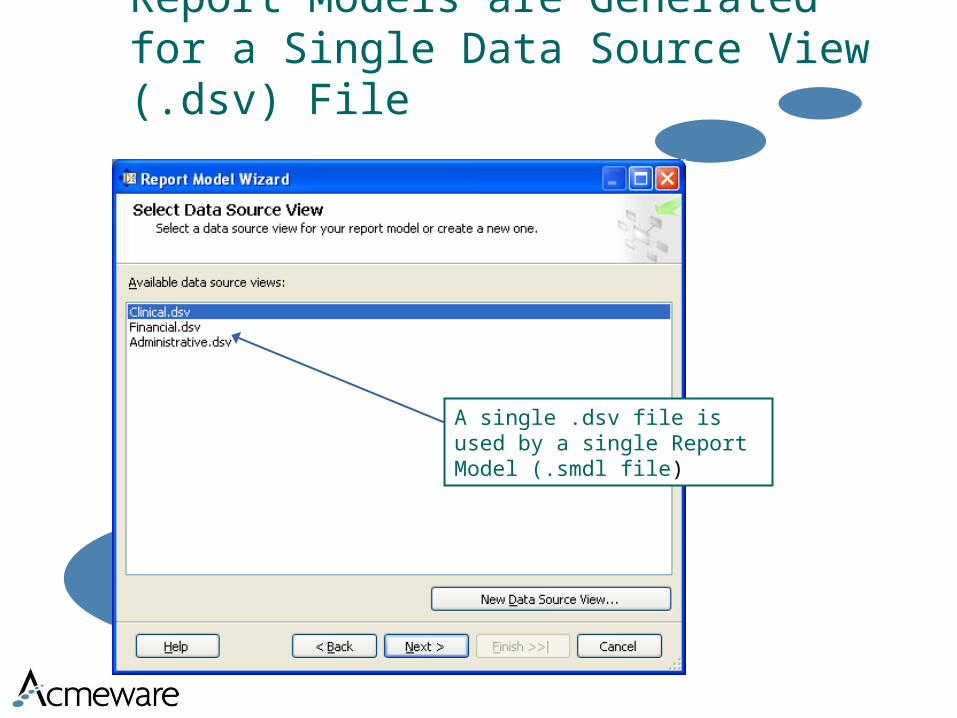
Report Models are Generated for a Single Data Source View (.dsv) File
A single .dsv file is used by a single Report Model (.smdl file)

Report Model Generation Options
We have primarily taken the default generation rules
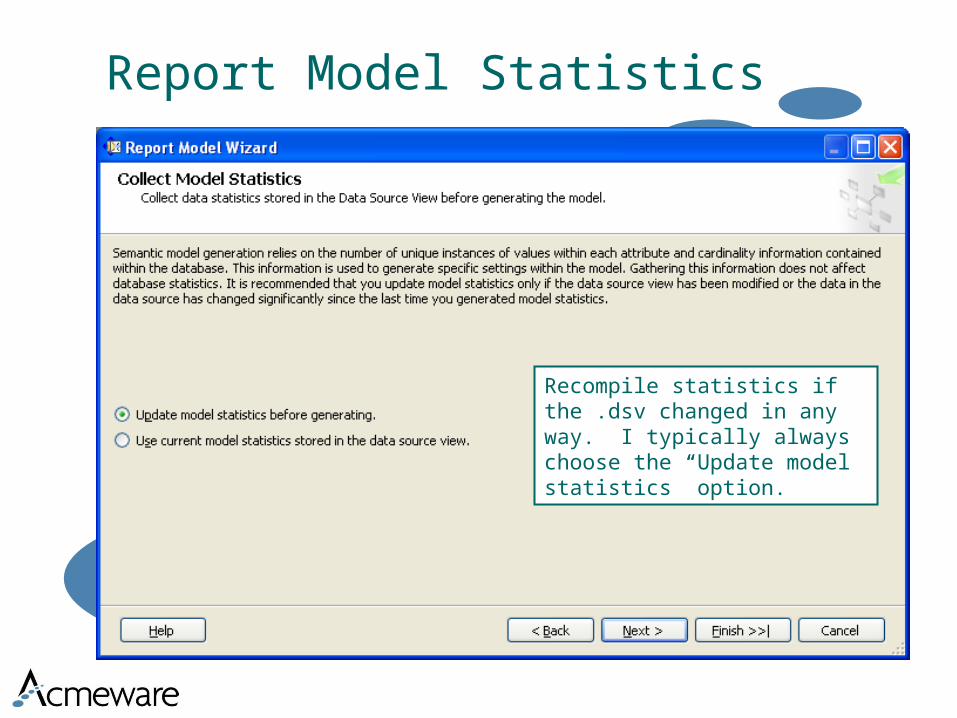
Report Model Statistics
Recompile statistics if the .dsv changed in any way. I typically always choose the “Update model statistics” option.

Naming a Report Model
Do not publish a new model with the same name because you will invalidate existing reports that are generated against this model. If you do create a new model with the same name and try to publish the model, you will see an error message. Always work on the same model to ensure that the IDs remain the same.
Use a meaningful name as this will be seen in the Report Builder tool
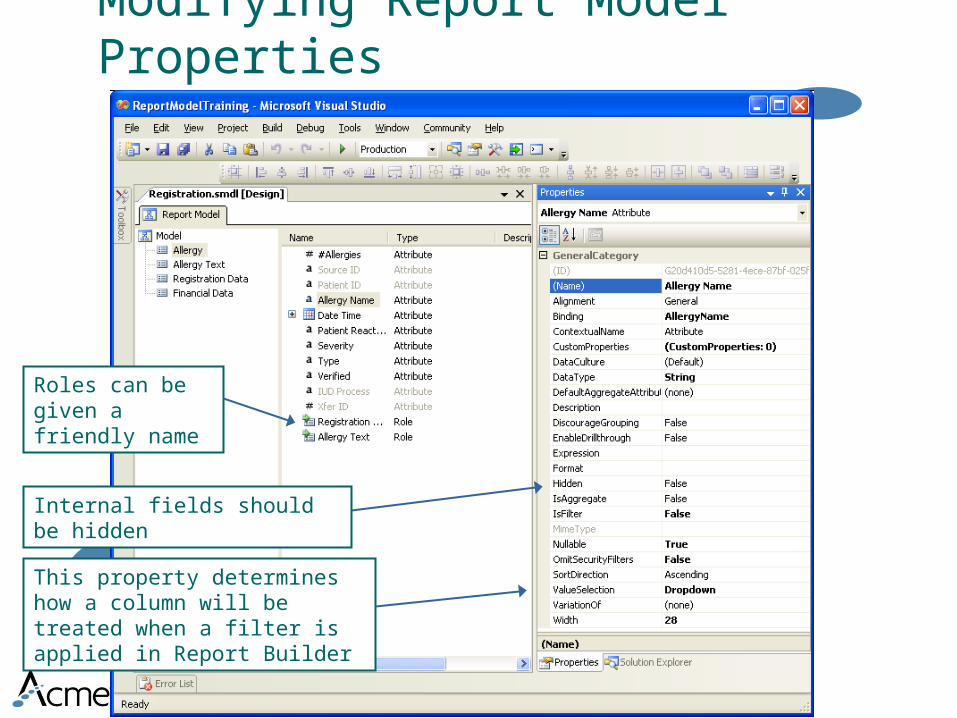
Modifying Report Model Properties
This property determines how a column will be treated when a filter is applied in Report Builder
Internal fields should be hidden
Roles can be given a friendly name
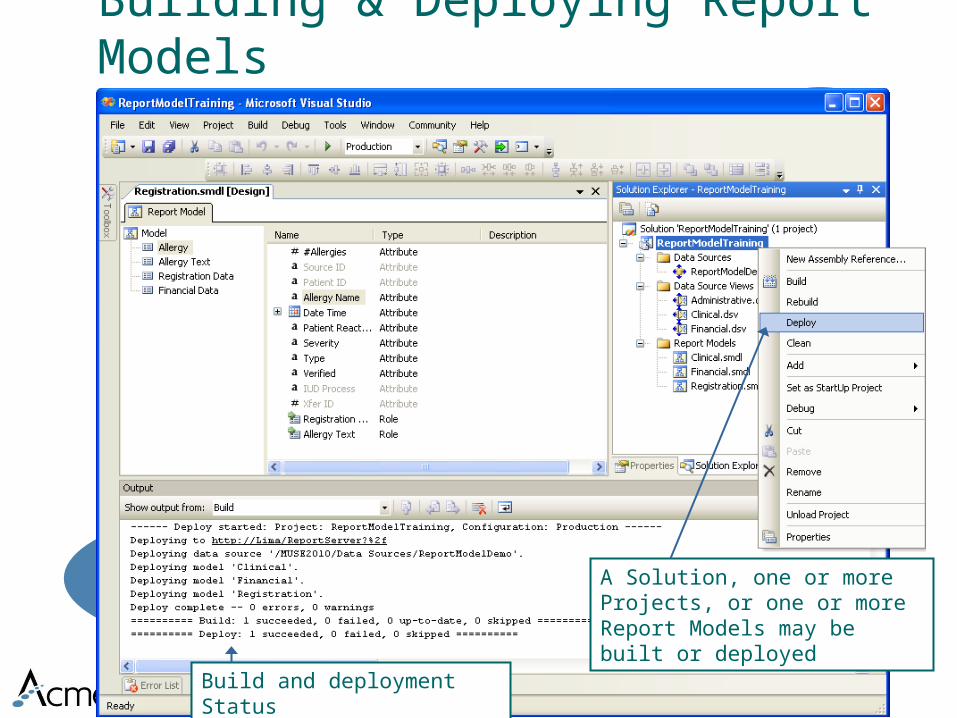
Building & Deploying Report Models
A Solution, one or more Projects, or one or more Report Models may be built or deployed
Build and deployment Status
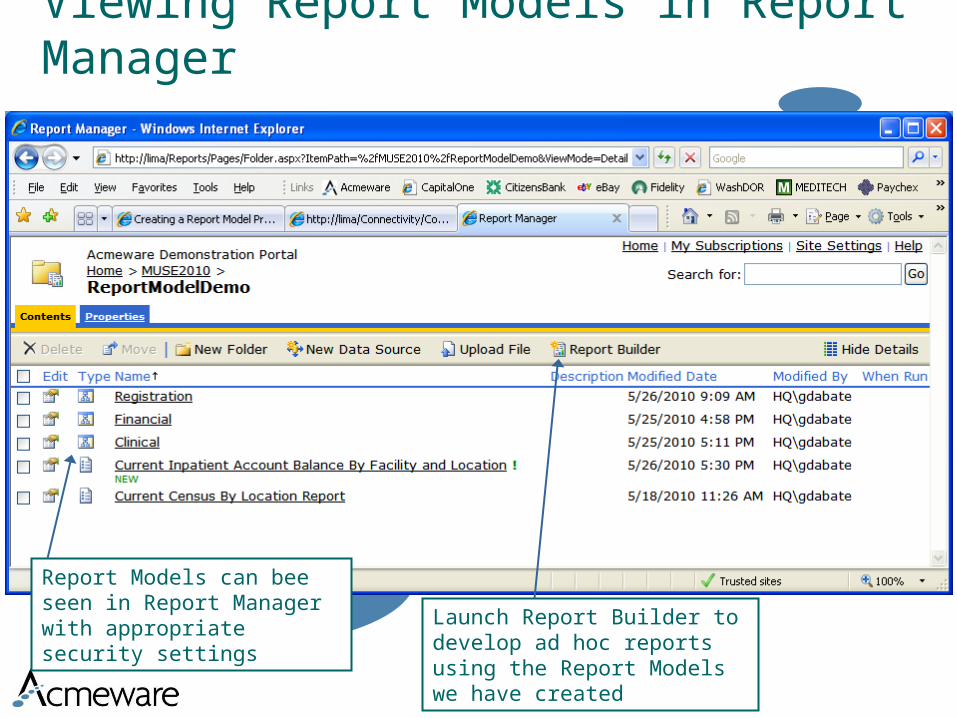
Viewing Report Models in Report Manager
Report Models can bee seen in Report Manager with appropriate security settings
Launch Report Builder to develop ad hoc reports using the Report Models we have created

Report Models in Report Builder
Models available in Report Builder IDE
Reporting Basics and Saved Reports
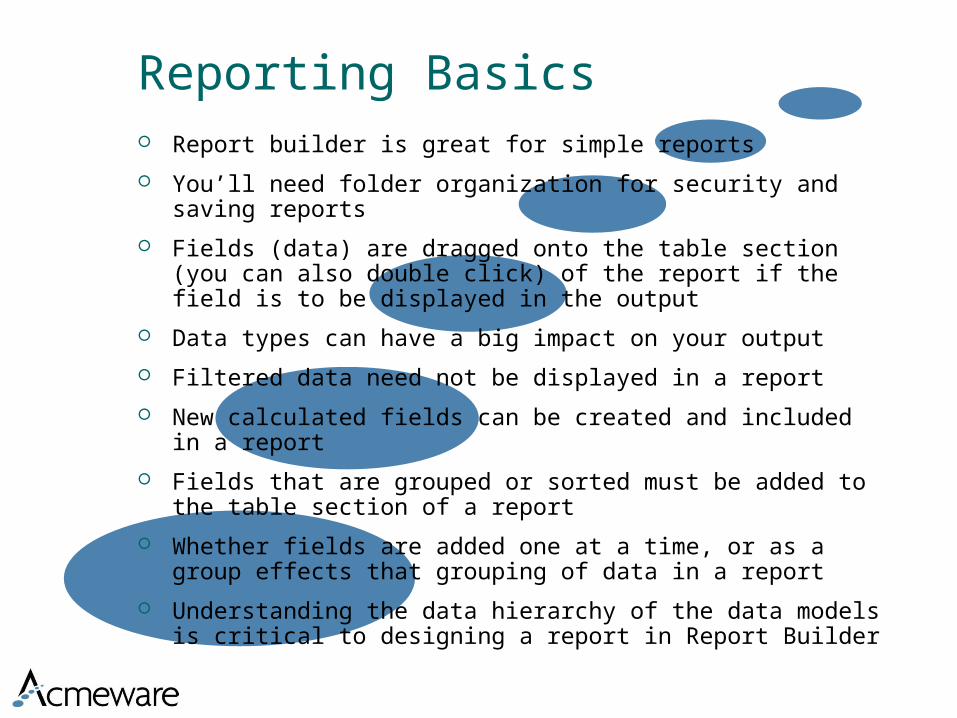
Reporting Basics Report builder is great for simple reports
You’ll need folder organization for security and saving reports
Fields (data) are dragged onto the table section (you can also double click) of the report if the field is to be displayed in the output
Data types can have a big impact on your output
Filtered data need not be displayed in a report
New calculated fields can be created and included in a report
Fields that are grouped or sorted must be added to the table section of a report
Whether fields are added one at a time, or as a group effects that grouping of data in a report
Understanding the data hierarchy of the data models is critical to designing a report in Report Builder
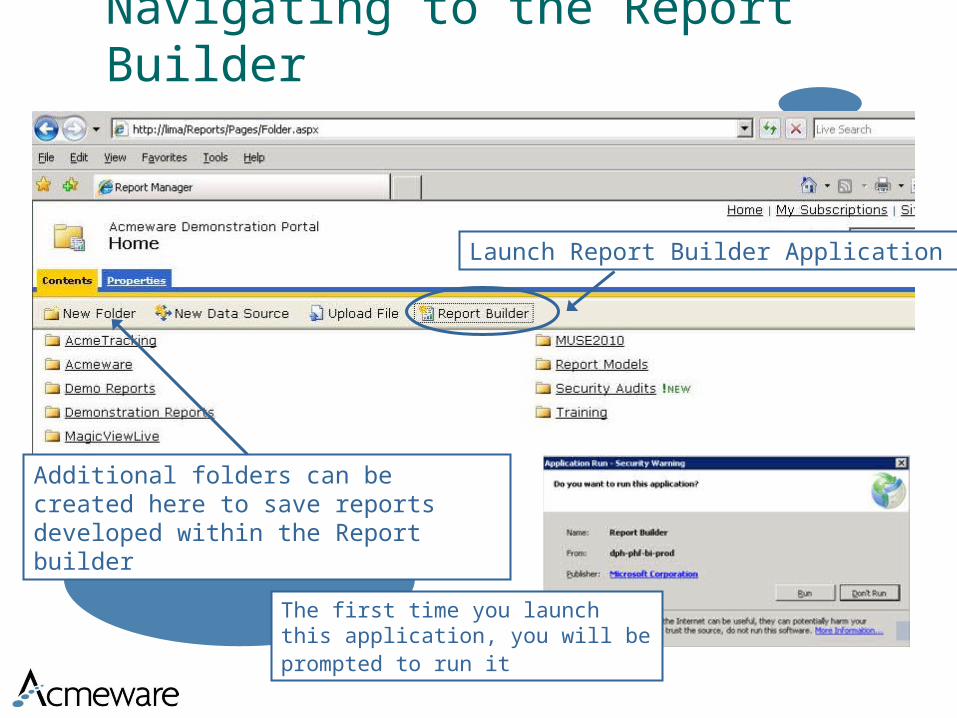
Navigating to the Report Builder
Additional folders can be created here to save reports developed within the Report builder
The first time you launch this application, you will be prompted to run it
Launch Report Builder Application
Opening Models
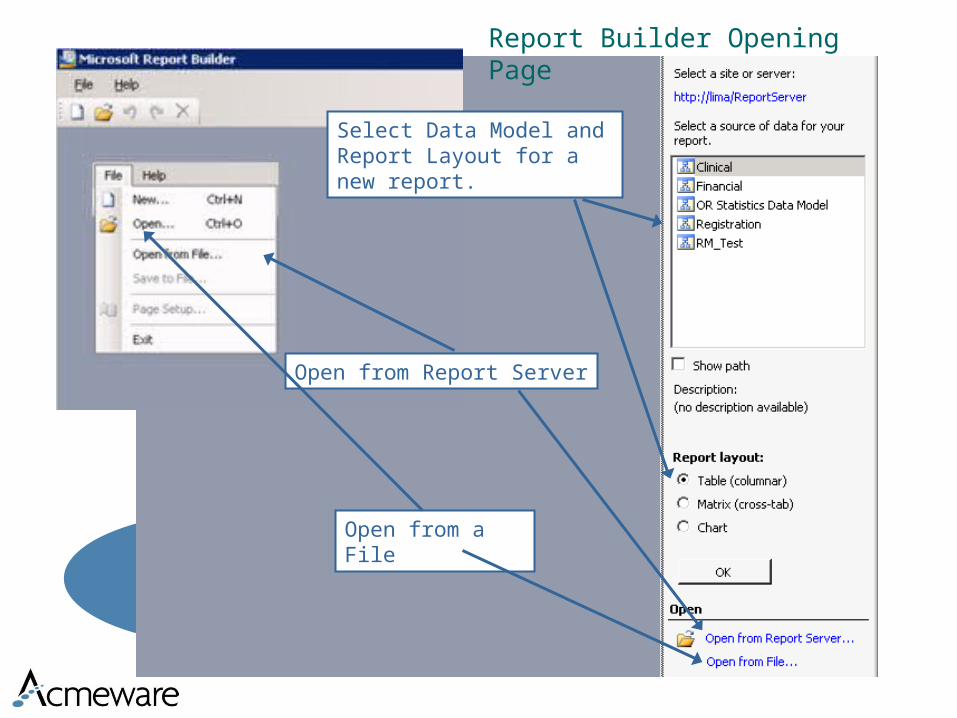
Open from Report Server
Open from a File
Report Builder Opening Page
Select Data Model and Report Layout for a new report.
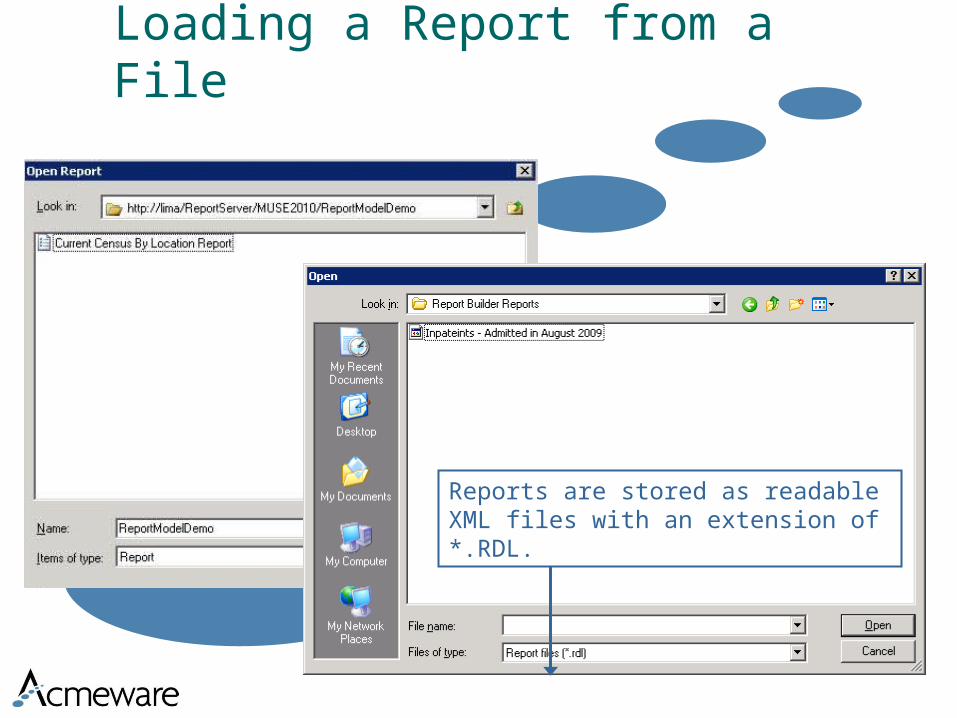
Reports are stored as readable XML files with an extension of *.RDL.
Loading a Report from a File
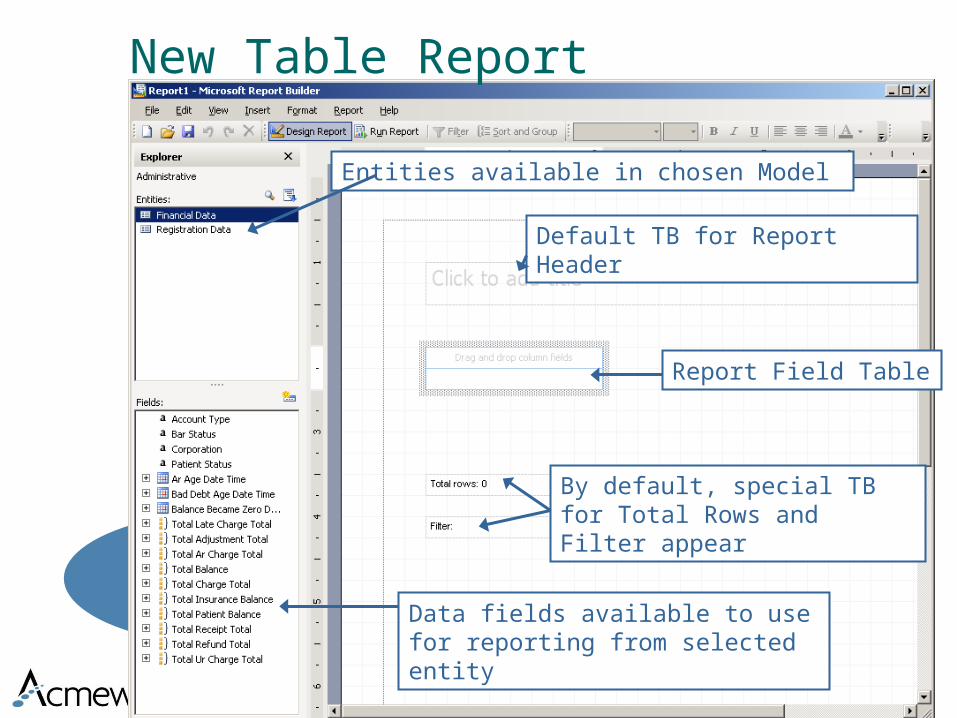
New Table Report
Entities available in chosen Model
Data fields available to use for reporting from selected entity
By default, special TB for Total Rows and Filter appear
Report Field Table
Default TB for Report Header
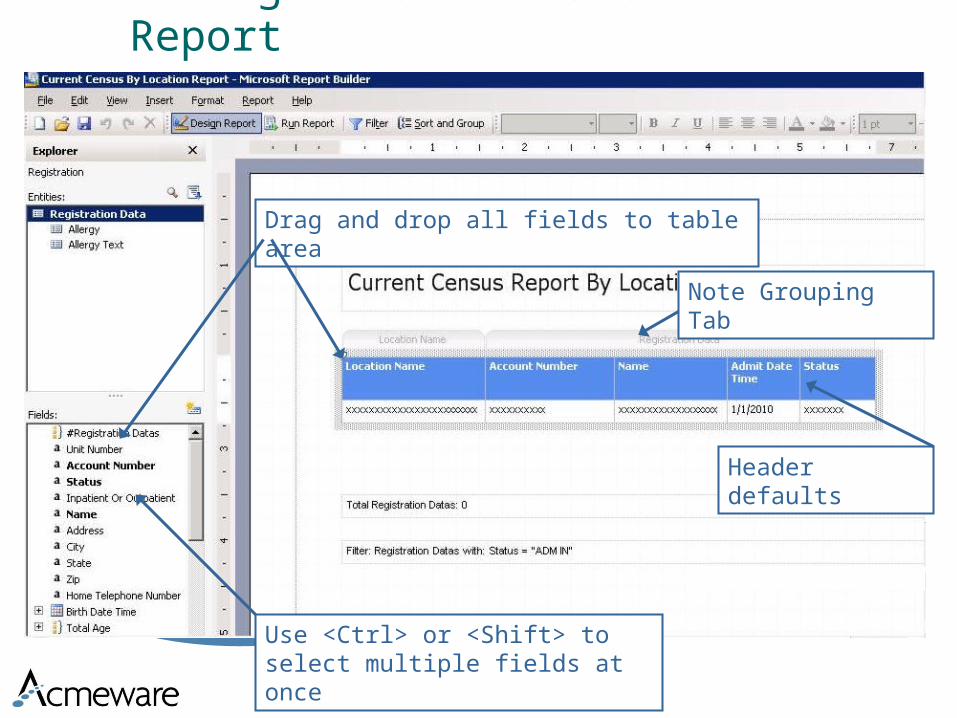
Adding Text Fields to a Report
Use <Ctrl> or <Shift> to select multiple fields at once
Drag and drop all fields to table area
Header defaults
Note Grouping Tab

Filter Dialogue Box
Define filters for Report
Drag fields (or double click) to apply filters
* Advanced filter options discussed later in the presentation
These fields have various options that we will show in the demo

Define Formula Dialogue box – Custom/Calculated Fields
Icon opens the Define formula box for Custom fields or Custom Field Filters

Field Types
The Field Data Type has a big influence on behavior of the field in the Report Field Table
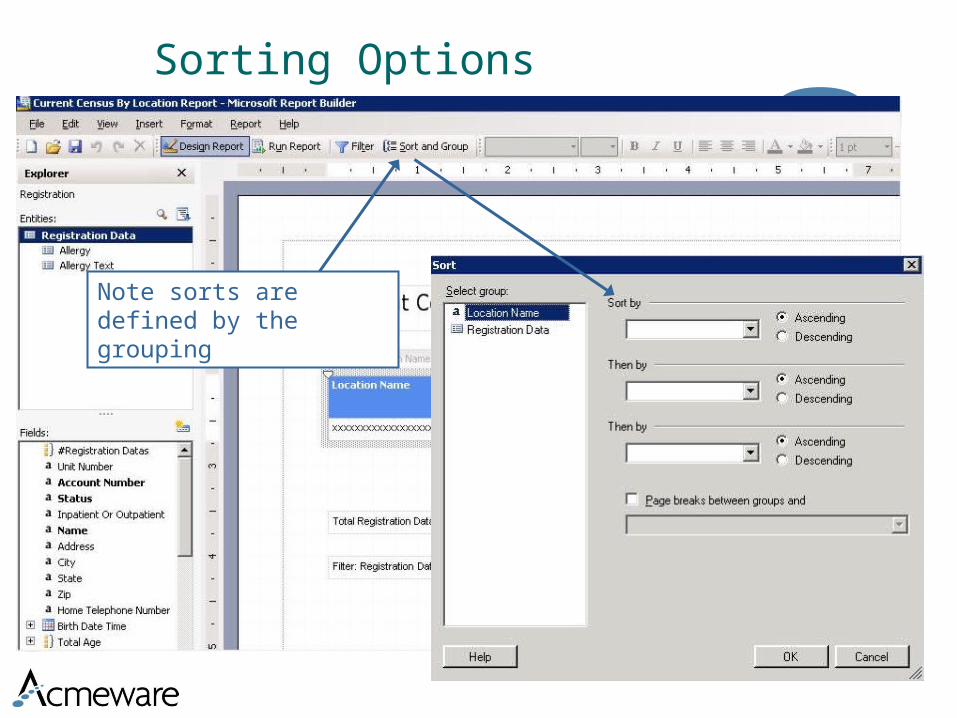
Sorting Options
Note sorts are defined by the grouping
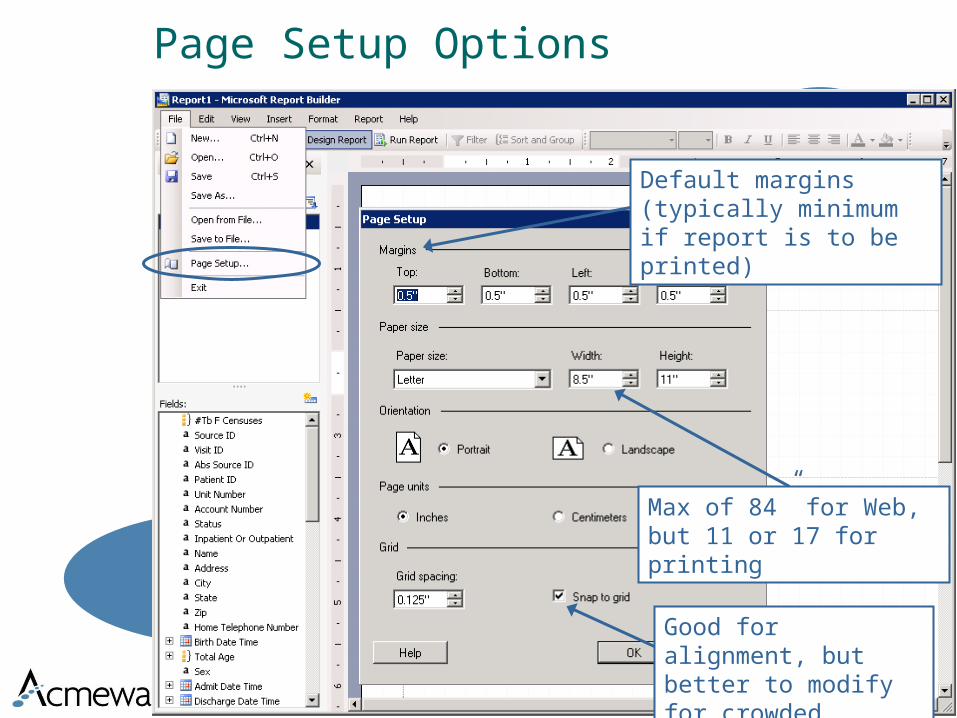
Page Setup Options
Default margins (typically minimum if report is to be printed)
Max of 84” for Web, but 11 or 17 for printing
Good for alignment, but better to modify for crowded reports

Reporting Basics and Saved Reports
Demo nstration
Filters and Groups

Filtering Result Data
Report Builder provides a Filter Building Dialog Box that simplifies the construction of report filters
Filtering result data allows a report to contain only data of interest
Reports can filter on data that is not displayed in the output
Filters can be on field data as well as computed fields
Filters can be statically entered in the report design or dynamically collected through prompts during report execution
Filter groups are available for sets of ‘OR’ statements

Launching the Filter Dialogue Box
Launch filter dialogue box
Filter Entities
Filters
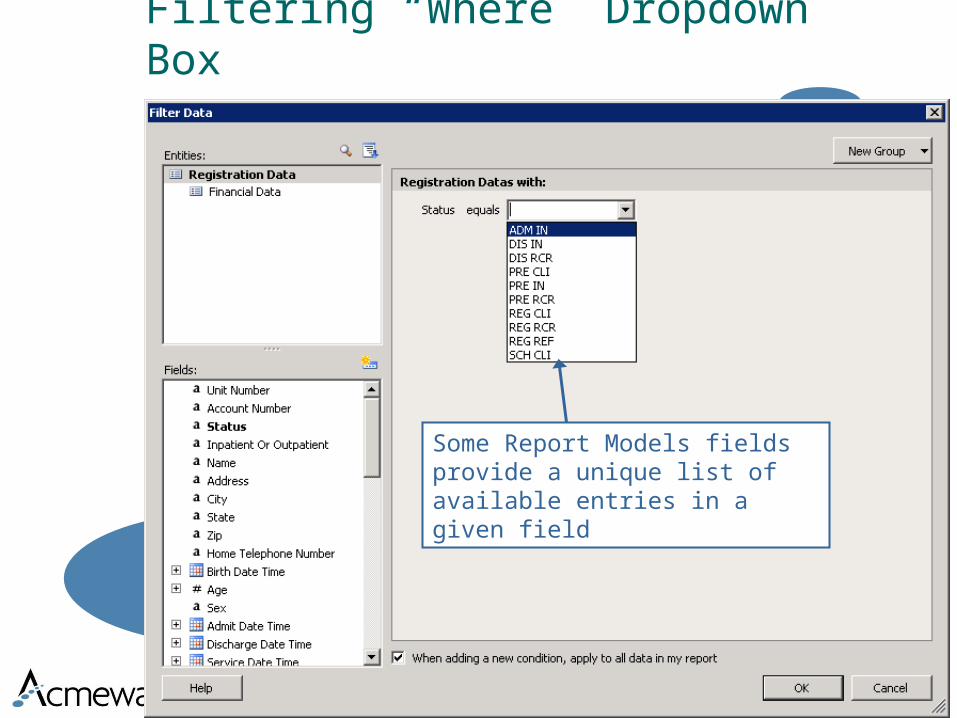
Filtering “Where” Dropdown Box
Some Report Models fields provide a unique list of available entries in a given field
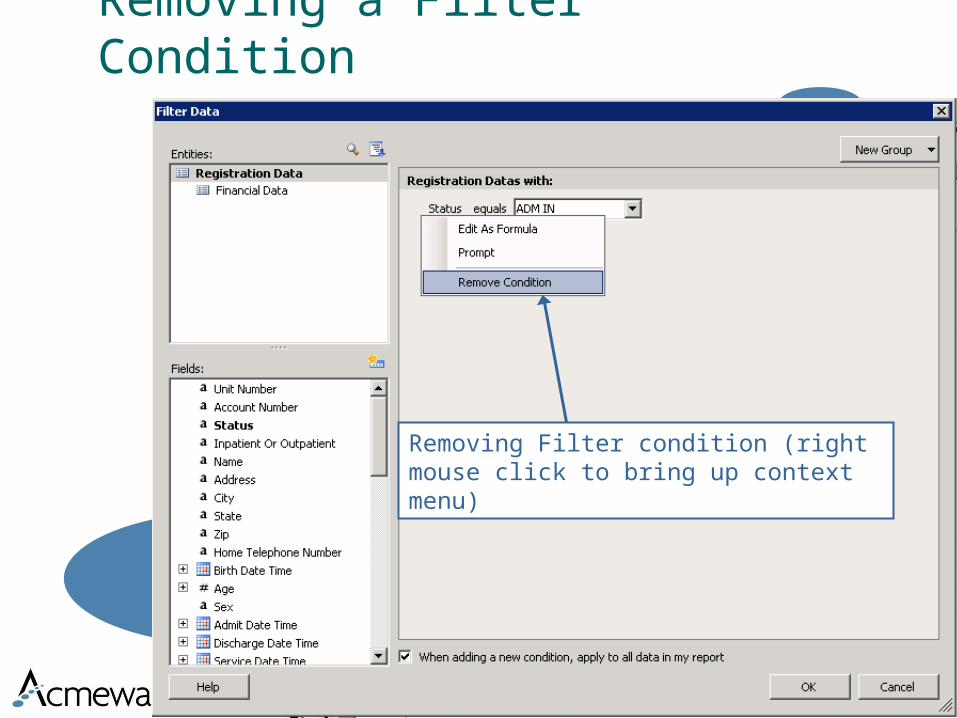
Removing a Filter Condition
Removing Filter condition (right mouse click to bring up context menu)
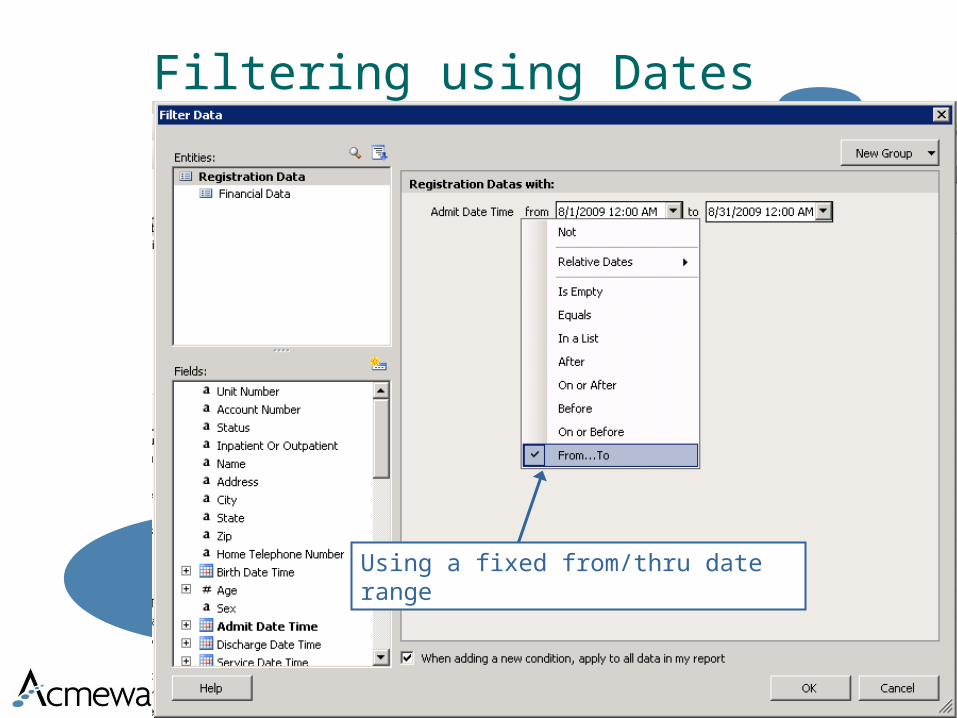
Filtering using Dates
Using a fixed from/thru date range

From / Through Dates
Date control is used both when creating a Filter and when executing reports

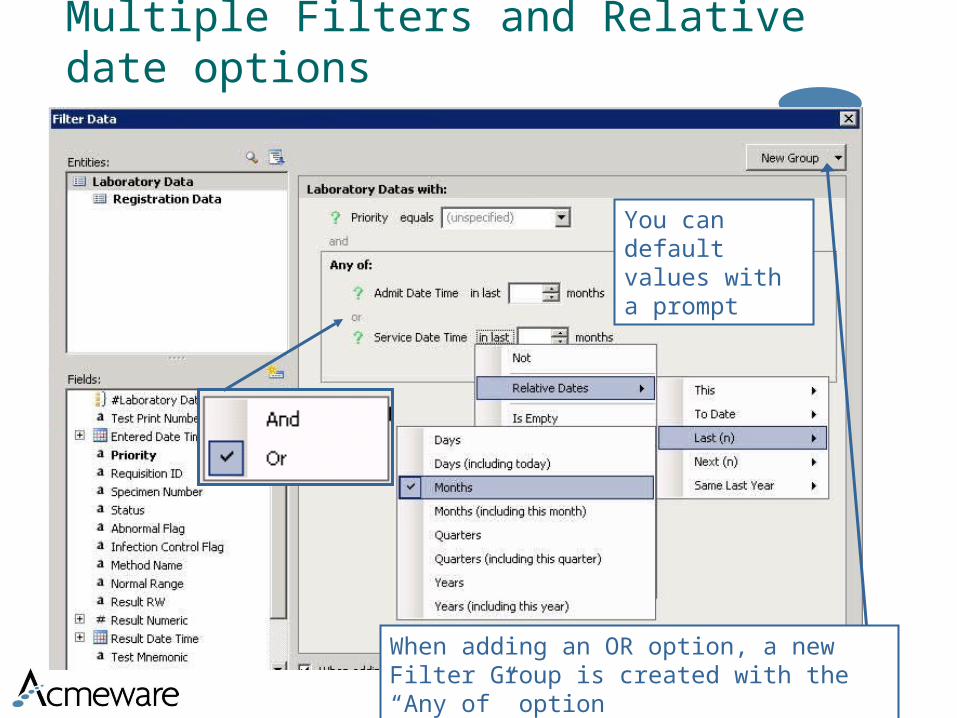
Multiple Filters
When adding an OR option, a new Filter Group is created with the “Any of” option
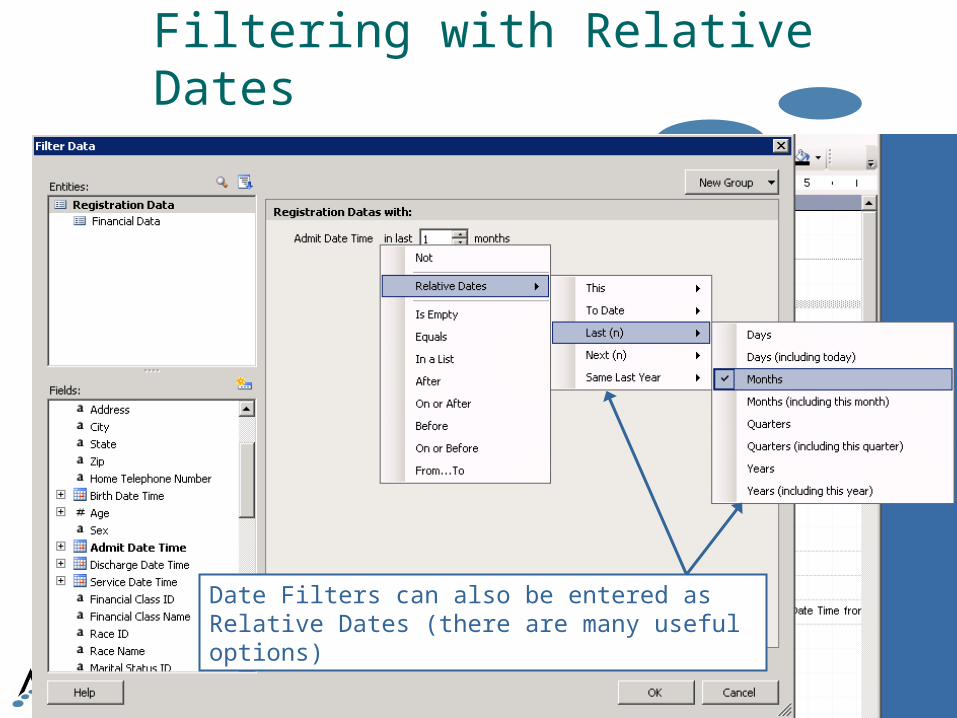
Filtering with Relative Dates
Date Filters can also be entered as Relative Dates (there are many useful options)

Query ID List Dialogue
Selecting a single QueryID from the available data
1400 Available QueryIDs

Grouping Concepts
Grouping make sense in the context of the hierarchical relationships that exist in MEDITECH data and are translated to the Report Models
Whenever a “one-to-many” relationship exists, Grouping on the “one” field and aggregating the “many” field is possible
You use Grouping whenever you describe a report specification using the keyword “By”
Grouping can occur on Formula fields as well as Entity fields
Grouping in the Report Builder requires paying very close attention to Tabbed Label above the Table. When fields share a Tab, they are at the same hierarchical level (e.g., Account Number, Admit Date, Admit Provider, Count of Orders)

Example 1 – Grouping on Attending Provider
Note the name of the tab ‘Attending Provider Name’ – this is important to your output
The name of the tab indicates the field that the data will be grouped on
Count of Patients is a calculated field that we will cover in the next section

Example 1 - Output and Sorting
The two options here are Attending Provider and Count of Patient
Sorting is set by the available tabs and fields in the report

Example 2 – Adds Financial ClassID as a New Group
Financial ClassID is dropped to the left of the current tab/table to create a new group. The summary is now by Provider and by Financial Class indicated by the grouping and Total Rows.

Example 2 – Output to include FinClassID
Totals are now grouped by Financial Class ID and then Attending Provider
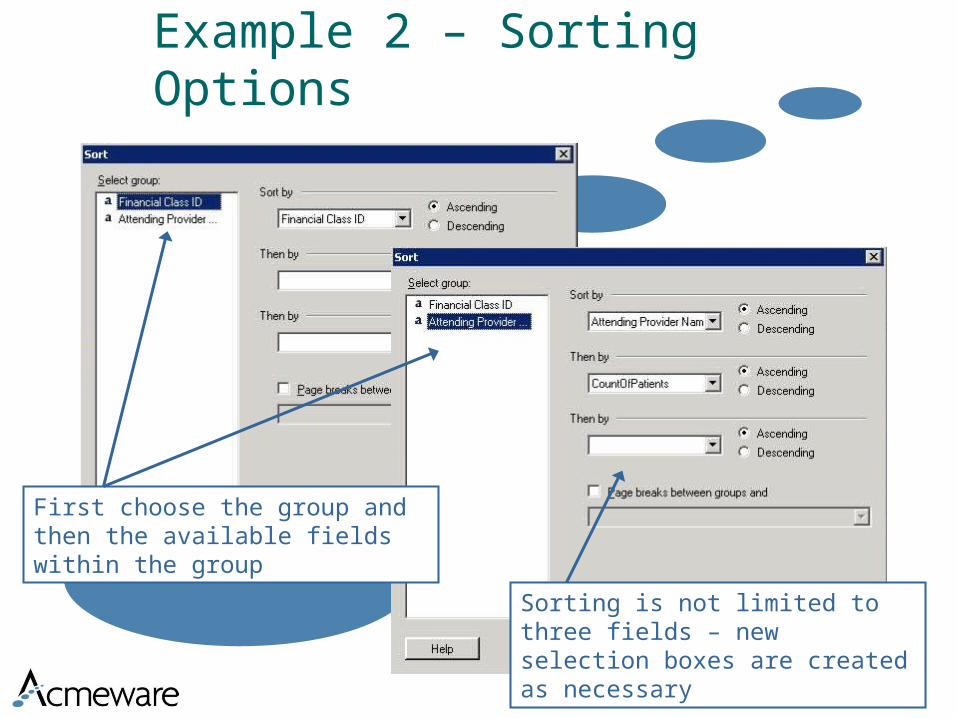
Example 2 – Sorting Options
First choose the group and then the available fields within the group
Sorting is not limited to three fields – new selection boxes are created as necessary

Example 3 – Grouping on Account Number and Procedure
Procedure Grouping – Procedure Description is brought over first then the aggregate fields are added to the right
Account Number Grouping – Account Number is selected from another Entity and brought over to the left of the current tab

Example 3 - Output
We have totals by Procedure by Account Number
Note Procedures totals – the grouped tab determined this display
Filtering and Grouping
Demo nstration

Formatting and Creating a Tabular
Report

Creating a Census Report
Drag over all four fields at one time by highlighting with the <Ctrl> key. Note tab name.
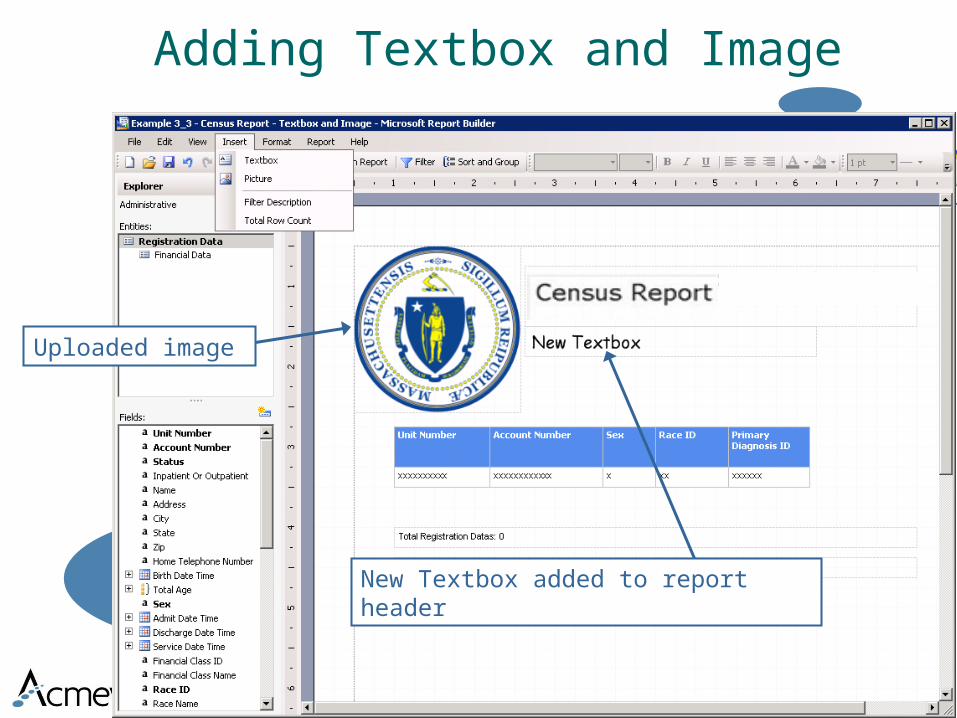
Adding Textbox and Image
New Textbox added to report header
Uploaded image
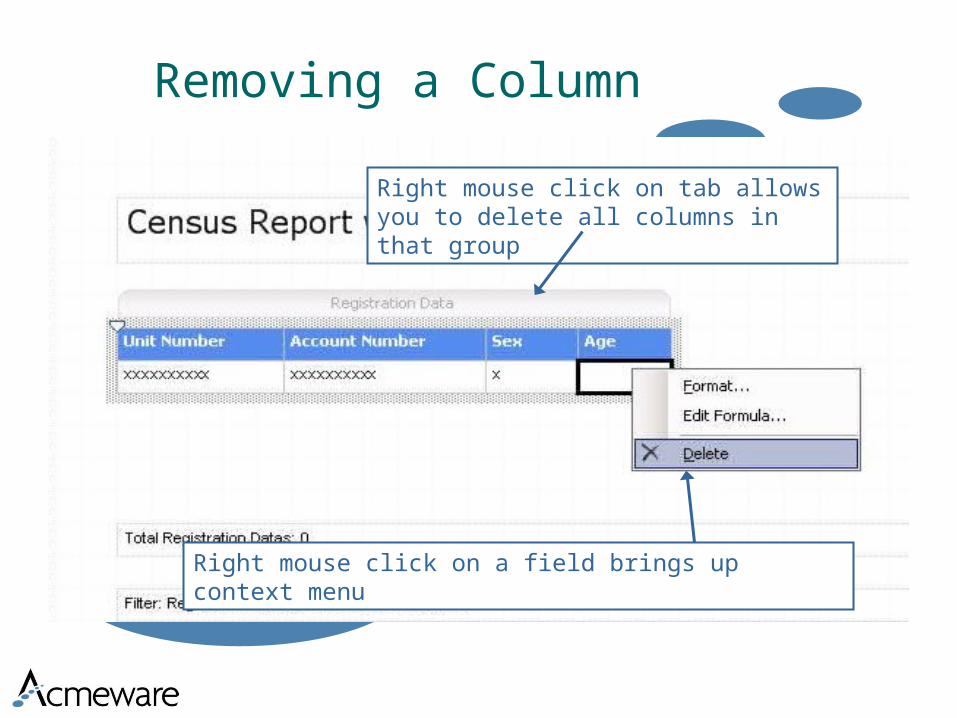
Removing a Column
Right mouse click on a field brings up context menu
Right mouse click on tab allows you to delete all columns in that group
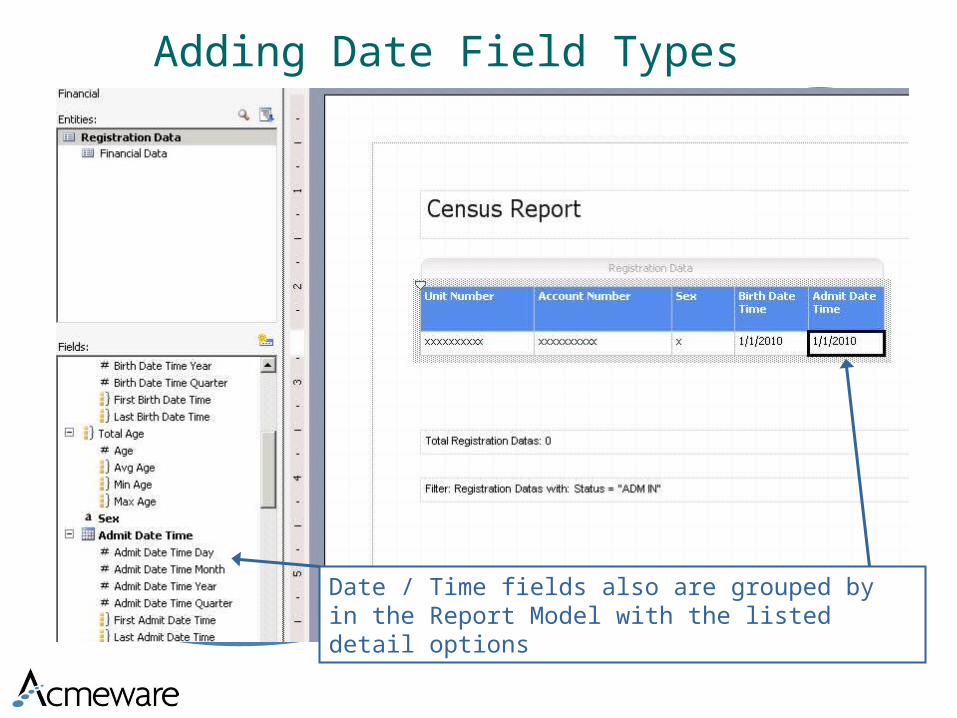
Adding Date Field Types
Date / Time fields also are grouped by in the Report Model with the listed detail options
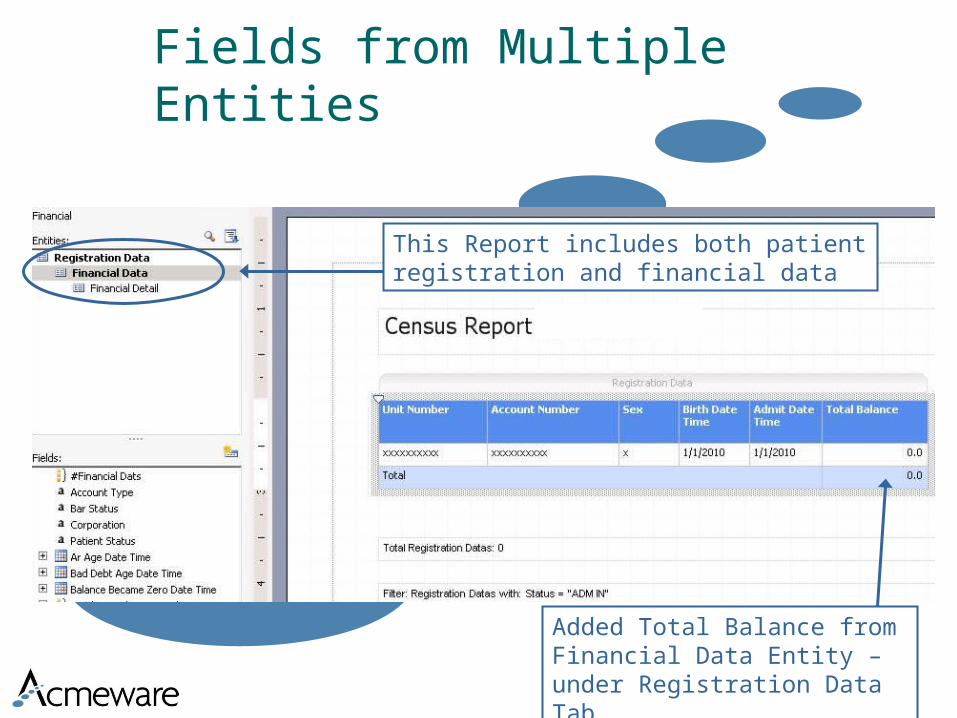
Fields from Multiple Entities
This Report includes both patient registration and financial data
Added Total Balance from Financial Data Entity – under Registration Data Tab

Formatting Text FieldsTextbox or Text field Format option dialogue boxes
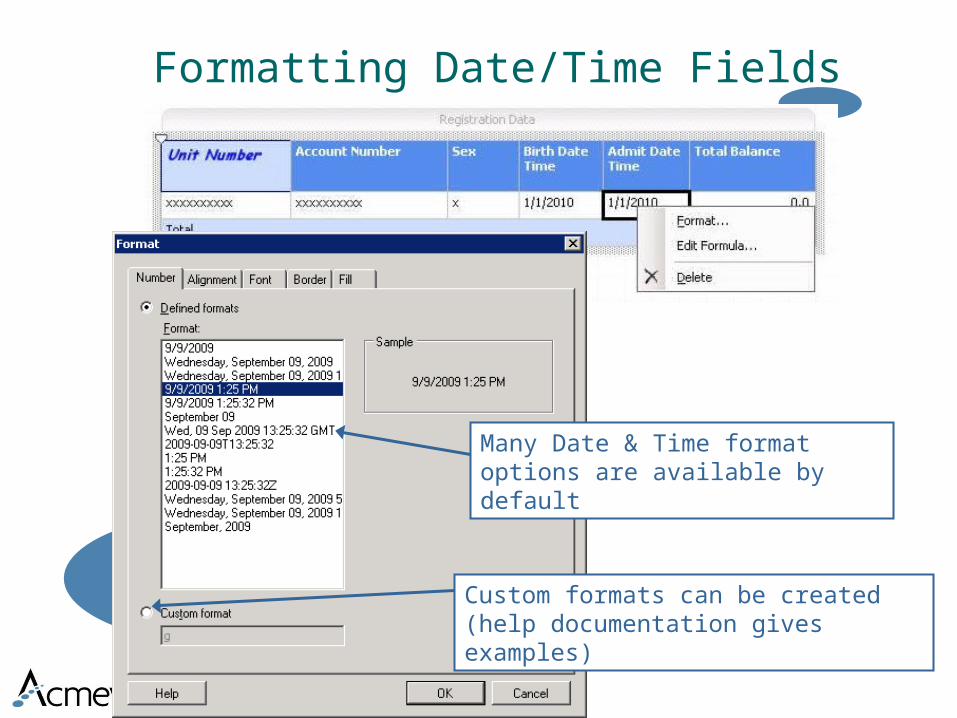
Formatting Date/Time Fields
Many Date & Time format options are available by default
Custom formats can be created (help documentation gives examples)
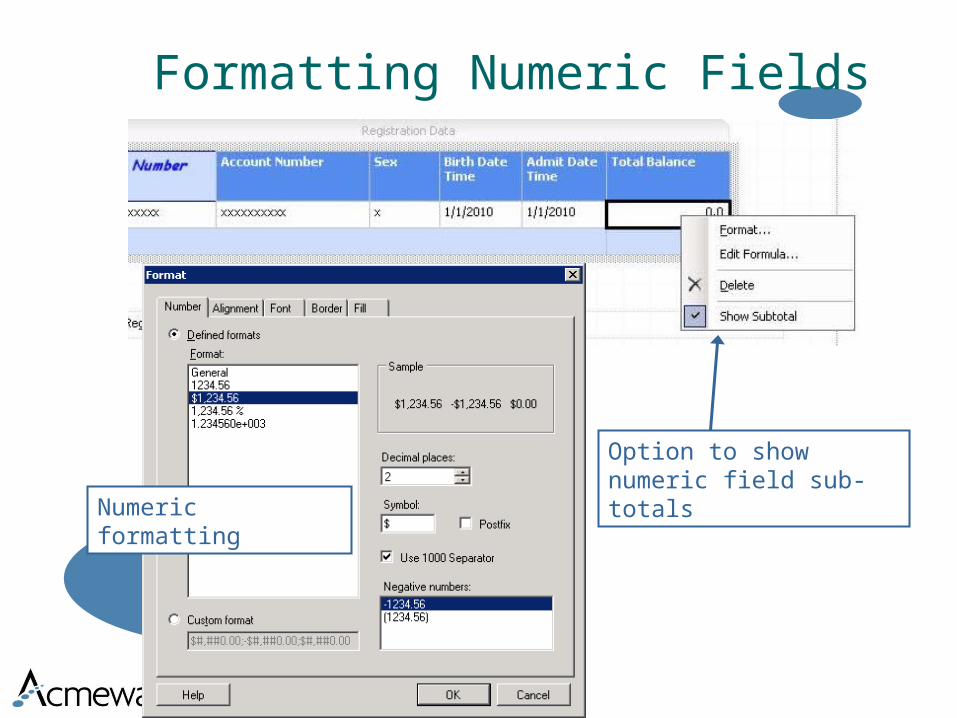
Formatting Numeric Fields
Numeric formatting
Option to show numeric field sub-totals
Formatting and Creating a Tabular Report
Demo nstration
Advanced Filters, Creating Custom
Fields, and How to Get Help

Advanced Filter Options
Prompts
Prompts are used to allow flexibility in reports
Prompts let the same report answer many different questions
Prompts can filter output and provide default values for input
Prompt data can be used to filter but are NOT treated like other field objects for the purpose of grouping, sorting, etc.
Often times, dictionary tables values are used for prompt dropdown lists (IDs are used for multiple lists and do not function well with prompts)
Group Filters
Group filters are used for large OR statements
Custom Filters
Custom fields can be created to be used as a filter
Sometimes custom fields are needed to be available for a prompt
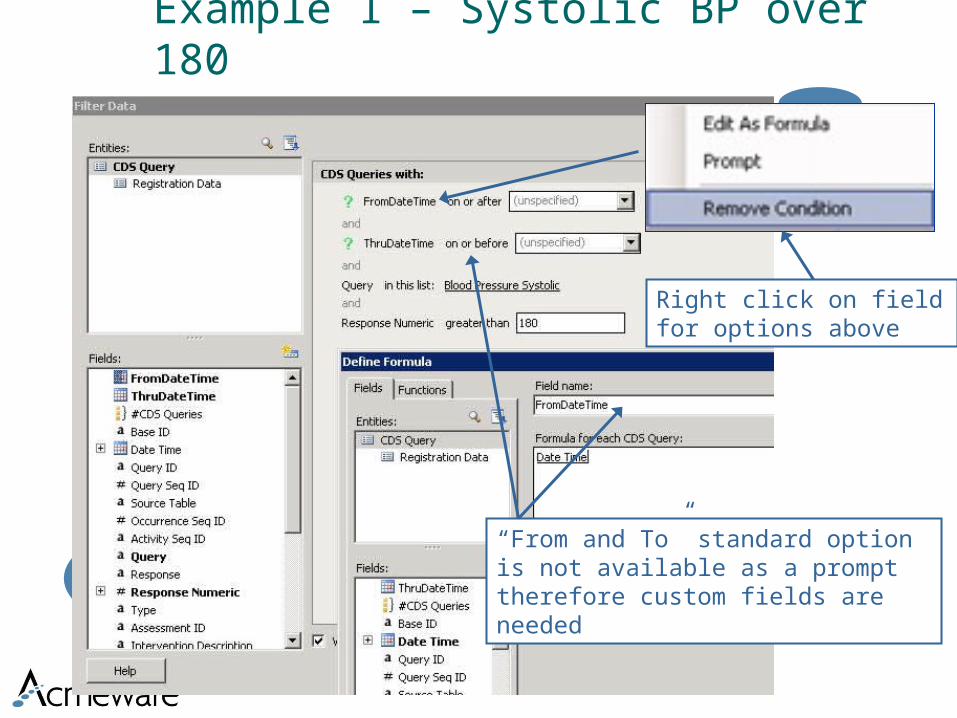
Example 1 – Systolic BP over 180
Right click on field for options above
“From and To” standard option is not available as a prompt therefore custom fields are needed
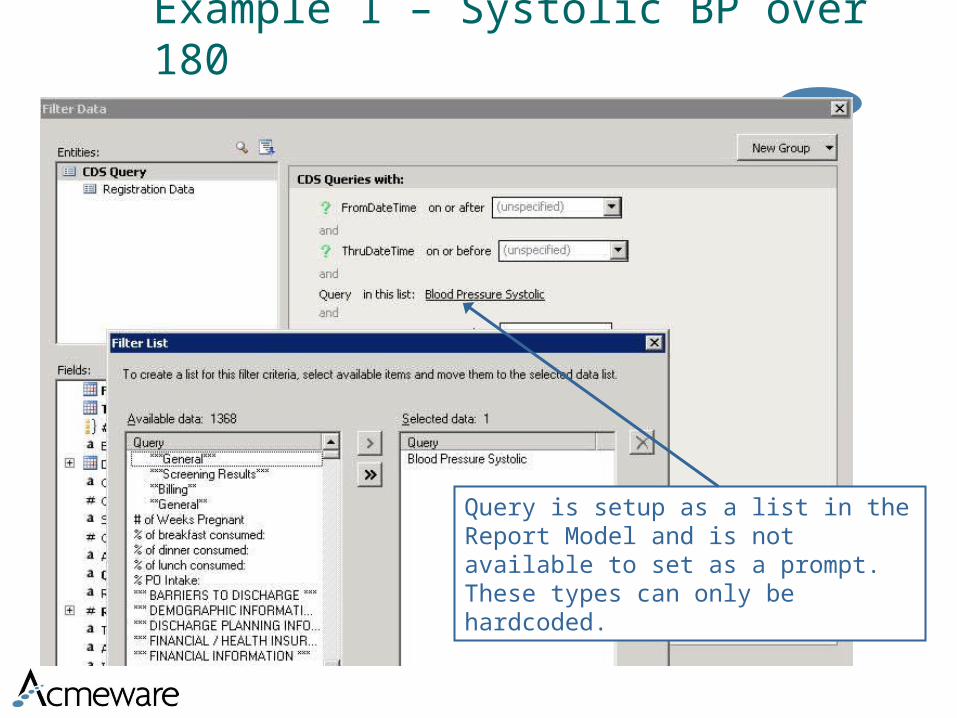
Example 1 – Systolic BP over 180
Query is setup as a list in the Report Model and is not available to set as a prompt. These types can only be hardcoded.
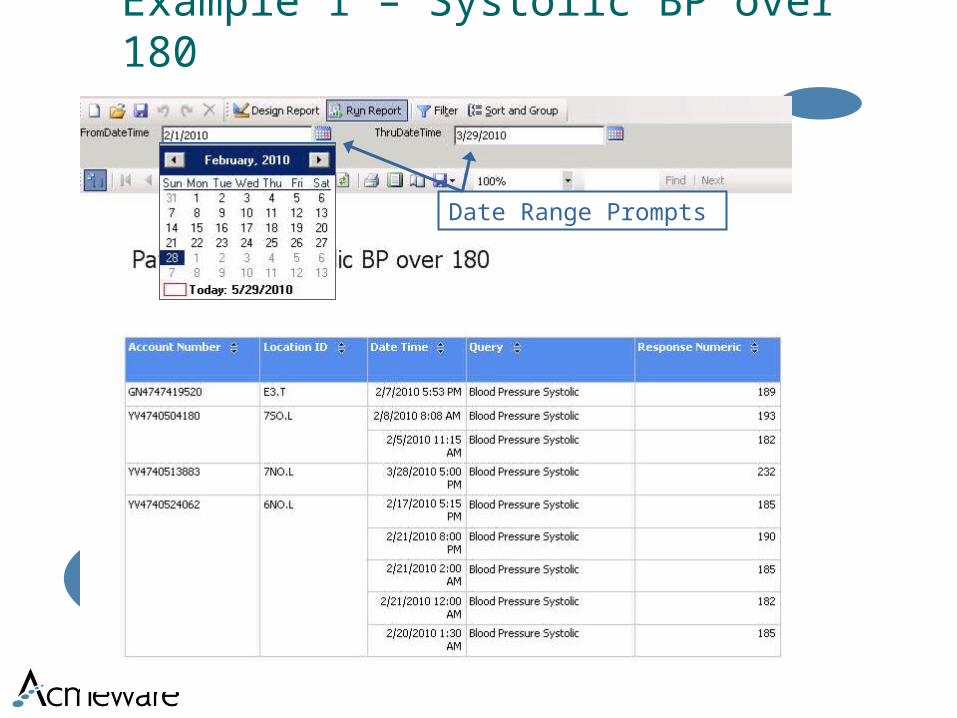
Example 1 – Systolic BP over 180
Date Range Prompts
Multiple Filters and Relative date options
When adding an OR option, a new Filter Group is created with the “Any of” option
You can default values with a prompt

Lab Result with Abnormal Flag Filter
Fields built as a dropdown create a combo box when set as a prompt and “in a list” is set.
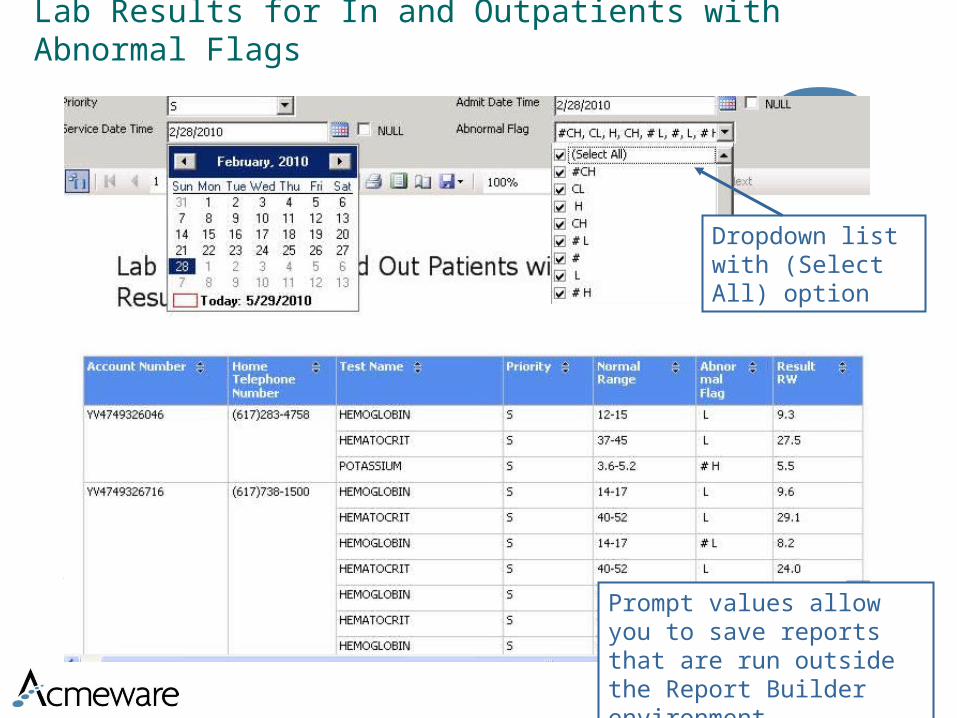
Lab Results for In and Outpatients with Abnormal Flags
Dropdown list with (Select All) option
Prompt values allow you to save reports that are run outside the Report Builder environment
User-Defined Formula Fields Formulas allow you to combine, aggregate, filter, and
evaluate both numeric and text data. You can create formulas and save them as new fields.
All formulas are defined within the context of an entity. This means that the formula returns a single value for each item within the entity. For example, suppose you create a formula within the Registration entity. The formula returns a single value for each Visit (Registration).
A formula can contain any or all of the following: user created fields, functions, operators, and constants.
You will need to create fields for specific types of information such as the count of records or the count of any item. This is not something that can be pre-populated.
From and through date ranges will need to be created if you want to set those values as a prompt.

Date Functions – LOS Computation
Creating a new user defined field within a entity
User created fields show up at the top of the entity field list with the appropriate field data type icon
Example to compute the actual LOS based on Admit and Discharge Dates
Inpatients with >= 365 Days LOS
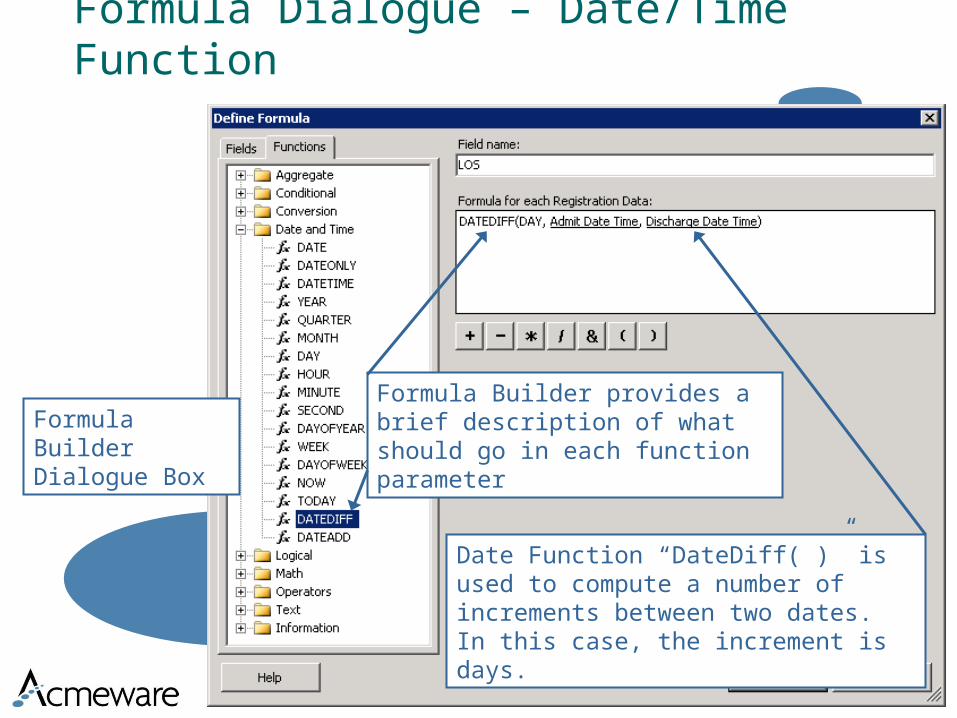
Formula Dialogue – Date/Time Function
Date Function “DateDiff( )” is used to compute a number of increments between two dates. In this case, the increment is days.
Formula Builder Dialogue Box
Formula Builder provides a brief description of what should go in each function parameter
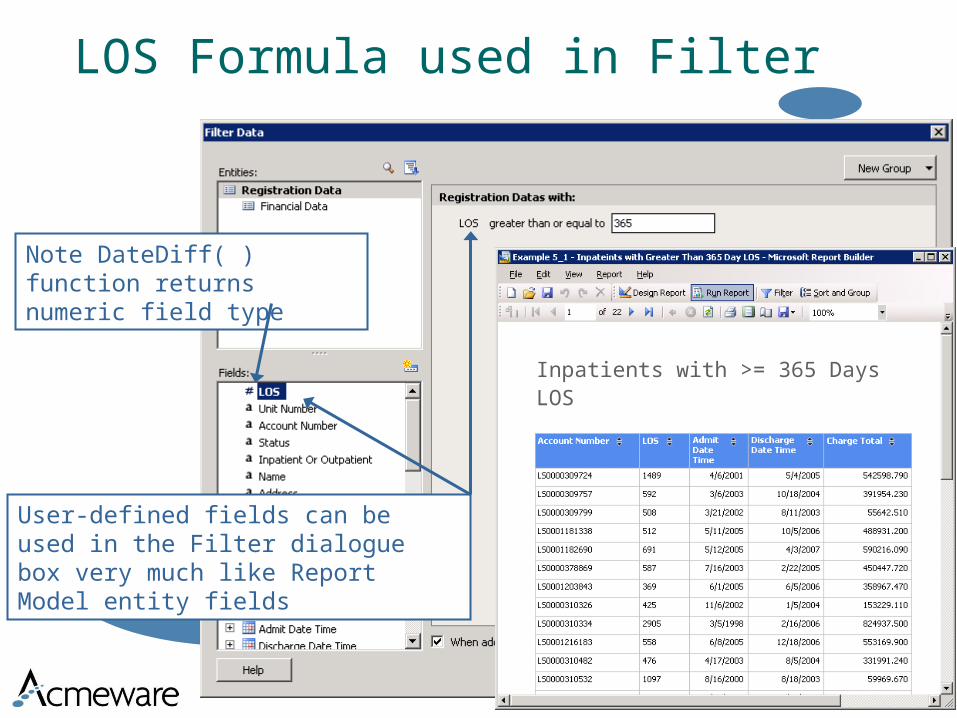
LOS Formula used in Filter
User-defined fields can be used in the Filter dialogue box very much like Report Model entity fields
Note DateDiff( ) function returns numeric field type
Inpatients with >= 365 Days LOS
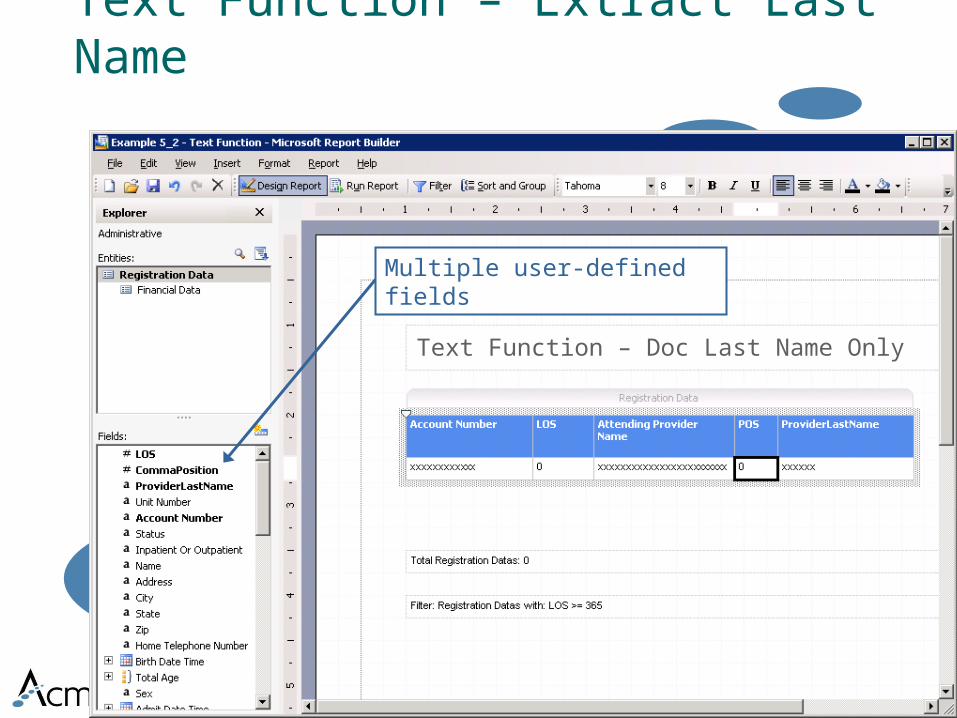
Text Function – Extract Last Name
Multiple user-defined fields
Text Function – Doc Last Name Only
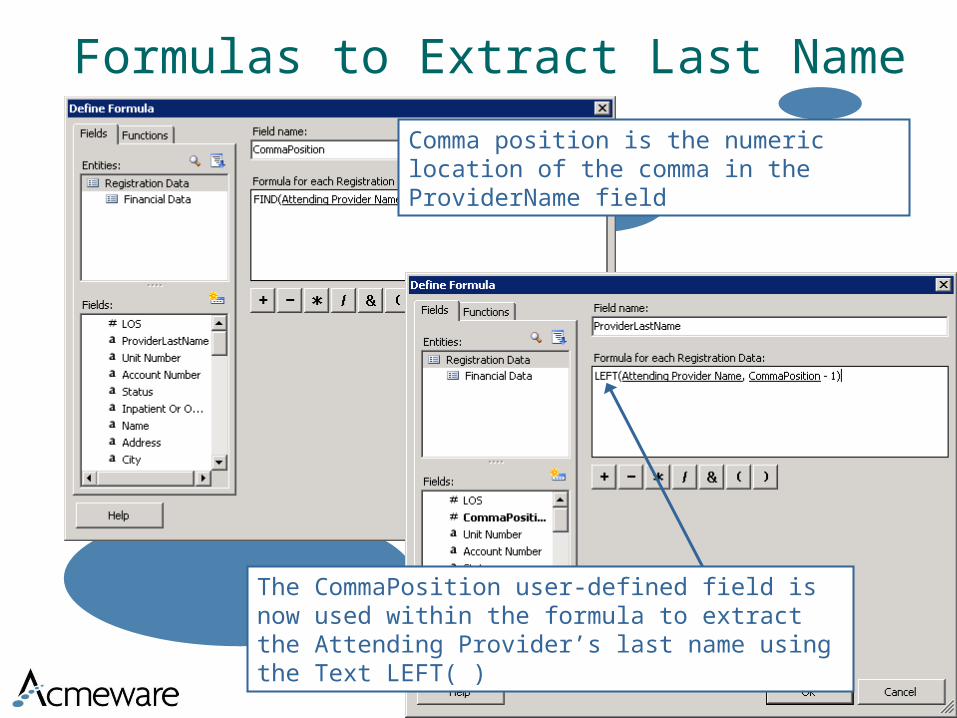
Formulas to Extract Last Name
Comma position is the numeric location of the comma in the ProviderName field
The CommaPosition user-defined field is now used within the formula to extract the Attending Provider’s last name using the Text LEFT( )

Provider Last Name Output
This works for Provider Names with a comma
Text Function – Doc Last Name Only
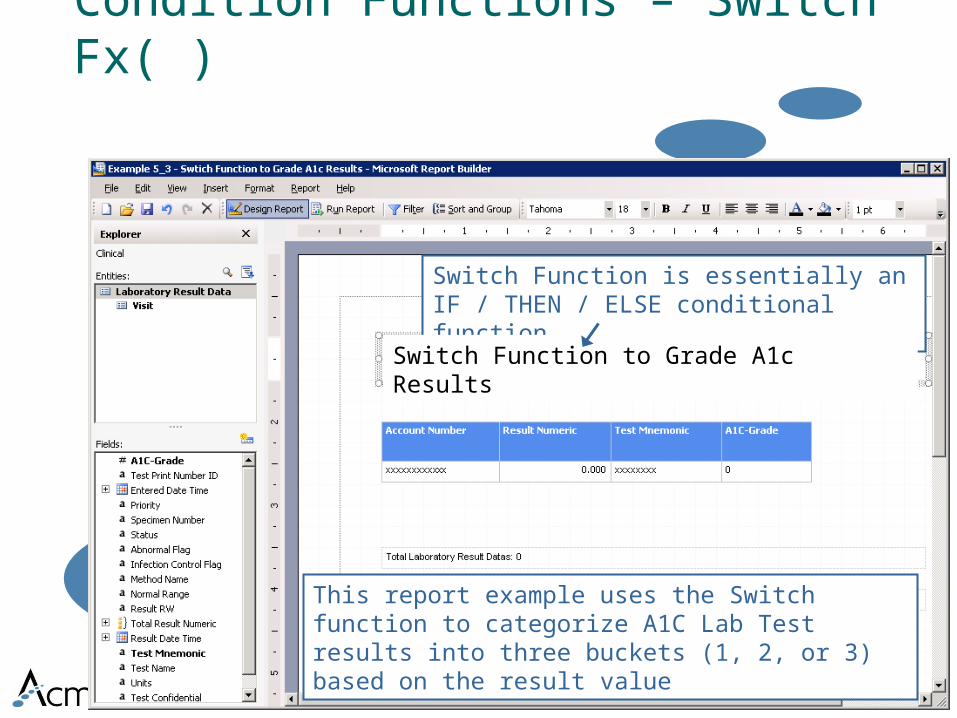
Condition Functions – Switch Fx( )
Switch Function is essentially an IF / THEN / ELSE conditional function
This report example uses the Switch function to categorize A1C Lab Test results into three buckets (1, 2, or 3) based on the result value
Switch Function to Grade A1c Results
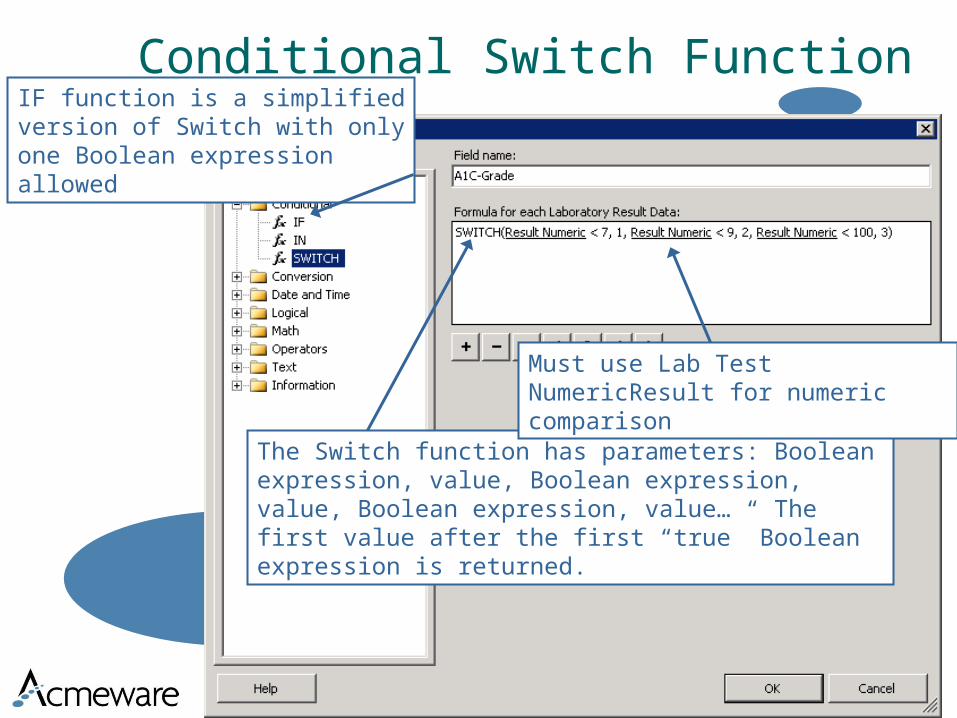
Conditional Switch Function
The Switch function has parameters: Boolean expression, value, Boolean expression, value, Boolean expression, value… The first value after the first “true” Boolean expression is returned.
IF function is a simplified version of Switch with only one Boolean expression allowed
Must use Lab Test NumericResult for numeric comparison
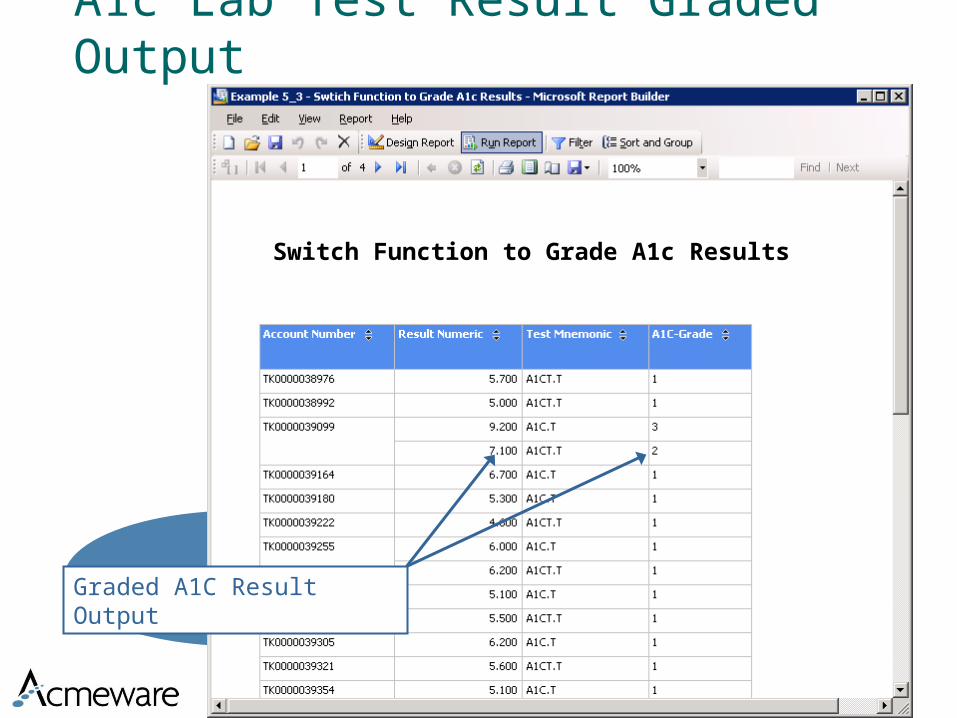
A1c Lab Test Result Graded Output
Graded A1C Result Output
Switch Function to Grade A1c Results
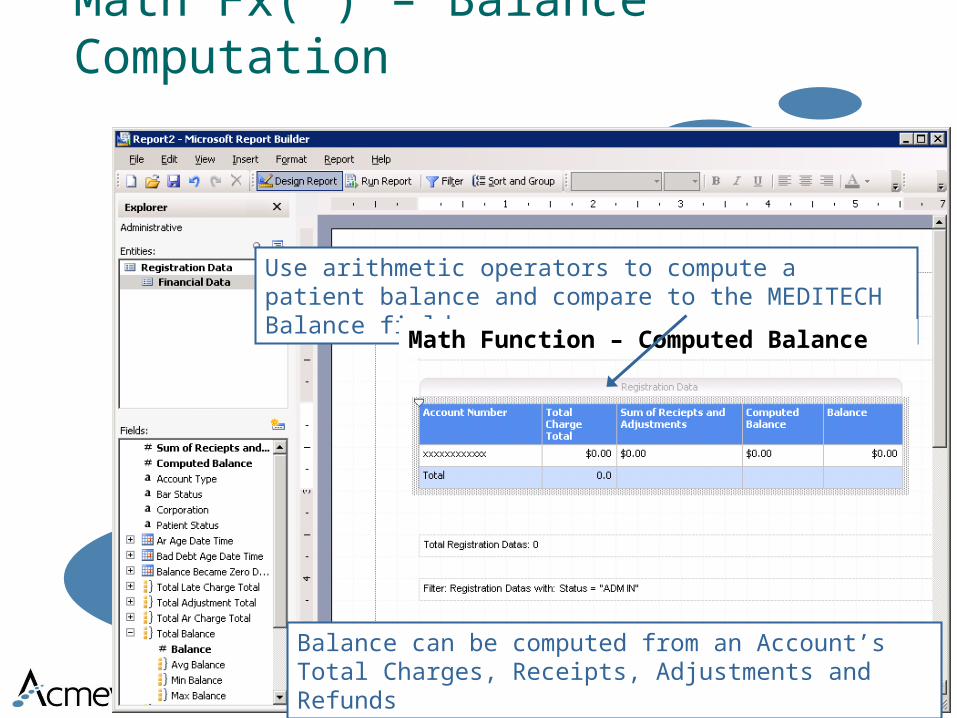
Math Fx( ) – Balance Computation
Use arithmetic operators to compute a patient balance and compare to the MEDITECH Balance field
Balance can be computed from an Account’s Total Charges, Receipts, Adjustments and Refunds
Math Function – Computed Balance
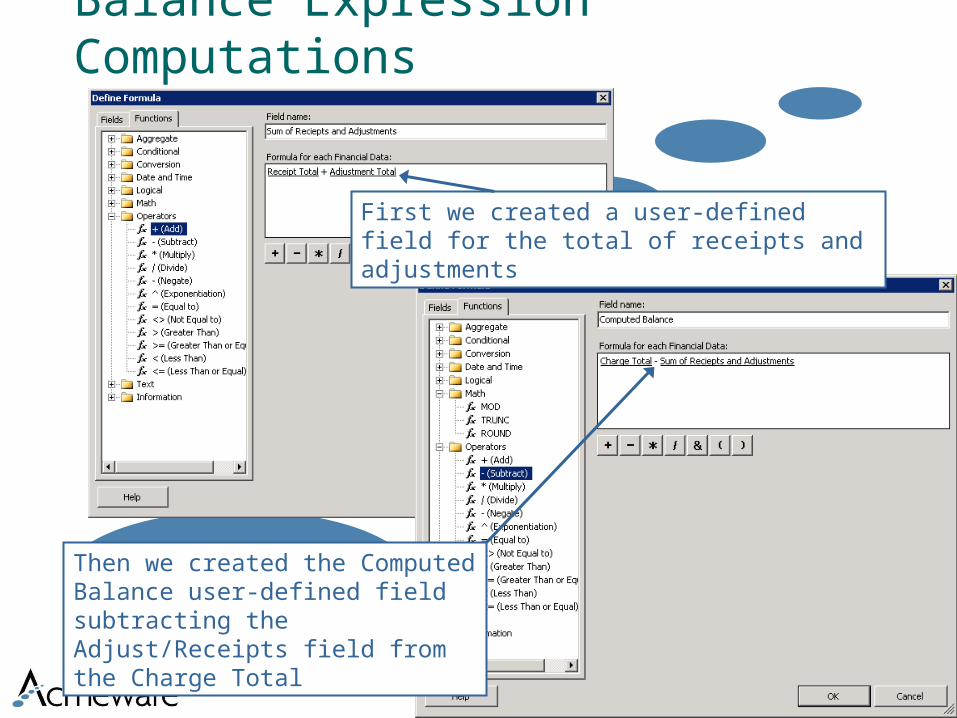
Balance Expression Computations
First we created a user-defined field for the total of receipts and adjustments
Then we created the Computed Balance user-defined field subtracting the Adjust/Receipts field from the Charge Total
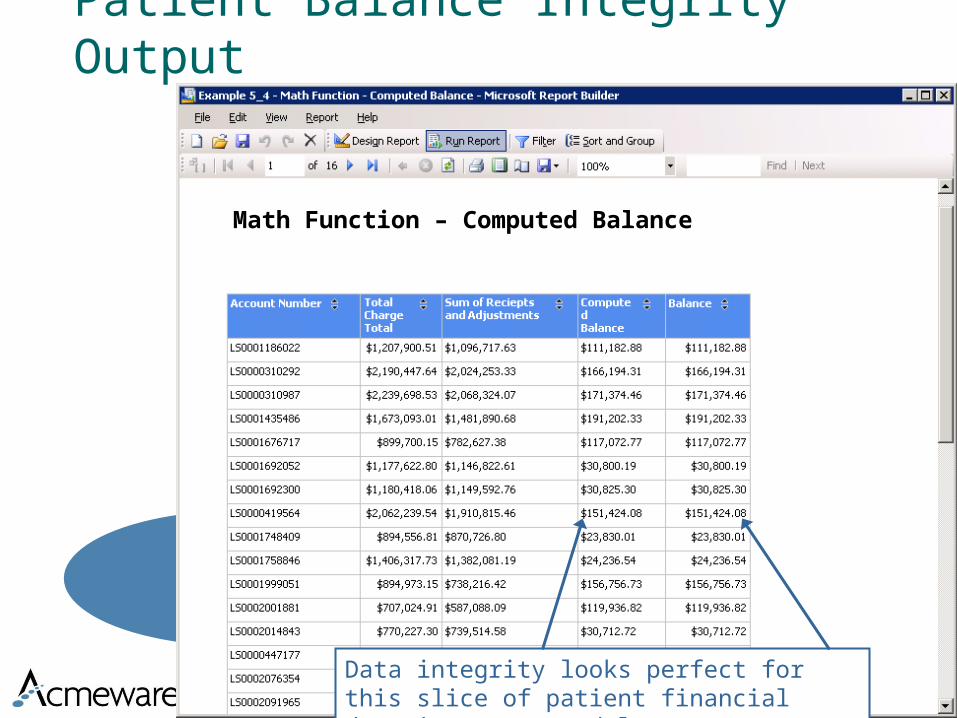
Patient Balance Integrity Output
Data integrity looks perfect for this slice of patient financial data in report model
Math Function – Computed Balance
Advanced Filters and Custom Fields
Demo nstration
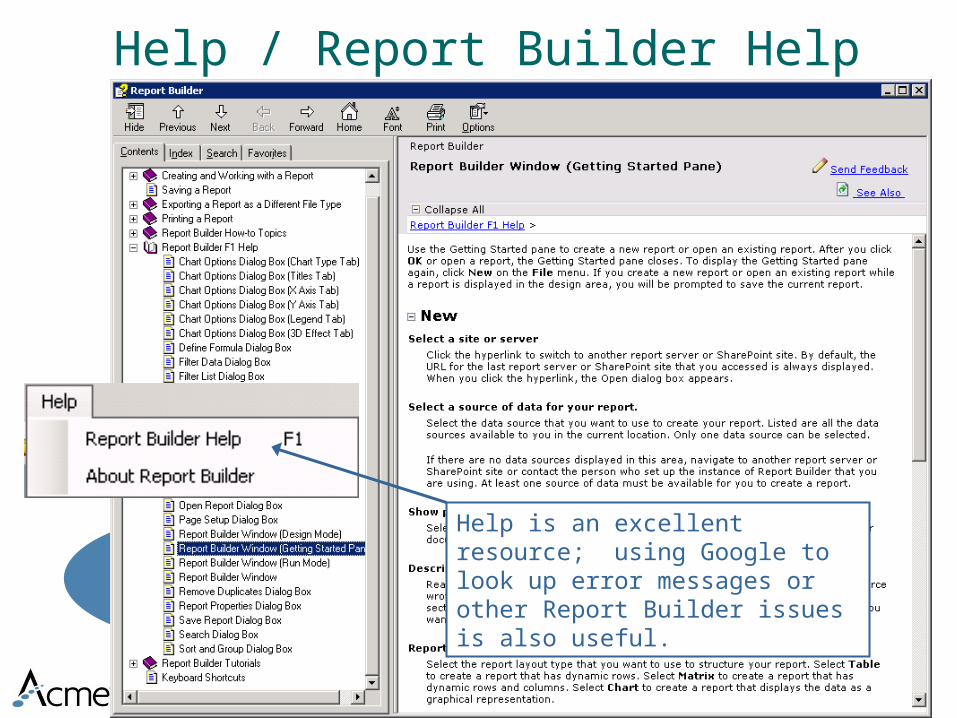
Help / Report Builder Help
Help is an excellent resource; using Google to look up error messages or other Report Builder issues is also useful.
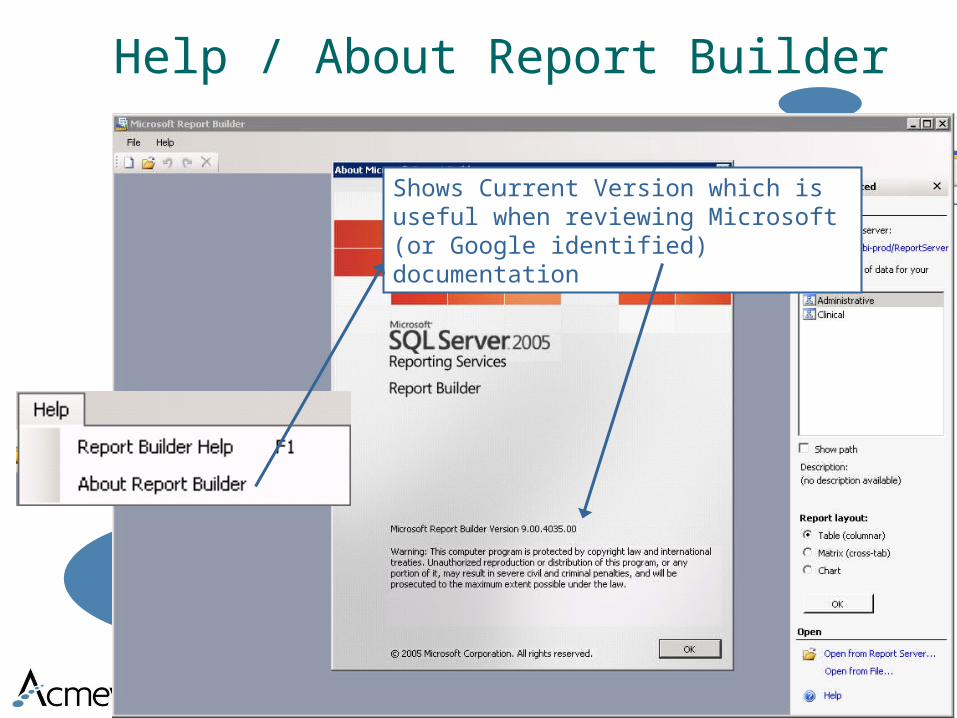
Help / About Report Builder
Shows Current Version which is useful when reviewing Microsoft (or Google identified) documentation
Matrix and Graph Reports
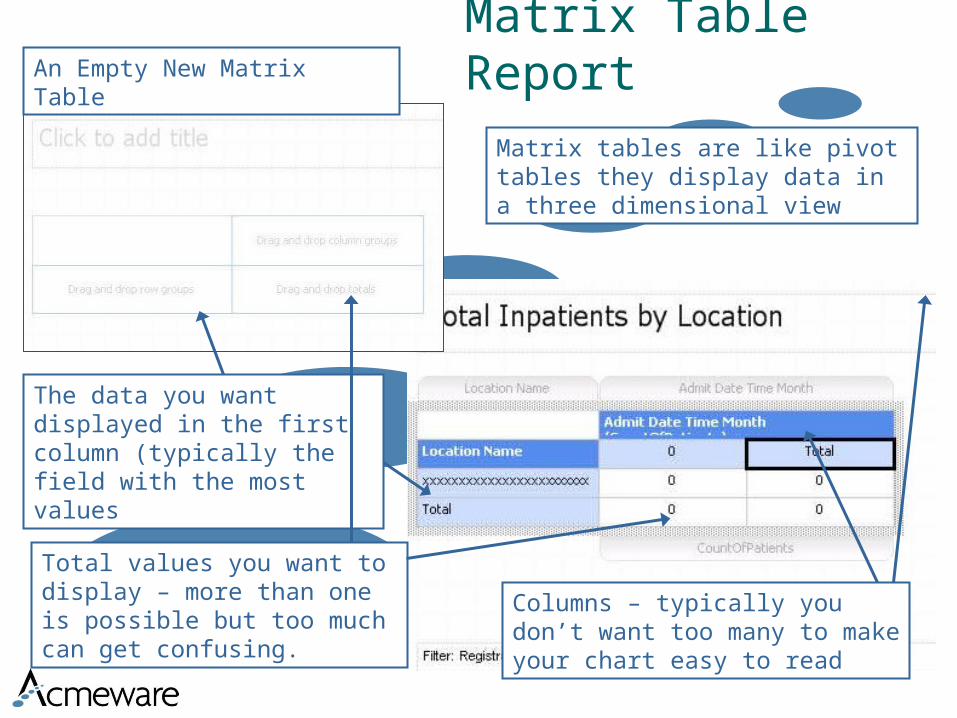
Matrix Table Report
Matrix tables are like pivot tables they display data in a three dimensional view
An Empty New Matrix Table
The data you want displayed in the first column (typically the field with the most values
Total values you want to display – more than one is possible but too much can get confusing.
Columns – typically you don’t want too many to make your chart easy to read

Matrix Report Results
Total Columns:1 = January 2 = February
Filtering and ordering of the Rows and Columns will make a big difference in the legibility of your report – it can easily get too big
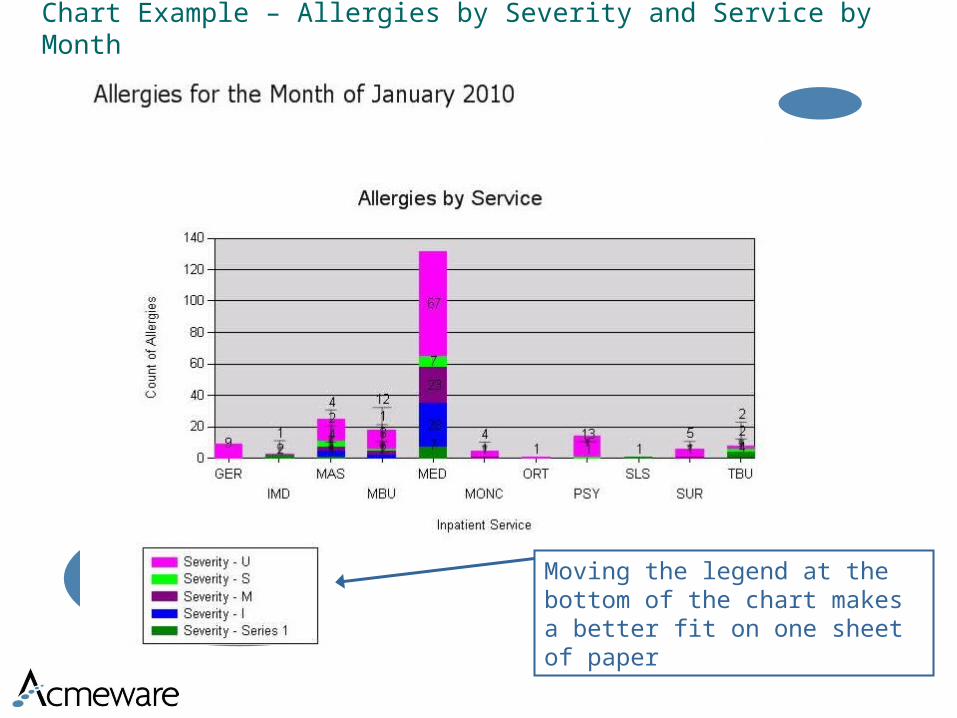
Chart Example – Allergies by Severity and Service by Month
Moving the legend at the bottom of the chart makes a better fit on one sheet of paper

Chart Example – Allergies by Severity and Service by Month
Drag over the three data fields you want to graph. Select chart type and define properties.
Count of Allergies by patient

Chart formatting options
You can select the Chart Type from the standard Microsoft chart formats.
Chart options give you control over many options for formatting

Discussion, Questions & Answers

Thank You!
Other Acmeware Sessions
805 DR Reporting Made Easy with SQL Server BI Tools – Tuesday 1:00pm (Jamie McDonald)
385 Digital Dashboards and Data Repository - Thursday 10:00am (Ian Proffer)
382 Report Development in a MEDITECH 6.0+ Environment – Thursday 1:30pm (Glen D’Abate)
384 Security Audits using DR and SQL Tools– Friday 9:30am (Jamie McDonald)
383 SQL Server Upgrade Issues and Version Questions for DR – Friday 3:30pm (Ian Proffer)