Embed Size (px)
Citation preview
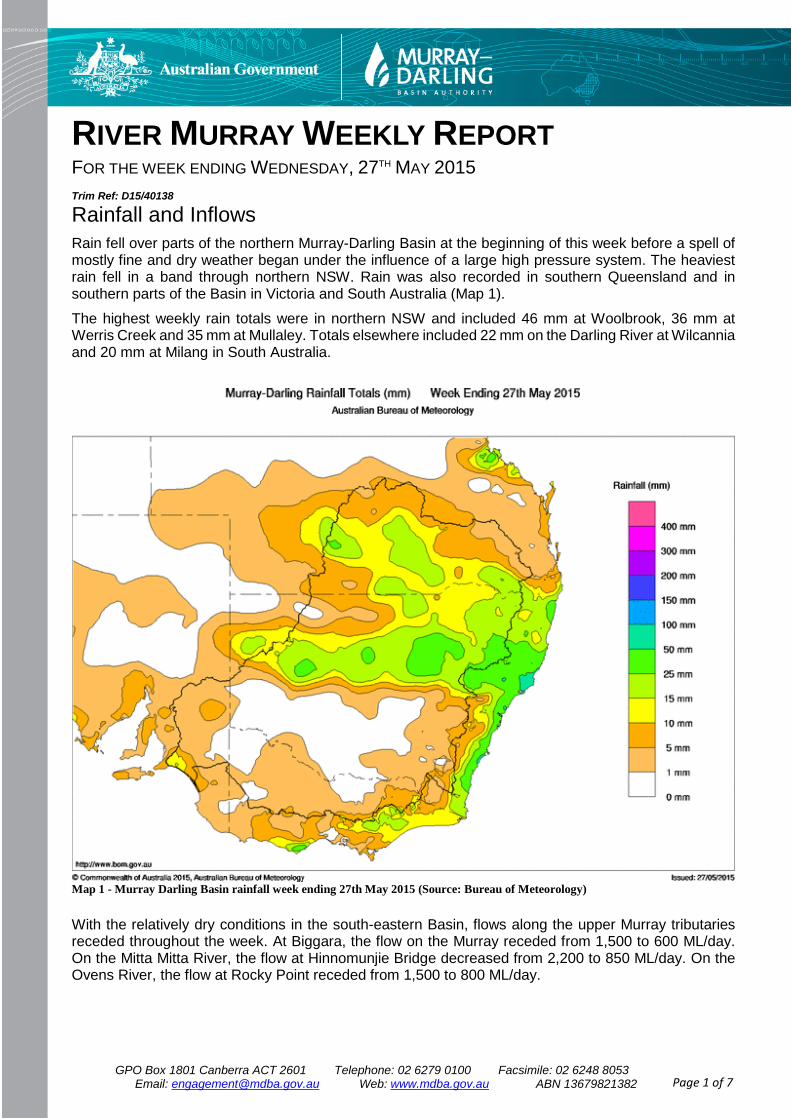
RIVER MURRAY WEEKLY REPORT FOR THE WEEK ENDING WEDNESDAY, 27TH MAY 2015 Trim Ref: D15/40138 Rainfall and Inflows Rain fell over parts of the northern Murray-Darling Basin at the beginning of this week before a spell of mostly fine and dry weather began under the influence of a large high pressure system. The heaviest rain fell in a band through northern NSW. Rain was also recorded in southern Queensland and in southern parts of the Basin in Victoria and South Australia (Map 1).
The highest weekly rain totals were in northern NSW and included 46 mm at Woolbrook, 36 mm at Werris Creek and 35 mm at Mullaley. Totals elsewhere included 22 mm on the Darling River at Wilcannia and 20 mm at Milang in South Australia.
Map 1 - Murray Darling Basin rainfall week ending 27th May 2015 (Source: Bureau of Meteorology)
With the relatively dry conditions in the south-eastern Basin, flows along the upper Murray tributaries receded throughout the week. At Biggara, the flow on the Murray receded from 1,500 to 600 ML/day. On the Mitta Mitta River, the flow at Hinnomunjie Bridge decreased from 2,200 to 850 ML/day. On the Ovens River, the flow at Rocky Point receded from 1,500 to 800 ML/day.
GPO Box 1801 Canberra ACT 2601 Telephone: 02 6279 0100 Facsimile: 02 6248 8053 Email: [email protected] Web: www.mdba.gov.au ABN 13679821382 Page 1 of 7
River Operations
MDBA storage has increased by 86 GL, with the active storage currently 3,728 GL or 44% capacity.
At Dartmouth Reservoir, the storage volume reduced by 13 GL to 2,888 GL (75% capacity). The flow at Colemans was decreased to 1,000 ML/day over the weekend but is now being increased and expected to reach 6,000 ML/day by 31 May. These releases are being undertaken as bulk transfers to Hume Reservoir in preparation for next season. See the attached flow advice for more details.
Hume Reservoir’s storage volume increased by 63 GL this week to 724 GL (24% capacity). The current release from Hume remains at the minimum of 600 ML/day.
At Yarrawonga Weir, the pool level continues to be reduced and is currently 122.32 m AHD, which is 2.38 m below the normal operating level. The pool level will continue to fall until a target of around 121.2 m AHD is reached in early June. The downstream release at Yarrawonga Weir has been decreased this week and is currently 7,300 ML/day. Further reductions will be made in the coming days.
On the Edward River System, inflows via the Edward River and Gulpa Creek offtakes were relatively high at the beginning of the week, but have now started to decrease. The current total inflow is about 1,900 ML/day and is expected to continue decreasing slowly during the coming week as releases upstream from Yarrawonga Weir recede further.
On the Goulburn River, the flow at McCoys Bridge has been steady at around 1,000 ML/day. This flow is expected to continue until mid-June, after which higher flows are possible. More information will be provided in future Weekly Reports.
At Torrumbarry Weir, the flow peaked on 26 May at 8,900 ML/day. Flows have now started to recede and will continue to fall away over the coming week. Downstream at Swan Hill, the flow has reached 8,700 ML/day and is close to a peak.
At Euston Weir, a pool level around 20 cm below FSL has been targeted over recent weeks. However, the pool is now being re-filled and is expected to have returned to the Full Supply Level (47.60 m AHD) in the coming days. The flow downstream of Euston has increased this week and is expected to exceed 10,000 ML/day in the next day or two before peaking in around a week’s time.
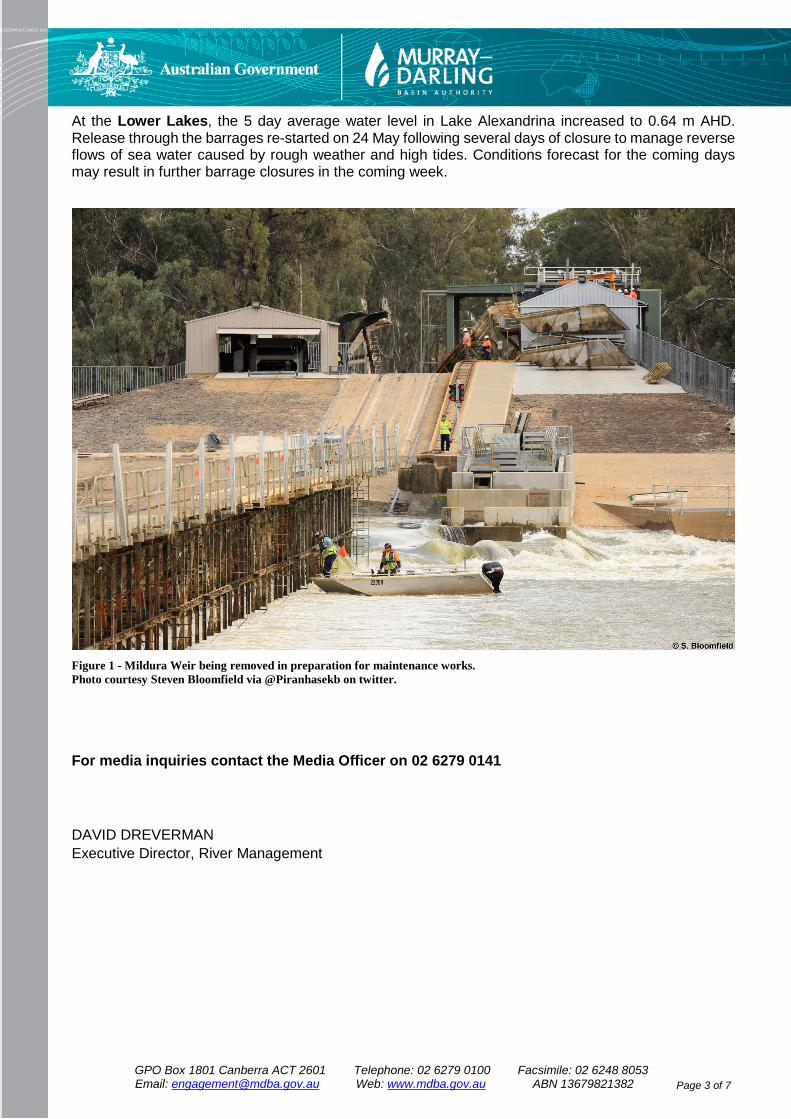
The drawdown of the weir pool at Mildura is continuing and the removal of the weir structure is now almost complete. The pool level is now more than 2 metres below FSL (Figure 1) and will continue decreasing to a level around 3.6 metres below FSL (depending on the river flow rate) in the coming days. The Mildura Weir works are planned to continue for up to 4 months, during which time Lock 11 will remain closed. More information is available from the Goulburn-Murray Water website. Flow rates downstream of Mildura Weir have varied between 9,000 and 12,500 ML/day over the last week in response to the drawdown, but will become more consistent once the structure is fully removed.
The volume stored in the Menindee Lakes increased by another 5 GL due to the continued arrival of a small pulse of inflows originating from upstream tributaries in early April. The Menindee Lakes currently store 72 GL (4% capacity) and there remains no release from Weir 32.
The flow at Wentworth increased to 12,500 ML/day this week and is expected to remain in excess of 10,000 ML/day into early June.
The storage in Lake Victoria increased by 31 GL to 310 GL (46% capacity). The storage level will exceed 350 GL (24.5 m AHD) in the coming days. The flow to South Australia averaged 3,900 ML/day during the last week and will remain close to this rate for the remainder of May. Slightly lower flow rates are expected for the beginning of June.
• Lake Mulwala level continues to fall • Mildura weir removed in preparation for maintenance works
GPO Box 1801 Canberra ACT 2601 Telephone: 02 6279 0100 Facsimile: 02 6248 8053 Email: [email protected] Web: www.mdba.gov.au ABN 13679821382 Page 2 of 7
At the Lower Lakes, the 5 day average water level in Lake Alexandrina increased to 0.64 m AHD. Release through the barrages re-started on 24 May following several days of closure to manage reverse flows of sea water caused by rough weather and high tides. Conditions forecast for the coming days may result in further barrage closures in the coming week.
Figure 1 - Mildura Weir being removed in preparation for maintenance works. Photo courtesy Steven Bloomfield via @Piranhasekb on twitter.
For media inquiries contact the Media Officer on 02 6279 0141 DAVID DREVERMAN Executive Director, River Management
GPO Box 1801 Canberra ACT 2601 Telephone: 02 6279 0100 Facsimile: 02 6248 8053 Email: [email protected] Web: www.mdba.gov.au ABN 13679821382 Page 3 of 7
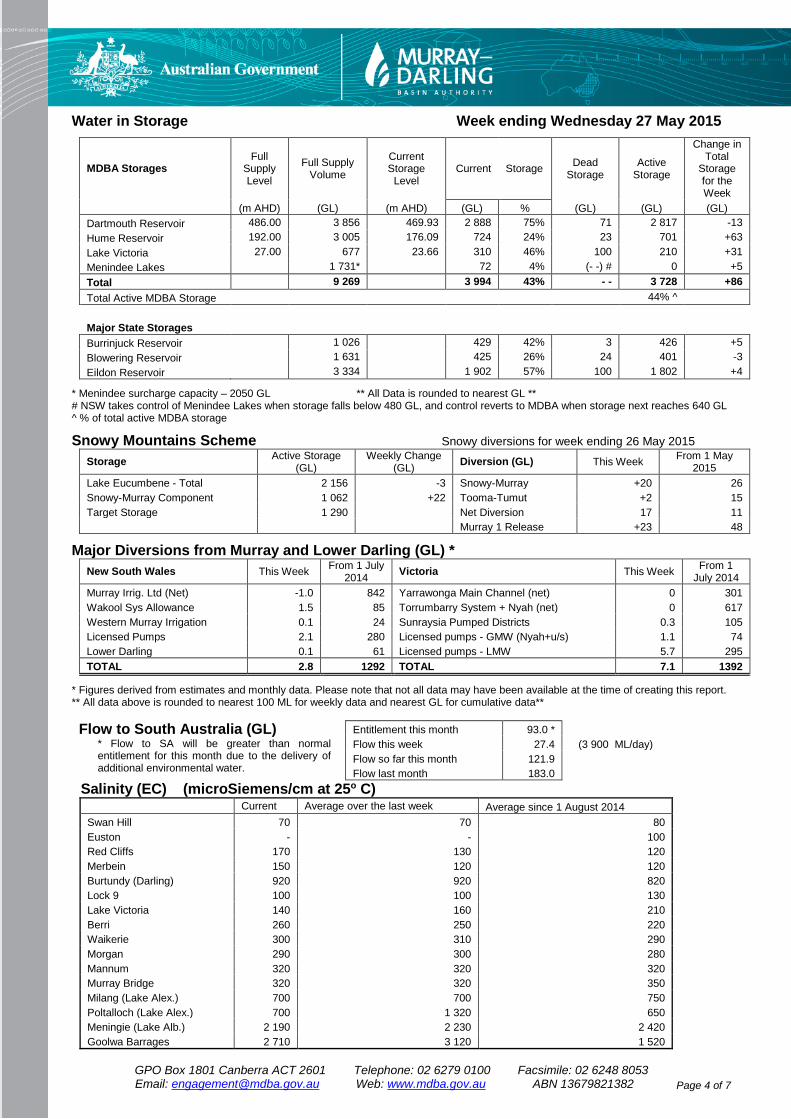
Water in Storage Week ending Wednesday 27 May 2015
MDBA Storages Full
Supply Level
Full Supply Volume
Current Storage
Level Current Storage Dead
Storage Active
Storage
Change in Total
Storage for the Week
(m AHD) (GL) (m AHD) (GL) % (GL) (GL) (GL) Dartmouth Reservoir 486.00 3 856 469.93 2 888 75% 71 2 817 -13 Hume Reservoir 192.00 3 005 176.09 724 24% 23 701 +63 Lake Victoria 27.00 677 23.66 310 46% 100 210 +31 Menindee Lakes 1 731* 72 4% (- -) # 0 +5 Total 9 269 3 994 43% - - 3 728 +86 Total Active MDBA Storage 44% ^ Major State Storages Burrinjuck Reservoir 1 026 429 42% 3 426 +5 Blowering Reservoir 1 631 425 26% 24 401 -3 Eildon Reservoir 3 334 1 902 57% 100 1 802 +4
* Menindee surcharge capacity – 2050 GL ** All Data is rounded to nearest GL ** # NSW takes control of Menindee Lakes when storage falls below 480 GL, and control reverts to MDBA when storage next reaches 640 GL ^ % of total active MDBA storage
Snowy Mountains Scheme Snowy diversions for week ending 26 May 2015 Storage Active Storage
(GL) Weekly Change
(GL) Diversion (GL) This Week From 1 May 2015
Lake Eucumbene - Total 2 156 -3 Snowy-Murray +20 26 Snowy-Murray Component 1 062 +22 Tooma-Tumut +2 15 Target Storage 1 290 Net Diversion 17 11 Murray 1 Release +23 48
Major Diversions from Murray and Lower Darling (GL) * New South Wales This Week From 1 July
2014 Victoria This Week From 1 July 2014
Murray Irrig. Ltd (Net) -1.0 842 Yarrawonga Main Channel (net) 0 301 Wakool Sys Allowance 1.5 85 Torrumbarry System + Nyah (net) 0 617 Western Murray Irrigation 0.1 24 Sunraysia Pumped Districts 0.3 105 Licensed Pumps 2.1 280 Licensed pumps - GMW (Nyah+u/s) 1.1 74 Lower Darling 0.1 61 Licensed pumps - LMW 5.7 295 TOTAL 2.8 1292 TOTAL 7.1 1392
* Figures derived from estimates and monthly data. Please note that not all data may have been available at the time of creating this report. ** All data above is rounded to nearest 100 ML for weekly data and nearest GL for cumulative data** Flow to South Australia (GL)
* Flow to SA will be greater than normal entitlement for this month due to the delivery of additional environmental water.
Entitlement this month 93.0 * Flow this week 27.4 (3 900 ML/day) Flow so far this month 121.9 Flow last month 183.0
Salinity (EC) (microSiemens/cm at 25o C) Current Average over the last week Average since 1 August 2014 Swan Hill 70 70 80 Euston - - 100 Red Cliffs 170 130 120 Merbein 150 120 120 Burtundy (Darling) 920 920 820 Lock 9 100 100 130 Lake Victoria 140 160 210 Berri 260 250 220 Waikerie 300 310 290 Morgan 290 300 280 Mannum 320 320 320 Murray Bridge 320 320 350 Milang (Lake Alex.) 700 700 750 Poltalloch (Lake Alex.) 700 1 320 650 Meningie (Lake Alb.) 2 190 2 230 2 420 Goolwa Barrages 2 710 3 120 1 520
GPO Box 1801 Canberra ACT 2601 Telephone: 02 6279 0100 Facsimile: 02 6248 8053 Email: [email protected] Web: www.mdba.gov.au ABN 13679821382 Page 4 of 7
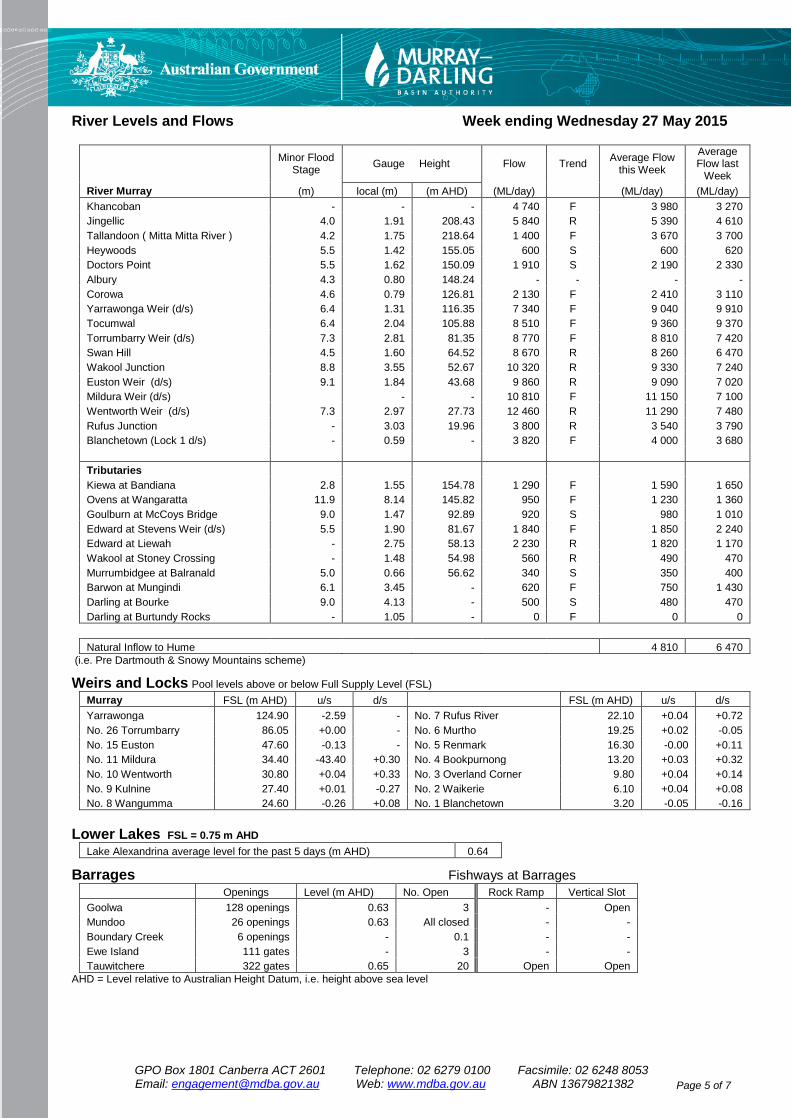
River Levels and Flows Week ending Wednesday 27 May 2015
Minor Flood Stage Gauge Height Flow Trend Average Flow
this Week
Average Flow last
Week River Murray (m) local (m) (m AHD) (ML/day) (ML/day) (ML/day) Khancoban - - - 4 740 F 3 980 3 270 Jingellic 4.0 1.91 208.43 5 840 R 5 390 4 610 Tallandoon ( Mitta Mitta River ) 4.2 1.75 218.64 1 400 F 3 670 3 700 Heywoods 5.5 1.42 155.05 600 S 600 620 Doctors Point 5.5 1.62 150.09 1 910 S 2 190 2 330 Albury 4.3 0.80 148.24 - - - - Corowa 4.6 0.79 126.81 2 130 F 2 410 3 110 Yarrawonga Weir (d/s) 6.4 1.31 116.35 7 340 F 9 040 9 910 Tocumwal 6.4 2.04 105.88 8 510 F 9 360 9 370 Torrumbarry Weir (d/s) 7.3 2.81 81.35 8 770 F 8 810 7 420 Swan Hill 4.5 1.60 64.52 8 670 R 8 260 6 470 Wakool Junction 8.8 3.55 52.67 10 320 R 9 330 7 240 Euston Weir (d/s) 9.1 1.84 43.68 9 860 R 9 090 7 020 Mildura Weir (d/s) - - 10 810 F 11 150 7 100 Wentworth Weir (d/s) 7.3 2.97 27.73 12 460 R 11 290 7 480 Rufus Junction - 3.03 19.96 3 800 R 3 540 3 790 Blanchetown (Lock 1 d/s) - 0.59 - 3 820 F 4 000 3 680 Tributaries Kiewa at Bandiana 2.8 1.55 154.78 1 290 F 1 590 1 650 Ovens at Wangaratta 11.9 8.14 145.82 950 F 1 230 1 360 Goulburn at McCoys Bridge 9.0 1.47 92.89 920 S 980 1 010 Edward at Stevens Weir (d/s) 5.5 1.90 81.67 1 840 F 1 850 2 240 Edward at Liewah - 2.75 58.13 2 230 R 1 820 1 170 Wakool at Stoney Crossing - 1.48 54.98 560 R 490 470 Murrumbidgee at Balranald 5.0 0.66 56.62 340 S 350 400 Barwon at Mungindi 6.1 3.45 - 620 F 750 1 430 Darling at Bourke 9.0 4.13 - 500 S 480 470 Darling at Burtundy Rocks - 1.05 - 0 F 0 0 Natural Inflow to Hume 4 810 6 470
(i.e. Pre Dartmouth & Snowy Mountains scheme)
Weirs and Locks Pool levels above or below Full Supply Level (FSL) Murray FSL (m AHD) u/s d/s FSL (m AHD) u/s d/s Yarrawonga 124.90 -2.59 - No. 7 Rufus River 22.10 +0.04 +0.72 No. 26 Torrumbarry 86.05 +0.00 - No. 6 Murtho 19.25 +0.02 -0.05 No. 15 Euston 47.60 -0.13 - No. 5 Renmark 16.30 -0.00 +0.11 No. 11 Mildura 34.40 -43.40 +0.30 No. 4 Bookpurnong 13.20 +0.03 +0.32 No. 10 Wentworth 30.80 +0.04 +0.33 No. 3 Overland Corner 9.80 +0.04 +0.14 No. 9 Kulnine 27.40 +0.01 -0.27 No. 2 Waikerie 6.10 +0.04 +0.08 No. 8 Wangumma 24.60 -0.26 +0.08 No. 1 Blanchetown 3.20 -0.05 -0.16
Lower Lakes FSL = 0.75 m AHD
Lake Alexandrina average level for the past 5 days (m AHD) 0.64
Barrages Fishways at Barrages Openings Level (m AHD) No. Open Rock Ramp Vertical Slot Goolwa 128 openings 0.63 3 - Open Mundoo 26 openings 0.63 All closed - - Boundary Creek 6 openings - 0.1 - - Ewe Island 111 gates - 3 - - Tauwitchere 322 gates 0.65 20 Open Open
AHD = Level relative to Australian Height Datum, i.e. height above sea level
GPO Box 1801 Canberra ACT 2601 Telephone: 02 6279 0100 Facsimile: 02 6248 8053 Email: [email protected] Web: www.mdba.gov.au ABN 13679821382 Page 5 of 7
Week ending Wednesday 27 May 2015
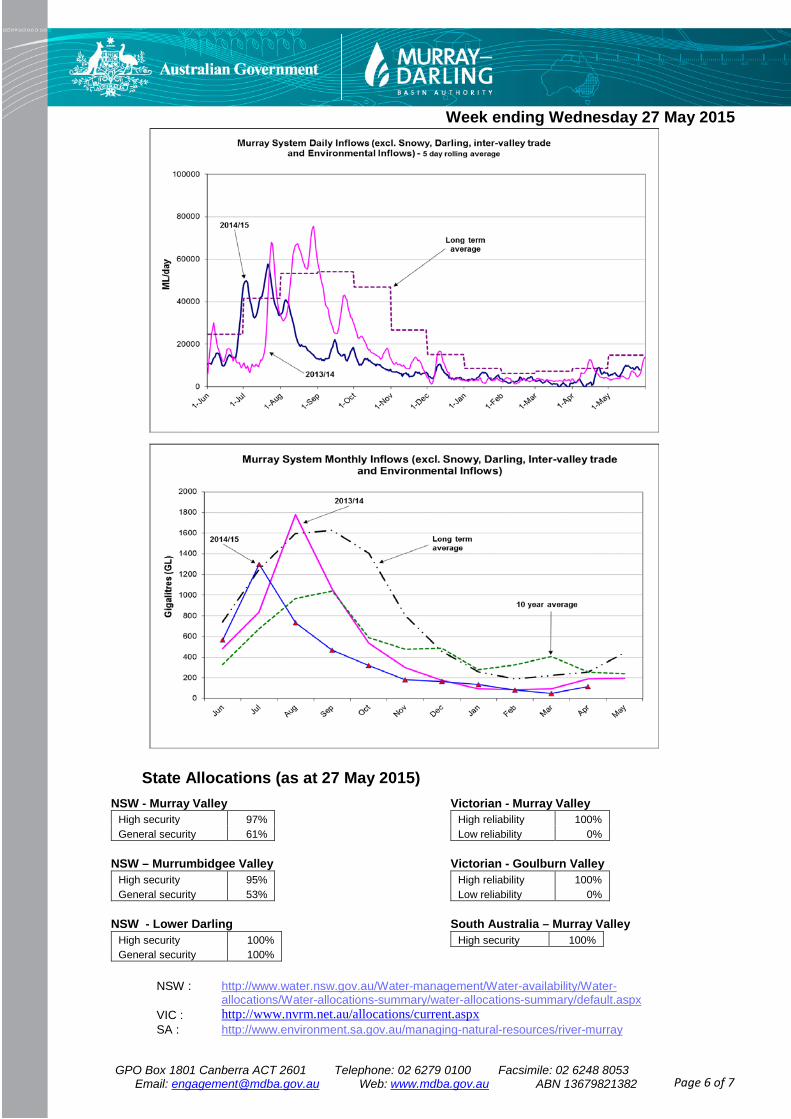
State Allocations (as at 27 May 2015)
NSW - Murray Valley Victorian - Murray Valley High security 97% General security 61%
High reliability 100% Low reliability 0%
NSW – Murrumbidgee Valley
Victorian - Goulburn Valley High security 95% General security 53%
High reliability 100% Low reliability 0%
NSW - Lower Darling
South Australia – Murray Valley High security 100% General security 100%
High security 100%
NSW :
http://www.water.nsw.gov.au/Water-management/Water-availability/Water-allocations/Water-allocations-summary/water-allocations-summary/default.aspx
VIC : http://www.nvrm.net.au/allocations/current.aspx
SA : http://www.environment.sa.gov.au/managing-natural-resources/river-murray
GPO Box 1801 Canberra ACT 2601 Telephone: 02 6279 0100 Facsimile: 02 6248 8053 Email: [email protected] Web: www.mdba.gov.au ABN 13679821382 Page 6 of 7
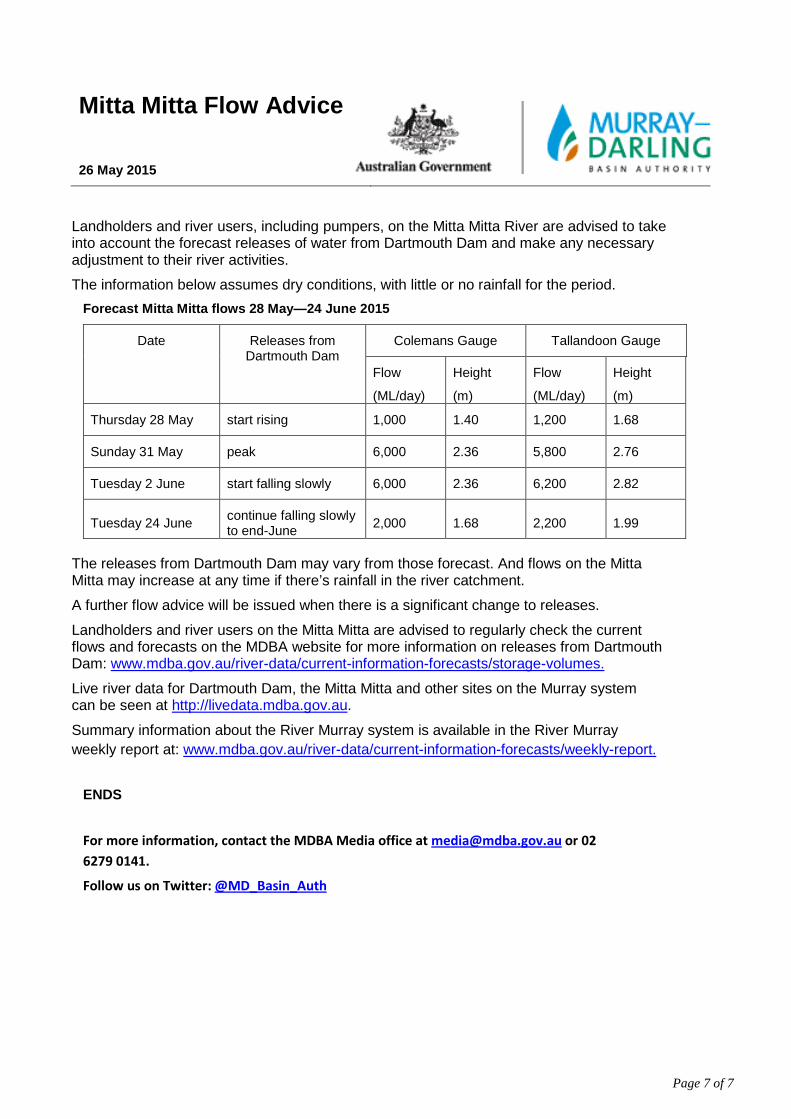
Landholders and river users, including pumpers, on the Mitta Mitta River are advised to take into account the forecast releases of water from Dartmouth Dam and make any necessary adjustment to their river activities.
The information below assumes dry conditions, with little or no rainfall for the period. Forecast Mitta Mitta flows 28 May—24 June 2015
Date Releases from Dartmouth Dam
Colemans Gauge Tallandoon Gauge
Flow
(ML/day)
Height
(m)
Flow
(ML/day)
Height
(m)
Thursday 28 May start rising 1,000 1.40 1,200 1.68
Sunday 31 May peak 6,000 2.36 5,800 2.76
Tuesday 2 June start falling slowly 6,000 2.36 6,200 2.82
Tuesday 24 June continue falling slowly to end-June 2,000 1.68 2,200 1.99
The releases from Dartmouth Dam may vary from those forecast. And flows on the Mitta Mitta may increase at any time if there’s rainfall in the river catchment.
A further flow advice will be issued when there is a significant change to releases.
Landholders and river users on the Mitta Mitta are advised to regularly check the current flows and forecasts on the MDBA website for more information on releases from Dartmouth Dam: www.mdba.gov.au/river-data/current-information-forecasts/storage-volumes.
Live river data for Dartmouth Dam, the Mitta Mitta and other sites on the Murray system can be seen at http://livedata.mdba.gov.au.
Summary information about the River Murray system is available in the River Murray weekly report at: www.mdba.gov.au/river-data/current-information-forecasts/weekly-report.
ENDS For more information, contact the MDBA Media office at [email protected] or 02 6279 0141.
Follow us on Twitter: @MD_Basin_Auth
Mitta Mitta Flow Advice 26 May 2015
Page 7 of 7