Embed Size (px)
Citation preview
Subscribe to the River Murray Weekly Report River Data website Water in Storages
River Murray Weekly Report For the week ending Wednesday, 23 January 2019
Trim Ref: D19/3383
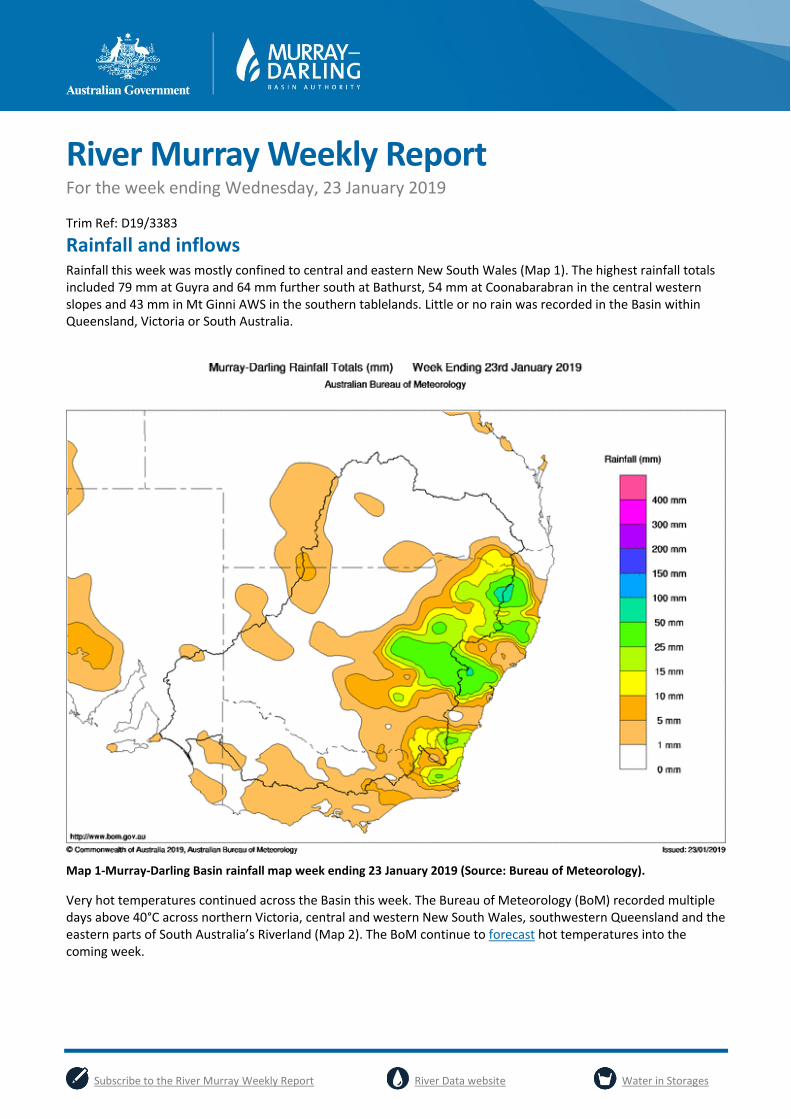
Rainfall and inflows Rainfall this week was mostly confined to central and eastern New South Wales (Map 1). The highest rainfall totals included 79 mm at Guyra and 64 mm further south at Bathurst, 54 mm at Coonabarabran in the central western slopes and 43 mm in Mt Ginni AWS in the southern tablelands. Little or no rain was recorded in the Basin within Queensland, Victoria or South Australia.
Map 1-Murray-Darling Basin rainfall map week ending 23 January 2019 (Source: Bureau of Meteorology).
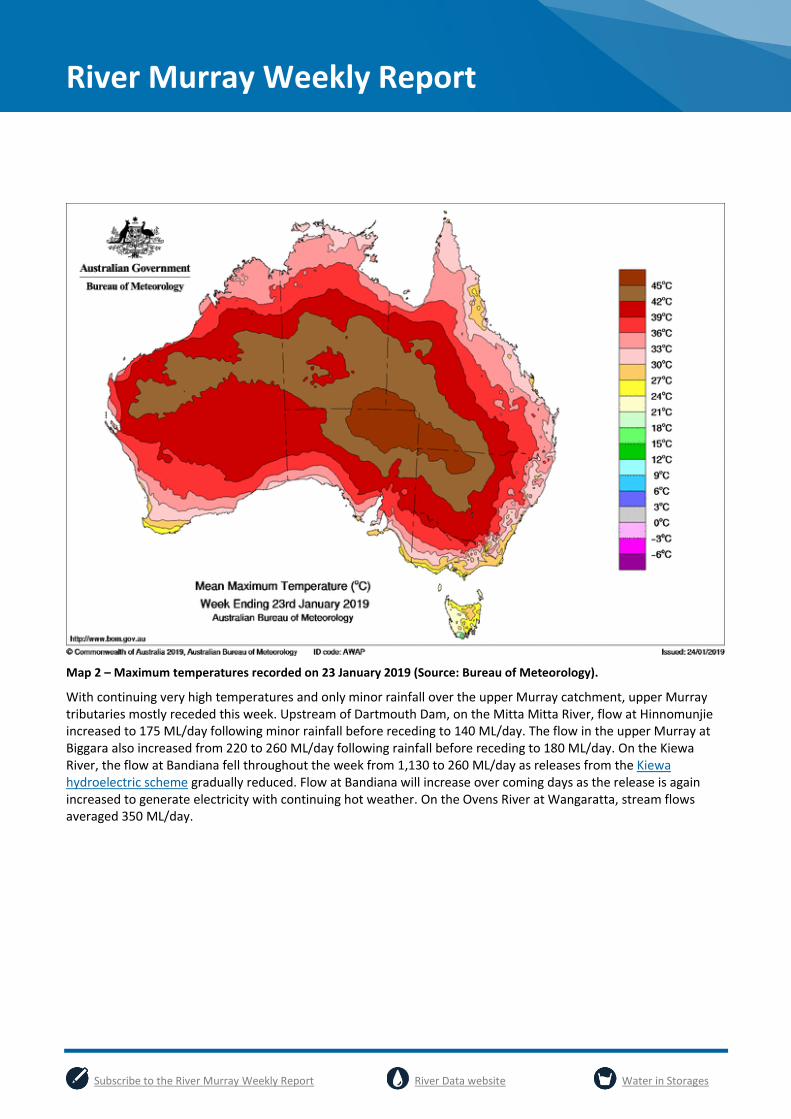
Very hot temperatures continued across the Basin this week. The Bureau of Meteorology (BoM) recorded multiple days above 40°C across northern Victoria, central and western New South Wales, southwestern Queensland and the eastern parts of South Australia’s Riverland (Map 2). The BoM continue to forecast hot temperatures into the coming week.
River Murray Weekly Report
Subscribe to the River Murray Weekly Report River Data website Water in Storages
Map 2 – Maximum temperatures recorded on 23 January 2019 (Source: Bureau of Meteorology).
With continuing very high temperatures and only minor rainfall over the upper Murray catchment, upper Murray tributaries mostly receded this week. Upstream of Dartmouth Dam, on the Mitta Mitta River, flow at Hinnomunjie increased to 175 ML/day following minor rainfall before receding to 140 ML/day. The flow in the upper Murray at Biggara also increased from 220 to 260 ML/day following rainfall before receding to 180 ML/day. On the Kiewa River, the flow at Bandiana fell throughout the week from 1,130 to 260 ML/day as releases from the Kiewa hydroelectric scheme gradually reduced. Flow at Bandiana will increase over coming days as the release is again increased to generate electricity with continuing hot weather. On the Ovens River at Wangaratta, stream flows averaged 350 ML/day.
River Murray Weekly Report
Subscribe to the River Murray Weekly Report River Data website Water in Storages
River operations
River operations The MDBA active storage volume decreased by 103 GL this week to 3,886 GL (46% capacity).
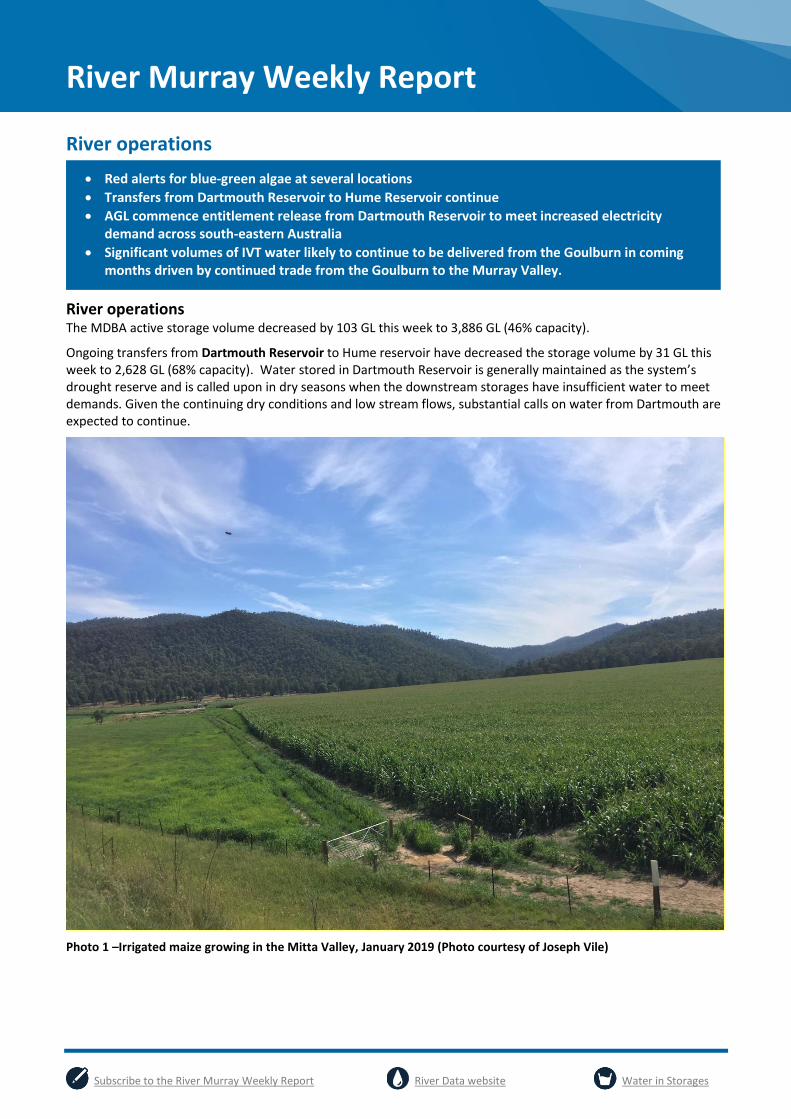
Ongoing transfers from Dartmouth Reservoir to Hume reservoir have decreased the storage volume by 31 GL this week to 2,628 GL (68% capacity). Water stored in Dartmouth Reservoir is generally maintained as the system’s drought reserve and is called upon in dry seasons when the downstream storages have insufficient water to meet demands. Given the continuing dry conditions and low stream flows, substantial calls on water from Dartmouth are expected to continue.
Photo 1 –Irrigated maize growing in the Mitta Valley, January 2019 (Photo courtesy of Joseph Vile)
Red alerts for blue-green algae at several locations
Transfers from Dartmouth Reservoir to Hume Reservoir continue
AGL commence entitlement release from Dartmouth Reservoir to meet increased electricity demand across south-eastern Australia
Significant volumes of IVT water likely to continue to be delivered from the Goulburn in coming months driven by continued trade from the Goulburn to the Murray Valley.
River Murray Weekly Report
Subscribe to the River Murray Weekly Report River Data website Water in Storages
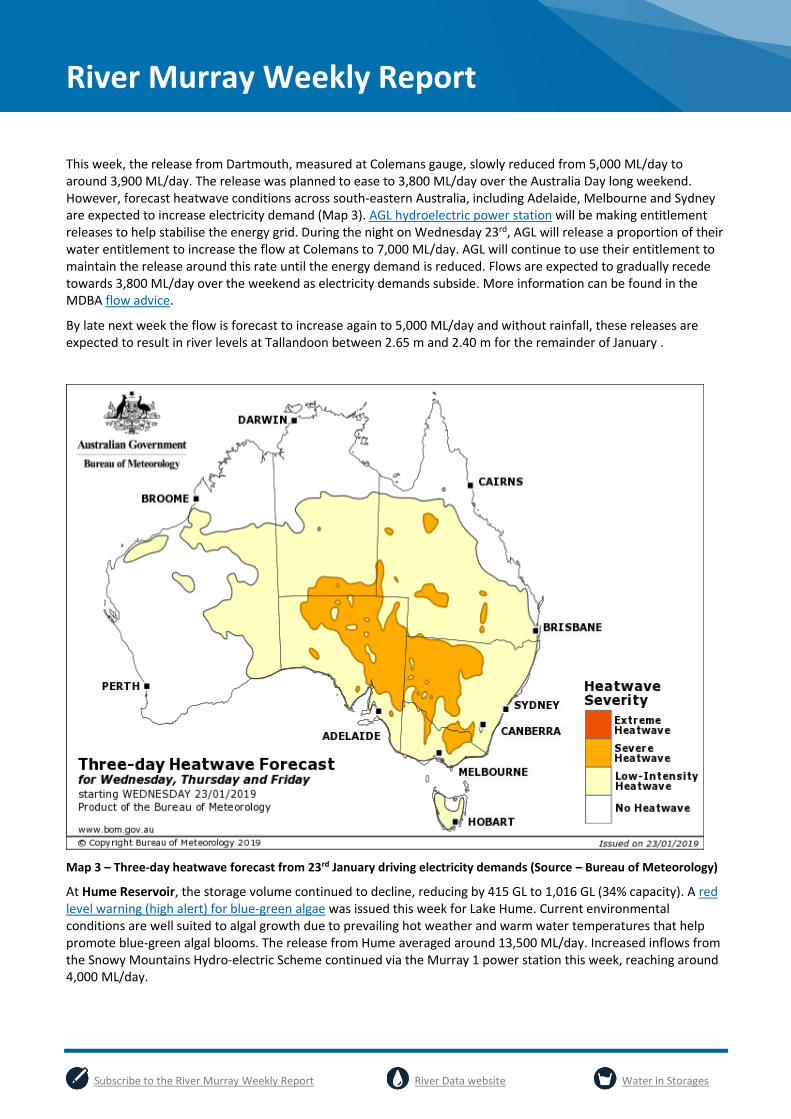
This week, the release from Dartmouth, measured at Colemans gauge, slowly reduced from 5,000 ML/day to around 3,900 ML/day. The release was planned to ease to 3,800 ML/day over the Australia Day long weekend. However, forecast heatwave conditions across south-eastern Australia, including Adelaide, Melbourne and Sydney are expected to increase electricity demand (Map 3). AGL hydroelectric power station will be making entitlement releases to help stabilise the energy grid. During the night on Wednesday 23rd, AGL will release a proportion of their water entitlement to increase the flow at Colemans to 7,000 ML/day. AGL will continue to use their entitlement to maintain the release around this rate until the energy demand is reduced. Flows are expected to gradually recede towards 3,800 ML/day over the weekend as electricity demands subside. More information can be found in the MDBA flow advice.
By late next week the flow is forecast to increase again to 5,000 ML/day and without rainfall, these releases are expected to result in river levels at Tallandoon between 2.65 m and 2.40 m for the remainder of January .
Map 3 – Three-day heatwave forecast from 23rd January driving electricity demands (Source – Bureau of Meteorology)
At Hume Reservoir, the storage volume continued to decline, reducing by 415 GL to 1,016 GL (34% capacity). A red level warning (high alert) for blue-green algae was issued this week for Lake Hume. Current environmental conditions are well suited to algal growth due to prevailing hot weather and warm water temperatures that help promote blue-green algal blooms. The release from Hume averaged around 13,500 ML/day. Increased inflows from the Snowy Mountains Hydro-electric Scheme continued via the Murray 1 power station this week, reaching around 4,000 ML/day.
River Murray Weekly Report
Subscribe to the River Murray Weekly Report River Data website Water in Storages
Downstream at Lake Mulwala the level is currently 124.87 m AHD, which is within the normal operating range (124.6 to 124.9 m AHD). Diversions to Yarrawonga Main Channel averaged near 900 ML/day. On the New South Wales side, Mulwala Canal diversions averaged around 3,800 ML/day. Of the diversion to Mulwala Canal, approximately 2,300 ML/day is water being diverted around the Barmah Choke through Murray Irrigation Limited (MIL) infrastructure and released into the River Murray (Perricoota escape), Wakool River (Wakool escape), Edward River (Edward escape) and Billabong Creek (Finley escape). Similarly, on the Victorian side around 120 ML/day continues to travel through Yarrawonga Main Channel and into the Broken Creek, again to meet demands downstream of the Barmah Choke.
The release from Yarrawonga Weir is currently targeting 9,000 ML/day which equates to a flow just below channel capacity of the Barmah Choke. Over the next few weeks the release is likely to remain around this flow rate.
Flows at the Edward River and Gulpa Creek offtakes are currently around their normal summer regulated flow rates of 1,600 ML/day and 350 ML/day. Downstream on the Edward River the flow at Toonalook averaged around 1,800 ML/day and return flows from the Millewa Forest have now ceased. Flow in the Edward River continues to be supplemented by releases from the Edward Escape of up to 2,200 ML/day this week, to boost deliveries downstream of the Barmah Choke.
Diversion into Wakool Main Canal averaged 110 ML/day, and Wakool, Yallakool and Colligen offtakes are passing around 60, 440 and 420 ML/day respectively. The flow in the Edward River downstream of Stevens Weir continues to target channel capacity of around 2,700 ML/day.
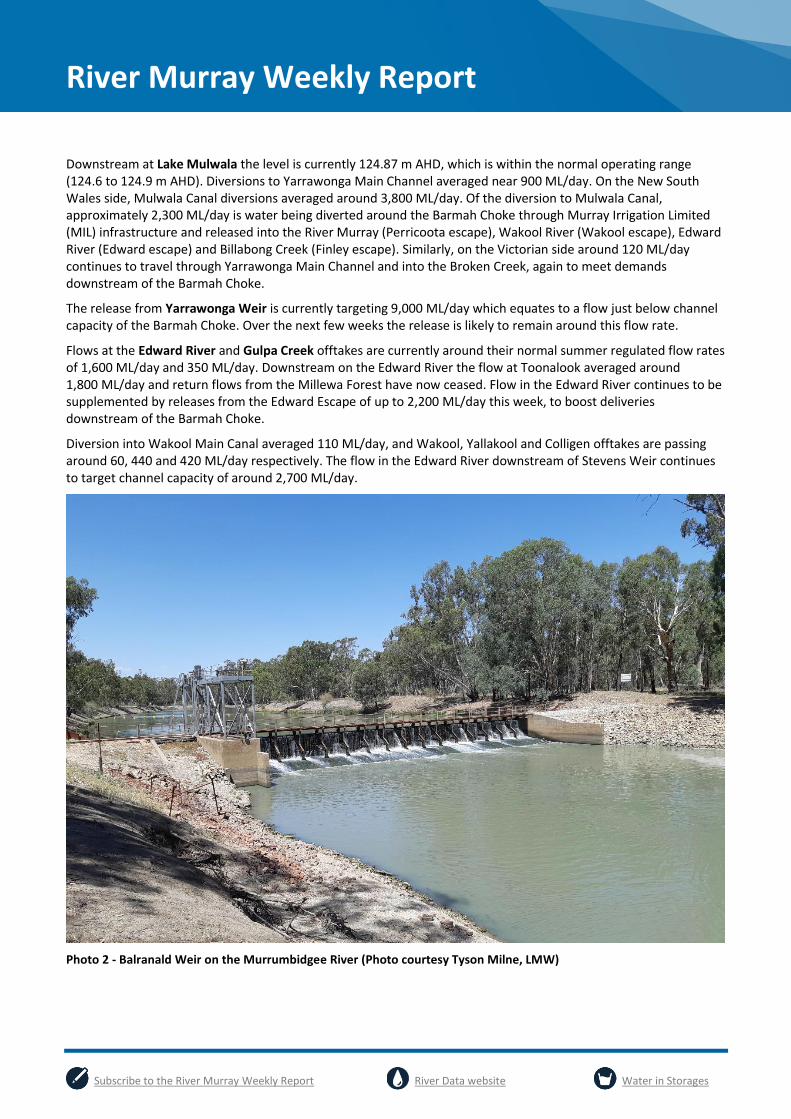
Photo 2 - Balranald Weir on the Murrumbidgee River (Photo courtesy Tyson Milne, LMW)
River Murray Weekly Report
Subscribe to the River Murray Weekly Report River Data website Water in Storages
Inflow to the Murray from the Goulburn River, measured at McCoys Bridge, averaged around 2,900 ML/day. The majority of this flow is Goulburn Valley Inter Valley Trade (IVT) water that is being delivered to help meet demands on the River Murray as a result of the trades from the Goulburn to the Murray valley. The flow at McCoys is expected to fluctuate between 2,600 ML/day and 3,000 ML/day during the remainder of January while temperatures are hot and River Murray demands remain high. Over coming months, significant volumes of IVT water are likely to continue to be delivered. Information regarding current opportunities for allocation trade between the Goulburn and Murray valleys is available at the Victorian water register website.
National Channel diversions remained around 2,000 ML/day during the past week and are likely to continue around this rate. The release from Torrumbarry Weir averaged around 7,500 ML/day and is expected to remain close to this rate for the remainder of January.
Inflow from the Murrumbidgee River, measured at Balranald, is currently 220 ML/day and receding from a small pulse that reached 470 ML/day earlier in the week (Photo 2). The Murrumbidgee IVT balance is currently below 0 GL, restricting the MDBA from calling water from this valley to help meet Murray system demands.
At Euston, the weir pool is targeting 20cm above the full supply level (FSL). If required, the additional volume stored in the Euston weir pool will be used to boost downstream flows during hot and dry periods when irrigation demands are high. The downstream release eased to around 7,640 ML/day and is expected to remain around this rate or higher for the remainder of January.
Further downstream, temperatures around Mildura remained very high this week with multiple days above 40°C. The downstream flow averaged 6,540 ML/day. A red level warning (high alert) for blue-green algae remains current for the Mildura Weir Pool from Lock 11 to Karadoc and for the Wentworth Weir pool from Wentworth to Lock 11.
The Menindee Lakes storage volume decreased by 7 GL to 45 GL (3% capacity). WaterNSW continues to manage the Menindee Lakes in accordance with the Lower Darling Annual Operations Plan. As part of drought contingency measures within this plan, WaterNSW has installed four temporary block banks across the lower Darling below Pooncarie near Jamesville, below Burtundy near Ashvale, and upstream of Pooncarie at Court Nareen and Karoola. Water held in these pools will assist in maintaining supply to domestic, stock and permanent plantings along the lower Darling.
The release from Weir 32 reduced to around 65 ML/day this week. WaterNSW estimates a minimum delivery of 50 ML/day to properties between Weir 32 and the first block bank at Karoola in the upper stretch of the Lower Darling until the end of January will be possible. Water restrictions remain in place across much of New South Wales as a result of the extensive and on-going drought conditions.
A red level warning (high alert) for blue-green algae is current for Lake Wetherell, Lake Pamamaroo, Copi Hollow, Lake Cawndilla and the Darling River at Menindee and Tolarno. The poor water quality conditions in the river has led to large scale fish deaths in the lower Darling River with native fish including Golden Perch, Murray Cod and Bony herring affected. This event is being managed by NSW. More information regarding the water quality conditions of the lakes and the lower Darling is available at the WaterNSW website. Information on factors that affect fish is available from NSW Department of Primary Industries website. Information on drought impacts across the Murray-Darling Basin including on fish and operations is available on the MDBA website.
At Wentworth Weir, operations continue to target a pool level of around 10 cm above the Full Supply Level (FSL) to assist pumpers in the upper reaches of the Darling River arm of the weir pool. A red level warning (high alert) for blue-green algae is current for the Wentworth Weir pool. The downstream release is currently near 4,800 ML/day and is expected to reduce toward 4,500 ML/day in the coming week.
The Lock 9 weir pool is currently targeting around 10 cm below FSL and at Lock 8, the weir pool is targeting 50 cm below FSL. The Lock 7 weir pool is targeting 10 cm below FSL and will vary between FSL and 20 cm below FSL during January. During February, the weir pool levels at Lock 8 and Lock 7 will be further lowered to around 60 cm and 50 cm (respectively) below FSL.
At Lake Victoria the storage reduced by 31 GL to 436 GL (64% capacity). The flow to South Australia is currently targeting around 7,500 ML/day which will continue over the coming week. The flow to South Australia this week consists of entitlement flow, traded water and environmental water. Deliveries of environmental water are expected to continue through summer.
River Murray Weekly Report
Subscribe to the River Murray Weekly Report River Data website Water in Storages
The 5-day average water level in the Lower Lakes decreased by 3 cm this week to 0.66 m AHD. Environmental water delivered to South Australia is helping to slow the rate of fall at the Lower Lakes and prolong small barrage releases to maintain connectivity between Lake Alexandrina and the Coorong estuary. These barrage releases may also provide suitable salinity gradient for Black Bream spawning. Barrage releases have been prioritised for Tauwitchere and Goolwa and all fishways remain open. For more information see the South Australian Department for Environment and Water’s latest River Murray flow report.
For media inquiries contact the Media Officer on 02 6279 0141
ANDREW REYNOLDS Executive Director, River Management
River Murray Weekly Report
Subscribe to the River Murray Weekly Report River Data website Water in Storages
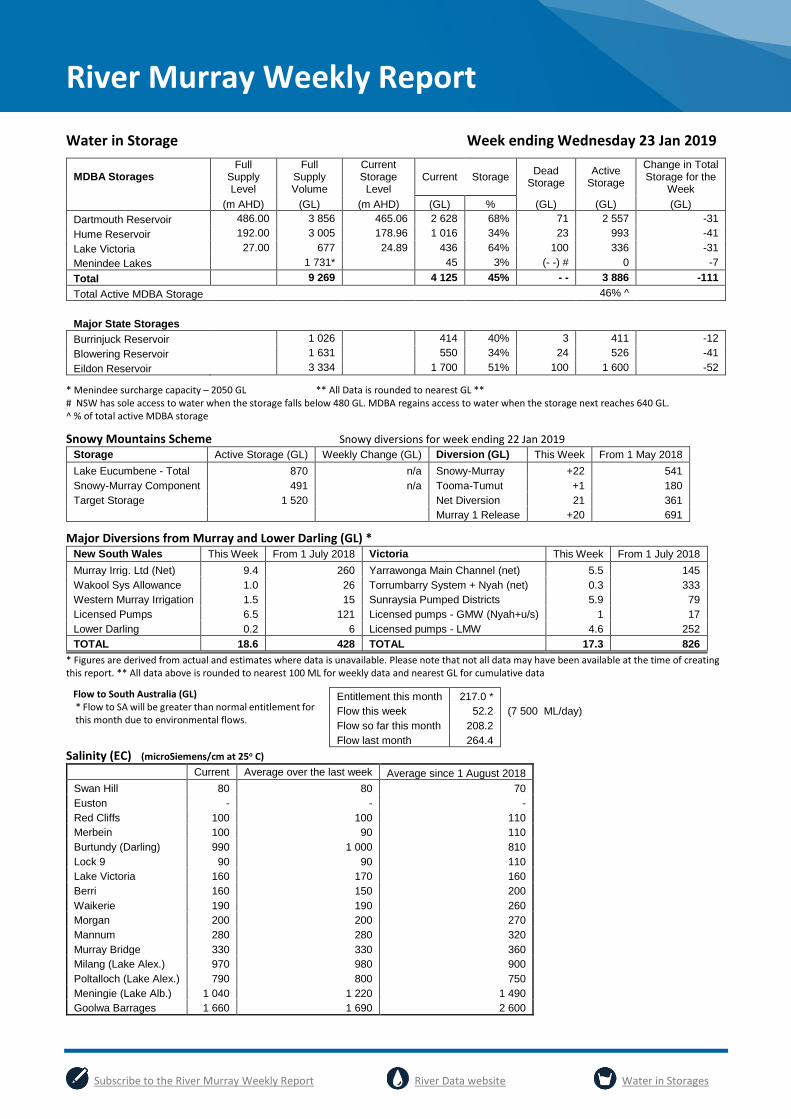
Water in Storage Week ending Wednesday 23 Jan 2019
MDBA Storages Full
Supply Level
Full Supply Volume
Current Storage
Level Current Storage
Dead Storage
Active Storage
Change in Total Storage for the
Week
(m AHD) (GL) (m AHD) (GL) % (GL) (GL) (GL)
Dartmouth Reservoir 486.00 3 856 465.06 2 628 68% 71 2 557 -31
Hume Reservoir 192.00 3 005 178.96 1 016 34% 23 993 -41
Lake Victoria 27.00 677 24.89 436 64% 100 336 -31
Menindee Lakes 1 731* 45 3% (- -) # 0 -7
Total 9 269 4 125 45% - - 3 886 -111
Total Active MDBA Storage 46% ^
Major State Storages
Burrinjuck Reservoir 1 026 414 40% 3 411 -12
Blowering Reservoir 1 631 550 34% 24 526 -41
Eildon Reservoir 3 334 1 700 51% 100 1 600 -52
* Menindee surcharge capacity – 2050 GL ** All Data is rounded to nearest GL ** # NSW has sole access to water when the storage falls below 480 GL. MDBA regains access to water when the storage next reaches 640 GL. ^ % of total active MDBA storage
Snowy Mountains Scheme Snowy diversions for week ending 22 Jan 2019
Storage Active Storage (GL) Weekly Change (GL) Diversion (GL) This Week From 1 May 2018
Lake Eucumbene - Total 870 n/a Snowy-Murray +22 541
Snowy-Murray Component 491 n/a Tooma-Tumut +1 180
Target Storage 1 520 Net Diversion 21 361
Murray 1 Release +20 691
Major Diversions from Murray and Lower Darling (GL) * New South Wales This Week From 1 July 2018 Victoria This Week From 1 July 2018
Murray Irrig. Ltd (Net) 9.4 260 Yarrawonga Main Channel (net) 5.5 145
Wakool Sys Allowance 1.0 26 Torrumbarry System + Nyah (net) 0.3 333
Western Murray Irrigation 1.5 15 Sunraysia Pumped Districts 5.9 79
Licensed Pumps 6.5 121 Licensed pumps - GMW (Nyah+u/s) 1 17
Lower Darling 0.2 6 Licensed pumps - LMW 4.6 252
TOTAL 18.6 428 TOTAL 17.3 826
* Figures are derived from actual and estimates where data is unavailable. Please note that not all data may have been available at the time of creating this report. ** All data above is rounded to nearest 100 ML for weekly data and nearest GL for cumulative data
Flow to South Australia (GL) * Flow to SA will be greater than normal entitlement for this month due to environmental flows.
Entitlement this month 217.0 *
Flow this week 52.2 (7 500 ML/day)
Flow so far this month 208.2 Flow last month 264.4
Salinity (EC) (microSiemens/cm at 25o C)
Current Average over the last week Average since 1 August 2018
Swan Hill 80 80 70
Euston - - -
Red Cliffs 100 100 110
Merbein 100 90 110
Burtundy (Darling) 990 1 000 810
Lock 9 90 90 110
Lake Victoria 160 170 160
Berri 160 150 200
Waikerie 190 190 260
Morgan 200 200 270
Mannum 280 280 320
Murray Bridge 330 330 360
Milang (Lake Alex.) 970 980 900
Poltalloch (Lake Alex.) 790 800 750
Meningie (Lake Alb.) 1 040 1 220 1 490
Goolwa Barrages 1 660 1 690 2 600
Subscribe to the River Murray Weekly Report River Data website Water in Storages
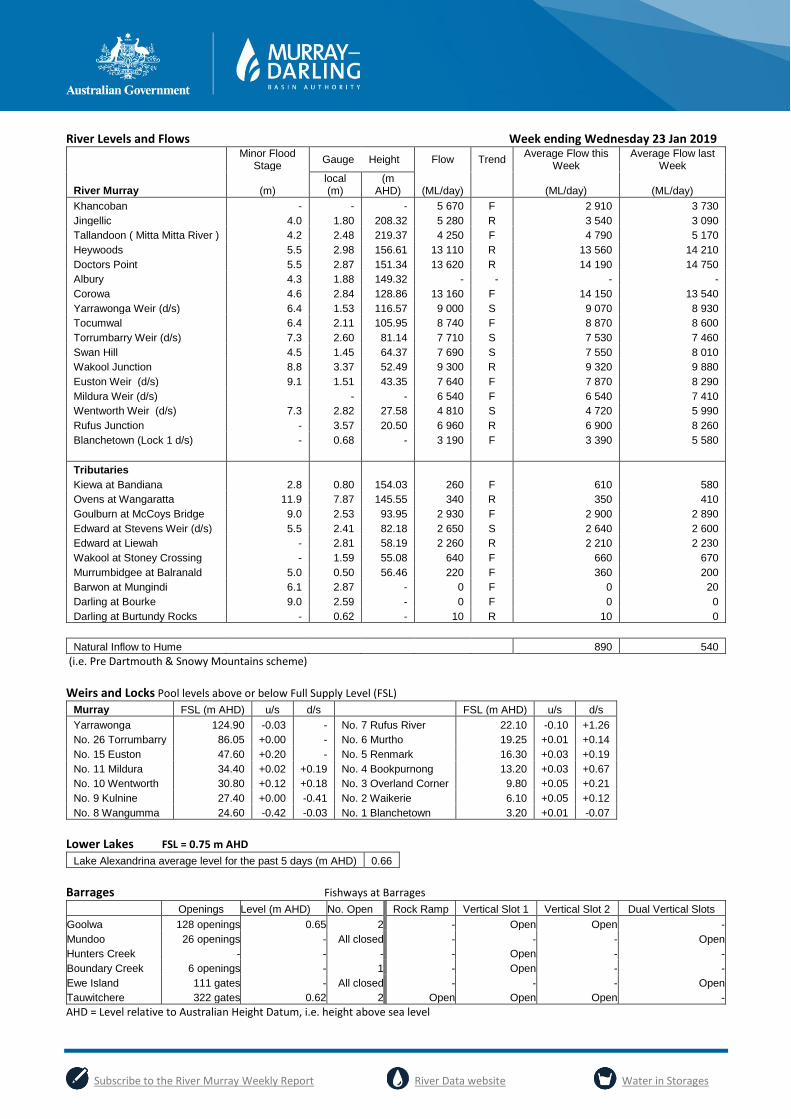
River Levels and Flows Week ending Wednesday 23 Jan 2019
Minor Flood
Stage Gauge Height Flow Trend
Average Flow this Week
Average Flow last Week
River Murray (m) local (m)
(m AHD) (ML/day) (ML/day) (ML/day)
Khancoban - - - 5 670 F 2 910 3 730
Jingellic 4.0 1.80 208.32 5 280 R 3 540 3 090
Tallandoon ( Mitta Mitta River ) 4.2 2.48 219.37 4 250 F 4 790 5 170
Heywoods 5.5 2.98 156.61 13 110 R 13 560 14 210
Doctors Point 5.5 2.87 151.34 13 620 R 14 190 14 750
Albury 4.3 1.88 149.32 - - - -
Corowa 4.6 2.84 128.86 13 160 F 14 150 13 540
Yarrawonga Weir (d/s) 6.4 1.53 116.57 9 000 S 9 070 8 930
Tocumwal 6.4 2.11 105.95 8 740 F 8 870 8 600
Torrumbarry Weir (d/s) 7.3 2.60 81.14 7 710 S 7 530 7 460
Swan Hill 4.5 1.45 64.37 7 690 S 7 550 8 010
Wakool Junction 8.8 3.37 52.49 9 300 R 9 320 9 880
Euston Weir (d/s) 9.1 1.51 43.35 7 640 F 7 870 8 290
Mildura Weir (d/s) - - 6 540 F 6 540 7 410
Wentworth Weir (d/s) 7.3 2.82 27.58 4 810 S 4 720 5 990
Rufus Junction - 3.57 20.50 6 960 R 6 900 8 260
Blanchetown (Lock 1 d/s) - 0.68 - 3 190 F 3 390 5 580
Tributaries
Kiewa at Bandiana 2.8 0.80 154.03 260 F 610 580
Ovens at Wangaratta 11.9 7.87 145.55 340 R 350 410
Goulburn at McCoys Bridge 9.0 2.53 93.95 2 930 F 2 900 2 890
Edward at Stevens Weir (d/s) 5.5 2.41 82.18 2 650 S 2 640 2 600
Edward at Liewah - 2.81 58.19 2 260 R 2 210 2 230
Wakool at Stoney Crossing - 1.59 55.08 640 F 660 670
Murrumbidgee at Balranald 5.0 0.50 56.46 220 F 360 200
Barwon at Mungindi 6.1 2.87 - 0 F 0 20
Darling at Bourke 9.0 2.59 - 0 F 0 0
Darling at Burtundy Rocks - 0.62 - 10 R 10 0
Natural Inflow to Hume 890 540
(i.e. Pre Dartmouth & Snowy Mountains scheme)
Weirs and Locks Pool levels above or below Full Supply Level (FSL)
Murray FSL (m AHD) u/s d/s FSL (m AHD) u/s d/s
Yarrawonga 124.90 -0.03 - No. 7 Rufus River 22.10 -0.10 +1.26
No. 26 Torrumbarry 86.05 +0.00 - No. 6 Murtho 19.25 +0.01 +0.14
No. 15 Euston 47.60 +0.20 - No. 5 Renmark 16.30 +0.03 +0.19
No. 11 Mildura 34.40 +0.02 +0.19 No. 4 Bookpurnong 13.20 +0.03 +0.67
No. 10 Wentworth 30.80 +0.12 +0.18 No. 3 Overland Corner 9.80 +0.05 +0.21
No. 9 Kulnine 27.40 +0.00 -0.41 No. 2 Waikerie 6.10 +0.05 +0.12
No. 8 Wangumma 24.60 -0.42 -0.03 No. 1 Blanchetown 3.20 +0.01 -0.07
Lower Lakes FSL = 0.75 m AHD
Lake Alexandrina average level for the past 5 days (m AHD) 0.66
Barrages Fishways at Barrages
Openings Level (m AHD) No. Open Rock Ramp Vertical Slot 1 Vertical Slot 2 Dual Vertical Slots
Goolwa 128 openings 0.65 2 - Open Open -
Mundoo 26 openings - All closed - - - Open
Hunters Creek - - - - Open - -
Boundary Creek 6 openings - 1 - Open - -
Ewe Island 111 gates - All closed - - - Open
Tauwitchere 322 gates 0.62 2 Open Open Open -
AHD = Level relative to Australian Height Datum, i.e. height above sea level
Subscribe to the River Murray Weekly Report River Data website Water in Storages
Week ending Wednesday 23 Jan 2019
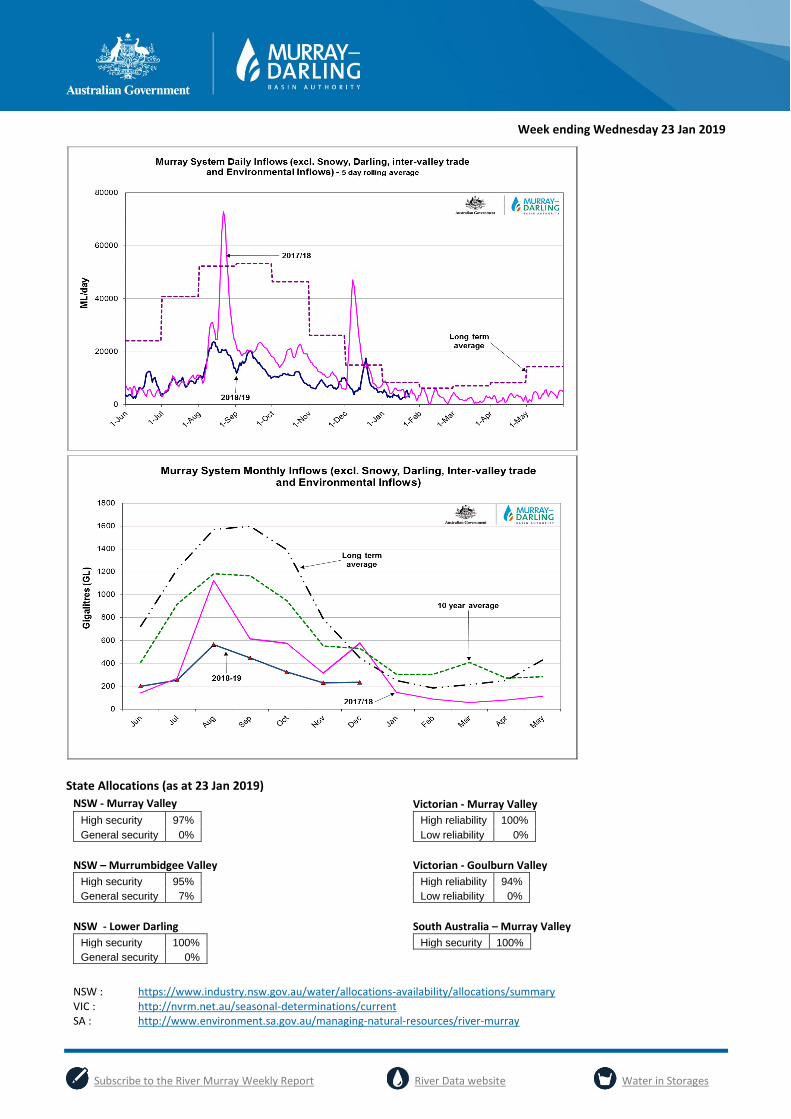
State Allocations (as at 23 Jan 2019)
NSW - Murray Valley Victorian - Murray Valley
High security 97%
General security 0%
High reliability 100%
Low reliability 0%
NSW – Murrumbidgee Valley
Victorian - Goulburn Valley
High security 95%
General security 7%
High reliability 94%
Low reliability 0%
NSW - Lower Darling
South Australia – Murray Valley
High security 100%
General security 0%
High security 100%
NSW : https://www.industry.nsw.gov.au/water/allocations-availability/allocations/summary
VIC : http://nvrm.net.au/seasonal-determinations/current
SA : http://www.environment.sa.gov.au/managing-natural-resources/river-murray


![[E. J. Mishan, Euston Quah] Cost-Benefit Analysis(Bookos-z1.Org)](https://img.pdfslide.us/doc/110x75/55cf9724550346d0338fe94d/e-j-mishan-euston-quah-cost-benefit-analysisbookos-z1org.jpg)
![[E. J. Mishan, Euston Quah] Cost Benefit Analysis(Bookos.org)](https://img.pdfslide.us/doc/110x75/55cf99a0550346d0339e5b71/e-j-mishan-euston-quah-cost-benefit-analysisbookosorg.jpg)