Embed Size (px)
Citation preview

MURRAY-DARLING BASIN AUTHORITY
Pipeline to the SeaFeasibility Study — Phase 1
Prepared October 2008 by Tonkin Science EngineeringPublished May 2011
Pipeline to the Sea: Feasibility Study - Phase 1
Prepared for the former Murray-Darling Basin Commission by Tonkin Science Engineering Published by Murray-Darling Basin Authority Postal Address GPO Box 1801, Canberra ACT 2601 Office location Level 4, 51 Allara Street, Canberra City Australian Capital Territory
Telephone (02) 6279 0100 international + 61 2 6279 0100 Facsimile (02) 6248 8053 international + 61 2 6248 8053 E-Mail [email protected] Internet http://www.mdba.gov.au
For further information contact the Murray-Darling Basin Authority office on (02) 6279 0100
This report may be cited as: Pipeline to the Sea: Feasibility Study – Phase 1
MDBA Publication No. 148/11 ISBN (on-line) 978-1-921914-11-9 © Copyright Murray-Darling Basin Authority (MDBA), on behalf of the Commonwealth of Australia 2011.
This work is copyright. With the exception of photographs, any logo or emblem, and any trademarks, the work may be stored, retrieved and reproduced in whole or in part, provided that it is not sold or used in any way for commercial benefit, and that the source and author of any material used is acknowledged.
Apart from any use permitted under the Copyright Act 1968 or above, no part of this work may be reproduced by any process without prior written permission from the Commonwealth. Requests and inquiries concerning reproduction and rights should be addressed to the Commonwealth Copyright Administration, Attorney General’s Department, National Circuit, Barton, ACT, 2600 or posted at http://www.ag.gov.au/cca.
The views, opinions and conclusions expressed by the authors in this publication are not necessarily those of the MDBA or the Commonwealth. To the extent permitted by law, the MDBA and the Commonwealth excludes all liability to any person for any consequences, including but not limited to all losses, damages, costs, expenses and any other compensation, arising directly or indirectly from using this report (in part or in whole) and any information or material contained within it.
Australian Government Departments and Agencies are required by the Disability Discrimination Act 1992 (Cth) to ensure that information and services can be accessed by people with disabilities. If you encounter accessibility difficulties or the information you require is in a format that you cannot access, please contact us.
Cover image: “Salinity Interception infastructure at Bookpurnong SA. Main line for salinity water to evaporation ponds” Arthur Mostead
Pipeline to the Sea: Feasibility Study - Phase 1
Preface
The Basin Salinity Management Strategy 2001–2015 is the Murray-Darling Basin Ministerial Council’s response to the threat of salinity to water quality, the riverine environment, regional infrastructure and productive agricultural land.
A key element of this Strategy was the implementation of a joint program to construct new salt interception schemes to offset a predicted 61EC future increase in average salinity at Morgan. With an increase in the number of operating salt interception schemes came the need to assess options for disposal of saline groundwater generated by these schemes.
Due to the controversial nature of disposal basins from a social and environmental perspective, more detailed assessments of a number of alternate disposal options have been carried out or are under way. One alternative for the Riverland is a pipeline to transfer saline water to the sea.
The Murray-Darling Basin Commission first assessed a pipeline to the sea to transfer saline water generated by salt interception schemes in the Murray-Darling Basin in 1990 (GHD et al, 1990). That assessment considered a combined pipeline to transfer water from the Sunraysia and Riverland areas (‘the Mallee Zone’) as well as a separate pipeline to transfer saline water east/upstream of Swan Hill (‘the Riverine Plains Zone’).
The objective of this latest feasibility report was to establish the feasibility of a pipeline/channel delivery system that would efficiently and effectively dispose of saline groundwater from the Stockyard Plain Disposal Basin in the Riverland Region of South Australia to the sea.
The key conclusion of this feasibility study is that a pipeline to the sea may have some promise in the longer term when or if the capacity of the existing basins is exceeded. This report has only been prepared to inform discussion around possible disposal alternatives. Any decision to build such a pipeline at some point in the future would require more detailed engineering and ecological assessments followed by an extensive consultation and approval process.

Pipeline to the Sea: Feasibility Study - Phase 1
Table of Contents
Pipeline to the Sea Feasibility Study – Phase 1
Executive Summary i 1. Introduction 1 1.1 Project Objective 1 1.2 Stockyard Plain Disposal Basin 2 2. Outline of Scheme 3 2.1 Outline of Infrastructure 3 2.2 Range of options considered 4 3. Other Options 5 3.1 General 5 3.2 Disposal to Existing Salt Fields 5 3.3 Disposal of Salt 6 3.4 Discharge to Morella Basin or Southern Lagoon of the Coorong 6 4. Pipeline Routes 7 4.1 Alternative Routes 7 4.2 Alternative Disposal Locations 7 4.3 Options Assessed 8 5. Pipeline and Pumping Infrastructure 12 5.1 System Description and Operating Philosophy 12 5.2 Pipeline 12 5.2.1 Pipe Size 12 5.2.2 Pipe Material 16 5.2.3 Pipeline Cost 16 5.3 Pump Stations 19 5.3.1 Number of Pump Stations 19 5.3.2 Pump Station Cost 23 5.4 Discussion 27 5.5 Off Peak Pumping 27 5.6 Energy Recovery 28 5.7 Open Channels 28 5.8 ETSA Upgrade 29 6. Marine Outfalls 32 6.1 General 32 6.2 Ecosystems at Outfall Locations 33 6.2.1 Port Wakefield 33 6.2.2 Port Gawler 35 6.2.3 Middleton 37 6.2.4 Murray Mouth 40

Pipeline to the Sea: Feasibility Study - Phase 1
6.2.5 Coorong Crossings (Hells Gate, Tea Tree Crossing, 42 Mile Crossing & South of Coorong) 42 6.3 Impact of Discharge on Receiving Environments 44 6.3.1 General 44 6.3.2 Water Quality Policy 44 6.3.3 Discharge Water Quality 45 6.3.4 Required Dilution for Compliance 46 6.3.5 Modelling of Discharge Mixing 47 6.3.6 Risk Assessment 50 6.3.7 Summary 56 7. Outfall Infrastructure 58 7.1 Description of outfalls 58 7.2 Outfall construction 59 7.3 Pipeline to the Sea Outfalls 59 7.3.1 Length of Outfalls 59 7.3.2 Cost of Outfalls 60 8. Concentration Techniques 64 8.1 Introduction 64 8.2 Concentration via solar evaporation 64 8.3 Climate Change 65 8.4 Opportunistic production of other products 65 8.5 Evaporation Basin Model 67 8.5.1 General 67 8.5.2 Model Methodology 67 8.5.3 Model Inputs and Assumptions 68 8.6 Area of Evaporation Basins Required 69 8.7 Cost of Evaporation Basins 70 8.7.1 Capital Cost 70 8.7.2 Operation and Maintenance Cost 72 8.8 Issues Associated with Evaporation Basins 72 8.9 Concentration by Desalination 73 9. Ecological Issues 75 9.1 Desktop Study 75 9.2 Stockyard Plain Basin 75 9.3 Pipeline Alignments 76 9.3.1 Methodology 76 9.3.2 Vegetation Types and Significance 78 9.3.3 Summary of Vegetation Assessment 79 9.3.4 Other Vegetation Issues 80 10. Aboriginal Heritage 82 10.1 Desktop Study 82 10.2 Aboriginal Heritage Sites 82 10.3 Native Title 85 10.4 Consultation with Aboriginal Groups 85 10.5 Summary 86

Pipeline to the Sea: Feasibility Study - Phase 1
11. Social Impacts 87 12. Comparison of Options 88 12.1 General 88 12.2 Total Cost 88 12.3 Present Value Cost 89 12.4 Cost per Tonne of Salt Removed 96 12.5 Cost of Removing Salt by Truck 98 12.6 Overall Comparison of Alternative Pipeline Alignments 99 12.7 Comparison of Pipeline and Trucking 100 13. Technical Review Workshop 101 13.1 Workshop Purpose, Attendees and Outcomes 101 13.2 Phase 2 102 14. Conclusions 104 14.1 Individual Conclusions 104 14.2 Overall Conclusions 106 15. References 107
Tables
Table 4.1 – Alternative Pipeline Routes 9 Table 5.1 - Pipe Sizes Assessed for Different Velocities 13 Table 5.2 – Optimum Pipe Sizes 13 Table 5.3 – Pipe Details 14 Table 5.4 - Optimisation of Pipeline Size 15 Table 5.5 – Pipeline Capital Costs 18 Table 5.6 – Pipeline Friction (m/km) for Different Pipeline Capacities and Velocities 19 Table 5.7 – Number of Pump Stations for Each Pipeline Option (50 L/s) 20 Table 5.8 – Number of Pump Stations for Each Pipeline Option (100 L/s) 21 Table 5.9 – Number of Pump Stations for Each Pipeline Option (250 L/s) 21 Table 5.10 – Number of Pump Stations for Each Pipeline Option (375 L/s) 22 Table 5.11 – Number of Pump Stations for Each Pipeline Option (500 L/s) 22 Table 5.12 – Unit Cost for each Different Pump Station 23 Table 5.13 – Pump Station Capital Costs 24 Table 5.14 – Density of Pumped Water 25 Table 5.15 – Annual Pump Station Operational Cost ($ million) 26 Table 5.16 - Power Upgrade Costs 29 Table 5.17 - Costs to Upgrade Electricity Network 31 Table 6.1 – Water Quality Data for Stockyard Plain Basin 46 Table 6.2 – CORMIX Model Input Data for Receiving Waters 48 Table 6.3 – CORMIX Model Input Data for Outfall Discharge 48 Table 6.4 – Results of Initial CORMIX Model Runs 48 Table 6.5 – Results of CORMIX Model Runs for Different Outfall Pipe Sizes 49 Table 6.6 – Impact Assessment Matrix 50 Table 6.7 – Summary Risk Matrix 55 Table 6.8 – Summary Risk Assessment for Habitat and Species 56

Pipeline to the Sea: Feasibility Study - Phase 1
Table 6.9 – Summary of Marine Outfalls 57 Table 7.1 – Outfall Lengths for Port Gawler Pipeline Options 60 Table 7.2 – Cost of Outfall Structures 62 Table 8.1 – Weather Data Used in Evaporation Basin Model 68 Table 8.2 – Area of Evaporation Basins for Salt Harvesting 69 Table 8.3 – Areas of Evaporation Basins for 300 L/s Inflow 69 Table 8.4 – Area (Ha) of Evaporation Basins Required to Concentrate Groundwater at Stockyard Plain 70 Table 8.5 - Estimated Cost of Reverse Osmosis Desalination Plants 73 Table 9.1 – Overall Significance Score 76 Table 9.2 – Roadside Vegetation Categories 77 Table 9.3 – Vegetation Scoring for Bow Hill to Tailem Bend 77 Table 9.4 – Roadside Vegetation Categories for Bow Hill to Tailem Bend 77 Table 9.5 – Summary of Roadside Vegetation Assessment 79 Table 10.1 – Consolidated List of Known Aboriginal Heritage Sites 84 Note: NNTT ID = National Native Title Tribunal Identification number
Table 10.2 – Native Title Claims 85 Table 10.3 – Aboriginal Stakeholder Groups 85 Table 12.2 – Overall Comparison of Pipeline Alignments 99
Figures
Figure 2.1 – Schematic Diagram of Project Infrastructure 3 Figure 4.1 – Alternative Pipeline Routes 10 Figure 4.2 – Longitudinal Sections of Pipeline Routes 11 Figure 5.1 – Pipeline Capital Costs 17 Figure 12.1 – Present Value Costs 96 Figure 12.2 – Cost per Tonne of Salt Removed 97
Appendices
Appendix A Fisheries Habitats Appendix B Risk Assessment for Marine Habitats Appendix C Risk Assessment for Marine Species Appendix D Pipeline System Schematics

Pipeline to the Sea: Feasibility Study - Phase 1
Document History and Status
Rev Description Author Rev’d App’d Date
A Draft for comment RME JPW 7/11/07
B Revised draft for workshop RME JPW 21/4/08
C Revised draft following workshop RME JPW 30/6/08
D Final RME PDC PDC 9/10/08

Pipeline to the Sea: Feasibility Study - Phase 1
i
Executive Summary
Key Conclusions
A pipeline to the sea is a promising option to remove salt from the Riverland region of South Australia some time in the future when additional volumes of saline groundwater are generated by new salt interception schemes and the capacity of existing disposal options is exceeded.
For the likely groundwater flows and salt loads to be disposed of in the short term, piping salt is not as cost effective as harvesting salt at Stockyard Plain Basin and removing by trucking. A drawback of this option however is that additional evaporation basins would have to be constructed to allow salt to be harvested
It is more cost effective to concentrate the groundwater at the Stockyard Plain Basin before pumping to the sea. This indicates that the additional costs to concentrate the groundwater are more than offset by the reduction in pipeline cost by using a smaller pipe to transfer the same volume of salt.
The enhanced concentration of the groundwater generated by the salt interception schemes, possibly by desalination at the Stockyard Plain Basin, would reduce the inflow to the basin and extend its sustainable life beyond the currently estimated 100 years.
The most cost effective pipeline option is to concentrate brine at Stockyard Plain Basin and transport to Cheetham Salt at Dry Creek north of Adelaide. Although preliminary figures indicate that this option is not as cost effective as the trucking option it is considered that it warrants more detailed assessment as it re-uses a waste product and there is opportunity to offset costs against the reduced pumping which would be required by Cheetham Salt. If coupled with a desalination plant at Stockyard Plain Basin to concentrate the brine and produce fresh water as aby-product, the total project would be seen as turning a problem into a number of benefits.
If a pipeline to the sea was to be adopted in the future a detailed investigation would be required to more accurately determine costs for the preferred alignment and to determine the optimum time to cease disposal to Stockyard Plain Basin to ensure the long term ecological sustainability of salt interception schemes in the Riverland.
Objective
The objective of this study is to establish the feasibility of a pipeline/channel delivery system that will efficiently and effectively dispose of saline groundwater from the Stockyard Plain Disposal Basin in the Riverland Region of South Australia to the sea.

Pipeline to the Sea: Feasibility Study - Phase 1
ii
A pipeline to the sea would be expected to extend the sustainability of existing salt management basins in the region as well as delaying or negating the need for the development of additional salt management basins.
Methodology
The project was considered as consisting of three main components;
• Works required at Stockyard Plain to concentrate the salt load.
• Works required to transport the salt load from the Stockyard Plain Basin to the disposal
site.
• Works required to dispose the salt load at the disposal site.
The efficiency of a salt disposal scheme can be measured by estimating the unit cost of salt removed from the Stockyard Plain Basin i.e. $/tonne. A number of alternative schemes were assessed by considering a range of pipeline capacities and salinities of pumped groundwater.
For this project a range of flows from 50 L/s to 500 L/s was considered for the disposal of groundwater from the Stockyard Plain Basin.
To cover the possible range of salinities to be pumped, the following salinities were considered when assessing the alternative schemes;
• 20 000 mg/L (lower limit).
• 60 000 mg/L (mid range).
• 100 000 mg/L (upper limit).
Alternative Options
Alternative pipeline routes were selected by consideration of potential disposal locations and proximity to the sea. The geography of the South Australian coastline highlights four principal disposal locations;
• Top of Gulf St Vincent.
• North of the city of Adelaide.
• The Coorong.
• Encounter Bay (Middleton).
The top of Gulf St Vincent is due west of the Stockyard Plain Basin and a pipeline alignment would avoid any major townships. The nearest point on the coastline to the Stockyard Plain Basin is north of the city of Adelaide. The Southern Ocean adjacent the Coorong is a logical destination because of its direct route and high energy coastline. The Encounter Bay alternative was selected as it provides a shorter pipeline route than the Coorong option.

Pipeline to the Sea: Feasibility Study - Phase 1
iii
In addition to disposal of the saline water to the sea, disposal at the existing Cheetham saltfields at Dry Creek was considered.
For each of the locations a pipeline alignment was selected by following existing road reserves and existing or disused railway corridors. The alignments also cross the River Murray and other rivers and creeks at existing or disused bridges.
A total of four principal pipeline routes (A to D) and 11 alternative disposal locations were considered and are summarised in the following table.
Pipeline Route
Disposal Location Length
(km)
Maximum
Elevation
(m AHD)
Distance Pumped (km)
A1 Port Wakefield 210 460 120
A2 Lochiel Salt Works 220 460 120
A3 Price Salt Works 240 460 120
B1 Dry Creek Salt Works 160 380 85
B2 Port Gawler 155 380 85
C1 Middleton 255 150 150
C2 Murray Mouth 265 150 150
D1 Hells Gate 240 76 210
D2 Tea Tree Crossing 280 76 245
D3 42 Mile Crossing 295 76 265
D4 South of Coorong National Park 330 76 290

Pipeline to the Sea: Feasibility Study - Phase 1
iv
Pipeline Costs
For the range of options considered, capital and on-going costs were estimated for a pipeline and pumping system. Pipeline capital costs varied from $44 million to $93 million for the 50 L/s capacity options and from $130 million to $278 million for the 500 L/s capacity options.
For all pipeline options the capital cost of the pipeline is much greater than the capital cost of the pump stations. For the Port Gawler (B2) and Dry Creek (B1) options the cost of the pump stations is 10% to 25% of the pipeline cost, while for the options which discharge to the Southern Ocean the cost of the pump stations is 10% to 15% of the pipeline cost.
The capital cost of the pipeline for any particular option is much greater than the capital cost of the pump stations and the outfall structures. For the options which pump raw groundwater from the Stockyard Plain Basin the pipeline represents 65% to 75% of the capital cost for the Port Gawler options and 75% to 90% of the capital cost for the options discharging to the Southern Ocean.
It was also found that the pump station operating costs were small compared to the pipeline capital cost. Using a 30 year period and 4% discount rate the present value of the operating cost for the Port Gawler options is 20% to 50% of the pipeline cost. For the pipeline options which outfall to the Southern Ocean the operating cost is between 10% and 15% of the pipeline cost, depending upon the pipeline capacity.
The existing ETSA Utilities electricity distribution network would require a significant upgrade south of Meningie and west of Blanchetown to cater for the proposed pump stations along the Coorong and Port Gawler pipeline options.
Concentration at Stockyard Plain
For the options pumping concentrated groundwater the area of evaporation basins required to achieve the desired concentration was estimated. To achieve the desired salinities it is necessary to line the basins to reduce the seepage rate. The cost of the basins was estimated using a rate of $35 000 to $40 000/ ha. The capital cost of the basins becomes significant for these options and the pipeline cost becomes 40% to 50% of the total capital cost for Port Gawler options and 50% to 70% for other options.
Marine Outfalls
The composition of the groundwater being pumped into the Stockyard Plain Basin is similar to that of seawater. The principal differences between the Stockyard Plain Basin water and seawater are elevated concentrations of oxidised nitrogen, ammonia, iron and manganese.
Based on the number of species and habitats the Southern Ocean marine outfall locations have a lower environmental risk than the Gulf St. Vincent marine outfall locations. However, results of the
Pipeline to the Sea: Feasibility Study - Phase 1
v
CORMIX∗
Marine outfalls discharging to the Southern Ocean are likely to be shorter in length than those discharging to Gulf St Vincent because of higher energy waters and deeper water closer to shore.
modelling indicate that discharge from a single open pipe marine outfall without a diffuser structure should adequately mix to achieve acceptable concentrations of critical elements at the edge of the mixing zone as defined in the Environmental Protection (Water Quality) Policy, 2003.
The location of the outfall will be governed by specific site conditions and further detailed modelling using site specific data would be required before any definite decisions on outfall locations were made. In particular, site specific bathymetry and time series wind and current data to define the worst conditions scenario are required to allow more accurate modelling of the outfalls.
For each option discharging to the sea, capital and on-going costs were estimated for a marine outfall. The cost of all outfalls was much smaller than the pipeline cost.
Ecological Issues
To assess the nature and scale of matters of conservation significance likely to be encountered along the alternative pipeline routes the database of roadside vegetation mapping was used. From the database, the extent of high value vegetation was quantified as this was considered a good indicator of the potential for impacting on conservation values.
It was concluded that the risk of impacting on conservation values along the Port Gawler alignment is low while the risk of impacting on conservation values along the Coorong alignments is high.
Aboriginal Heritage
A desk top study revealed a total of 22 sites recorded within 50 metres of the proposed pipeline alignments. Thirteen sites were recorded along the Coorong pipeline routes, 10 along the Middleton and Murray Mouth routes and 3 along the Dry Creek-Port Gawler route.
Aboriginal heritage issues are likely to be encountered along all pipeline alignments although there is a greater likelihood for more issues to be encountered along the Coorong and Middleton-Murray Mouth alignments than the Dry Creek-Port Gawler alignment.
Although Aboriginal heritage issues will be encountered along all alignments it is considered that they can be adequately managed to the satisfaction of local Aboriginal groups by avoidance of sites or monitoring during construction.
∗ Cornell Mixing Zone Expert System (CORMIX) hydrodynamic computer model - approved by the US EPA.
Pipeline to the Sea: Feasibility Study - Phase 1
vi
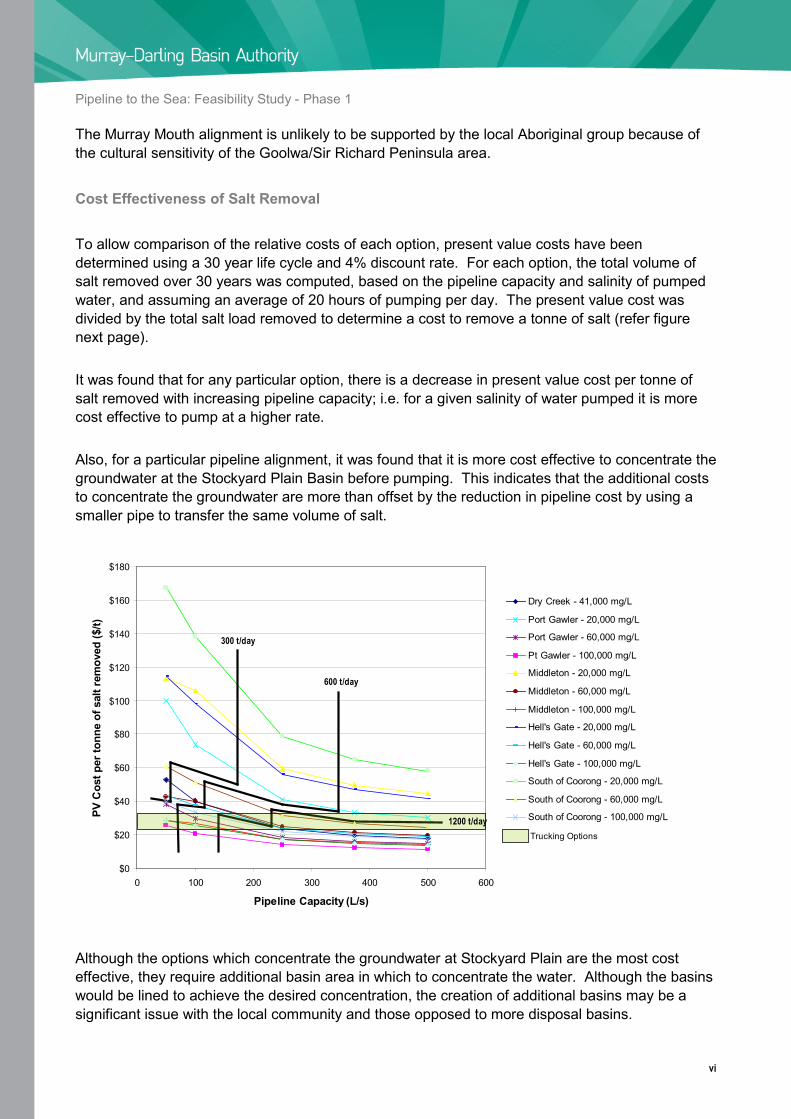
The Murray Mouth alignment is unlikely to be supported by the local Aboriginal group because of the cultural sensitivity of the Goolwa/Sir Richard Peninsula area.
Cost Effectiveness of Salt Removal
To allow comparison of the relative costs of each option, present value costs have been determined using a 30 year life cycle and 4% discount rate. For each option, the total volume of salt removed over 30 years was computed, based on the pipeline capacity and salinity of pumped water, and assuming an average of 20 hours of pumping per day. The present value cost was divided by the total salt load removed to determine a cost to remove a tonne of salt (refer figure next page).
It was found that for any particular option, there is a decrease in present value cost per tonne of salt removed with increasing pipeline capacity; i.e. for a given salinity of water pumped it is more cost effective to pump at a higher rate.
Also, for a particular pipeline alignment, it was found that it is more cost effective to concentrate the groundwater at the Stockyard Plain Basin before pumping. This indicates that the additional costs to concentrate the groundwater are more than offset by the reduction in pipeline cost by using a smaller pipe to transfer the same volume of salt.
$0
$20
$40
$60
$80
$100
$120
$140
$160
$180
0 100 200 300 400 500 600
Pipeline Capacity (L/s)
PV C
ost p
er to
nne
of s
alt r
emov
ed ($
/t)
Dry Creek - 41,000 mg/L
Port Gawler - 20,000 mg/L
Port Gawler - 60,000 mg/L
Pt Gawler - 100,000 mg/L
Middleton - 20,000 mg/L
Middleton - 60,000 mg/L
Middleton - 100,000 mg/L
Hell's Gate - 20,000 mg/L
Hell's Gate - 60,000 mg/L
Hell's Gate - 100,000 mg/L
South of Coorong - 20,000 mg/L
South of Coorong - 60,000 mg/L
South of Coorong - 100,000 mg/L
300 t/day
600 t/day
1200 t/dayTrucking Options
Although the options which concentrate the groundwater at Stockyard Plain are the most cost effective, they require additional basin area in which to concentrate the water. Although the basins would be lined to achieve the desired concentration, the creation of additional basins may be a significant issue with the local community and those opposed to more disposal basins.

Pipeline to the Sea: Feasibility Study - Phase 1
vii
Comparison of Options
The Port Gawler options are more cost effective that the Middleton-Murray Mouth options and the Coorong options which discharge to the Southern Ocean.
The most cost effective options are the 500 L/s pipelines delivering 100 000 mg/L water to Port Gawler and Cheetham Salt at Dry Creek. Under these options the present value cost per tonne of salt is approximately $11.40.
Most of the pipeline options are less cost effective in removing salt than harvesting salt at the Stockyard Plain Basin and trucking it to a disposal site. The only pipeline options which are more cost effective are the larger pipelines carrying concentrated groundwater and these are very expensive. These options are also unrealistic in the short term as they represent salt loads greater than will be delivered to Stockyard Plain Basin when all currently planned salt interception schemes are operational.
A summary of the issues associated with each option is provided in the table below.
Option
Project Cost
1 = lowest
10 = highest
Power Cost
1 = lowest
10 = highest Aboriginal Heritage Issues
Risk of Impact on Conservation Values
Suitability of Marine Outfall
B1 – Cheetham Salt 2 1 Preferred Low No outfall
B2 – Port Gawler 1 2 Preferred Low Medium – Low
C1 – Middleton 5 5 Less preferred Intermediate Low – High
C2 - Murray Mouth 6 8 Unlikely to be supported Medium High
D1 – Hells Gate 4 4 Less preferred High High
D2 – Tea Tree Crossing 8 6 Less preferred High High
D3 – 42 Mile Crossing 9 9 Less preferred High High
D4 – South of Coorong 10 10 Less preferred High High
E1 – Coorong Southern Lagoon 3 3 Less preferred High No outfall
E2 – Morella Basin 7 7 Less preferred High No outfall
Pipeline to the Sea: Feasibility Study - Phase 1
viii
For Stockyard Plain Basin to remain sustainable, the volume of groundwater to be disposed of is about 95 L/s at 19 000 mg/L or about 20 L/s at 41 000 mg/L. Pipeline options to Port Gawler or Cheetham Salt at Dry Creek would achieve this at a present value cost of salt removed of $73.60/tonne and $52.62/tonne respectively. Neither of these two options are as cost effective as harvesting the salt and removing by truck which has a present value cost of removal of between $23.14/tonne and $32.27/tonne depending upon destination. A drawback of this option is that additional evaporation basins would have to be constructed to allow salt to be harvested.
Preferred Option
The selection of a preferred alignment is difficult as no alignment ranks highest on all issues. The selection of a preferred alignment is therefore a subjective judgement. Consideration of the issues summarised in the above table suggests that the pipeline alignment to Port Gawler/ Cheetham Salt is the preferred alignment. The suitability of the marine outfall for discharge of saline water is inferior to the options discharging to the Southern Ocean but preliminary modelling of the outfall indicates that an acceptable outfall could be constructed. Although the outfall at Port Gawler is likely to be more expensive than the outfalls for the Southern Ocean options, the overall project cost is likely to be considerably less because of the significantly shorter pipeline length. A significant advantage of the Port Gawler option is the avoidance of the Coorong National Park.
The most cost effective pipeline option is to concentrate brine at Stockyard Plains Basin and transport to the Cheetham Salt at Dry Creek. Although preliminary figures indicate that this option is not as cost effective as the trucking option it is considered that it warrants more detailed assessment as it re-uses a waste product and there is opportunity to offset costs against the reduced pumping which would be required by Cheetham Salt. If coupled with a desalination plant at Stockyard Plains Basin to concentrate the brine, the total project could be seen as turning a problem into a number of benefits.
Phase 2
A pipeline to the sea is a promising option to remove salt from the Riverland region of South Australia some time in the future when additional volumes of saline groundwater are generated by new salt interception schemes. A pipeline to the sea warrants more detailed investigation to more accurately determine costs for the preferred alignment and to determine when the pipeline would be required to ensure the long term ecological sustainability of the Stockyard Plain Basin.

Pipeline to the Sea: Feasibility Study - Phase 1
1
1. Introduction
Project Objective
The Murray-Darling Basin Commission (MDBC) and the South Australian Government are currently investigating and constructing a number of salt interceptions schemes in the South Australian Riverland region. Included in the investigations program has been the assessment of options for the disposal of the saline groundwater generated by these schemes.
Due to the controversial nature of disposal basins from a social and environmental perspective, more detailed assessments of a number of alternate disposal options have been carried out or are underway. One alternative is a pipeline to transfer the saline water to the sea.
The MDBC previously assessed a pipeline to the sea to transfer saline water generated by salt interception schemes in the Murray-Darling Basin in 1990 (GHD et al, 1990). The assessment considered a combined pipeline to transfer water from the Sunraysia and Riverland areas as well as a separate pipeline to transfer saline water from upstream of Swan Hill.
While the study proposed a pipe route linking Sunraysia and Riverland flows south of Loxton and discharging the water to the Southern Ocean near Policemans Point on the Coorong in South Australia, it did not consider there were sufficient sources of concentrated saline flows to the river to warrant further consideration.
The study assumed that this option would allow disposal basins to be decommissioned. It did not look to optimise the pipeline – disposal basin system. Nor did this study look at the environmental and social implications of establishing a pipeline to the sea.
The objective of this study is to establish the feasibility of a pipeline/channel delivery system that will efficiently and effectively dispose of saline groundwater from the Riverland Region of South Australia to the sea.
A pipeline to the sea would be expected to extend the sustainability of existing salt management basins in the region as well as delaying or negating the need for the development of additional salt management basins.
As these basins would be the source of saline water it may be feasible to concentrate water to the optimum salinity for cost effective disposal.

Pipeline to the Sea: Feasibility Study - Phase 1
2
Stockyard Plain Disposal Basin
The Stockyard Plain Disposal Basin is a major disposal basin for intercepted saline groundwater in the Murray-Darling Basin. The disposal basin is located approximately 12 km south west of Waikerie in the Riverland of South Australia and consists of a series of natural depressions with a levee bank constructed on the western side.
The reserve has an area of 1870 ha, with 675 ha set aside as pond area, 680 ha for the expected salinised zone and 515 ha of buffer vegetation. The basin was constructed in 1989 as part of the Woolpunda Salt Interception Scheme. The main basin consists of two permanent evaporation ponds – Pond A (in the east) and Pond B (in the west). Two ephemeral salinas, are used during winter or high inflow periods to reduce the variation in water level in the main basin. The maximum storage volume in the basin is approximately 12 500 ML (AWE, 2003).
The Stockyard Plain Disposal Basin receives saline groundwater from the Woolpunda, Waikerie Phase I and Waikerie Phase IIA Salt Interception Schemes and the Qualco Sunlands Trust Groundwater Control Scheme. The basin will also receive saline groundwater from the Waikerie Lock 2 Salt Interception Scheme when commissioned.
The inlet pipe to the basin is 525 mm diameter Class 6 Hobas and has a capacity of 500 L/s (AWE, 2003).
The basin relies on evaporation and infiltration to the underlying groundwater system to dispose of the inflowing water. The latest estimate of the sustainable disposal capacity of the basin is an average of 300 L/s over 100 years. The basin will be sustainable with periods of inflow greater than 300 L/s provided the average inflow over 100 years does not exceed 300 L/s (Collingham, 2008).
The salinity in the basin has been monitored by SA Water since commissioning. Results of the monitoring indicate the salinity of the intercepted groundwater discharged to the basin is typically about 19 000 mg/L. Salinity in Pond A typically ranges between 19 000 mg/L and 25 000 mg/L while in Pond B the salinity range is typically from 22 000 mg/L to 32 000 mg/L (SKM, 2004b).
The basin first received saline groundwater in June 1990 when the Woolpunda SIS was commissioned. Since that time the dryland mallee habitat has been transformed into a new saline dryland and aquatic habitat. The creation of the new environment due to the ponding of saline groundwater has attracted migratory and sedentary bird species to the site and improved the natural habitat value of the area.

Pipeline to the Sea: Feasibility Study - Phase 1
3
2. Outline of Scheme
Outline of Infrastructure
The aim of the project is to determine an efficient and effective mechanism for removing salt from the Stockyard Plain Basin and disposing of it outside of the Murray-Darling Basin. Conceptually this can be considered as comprising three principal components;
• Works required at Stockyard Plain to concentrate the salt load.
• Works required to transport the salt load from the Stockyard Plain Basin to the disposal
site.
• Works required to dispose the salt load at the disposal site.
A schematic diagram of the project infrastructure is shown in Figure 2.1. In the simplest arrangement where saline groundwater is pumped directly from the Stockyard Plain Basin and piped to sea, no concentration infrastructure is required and the schematic diagram reduces to a pipeline and pump system from the Stockyard Plain Basin to an outfall structure at the sea.
Figure 2.1 – Schematic Diagram of Project Infrastructure

Pipeline to the Sea: Feasibility Study - Phase 1
4
By considering the project as the three components described above a range of alternatives may be assessed and compared to determine the most efficient and effective mechanism. For example, if the groundwater at the Stockyard Plain Basin is concentrated to a higher salinity the same volume of salt could be disposed of via a smaller pipe. Separate consideration of the infrastructure required to dispose of the saline water also allows a range of different disposal locations to be compared.
Range of options considered
The efficiency of a salt disposal scheme can be measured by estimating the unit cost of salt removed from the Stockyard Plain Basin i.e. $/tonne. A number of alternative schemes were assessed by considering a range of pipeline capacities and salinities of pumped groundwater.
The current inflow to the Stockyard Plain Basin is approximately 300 L/s while the design capacity of the inlet pipe to the basin is 500 L/s. For this project a range of flows from 50 L/s to 500 L/s was considered for the disposal of groundwater from the Stockyard Plain Basin.
The salinity of groundwater discharged to the basin is typically about 19 000 mg/L. As saline water concentrates, different salts precipitate at different salinity levels. The salts which precipitate and the salinity at which they precipitate are dependent upon the chemical composition of the water. For the groundwater being discharged to the Stockyard Plain Basin it is likely that the first precipitate, calcium sulphate, would begin at a salinity of about 130 000 mg/L. Pumping water of salinity greater than this would cause problems because of flow restrictions caused by scaling of pipes and pumps. For this project it has been assumed that the most saline waters that can effectively be pumped without causing significant physical problems is 100 000 mg/L. To cover the possible range of salinities to be pumped, the following salinities were considered when assessing the alternative schemes;
• 20 000 mg/L (lower limit).
• 60 000 mg/L (mid range).
• 100 000 mg/L (upper limit).

Pipeline to the Sea: Feasibility Study - Phase 1
5
3. Other Options
General
In addition to the pipeline to the sea options a number of other options to remove the salt from Stockyard Plain Basin have been considered. Some of the options are adjuncts to the pipeline options while others are presented to allow the cost per tonne of salt removed to be compared.
Disposal to Existing Salt Fields
There are a number of existing salt harvesting operations within 200 km of Stockyard Plain Basin. Instead of piping saline water to the sea it could be piped to one of the existing salt works. Most of the salt harvesting operations are small and would not have the capacity to cope with the likely volumes of saline water supplied from Stockyard Plain. However, the Cheetham Salt Ltd Dry Creek Saltfield near Adelaide is the largest solar salt operation in Eastern Australia and harvests an average of 650 000 tonnes of salt per year. About 600 000 tonnes of this is supplied to Penrice in the form of crude brine for the production of soda ash.
The Dry Creek Saltfield occupies a strip of low lying coastal land along the east coast of Gulf St Vincent north of the city of Adelaide. The Saltfield consists of 44 individual irregular shaped shallow evaporation ponds covering 3670 ha and 8 crystallising ponds covering almost 400 ha. Seawater is pumped into the ponds at Middle Beach to the north of the ponds and gravitates southward through the pond layout.
The seawater pumped into the ponds has salinity levels of approximately 41 000 mg/L. From the inlet the water gradually increases in salinity as it moves through the series of ponds. For Cheetham to accept saline water from an external source, the water would have to be at least as saline as the sea water currently used. Also, the Cheetham operation is strictly controlled and would require the inflow water to be of constant salinity or density. Depending upon the salinity of the water, it could be introduced into the appropriate pond of the Dry Creek Saltfield.
Because of this stipulation it would be necessary to concentrate the raw Stockyard Plain Basin groundwater in a well managed series of evaporation ponds. As there is no available land at the Cheetham salt fields it is logical to concentrate the groundwater at the Stockyard Plain Basin. This would also reduce the cost of the pipeline and pump stations.
Currently, seawater is only pumped into the ponds during summer. However, by introducing additional storage into the system (by raising some pond banks) the saltfield could accommodate a constant inflow from the Stockyard Plain Basin.

Pipeline to the Sea: Feasibility Study - Phase 1
6
Disposal of Salt
Instead of removing salt from the Stockyard Plain Basin in liquid form it could be removed as a solid. This option would involve concentrating the saline groundwater in evaporation ponds and harvesting the crystallised salt. The salt could be transported to the sea for disposal, via trucks or a combination of trucks and barges. These options would be similar to a salt harvesting operation but without the processing component which produces marketable products.
Discharge to Morella Basin or Southern Lagoon of the Coorong
For the options which include disposal to the sea, a marine outfall is required to ensure that the saline water is appropriately disposed of without negatively impacting on the marine environment. Depending upon the specific site conditions, the outfall may include a lengthy pipeline and also a diffuser to ensure adequate mixing. The potentially expensive outfall could be avoided if the saline water is discharged directly into an existing body of water without the need for mixing.
The Upper South East Dryland Salinity and Flood Management Plan is a project which includes the construction of a large network of drains in the Upper South East of South Australia which discharge to the Southern Lagoon of the Coorong at Salt Creek. Prior to entering the Coorong the drains discharge to Morella Basin, a natural depression south east of the township of Salt Creek. A regulator controls the release of the stored water in Morella Basin to the Coorong.
The nearest component of the Upper South East Dryland Salinity and Flood Management Plan drainage network to the Stockyard Plain Basin is Morella Basin. Therefore the pipeline from the Stockyard Plain Basin could discharge either directly to Morella Basin or to the southern lagoon of the Coorong.
The drains which discharge to the Coorong are a combination of groundwater and surface water drains and hence the salinity and volume of the discharge can be quite variable. Between 2000 and 2005 there were five periods of release to the Coorong with discharge varying between 9 ML/day and 398 ML/day and salinity varying between 7500 mg/L and 30 500 mg/L (Everingham et al, 2005).
A typical release to the Coorong is about 50 ML/day (580 L/s) at 15 000 to 20 000 mg/L. The releases to the Coorong are not continuous throughout the whole year. Over the period 2000 to 2005 the average annual release was 8,100 ML which is equivalent to a continuous discharge of 260 L/s. As more drains are constructed in the Upper South East the discharge to the Coorong will increase.
It is considered that the discharge from the Stockyard Plain would be comparable to the average release to the Coorong from the Upper South East drains and therefore is worthy of further consideration.

Pipeline to the Sea: Feasibility Study - Phase 1
7
4. Pipeline Routes
Alternative Routes
Alternative pipeline routes were selected by consideration of potential disposal locations and proximity to the sea. The geography of the South Australian coastline highlights four principal disposal locations;
• Top of Gulf St Vincent
• North of the city of Adelaide
• The Coorong
• Encounter Bay (Middleton)
The top of Gulf St Vincent is due west of the Stockyard Plain Basin and a pipeline alignment would avoid any major townships. The nearest point on the coastline to the Stockyard Plain Basin is north of the city of Adelaide. The Southern Ocean adjacent the Coorong is a logical destination because of its direct route and high energy coastline. The Encounter Bay alternative was selected as it provides a shorter pipeline route than the Coorong option.
For each of the locations a pipeline alignment was selected by following existing road reserves and existing or disused railway corridors. The alignments also cross the River Murray and other rivers and creeks at existing or disused bridges.
The alignments adopted generally provide a reasonably direct route from the Stockyard Plain Basin to the disposal location. Each individual alignment could be shortened if the pipeline was to traverse private property but such refinements are not considered to significantly affect the comparison of options within the accuracy of this feasibility study. As there is a land acquisition cost associated with pipelines across private properties, the shortest alignment is not always the least expensive. In addition, alignments across private property increase the negotiation required and also introduce the potential for obstinate landholders to delay the project.
Alternative Disposal Locations
For each of the four principal pipeline routes a number of alternative disposal locations were considered.

Pipeline to the Sea: Feasibility Study - Phase 1
8
At the top of Gulf St Vincent the closest disposal point to the Stockyard Plain Basin is Port Wakefield. Near the top of the gulf Cheetham Salt operate two salt fields, at Price and Lochiel, and these provide alternative disposal locations.
For the pipeline route to the north of the city of Adelaide the Cheetham Salt operation at Dry Creek was selected as a logical disposal location while disposal to Gulf St Vincent at Port Gawler was selected as a supplementary disposal location.
At the time of selecting the pipeline routes, the physical characteristics of the marine outfall locations had not been investigated and it was unknown whether there was any significant variation in mixing and dilution capacity along the Southern Ocean coastline. Therefore, four alternative outfalls adjacent the Coorong were selected for consideration. The outfalls selected corresponded to points opposite existing tracks across the Coorong National Park to the coastline.
For the Encounter Bay route a disposal location near Middleton was selected. An alternative disposal location within the Goolwa channel near the Murray Mouth was also included.
Options Assessed
A total of four principal pipeline routes and 11 alternative disposal locations were considered. The alternative pipeline routes and disposal locations are shown in Figure 4.1. A summary of the pipeline routes is given in Table 4.1 while approximate longitudinal sections for each route are shown in Figure 4.2. The longitudinal sections were computed by manually extracting distances from 1:50 000 topographic plans with a 10 metre contour interval.
Table 4.1 and Figure 4.2 show that the pipeline route to north of the city of Adelaide is the shortest but traverses the Mt Lofty Ranges and therefore requires a significant pump head. Although the pump head required for this route is much greater than for the Coorong routes the distance to be pumped is much less because significant portions would be gravity pipeline rather than pressure pipeline.

Pipeline to the Sea: Feasibility Study - Phase 1
9
Pipeline Route
Disposal Location Length
(km)
Maximum
Elevation
(m AHD)
Distance Pumped** (km)
A1 Port Wakefield 210 490 140 - 170
A2 Lochiel Salt Works 220 490 155 - 220
A3 Price Salt Works 240 490 140 - 200
B1 Dry Creek Salt Works 165 370 80 - 170
B2 Port Gawler 155 370 80 - 180
C1 Middleton 255 160 100 - 230
C2 Murray Mouth 260 160 100 - 245
D1 Hells Gate 240 110 200 - 235
D2 Tea Tree Crossing 280 110 240 - 270
D3 42 Mile Crossing 290 110 250 - 290
D4 South of Coorong National Park 330 110 290 - 330
** Distance pumped is dependent on pipe size and velocity and therefore varies depending upon pump layout
Table 4.1 – Alternative Pipeline Routes

Pipeline to the Sea: Feasibility Study - Phase 1
Figure 4.1 – Alternative Pipeline Routes

0
20
40
60
80
100
120
140
160
180
200
220
240
260
280
300
320
340
360
380
400
420
440
460
480
500
0 20 40 60 80 100 120 140 160 180 200 220 240 260 280 300 320 340 360
Pipeline Distance (km)
Nat
ural
Sur
face
Ele
vatio
n (m
AH
D)
A1 - Port Wakefield
A2 - Lochiel
A3 - Price
B1 - Dry Creek
B2 - Port Gawler
C1 - Middleton
C2 - Murray Mouth
D1 - Hells Gate
D2 - Tea Tree Crossing
D3 - 42 Mile Crossing
D4 - South of Coorong
Figure 4.2 – Longitudinal Sections of Pipeline Routes

Pipeline to the Sea: Feasibility Study - Phase 1
12
5. Pipeline and Pumping Infrastructure
System Description and Operating Philosophy
The transport mechanism highlighted in Figure 2.1 is considered to be a pressure pipeline from the Stockyard Plain Disposal Basin to the outlet location with sufficient pump stations along the route to transfer the required flow. In sections along the route where topography allows, gravity will be used to transfer the saline water.
A main pump station will be located at the Stockyard Plain Basin and is common to all pipeline routes considered, although the pumping capacity will vary to suit the range of pipeline options. It is assumed that a suction system with the following components will be included at the basin to extract the water to be transferred;
• Multiple tapered inlets on separately isolatable pipes
• Each separate pipe system connects into a common manifold for connection to the
pumping system
• Each inlet pipe to be fitted with screens to prevent debris entry and shall be removable for
cleaning
• Inlet pipes to have bell mouth entry for flow control.
It is assumed that the pumping system will operate continuously, except for breakdowns and closures for maintenance. For operational flexibility it is assumed that each individual pump station will operate independently and therefore require a balancing storage at each pump station. It is assumed that pump station operation will be based on water level in the balancing tanks and that control will be by SCADA/telemetry links between each pump station and a central control centre.
Pipeline
Pipe Size
It was decided to consider 5 different flow rates within the flow range 50 L/s to 500 L/s. For each pipeline alignment, pipe sizes were chosen for velocities of 1.1 m/s, 1.5 m/s and 2.2 m/s to determine the least total cost option. The pipe sizes assessed for the different velocities are listed in Table 5.1.
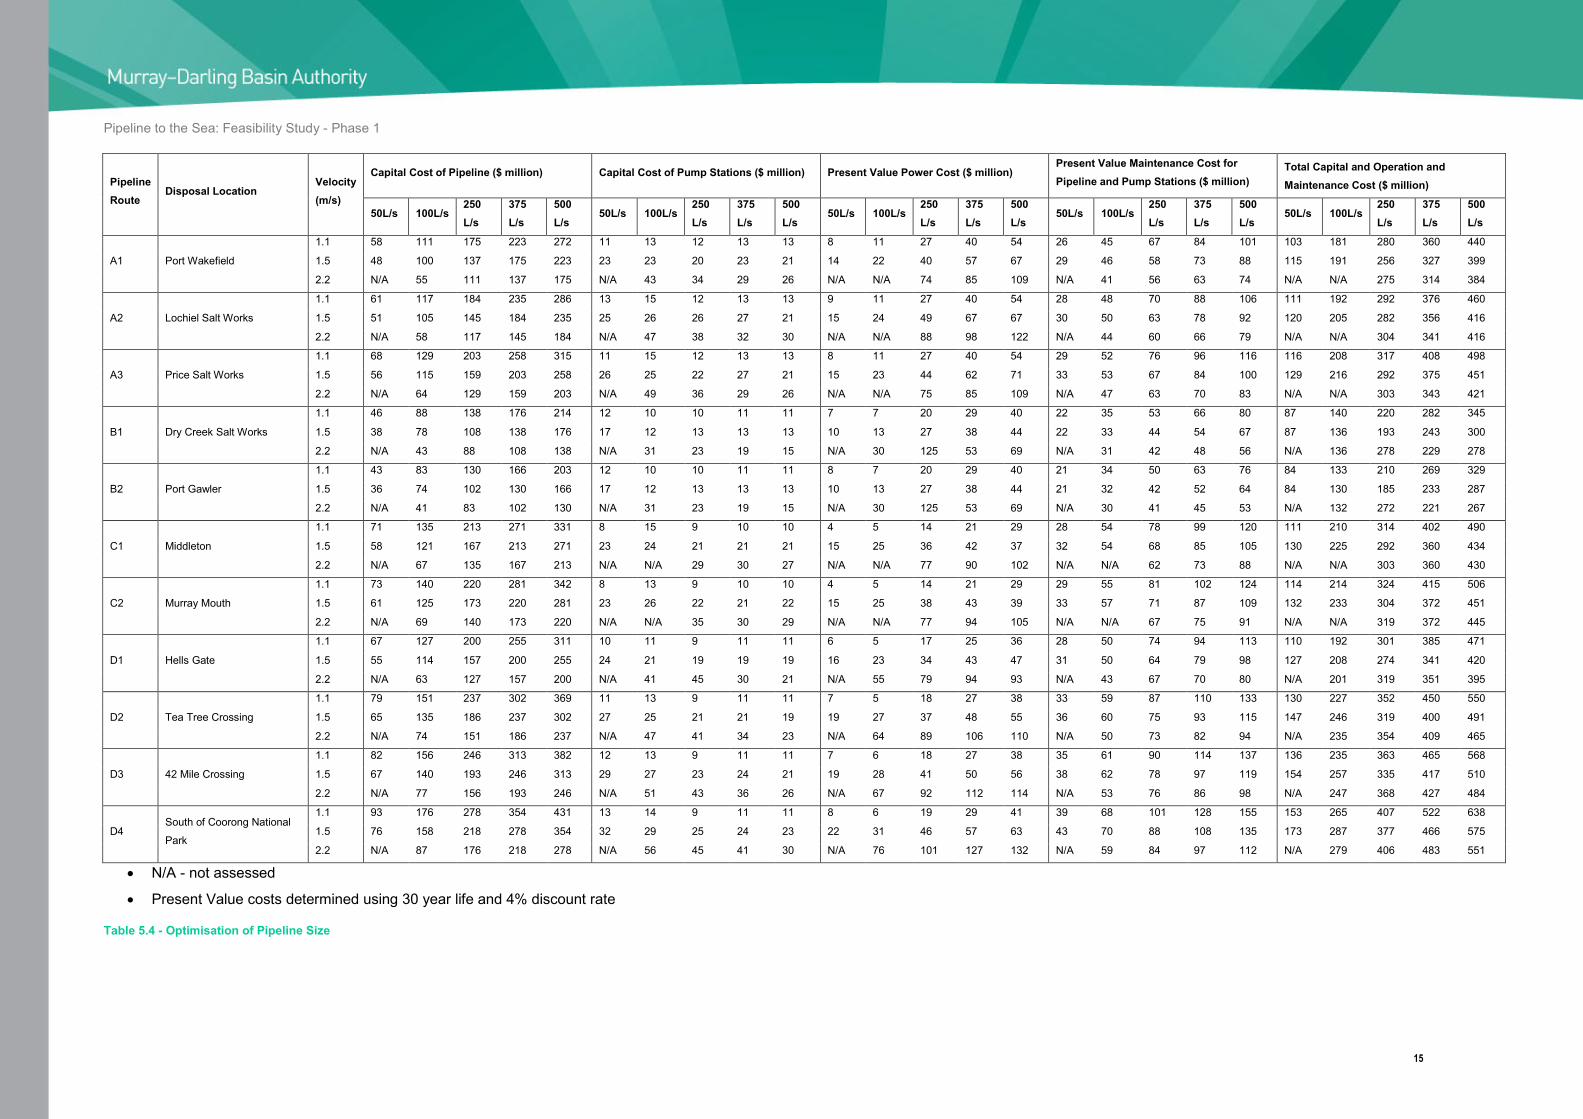
For each pipeline option, pipeline and pump station capital and annual costs were determined, as described in subsequent sections, and a total present value calculated to determine the least cost option. The range of costs calculated are presented in Table 5.4.

Pipeline to the Sea: Feasibility Study - Phase 1
13
Velocity (m/s)
Pipeline Diameter (mm)
50L/s 100L/s 250 L/s 375 L/s 500 L/s
1.1 250 375 525 675 750
1.5 200 300 450 525 675
2.2 N/A 225 375 450 525
• N/A = not assessed
Table 5.1 - Pipe Sizes Assessed for Different Velocities
It was found that for all options the minimum total present value cost of pipeline and pump stations for the 50 L/s scenario was obtained with velocities of 1.1 m/s. For the 500 L/s scenarios the minimum present value cost was obtained with velocities of 2.2 m/s. The ranges of optimum pipe sizes for all options are presented in Table 5.2.
Flow Rate (L/s) Optimum Pipe Diameter (mm)
50 250
100 300 for Options B1 & B2, 375 for others
250 450
375 450 for Options A1, A2, A3, B1, B2, C1 & C2, 525 for others
500 525
• (refer Table 4.1 for description of pipeline options)
Table 5.2 – Optimum Pipe Sizes
For the larger flow options, the higher velocities result in lower costs because the capital cost of the pipeline is the largest cost component of the scheme. It is therefore cost effective to reduce the pipeline cost by adopting a smaller diameter and incurring additional pumping costs due to

Pipeline to the Sea: Feasibility Study - Phase 1
14
increased velocity. However, for the smaller flow options, a reduction in pipe diameter causes greater proportional increases in pipe friction. This results in significant increases in the number of pump stations required and the increase in pump station and power costs are greater than the reduction in pipeline cost.
The pipeline pressure ratings and material costs that were adopted for this study are shown in Table 5.3.
Pipe Diameter (mm) Pipe Material Pressure Rating Supply cost ($/m)
200 PVC PN12 70
225 PVC PN12 80
250 PVC PN12 85
300 PVC PN12 145
375 GRP PN10 162
450 GRP PN10 200
525 GRP PN10 255
675 GRP PN10 325
750 GRP PN10 396
Table 5.3 – Pipe Details
Pipeline to the Sea: Feasibility Study - Phase 1
15
Pipeline Route
Disposal Location Velocity (m/s)
Capital Cost of Pipeline ($ million) Capital Cost of Pump Stations ($ million) Present Value Power Cost ($ million) Present Value Maintenance Cost for Pipeline and Pump Stations ($ million)
Total Capital and Operation and Maintenance Cost ($ million)
50L/s 100L/s 250 L/s
375 L/s
500 L/s
50L/s 100L/s 250 L/s
375 L/s
500 L/s
50L/s 100L/s 250 L/s
375 L/s
500 L/s
50L/s 100L/s 250 L/s
375 L/s
500 L/s
50L/s 100L/s 250 L/s
375 L/s
500 L/s
A1 Port Wakefield
1.1 58 111 175 223 272 11 13 12 13 13 8 11 27 40 54 26 45 67 84 101 103 181 280 360 440
1.5 48 100 137 175 223 23 23 20 23 21 14 22 40 57 67 29 46 58 73 88 115 191 256 327 399
2.2 N/A 55 111 137 175 N/A 43 34 29 26 N/A N/A 74 85 109 N/A 41 56 63 74 N/A N/A 275 314 384
A2 Lochiel Salt Works
1.1 61 117 184 235 286 13 15 12 13 13 9 11 27 40 54 28 48 70 88 106 111 192 292 376 460
1.5 51 105 145 184 235 25 26 26 27 21 15 24 49 67 67 30 50 63 78 92 120 205 282 356 416
2.2 N/A 58 117 145 184 N/A 47 38 32 30 N/A N/A 88 98 122 N/A 44 60 66 79 N/A N/A 304 341 416
A3 Price Salt Works
1.1 68 129 203 258 315 11 15 12 13 13 8 11 27 40 54 29 52 76 96 116 116 208 317 408 498
1.5 56 115 159 203 258 26 25 22 27 21 15 23 44 62 71 33 53 67 84 100 129 216 292 375 451
2.2 N/A 64 129 159 203 N/A 49 36 29 26 N/A N/A 75 85 109 N/A 47 63 70 83 N/A N/A 303 343 421
B1 Dry Creek Salt Works
1.1 46 88 138 176 214 12 10 10 11 11 7 7 20 29 40 22 35 53 66 80 87 140 220 282 345
1.5 38 78 108 138 176 17 12 13 13 13 10 13 27 38 44 22 33 44 54 67 87 136 193 243 300
2.2 N/A 43 88 108 138 N/A 31 23 19 15 N/A 30 125 53 69 N/A 31 42 48 56 N/A 136 278 229 278
B2 Port Gawler
1.1 43 83 130 166 203 12 10 10 11 11 8 7 20 29 40 21 34 50 63 76 84 133 210 269 329
1.5 36 74 102 130 166 17 12 13 13 13 10 13 27 38 44 21 32 42 52 64 84 130 185 233 287
2.2 N/A 41 83 102 130 N/A 31 23 19 15 N/A 30 125 53 69 N/A 30 41 45 53 N/A 132 272 221 267
C1 Middleton
1.1 71 135 213 271 331 8 15 9 10 10 4 5 14 21 29 28 54 78 99 120 111 210 314 402 490
1.5 58 121 167 213 271 23 24 21 21 21 15 25 36 42 37 32 54 68 85 105 130 225 292 360 434
2.2 N/A 67 135 167 213 N/A N/A 29 30 27 N/A N/A 77 90 102 N/A N/A 62 73 88 N/A N/A 303 360 430
C2 Murray Mouth
1.1 73 140 220 281 342 8 13 9 10 10 4 5 14 21 29 29 55 81 102 124 114 214 324 415 506
1.5 61 125 173 220 281 23 26 22 21 22 15 25 38 43 39 33 57 71 87 109 132 233 304 372 451
2.2 N/A 69 140 173 220 N/A N/A 35 30 29 N/A N/A 77 94 105 N/A N/A 67 75 91 N/A N/A 319 372 445
D1 Hells Gate
1.1 67 127 200 255 311 10 11 9 11 11 6 5 17 25 36 28 50 74 94 113 110 192 301 385 471
1.5 55 114 157 200 255 24 21 19 19 19 16 23 34 43 47 31 50 64 79 98 127 208 274 341 420
2.2 N/A 63 127 157 200 N/A 41 45 30 21 N/A 55 79 94 93 N/A 43 67 70 80 N/A 201 319 351 395
D2 Tea Tree Crossing
1.1 79 151 237 302 369 11 13 9 11 11 7 5 18 27 38 33 59 87 110 133 130 227 352 450 550
1.5 65 135 186 237 302 27 25 21 21 19 19 27 37 48 55 36 60 75 93 115 147 246 319 400 491
2.2 N/A 74 151 186 237 N/A 47 41 34 23 N/A 64 89 106 110 N/A 50 73 82 94 N/A 235 354 409 465
D3 42 Mile Crossing
1.1 82 156 246 313 382 12 13 9 11 11 7 6 18 27 38 35 61 90 114 137 136 235 363 465 568
1.5 67 140 193 246 313 29 27 23 24 21 19 28 41 50 56 38 62 78 97 119 154 257 335 417 510
2.2 N/A 77 156 193 246 N/A 51 43 36 26 N/A 67 92 112 114 N/A 53 76 86 98 N/A 247 368 427 484
D4 South of Coorong National
Park
1.1 93 176 278 354 431 13 14 9 11 11 8 6 19 29 41 39 68 101 128 155 153 265 407 522 638
1.5 76 158 218 278 354 32 29 25 24 23 22 31 46 57 63 43 70 88 108 135 173 287 377 466 575
2.2 N/A 87 176 218 278 N/A 56 45 41 30 N/A 76 101 127 132 N/A 59 84 97 112 N/A 279 406 483 551
• N/A - not assessed
• Present Value costs determined using 30 year life and 4% discount rate
Table 5.4 - Optimisation of Pipeline Size

Pipeline to the Sea: Feasibility Study - Phase 1
16
Pipe Material
As the water to be transferred from Stockyard Plain is highly saline and hence corrosive, metallic and concrete pipes are not considered appropriate. Plastic or fibreglass pipes are more resistant to corrosion and therefore are preferred materials. Based on indicative unit costs for different pipe materials from suppliers and other pipeline projects, it was found that PVC is the cheapest material for pipe sizes less than DN375, while glass reinforced pipe (GRP) is the cheaper material for pipe sizes greater than DN375.
Pipeline Cost
Pipeline capital costs were estimated for each pipeline option using the following equation;
Capital Cost
Cpipeline = f1 f2 M L
Where L = length of pipeline (m)
M = material cost of pipe ($/m)
f1 = allowance for pipe fittings
f2 = factor to account for labour and other costs
The factors f1 and f2 are based on assessment of other pipeline projects which Tonkin Consulting have been involved in, including the Wimmera Mallee Pipeline. It was found that the cost of pipeline fittings was about 10% of the cost of the pipe and that the total capital cost of the pipeline was equivalent to about 3 times the material cost of the pipeline and fittings.
It has been assumed that pipes are laid in road reserves outside of the formed road or track and therefore trench reinstatement does not specifically allow for any road pavement.
It has also been assumed that rivers and creeks would be crossed at existing bridges and the pipeline would be attached to the bridges. No allowance has been included for the extra over cost associated with the river crossings because the length of crossing is very small compared to the total pipeline length.
For the same reason, no allowance has been included in the cost estimate for road crossings. The pipelines are likely to cross roads at a number of locations to avoid sections of native vegetation, services or other significant features.

Pipeline to the Sea: Feasibility Study - Phase 1
17
All pipeline options, as selected, pass through towns or urban areas. The cost of pipelaying in these areas is greater than in rural areas but no allowance has been made for the additional cost because the f2 factor is somewhat subjective and it is considered that a factor of f2 = 3 includes some proportion of pipelaying in conditions more difficult than rural areas with no special trench reinstatement requirements.
The estimated capital costs for each pipeline alignment are presented in Table 5.5. For comparison purposes, the capital cost for the Port Wakefield, Port Gawler, Middleton and the four Coorong options are shown in Figure 5.1. The lowest cost option for the full range of flow scenarios is the pipeline to Port Gawler.
For all pipeline alignments it was assumed that the sub-surface conditions are the same. No attempt was made to investigate the differing geotechnical conditions along the various pipeline alignments.
0
50
100
150
200
250
300
0 50 100 150 200 250 300 350 400 450 500
Pipeline Capacity (L/s)
Cap
ital C
ost o
f Pip
elin
e ($
mill
ion)
A1 - Port WakefieldB2 - Port GawlerC1 - MiddletonD1 - Hell's GateD2 - Tea Tree CrossingD3 - 42 Mile CrossingD4 - South of Coorong National Park
Figure 5.1 – Pipeline Capital Costs
The annual maintenance cost for all pipeline options has been assumed to be equivalent to 2% of the pipeline capital cost.
Maintenance Cost

Pipeline to the Sea: Feasibility Study - Phase 1
18
Pipeline Route (Refer Table 4.1)
Pipeline Length (m)
Pipeline Capacity (L/s)
Pipe Diameter (mm)
Pipe Material
Material Cost ($/m)
Estimated Capital Cost ($ million)
A1 Port Wakefield
210 50 250 PVC 85 58 100 375 GRP 162 111 250 450 GRP 200 137 375 450 GRP 200 137 500 525 GRP 255 175
A2 Lochiel Salt Works
220 50 250 PVC 85 61 100 375 GRP 162 117 250 450 GRP 200 145 375 450 GRP 200 145 500 525 GRP 255 184
A3 Price Salt Works
240 50 250 PVC 85 68 100 375 GRP 162 129 250 450 GRP 200 159 375 450 GRP 200 159 500 525 GRP 255 203
B1 Dry Creek Salt Works
165 50 250 PVC 85 46 100 300 PVC 145 79 250 450 GRP 200 108 375 450 GRP 200 108 500 525 GRP 255 138
B2 Port Gawler
155 50 250 PVC 85 43 100 300 PVC 145 74 250 450 GRP 200 102 375 450 GRP 200 102 500 525 GRP 255 130
C1 Middleton
255 50 250 PVC 85 71 100 375 GRP 162 135 250 450 GRP 200 167 375 450 GRP 200 167 500 525 GRP 255 213
C2 Murray Mouth
260 50 250 PVC 85 73 100 375 GRP 162 140 250 450 GRP 200 173 375 450 GRP 200 173 500 525 GRP 255 220
D1 Hells Gate
240 50 250 PVC 85 67 100 375 GRP 162 127 250 450 GRP 200 157 375 525 GRP 255 200 500 525 GRP 255 200
D2 Tea Tree Crossing
280 50 250 PVC 85 79 100 375 GRP 162 151 250 450 GRP 200 186 375 525 GRP 255 237 500 525 GRP 255 237
D3 42 Mile Crossing
290 50 250 PVC 85 82 100 375 GRP 162 156 250 450 GRP 200 193 375 525 GRP 255 246 500 525 GRP 255 246
D4 South of Coorong National Park
330 50 250 PVC 85 93 100 375 GRP 162 176 250 450 GRP 200 218 375 525 GRP 255 278 500 525 GRP 255 278
Table 5.5 – Pipeline Capital Costs

Pipeline to the Sea: Feasibility Study - Phase 1
19
Pump Stations
Number of Pump Stations
To determine the number of pump stations required along each pipeline alignment the following three different pump sizes were considered;
• Type 1 – duty flow at 30 m head
• Type 2 – duty flow at 50 m head
• Type 3 – duty flow at 100 m head
The number of pump stations for each alignment was determined by considering pipeline friction and site elevation, using the longitudinal sections shown in Figure 4.2. The pipeline friction assumed for each different pipeline capacity and velocity is given in Table 5.6.
Pipeline Capacity (L/s)
Pipeline Velocity (m/s)
1.1 1.5 2.2
50 3 7.5 Not assessed
100 1 5.4 13
250 1.3 3 7.5
375 1.3 2.5 6
500 1.4 2 5
Table 5.6 – Pipeline Friction (m/km) for Different Pipeline Capacities and Velocities
The number of each different pump station type estimated for the optimum pipeline/pump station configuration for each pipeline option is listed in Table 5.7 to Table 5.11. Schematic drawings for each pipeline alignment are included in Appendix D. The drawings show the number and location of pump stations and tanks as well as the conceptual pipework configuration at each site for the 1.1 m/s velocity scenarios.

Pipeline to the Sea: Feasibility Study - Phase 1
20
Pipeline Route (Refer
Table 4.1)
Number of Pump Stations
Type 1 Type 2 Type 3
A1 7 1 1
A2 7 2 2
A3 7 1 1
B1 6 2 2
B2 6 2 2
C1 6 0 0
C2 6 0 0
D1 6 1 1
D2 7 1 1
D3 7 1 2
D4 8 1 2
Table 5.7 – Number of Pump Stations for Each Pipeline Option (50 L/s)

Pipeline to the Sea: Feasibility Study - Phase 1
21
Pipeline Route (Refer
Table 4.1)
Number of Pump Stations
Type 1 Type 2 Type 3
A1 6 1 0
A2 6 2 0
A3 6 1 1
B1 6 0 0
B2 6 0 0
C1 5 2 1
C2 5 2 0
D1 3 2 1
D2 3 3 1
D3 3 3 1
D4 3 3 2
Table 5.8 – Number of Pump Stations for Each Pipeline Option (100 L/s)
Pipeline Route (Refer
Table 4.1)
Number of Pump Stations
Type 1 Type 2 Type 3
A1 7 2 2
A2 8 4 2
A3 8 2 2
B1 6 0 1
B2 6 0 1
C1 8 2 1
C2 8 2 2
D1 8 1 1
D2 9 1 1
D3 10 1 1
D4 11 1 1
Table 5.9 – Number of Pump Stations for Each Pipeline Option (250 L/s)

Pipeline to the Sea: Feasibility Study - Phase 1
22
Pipeline Route (Refer
Table 4.1)
Number of Pump Stations
Type 1 Type 2 Type 3
A1 10 1 3
A2 11 1 3
A3 10 1 3
B1 8 0 1
B2 8 0 1
C1 9 4 1
C2 9 4 1
D1 7 1 1
D2 8 1 1
D3 9 1 1
D4 9 1 1
Table 5.10 – Number of Pump Stations for Each Pipeline Option (375 L/s)
Pipeline Route (Refer
Table 4.1)
Number of Pump Stations
Type 1 Type 2 Type 3
A1 9 2 1
A2 10 3 0
A3 9 2 1
B1 7 0 0
B2 7 0 0
C1 9 1 3
C2 9 1 4
D1 7 2 1
D2 8 2 1
D3 9 2 1
D4 11 2 1
Table 5.11 – Number of Pump Stations for Each Pipeline Option (500 L/s)

Pipeline to the Sea: Feasibility Study - Phase 1
23
Pump Station Cost
For costing purposes it has been assumed that each pump station consists of the following components;
Capital Cost
• Dedicated building with portal frame, metal clad construction, acoustically lined with
adequate ventilation to suit the electrical equipment installed.
• 2 duty pumps and 1 standby pump.
• Pump to be axial split case dry well horizontal spindle mounted.
• Pumps manufactured from corrosion resistant materials, specifically stainless steel
materials SAF 2205 or 904L as minimum corrosion resistance grades.
• All pumps to operate on variable speed drives.
• Dedicated priming system to ensure pumps are primed and ready for operation as required.
Priming system to consist of tank, vacuum pump, controls, valving & pipework.
• Pumps to be linked via a common manifold with manual valve selection and control.
• Pigging point for pipeline cleaning.
• Tanks and pump stations to be isolatable.
• Series of surge vessels to limit water hammer.
• All valves to be gate type suitable for pigging.
• Balancing tanks to be lined concrete tanks without roofs. Typical SA Water detail. Two
separately isolated tanks at each site.
The estimated unit cost for each different pump station and tank size required for the full range of pipeline options considered is given in Table 5.12. The total capital cost for pump stations and tanks for each pipeline option was estimated by multiplying the unit costs by the number of pump stations and tanks listed in
Table 5.7. The resultant costs are presented in Table 5.13.
Pipeline Capacity (L/s)
Pump Station Cost ($ million)
Type 1 Type 2 Type 3
50 1.264 1.128 1.02
100 & 250 1.945 1.735 1.57
375 & 500 2.205 1.971 1.814
Table 5.12 – Unit Cost for each Different Pump Station

Pipeline to the Sea: Feasibility Study - Phase 1
24
Pipeline Route
Pipeline Capacity (L/s)
Estimated Capital Cost ($ million)
Pipeline Route
Pipeline Capacity (L/s)
Estimated Capital Cost ($ million)
A1 Port Wakefield
50 11.0 C1 Middleton
50 7.6
100 13.4 100 14.8
250 20.2 250 20.6
375 29.5 375 29.5
500 25.6 500 27.3
A2 Lochiel Salt Works
50 13.1 C2 Murray Mouth
50 7.6
100 15.1 100 13.2
250 25.6 250 22.2
375 31.7 375 29.5
500 29.8 500 29.1
A3 Price Salt Works
50 11.0 D1 Hells Gate
50 9.7
100 15.0 100 10.9
250 22.2 250 18.9
375 29.5 375 19.2
500 25.6 500 21.2
B1 Dry Creek Salt Works
50 11.9 D2 Tea Tree Crossing
50 11.0
100 11.7 100 12.6
250 13.2 250 20.8
375 19.5 375 21.4
500 15.4 500 23.4
B2 Port Gawler
50 11.9 D3 42 Mile Crossing
50 12.0
100 11.7 100 12.6
250 13.2 250 22.8
375 19.5 375 23.6
500 15.4 500 25.6
D4 South of Coorong National Park
50 13.3
100 14.2
250 24.7
375 23.6
500 30.0
Table 5.13 – Pump Station Capital Costs

Pipeline to the Sea: Feasibility Study - Phase 1
25
Operating Cost
All pump stations are assumed to be electrically powered with the power requirement defined by the following equation;
P = ρ g Q (f D + H)/μ
Where P = power (MW)
ρ = density of pumped water (kg/L)
g = standard gravity (9.81 m/s²)
Q = pipeline discharge (m³/s)
f = pipe friction (m/km)
D = pumped distance (km)
H = total static lift along pipeline route (m)
μ = combined pump and motor efficiency (assumed to be 0.75)
The density of the pumped water was varied to account for the increase in salinity for the options where the Stockyard Plain Basin water is concentrated. The adopted densities for the range of salinities considered are given in Table 5.14.
Salinity of Pumped Water (mg/L)
Density (kg/L)
20 000 1.05
60 000 1.11
100 000 1.15
Table 5.14 – Density of Pumped Water
Pipe friction used in the estimation of pumping costs were as listed in Table 5.6 and used in the determination of the number and location of pump stations.

Pipeline to the Sea: Feasibility Study - Phase 1
26
The power calculated from the above equation was converted to an annual pumping figure by assuming an average of 20 hours pumping per day over a year. The cost of the annual power was estimated by assuming an electricity cost of 10 cents/kWhr. It is considered that for a scheme of the magnitude contemplated, SA Water could negotiate a lower electricity cost than the 10 cents/kWhr assumed. The computed annual operating costs for each pipeline option and different salinity option are shown in Table 5.15.
Pipeline Route
Salinity of Pumped Water
20,000 mg/L 60,000 mg/L 100,000 mg/L
Pipeline Capacity (L/s) Pipeline Capacity Pipeline Capacity
50 100 250 375 500 50 100 250 375 500 50 100 250 375 500
A1 0.46 0.63 2.32 4.89 6.32 0.48 0.67 2.45 5.17 6.68 0.50 0.69 2.54 5.36 6.92
A2 0.50 0.65 2.82 5.68 7.07 0.53 0.69 2.98 6.01 7.48 0.55 0.71 3.08 6.22 7.75
A3 0.47 0.66 2.57 4.89 6.32 0.50 0.70 2.72 5.17 6.68 0.52 0.73 2.81 5.36 6.92
B1 0.43 0.75 1.57 3.09 3.96 0.45 0.79 1.66 3.26 4.19 0.47 0.82 1.72 3.38 4.34
B2 0.44 0.75 1.57 3.09 3.96 0.47 0.79 1.66 3.26 4.19 0.48 0.82 1.72 3.38 4.34
C1 0.22 0.30 2.06 5.23 5.92 0.23 0.32 2.17 5.53 6.26 0.24 0.33 2.25 5.73 6.48
C2 0.22 0.31 2.17 5.46 6.04 0.23 0.33 2.29 5.77 6.39 0.24 0.34 2.38 5.97 6.62
D1 0.34 0.27 1.94 2.47 5.37 0.36 0.29 2.05 2.62 5.67 0.37 0.30 2.13 2.71 5.88
D2 0.40 0.31 2.13 2.80 6.37 0.42 0.33 2.25 2.96 6.73 0.43 0.34 2.33 3.07 6.98
D3 0.41 0.32 2.36 2.90 6.62 0.43 0.34 2.49 3.06 7.00 0.45 0.35 2.58 3.17 7.25
D4 0.47 0.36 2.66 3.27 7.62 0.50 0.38 2.81 3.46 8.06 0.52 0.40 2.91 3.58 8.35
Table 5.15 – Annual Pump Station Operational Cost ($ million)

Pipeline to the Sea: Feasibility Study - Phase 1
27
Maintenance Cost
The annual pump station maintenance cost for all pipeline options has been assumed to be equivalent to 3% of the pump station capital cost.
Discussion
For all options the capital cost of the pipeline is much greater than the capital cost of the pump stations. For the Port Gawler and Dry Creek options the cost of the pump stations is 10% to 25% of the pipeline cost, while for the options which discharge to the Southern Ocean the cost of the pump stations is 10% to 15% of the pipeline cost.
To compare the operating cost of the pump stations to the pipeline capital cost a present value cost of the annual operating cost has been determined using a 30 year period and 4% discount rate. Based on these assumptions, the operating cost for the Port Gawler and Dry Creek options is 20% to 50% of the pipeline cost. For the pipeline options which outfall to the Southern Ocean the operating cost is between 10% and 15% of the pipeline cost, depending upon the pipeline capacity. The lower percentage for the Southern Ocean options reflects the lower pump head required as the pipeline routes do not traverse the Mt Lofty Ranges. It is also partly due to the higher pipeline costs for these options.
The pipeline cost for the Port Wakefield option is about 25% greater than the Port Gawler option. The Port Wakefield option also has slightly higher pump station and operating costs. Initial consideration of the marine outfall for both locations indicated that discharge to the top of Gulf St Vincent was less preferred than discharge to the gulf at Port Gawler. Based on these findings it was considered that the Port Wakefield options had no advantage over the Port Gawler options and therefore the Port Wakefield pipeline alignment was not pursued further.
Off Peak Pumping
In Section 5.3.2.2 an electricity cost of 10 cents/kWhr was assumed for a pumping period of 20 hours per day. If pumping was limited to off-peak periods, a lower rate could be used. Based on current SA Water tariffs, the off-peak electricity tariff rate is approximately 75% of the flat rate. Therefore, for this study an off-peak rate of 7.5 cents/kWhr has been assumed.
The current off-peak period is from 9:00 pm to 7:00 am during week days and all day on weekends. This gives 98 hours of off-peak period during a normal week and 70 hours of peak period. The off-peak period is 58% of the seven day week or equivalent to about 14 hours per day.
To determine if off-peak pumping is cost effective, the 100 L/s pipeline option to Port Gawler was considered as an example. If off-peak pumping was adopted, the pump and pipeline capacity would have to be increased by 42% (i.e. 20/14) to transfer the same salt load as the 100 L/s pumping 20 hours per day.

Pipeline to the Sea: Feasibility Study - Phase 1
28
Using the pipeline capital costs from Table 5.5 a cost for a 142 L/s pipeline was interpolated to be $81.8 million. This is $7.8 million more than the 100 L/s pipeline. Similarly, power costs were estimated for off-peak pumping for the 100 L/s and 250 L/s options and a value of $355 000/year interpolated for the 142 L/s option.
The annual power costs were converted to a present value cost assuming a 30 year period and 4% discount rate. For the 100 L/s option the present value power cost is $6.8 million while for the 142 L/s option the present value power cost is $5.1 million.
These figures indicate that if an off-peak pumping philosophy was adopted, the same salt load could be transferred from the Stockyard Plain Basin at a power cost saving of $1.7 million (present value). However, to achieve this saving it is necessary to spend an additional $7.8 million to provide a larger pipeline. Therefore, off-peak pumping is not considered to be cost effective. This is because the power costs are much smaller than the pipeline costs and hence the saving in power cost is less than the incremental pipeline cost.
Energy Recovery
The longitudinal sections shown in Figure 4.2 highlight significant sections where gravity flow could occur. For these sections it may be possible to recovery energy and therefore offset the operating costs of the pump stations.
It is considered that the differential head for most of the gravity sections is relatively small and therefore would not result in useful energy recovery. It has been assumed that the head difference between adjacent tanks is used to overcome friction in the section of pipeline between the tanks and therefore there would not be sufficient energy to be economically recovered. Although energy recovery is unlikely to be viable under the assumed operating conditions it may be economical to adopt a different operating strategy which allows for energy recovery. Without more detailed hydraulic modelling it is not possible to determine the likelihood of energy recovery nor assess its feasibility.
Open Channels
The longitudinal sections shown in Figure 4.2 highlight that all options considered have significant sections where gravity can be used to transfer the saline groundwater. There is therefore opportunity to use open channels for the disposal of saline groundwater rather than pressure pipeline. It is assumed that pipelines will be a more socially and environmentally acceptable option than open channels and therefore no detailed investigation into the use of open channels have been undertaken for this report.
Open channels are likely to require lining to limit seepage to acceptable levels and therefore may not be significantly cheaper than a pipeline. For maintenance purposes an open channel is likely to have a constructed bed width of approximately two metres. Additionally, larger channels can be excavated more economically than smaller channels because of the greater efficiency obtained by

Pipeline to the Sea: Feasibility Study - Phase 1
29
using larger machinery. The resultant capacity of the open channel is therefore likely to be much greater than required. Preliminary costs for an open channel lined with HDPE liner indicate $100/m to $200/m with the excavation cost small compared to the cost of the liner and very much dependent upon local topographic variations.
It is considered that the above costs are applicable to the full range of flow options assessed in this study because the channel will be over-sized. For this reason, open channels will be more attractive for the larger flow options.
Other factors to consider with open channels are the cost of crossings required to access adjacent properties, the hazard to vehicular traffic on adjacent roads and the barrier to fauna movement.
It is expected that should this project proceed to a detailed design phase, further investigation of the use of open channels could be undertaken.
ETSA Upgrade
Indicative pump station locations for the Port Gawler, Middleton and Coorong options were provided to ETSA Utilities to assess the potential upgrade of the existing electricity network that would be required to supply power to the three options. The estimated loads for each pump station for the 100 L/s and 375 L/s options were provided to ETSA. The speculative prices received from ETSA Utilities for these options are listed in Table 5.17. The prices include augmentation but do not include any Distribution Use of System Rebate.
The power upgrade costs for the 250 L/s options were estimated by averaging the costs for the 100 L/s and 250 L/s options. Costs for the 50 L/s and 500 L/s options were estimated by subjective extrapolation of the costs obtained for the 100 L/s and 250 L/s options. The estimated power upgrade costs adopted are presented in Table 5.16.
Pipeline Option Estimated Capital Cost to Upgrade Electricity Network ($ million)
50 L/s 100 L/s 250 L/s 375 L/s 500 L/s
Dry Creek and Port Gawler 9.8 10.12 10.81 11.5 12.0
Middleton and Murray Mouth 2.07 2.27 3.26 4.25 5.01
Hells Gate, Tea Tree Crossing & Southern Lagoon of the Coorong
2.1 2.37 3.47 4.57 5.4
42 Mile Crossing, South of Coorong National Park & Morella Basin
10.6 10.97 12.12 13.27 14.2
Table 5.16 - Power Upgrade Costs

Pipeline to the Sea: Feasibility Study - Phase 1
30
The cost estimates provided by ETSA Utilities do not allow for backup supplies or redundancy to the proposed pump station sites. In the event of equipment failure on the distribution network, supply may be interrupted for up to 48 hours at an individual connection site. If a more secure supply is required there would be significant cost increases.
The assessment of the capacity of the existing distribution network to cater for the pump stations required for the pipeline to the sea options highlighted two major deficiencies. Firstly, there is inadequate power south of Meningie which impacts on the Coorong pipeline options. Secondly, the area west of Blanchetown requires significant upgrade for the Port Gawler pipeline options.
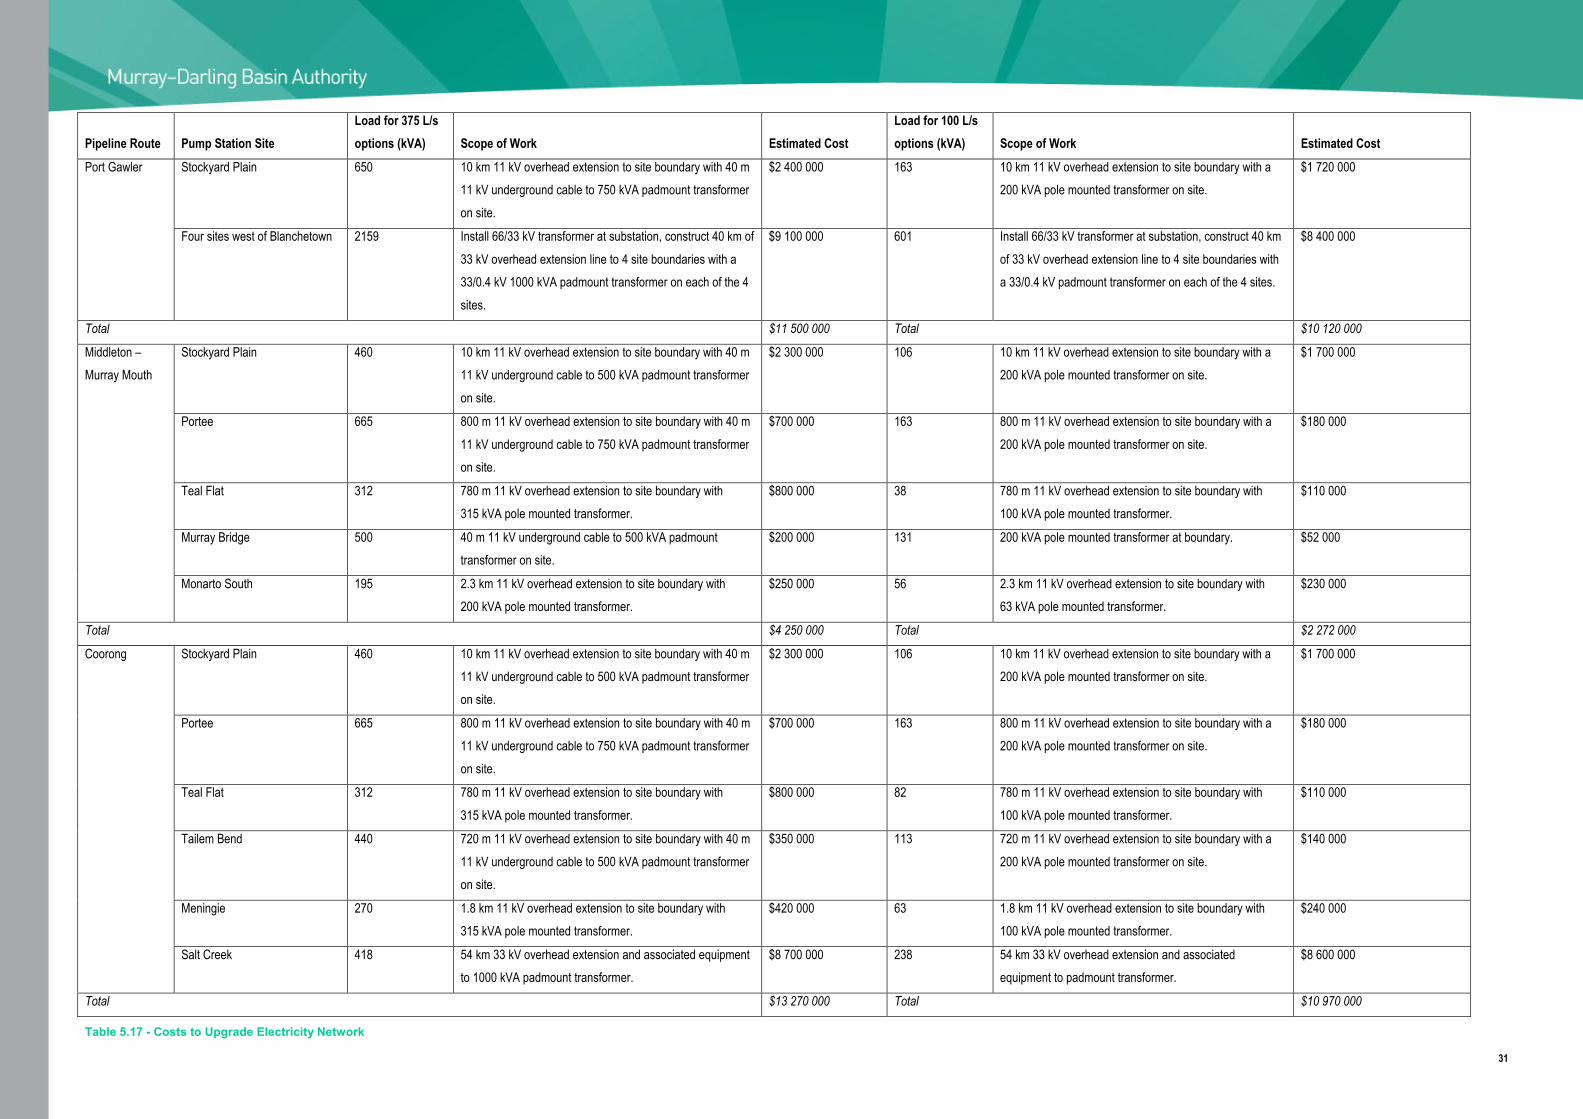
31
Pipeline Route Pump Station Site Load for 375 L/s options (kVA) Scope of Work Estimated Cost
Load for 100 L/s options (kVA) Scope of Work Estimated Cost
Port Gawler Stockyard Plain 650 10 km 11 kV overhead extension to site boundary with 40 m 11 kV underground cable to 750 kVA padmount transformer on site.
$2 400 000 163 10 km 11 kV overhead extension to site boundary with a 200 kVA pole mounted transformer on site.
$1 720 000
Four sites west of Blanchetown 2159 Install 66/33 kV transformer at substation, construct 40 km of 33 kV overhead extension line to 4 site boundaries with a 33/0.4 kV 1000 kVA padmount transformer on each of the 4 sites.
$9 100 000 601 Install 66/33 kV transformer at substation, construct 40 km of 33 kV overhead extension line to 4 site boundaries with a 33/0.4 kV padmount transformer on each of the 4 sites.
$8 400 000
Total $11 500 000 Total $10 120 000
Middleton – Murray Mouth
Stockyard Plain 460 10 km 11 kV overhead extension to site boundary with 40 m 11 kV underground cable to 500 kVA padmount transformer on site.
$2 300 000 106 10 km 11 kV overhead extension to site boundary with a 200 kVA pole mounted transformer on site.
$1 700 000
Portee 665 800 m 11 kV overhead extension to site boundary with 40 m 11 kV underground cable to 750 kVA padmount transformer on site.
$700 000 163 800 m 11 kV overhead extension to site boundary with a 200 kVA pole mounted transformer on site.
$180 000
Teal Flat 312 780 m 11 kV overhead extension to site boundary with 315 kVA pole mounted transformer.
$800 000 38 780 m 11 kV overhead extension to site boundary with 100 kVA pole mounted transformer.
$110 000
Murray Bridge 500 40 m 11 kV underground cable to 500 kVA padmount transformer on site.
$200 000 131 200 kVA pole mounted transformer at boundary. $52 000
Monarto South 195 2.3 km 11 kV overhead extension to site boundary with 200 kVA pole mounted transformer.
$250 000 56 2.3 km 11 kV overhead extension to site boundary with 63 kVA pole mounted transformer.
$230 000
Total $4 250 000 Total $2 272 000
Coorong Stockyard Plain 460 10 km 11 kV overhead extension to site boundary with 40 m 11 kV underground cable to 500 kVA padmount transformer on site.
$2 300 000 106 10 km 11 kV overhead extension to site boundary with a 200 kVA pole mounted transformer on site.
$1 700 000
Portee 665 800 m 11 kV overhead extension to site boundary with 40 m 11 kV underground cable to 750 kVA padmount transformer on site.
$700 000 163 800 m 11 kV overhead extension to site boundary with a 200 kVA pole mounted transformer on site.
$180 000
Teal Flat 312 780 m 11 kV overhead extension to site boundary with 315 kVA pole mounted transformer.
$800 000 82 780 m 11 kV overhead extension to site boundary with 100 kVA pole mounted transformer.
$110 000
Tailem Bend 440 720 m 11 kV overhead extension to site boundary with 40 m 11 kV underground cable to 500 kVA padmount transformer on site.
$350 000 113 720 m 11 kV overhead extension to site boundary with a 200 kVA pole mounted transformer on site.
$140 000
Meningie 270 1.8 km 11 kV overhead extension to site boundary with 315 kVA pole mounted transformer.
$420 000 63 1.8 km 11 kV overhead extension to site boundary with 100 kVA pole mounted transformer.
$240 000
Salt Creek 418 54 km 33 kV overhead extension and associated equipment to 1000 kVA padmount transformer.
$8 700 000 238 54 km 33 kV overhead extension and associated equipment to padmount transformer.
$8 600 000
Total $13 270 000 Total $10 970 000
Table 5.17 - Costs to Upgrade Electricity Network

Pipeline to the Sea: Feasibility Study - Phase 1
32
6. Marine Outfalls
General
This section describes the ecosystems surrounding the potential discharge locations for the saline water from the Stockyard Plain Basin. Throughout this section the terminology used by the South Australian marine regionalisation project in the development of the Marine Protected Areas (Edyvane and Baker, 1995) has been adopted.
As discussed in Section 4.2, eight marine outfall locations were identified for consideration. These outfalls are located within the Gulf St Vincent and Coorong marine bioregions. A marine bioregion is a biogeographic region containing distinctly recognisable patterns of biodiversity and is typically hundreds of square kilometres in size. The Coorong marine bioregion contains flora and fauna which have adapted to the cold, exposed waters of the lower south-east and are distinct from the flora and fauna of the warmer, sheltered waters of the upper Gulf St Vincent.
Marine bioregions are subdivided into biounits. Biounits are delineated on the basis of major coastal physiographic features and the representation and distribution of major marine habitats and are typically tens of square kilometres in size.
A desktop study of the implications of the discharge of saline water from the Stockyard Plain Basin on the marine ecosystems at the outfall locations was undertaken by Natural Resource Services (NRS). A separate report of the study has been prepared (NRS, 2007) while a summary of key findings are presented in the following sections.
Of the 8 outfall locations, the southern three, along the Coorong, have been jointly assessed as they are all considered to be similar at the level of detail for this study.

Pipeline to the Sea: Feasibility Study - Phase 1
33
Ecosystems at Outfall Locations
Port Wakefield
Port Wakefield is to the north of the Clinton Biounit within the Gulf St Vincent Bioregion. Important physical and oceanographic characteristics of the region are:
Regional Description
• Confined “inverse estuary”, characterised by relatively high mean salinities (ranging from
35.5 to 42.0 ppt) and temperatures (up to 26oC and higher, in summer);
• Low wave energy; oceanographically “sheltered” coastline; weak currents, and extensive
area of “quiet water” shallows;
• Clockwise water circulation, with a seasonal outflow of saline water in a gravity current on
their eastern sides, from April to December each year;
• Large tidal range with a horizontal extent of at least 100m in some areas. Also, periods of
“dodge” tide (when semi-diurnal and diurnal tide components show little variation over a 24
hr period);
• Input of suspended carbonate matter (carbonate sediment coming from coralline algae in
seagrass beds, benthic and epiphytic foraminifera) from the south, which is transported
northwards to the upper gulf area, resulting in turbid upper gulf waters;
• Long-shore drift, resulting in accumulation of sediments in the upper gulf area.
The region includes the largest tidal wetland and mangrove ecosystem in Gulf St Vincent and the second largest in Australia, covering approximately 20 000 hectares. It also includes the largest area of seagrass meadows in Gulf St Vincent (approximately 132 500 Ha), and the second largest in South Australia (Edyvane 1999).
Benthic habitats/flora
The intertidal area seaward of the supratidal samphire zone is dominated by extensive sand, mud flats and areas covered by the mangrove Avicennia marina which are more than half a kilometre wide on the north-eastern side of the gulf.
Mudflats in the region are mostly bare; with the exception of the blue-green algae Oscillatoria and a rich community of diatoms. Macroalgae are found in some areas.
The mangrove areas and bare intertidal mud and sand flats grade into intertidal Zostera seagrass growing at slightly lower depths and extending into the sublittoral.

Pipeline to the Sea: Feasibility Study - Phase 1
34
The mudflats contain gastropods such as species of Bembicium, Salinator and Austrocochlea; bivalves such as species of Modiolus; and species of the cockle Katelysia. Abundant razorfish are found in the area and provide a “micro-reef” habitat by housing a “rich epizoic assemblage” e.g. small sponges, ascidians, bryozoa and tube worms and provide the hard substrate required for some species to settle in areas of limited hard substrate (e.g. muddy and sandy sediments). There is also a high abundance of other estuarine invertebrate groups including various worms, small crabs and other crustaceans.
Fauna
Bryars (2003) identified key fisheries habitat for a number of species in the region, between Port Clinton and the Firing Range, and these are summarised in Appendix A. The Port Wakefield area is one of the most important in Gulf St Vincent in terms of numbers of post-larval and juvenile prawns settling into the shallows. The region also has an abundance of smaller prawn species in the shallow seagrass beds and these are a major seasonal food source for a number of fish species. The seagrass beds in the area are also important for Garfish reproduction during the spawning season.
Fisheries
Northern Gulf St Vincent has been proposed as one of 19 areas to become multiple use marine parks within the SA Representative System of Marine Park Areas. The precise boundaries are yet to be determined, but it is highly likely that this marine park would include Port Wakefield.
Conservation Significance
Clinton Conservation Park is an area of international importance for shorebirds and is listed as a Wetland of National Importance and is on the Register of the National Estate. It is one of the major undisturbed mangrove and saltmarsh associations in the State and also contains dense seagrass.
The mangrove and seagrass habitats are considered by Edyvane (1999) to be of National significance. Baker (2004) states that the saltmarsh, mudflat, sandflat, mangrove and seagrass habitats in the area have outstanding ecological significance and are recognised as important contributors to the biological productivity and ecological functioning of Gulf St Vincent, particularly the northern gulf.
In general, the whole of the intertidal and supratidal area of northern and north-eastern Gulf St Vincent provides key habitat for local and migratory wading, coastal, and sea birds as well as important breeding areas for some coastal bird species. Baker (2004) notes the following fish species of conservation significance in the upper Gulf St Vincent;
• the tropical species Sargassum decurrens,
• Congolli Pseudaphritis urvillii, which uses both marine and freshwater, has been classed as
a species of conservation concern in South Australia due to the severe reductions in the
quality and quantity of preferred habitat. The Department for Environment and Heritage

Pipeline to the Sea: Feasibility Study - Phase 1
35
have recommended that the species be listed as Rare, under a schedule of the National
Parks and Wildlife Act 1972.
• The endemic Magpie Fiddler Ray Trygonorrhina melaleuca,
• Young Bronze Whaler Sharks,
• Pipefish (Syngnathidae family),
• Fish in the Clinidae and Apogonidae families.
Port Gawler
The Port Gawler area is towards the southern end of the Clinton Biounit within the Gulf St Vincent Bioregion and has similar physical and oceanographic characteristics to those described for Port Wakefield in Section
Regional Description
6.2.1.1.
The region includes the largest tidal wetland and mangrove ecosystem in Gulf St Vincent and the second largest in Australia, covering approximately 20 000 hectares. It also includes the largest area of seagrass meadows in Gulf St Vincent (approximately 132 500 Ha), and the second largest in South Australia (Edyvane 1999).
Benthic habitats/flora
There is extensive low gradient supratidal and intertidal samphire/saltmarsh habitat at Port Gawler, including both vegetated areas and bare saline flat. There are also sand beaches, dunes, and extensive areas of stranded beach ridges of shelly and swampy deposits, extending inland up to 2 km. The intertidal area seaward of the samphire zone is dominated by extensive sand and mud flats, backed by the mangrove Avicennia marina, extending inland to approximately 2 km in some places, dissected by tidal channels and creeks. Some of the large areas of intertidal sandflats, shallow subtidal and mudflats are colonised by Zostera seagrass species, which dominate the substrate in some of the more sandy areas. Otherwise, mudflats in the region are mostly bare; with the exception of the blue-green algae Oscillatoria and a rich community of diatoms. Macroalgae are found in some areas.
The mangrove areas and bare intertidal mud and sand flats grade into intertidal Zostera seagrass growing at slightly lower depths, extending into the sublittoral. Posidonia australis is the most common seagrass in the subtidal area, but Amphibolis antarctica also occurs. Extensive benthic seagrass meadows of Posidonia and Amphibolis species were previously recorded in waters to approximately 10m – 15m deep but are now degraded. Subtidal sand habitats are also present, as

Pipeline to the Sea: Feasibility Study - Phase 1
36
are small areas of calcareous/consolidated shell substrate, supporting mixed macroalgae and invertebrate assemblages.
Mudflats contain gastropods such as species of Bembicium, Salinator and Austrocochlea; bivalves such as species of Modiolus; species of the cockle Katelysia, and Pinna bicolor (Razorfish) are also common. There is also a high abundance of other estuarine invertebrate groups e.g. worms, small crab species and other small macro-crustaceans, and micro crustacea.
Fauna
Bryars (2003) identified key fisheries habitat for a number of species in the region, and these are summarised in Appendix A. Port Gawler and Buckland Park have been identified as nursery areas for thirteen fish and crustacean species, most of which are commercially and/or recreationally significant.
Fisheries
As discussed in Section
Conservation Significance
6.2.1.5 the Northern Gulf St Vincent has been proposed as a multiple use marine park but the precise boundaries have not yet been determined. It is likely that this marine park would include Port Gawler.
The St Kilda – Chapman Creek Aquatic Reserve was established for the conservation of mangrove and seagrass communities and the protection of nursery areas for major commercial and recreational fish species. It provides a buffer area between commercial fishing activity and the Barker Inlet Aquatic Reserve. The samphire-mangrove-mudflat ecosystem is an important and highly productive part of the nearshore marine food web in the northern areas of Gulf St Vincent. The ecosystem provides shelter and breeding areas for many animal groups, stabilises coastal sediments and protects the coast from storm surge damage.
The Port Gawler Conservation Park (418 ha) is situated at the Gawler River delta. The Port Gawler area is a significant estuarine habitat for the Gawler River, consisting of extensive tidal flats (shelly silts, clays, and sands) and fringing mangrove forests that are crossed by a multitude of tidal channels. The mangroves at Port Gawler are more than 1km wide, backed by intertidal and supratidal samphires. Shellgrit ridges (stranded beach deposits) occur along a belt within the mangrove forest. The sub-littoral / shallow subtidal zone at Port Gawler supports seagrass meadows of Zostera mucronata, Z. tasmanica and Posidonia australis.
Port Gawler is listed as a Wetlands of National Importance and is recognised for its significant estuarine function. Port Gawler is also listed on the Register of the National Estate. These areas provide habitat for 65 coastal bird species, many of which are listed as rare or threatened or are listed under international treaties. Baker (2004) summarises the region stating that the saltmarsh, mudflat, sandflat, mangrove and seagrass habitats in the area have outstanding ecological significance, and are recognised as important contributors to the biological productivity and

Pipeline to the Sea: Feasibility Study - Phase 1
37
ecological functioning of Gulf St Vincent, particularly the northern part of the gulf. The mangrove and seagrass habitats are considered by Edyvane (1999) to be of National significance.
In general, the whole of the intertidal and supratidal area of northern and north-eastern Gulf St Vincent provides key habitat for local and migratory wading, coastal, and sea birds.
The following fish species of conservation significance have been noted in the Port Gawler area;
• Congolli (Pseudaphritis urvillii ), Common Galaxias or Jollytail (Galaxias maculatus),
Mountain Galaxias (Galaxias olidus), and Flathead Gudgeon (Philypnodon grandiceps),
• Magpie Fiddler Ray (Trygonorrhina melaleuca),
• various species of Pipefish (Syngnathidae family) and some of the species in the Clinidae
family (the Weedfish and Snake-blenny family) and the Apogonidae family (Cardinalfish
family),
• invertebrate species including the brown or black striated sea anemone Edwardsia vivipara,
and barnacles Elminius adelaidae and E. erubescens,
• Race rosinae of the Samphire Thornbill (Slender-billed Thornbill) Acanthiza iredalei,
• The Weedy Seadragon Phyllopterix taeniolatus is considered vulnerable to population
impacts due to its strong site association with seagrass. It is now protected, along with all
other members of the Syngnathidae family, under the Fisheries Act 1982.
Middleton
The Middleton area is at the interface between the Encounter biounit of the Gulf St Vincent bioregion, and the Coorong biounit/bioregion. The sheltered Horseshoe Bay and the reef habitats of Pullen Island are typical of the former, while the surf beaches to the east of Horseshoe Bay are more typical of the latter.
Regional description
Intertidal reefs areas are dominated by thin algal mat covers, such as Calothrix sp., various lichen species and species of the green Ulva and Enteromorpha, the brown Splachnidium rugosum, and the worm-like red alga Nemalion. Lower intertidal to subtidal species include the red coralline alga Haliptilon, Hormosira banksii, Cystophora intermedia and multi-branched red algae Laurencia, Wrangelia and Dasya.
Benthic habitats/flora
The subtidal boulder habitats of Pullen Island and nearby sites are typical of the Encounter Bay islands, supporting stands of large brown macroalgae (mainly Ecklonia radiata, mixed Cystophora

Pipeline to the Sea: Feasibility Study - Phase 1
38
(C. moniliformis dominating the inner protected side) and Sargassum species and Scytothalia dorycarpa, with Acrocarpia paniculata in more exposed areas), with highly diverse red macroalgal assemblages in the understorey. Common understorey include species of the red genera Plocamium, Gelidium, Callophycus, Melanthalia, Pterocladia and Phacelocarpus, the green genus Caulerpa, turfing brown species, and various crustose and articulated coralline species.
A system of offshore platform reefs, with algal communities, interspersed with unvegetated sediments extends parallel to the Coorong coast from an origin near Seal Island in Encounter Bay. Near Middleton, such reef areas are about two kilometres offshore in 10 to 15 metre water depths.
Seagrass meadows of Posidonia (P. sinuosa, P. angustifolia), Amphibolis antarctica and Halophila australis are sparse in this region and are restricted to the sheltered embayments of Encounter Bay further west from the Middleton area.
In exposed areas comprising coarse sand, few species are supported. Among those which can find a foothold are species of the isopods Acteacia and Cirolana, the commercially important Goolwa cockle Donax (Plebidonax) deltoides and the sand dwelling conical gastropod Polinices (Conuber) incei, whose egg masses (popularly known as “sausage blubbers”) are often washed up on beaches (Baker 2004).
Fauna
On the more exposed coasts, intertidal reefs host plentiful Littorinid snails (Nodilittorina unifasciata and N. praetermissa), crabs (e.g. Grapsidae family) and isopods in the supralittoral, barnacle species including Chamaesiph, Chthamalus sp. and larger surf barnacles, limpets, turban shells and black mussels in the mid-eulittoral. Polychaete worms, Tetraclina and Balanus barnacles, periwinkle and coniwinkle species are common in areas of moderate water movement. Abalone, stalked ascidians (Pyura sp.) and seastars are also present.
Pullen Island is one of several islands of Encounter Bay that contain a rich diversity of invertebrate species such as hydroids, bryozoans, ascidians, seastars and brittlestars, chitons, anemones, gorgonian corals, gastropods and other molluscs, including various squid, cuttlefish and octopus species, and crustaceans.
The high energy offshore platform reefs are generally low in species of molluscs, crustaceans, and fish but are abundant in sessile filter feeding invertebrates, including a variety of ascidians, sponges and other taxa.
The fish species diversity of Encounter Bay has not been quantified by scientific survey, however well over 70 fish species have been commonly recorded by divers, dive organisations, other groups (e.g. Marine Life Society of South Australia), and fishers.

Pipeline to the Sea: Feasibility Study - Phase 1
39
Bryars (2003) identified key fisheries habitat for a number of species in the region and these are summarised in Appendix A.
Fisheries
The proposed Encounter Marine Park comprises a variety of zones ranging from general use, allowing most current activities, through to Restricted Access Zones with no public access. The Middleton area is largely surrounded by a Sanctuary Zone, with a strip of Habitat Protection Zone along Basham’s Beach. The objective of a Sanctuary Zone is to provide protection and conservation for habitats and biodiversity within a marine park, while the objective of a Habitat Protection Zone is to provide protection for species and habitats within a marine park whilst allowing activities and uses that do not harm habitats or the functioning of ecosystems.
Conservation significance
Pullen Island Conservation Park was declared in 1983 under the National Parks and Wildlife Act 1972, and provides habitat for breeding colonies of Little Penguins and other seabird species including Silver Gulls, Crested Terns, Little Pied Cormorants and Black Cormorants.
The Encounter Bay Region is listed on the Register of the National Estate. The registered area comprises the islands and marine environment of Encounter Bay, approximately 100 km of coastline and 17 500 ha of area, extending from Newland Head in the west to the west bank of the River Murray Mouth in the east. In terms of ecological values, the region is recognised by the Australian Heritage Commission as significant due to the high levels of biodiversity and geological diversity.
The globally protected endangered Southern Right Whale (Eubalaena australis) annually visits the Encounter Bay region during the autumn to mid spring months for mating, calving and rearing young. The IUCN Red List 2003 classified the Southern Right Whale as conservation dependent. The species is listed under South Australian legislation as Vulnerable, and is also listed under the Environment Protection (Biodiversity Conservation) Act, 1999 as a threatened species. Other potentially threatened cetacean species including Sperm Whales, Pygmy Sperm Whales and Pygmy Right Whales have also been irregularly recorded visiting the Encounter Bay area.
Encounter Bay provides refuge for the Australian Sea Lion, listed as Rare under the National Parks and Wildlife Act 1972.
Syngnathid species, including seahorses, most pipefish, and seadragons, are generally considered to be of conservation concern and are listed marine species under the Commonwealth EPBC Act 1999 and protected under the SA Fisheries Act 1982.
Baker (2004) lists a range of other species of conservation interest found within the broader Encounter Bay area, including;
• various shark species, including Whiskery Shark, Saw Sharks, Smooth Hammerhead,
School Shark, Gummy Shark, Great White Shark, Basking Shark and the Porbeagle Shark,

Pipeline to the Sea: Feasibility Study - Phase 1
40
• ray and skate species,
• the unusual octopus Argonauta nodosa,
• a diversity of pycnogonid (sea spider) species,
• very diverse and dense articulated bryozoan communities,
• Alison’s Blue Devil Paraplesiops alisonae,
• the little known Orange-barred Pufferfish Polyspina piosae,
• reef fish species such as the Western Blue Groper and other wrasse species.,
• the very rare, small, shallow water fish Neoaploactis tridorsalis (Threefin Velvetfish),
• the Crested Flounder Lophonectes gallus,
• several species of hemichordates (“acorn worms”),
• an uncommon species of sea cucumber (provisionally called “Cucumaria” squamatoides)
and a rare phototrophic sponge (Cymbastela sp.),
• reef dwelling spongivore Zoila marginate,
• twenty bird species recorded from the region are listed in the CAMBA and JAMBA
international treaties.
Murray Mouth
The Murray Mouth site is towards the north of the Coorong Biounit, the sole biounit of the Coorong Bioregion which extends from Encounter Bay to Lacepede Bay and includes the estuarine Coorong Lagoons located in the Coorong National Park. The lagoons of the Coorong system receive water from a number of sources, including exchange with the sea via the Murray Mouth. The flow of the Murray Mouth estuarine area is integral to the ecosystem functioning of the Coorong region and the adjacent coastal and marine areas.
Regional description
Salinity in the estuary varies according to the influences of river flow, tidal excursion, and rainfall. During periods when the barrages are open salinities are usually low. Long periods of barrage closure increase the salinity of the Murray Mouth to a level that approaches seawater. Hypersaline areas do not occur at the Murray Mouth but are restricted to the southern end of the Coorong system.
In general terms, the Murray Mouth estuary is described as a saline -brackish tidal system, containing extensive mudflats and sparse vegetation. Depths in the estuary vary from shallow flats and shallow channels to deep channels. Depth varies from less than 1m to around 5m, depending
Benthic habitats/flora

Pipeline to the Sea: Feasibility Study - Phase 1
41
on time of the year, river flow, storms and tides. Coarse sediments are found mainly in deep channels, and finer sediments occur on shallow flats and shallow channels.
The Murray Mouth estuary is an area of low diversity of benthic flora. Surveys showed that macroflora was generally absent in areas of high sediment mobility and waterflow. However, in sheltered embayments, ‘opportunistic’ and filamentous macroalgae dominated, such as Enteromorpha ralfsii, E. clathrata, Polysiphonia infestans and Ulvaria oxysperma. The red alga Gracilaria was also common. Within the open estuary, the narrow deeper water channel (approximately 2m - 7m deep), comprised fine to very fine sand, and was devoid of macroflora.
Outside of the mouth, the major intertidal habitat in the region is sandy beach.
The Coorong system is an important habitat for amphipods (e.g. species of Melita and Paracorophium). The abundance of amphipods is considered to be the principal driving feature of the winter and early spring growth of juvenile estuarine fishes, particularly Flounder, Bream and Mullet. Seasonal blooms of the Cladoceran Micro-crustaceans Daphnia carinata, Ceriodaphnia quadrangula and the Copepod Boeckella triarticulata are also ecologically significant, being the dominant zooplankton in the now turbid Murray Mouth area of the Coorong system, which are flushed from the freshwater lakes when the barrages are open.
Fauna
On the surf beaches outside the Murray Mouth, the Goolwa Cockle (Donax deltoides) is highly abundant.
The offshore high wave energy reefs are generally low in species of molluscs, crustaceans, and fish.
A well established fishery along the Coorong Beach is the removal of the Goolwa Cockle (Donax deltoides). Commercial netting for Mulloway (Argyrosomus hololepidotus) and shark also occurs along the Coorong beach. Most recreational fishing effort is centred around the Murray Mouth.
Fisheries
Bryars (2003) identified key fisheries habitat for a number of species in the region and these are summarised in Appendix A.
The proposed Encounter Marine Park comprises a variety of zones ranging from general use, allowing most current activities, through to Restricted Access zones with no public access. The Murray Mouth is within a Habitat Protection Zone, for which the objective is to provide protection for species and habitats within a Marine Park, whilst allowing activities and uses that do not harm habitats or the functioning of ecosystems.
Conservation significance

Pipeline to the Sea: Feasibility Study - Phase 1
42
The Murray Mouth estuary, along with the Coorong lagoons and Lakes Albert and Alexandrina is of major conservation significance for wading birds and other coastal birds, and is included as a Ramsar Wetlands of International Significance, and also listed in the JAMBA and CAMBA international agreements for protection and management of migratory birds. Carpenter (1995) reported 26 migratory species under JAMBA and/or CAMBA agreement. The area is known to be one of the most significant in southern Australia, in terms of numbers and species diversity of migratory and indigenous wading birds, and one of the top 10 areas for migratory wader numbers in Australia. The entire Coorong, including the Lower Murray/Murray Mouth, is a drought refuge when central or eastern Australian wetlands dry out.
One of few South Australian habitats for the endangered Estuary Perch Macquaria colonorum occurs near the Murray Mouth. The Congolli (Pseudaphritis urvillii) also occurs in the Murray Mouth area, and is a species of conservation concern. The Lagoon Goby Tasmanogobius lasti, an eastern Australian species that is not recorded in most parts of South Australia, also occurs in the Murray Mouth area, and is of potential conservation concern in South Australia.
A resident wader, the vulnerable Hooded Plover Charadrius rubricollis, nests on the ocean beaches and fore-dunes of the Coorong. The species is listed under the Environment Protection (Biodiversity Conservation) Act, 1999, and previously under the Flora and Fauna Guarantee Act 1988. The Murray Mouth area also supports breeding colonies of Australian Pelicans, ibis, egrets, spoonbills, and cormorants.
Coorong Crossings (Hells Gate, Tea Tree Crossing, 42 Mile Crossing & South of Coorong)
The four outfall locations in the vicinity of the southern end of the Coorong are considered together as they are similar and difficult to differentiate at this level of investigation. The Hells Gate site is to the centre of the Coorong Biounit while the other three locations are in the southern half of the Coorong Biounit.
Regional description
The region faces in a southwesterly direction into the Southern Ocean. The Coorong Biounit is dominated by sandy beach dunes, beach ridges and blowouts. The gently curving sandy coast running from the Murray Mouth to Cape Jaffa represents a classic example of spatial variation in nearshore wave energy and beach surf-zone morphology controlling the evolution, extent and nature of the entire coastal zone. Two factors important in the evolution of this coast are the relatively steep the gradient of the nearshore and the high breaker wave energy.
The offshore gradient declines and the zone of wave attenuation widens gradually towards the south and therefore there is a reduction in breaker wave power for the outfall location south of the Coorong National Park.

Pipeline to the Sea: Feasibility Study - Phase 1
43
The major intertidal habitat in the region is sandy beach.
Benthic habitats/flora
The offshore rocky areas in this region consist of a series of parallel rocky reefs, which stretch offshore from Encounter Bay to Cape Jaffa. These parallel reefs are submerged beach ridge systems, consisting of Pleistocene dune calcarenite, and form low profile reefs, subject to sand scour.
Seagrass beds are absent along most of the offshore and nearshore coast off the Coorong, until south of “The Granites”, a geological feature approximately 45 km north of Cape Jaffa. High wave energy and active sand movement probably prevent the colonisation of the sandy areas north of this area.
The high wave energy reefs are generally low in species of molluscs, crustaceans, and fish. No information could be found on the infauna of the subtidal sandy habitats in the region.
Fauna
A well established fishery along the Coorong Beach is the removal of the Goolwa Cockle (Donax deltoides). Commercial netting for Mulloway (Argyrosomus hololepidotus) and shark also occurs along the Coorong beach. Most recreational fishing effort is centred around the Murray Mouth.
Fisheries
Bryars (2003) identified key fisheries habitat for a number of species in the region and these are summarised in Appendix A.
No protected areas nor habitats of conservation significance have been identified for this region. The only species of conservation significance identified in the area is the endangered Southern Right Whale (Eubalaena australis). Further species may be identified by a forthcoming summary of the conservation status of marine fish, sharks and rays (Baker, in press).
Conservation significance

Pipeline to the Sea: Feasibility Study - Phase 1
44
Impact of Discharge on Receiving Environments
General
The behaviour of the saline water once released into the sea will depend on its density, which is a function of temperature and salinity, and the oceanographic conditions at the discharge location. The deeper and more energetic the receiving environment is, the quicker the discharge water will mix through the water column and the lower the environmental impacts will be.
Changes in temperature, dissolved oxygen, pH, salinity, nutrients, turbidity and metals of the receiving waters may harm marine fauna or influence the behaviour of fish, particularly migratory species.
The desktop study has identified fauna and fisheries that are likely to be found around the potential discharge locations and therefore may be adversely impacted by the discharge of saline groundwater to the ocean. The potential impacts of the discharge have been considered in two ways;
• Compliance with the South Australian EPA Water Quality Policy.
• Qualitative risk assessment of impacts on ecosystems.
Water Quality Policy
In South Australia the principal policy relating to water quality for receiving waters is the Environmental Protection (Water Quality) Policy, 2003. The main focus of the policy is the protection and enhancement of water quality while allowing economic development.
Section 14 of the policy refers to the mixing zone and allows discharge into the mixing zone provided the discharge is sustainable and does not prejudice the water quality objectives for the waters outside of the mixing zone. The mixing zone is not to exceed 100 metres in diameter and is not be within 200 metres of the mean low water mark of the coast at spring tide. Schedule 2 of the policy contains water quality criteria for a range of protected environmental values, including Marine Aquatic Ecosystems, which is relevant to this study.
The Water Quality Policy is considered to be complied with if the concentrations of critical analytes at the edge of the mixing zone are sufficiently diluted to meet the concentration listed in Schedule 2. The required dilution for compliance is defined by
D = (B-A)/(C-A)
where D = required dilution factor to achieve compliance A = ambient concentration B = concentration of outfall discharge C = compliance concentration (from Schedule 2).
Pipeline to the Sea: Feasibility Study - Phase 1
45
The Water Quality Policy does not currently list a compliance concentration for salinity. The EPA advise that the onus is on the proponent to prove that the discharge will not have any adverse impact on the receiving waters.
Discharge Water Quality
For the Stockyard Plain Basin the only available water quality data was that collected on 21 June 2003 for the CSIRO Value Adding to Salts Recovered from Saline Waters in Disposal Basins in the Murray-Darling Basin Study and reported in Harrington and Howes (2004). Water samples were taken from the outfall to the basins as well as from each of the four ponds within the basin complex. The data for each sample is presented in Table 6.1.
Table 6.1 also includes information on the composition of sea water, taken from Drever (1982) as well as compliance concentrations from Schedule 2 of the Water Quality Policy.
Table 6.1 shows that the composition of the groundwater being pumped into the Stockyard Plain Basins and the water in the basins is similar to that of seawater. This is not surprising given that the groundwater would have originated from ancient seabed strata.
The principal differences between the Stockyard Plain Basin water and seawater are elevated concentrations of oxidised nitrogen, ammonia, iron and manganese. When discharged to the marine environment, the elevated nutrients may reduce productivity and survival of sedentary organisms such as seagrass and bivalves (e.g. the Goolwa cockle and razorfish). This in turn might have an impact on the animals that feed on the seagrass, cockles and razorfish, including international migratory species that inhabit the area. The impacts may arise from either reduced food sources and/or a build-up of chemicals, although neither iron nor manganese are known to accumulate through the food chain.
Ammonia and oxides of nitrogen are macronutrients associated with the reduction of seagrass beds off the Adelaide coast. In trials conducted for the Adelaide Coastal Water Studies, Amphiboles and Posidonia were shown to be sensitive to ammonia at levels of 5 mg/L to 10 mg/L respectively, (Collings et al., 2006). The highest level of ammonia found in Stockyard Plain water was 1.2 mg/L at the outfall, well below the concentrations reported by Collings.
It is noted that the water quality data for Ponds A, B, C and D indicate what changes in composition may occur as water is concentrated within the basin complex at Stockyard Plain. As water is retained in the basins, it appears as if ammonia and oxidised nitrogen are reduced in concentration by denitrifying bacteria converting ammonia and oxidised nitrogen to atmospheric nitrogen or by assimilation in plant matter. In addition, the concentrations of iron and manganese decrease with time, possibly indicating precipitation to the basin floor. While some elements show a decrease in concentration with time, others show an increase. This is likely due to the concentration due to evaporation.
For the scenario where Stockyard Plain Basin water is to be concentrated to achieve a brine concentration of 100 000 mg/L it is assumed that the concentration of all elements in the water will be twice that of Pond C (as Pond C has a salinity of almost 50 000 mg/L). Based on this

Pipeline to the Sea: Feasibility Study - Phase 1
46
assumption, the critical concentrations for consideration are those for the raw water discharged to the Stockyard Plain Basin.
Element
Concentration (mg/L)
EPA.SA water quality criteria (marine)
Stockyard Plain Outfall
Stockyard Plain Pond A
Stockyard Plain Pond B
Stockyard Plain Pond C
Stockyard Plain Pond D Seawater*
Na nv 5 570 6 480 10 700 14 700 12 000 10 760 K nv 100 95.7 138 217 157 399 Ca nv 410 432 618 844 680 411 Mg nv 482 563 933 1 320 1 050 1 290 Mn nv 0.051 0.009 0.009 0.018 0.008 0.0002 Sr nv 15.6 16.6 26.8 33.8 29.4 80 Fe 0.3** 1.1 0.073 0.025 0.06 0.066 0.002 B nv 3.42 3.34 5.28 5.01 5.82 5 Cl nv 9 160 11 300 19 600 27 400 21 100 19 350 SO4 nv 1 660 1 860 2 980 4 220 3 360 2 710 HCO3- nv 481 357 230 189 187 142 CO32- nv 17 15 5 2 5 Negligible Br nv 27.3 30.2 53.8 71.7 61.8 67 NH3 as N 0.2 1.22 0.218 0.159 0.526 0.265 Negligible NO3+NO2 as N 0.2 1.07 0.42 0.14 0.011 0.088 Negligible Total salts nv 17 930 21 154 35 290 49 003 38 636 35 214
nv = no guideline value in Schedule 2 of Environment Protection (Water Quality) Policy 2003.
** = temporary ANZECC (2000) guideline
Table 6.1 – Water Quality Data for Stockyard Plain Basin
Required Dilution for Compliance
Based on the discussion in Section 6.3.3 and using the formula described in Section 6.3.2, the required dilutions for the three elements for which compliance values are available are;
• Ammonia - required dilution = 6.1
• Oxidised Nitrogen - required dilution = 5.35
• Iron - required dilution = 3.68
The above indicates that ammonia is the critical element and that a dilution of 6.1 is required to satisfy the Water Quality Policy.
Pipeline to the Sea: Feasibility Study - Phase 1
47
Modelling of Discharge Mixing
The likely extent of impacts on water quality of the receiving waters was modelled to determine the geometry of an outfall system which would produce adequate mixing and satisfy the EPA regulatory requirements. The Cornell Mixing Zone Expert System (CORMIX) hydrodynamic computer model, which is approved by the US EPA, was selected for analysis of pollutant discharges in the near field. The near field is defined as the region where the discharge emerges from the outfall pipeline and becomes entrained into the receiving waters where the momentum and buoyancy flux and discharge geometry determine the mixing in the receiving waters and causes dilution of the effluent. As the plume moves away from the discharge point the flux factors become less important and the dispersion of the plume is governed by environmental factors such as tidal currents.
Methodology
The CORMIX model has been used in permit applications of industrial, municipal, thermal and brine discharges to receiving waters, including several applications in South Australia to examine thermal and brine discharges to marine waters. Applications have included the thermal discharge from the Pelican Point (Adelaide) power station and the Penneshaw (Kangaroo Island) desalination plant brine discharge.
The method used by the CORMIX model is not exact and should be considered as an approximation only. Extensive predictions by the Cornell University and the US EPA with field and laboratory data have shown that the method of predictions on dilutions and concentrations are reliable for the majority of cases and are accurate to within about +/- 0.5 standard deviation. As a further safeguard, the method is designed to not provide predictions whenever it judges the design configuration as highly complex and uncertain for prediction.
Winter-worst case conditions corresponding to tidal speed near slack water under tidally reversing conditions to account for pollutant entrapment from previous cycle and zero wind mixing were assumed for the receiving waters.
Data and Assumptions
In the absence of any time series data on current speeds an estimated 0.12 m/sec was adopted for all outfalls. This is considered a conservative estimate for mean current speed in open seas and is consistent with a worst case situation for mixing.
Based on previous experience it was assumed that the outfall would be located a distance off-shore where sufficiently deep water was present. For the Port Gawler outfall, due to the presence of the wide intertidal mud flats, this was achieved at a distance in excess of 2200 m. For the outfalls into the Southern Ocean relatively deep water was achieved within several hundred metres of the shoreline.
The model input data for the receiving waters are shown in Table 6.2.

Pipeline to the Sea: Feasibility Study - Phase 1
48
Table 6.2 – CORMIX Model Input Data for Receiving Waters
Based on the range of discharge options being assessed the CORMIX model was initially run with the input data shown in Table 6.3 to describe the outfall discharge. Based on previous experience it was assumed that a single open pipe without a diffuser structure would be adequate.
Mean maximum air temperature (July at Berri) 15.5ºC
Mean discharge salinity 50 000 ppm
Mean density 1 037.46 kg/m³
Pipe diameter 500 mm
Discharge velocity 1.1 m/sec
Table 6.3 – CORMIX Model Input Data for Outfall Discharge
The results of the initial runs of the CORMIX model are shown in
Model Results
Table 6.4. As all dilutions exceed the critical value of 6.1 (refer Section 6.3.4) there is sufficient mixing of the discharge from the outfall to achieve acceptable concentrations at the edge of the mixing zone.
Outfall Location Depth (m) Distance (m) Dilution
Port Gawler 1 3.1 2 200 13
Port Gawler 2 6.8 4 000 33.6
Middleton 5.0 250 24
Hells Gate 5.0 250 24
Tea Tree Crossing 5.0 250 24
42 Mile Crossing 5.0 250 24
South of Coorong 5.0 250 24
Table 6.4 – Results of Initial CORMIX Model Runs
Outfall Location Water Temperature (ºC)
Water Salinity (ppm)
Water Density (kg/m³)
Depth of Water at Discharge (m)
Distance Offshore (m)
Port Gawler 12.4 37 120 1 028.16 3.1 & 6.8 2 200 & 4 000
Middleton 13.9 36 000 1 026.98 5.0 250
Hells Gate 14.2 36 000 1 026.92 5.0 250
Tea Tree Crossing 14.4 36 000 1 026.88 5.0 250
42 Mile Crossing 14.2 36 000 1 026.92 5.0 250
South of Coorong 14.5 36 000 1 026.85 5.0 250
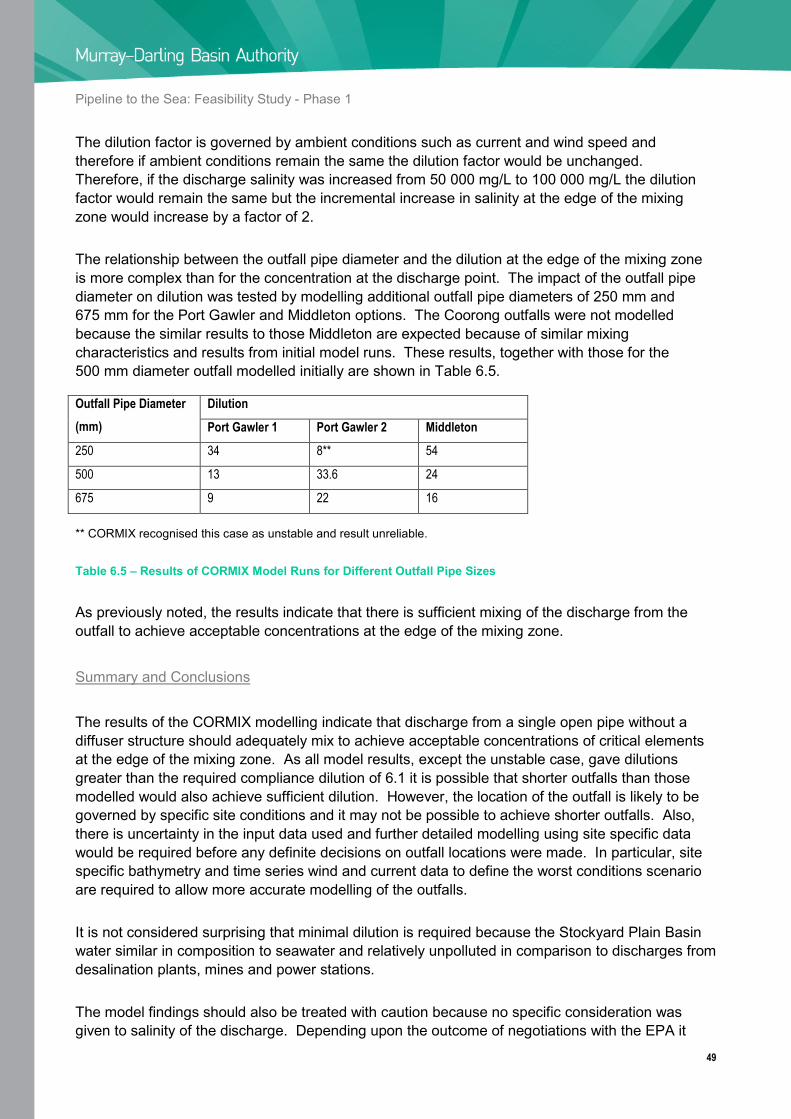
Pipeline to the Sea: Feasibility Study - Phase 1
49
The dilution factor is governed by ambient conditions such as current and wind speed and therefore if ambient conditions remain the same the dilution factor would be unchanged. Therefore, if the discharge salinity was increased from 50 000 mg/L to 100 000 mg/L the dilution factor would remain the same but the incremental increase in salinity at the edge of the mixing zone would increase by a factor of 2.
The relationship between the outfall pipe diameter and the dilution at the edge of the mixing zone is more complex than for the concentration at the discharge point. The impact of the outfall pipe diameter on dilution was tested by modelling additional outfall pipe diameters of 250 mm and 675 mm for the Port Gawler and Middleton options. The Coorong outfalls were not modelled because the similar results to those Middleton are expected because of similar mixing characteristics and results from initial model runs. These results, together with those for the 500 mm diameter outfall modelled initially are shown in Table 6.5.
Outfall Pipe Diameter (mm)
Dilution
Port Gawler 1 Port Gawler 2 Middleton
250 34 8** 54
500 13 33.6 24
675 9 22 16
** CORMIX recognised this case as unstable and result unreliable.
Table 6.5 – Results of CORMIX Model Runs for Different Outfall Pipe Sizes
As previously noted, the results indicate that there is sufficient mixing of the discharge from the outfall to achieve acceptable concentrations at the edge of the mixing zone.
The results of the CORMIX modelling indicate that discharge from a single open pipe without a diffuser structure should adequately mix to achieve acceptable concentrations of critical elements at the edge of the mixing zone. As all model results, except the unstable case, gave dilutions greater than the required compliance dilution of 6.1 it is possible that shorter outfalls than those modelled would also achieve sufficient dilution. However, the location of the outfall is likely to be governed by specific site conditions and it may not be possible to achieve shorter outfalls. Also, there is uncertainty in the input data used and further detailed modelling using site specific data would be required before any definite decisions on outfall locations were made. In particular, site specific bathymetry and time series wind and current data to define the worst conditions scenario are required to allow more accurate modelling of the outfalls.
Summary and Conclusions
It is not considered surprising that minimal dilution is required because the Stockyard Plain Basin water similar in composition to seawater and relatively unpolluted in comparison to discharges from desalination plants, mines and power stations.
The model findings should also be treated with caution because no specific consideration was given to salinity of the discharge. Depending upon the outcome of negotiations with the EPA it

Pipeline to the Sea: Feasibility Study - Phase 1
50
may be necessary for the marine outfall to include a diffuser structure. The cost of a diffuser has not been included in this study but is not considered to adversely impact on the overall conclusion because the cost of the outfall structure is a very small component of the total project cost (refer Table 12.1).
Risk Assessment
To further compare the outfall locations a qualitative assessment of a number of risks associated with construction and operation of the marine outfalls was undertaken. Because of the limited site specific data the Southern Ocean outfalls were considered together and compared with the Gulf St Vincent outfall at Port Gawler.
Methodology
Risk is a function of impact (consequences) and likelihood (probability). The likelihood of an unwanted impact occurring can be reduced by management or implementing control measures.
To evaluate the potential impacts of discharging water from the Stockyard Plain Basin to the sea, the sensitivity of marine plants and animals to the discharge water quality and the ability of the ecosystem to recover from any adverse impacts need to be considered. In this study the impacts have been evaluated using the matrix outlined in Table 6.6.
Impact Score and Description of Impact
1 2 3 4
Duration of impact
Immediate Few days.
Short-term 1 season.
Medium-term 1-2 years.
Long-term > 2 years.
Severity of impact
Negligible Not detectable.
Minor Temporary
impact on few
species.
Moderate Loss of some
species.
Severe Destruction of
habitat.
Scale of impact
Local Within 100m.
Embayment A few
kilometres.
Regional Tens of
kilometres.
Global Loss of an
endemic
species.
Ecosystem resilience
Good Small or
temporary loss
in productivity.
Moderate Will recover
within 1 season.
Poor Will not recover
locally or take a
few decades.
Devastating Irretrievable
loss.
Table 6.6 – Impact Assessment Matrix

Pipeline to the Sea: Feasibility Study - Phase 1
51
The likelihood of harming the marine environment is dependent on:
• the methods used for placing and anchoring the pipeline on the seabed
• the type of outfall and discharge rate
• the quality of water discharged to the sea.
In this assessment, three levels of likelihood are assigned; low, medium and high. The assessment is based on literature and data available at the time of undertaking this desktop study and professional experience and judgement.
Potential impacts arise from disturbing the seabed during placement of the outfall pipeline, by the introduction of exotic marine species from construction equipment and hydrocarbon spills and turbidity plumes. The impacts arising from placing the pipeline on the seabed will depend on the method employed. Anchoring with concrete blocks would have a lower immediate impact on the seabed than dredging to lay the pipeline in a trench. Dredging is likely to have a lower long-term impact than anchoring because the benthic flora and fauna will recolonise the disturbed area and the flat profile will prevent erosion of the seabed from episodic strong current events. A submerged outfall will also cause less risk to navigation, fishing and trawling. Dredging has the potential risk of releasing metals locked in sediment (acid sulphate soils), particularly in the Gulf St Vincent locations.
Risks during the Construction Phase
Three risks have been assessed in terms of impacts from Table 6.6 and the likelihood of occurrence and are summarised below.
Activity/issue: Anchoring outfall pipeline to the seabed
Risk # 1
Potential Impact: Scouring of the seabed
• Duration: immediate
• Severity: moderate
• Scale: local
• Resilience: good (Southern Ocean) to poor (Gulf St Vincent due to seagrass (Posidonia
sp.) that could be irreversibly removed)
Likelihood: high
The pipeline has an unavoidable footprint and the best control measure is to minimise the area of disturbance.

Pipeline to the Sea: Feasibility Study - Phase 1
52
Activity/Issue: Hydrocarbon spills and turbidity plumes
Risk #2
Potential Impact: Loss of plants and animals and general damage to marine habitat
• Duration: immediate
• Severity: minor (Southern Ocean) to moderate (Gulf)
• Scale: local
• Resilience: good
Likelihood: low (Southern Ocean) to medium (Gulf)
The severity and scale of impact will depend on the size of the spill or plume. A small spill or plume has a medium likelihood of occurring and is attributable to human error, but a large spill has a low likelihood of occurring due to control measures that can be implemented to prevent this event.
Activity/issue: Introduction of exotic species from ballast water or growth on hull of pipe laying /tender vessels
Risk #3
Potential Impact: Competition and displacement of indigenous species
• Duration: long term
• Severity: severe
• Scale: embayment
• Resilience: moderate
Likelihood: low
Vessels for laying the pipeline are likely to be contracted from local waters. In the event that they originate from exotic waters, simple control measures to exchange ballast water at sea and if necessary cleaning the hull at sea would minimise the likelihood of exotic species being introduced.
The design and location of the outfall pipeline can have an impact on the seabed as ocean currents and wave action can generate turbulence around the pipeline and anchoring system that might resuspended sediment and generate turbidity plumes that will move in the direction of the ocean currents or waves. Seabed scouring may also be caused by the discharge from the outfall pipeline, depending upon the design and the physical characteristics of the sea floor.
Risks during the Operational Phase

Pipeline to the Sea: Feasibility Study - Phase 1
53
The presence of nutrients and the elevated metals iron and manganese (and other metals such as cadmium or zinc that have not been identified due to lack of data) in the discharge plume have a potential impact on the marine environment. The potential impacts might extend beyond the immediate area around the outlet to other ecosystems or habitats downstream of the discharge point. Other potential impacts include obstruction to amateur or commercial fishing and marine navigation by the outfall pipeline.
Four risks have been assessed in terms of impacts from Table 6.6 and the likelihood of occurrence and are summarised below.
Activity/issue: Ocean currents and wave action moving past structures
Risk #4
Potential Impact: Scouring of the seabed and loss of habitat
• Duration: long term
• Severity: moderate (Southern Ocean) to severe (Gulf)
• Scale: local
• Resilience: good (Southern Ocean) moderate to poor (Gulf)
Likelihood: high.
Wave action is higher in the exposed Southern Ocean locations while currents are higher at the Gulf St Vincent locations. Turbulence around the structures can be reduced through engineering design. The potential loss of seagrass in the Gulf St Vincent is the reason for the higher severity and resilience scores.
Activity/issue: Discharge outlet
Risk #5
Potential Impact: Scouring of the seabed and loss of habitat
• Duration: long term
• Severity: moderate (Southern Ocean) to severe (Gulf)
• Scale: local
• Resilience: good (Southern Ocean) moderate to poor (Gulf)
Likelihood: low (Southern Ocean) to medium (Gulf)
Seagrass particularly Posidonia has very poor recruitment potential, therefore potential loss of seagrass from highly turbulent discharge plumes results in a poorer rating for the Gulf St Vincent

Pipeline to the Sea: Feasibility Study - Phase 1
54
outfall. The discharge outlet can be engineered to prevent or reduce the likelihood of turbulent flow and associated severity of impact.
Activity/issue: Pollutants (nutrients and dissolved metals)
Risk #6
Potential Impact: Loss of plants, animals and/or habitat
• Duration: long term
• Severity: low (Southern Ocean) to moderate (Gulf)
• Scale: local to embayment (if insufficient mixing in Gulf St Vincent)
• Resilience: good (Southern Ocean) moderate (Gulf St Vincent)
Likelihood: low
The main pollutants of concern are nutrients (particularly ammonia and nitrogen oxides), however, as discussed in Section 6.3.3 they are likely to be at concentrations which are not expected to significantly harm marine life. The poorer ratings assigned to the Gulf St Vincent outfall is based on the assumption that the nutrient load will add to that already being released into this environment from other sources such as water treatment plants and stormwater. The likely nutrient load discharged by the proposed pipeline is considered small in comparison to that from the other sources.
Activity/issue: Physical obstruction to fishing and navigation
Risk #7
Potential Impact: Loss of amenity
• Duration: long term
• Severity: minor (Southern Ocean) moderate (Gulf)
• Scale: local
• Resilience: not relevant
Likelihood: low (Southern Ocean) to medium (Gulf)
Trawling and potential impact from shallow draft vessels with the pipeline are the main hazards. Signage, public notices and the eventual inclusion of the pipeline on the admiralty and other navigational charts would reduce the likelihood of this occurring.

Pipeline to the Sea: Feasibility Study - Phase 1
55
The overall risk rating for the two bioregions (Gulf of St. Vincent and the Coorong) is presented in
Risk Rating
Table 6.7. The risk has been quantified by assigning scores for the assessed impact using Table 6.6 and assigning a score of 1 (low) to 3 (high) for the likelihood assessment. The risk score has been determined by summing the impact scores and multiplying by the likelihood score.
Risk No
Impact Score Likelihood Risk
Duration Severity Scale Resilience Score Score
SO Gulf SO Gulf SO Gulf SO Gulf SO Gulf SO Gulf
1 1 1 3 3 1 1 1 1 3 3 18 18
2 1 1 2 3 1 1 1 1 1 2 5 12
3 4 4 4 4 2 2 3 3 1 1 13 13
4 4 4 3 4 1 1 1 1 3 3 27 30
5 4 4 3 4 1 1 1 3 1 3 9 36
6 4 4 1 3 1 2 1 3 1 1 7 12
7 4 4 2 3 1 1 1 2 7 16
Total Risk Score 86 137
Note: SO = Southern Ocean and Gulf = Gulf St Vincent
Table 6.7 – Summary Risk Matrix
This assessment is crude and subjective but has been presented to differentiate the impact of outfalls on the Southern Ocean Outfalls and Gulf St Vincent. More refined risk evaluation would require more quantitative data to be taken into consideration and is recommended to enable the five Southern Ocean outfalls to be differentiated.
Based on this risk assessment the Southern Ocean outfall locations have a lower environmental risk than Gulf St. Vincent outfall locations.
Risk ratings using the same methodology have also undertaken at the biounit level and individual species level. At the biounit level the impacts on the different habitats within each biounit have been assessed. The results of the assessment are presented in Appendix B. An assessment of

Pipeline to the Sea: Feasibility Study - Phase 1
56
the risks to individual species found in the vicinity of the marine outfalls is presented in Appendix C. A summary of these two assessments is given in Table 6.8.
Outfall Location Number of Habitats
Risk Score for Habitats
Number of Species
Risk Score for Species
Coorong Crossings 2 24 26 194
Hells Gate 1 8 13 96
Middleton 5 69 29 222
Pt Gawler 5 59 24 192
Pt Wakefield 5 59 16 131
Table 6.8 – Summary Risk Assessment for Habitat and Species
As the total scores shown in Table 6.8 are the summation of scores for individual habitats and species, these more refined risk assessments are biased strongly by the number of different habitats and species present at the individual outfall locations. Because the outfall location at Hells Gate has the lowest number of habitats and species it records the least level of risk for both habitats and species.
Summary
A summary of the principal characteristics and issues for each marine outfall is provided in Table 6.9.

57
Potential Discharge Point
Wave Energy
Currents Waters Habitats Benthic fauna Fisheries Protected areas Species of conservation significance
Suitability for receiving saline discharge
Control measures
Port Wakefield low-high weak quiet Large areas of seagrass meadows. Unvegetated soft bottom, tidal flat, tidal creek and wetlands with large areas of mangrove forest.
Gastropods including razorfish and cockles, tubeworms, bryozoa, ascidians, crustaceans, mud crabs are abundant.
Extensive and commercial. Recommended as multiple use marine park (MPA), Clinton Conservation Park.
Sargassum decurrens relict tropical population. Congolli (species of conservation concern). Thornbill (vulnerable species).
Low: Due to low circulation of seawater, extensive seagrass and mangrove habitats and environmental significance.
Extend the mixing zone by discharging over a wider area. Mathematical model of plume dispersion.
Port Gawler low-high weak quiet Historically areas of seagrass meadows occurred but are now degraded due to human activities. Other habitats include unvegetated soft bottom, tidal flats, tidal creek mangrove forest.
Gastropods including razorfish and cockles, tubeworms, bryozoa, ascidians, crustaceans, mud crabs are abundant.
Commercial fishing and high density recreational fishing and activities.
Recommended as multiple use marine park (MPA), St Kilda – Chapman Creek Aquatic Reserve, Port Gawler and Buckland Park.
Congolli (species of conservation concern). Weedy seadragons. (vulnerable species).
Medium - low: Due to low circulation of seawater, seagrass habitats are degraded and additional stress may increase damage to seagrass beds.
Extend the mixing zone by discharging over a wider area. Mathematical model of plume dispersion.
Middleton low-high moderate quiet to strong
Intertidal reefs dominated by a thin algae, surf and sheltered beaches, seagrass meadows and unvegetated soft bottom.
On the exposed sandy areas; isopod species including the Goolwa cockles. On the exposed intertidal reefs; snails, crabs, black muscles, isopods, limpits, barnacles and polychaete worms. Abalones, stalked ascidians and seastars also occur. Pullen Island has a rich diversity of animals. Around 70 different fish species have been recorded in this area.
Some fisheries mostly in the Murray Mouth for mulloway, salmon, snapper, mullet, snook, tommy ruff, travelly, flathead, sweep, flounder, tailor, bream, whiting, garfish, gurnards, scorpion-cod, mackerel, morwong, blue groper, several shark species, rays and Goolwa Cockles.
Encounter Marine Park, Pullen Is Conservation Park (declared 1983) and surrounding Habitat Zone and Basham's Beach Sanctuary Zone.
Southern Right Whale (annual visits) and other whale species. Bottlenose Dolphins (data deficient), Australian Sea Lion (rare), Leafy and Weedy Seadragons, seahorses and pipefish (conservation concern).
High – low (in protected areas): Several protected areas and sensitive environments - need more work to understand the implications to migratory species such as Southern Right Whale, sea lions and penguins.
Avoid environmentally sensitive area. Mixing with freshwater from Lake Alexandrina. and model the dispersion to ensure that hypersaline plume does not encroach sensitive habitat.
Murray Mouth high strong energetic Estuary saline-brackish tidal system with extensive mud flats with coarse sediments in deep channels. Sandy beach outside of the mouth area with offshore rocky reefs.
Low diversity of benthic fauna. Opportunistic filamentous macroalgae in sheltered embayments. The dominant species are amphipods supporting a higher food chain of predatory birds. The Goolwa cockle is abundant on nearby surf beaches.
Well established fishery along the Coorong beach for Goolwa Cockle (~400 t/yr). Also mulloway netting. Other fish include salmon, snapper, mullet, snook, tommy ruff, travelly, flathead, sweep, flounder, tailor, bream, whiting, garfish, gurnards, scorpion-cod, mackerel, morwong, blue groper, several shark species, rays, cuttlefish and calamari.
Encounter Marine Park, the Murray Mouth is within a habitat protection zone to provide protection to species whilst allowing activities and uses that do not harm the habitat. The Murray Mouth is a drought refuge when central and eastern wetlands dry out.
Southern Right Whale (annual visits) and other whale species. Estuarine Perch (endangered species) Congolli (species of conservation concern) Lagoon Gobi (potential conservation concern). Several species of birds are listed as endangered or rare in the Murray Mouth.
High: Whilst several species are dependent on the Murray Mouth, it is assumed that these have adapted to changes in salinity, temperature, turbidity and nutrient levels.
Discharge in high flow portion of the Murray Mouth to maximise mixing.
Hells Gate high moderate energetic Most of the habitat is sandy surf beach with some offshore rocky reefs. Seagrass beds are generally absent.
Low number of species of molluscs, crustaceans and fish. Very little work has been done on the infauna in this region.
Well established fishery along the Coorong beach for Goolwa Cockle (~400 t/yr). Also mulloway and shark netting along the beach.
No protected areas found in records and no habitats of conservation significance reported.
Southern Right Whale (annual visits) and other whale species. Further species may be identified in a forthcoming summary status of marine fish.
High: Discharge of saline water in an energetic marine environment will result in rapid dilution of salts and nutrients.
Model the discharge to ensure that mixing is effective in all tidal and wave regimes.
Coorong Crossings
high moderate energetic Most of the habitat is sandy surf beach with some offshore rocky reefs. Seagrass beds are generally absent.
Low number of species of molluscs, crustaceans and fish. Very little work has been done on the infauna in this region.
Well established fishery along the Coorong beach for Goolwa Cockle (~400 t/yr). Also mulloway and shark netting along the beach.
No protected areas found in records and no habitats of conservation significance reported.
Southern Right Whale (annual visits) and other whale species. Further species may be identified in a forthcoming summary status of marine fish.
High: Discharge of saline water in an energetic marine environment will result in rapid dilution of salts and nutrients.
Model the discharge to ensure that mixing is effective in all tidal and wave regimes.
Table 6.9 – Summary of Marine Outfalls

Pipeline to the Sea: Feasibility Study - Phase 1
58
7. Outfall Infrastructure
Description of outfalls
The disposal of saline groundwater to the ocean requires the design of an outfall structure to ensure appropriate dispersion throughout the marine environment and prevent adverse impacts. As previously stated, the saline groundwater to be disposed through the Pipeline to the Sea may cover a range of possible salinities. Following discharge, the brine would form a plume that interacts with the ocean, and dependent upon its salinity will sink, float or stabilise in the water. As such, the groundwater stream forms a continuous source of aquatic pollution that, dependent upon the engineering design of the outfall structure, may also be a cumulative source of pollution within the receiving environment.
The main aim for an ocean outfall is to allow the rapid dilution of an effluent solution in order to minimise potential environmental impacts. An ocean outfall generally consists of a long pipe taking the brine solution away from the shore, together with either a single-port opening, or a multi-port diffuser. The design of an ocean outfall will be site-specific, dependent upon the local hydrodynamics of the receiving water. The physical process of brine dilution within sea water is dependent upon both the primary (jet) dilution and the secondary (turbulent) dilution. The former is influenced by the density difference between the saline solution and the seawater, the rate of flow out of the pipeline and the diameter of the pipeline outlet, with the latter influenced by the mixing processes generated by waves and currents.
When a brine stream with lower density than seawater exits the outfall pipeline, the difference in density will drive the saline concentrate towards the surface, and this enhances its diffusion. In this case, a submerged pipe with a single opening may be specified if ambient conditions favour the rapid diffusion of a brine stream.
The design of an ocean outfall is more complicated when the brine solution is denser than the receiving water, with the brine having a tendency to sink and to potentially accumulate on the ocean floor as a layer of higher salinity. This may be detrimental to the marine environment; with large changes in the ambient salinity potentially impacting upon the benthic ecology includes seagrass species. For negatively buoyant brine concentrates, the outfall needs to be designed to increase the turbulent dilution and to increase the volume of seawater that interacts with the brine. This will in turn maximise the brine dilution while minimising the mixing zone.
Multi-port diffusers are often designed in this case, consisting of a header pipe with a series of ports that eject the brine stream into the receiving environment as a series of high-velocity turbulent jets, thus producing a more efficient dispersion of a brine stream. If the pipeline is lying on the sea bed, these ports can be simply openings in the pipe, or if the pipe is buried, these can be attached to vertical risers. Furthermore, duckbill valves are often specified on these ports in order to limit seawater inflow and to reduce marine growth within the diffuser structure. The size, quantity and configuration of these dispersion valves will each impact upon the efficiency of the diffuser

Pipeline to the Sea: Feasibility Study - Phase 1
59
structure, and detailed hydraulic modelling is required in order to produce equal flows out of each port. Ports are generally angled away from the sea-bed to jet the concentrate towards the surface.
Outfall construction
The pipework within a brine disposal system constitutes a large component of the total capital cost. Furthermore, the primary construction technique that is employed can make a significant contribution to both the overall cost of the project, and its potential environmental impact. The construction of ocean outfalls generally follows one of three main construction methods: trenching through the seabed to bury the entire outfall pipeline below the seabed, directional drilling or micro-tunnelling to most effectively bury the outfall pipeline, or limiting trenching to the inter-tidal zone and laying the rest of the outfall pipeline on the seabed. The choice of construction method will be governed by ease of construction that is dependent upon the specific oceanographic, geological and environmental characteristics of the outfall zone, together with the cost of construction.
Whether construction methods are used to retain the majority of the pipeline either on the seabed or whether the pipeline is buried below the surface, it is vital that the risk of potential pipeline breakage due to the effects of ocean current-imposed loads, the dragging of ship anchors or changes in ocean floor due to the dynamic impact of waves and currents are minimised. Outfalls should be buried in the shallow surf zone, where considerable water movement and wave force is possible. Breakages in the outfall pipeline may cause failure of the diffuser design and could result in un-diluted brine exiting the outfall. Regular monitoring of the effectiveness of the diffusion and dispersion of the concentrated brine is required in any ocean outfall construction.
Trenching of the seabed to lay the pipeline is likely to cause the most disturbances to the benthic environment, particularly in the seagrass zone. In order to minimise potential impacts, seagrass may have to be removed prior to trenching, and replanted after the pipeline has been installed and backfilled. Although in many cases directional drilling/micro-tunnelling may be the preferred option for outfall construction, its feasibility (and cost) will be dependent upon the geology of the seabed, with this method generally only practical through a stiff clay or rock material. Geotechnical investigations are essential to determine whether this approach is suitable for the design of the brine disposal system.
Pipeline to the Sea Outfalls
Length of Outfalls
The modelling of the impacts of the outfall discharges (refer Section 6.3.5) indicated that all outfalls considered would achieve sufficient mixing to satisfy the Water Quality Policy. Because of the limited number of model runs performed and limitations on the accuracy of the input data, the optimum length of outfall was not determined. To allow comparison between the full range of pipeline options it is necessary to make value judgements to determine an indicative length of outfall for all options.

Pipeline to the Sea: Feasibility Study - Phase 1
60
The modelling indicated that an outfall length of 250 m was adequate for the Middleton and Coorong options. As this is the minimum outfall length required to satisfy the conditions defining the mixing zone, it is not appropriate to consider shorter outfalls.
For the Port Gawler outfalls the modelling indicated that for the 50 L/s (250 mm diameter outfall) pipeline options an outfall shorter than 2200 m may be adequate. Applying a factor of safety of 2 to the dilution (i.e. a dilution factor of 6.1 x 2 = 12.2 is required) indicates that for the 250 L/s (525 mm diameter outfall) pipeline option an outfall of length 2200 m is required. Similarly, for the 375 L/s (675 mm diameter outfall) pipeline option an outfall length between 2200 m and 4400 m is required. Based on the foregoing discussion a range of outfall lengths for the range of pipeline options considered have been subjectively determined and are presented in Table 7.1.
Pipeline Option (L/s)
Outfall Length (m)
50 1 500
100 2 000
250 2 200
375 2 500
500 3 000
Table 7.1 – Outfall Lengths for Port Gawler Pipeline Options
For the Murray Mouth outfall location it is assumed that the discharge point would be a nominal 100 metres from the edge of the Goolwa Channel to allow discharge to the centre of the channel.
Cost of Outfalls
The modelling of the impacts of the outfall discharges (refer Section
Capital Cost
6.3.5) indicated that the discharge from a single open pipe without diffuser structure would achieve sufficient mixing to satisfy the Water Quality Policy.
To determine estimates of the cost of the outfall infrastructure it has been assumed that the outfall pipe will be buried in the surf zone and lay or be anchored to the sea floor beyond the surf zone. It has further been assumed that directional drilling will be used to bury the outfall pipes in the near shore zone. To achieve sufficient depth of burial and to provide sufficient working space it would not be practical to set up the directional drilling rig at the sea edge. In addition, it would be prudent to avoid construction through the sand dunes of the Coorong and also the water body. It has therefore been assumed that the directional drilling rig would be set up some distance back from the sea edge to allow drilling beneath the water and sand dunes. The assumed set back distance for each outfall is included in Table 7.2.
The surf zone at Port Gawler has been assumed to be 200 m and therefore the majority of the outfall pipe is laid on the sea floor. Due to the relatively short lengths of outfall required for the

Pipeline to the Sea: Feasibility Study - Phase 1
61
discharges into the Southern Ocean it has been assumed that the entire length of outfall will be directionally drilled and no outfall will be laid on the sea floor.
Directional drilling for larger diameter pipes requires drilling of multiple holes of increasing diameter. It may therefore be cost effective for the outfall structures to consist of multiple pipes rather than a single pipe. For simplicity of costing to compare the full range of outfall sizes and locations being considered it has therefore been assumed that the outfall structures consist of multiple numbers of DN355 HDPE pipes. With a discharge velocity of 1.1 m/s a single pipe would discharge approximately 80 L/s. Therefore the 500 L/s pipeline options will require six DN355 outfall pipes.
The cost of directional drilling a single outfall pipe has been assumed to be $1200/metre and the cost of laying a single outfall pipe on the sea floor has been assumed to be $800/metre.
The multiple pipe outfall arrangements will require a concrete chamber to house a manifold and valves to join the single inflow pipeline to the multiple outfall pipes. No specific allowance has been included in the capital cost for the chamber because the cost is considered to be small when compared to the pipework cost. The estimated costs for the range of outfall sizes and locations, based on the above assumptions, are presented in Table 7.2.
The multiple pipe outfall arrangement is simplistic and a more efficient and cheaper outfall could be designed. However, the arrangement adopted is considered sufficient for the purposes of this study, which is principally to allow a comparison of options. Also, the outfall costs estimated are much lower than the capital cost of the pipelines from Stockyard Plain and therefore the comparison of total costs for the various options is relatively insensitive to the cost of the outfall.
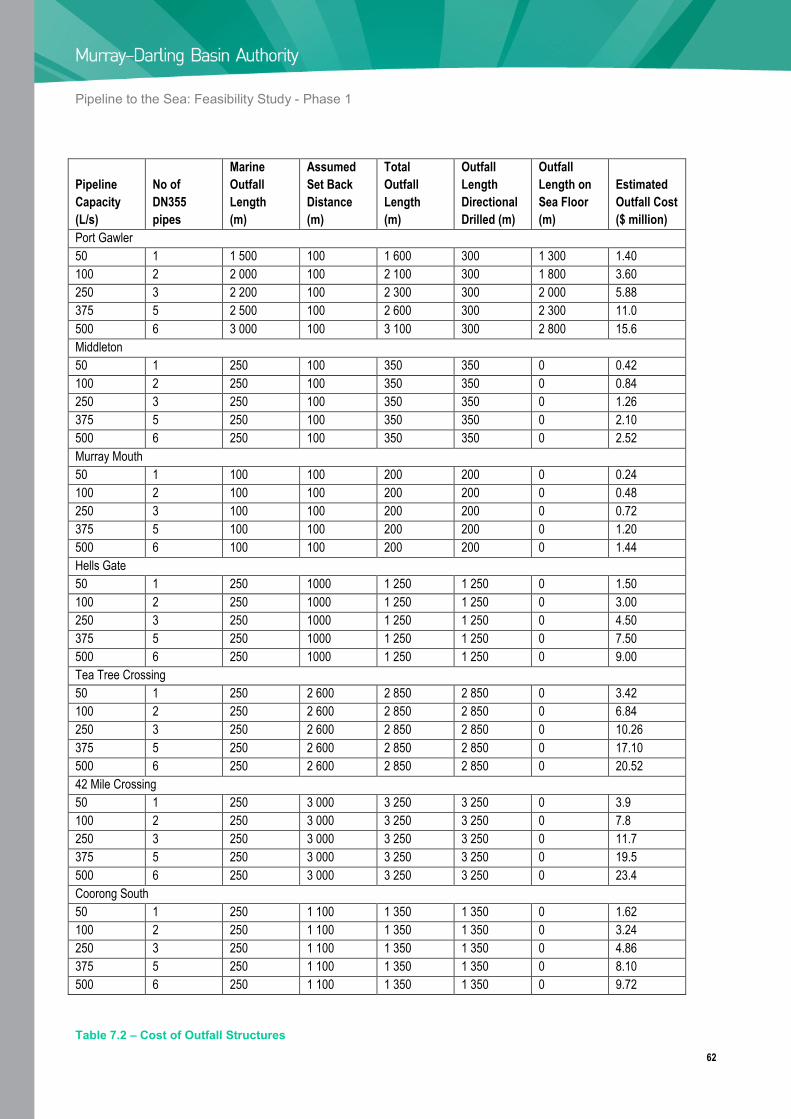
Pipeline to the Sea: Feasibility Study - Phase 1
62
Pipeline Capacity (L/s)
No of DN355 pipes
Marine Outfall Length (m)
Assumed Set Back Distance (m)
Total Outfall Length (m)
Outfall Length Directional Drilled (m)
Outfall Length on Sea Floor (m)
Estimated Outfall Cost ($ million)
Port Gawler 50 1 1 500 100 1 600 300 1 300 1.40 100 2 2 000 100 2 100 300 1 800 3.60 250 3 2 200 100 2 300 300 2 000 5.88 375 5 2 500 100 2 600 300 2 300 11.0 500 6 3 000 100 3 100 300 2 800 15.6 Middleton 50 1 250 100 350 350 0 0.42 100 2 250 100 350 350 0 0.84 250 3 250 100 350 350 0 1.26 375 5 250 100 350 350 0 2.10 500 6 250 100 350 350 0 2.52 Murray Mouth 50 1 100 100 200 200 0 0.24 100 2 100 100 200 200 0 0.48 250 3 100 100 200 200 0 0.72 375 5 100 100 200 200 0 1.20 500 6 100 100 200 200 0 1.44 Hells Gate 50 1 250 1000 1 250 1 250 0 1.50 100 2 250 1000 1 250 1 250 0 3.00 250 3 250 1000 1 250 1 250 0 4.50 375 5 250 1000 1 250 1 250 0 7.50 500 6 250 1000 1 250 1 250 0 9.00 Tea Tree Crossing 50 1 250 2 600 2 850 2 850 0 3.42 100 2 250 2 600 2 850 2 850 0 6.84 250 3 250 2 600 2 850 2 850 0 10.26 375 5 250 2 600 2 850 2 850 0 17.10 500 6 250 2 600 2 850 2 850 0 20.52 42 Mile Crossing 50 1 250 3 000 3 250 3 250 0 3.9 100 2 250 3 000 3 250 3 250 0 7.8 250 3 250 3 000 3 250 3 250 0 11.7 375 5 250 3 000 3 250 3 250 0 19.5 500 6 250 3 000 3 250 3 250 0 23.4 Coorong South 50 1 250 1 100 1 350 1 350 0 1.62 100 2 250 1 100 1 350 1 350 0 3.24 250 3 250 1 100 1 350 1 350 0 4.86 375 5 250 1 100 1 350 1 350 0 8.10 500 6 250 1 100 1 350 1 350 0 9.72
Table 7.2 – Cost of Outfall Structures

Pipeline to the Sea: Feasibility Study - Phase 1
63
For all outfalls, irrespective of size and location, a nominal annual operating cost of $50 000 has been adopted. This figure will have minimal impact on the total project cost but has been included to highlight that the cost is negligible compared to other cost components.
Operating and Maintenance Cost

Pipeline to the Sea: Feasibility Study - Phase 1
64
8. Concentration Techniques
Introduction
As discussed in Section 2, it may be cost effective to concentrate the groundwater at the Stockyard Plain Basin to a higher salinity to enable a smaller, and less expensive, pipe to transport the same volume of salt.
Concentration via solar evaporation
The concentration of groundwater by solar evaporation has traditionally been the primary method used to concentrate and dispose of saline wastes in evaporation ponds throughout the Murray-Darling Basin. This approach has low capital and negligible operating cost, although it generally requires large areas of land to be developed and presents risks such as the time taken for concentration of the saline solution, the risk of leakage to local groundwater and the significant loss of the basic water resource.
Solar evaporation is well suited to the Riverland area of the Murray-Darling Basin, having a high potential evaporation/ precipitation ratio. Stockyard Plain has an average annual rainfall of approximately 250 mm, with average annual pan evaporation of approximately 1760 mm. The efficiency of solar evaporation for the concentration of saline groundwater is directly related to the surface area of the ponds.
Evaporation basins have been an important facet of water resource management in the Murray-Darling Basin for many years, being the lowest cost option for the disposal of high salinity drainage water. For evaporation basins designed to store saline groundwater that is extracted in order to lower water tables, leakage plays an important role allowing basins to operate longer and to utilise a smaller area. It is recommended that evaporation basins such as these should be allowed to leak at a low rate, with interception drains designed to intercept most of the leakage (Jolly et al., 2000). Controlled low rates of leakage provide the possibility for leakage to be contained, and ensuring the longevity of the basin. Controlled leakage prevents these evaporation basins from becoming too saline, which will reduce the rate of evaporation.
The design of evaporation basins instead for concentrating saline groundwater prior to its removal from Stockyard Plain requires leakage to be minimised, with lined basins the most likely solution.
It is acknowledged that the area in the vicinity of the Stockyard Plain Basin may not be an ideal location for an evaporation basin if salt is to be harvested because of likely excessive seepage rates. However, given the success of the Pyramid Creek scheme in producing harvestable salt from basins lined with HDPE liner it is considered that the non-ideal location at Stockyard Plain should not be a deterrent to further consideration. It is also acknowledged that the existing Stockyard Plain Basin could be modified to allow salt to be harvested.

Pipeline to the Sea: Feasibility Study - Phase 1
65
Climate Change
As the effectiveness of evaporation basins is dependent upon nett evaporation, discussion on likely evaporation rates in the future is warranted. CSIRO (2007) predicts that the enhanced greenhouse effect due to human activities will cause measurable changes in Australia’s climate over the next sixty years.
A range of climate models were considered by CSIRO and projections indicated an increase in potential evapotranspiration throughout Australia but did not include pan evaporation rates in these predictions. The projected increase in evapotranspiration is up to 10% by 2070 in the south, depending upon which climate model is adopted. Although pan evaporation was not modelled, CSIRO note that from 1970 to 2005 there has been a non-statistically significant decline in pan evaporation rates across Australia.
CSIRO also predicts increases in temperature and wind speed and a decrease in rainfall in southern Australia. It is predicted that rainfall will decrease by approximately 2% to 5% by 2030 and by approximately 10% by 2070. Although not stated in the CSIRO report, these changes in climatic variables would indicate an increase in pan evaporation over the next sixty years.
This assumed increase in pan evaporation rate has not been factored into the determination of evaporation basin areas (refer Section 8.5). This omission is likely to result in conservative estimates of evaporation basin area but is considered unlikely to be significant in terms of evaporation basin cost given the uncertainty in the adopted unit cost of basins (refer Section 8.7).
Opportunistic production of other products
In order to remove a given quantitiy of salt from Stockyard Plain, both capital and pumping costs are directly related to the concentration of the saline groundwater. To increase the saline concentration at the Stockyard Plains site, water needs to be removed. If this is undertaken through solar evaporation, water will be lost to the atmosphere, producing a concentrated saline solution that is then pumped from the site.
The saline groundwater can instead be concentrated through a range of alternative methods that, through the input of energy, can capture this water. In this regard processes that have been developed for the desalination of brackish or saline sources to produce potable water for human consumption could be adapted. These processes include membrane-based technologies such as Reverse Osmosis, or thermal desalination technologies such as multi-stage flash distillation. The desire to produce concentrated saline effluent can then be coupled with the production of a “waste” stream of desalinated (potable) water, which would reverse the traditional paradigm of desalination plants, in which the concentrated brine is the “waste” stream.
The large energy consumption associated with established desalination processes leads to both large operating costs and potentially large environmental impacts through the associated greenhouse gas emissions if non-renewable energy sources are used. In this application, the cost of supplying energy could be offset slightly through the sale of the desalinated (potable) water for

Pipeline to the Sea: Feasibility Study - Phase 1
66
irrigation or similar purposes in the vicinity of Stockyard Plain. Under such a scenario, it could not be assumed that water would be sold at a price that would enable full cost recovery from the desalination process, as this is likely to exceed prices paid for irrigation licences on the open market. However the sale of “waste” water for comparable prices would provide a degree of cost recovery to a process that would require less land to be developed than would be required for solar evaporation ponds. One of the major requirements for the adoption of desalination technologies is suitable power supply to Stockyard Plain. If existing power supply infrastructure is inadequate, this may represent a significant capital cost to establishing this process.
The costs associated with the construction and operation of evaporation ponds can be reduced through establishing relationships with productive activities. As an example of such synergies, the production of concentrated saline solution can be linked to salinity gradient solar ponds, which combine the collection of solar energy with the long-term storage of thermal energy. Salinity gradient solar ponds typically consist of three layers of increasing salinity. The surface layer, called the upper convective zone (UCZ), consists of saline water with concentration typically 10 000-40 000 mg/L. The second layer is called the non-convective zone, and contains a salinity gradient that increases with depth, insulating the lower convective zone that contains saturated or near-saturated brine with concentration approximately 260 000 mg/L. The lower layer captures sunlight, with solar energy only able to escape by conduction. With the heat conductivity of water being very low, the heat loss from solar ponds is consequently very low. The insulating properties that are inherent in the design of these ponds combined with the relatively high heat capacity of the large volumes of water in the pond allow the lower layer to increase in temperature, up to 90°C. This efficiently stored heat can then be used for various industrial purposes, including the generation of electricity.
In various trials, heat stored within solar ponds has been extracted to generate electricity which in turn is utilised in a desalination process that produces concentrated saline solution which can augment the solar pond. Solar ponds can combine the brine disposal, heat recovery and the salinity augmentation of a pond by using heat generated by the pond to drive a turbine to further desalinate saline water. A two-year research project conducted by the Royal Melbourne Institute of Technology and funded by the Victorian and Australian Governments is investigating opportunities to desalinate water using solar thermal energy. Field trials are being conducted at Pyramid Hill, Victoria, at the site of the salt production facilities to determine whether the solar pond can generate sufficient energy to supply the needs of a commercial salt crystallisation plant. This research has investigated the use of thermal desalination techniques such as multi-stage flash units and multiple-effect evaporation units to extract fresh liquid water from the vaporisation of heated brine. The cost and supply of this electricity from the national electricity grid to Stockyard Plain may be prohibitive, and its generation on the Stockyard Plain site would therefore offer clear cost savings, together with offering a source of renewable energy with no greenhouse gas emissions. However this technology remains in its infancy, and full-scale trials need to first be completed.

Pipeline to the Sea: Feasibility Study - Phase 1
67
Evaporation Basin Model
General
To assess the range of options highlighted in Section 2 it is necessary to determine the area of evaporation basins required to achieve the selected salinities, namely 20 000 mg/L, 60 000 mg/L and 100 000 mg/L. In addition, the area of basins required to concentrate the groundwater to 41 000 mg/L for compatibility with the Cheetham Salt operations at Dry Creek and Price is required. For the 20 000 mg/L options it is assumed that groundwater can be pumped directly from the vicinity of the Stockyard Plain Basin outfall as the salinity of the intercepted groundwater discharged to the basin is typically about 19 000 mg/L.
Delta Environmental Consulting were engaged to determine the evaporation basin areas because of its experience with the operation of the Cheetham Salt ponds at Dry Creek and because it has an existing spreadsheet model used to design evaporation basins. The results of the modelling by Delta Environmental Consulting are described in a separate report (Delta Environmental Consulting, 2007) and summarised within this section.
Model Methodology
The model calculates the appropriate evaporation area for saline brines using a simple mass balance calculation. The inputs are water and salts from various sources, such as direct inputs, groundwater inflow and rainfall, and are modified over time by the evaporation of freshwater, dilution by rain, deposition of salts and/or seepage of saline water. As normal evaporation calculations are confounded by the presence of salts in the water, the model uses the McCarthy evaporation factor formulas, derived from the work of CW Bonython in the late 1950’s at ICI in South Australia.
The formula used for determining the evaporation factor for each concentrator pond is:
1 - 0.959048 x Average Pond SG-1
+ 9.08057 x (Average Pond SG-1)2 -102.371 x (Average Pond
SG-1)3 + 242.458 x (Average Pond SG
-1)
while the formula for each Crystalliser Pond is;
1.3571 – 0.6176 x SG
The formulas were written using specific gravity (SG) of the brines, and so the model uses Baseggio’s evaporated seawater tables to determine the relationship between salt content of the brine and SG. The deposition of salts is calculated using the tables published by Gino Baseggio in the Fourth International Symposium on Salt, in 1974. This produces the salt deposit formula:
(-36.666 x (End SG + Start SG) / 2 + 48.37) x (End SG – Start SG) x 1000)

Pipeline to the Sea: Feasibility Study - Phase 1
68
The model determines the minimum and maximum detention period for each pond by examining the daily inputs (flow in, rain in, evaporation out) against the instantaneous volume of the pond at a steady state condition.
Model Inputs and Assumptions
The evaporation basin model used is based on sea water derived brines. The groundwater discharged into the Stockyard Plain Basin is about half the salinity of sea water and of similar chemical composition to sea water (refer Table 6.1). The groundwater is enriched with gypsum compared to a diluted sea water brine and has less magnesium. The higher concentration of gypsum is unlikely to affect the evaporation rate for the model because gypsum precipitates out while evaporation rates are still high. The lower concentrations of magnesium will result in greater rates of evaporation than predicted by the model. Overall, the chemical composition of the Stockyard Plain water is considered to be similar to that of sea water brines and hence the model results are considered to be sufficiently accurate for this feasibility study.
The weather data used as input to the model were sourced from the Bureau of Meteorology. Rainfall and gross evaporation for Blanchetown and the number of raindays at Waikerie were used, with data presented in Table 8.1.
The model assumes multiple basins as this is necessary to control salinity and prevent biological perturbations which could foul the development of salt. In particular, five concentrator and three crystalliser basins were assumed for all options.
It was assumed that inflow to the evaporation basins would occur continuously throughout the year. The model assumed a seepage rate of 0.6 mm/day from the evaporation basins.
Month Rainfall (mm) No of Raindays Gross Evaporation (mm)
January 16 3 273
February 22 2.3 248
March 12 4.3 180
April 17 5.6 108
May 25 8.3 63
June 25 9.5 45
July 22 11.2 48
August 24 11.8 73
September 24 8.8 110
October 26 7.4 158
November 20 5.3 208
December 20 3.8 245
Annual Total 253 81.3 1 759
Table 8.1 – Weather Data Used in Evaporation Basin Model

Pipeline to the Sea: Feasibility Study - Phase 1
69
Area of Evaporation Basins Required
The model was initially run using both the concentrator and crystalliser components to determine the area of evaporation basin required to produce salt from inflows of 100 L/s and 300 L/s (refer Table 8.2). These runs showed that the relationship between basin area and inflow was almost linear. It was therefore assumed that the area of evaporation basins required was directly proportional to the rate of inflow to the basins. This reduced the number of runs of the model required to assess the full range of options being considered.
Inflow to Evaporation Basins
100 L/s 300 L/s
Salinity of inflow (mg/L) 17 930 17 930
Salts in inflow (t/yr) 56 544 169 632
Area of concentrator ponds (Ha) 199 598
Area of crystalliser ponds (Ha) 10 30
Salts lost in seepage (t/yr) 22 945 68 304
Salts crystallised in ponds (t/yr) 27 724 83 902
Volume of bitterns (L/s) 0.79 2.38
Salts in bitterns (t/yr) 5 876 17 426
Minimum detention in ponds 12 12
Maximum detention in ponds 18 20
Table 8.2 – Area of Evaporation Basins for Salt Harvesting
For the pipeline options where brine is to be pumped to a disposal location, the concentrator component of the evaporation basin model was used. For each of the three desired brine concentrations the model was run assuming an inflow of 300 L/s with salinity of 17 930 mg/L. Table 8.3 provides a summary of the results obtained from the model run.
Outflow Brine Salinity (mg/L)
Area of Evaporation Basins (Ha)
Ratio of Outflow to Inflow
20 000 0 1.0
41 000 375 0.393
60 000 462 0.253
10 000 530 0.144
Table 8.3 – Areas of Evaporation Basins for 300 L/s Inflow
The data in Table 8.3 has been used to determine the area of evaporation basins required to produce brine of the desired salinity for the full range of pipeline sizes being assessed. For a particular pipeline capacity, the outflow rate from the evaporation basins was assumed to be Pipeline Capacity x 20/24 to reflect the assumption that an average of 20 hours pumping per day would be achieved because of breakdowns and maintenance.

Pipeline to the Sea: Feasibility Study - Phase 1
70
An example calculation used to determine the evaporation basin area is provided below;
• For the 100 L/s pipeline options, the required outflow from the evaporation basins is
100x20/24 = 83 L/s.
• For the 60,000 mg/L brine option, an inflow of 83/0.253 = 330 L/s is required to produce
83 L/s of brine at 60 000 mg/L (0.253 from Table 8.3).
• The area of evaporation basins required to produce this volume of brine is 330/300x462 =
508 ha (462 from Table 8.3).
The required evaporation basin areas for each option being assessed are presented in Table 8.4. Some of the areas presented are unrealistic as they correspond to inflows greater than 1000 L/s. For example, for the 500 L/s pipeline option an inflow of 2886 L/s is required to produce sufficient brine of 100 000 mg/L salinity. Although some of the figures are unrealistic they are presented for completeness and comparison purposes.
Salinity of Brine (mg/L) Pipeline Capacity (L/s)
50 100 250 375 500
41 000 133 265 663 994 1 326
60 000 254 508 1 269 1 904 2 538
100 000 510 1 020 2 549 3 824 5 099
Table 8.4 – Area (Ha) of Evaporation Basins Required to Concentrate Groundwater at Stockyard Plain
Cost of Evaporation Basins
Capital Cost
The cost to construct evaporation basins is dependent on the specific site conditions and hence is difficult to estimate for this study. As the principal aim of this study is to compare options, it is assumed that the required evaporation basins can be constructed near the existing Stockyard Plain Basin site.
The existing Stockyard Plain Basin has a significant seepage component and it appears that the equilibrium salinity that can be achieved within the basin complex is less than 50 000 mg/L. Therefore, to achieve brine concentrations of 60 000 mg/L and 100 000 mg/L and also to produce harvestable salt, it is necessary for the constructed evaporation basins to have considerably less seepage than the existing basin. It is assumed that the constructed basins would either be constructed in a low permeable location or lined with clay to produce a low seepage basin. For salt to be harvested it would be necessary to line at least some of the basins with a synthetic membrane.
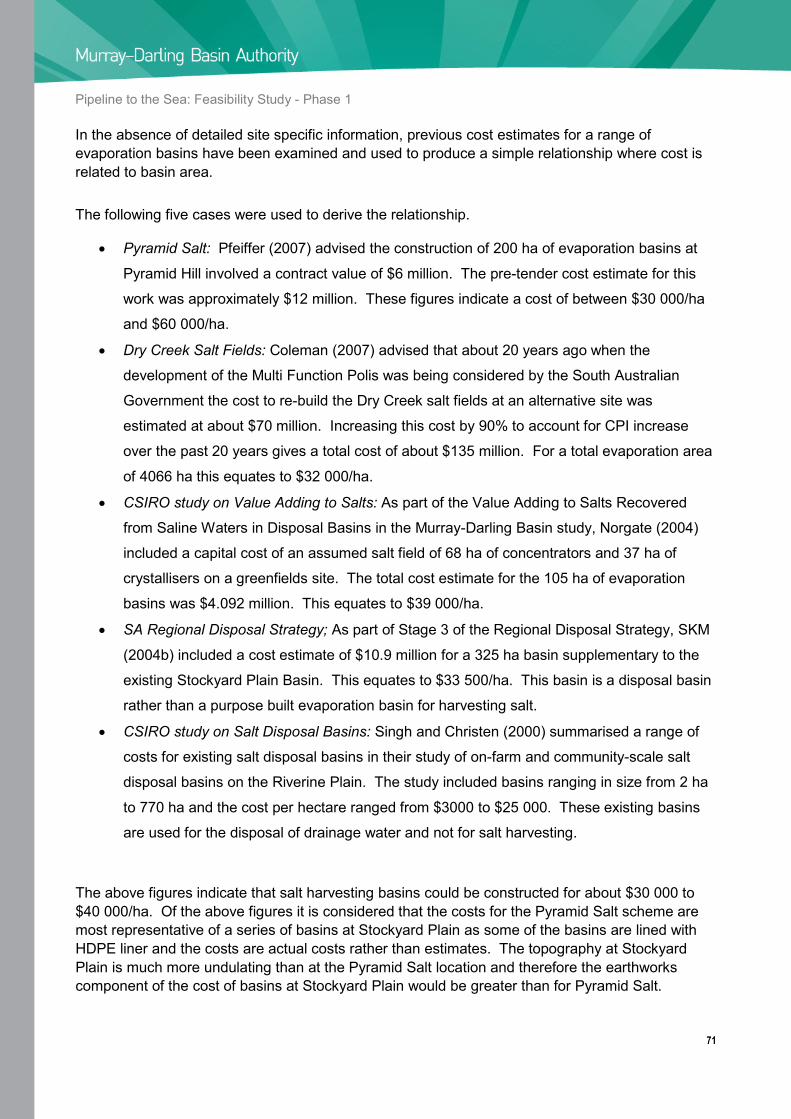
Pipeline to the Sea: Feasibility Study - Phase 1
71
In the absence of detailed site specific information, previous cost estimates for a range of evaporation basins have been examined and used to produce a simple relationship where cost is related to basin area.
The following five cases were used to derive the relationship.
• Pyramid Salt: Pfeiffer (2007) advised the construction of 200 ha of evaporation basins at
Pyramid Hill involved a contract value of $6 million. The pre-tender cost estimate for this
work was approximately $12 million. These figures indicate a cost of between $30 000/ha
and $60 000/ha.
• Dry Creek Salt Fields: Coleman (2007) advised that about 20 years ago when the
development of the Multi Function Polis was being considered by the South Australian
Government the cost to re-build the Dry Creek salt fields at an alternative site was
estimated at about $70 million. Increasing this cost by 90% to account for CPI increase
over the past 20 years gives a total cost of about $135 million. For a total evaporation area
of 4066 ha this equates to $32 000/ha.
• CSIRO study on Value Adding to Salts: As part of the Value Adding to Salts Recovered
from Saline Waters in Disposal Basins in the Murray-Darling Basin study, Norgate (2004)
included a capital cost of an assumed salt field of 68 ha of concentrators and 37 ha of
crystallisers on a greenfields site. The total cost estimate for the 105 ha of evaporation
basins was $4.092 million. This equates to $39 000/ha.
• SA Regional Disposal Strategy; As part of Stage 3 of the Regional Disposal Strategy, SKM
(2004b) included a cost estimate of $10.9 million for a 325 ha basin supplementary to the
existing Stockyard Plain Basin. This equates to $33 500/ha. This basin is a disposal basin
rather than a purpose built evaporation basin for harvesting salt.
• CSIRO study on Salt Disposal Basins: Singh and Christen (2000) summarised a range of
costs for existing salt disposal basins in their study of on-farm and community-scale salt
disposal basins on the Riverine Plain. The study included basins ranging in size from 2 ha
to 770 ha and the cost per hectare ranged from $3000 to $25 000. These existing basins
are used for the disposal of drainage water and not for salt harvesting.
The above figures indicate that salt harvesting basins could be constructed for about $30 000 to $40 000/ha. Of the above figures it is considered that the costs for the Pyramid Salt scheme are most representative of a series of basins at Stockyard Plain as some of the basins are lined with HDPE liner and the costs are actual costs rather than estimates. The topography at Stockyard Plain is much more undulating than at the Pyramid Salt location and therefore the earthworks component of the cost of basins at Stockyard Plain would be greater than for Pyramid Salt.

Pipeline to the Sea: Feasibility Study - Phase 1
72
As salt fields for salt harvesting operations consist of a number of ponds rather than a single pond it was considered that a cost per unit area was a valid assumption. To introduce an element of economy of scale, it was assumed that the cost per hectare would vary linearly from $40 000 for small basins to $35 000 for a basin of 5000 ha size. This can be expressed as;
Cost ($/Ha) = 40 000 – Area (in Ha)
This relationship was used to calculate capital cost estimates for the range of evaporation basin areas shown in Table 8.4.
Operation and Maintenance Cost
As with the capital cost of the evaporation basins, the operation and maintenance costs associated with salt harvesting basins has been estimated based on examples provided by others. Norgate (2007) includes an operating cost of $18.49/tonne for his assumed salt field. Delta Environmental Consulting (2007) states that salt can be manufactured in Australia for as little as $4/tonne. Ward (2007) advised that the operation and maintenance cost is highly variable and dependent on the specific operation and said that the cost could vary between $10/tonne and $50/tonne.
For this study the salt harvesting operation would be relatively simple as the salt is to be disposed of rather than marketed and therefore quality is not an issue. The operation and maintenance cost is therefore likely to be at the lower end of the above figures and an annual cost of $10/tonne has been adopted.
For the evaporation basins modelled and presented in Table 8.2, the above operation and maintenance cost equates to $1330/ha of evaporation basin. For the pipeline to the sea options where brine is concentrated but salt not harvested, the operation and maintenance cost of the basins would be less than for the salt harvesting basins. An annual cost of $500/ha has been adopted for this study.
Issues Associated with Evaporation Basins
Table 8.4 indicates that the area of evaporation basins could be quite significant and therefore there could be significant land acquisition costs and issues. These costs have not been included in this assessment.
No attempt has been made to investigate the availability of land for evaporation basins. This is likely to be a significant issue because of the community opposition to further disposal basins in the Riverland.
Additional issues associated with evaporation basins are the leakage from the basins and the environmental implications and also the disposal of bitterns produced if salt is harvested. The quantity of bitterns likely to be produced would probably be able to be used as a dust suppressant for roads in the local area.

Pipeline to the Sea: Feasibility Study - Phase 1
73
Concentration by Desalination
An alternative to concentrating the brine by evaporation is to use desalination techniques. Rather than losing water by evaporation, the use of desalination would produce fresh water which could be either sold to irrigators or returned to the River Murray as an environmental flow.
URS (2002) estimated the capital cost associated withaseawater reverse osmosis (RO) plants as $1600 to $2500 per kL/day of product water. Similarly the cost of brackish RO plants is listed as $600 to $1800 per kL/day of product water. The inflow water to the Stockyard Plain Basin is about 20 000 mg/L and is therefore more saline than brackish water and less saline than seawater. For this study it is assumed that the cost of a desalination plant is $1800 per kL/day of product water.
It is also assumed that a recovery rate of 80% can be achieved so that a brine concentration of 100 000 mg/L can be produced from the inflow water of 20 000 mg/L. Such a recovery rate is optimistic for saline inflow water but could be achieved by multiple staging.
The cost of 4 desalination plants has been estimated on the basis of the quantity of fresh water produced to achieve brine quantities of 50 L/s and 100 L/s and brine concentrations of 60 000 mg/L and 100 000mg/L. The estimated costs are presented in Table 8.5. Table 8.5 also presents the estimated cost of evaporation basins required to achieve the same quantity and concentration of brine.
Brine Concentration (mg/L)
Assumed Recovery Rate of Desalination Plant (%)
Quantity of Brine (L/s)
Required Inflow to achieve brine quantity (L/s)
Quantity of Fresh Water produced (L/s)
Cost of Desalination Plant ($ million)
Cost of Evaporation Basins ($ million)
60 000 67 50 150 100 15.5 10.1
60 000 67 100 300 200 31.0 20.1
100 000 80 50 250 200 31.0 20.1
100 000 80 100 500 400 62.0 39.8
Table 8.5 - Estimated Cost of Reverse Osmosis Desalination Plants
Table 8.5 shows that the capital cost of the desalination plants is about 50% greater than the capital cost of evaporation basins to achieve the same quantity of brine.
The operation and maintenance costs associated with the desalination plants is considerably greater than the operation and maintenance costs associated with the evaporation basins. URS (2002) indicate operating cost estimates of $0.65 to $1.50/kL of product water for brackish RO plants and $1.89 to $2.20/kL for seawater RO plants. The fresh water produced by the desalination could be sold to irrigators or returned to the river as environmental flows. It is conceivable that the value of this water could be greater than the operation and maintenance costs associated with the desalination plants and therefore the sale of the water could offset the cost of the infrastructure.

Pipeline to the Sea: Feasibility Study - Phase 1
74
If the fresh water produced was sold or returned to the river, a pipeline and pump station would be required. Stockyard Plain Basin is approximately 10 km from the River Murray and therefore a further $5 million to $10 million would be required for this infrastructure.
The power demand associated with desalination plants is significant. Melbourne Water and GHD (2007) give a typical total power use at seawater RO plants of around 4 kWh/kL of water produced. For the 4 desalination options listed in Table 8.5 the estimated power demands range from 1.9 MW to 7.6 MW. A pump station is required at the Stockyard Plain Basin to transfer the brine to the sea and the cost to upgrade the electricity network has been included in Section 5.6. The incremental cost to provide sufficient power for the desalination plant is therefore the cost of a larger transformer and hence is not expected to be significant in comparison with the capital cost of the desalination plant.
The above is a crude assessment but indicates that concentrating the brine by desalination warrants further more detailed consideration. The desalination option is also attractive in that additional evaporation basins would not have to be constructed.

Pipeline to the Sea: Feasibility Study - Phase 1
75
9. Ecological Issues
Desktop Study
A desktop study was undertaken by Ecological Associates to assess ecological issues associated with the potential routes for the pipeline to the sea. The study covered the three principal alternative routes; namely the Dry Creek, Middleton and Murray Mouth and the Coorong routes. The Port Wakefield route was not investigated as it was considered to be a non-preferred route following estimation of pipeline costs and initial consideration of marine outfalls.
The main ecological impact of the construction of a pipeline is associated with the clearance of native vegetation along the alignment and the loss of habitat. A separate report of the study has been prepared (Ecological Associates, 2007) while a summary of key findings are presented in the following sections.
Stockyard Plain Basin
The Stockyard Plain Basin is within the Holder Environmental Association (Laut et al., 1977) and occupies a natural depression in mallee scrub. The basin has extensive areas of shallows and many inlets and embayments which add to its structural diversity and visual amenity and is of considerable value as a refuge in times of drought (Woodward-Clyde, 1998).
Stockyard Plain Basin is listed in the Directory of Important Wetlands (Environment Australia, 2001) and is regarded as having important conservation value, largely because of the diversity and numbers of bird species recorded on the site. Forty waterbirds and more than 100 other bird species have been recorded at the basin. Three nationally listed bird species have been recorded in the mallee habitats; Malleefowl (Leiopoa ocellata), Redlored Whistler (Pachycephala rufogularis) and Regent Parrot (Polytelis anthopeplus). A further 10 bird species found at the basin have state conservation listings.
The proposal to divert saline groundwater from the basin potentially impacts on the conservation values of the site. Even though the wetland was created through the disposal of saline water, it has developed important conservation values, particularly as a habitat for waterbirds, including threatened and migratory species. A reduction in inflows to the basin could impact on the site by reducing the area of wetland or wetland habitat and therefore carrying capacity of the site. Also, reduced inflows to the basin could increase the salinities to levels beyond the tolerance of food-species (eg macroinvertebrates and aquatic vegetation) that are currently used by waterbirds and therefore reduce the carrying capacity of the site.

Pipeline to the Sea: Feasibility Study - Phase 1
76
Pipeline Alignments
Methodology
To assess the nature and scale of matters of conservation significance likely to be encountered along the alternative pipeline routes it was decided to use the database of roadside vegetation mapping as this provides a scored rating of significance for the roadside vegetation. It is recognised that roadside vegetation is likely to be better preserved than vegetation elsewhere and that this approach may over-emphasise the conservation issues but as a first-pass, to discern the relative impact of alternative routes, this approach was considered appropriate.
It should be recognised that while roadsides may be representative of regional native vegetation extent, condition and types, other plant communities and conservation issues may be encountered if a route outside of road reserves is selected.
To assess the three principal pipeline alignments, namely Port Gawler, Middleton-Murray Mouth and Coorong, the alignments were sub-divided into 12 assessment zones. For each zone an assessment of the roadside vegetation was made using the Roadside Vegetation (Floristic) – Arcs dataset (Department of Environment and Heritage, 2007). This dataset reports the composition, condition and significance of the roadsides based on on-ground mapping of road reserve segments. The dataset contains an Overall Significance Score as outlined in Table 9.1.
Overall Significance Score Description
A Contains a high priority vegetation association in excellent or near excellent condition
B Contains a high priority vegetation in moderate condition or a lower priority association in excellent condition
C Contains a high priority vegetation association in poor condition or a lower priority vegetation association in moderate condition
D Contains limited native vegetation in poor condition
E Very little or no native vegetation present
Z Built-up area or bare ground
Table 9.1 – Overall Significance Score
Each segment of roadside vegetation was assigned to one of the categories described in Table 9.2. It was decided to determine the extent of potentially high value vegetation on both sides of the road as this would indicate where it was not possible to avoid the vegetation by crossing the road.
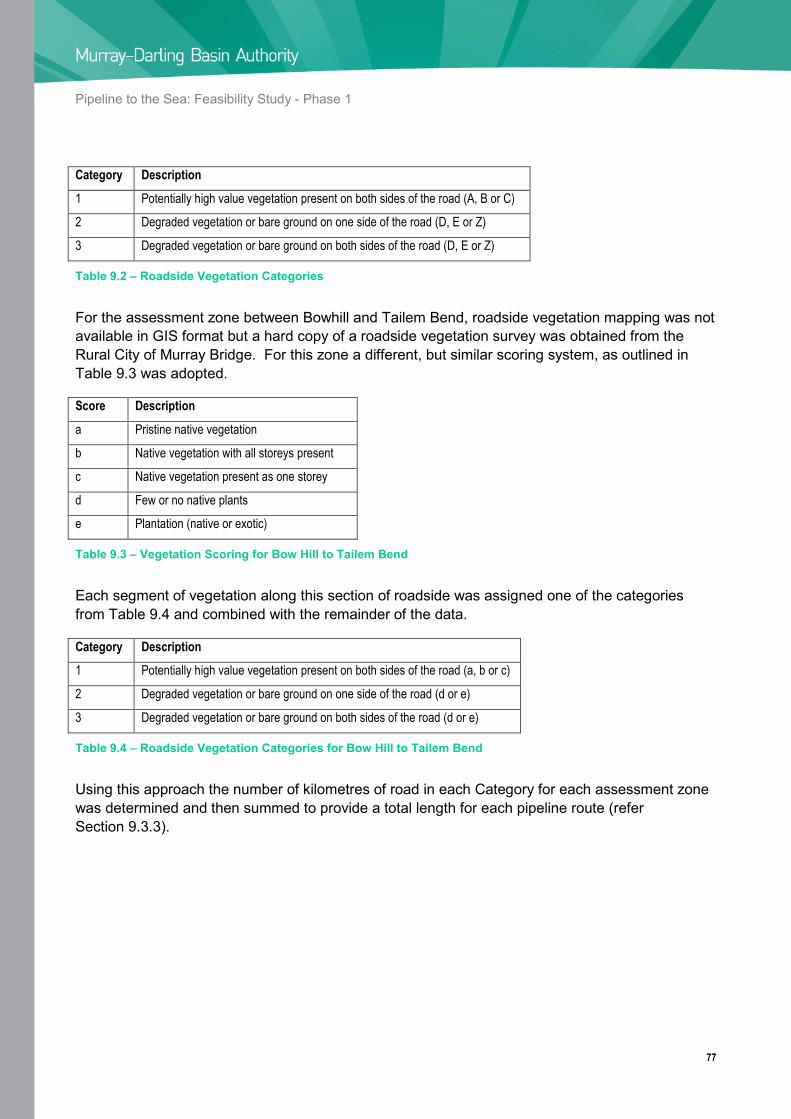
Pipeline to the Sea: Feasibility Study - Phase 1
77
Category Description
1 Potentially high value vegetation present on both sides of the road (A, B or C)
2 Degraded vegetation or bare ground on one side of the road (D, E or Z)
3 Degraded vegetation or bare ground on both sides of the road (D, E or Z)
Table 9.2 – Roadside Vegetation Categories
For the assessment zone between Bowhill and Tailem Bend, roadside vegetation mapping was not available in GIS format but a hard copy of a roadside vegetation survey was obtained from the Rural City of Murray Bridge. For this zone a different, but similar scoring system, as outlined in Table 9.3 was adopted.
Score Description
a Pristine native vegetation
b Native vegetation with all storeys present
c Native vegetation present as one storey
d Few or no native plants
e Plantation (native or exotic)
Table 9.3 – Vegetation Scoring for Bow Hill to Tailem Bend
Each segment of vegetation along this section of roadside was assigned one of the categories from Table 9.4 and combined with the remainder of the data.
Category Description
1 Potentially high value vegetation present on both sides of the road (a, b or c)
2 Degraded vegetation or bare ground on one side of the road (d or e)
3 Degraded vegetation or bare ground on both sides of the road (d or e)
Table 9.4 – Roadside Vegetation Categories for Bow Hill to Tailem Bend
Using this approach the number of kilometres of road in each Category for each assessment zone was determined and then summed to provide a total length for each pipeline route (refer Section 9.3.3).

Pipeline to the Sea: Feasibility Study - Phase 1
78
Vegetation Types and Significance
The Roadside Vegetation dataset highlighted the following broad vegetation types as being likely to be encountered along the potential pipeline alignments.
Mangrove Forests The proposal potentially impacts on Mangrove Forests at the outfall site near the Port Gawler Conservation Park. Mangrove Forests and their associated Samphire dominated plant communities provide habitat for a significant number of resident sea birds and migratory waders (Graham et al., 2001).
Woodlands Woodlands provide an important habitat due to their structure. They are particularly important for many species of birds feeding on nectar, ground-seeds, and open-ground insects; and for their nesting hollows (Kahrimanis et al., 2001). Woodlands are important habitat for ground-foraging and bark or hollow nesting mammals and are also habitat for many threatened reptile species (Kahrimanis et al., 2001).
Mallee Mallee occurs as a mosaic of plant communities providing different resources for a diverse assemblage of species. For example, 163 species of bird were recorded in the Biological Survey of the Murray Mallee. Many species require large areas to sustain viable populations, eg Malleefowl. There are several Mallee-specific or -dependent species in the Murray-Darling Basin, eg Southern Ningaui and Scarlet Chested Parrot (Kahrimanis et al., 2001).
Shrublands Shrublands can be biologically diverse, both as individual communities and where interspersed with other associations such as mallee. The State Rare Chestnut Quail-thrush (Cinclosoma castanotus) utilises Acacia Shrublands in the Murray Mallee (Kahrimanis et al., 2001).
Chenopod Shrublands Chenopod Shrublands appear to be the habitat for a high number of relatively common fauna. Some groups of mammals, birds and reptiles can be related directly to different forms of Chenopod Shrublands (Kahrimanis et al., 2001).
Shrublands of Wet Areas Shrublands of Wet Areas are frequently ecologically important components of wetlands, where they provide nesting habitat for waterbirds and their flowers and foliage provide food sources and cover for a variety of insects, reptiles and small mammals.
Grasslands Temperate native grasslands provide habitat for a wide range of plant and animal species that do not occur in the more common and better preserved plant communities. Even degraded grasslands still provide habitat for a variety of species (Kahrimanis et al., 2001).

Pipeline to the Sea: Feasibility Study - Phase 1
79
Sedgelands
Summary of Vegetation Assessment
Sedgelands form a transition zone between terrestrial and aquatic ecosystems. They provide shelter and breeding sites for a diverse range of invertebrates, fish, frogs, and birds. They contribute to the organic content of wetlands and also serve to stabilise and protect the shoreline from wave erosion (Kahrimanis et al., 2001).
For each pipeline alignment the length of roadside vegetation within each Roadside vegetation Category was determined and summarised in Table 9.5. The quantity of high value vegetation on both sides of the road is an indication of the potential impact on conservation values. Table 9.5 indicates that the Coorong pipeline alignments have the greatest potential impact on conservation values while the Port Gawler alignment has the lowest potential impact.
Pipeline Route
Roadside Length in each Vegetation Category (km)
Length of Roadside for which Vegetation Data Available (km)
% of Vegetation in Category 1
Length of Roadside for which no Vegetation Data Available (km) 1 2 3
Port Gawler 18.3 15.7 117.0 151.0 12 34.0
Middleton 57.2 23.9 123.0 204.1 28 50.9
Murray Mouth 57.2 26.6 127.4 211.2 27 53.8
Hells Gate 73.3 27.6 112.6 213.5 34 26.5
Tea Tree Crossing 75.7 28.9 146.0 250.6 30 29.4
42 Mile Crossing 88.1 30.6 149.3 268.0 30 27.0
Coorong South 94.4 40.2 172.2 306.8 31 23.3
Table 9.5 – Summary of Roadside Vegetation Assessment
The potential impact of each pipeline alignment can be furthered compared by considering the conservation reserves in close proximity to the pipeline alignment. Routes that pass close to, or through, conservation reserves are more likely to impact on matters of conservation significance.
The most significant conservation reserve encountered is the Coorong National Park. The Coorong has high conservation significance due to the abundance and diversity of waterbirds it supports, its fish fauna and its native plant communities. It is recognised as an internationally significant wetland under the Ramsar Convention and is therefore protected under the Environment Protection (Biodiversity Conservation Act), 1999. The Act requires that any disturbance must not significantly impact on the ecological character of the site as set out in the Ecological Character Description (Phillips and Muller 2006).

Pipeline to the Sea: Feasibility Study - Phase 1
80
A summary of potential impacts for each alignment is summarised below;
Port Gawler This route has a relatively low risk of impacts on conservation values. A high proportion of the roadside on this route has been cleared of native vegetation. The route passes only one conservation reserve and one Heritage Agreement area.
Middleton This route has an intermediate risk of impact on conservation values. An intermediate proportion of the roadside on this route has been cleared of native vegetation. The route passes one conservation reserve and several Heritage Agreement areas.
Murray Mouth This route is considered to have a medium risk of impact on conservation values. A medium proportion of the roadside on this route has been cleared of native vegetation. The route passes one conservation reserve, passes through the Coorong National Park, and passes several Heritage Agreement areas. The route enters the Lower Lakes and Coorong Ramsar Area.
Hells Gate This route is considered to have a relatively high risk of impact on conservation values. A lower proportion of the roadside on this route has been cleared of native vegetation, and the route passes three conservation reserves, passes through the Coorong National Park, and passes several Heritage Agreement areas.
Tea Tree Crossing and 42 Mile Crossing These routes are considered to have relatively high risks of impact on conservation values. A lower proportion of the roadside on these routes has been cleared of native vegetation and the routes pass four conservation reserves and several Heritage Agreement areas, and pass through the Coorong National Park.
South of Coorong National Park
Other Vegetation Issues
This route is considered to have a relatively high risk of impact on conservation values. A lower proportion of the roadside on this route has been cleared of native vegetation but overall it impacts on a relatively high total length of roadside vegetation. The route passes four conservation reserves and passes several Heritage Agreement areas.
The three principal pipeline alignments pass through areas where the following three vegetation related diseases have been identified.
The Middleton-Murray Mouth and Coorong alignments pass through Branched Broomrape Quarantine areas north east of Murray Bridge. When working within these areas the movement of
Branched Broomrape

Pipeline to the Sea: Feasibility Study - Phase 1
81
soil is restricted as it may contain Broomrape seed. Any machinery, tools, vehicles etc. which have been in contact with soil must be decontaminated by the Branched Broomrape Program. Movement of other items, which may contain broomrape seed, from the containment area is also restricted. All items require certification prior to removal and may require washdown or be refused due to high risk.
Mundulla Yellows Mundulla Yellows is a disease of Eucalypts and other native plants that is characterised by progressive yellowing and die-back of foliage, resulting in the death of the affected plants over several years. There appears to be a strong association between the presence of Mundulla Yellows symptoms and vegetation on roadsides, and/or in areas that had been disturbed in some way by humans, such as urban parklands, farm paddocks, quarries, cemeteries and car parks. The cause of Mundulla Yellows is yet to be determined and there has been no success in re-establishing healthy plants on sites with Mundulla Yellows dieback. All three pipeline alignments pass through areas where Mundulla Yellows has been identified.
Phytophthora Phytophthora are soil and waterborne fungi that cause disease and death to a wide variety of native plant species, exotic fruits and vegetables. All three principal pipeline alignments are in close proximity to reported locations of Phytophthora infestation.

Pipeline to the Sea: Feasibility Study - Phase 1
82
10. Aboriginal Heritage
Desktop Study
A desktop research study was undertaken by Australian Cultural Heritage Management (ACHM) to identify Aboriginal cultural heritage issues associated with the potential routes for the pipeline to the sea. The study covered the three principal alternative routes; namely the Dry Creek, Middleton and Murray Mouth and the Coorong routes. The Port Wakefield route was not investigated as it was considered to be a non-preferred route following estimation of pipeline costs and initial consideration of marine outfalls.
The study reviewed available information to provide an overview, risk assessment and recommended procedures for Aboriginal cultural heritage management and Aboriginal group consultation in relation to the known and likely occurrence of Aboriginal heritage sites along the three alternative routes. A separate report of the study has been prepared (ACHM, 2007) while a summary of key findings are presented in the following sections.
Aboriginal Heritage Sites
The following databases were searched to identify any previously recorded Aboriginal heritage sites along the potential pipeline alignments;
• Aboriginal Affairs and Reconciliation Division Central Archive
• SA State Heritage Register
• SA Museum Anthropology Database
• Australian Heritage Database
• ACHM corporate archives.
The search revealed a total of 22 sites recorded within 50 metres of the proposed pipeline alignments (refer Table 10.1). Thirteen sites were recorded along the Coorong pipeline routes, 10 along the Middleton and Murray Mouth routes and 3 along the Dry Creek routes. It should be noted that the sum of the above number of sites exceeds 22 because 4 sites were recorded along the section of alignment common to both the Coorong and Middleton and Murray Mouth routes.
In addition to the recorded sites there is also a large amount of Aboriginal skeletal material with poor provenance collected from localities along the alternative three routes. There are also locations entered on the Register of the National Estate in the vicinity of the pipeline routes with the potential to contain Aboriginal sites and/or heritage values. It is the opinion of ACHM that there is a high potential for the project areas to contain unrecorded Aboriginal sites, particularly along the Coorong Routes and the Middleton and Murray Mouth Routes.

Pipeline to the Sea: Feasibility Study - Phase 1
83
As Aboriginal heritage sites have been identified for the pipeline routes during the heritage register searches, the MDBC has a legal obligation to not “damage, disturb or interfere” with these identified Aboriginal sites without the prior written authorisation from the South Australian Minister for Aboriginal Affairs and Reconciliation.
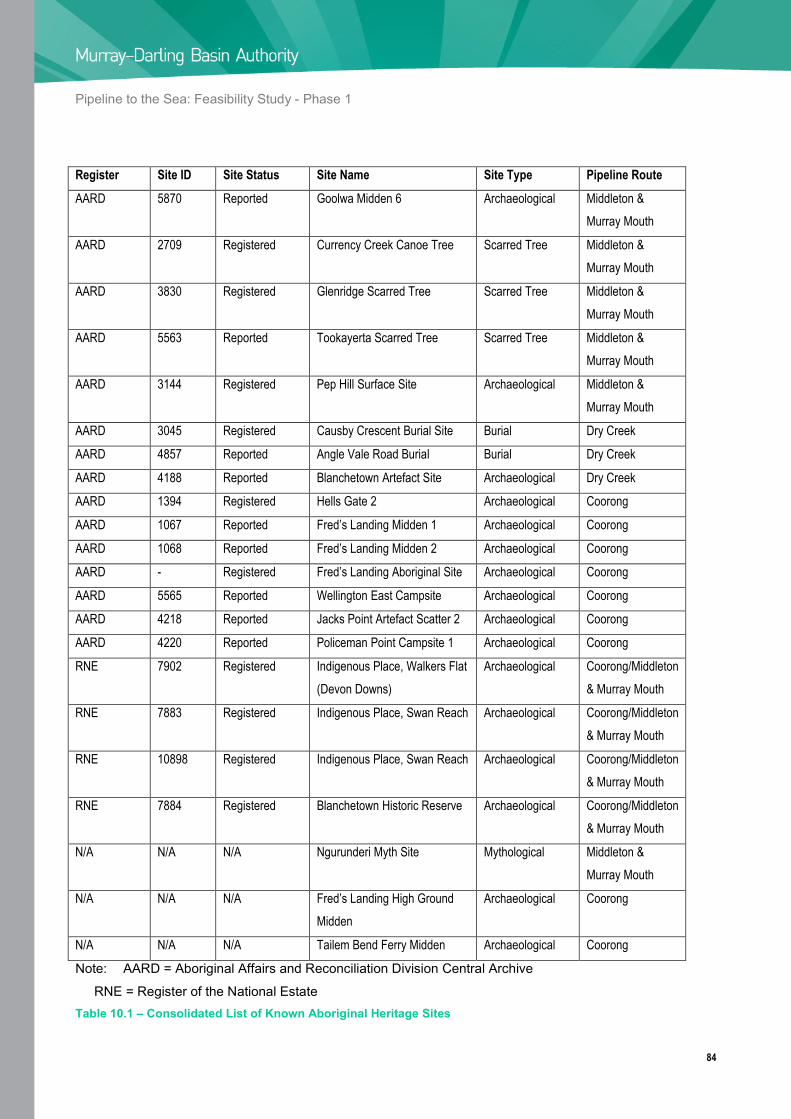
Pipeline to the Sea: Feasibility Study - Phase 1
84
Register Site ID Site Status Site Name Site Type Pipeline Route
AARD 5870 Reported Goolwa Midden 6 Archaeological Middleton & Murray Mouth
AARD 2709 Registered Currency Creek Canoe Tree Scarred Tree Middleton & Murray Mouth
AARD 3830 Registered Glenridge Scarred Tree Scarred Tree Middleton & Murray Mouth
AARD 5563 Reported Tookayerta Scarred Tree Scarred Tree Middleton & Murray Mouth
AARD 3144 Registered Pep Hill Surface Site Archaeological Middleton & Murray Mouth
AARD 3045 Registered Causby Crescent Burial Site Burial Dry Creek
AARD 4857 Reported Angle Vale Road Burial Burial Dry Creek
AARD 4188 Reported Blanchetown Artefact Site Archaeological Dry Creek
AARD 1394 Registered Hells Gate 2 Archaeological Coorong
AARD 1067 Reported Fred’s Landing Midden 1 Archaeological Coorong
AARD 1068 Reported Fred’s Landing Midden 2 Archaeological Coorong
AARD - Registered Fred’s Landing Aboriginal Site Archaeological Coorong
AARD 5565 Reported Wellington East Campsite Archaeological Coorong
AARD 4218 Reported Jacks Point Artefact Scatter 2 Archaeological Coorong
AARD 4220 Reported Policeman Point Campsite 1 Archaeological Coorong
RNE 7902 Registered Indigenous Place, Walkers Flat (Devon Downs)
Archaeological Coorong/Middleton & Murray Mouth
RNE 7883 Registered Indigenous Place, Swan Reach Archaeological Coorong/Middleton & Murray Mouth
RNE 10898 Registered Indigenous Place, Swan Reach Archaeological Coorong/Middleton & Murray Mouth
RNE 7884 Registered Blanchetown Historic Reserve Archaeological Coorong/Middleton & Murray Mouth
N/A N/A N/A Ngurunderi Myth Site Mythological Middleton & Murray Mouth
N/A N/A N/A Fred’s Landing High Ground Midden
Archaeological Coorong
N/A N/A N/A Tailem Bend Ferry Midden Archaeological Coorong
Note: AARD = Aboriginal Affairs and Reconciliation Division Central Archive
RNE = Register of the National Estate Table 10.1 – Consolidated List of Known Aboriginal Heritage Sites

Pipeline to the Sea: Feasibility Study - Phase 1
85
Native Title
There are currently three native title claims which cover parts of the three pipeline alignments. These claims and claimants are listed in Table 10.2.
Native Title Claimant NNTT ID Pipeline to the Sea Alignment
First Peoples of the River Murray & Mallee Region
SC98/3 Dry Creek Middleton and Murray Mouth Coorong
Kaurna Peoples SC00/1 Dry Creek
Ngarrindjeri and Others SC98/4 Middleton and Murray Mouth Coorong
Note: NNTT ID = National Native Title Tribunal Identification number Table 10.2 – Native Title Claims
The Aboriginal groups listed in Table 10.2, through their native title claims, exert native title rights over Crown land through which the pipeline alignments traverse. It is beyond the scope of this study to identify individual land parcels which may be affected by the claims.
Consultation with Aboriginal Groups
The desktop study has identified that the three pipeline alignments cross the claimed traditional lands of five Aboriginal groups (refer Table 10.3). These groups would request an Aboriginal cultural heritage survey to be undertaken over the pipeline alignment where the route overlaps the group’s native title claim and/or heritage interest area boundary. There is no legal requirement under the Aboriginal Heritage Act, 1988 to undertake cultural heritage surveys but it is recommended that such surveys are undertaken as a risk management and due diligence strategy to ensure that delays during the construction phase of the project are minimised. Any cultural heritage surveys undertaken would need to be conducted on a group by group basis with independent survey, reporting and consultation for each Aboriginal group.
Pipeline to the Sea Alignment Aboriginal Group Aboriginal Group Status
Dry Creek First Peoples of the River Murray & Mallee Region Native Title Claim
Kaurna Native Title Claim
Ngadjuri Heritage Committee
Middleton and Murray Mouth First Peoples of the River Murray & Mallee Region Native Title Claim
Ngarrindjeri Native Title Claim
Mannum Aboriginal Community Association Heritage Committee
Coorong First Peoples of the River Murray & Mallee Region Native Title Claim
Ngarrindjeri Native Title Claim
Mannum Aboriginal Community Association Heritage Committee
Table 10.3 – Aboriginal Stakeholder Groups

Pipeline to the Sea: Feasibility Study - Phase 1
86
In addition to the Aboriginal groups listed in Table 10.3 the Murray Lower Darling Rivers Indigenous Nations (MLDRIN) should be consulted regarding the status and progress of the project. The MLDRIN is an advisory group, established by the Murray Darling Basin Commission, which provides key strategic advice to the Murray Darling Basin Commission regarding Aboriginal heritage and other issues.
Summary
The desktop study by ACHM identified that the Dry Creek pipeline alignment contains a markedly lower number of previously recorded Aboriginal sites and collected Aboriginal skeletal remains than the Coorong alignment and the Middleton and Murray Mouth alignment. While the majority of all alignments traverse previously disturbed ground within road easements, which should not have significant Aboriginal heritage issues, there are known areas of particular Aboriginal cultural heritage sensitivity and interest along all routes. For all alignments where the routes traverse large flat plains, there is a lower chance of encountering Aboriginal sites than locations with permanent or ephemeral water supplies and resources such as ‘bush tucker’, game and wood (i.e. River Murray and wetlands, swamps, sand dunes, creeks and coastlines).
Based on the findings of this desktop research, it is determined that there is a high likelihood for Aboriginal cultural heritage issues to arise during subsequent stages of the Pipeline to the Sea project. Given the likelihood of encountering an Aboriginal site during construction (particularly along sections of the Coorong Route and the Middleton and Murray Mouth Route), an Aboriginal cultural heritage survey should be undertaken to provide the Murray Darling Basin Commission with a due diligence process to follow in relation to managing any Aboriginal heritage issues that may arise. The discovery of Aboriginal sites should not greatly influence the selection of the preferred pipeline alignment as all Aboriginal heritage issues can be appropriately managed (i.e. through site avoidance or impact measures, monitoring of earthworks by Aboriginal group representatives, etc.).
Although Aboriginal heritage issues may be managed, it is considered that due to the cultural sensitivity of the Goolwa/Sir Richard Peninsula area it is unlikely that the Aboriginal group who claim traditional ownership of this area would support the Murray Mouth option.
Of the three pipeline alignments considered, the Dry Creek alignment is considered to contain the least Aboriginal cultural heritage issues due to the lower number of previously recorded Aboriginal sites, collected Aboriginal skeletal remains and Aboriginal site sensitive landforms, and the higher levels of previous impact from development. As Aboriginal heritage issues are likely to be manageable, it is considered that management of other issues, such as marine outfalls and project costs, may be more influential than Aboriginal heritage issues in the determination of the preferred pipeline alignment.

Pipeline to the Sea: Feasibility Study - Phase 1
87
11. Social Impacts
The only significant social impact for the pipeline to the sea project is that associated with the construction of evaporation basins near the Stockyard Plain Basin to concentrate the groundwater prior to pumping to the sea. The acquisition of land for the evaporation basins will impact on the local farming enterprise, and depending upon the size of the basins may cause one or more farming enterprises to become non viable.
In addition, there is the psychological impact associated with additional evaporation basins in the Riverland. Some elements of the local community are opposed to more evaporation basins and would view it as further erosion of the value of farming in the area.
The pipeline to the sea options which pump unconcentrated groundwater are not expected to have any significant social impacts, principally because the pipeline will be buried and pre-existing land use can be continued after construction. Land is expected to be acquired for tanks and pump stations but the area required is small and is not expected to adversely impact on any existing land use.
Another psychological impact may be the view of some people that a pipeline to the sea is transferring a problem from one area to another. Some people would expect that the problem should be contained within the backyard of those who caused the problem.

Pipeline to the Sea: Feasibility Study – Phase 1
88
12. Comparison of Options
General
In this section various options for the transport of saline groundwater from Stockyard Plain are compared. A range of pipe sizes and potential groundwater salinities have been assessed in order to allow the optimum combination to be determined. No consideration has been given to how the Stockyard Plain Basin would be managed to achieve any particular flow and salinity combination. Therefore, the impact of the pipeline to the sea on the Stockyard Plain Basin has not been quantified. To fully assess the impact it is recommended that a water and salt balance model of the Stockyard Plain Basin, incorporating an offtake for the pipeline to the sea, be established. The model could be used to determine the most appropriate management strategy for the basin to achieve minimal detrimental impacts.
Some combinations are unrealistic in the short term but may be practical some time in the future when additional salt interception schemes are operational. For example, a 500 L/s pipeline carrying 100 000 mg/L groundwater would transfer 3600 tonnes/day of salt which is approximately seven times greater than the salt load currently entering Stockyard Plain Basin.
Total Cost
The capital and annual costs of the three principal components for each pipeline option, as described in Sections 5, 7 and 8, have been consolidated into Table 12.1 (Note that Table 12.1 is presented over 5 pages). The table also includes Options E1 and E2 which involve pipelines to the Southern Lagoon of the Coorong and Morella Basin respectively (refer Section 3.4). Option E1 has been costed as for the Hells Gate pipeline option (D1) but with no outfall cost and Option E2 has been costed as for the Tea Tree Crossing pipeline option (D2) but with no outfall cost.
Table 12.1 highlights that the capital cost of the pipeline for any particular option is much greater than the capital cost of the pump stations and the outfall structures. For the options which involve the pumping of raw groundwater from the Stockyard Plain Basin the pipeline represents approximately 65% to 75% of the capital cost for the Port Gawler options and approximately 75% to 90% of the capital cost for the options discharging to the Southern Ocean. For the options involving the pumping of concentrated groundwater the capital cost of the concentrator becomes significant and pipeline cost reduces to approximately 40% to 50% of the total capital cost for Port Gawler options and approximately 50% to 70% for other options.

Pipeline to the Sea: Feasibility Study – Phase 1
89
Present Value Cost
To allow comparison of the cost of each option a present value cost has been determined using a 30 year life cycle and 4% discount rate. The analysis was simplified as not all individual asset components were assigned separate design lives. The following assumptions were made in determining the present value cost.
• Asset life = 100 years as majority of cost is earthworks and assumed that annual
maintenance would ensure replacement not required.
Concentrator Capital Cost
• All cost included in Year 1.
• Operation and maintenance cost included from Year 2.
Concentrator Annual Cost
• Asset life = 80 years.
Pipeline Capital Cost
• Construction over three years.
• One third of cost included in Years 1, 2, and 3.
• Residual value of 62.5% of cost included in Year 30.
• Asset life = 30 years. All components i.e. pumps, pipework, electrical, tanks etc given same
design life.
Pump Station Capital Cost
• Construction over two years.
• Half of cost included in Years 1 and 2.
• All cost included in Year 1.
ETSA Upgrade Cost
• Operation and maintenance cost included from Year 4.
Pipeline and Pump Station Annual Cost
• Asset life = 80 years.
Outfall Capital Cost
• Construction in one year.
• All cost included in Year 1.
• Residual value of 62.5% of cost included in Year 30.

Pipeline to the Sea: Feasibility Study – Phase 1
90
• Operation and maintenance cost included from Year 4.
Concentrator Annual Cost
The present values calculated are included in Table 12.1 and for selected options the present value costs are shown graphically in Figure 12.1.

Pipeline to the Sea: Feasibility Study – Phase 1
91
Salinity Flow
Concentrator Capital Cost
Concentrator O&M Cost
Pipeline Capital Cost
Pump Station Capital Cost
Power Upgrade Cost
Pipeline and Pump Station O&M Cost
Outfall Capital Cost
Outfall O&M Cost
Total Capital Cost
Total O&M Cost
Total Present Value Cost
Total Salt Exported
Total PV Cost per Tonne of Salt Exported
Option (mg/L) (L/s) ($mill) ($mill/yr) ($mill) ($mill) ($mill) ($mill/yr) ($mill) ($mill/yr) ($mill) ($mill/yr) ($mill) (t/day) ($/t) B1 - Pipeline to Cheetham Salt
41,000 50 $5.29 $0.07 $46.0 $11.9 $9.80 $1.70 0 0 $72.99 $1.77 $85 148 $52.62 41,000 100 $10.54 $0.13 $78.5 $11.7 $10.12 $2.67 0 0 $110.86 $2.80 $129 295 $39.93 41,000 250 $26.08 $0.33 $108.2 $13.2 $10.81 $4.13 0 0 $158.29 $4.46 $192 738 $23.75 41,000 375 $38.79 $0.50 $108.2 $19.5 $11.50 $5.83 0 0 $177.99 $6.33 $238 1107 $19.62 41,000 500 $51.27 $0.66 $138.0 $15.4 $12.00 $7.19 0 0 $216.67 $7.85 $290 1476 $17.97 60,000 50 $10.09 $0.13 $46.0 $11.9 $9.80 $1.73 0 0 $77.79 $1.86 $91 216 $38.47 60,000 100 $20.05 $0.25 $78.5 $11.7 $10.12 $2.71 0 0 $120.37 $2.96 $141 432 $29.71 60,000 250 $49.15 $0.64 $108.2 $13.2 $10.81 $4.22 0 0 $181.36 $4.86 $220 1080 $18.59 60,000 375 $72.52 $0.95 $108.2 $19.5 $11.50 $6.01 0 0 $211.72 $6.96 $279 1620 $15.76 60,000 500 $95.08 $1.27 $138.0 $15.4 $12.00 $7.41 0 0 $260.48 $8.68 $345 2160 $14.57 100,000 50 $20.13 $0.26 $46.0 $11.9 $9.80 $1.74 0 0 $87.83 $2.00 $103 360 $26.04 100,000 100 $39.75 $0.51 $78.5 $11.7 $10.12 $2.74 0 0 $140.07 $3.25 $164 720 $20.76 100,000 250 $95.47 $1.28 $108.2 $13.2 $10.81 $4.28 0 0 $227.68 $5.56 $275 1800 $13.93 100,000 375 $138.33 $1.91 $108.2 $19.5 $11.50 $6.13 0 0 $277.53 $8.04 $358 2700 $12.12 100,000 500 $177.95 $2.55 $138.0 $15.4 $12.00 $7.56 0 0 $343.35 $10.11 $445 3600 $11.29
B2 - Pipeline to Pt Gawler
20,000 50 0 0 $43.5 $11.9 $9.80 $1.67 $1.40 $0.05 $66.60 $1.72 $79 72 $99.63 20,000 100 0 0 $74.2 $11.7 $10.12 $2.58 $3.60 $0.05 $99.62 $2.63 $116 144 $73.60 20,000 250 0 0 $102.3 $13.2 $10.81 $4.01 $5.88 $0.05 $132.19 $4.06 $161 360 $40.90 20,000 375 0 0 $102.3 $19.5 $11.50 $5.71 $11.00 $0.05 $144.30 $5.76 $196 540 $33.22 20,000 500 0 0 $130.4 $15.4 $12.00 $7.03 $15.60 $0.05 $173.40 $7.08 $236 720 $29.98 60,000 50 $10.09 $0.13 $43.5 $11.9 $9.80 $1.69 $1.40 $0.05 $76.69 $1.87 $90 216 $38.21 60,000 100 $20.05 $0.25 $74.2 $11.7 $10.12 $2.62 $3.60 $0.05 $119.67 $2.92 $140 432 $29.51 60,000 250 $49.15 $0.64 $102.3 $13.2 $10.81 $4.10 $5.88 $0.05 $181.34 $4.79 $219 1080 $18.52 60,000 375 $72.52 $0.95 $102.3 $19.5 $11.50 $5.89 $11.00 $0.05 $216.82 $6.89 $283 1620 $15.93 60,000 500 $95.08 $1.27 $130.4 $15.4 $12.00 $7.26 $15.60 $0.05 $268.48 $8.58 $350 2160 $14.78 100,000 50 $20.13 $0.26 $43.5 $11.9 $9.80 $1.71 $1.40 $0.05 $86.73 $2.02 $102 360 $25.92 100,000 100 $39.75 $0.51 $74.2 $11.7 $10.12 $2.65 $3.60 $0.05 $139.37 $3.21 $163 720 $20.64 100,000 250 $95.47 $1.28 $102.3 $13.2 $10.81 $4.16 $5.88 $0.05 $227.66 $5.49 $274 1800 $13.89 100,000 375 $138.33 $1.91 $102.3 $19.5 $11.50 $6.01 $11.00 $0.05 $282.63 $7.97 $362 2700 $12.23 100,000 500 $177.95 $2.55 $130.4 $15.4 $12.00 $7.41 $15.60 $0.05 $351.35 $10.01 $450 3600 $11.41

Pipeline to the Sea: Feasibility Study – Phase 1
92
Salinity Flow
Concentrator Capital Cost
Concentrator O&M Cost
Pipeline Capital Cost
Pump Station Capital Cost
Power Upgrade Cost
Pipeline and Pump Station O&M Cost
Outfall Capital Cost
Outfall O&M Cost
Total Capital Cost
Total O&M Cost
Total Present Value Cost
Total Salt Exported
Total PV Cost per Tonne of Salt Exported
Option (mg/L) (L/s) ($mill) ($mill/yr) ($mill) ($mill) ($mill) ($mill/yr) ($mill) ($mill/yr) ($mill) ($mill/yr) ($mill) (t/day) ($/t) C1 - Pipeline to Middleton
20,000 50 0 0 $71.0 $7.6 $2.07 $1.86 $0.42 $0.05 $81.09 $1.91 $89 72 $113.14 20,000 100 0 0 $135.3 $14.8 $2.27 $3.45 $0.84 $0.05 $153.21 $3.50 $167 144 $105.71 20,000 250 0 0 $167.0 $20.6 $3.26 $6.01 $1.26 $0.05 $192.12 $6.06 $234 360 $59.31 20,000 375 0 0 $167.0 $29.5 $4.25 $9.46 $2.10 $0.05 $202.85 $9.51 $294 540 $49.70 20,000 500 0 0 $212.9 $27.3 $5.01 $11.00 $2.52 $0.05 $247.73 $11.05 $349 720 $44.24 60,000 50 $10.09 $0.13 $71.0 $7.6 $2.07 $1.87 $0.42 $0.05 $91.18 $2.05 $101 216 $42.66 60,000 100 $20.05 $0.25 $135.3 $14.8 $2.27 $3.47 $0.84 $0.05 $173.26 $3.77 $190 432 $40.15 60,000 250 $49.15 $0.64 $167.0 $20.6 $3.26 $6.13 $1.26 $0.05 $241.27 $6.82 $292 1080 $24.69 60,000 375 $72.52 $0.95 $167.0 $29.5 $4.25 $9.75 $2.10 $0.05 $275.37 $10.75 $382 1620 $21.51 60,000 500 $95.08 $1.27 $212.9 $27.3 $5.01 $11.33 $2.52 $0.05 $342.81 $12.65 $463 2160 $19.60 100,000 50 $20.13 $0.26 $71.0 $7.6 $2.07 $1.88 $0.42 $0.05 $101.22 $2.19 $113 360 $28.55 100,000 100 $39.75 $0.51 $135.3 $14.8 $2.27 $3.48 $0.84 $0.05 $192.96 $4.04 $213 720 $26.98 100,000 250 $95.47 $1.28 $167.0 $20.6 $3.26 $6.21 $1.26 $0.05 $287.59 $7.54 $347 1800 $17.61 100,000 375 $138.33 $1.91 $167.0 $29.5 $4.25 $9.95 $2.10 $0.05 $341.18 $11.91 $462 2700 $15.62 100,000 500 $177.95 $2.55 $212.9 $27.3 $5.01 $11.56 $2.52 $0.05 $425.68 $14.16 $565 3600 $14.33
C2 - Pipeline to Murray Mouth
20,000 50 0 0 $73.5 $7.6 $2.07 $1.91 $0.24 $0.05 $83.41 $1.96 $92 72 $116.21 20,000 100 0 0 $140.1 $13.2 $2.27 $3.51 $0.48 $0.05 $156.05 $3.56 $169 144 $107.36 20,000 250 0 0 $172.9 $22.2 $3.26 $6.29 $0.72 $0.05 $199.08 $6.34 $243 360 $61.72 20,000 375 0 0 $172.9 $29.5 $4.25 $9.80 $1.20 $0.05 $207.85 $9.85 $302 540 $51.15 20,000 500 0 0 $220.5 $29.1 $5.01 $11.33 $1.44 $0.05 $256.05 $11.38 $360 720 $45.67 60,000 50 $10.09 $0.13 $73.5 $7.6 $2.07 $1.93 $0.24 $0.05 $93.50 $2.11 $103 216 $43.74 60,000 100 $20.05 $0.25 $140.1 $13.2 $2.27 $3.53 $0.48 $0.05 $176.10 $3.83 $193 432 $40.70 60,000 250 $49.15 $0.64 $172.9 $22.2 $3.26 $6.42 $0.72 $0.05 $248.23 $7.11 $302 1080 $25.51 60,000 375 $72.52 $0.95 $172.9 $29.5 $4.25 $10.11 $1.20 $0.05 $280.37 $11.11 $390 1620 $22.01 60,000 500 $95.08 $1.27 $220.5 $29.1 $5.01 $11.67 $1.44 $0.05 $351.13 $12.99 $475 2160 $20.08 100,000 50 $20.13 $0.26 $73.5 $7.6 $2.07 $1.93 $0.24 $0.05 $103.54 $2.24 $115 360 $29.17 100,000 100 $39.75 $0.51 $140.1 $13.2 $2.27 $3.54 $0.48 $0.05 $195.80 $4.10 $215 720 $27.31 100,000 250 $95.47 $1.28 $172.9 $22.2 $3.26 $6.50 $0.72 $0.05 $294.55 $7.83 $357 1800 $18.09 100,000 375 $138.33 $1.91 $172.9 $29.5 $4.25 $10.32 $1.20 $0.05 $346.18 $12.28 $471 2700 $15.92 100,000 500 $177.95 $2.55 $220.5 $29.1 $5.01 $11.90 $1.44 $0.05 $434.00 $14.50 $576 3600 $14.62

Pipeline to the Sea: Feasibility Study – Phase 1
93
Salinity Flow
Concentrator Capital Cost
Concentrator O&M Cost
Pipeline Capital Cost
Pump Station Capital Cost
Power Upgrade Cost
Pipeline and Pump Station O&M Cost
Outfall Capital Cost
Outfall O&M Cost
Total Capital Cost
Total O&M Cost
Total Present Value Cost
Total Salt Exported
Total PV Cost per Tonne of Salt Exported
Option (mg/L) (L/s) ($mill) ($mill/yr) ($mill) ($mill) ($mill) ($mill/yr) ($mill) ($mill/yr) ($mill) ($mill/yr) ($mill) (t/day) ($/t) D1 - Pipeline to Hells Gate
20,000 50 0 0 $66.8 $9.7 $2.10 $1.96 $1.50 $0.05 $80.10 $2.01 $90 72 $114.69 20,000 100 0 0 $127.2 $10.9 $2.37 $3.14 $3.00 $0.05 $143.47 $3.19 $154 144 $97.87 20,000 250 0 0 $157.1 $18.9 $3.47 $5.65 $4.50 $0.05 $183.97 $5.70 $222 360 $56.42 20,000 375 0 0 $200.3 $19.2 $4.57 $7.06 $7.50 $0.05 $231.57 $7.11 $278 540 $47.04 20,000 500 0 0 $200.3 $21.2 $5.40 $10.01 $9.00 $0.05 $235.90 $10.06 $325 720 $41.20
60,000 50 $10.09 $0.13 $66.8 $9.7 $2.10 $1.98 $1.50 $0.05 $90.19 $2.16 $102 216 $43.23 60,000 100 $20.05 $0.25 $127.2 $10.9 $2.37 $3.16 $3.00 $0.05 $163.52 $3.46 $178 432 $37.54 60,000 250 $49.15 $0.64 $157.1 $18.9 $3.47 $5.76 $4.50 $0.05 $233.12 $6.45 $280 1080 $23.72 60,000 375 $72.52 $0.95 $200.3 $19.2 $4.57 $7.20 $7.50 $0.05 $304.09 $8.20 $364 1620 $20.51 60,000 500 $95.08 $1.27 $200.3 $21.2 $5.40 $10.32 $9.00 $0.05 $330.98 $11.64 $439 2160 $18.57
100,000 50 $20.13 $0.26 $66.8 $9.7 $2.10 $2.00 $1.50 $0.05 $100.23 $2.31 $114 360 $28.93 100,000 100 $39.75 $0.51 $127.2 $10.9 $2.37 $3.17 $3.00 $0.05 $183.22 $3.73 $200 720 $25.42 100,000 250 $95.47 $1.28 $157.1 $18.9 $3.47 $5.84 $4.50 $0.05 $279.44 $7.17 $335 1800 $17.02 100,000 375 $138.33 $1.91 $200.3 $19.2 $4.57 $7.29 $7.50 $0.05 $369.90 $9.25 $442 2700 $14.96 100,000 500 $177.95 $2.55 $200.3 $21.2 $5.40 $10.52 $9.00 $0.05 $413.85 $13.12 $540 3600 $13.71
D2 - Pipeline to Tea Tree Crossing
20,000 50 0 0 $79.1 $11.0 $2.10 $2.31 $3.42 $0.05 $95.62 $2.36 $107 72 $135.98 20,000 100 0 0 $150.8 $12.6 $2.37 $3.71 $6.84 $0.05 $172.61 $3.76 $184 144 $116.97 20,000 250 0 0 $186.1 $20.8 $3.47 $6.48 $10.26 $0.05 $220.63 $6.53 $262 360 $66.44 20,000 375 0 0 $237.3 $21.4 $4.57 $8.19 $17.10 $0.05 $280.37 $8.24 $331 540 $56.00 20,000 500 0 0 $237.3 $23.4 $5.40 $11.82 $20.52 $0.05 $286.62 $11.87 $389 720 $49.36
60,000 50 $10.09 $0.13 $79.1 $11.0 $2.10 $2.33 $3.42 $0.05 $105.71 $2.51 $119 216 $50.33 60,000 100 $20.05 $0.25 $150.8 $12.6 $2.37 $3.72 $6.84 $0.05 $192.66 $4.02 $208 432 $43.88 60,000 250 $49.15 $0.64 $186.1 $20.8 $3.47 $6.60 $10.26 $0.05 $269.78 $7.29 $320 1080 $27.07 60,000 375 $72.52 $0.95 $237.3 $21.4 $4.57 $8.35 $17.10 $0.05 $352.89 $9.35 $417 1620 $23.51 60,000 500 $95.08 $1.27 $237.3 $23.4 $5.40 $12.18 $20.52 $0.05 $381.70 $13.50 $504 2160 $21.32
100,000 50 $20.13 $0.26 $79.1 $11.0 $2.10 $2.35 $3.42 $0.05 $115.75 $2.66 $131 360 $33.19 100,000 100 $39.75 $0.51 $150.8 $12.6 $2.37 $3.74 $6.84 $0.05 $212.36 $4.30 $230 720 $29.24 100,000 250 $95.47 $1.28 $186.1 $20.8 $3.47 $6.68 $10.26 $0.05 $316.10 $8.01 $375 1800 $19.03 100,000 375 $138.33 $1.91 $237.3 $21.4 $4.57 $8.46 $17.10 $0.05 $418.70 $10.42 $496 2700 $16.77 100,000 500 $177.95 $2.55 $237.3 $23.4 $5.40 $12.43 $20.52 $0.05 $464.57 $15.03 $606 3600 $15.38
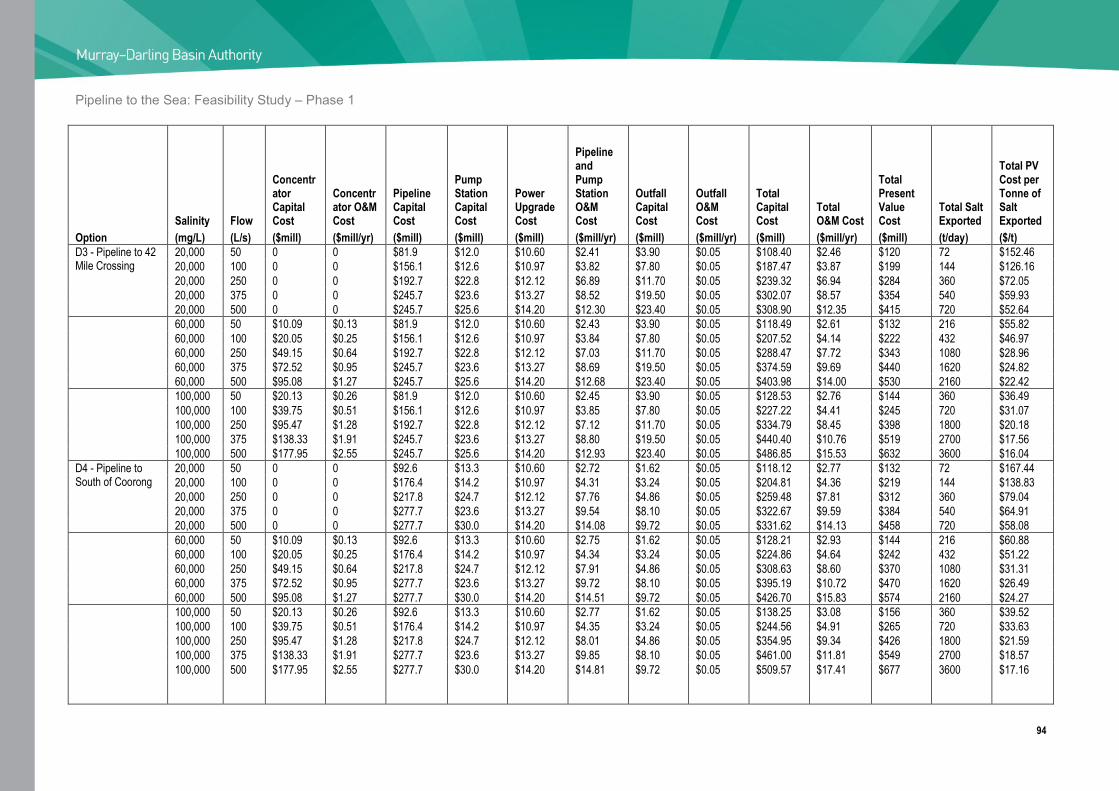
Pipeline to the Sea: Feasibility Study – Phase 1
94
Salinity Flow
Concentrator Capital Cost
Concentrator O&M Cost
Pipeline Capital Cost
Pump Station Capital Cost
Power Upgrade Cost
Pipeline and Pump Station O&M Cost
Outfall Capital Cost
Outfall O&M Cost
Total Capital Cost
Total O&M Cost
Total Present Value Cost
Total Salt Exported
Total PV Cost per Tonne of Salt Exported
Option (mg/L) (L/s) ($mill) ($mill/yr) ($mill) ($mill) ($mill) ($mill/yr) ($mill) ($mill/yr) ($mill) ($mill/yr) ($mill) (t/day) ($/t) D3 - Pipeline to 42 Mile Crossing
20,000 50 0 0 $81.9 $12.0 $10.60 $2.41 $3.90 $0.05 $108.40 $2.46 $120 72 $152.46 20,000 100 0 0 $156.1 $12.6 $10.97 $3.82 $7.80 $0.05 $187.47 $3.87 $199 144 $126.16 20,000 250 0 0 $192.7 $22.8 $12.12 $6.89 $11.70 $0.05 $239.32 $6.94 $284 360 $72.05 20,000 375 0 0 $245.7 $23.6 $13.27 $8.52 $19.50 $0.05 $302.07 $8.57 $354 540 $59.93 20,000 500 0 0 $245.7 $25.6 $14.20 $12.30 $23.40 $0.05 $308.90 $12.35 $415 720 $52.64
60,000 50 $10.09 $0.13 $81.9 $12.0 $10.60 $2.43 $3.90 $0.05 $118.49 $2.61 $132 216 $55.82 60,000 100 $20.05 $0.25 $156.1 $12.6 $10.97 $3.84 $7.80 $0.05 $207.52 $4.14 $222 432 $46.97 60,000 250 $49.15 $0.64 $192.7 $22.8 $12.12 $7.03 $11.70 $0.05 $288.47 $7.72 $343 1080 $28.96 60,000 375 $72.52 $0.95 $245.7 $23.6 $13.27 $8.69 $19.50 $0.05 $374.59 $9.69 $440 1620 $24.82 60,000 500 $95.08 $1.27 $245.7 $25.6 $14.20 $12.68 $23.40 $0.05 $403.98 $14.00 $530 2160 $22.42
100,000 50 $20.13 $0.26 $81.9 $12.0 $10.60 $2.45 $3.90 $0.05 $128.53 $2.76 $144 360 $36.49 100,000 100 $39.75 $0.51 $156.1 $12.6 $10.97 $3.85 $7.80 $0.05 $227.22 $4.41 $245 720 $31.07 100,000 250 $95.47 $1.28 $192.7 $22.8 $12.12 $7.12 $11.70 $0.05 $334.79 $8.45 $398 1800 $20.18 100,000 375 $138.33 $1.91 $245.7 $23.6 $13.27 $8.80 $19.50 $0.05 $440.40 $10.76 $519 2700 $17.56 100,000 500 $177.95 $2.55 $245.7 $25.6 $14.20 $12.93 $23.40 $0.05 $486.85 $15.53 $632 3600 $16.04
D4 - Pipeline to South of Coorong
20,000 50 0 0 $92.6 $13.3 $10.60 $2.72 $1.62 $0.05 $118.12 $2.77 $132 72 $167.44 20,000 100 0 0 $176.4 $14.2 $10.97 $4.31 $3.24 $0.05 $204.81 $4.36 $219 144 $138.83 20,000 250 0 0 $217.8 $24.7 $12.12 $7.76 $4.86 $0.05 $259.48 $7.81 $312 360 $79.04 20,000 375 0 0 $277.7 $23.6 $13.27 $9.54 $8.10 $0.05 $322.67 $9.59 $384 540 $64.91 20,000 500 0 0 $277.7 $30.0 $14.20 $14.08 $9.72 $0.05 $331.62 $14.13 $458 720 $58.08
60,000 50 $10.09 $0.13 $92.6 $13.3 $10.60 $2.75 $1.62 $0.05 $128.21 $2.93 $144 216 $60.88 60,000 100 $20.05 $0.25 $176.4 $14.2 $10.97 $4.34 $3.24 $0.05 $224.86 $4.64 $242 432 $51.22 60,000 250 $49.15 $0.64 $217.8 $24.7 $12.12 $7.91 $4.86 $0.05 $308.63 $8.60 $370 1080 $31.31 60,000 375 $72.52 $0.95 $277.7 $23.6 $13.27 $9.72 $8.10 $0.05 $395.19 $10.72 $470 1620 $26.49 60,000 500 $95.08 $1.27 $277.7 $30.0 $14.20 $14.51 $9.72 $0.05 $426.70 $15.83 $574 2160 $24.27
100,000 50 $20.13 $0.26 $92.6 $13.3 $10.60 $2.77 $1.62 $0.05 $138.25 $3.08 $156 360 $39.52 100,000 100 $39.75 $0.51 $176.4 $14.2 $10.97 $4.35 $3.24 $0.05 $244.56 $4.91 $265 720 $33.63 100,000 250 $95.47 $1.28 $217.8 $24.7 $12.12 $8.01 $4.86 $0.05 $354.95 $9.34 $426 1800 $21.59 100,000 375 $138.33 $1.91 $277.7 $23.6 $13.27 $9.85 $8.10 $0.05 $461.00 $11.81 $549 2700 $18.57 100,000 500 $177.95 $2.55 $277.7 $30.0 $14.20 $14.81 $9.72 $0.05 $509.57 $17.41 $677 3600 $17.16

Pipeline to the Sea: Feasibility Study – Phase 1
95
Salinity Flow
Concentrator Capital Cost
Concentrator O&M Cost
Pipeline Capital Cost
Pump Station Capital Cost
Power Upgrade Cost
Pipeline and Pump Station O&M Cost
Outfall Capital Cost
Outfall O&M Cost
Total Capital Cost
Total O&M Cost
Total Present Value Cost
Total Salt Exported
Total PV Cost per Tonne of Salt Exported
Option (mg/L) (L/s) ($mill) ($mill/yr) ($mill) ($mill) ($mill) ($mill/yr) ($mill) ($mill/yr) ($mill) ($mill/yr) ($mill) (t/day) ($/t) E1 - Pipeline to Southern Lagoon of Coorong
20,000 50 0 0 $66.8 $9.7 $2.10 $1.96 0 0 $78.60 $1.96 $89 72 $112.30 20,000 100 0 0 $127.2 $10.9 $2.37 $3.14 0 0 $140.47 $3.14 $151 144 $95.95 20,000 250 0 0 $157.1 $18.9 $3.47 $5.65 0 0 $179.47 $5.65 $192 360 $48.68 20,000 375 0 0 $200.3 $19.2 $4.57 $7.06 0 0 $224.07 $7.06 $272 540 $45.95 20,000 500 0 0 $200.3 $21.2 $5.40 $10.01 0 0 $226.90 $10.01 $317 720 $40.23
60,000 50 $10.09 $0.13 $66.8 $9.7 $2.10 $1.98 0 0 $88.69 $2.11 $100 216 $42.44 60,000 100 $20.05 $0.25 $127.2 $10.9 $2.37 $3.16 0 0 $160.52 $3.41 $175 432 $36.90 60,000 250 $49.15 $0.64 $157.1 $18.9 $3.47 $5.76 0 0 $228.62 $6.40 $276 1080 $23.36 60,000 375 $72.52 $0.95 $200.3 $19.2 $4.57 $7.20 0 0 $296.59 $8.15 $357 1620 $20.14 60,000 500 $95.08 $1.27 $200.3 $21.2 $5.40 $10.32 0 0 $321.98 $11.59 $432 2160 $18.25
100,000 50 $20.13 $0.26 $66.8 $9.7 $2.10 $2.00 0 0 $98.73 $2.26 $112 360 $28.46 100,000 100 $39.75 $0.51 $127.2 $10.9 $2.37 $3.17 0 0 $180.22 $3.68 $197 720 $25.03 100,000 250 $95.47 $1.28 $157.1 $18.9 $3.47 $5.84 0 0 $274.94 $7.12 $331 1800 $16.81 100,000 375 $138.33 $1.91 $200.3 $19.2 $4.57 $7.29 0 0 $362.40 $9.20 $436 2700 $14.74 100,000 500 $177.95 $2.55 $200.3 $21.2 $5.40 $10.52 0 0 $404.85 $13.07 $533 3600 $13.51
E2 - Pipeline to Morella Basin
20,000 50 0 0 $79.1 $11.0 $10.60 $2.31 0 0 $100.70 $2.31 $112 72 $142.09 20,000 100 0 0 $150.8 $12.6 $10.97 $3.71 0 0 $174.37 $3.71 $187 144 $118.42 20,000 250 0 0 $186.1 $20.8 $12.12 $6.48 0 0 $219.02 $6.48 $262 360 $66.37 20,000 375 0 0 $237.3 $21.4 $13.27 $8.19 0 0 $271.97 $8.19 $326 540 $55.07 20,000 500 0 0 $237.3 $23.4 $14.20 $11.82 0 0 $274.90 $11.82 $381 720 $48.34
60,000 50 $10.09 $0.13 $79.1 $11.0 $10.60 $2.33 0 0 $110.79 $2.46 $124 216 $52.37 60,000 100 $20.05 $0.25 $150.8 $12.6 $10.97 $3.72 0 0 $194.42 $3.97 $210 432 $44.36 60,000 250 $49.15 $0.64 $186.1 $20.8 $12.12 $6.60 0 0 $268.17 $7.24 $320 1080 $27.05 60,000 375 $72.52 $0.95 $237.3 $21.4 $13.27 $8.35 0 0 $344.49 $9.30 $411 1620 $23.20 60,000 500 $95.08 $1.27 $237.3 $23.4 $14.20 $12.18 0 0 $369.98 $13.45 $496 2160 $20.98
100,000 50 $20.13 $0.26 $79.1 $11.0 $10.60 $2.35 0 0 $120.83 $2.61 $136 360 $34.42 100,000 100 $39.75 $0.51 $150.8 $12.6 $10.97 $3.74 0 0 $214.12 $4.25 $233 720 $29.53 100,000 250 $95.47 $1.28 $186.1 $20.8 $12.12 $6.68 0 0 $314.49 $7.96 $375 1800 $19.02 100,000 375 $138.33 $1.91 $237.3 $21.4 $13.27 $8.46 0 0 $410.30 $10.37 $490 2700 $16.58 100,000 500 $177.95 $2.55 $237.3 $23.4 $14.20 $12.43 0 0 $452.85 $14.98 $598 3600 $15.17
Table 12.1 – Summary of Cost of Options

Pipeline to the Sea: Feasibility Study - Phase 1
96
$0
$100
$200
$300
$400
$500
$600
$700
$800
0 100 200 300 400 500 600
Pipeline Capacity (L/s)
Pres
ent V
alue
Cos
t ($
mill
ion)
Dry Creek - 41,000 mg/LPort Gawler - 20,000 mg/LPort Gawler - 60,000 mg/LPort Gawler - 100,000 mg/LMiddleton - 20,000 mg/LMiddleton - 60,ooo mg/LMiddleton - 100,000 mg/LHell's Gate - 20,000 mg/LHells' Gate - 60,000 mg/lHell's Gate - 100,000 mg/LSouth of Coorong - 20,000 mg/LSouth of Coorong - 60,000 mg/LSouth of Coorong - 100,000 mg/L
Figure 12.1 – Present Value Costs
Cost per Tonne of Salt Removed
For each option, the daily volume of salt removed was computed, based on the pipeline capacity and the salinity of the pumped water, and assuming an average of 20 hours of pumping per day. The salt loads are listed in Table 12.1.
To compare each option, the present value cost was divided by the total salt load removed for the 30 year period to determine a cost for the removal of one tonne of salt. These values are also included in Table 12.1. For selected options, the costs per tonne are shown in Figure 12.2. The cost per tonne of salt removed is considered to be a measure of the cost effectiveness of the various options.
Table 12.1 and Figure 12.2 indicate that for any particular option, there is a decrease in cost per tonne with increasing pipeline capacity; i.e. for a given salinity of water pumped it is cost effective to pump at a higher rate. The results also indicate that for a particular pipeline alignment it is cost effective to concentrate the groundwater at the Stockyard Plain Basin before pumping. This indicates that the additional cost to concentrate the groundwater is more than offset by the reduction in pipeline cost by using a smaller pipe to transfer the same volume of salt. Although the options which concentrate the groundwater at Stockyard Plain are the most cost effective, they require additional basin area for concentration. This may be a significant issue with the local community and those opposed to the construction of additional disposal basins.

Pipeline to the Sea: Feasibility Study - Phase 1
97
$0
$20
$40
$60
$80
$100
$120
$140
$160
$180
0 100 200 300 400 500 600
Pipeline Capacity (L/s)
PV C
ost p
er to
nne
of s
alt r
emov
ed ($
/t)
Dry Creek - 41,000 mg/L
Port Gawler - 20,000 mg/L
Port Gawler - 60,000 mg/L
Pt Gawler - 100,000 mg/L
Middleton - 20,000 mg/L
Middleton - 60,000 mg/L
Middleton - 100,000 mg/L
Hell's Gate - 20,000 mg/L
Hell's Gate - 60,000 mg/L
Hell's Gate - 100,000 mg/L
South of Coorong - 20,000 mg/L
South of Coorong - 60,000 mg/L
South of Coorong - 100,000 mg/L
300 t/day
600 t/day
1200 t/dayTrucking Options
Figure 12.2 – Cost per Tonne of Salt Removed
The above two findings combine to highlight that the most cost effective options are those with largest pipe size and most concentrated groundwater. These options are the most costly as they include all three components and at the upper end of the ranges considered.
A comparison of pipeline alignments highlights that the Port Gawler options are more cost effective that the Middleton-Murray Mouth options and the Coorong options which discharge to the Southern Ocean. The most cost effective options are the 500 L/s pipelines delivering 100 000 mg/L water to Port Gawler and Cheetham Salt at Dry Creek. For these options the present value cost per tonne of salt is $11.41 and $11.29 respectively.
The options to dispose saline water to either the Southern Lagoon of the Coorong or Morella Basin are marginally more cost effective than the equivalent Coorong options (Hells Gate and Tea Tree Crossing) because no marine outfall is required. For all options where marine outfalls are not required there is very little saving in terms of cost effectiveness because the cost of the outfall structures is very small compared to the overall project cost.
The current salt load entering Stockyard Plain Basin is about 500 tonne/day. As mentioned in Section 12.1 many of the options pipeline considered represent considerably more salt than currently enters Stockyard Plain Basin or is likely to enter the basin in the short term. Figure 12.2 includes salt load “contours” for 300 tonne/day, 600 tonne/day and 1200 tonne/day. Options which plot to the left of a “contour” represent a salt load less than the contour value. Figure 12.2 shows

Pipeline to the Sea: Feasibility Study - Phase 1
98
that many of the options considered are not feasible in the short term because they represent greater salt loads than are currently, or likely to be, discharged to the Stockyard Plain Basin.
The expected inflow to the basin when all currently planned salt interception schemes are operational is 395 L/s. If all this groundwater was piped to the sea the ecological value of the Stockyard Plain Basin would be lost. The current estimated sustainable inflow to the basin is 300 L/s and therefore the feasible volume of groundwater to be disposed of is 95 L/s. At a salinity of 19 000 mg/L this represents 130 tonnes/day of salt. If concentrated to 100 000 mg/L the quantity of groundwater to be disposed reduces to less than 20 L/s. It is difficult to justify the expense of a pipeline and concentrating infrastructure for such a small flow.
Cost of Removing Salt by Truck
An alternative method of removing salt from the Stockyard Plain Basin is to crystallise the salt in a basin and remove it by trucks. To evaluate this option present value costs to transport salt by truck have been estimated.
A cost of $2.40/km was obtained from a commercial gypsum transporter for carting by B-double truck with 43 tonne capacity. It is assumed that this rate includes the cost of truck replacement. A trip from the Stockyard Plain Basin to Cheetham Salt at Dry Creek and return is about 320 km. A round trip from the basin to south of the Coorong is 660 km. These two figures are considered to be lower and upper limits of practical disposal distances.
Using the 100 L/s option from Table 8.2, 27 724 tonnes of salt could be harvested annually from a basin complex of 209 Ha. Using the cost assumptions from Section 8.7 the capital cost of the complex would be $8.36 million and the operation and maintenance cost would be $277 000 per year. The annual cost to truck the salt to Dry Creek is $500 000 while the cost to truck the salt to south of the Coorong is $1.0 million. Using the above figures with a present value discount rate of 4% over 30 years gives a present value cost per tonne of salt removed of $23.14 (Dry Creek) and $32.27 (south of Coorong).
The above costs per tonne do not include the cost of disposing the salt at the receival point. If salt is transported to an existing salt harvesting operation or to a site where the salt can simply be dumped the additional cost would be negligible. If the salt was to be dumped in the ocean, some form of outfall and mixing arrangement would be required.
As this option requires salt to be harvested, additional evaporation basins would be required.
Advantages of this option are that salt can be transported to more than one destination and, unlike a pipeline, does not need to be operated at capacity to be at optimal cost effectiveness.

Pipeline to the Sea: Feasibility Study - Phase 1
99
Overall Comparison of Alternative Pipeline Alignments
The foregoing sections focussed on the cost of the various options considered and highlighted how sensitive the pipeline capacity and groundwater salinity are on the cost of disposing the salt. In this section an overall comparison of the pipeline alignments is provided by including costs as well as the other issues considered throughout this study. Table 12.2 includes the Aboriginal heritage issues summarised in Section 10, the ecological issues summarised in Section 9 and the marine outfall issues summarised in Section 6. In addition, Table 12.2 includes a ranking of overall project cost and power cost. For both rankings the 10 pipeline options listed are ranked in order of cost with 1 = lowest cost and 10 = highest cost. The power cost has been included as a separate element because it is an indicator of the reliance of the option on electricity and given that the cost of electricity is expected to increase significantly greater than inflation it is an issue considered worthy of highlighting. Having highlighted power as an issue, it is worth noting that at current electricity prices the power cost is small compared to the total project cost for all options.
Option
Project Cost
1 = lowest
10 = highest
Power Cost
1 = lowest
10 = highest Aboriginal Heritage Issues
Risk of Impact on Conservation Values
Suitability of Marine Outfall
B1 – Cheetam Salt 2 1 Preferred Low No outfall
B2 – Port Gawler 1 2 Preferred Low Medium – Low
C1 – Middleton 5 5 Less preferred Intermediate Low – High
C2 - Murray Mouth 6 8 Unlikely to be supported Medium High
D1 – Hells Gate 4 4 Less preferred High High
D2 – Tea Tree Crossing 8 6 Less preferred High High
D3 – 42 Mile Crossing 9 9 Less preferred High High
D4 – South of Coorong 10 10 Less preferred High High
E1 – Coorong Southern Lagoon 3 3 Less preferred High No outfall
E2 – Morella Basin 7 7 Less preferred High No outfall
Table 12.1 – Overall Comparison of Pipeline Alignments

Pipeline to the Sea: Feasibility Study - Phase 1
100
The Murray Mouth option, which discharges to the Goolwa Channel, may assist preventing the Murray Mouth from closing. However, as the likely discharge rates are less than 500 L/s it is considered that the discharge would probably be of limited value in preventing closure of the mouth.
The selection of a preferred alignment is difficult as no alignment ranks highest under all categories. The selection of a preferred alignment is therefore a subjective judgement. Consideration of the issues summarised in Table 12.2 suggests that the pipeline alignment to Port Gawler/Cheetham Salt is the preferred alignment. The suitability of the marine outfall for discharge of saline water is inferior to the options discharging to the Southern Ocean but preliminary modelling of the outfall indicates that an acceptable outfall could be constructed. Although the outfall at Port Gawler is likely to be more expensive than the outfalls for the Southern Ocean options, the overall project cost is likely to be considerably less because of the significantly shorter pipeline length. A significant advantage of the Port Gawler option is the avoidance of the Coorong National Park.
Comparison of Pipeline and Trucking
Figure 12.2 highlights that many of the pipeline options are less cost effective in removing salt than the trucking option. The only pipeline options which are more cost effective are the larger pipelines carrying concentrated groundwater. As highlighted in Section 12.4 these options are unrealistic in the short term.
As also highlighted in Section 12.4, the likely disposal requirement in the short term to maintain a sustainable Stockyard Plain Basin is 95 L/s at 19 000 mg/L salinity. The most cost effective pipeline option to dispose 100 L/s at 20 000 mg/L is the pipeline to Port Gawler and the present value cost per tonne of salt removed is $73.60. A similar salt load would be disposed by the 50 L/s pipeline to Cheetham Salt at Dry Creek carrying 41 000 mg/L water. The present value cost per tonne of salt removed for this option is $52.62. Neither of these two options are as cost effective as the trucking option which has a present value cost per tonne of salt removed of between $23.14 and $32.27, depending upon the destination point.

Pipeline to the Sea: Feasibility Study - Phase 1
101
13. Technical Review Workshop
Workshop Purpose, Attendees and Outcomes
A Technical Review Workshop was held on 1 May 2008 to review the draft report, discuss the findings of the study and to assess if a Phase 2 investigation was warranted. The workshop was attended by the following key stakeholders.
• Phil Cole (Department of Water Land & Biodiversity Conservation)
• Ed Collingham (SA Water)
• David Dreverman (Murray-Darling Basin Commission)
• Roger Ebsary (Tonkin Consulting)
• Brenton Erdmann (SA Water)
• Peter Forward (SA Water)
• Deb Lewis (Tonkin Consulting)
• Geordie McKinlay (Goulburn Murray Water)
• Joe Mifsud (Natural Resource Services)
• Jason Mitchell (Tonkin Consulting)
• Tony Morse (Murray-Darling Basin Commission)
• Phil Pfeiffer (Murray-Darling Basin Commission)
• Carmine Porcaro (Department of Water Land & Biodiversity Conservation)
• Domenic Rugari (Dommar Constructions)
• Andrew Telfer (Australian Water Environments)
• Julian Whiting (Tonkin Consulting)
It was generally agreed that the assumptions made during the investigation were acceptable for a feasibility study. The most notable debate centred on the assumption that evaporation basins could be constructed in the vicinity of Stockyard Plain to harvest salt. It was considered that it would not be possible to achieve sufficiently low leakage from clay-lined basins to produce salt. It was however acknowledged that the Stockyard Plain Basin could be modified to produce salt.
The initial consideration assumed that pipeline velocities should be maintained below 1.1 m/s to minimise the potential for the formation of iron bacteria in the pipeline. The workshop advised that if groundwater is pumped after discharging into Stockyard Plain Basin the iron bacteria would not form in the pipeline. The pipeline options were therefore reviewed following the workshop to select an optimum pipeline diameter which minimised the total pipeline and pumping cost.

Pipeline to the Sea: Feasibility Study - Phase 1
102
The workshop also requested that the desalination option be further developed to include operation and maintenance costs, the value of water and the cost of a pipeline to dispose fresh water to the River Murray. It was also noted that the recovery rates associated with a reverse osmosis plant were ambitious but could be achieved by multiple processing.
Given the importance of evaporation in the project it was agreed that the impact of climate change should be considered and included in the final report.
It was also considered that the total scheme costs could be reduced by having some sections of pipeline replaced by open channel and including energy recovery on the gravity sections of pipeline.
Overall, the workshop attendees considered that a pipeline to the sea was worthy of further investigation because it appeared to provide a cost effective option in the longer term when the inflow to the Stockyard Plain Basin exceeds the sustainable limit.
Phase 2
The project brief included consideration of a possible scope of works for further investigation if Phase 1 concluded that a pipeline to the sea was feasible. The brief listed the following as possible Phase 2 investigations;
• Optimising the sustainability of Stockyard Plain Basin allowing for the potential to use the
Basin for disposal of saline groundwater for a range of new schemes;
• The potential to extend the pipeline to also include disposal of saline water from the Noora
basin.
The principal conclusion from the workshop was that a pipeline to the sea could not be discounted and that it could be beneficial at some time in the future. The uncertainty in when the pipeline would be required was highlighted as the major unknown. It was therefore concluded that Phase 2 would look at what set of circumstances would lead to the construction of the pipeline. In particular, the commissioning of future salt interception schemes and the associated salt loads and flow rates would be quantified to determine the cumulative inflow to the Stockyard Plain Basin. The inclusion of Noora Basin and upstream salt interception schemes should also be considered, although the workshop consensus was that Noora Basin has a much longer sustainable life than the Stockyard Plain Basin.
It was also highlighted that a stand alone desalination plant at Stockyard Plain Basin (i.e. without a pipeline to the sea) would be worthwhile considering in more detail as a means of reducing inflow to the basin and hence extending the sustainable life of the basin. Although this option may be cost effective, it delays a decision on the pipeline to the sea but does not eliminate the need for the pipeline. The workshop also noted that this option retained salt in the Riverland whereas the preference is to remove salt from the landscape.

Pipeline to the Sea: Feasibility Study - Phase 1
103
The sustainable life of the Stockyard Plain Basin could also be increased by revising the management of the basin to maximise the evaporation from it. The potential to increase the area of the basin should be investigated.
Given that it has been shown that it is cost effective to concentrate the groundwater prior to disposal by pipeline, any further work on this project should include more detailed assessment of the desalination plant and evaporation basin options to determine a preferred concentrating mechanism.
It would also be beneficial if Phase 2 included more detailed assessment, including hydraulic modelling, of the preferred route to more accurately optimise the pipeline/pumping arrangement and hence determine more accurate cost estimates.

Pipeline to the Sea: Feasibility Study - Phase 1
104
14. Conclusions
Individual Conclusions
Notable conclusions from this desk top study are;
• The shortest pipeline length from the Stockyard Plain Basin to the sea is approximately
155 km to Port Gawler on Gulf St Vincent.
• A pipeline length of at least 240 km is required to discharge to the Southern Ocean.
• For all pipeline options the capital cost of the pipeline is much greater than the capital cost
of the pump stations. For the Port Gawler and Dry Creek options the cost of the pump
stations is 10% to 25% of the pipeline cost, while for the options which outfall to the
Southern Ocean the cost of the pump stations is 10% to 15% of the pipeline cost.
• The capital cost of the pipeline for any particular option is much greater than the capital
cost of the pump stations and the outfall structures. For the options which pump raw
groundwater from the Stockyard Plain Basin the pipeline represents 65% to 75% of the
capital cost for the Port Gawler options and 75% to 90% of the capital cost for the options
discharging to the Southern Ocean.
• For the options pumping concentrated groundwater, the capital cost of the concentrator
becomes significant and the pipeline cost becomes 40% to 50% of the total capital cost for
Port Gawler options and 50% to 70% for other options.
• Using a 30 year period and 4% discount rate the present value of the operating cost for the
Port Gawler and Dry Creek options is 20% to 50% of the pipeline cost. For the pipeline
options which involve an outfall to the Southern Ocean the operating cost is between 5%
and 30% of the pipeline cost, depending upon the pipeline capacity. For all options the
present value operating cost becomes a larger proportion of the scheme cost as the
pipeline capacity increases.
• The existing ETSA Utilities electricity distribution network would require significant upgrade
south of Meningie and west of Blanchetown to cater for the proposed pump stations along
the Coorong and Port Gawler pipeline options.
• The composition of the groundwater being pumped into the Stockyard Plain Basin is similar
to that of seawater. The principal differences between the Stockyard Plain Basin water and

Pipeline to the Sea: Feasibility Study - Phase 1
105
seawater are the elevated concentrations of oxidised nitrogen, ammonia, iron and
manganese.
• The results of the CORMIX modelling indicate that discharge from a single open pipe
marine outfall without a diffuser structure is likely to provide adequate mixing to achieve
acceptable concentrations of critical elements at the edge of the mixing zone as defined in
the Environmental Protection (Water Quality) Policy, 2003.
• Marine outfalls discharging to the Southern Ocean are likely to be shorter in length than
those discharging to Gulf St Vincent because of the higher energy waters and deeper water
closer to shore.
• Based on the number of species and habitats the Southern Ocean marine outfall locations
have a lower environmental risk than the Gulf St. Vincent marine outfall locations.
• The risk of impacting on conservation values along the Port Gawler alignment is low while
the risk of impacting on conservation values along the Coorong alignments is high.
• Aboriginal heritage issues are likely to be encountered along all pipeline alignments
although the number of issues is likely to be greater along the Coorong and Middleton-
Murray Mouth alignments.
• All Aboriginal heritage issues are likely to be manageable.
• The Murray Mouth alignment is unlikely to be supported by the local Aboriginal group
because of the cultural sensitivity of the Goolwa/Sir Richard Peninsula area.
• For any particular option, there is a decrease in present value cost per tonne of salt
removed with increasing pipeline capacity; i.e. for a given salinity of water pumped it is cost
effective to pump at a higher rate.
• For a particular pipeline alignment it is more cost effective to concentrate the groundwater
at the Stockyard Plain Basin before pumping. This indicates that the additional cost to
concentrate the groundwater is more than offset by the reduction in pipeline cost by using a
smaller pipe to transfer the same volume of salt.
• Although the options which concentrate the groundwater at Stockyard Plain are the most
cost effective, they require additional basin area in which to concentrate the water. This is
likely to be a significant issue with the local community and those opposed to the
construction of additional disposal basins.
• The Port Gawler options are likely to be more cost effective that the Middleton-Murray
Mouth options and the Coorong options which discharge to the Southern Ocean.

Pipeline to the Sea: Feasibility Study - Phase 1
106
• The most cost effective options are the 500 L/s pipelines delivering 100 000 mg/L water to
Port Gawler and Cheetham Salt at Dry Creek. Under this option the present value cost per
tonne of salt is approximately $11.40.
• Most of the pipeline options are less cost effective in removing salt than harvesting salt at
the Stockyard Plain Basin and trucking it to a disposal site. The only pipeline options which
are more cost effective are the larger pipelines carrying concentrated groundwater and
these are very expensive.
• Consideration of all issues suggests that the pipeline alignment to Port Gawler/Cheetham
Salt is the preferred alignment.
Overall Conclusions
• For the anticipated groundwater flows and salt loads requiring disposal in the short term,
piping salt is not as cost effective as harvesting salt at Stockyard Plain Basin and removal
by trucking. A drawback of this option is that additional evaporation basins would have to
be constructed to allow salt to be harvested.
• The most cost effective pipeline option is to concentrate brine at Stockyard Plain Basin and
transport it to the Cheetham Salt facility at Dry Creek. Although preliminary figures indicate
that this option is not as cost effective as the trucking option it is considered that it warrants
more detailed assessment as it re-uses a waste product and there is opportunity to offset
costs against the reduced pumping which would be required by Cheetham Salt. If coupled
with a desalination plant at Stockyard Plain Basin to concentrate the brine, the total project
could be seen as turning a problem into a number of benefits.
• A pipeline to the sea is a promising option to remove salt from the Riverland region of
South Australia some time in the future when additional volumes of saline groundwater are
generated by new salt interception schemes. A pipeline to the sea warrants more detailed
investigation to more accurately determine costs for the preferred alignment and to
determine when the pipeline would be required to ensure the long term ecological
sustainability of the Stockyard Plain Basin.

Pipeline to the Sea: Feasibility Study - Phase 1
107
15. References
ACHM (2007), “Aboriginal Heritage Desktop Study – Murray Darling Basin Commission Pipeline to the Sea” by Phil Czerwinski, Australian Cultural Heritage Management, September 2007.
Australian and New Zealand Environmental and Conservation Council (ANZECC) (2000), “Australian and New Zealand Guidelines for Fresh and Marine Water Quality – Volume 1” Australian Water Association.
AWE (2003), “Regional Saline Water Disposal Strategy, Stages 1 & 2. River Murray, Lock 1 to Lock10” by Australian Water Environments for Department of Water Land and Biodiversity Conservation, June 2003.
Baker, J.L. (2004), “Towards a System of Ecologically Representative Marine Protected Areas in South Australian Marine Bioregions - Technical Report.” prepared for Coast and Marine Conservation Branch, Department for Environment and Heritage, South Australia.
Baker, J.L. (in press), “Marine and Estuarine Fish and Elasmobranch Species of Conservation Concern in South Australia.” prepared under contract to Coast and Marine Conservation Branch, S.A. Department for Environment and Heritage, and Marine and Coastal Community Network of S.A., for the South Australian Working Group for Marine Species of Conservation Concern.
Bryars, S. (2003), “An Inventory of Important Coastal Fisheries Habitats in South Australia.” Fish Habitat Program, Primary Industries and Resources, South Australia.
Coleman, P. (2007), personal communication from Peri Coleman of Delta Environmental Consulting, August 2007.
Collingham, E.B. (2008), personal communication at Technical Review Workshop, May 2008.
Collings, G., Bryars, S., Nayar, S., Miller, D., Lill, J. and O’Loughlin, E., (2006), “Elevated nutrient responses of the meadow forming seagrasses, Amphibolis and Posidonia, from the Adelaide metropolitan coastline” ACWS Technical Report No. 11 prepared for the Adelaide Coastal Waters Study Steering Committee, SARDI (Aquatic Sciences) Publication No. RD01/0208-16, Adelaide.
CSIRO (2007), “Climate Change in Australia” CSIRO Technical Report 2007.
Delta Environmental Consulting (2007), “Modelling Evaporation Basins” for Tonkin Consulting, September 2007.

Pipeline to the Sea: Feasibility Study - Phase 1
108
Drever, J.I. (1982), "The Geochemistry of Natural Water” Prentice-Hall, Englewood Cliffs, New Jersey.
Ecological Associates (2007), “Pipeline to the Sea – Assessment of Ecological Issues” October 2007.
Edyvane, K. (1999), “Conserving Marine Biodiversity in South Australia – Part 2 – Identification of Areas of High Conservation Value in South Australia.” SARDI Report Number 39, PIRSA.
Edyvane, K.S. and Baker, J.L. (1995), “The South Australian Marine Regionalisation Project.” Towards a Marine Regionalisation for Australia, Proceedings of a Workshop Held in Sydney, New South Wales, 4-6 March 1994, Great Barrier Reef Marine Park Authority, September 1995 for the Commonwealth of Australia Ocean Rescue 2000 Workshop Series; No. 1. Edited by Jim Muldoon. ISBN 0642174393.
Everingham, P., Fisher, G., Nicholson, B. (2005), “Coorong Water Quality Assessment” for Department of Water Land and Biodiversity Conservation, September 2005.
Graham, A., Oppermann, A. and Inns, R.W. (2001), “Biodiversity Plan for the Northern Agricultural Districts”, Department for Environment and Heritage, SA.
Harrington, G.A. and Howes, N.M. (2004), “Analytical Data for Waters in the MDBC Disposal Basins. Appendix 1 of Value Adding to Salts Recovered from Saline Waters in Disposal Basins in the Murray-Darling Basin – Proof of Concept Study” CSIRO Minerals Report DMR-2378A, September 2004.
Kahrimanis, M.J., Carruthers, S., Oppermann, A. and Inns, R. (2001), Biodiversity Plan for the South Australian Murray-Darling Basin” Department for Environment and Heritage, SA.
Laut, P., Heyligers, P.C., Keig, G., Loffler, E., Margules, C., Scott, R.M. and Sullivan, M.E. (1977) “Environments of South Australia. Province 2 Murray Mallee” CSIRO, Canberra.
Melbourne Water and GHD (2007), Melbourne Augmentation Program, Seawater Desalination - Feasibility Study” June 2007.
Natural Resource Services (2007), “Pipeline from the Stockyard Plain Salt Interception Scheme to the Sea, Phase 1, Implications to the Marine Ecosystems at the Proposed Discharge Locations” October 2007.
Norgate, T. E. (2004), “Modelling and Techno-economic Evaluation of the Production of Mineral Salts from Saline Waters. Appendix 5 of Value Adding to Salts Recovered from Saline Waters in Disposal Basins in the Murray-Darling Basin – Proof of Concept Study” CSIRO Minerals Report DMR-2378E, September 2004.

Pipeline to the Sea: Feasibility Study - Phase 1
109
Pfeiffer, P. (2007), personal communication from Phil Pfeiffer, Manager Salt Interception, River Murray Water, Murray Darling Basin Commission, August 2007.
Phillips, W. and Muller, K. (2006) “Ecological Character of the Coorong,, Lakes Alexandrina and Albert. Wetland of International Importance.” Department for Environment and Heritage, SA.
Singh, J. and Christen, E. (2000), “On-farm and Community-scale Salt Disposal Basins on the Riverine Plain, Minimising the Cost of Basins: Siting, Design and Construction Factors” CSIRO Land and Water Technical Report 12/99, April 2000.
SKM (2004a), “Regional Saline Disposal Strategy – Stage 3, Geographic Information System Results, Noora basin and Stockyard Plains” by Sinclair Knight Merz for Department of Water Land and Biodiversity Conservation, Draft A June 2004.
SKM (2004b), “Regional Saline Disposal Strategy – Stage 3, South Australian Regional Disposal Strategy” by Sinclair Knight Merz for Department of Water Land and Biodiversity Conservation, Draft A November 2004.
URS (2002), “Introduction to Desalination Technologies in Australia - Summary Report” by URS Australia for Agriculture, Fisheries & Forestry - Australia, September 2002.
Ward, R. (2007), personal communication from Roger Ward, South Australian Operations Manager, Cheetham Salt Limited, October 2007.

Pipeline to the Sea: Feasibility Study - Phase 1
110
Appendix A Fisheries Habitats
Fisheries habitats of relevance to the Port Wakefield site
Species Habitat Seagrass meadow
Unvegetated soft bottom Tidal flat Tidal creek Mangrove
forest Blue Swimmer Crab a,s,e,l,j a,s,e,l,j a,s,e,j a,j a,j Razorfish a,s,p,j a,s,p,j a,s,p,j Western King Prawn a,j p,j j J Southern Calamari a,s,e a King & Queen Scallop a,s,p,j a,s,p,j King George Whiting a,j a,j p,j a,j p,j Mud Cockle a,s,p,j Baitworm a,s,p,j a,s,p,j Southern Sea Garfish a,s,l,j a,l a,j a,j j Australian Salmon a,j a,j a,j a,j j Snapper a,j a,j Tommy Ruff a,j a,j a,j j Yellowfin Whiting a,s,p,j a,s,p,j a,p,j j Snook s s Yelloweye Mullet Red Mullet j a,j a,j a,j
Abbrevations: a = adults/recruits
s = spawners
e = eggs
l = larvae
p = post larvae
j = juveniles

Pipeline to the Sea: Feasibility Study - Phase 1
111
Fisheries habitats of relevance to the Port Gawler site.
Species
Habitat Seagrass meadow
Unvegetated soft bottom Tidal flat Tidal creek Mangrove
forest Firing Range-Outer Harbor
Firing Range-Outer Harbor
Firing Range-St Kilda
Port Parham-St Kilda
Light Beach-St Kilda
Blue Swimmer Crab a,s,e,j a,s,e,l,j a,s,e,l,j a,j a,j Razorfish a,s,p,j a,s,p,j a,s,p,j King/Queen Scallop a,s,p,j a,s,p,j Western King Prawn a,j p,j j j Southern Calamari a,s,e a King George Whiting a,j a,j p,j a,j p,j Australian Salmon a,j a a,j a,j J Southern Sea Garfish a,j,s,l a,j,l a,j a,j J Yellowfin Whiting a,j,p,s a,j,p a,j,p J Yelloweye Mullet a,j a,j a,j a,j Snook a,s a,s Snapper a,j a,j Tommy Ruff a,j a,j a,j a,j j Mud Cockle a,j,p,s a,j,p,s Baitworm a,j,p,s a,j,p,s Red Mullet a,j a,j Flathead a,j a,j a,j a,j Flounder a,j a,j a,j Trevally a,j j Black Bream a,j a,j Mulloway a a,j School Whiting a Whaler Shark a,j a,j Leatherjacket j Abbrevations: a = adults/recruits
s = spawners
e = eggs
l = larvae
p = post larvae
j = juveniles

Pipeline to the Sea: Feasibility Study - Phase 1
112
Fisheries habitats of relevance to the Middleton site.
Species
Habitat
Reef Surf beach Surf beach Surf beach Sheltered
beach Seagrass meadow
Unvegetated soft bottom
King Head-Middleton Point
Dump Beach-Knights Beach
Horse-shoe Bay
Middleton Beach-Goolwa Beach
Fisherman Bay/ Basham Beach
Fisherman Bay
King Head-Middleton Point
Southern Rock Lobster a,s,p,j Greenlip & Blacklip Abalone a,s,e,l,p,j Purple Sea Urchin a,s,e,l,p,j Southern Calamari a,s,e a,s,e a Maori Octopus a,s,e,j Sea Sweep a,s,j Western Blue Groper a,s,j Baitworm a,s,p,j a,s,p,j a,s,p,j a,s,p,j a,s,p,j Goolwa Cockle a,s,p,j Yelloweye Mullet a a a a a,s a Sand Crab a,j a,j a,j a,j a,j Australian Salmon a,j a a a a a,j a School Whiting a,j a,j a,j a,j a Mulloway a a,j a,j a,j a,j a Tommy Ruff a,j a a a a a,j a Giant Cuttlefish a King George Whiting a a a Snapper a a Southern Sea Garfish a a a Flathead a a a a a a Whaler Shark a a a a a a a Wrasse a Snook a a a Trevally a a a Leatherjacket a a Silver Drummer a Gummy Shark a a School Shark a Flounder a
Abbrevations: a = adults/recruits
s = spawners
e = eggs
l = larvae
p = post larvae
j = juvenile

Pipeline to the Sea: Feasibility Study - Phase 1
113
Fisheries habitats of relevance to the Murray Mouth site
Species
Habitat
A continuous section of surf beach between the Murray Mouth and The Granites.
The Murray River estuary encompassing those waters between the barrages and the Murray Mouth that are northwest of a line between Pelican Point and Gnurlung Point.
Snapper a Australian Salmon a a,j Tommy Ruff a a,j Yelloweye Mullet a a,s,j Mulloway a,j a,j Gummy Shark a Whaler Shark a a Sand Crab a,j Baitworm a,s,p,j a,s,p,j Goolwa Cockle a,s,p,j School Whiting a,j School Shark a Flathead a Flounder a Black Bream a,s,e,l,p,j Western River Garfish a,j
Abbrevations: a = adults/recruits
s = spawners
e = eggs
l = larvae
p = post larvae
j = juveniles

Pipeline to the Sea: Feasibility Study - Phase 1
114
Fisheries habitats of relevance to the McGrath Flat site
Species
Habitat A continuous section of surf beach between the Murray Mouth and The Granites.
Snapper a Australian Salmon a Tommy Ruff a Yelloweye Mullet a Mulloway a,j Gummy Shark a Whaler Shark a Sand Crab a,j Baitworm a,s,p,j Goolwa Cockle a,s,p,j School Whiting a,j School Shark a Gummy Shark a
Abbrevations: a = adults/recruits
s = spawners
e = eggs
l = larvae
p = post larvae
j = juveniles

Pipeline to the Sea: Feasibility Study - Phase 1
115
Fisheries habitats of relevance to the Crossings sites
Species
Habitat
Sections of offshore reef occur between 32 Mile Crossing and an area along Long Beach just south of Lake Nadzab.
A continuous section of surf beach occurs between the Murray Mouth and The Granites.
Southern Rock Lobster a,s,p,j Maori Octopus a,s,e,j Greenlip & Blacklip Abalone a,s,e,l,p,j Purple Sea Urchin a,s,e,l,p,j Sea Sweep a,s,j King George Whiting a Snapper a a Australian Salmon a a Tommy Ruff a a Yelloweye Mullet a a Mulloway a a,j Trevally a Leatherjacket a Wrasse a Snook a Sea Sweep a Silver Drummer a Gummy Shark a a Whaler Shark a a Sand Crab a,j Baitworm a,s,p,j Goolwa Cockle a,s,p,j School Whiting a,j School Shark a
Abbrevations: a = adults/recruits
s = spawners
e = eggs
l = larvae
p = post larvae
j = juveniles

Pipeline to the Sea: Feasibility Study - Phase 1
116
Appendix B Risk Assessment for Marine Habitats
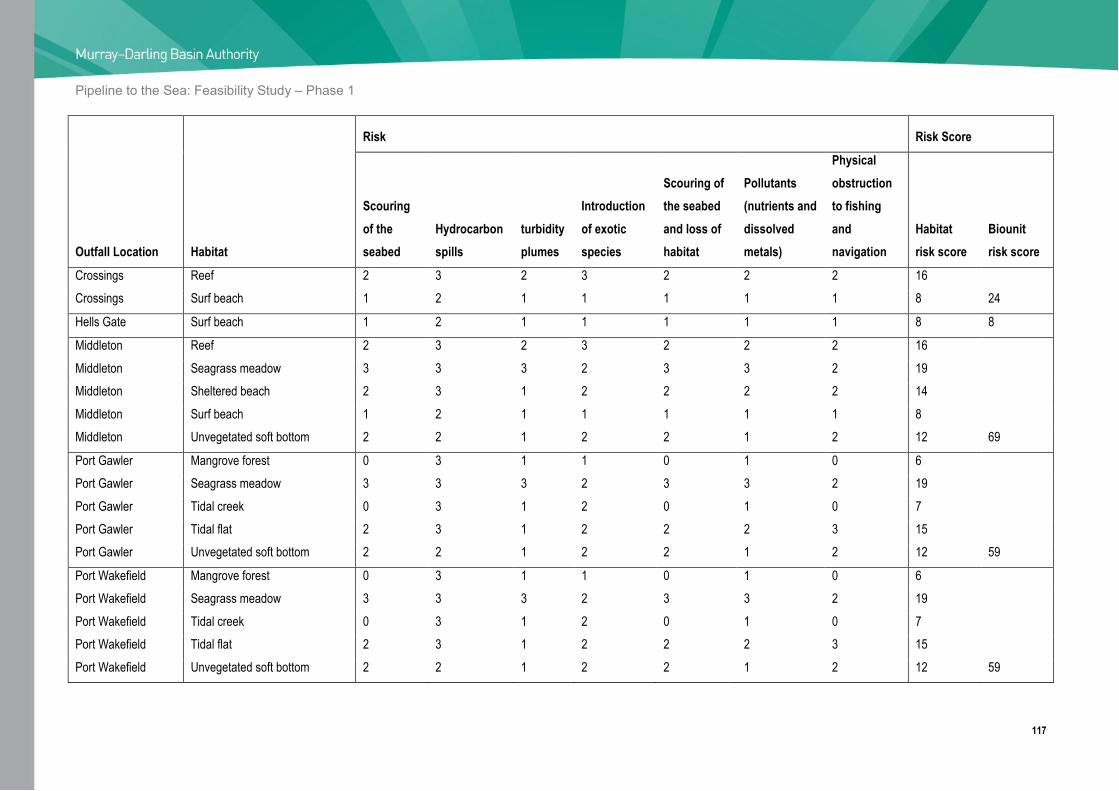
Pipeline to the Sea: Feasibility Study – Phase 1
117
Outfall Location Habitat
Risk Risk Score
Scouring of the seabed
Hydrocarbon spills
turbidity plumes
Introduction of exotic species
Scouring of the seabed and loss of habitat
Pollutants (nutrients and dissolved metals)
Physical obstruction to fishing and navigation
Habitat risk score
Biounit risk score
Crossings Reef 2 3 2 3 2 2 2 16 Crossings Surf beach 1 2 1 1 1 1 1 8 24
Hells Gate Surf beach 1 2 1 1 1 1 1 8 8
Middleton Reef 2 3 2 3 2 2 2 16 Middleton Seagrass meadow 3 3 3 2 3 3 2 19 Middleton Sheltered beach 2 3 1 2 2 2 2 14 Middleton Surf beach 1 2 1 1 1 1 1 8 Middleton Unvegetated soft bottom 2 2 1 2 2 1 2 12 69
Port Gawler Mangrove forest 0 3 1 1 0 1 0 6 Port Gawler Seagrass meadow 3 3 3 2 3 3 2 19 Port Gawler Tidal creek 0 3 1 2 0 1 0 7 Port Gawler Tidal flat 2 3 1 2 2 2 3 15 Port Gawler Unvegetated soft bottom 2 2 1 2 2 1 2 12 59
Port Wakefield Mangrove forest 0 3 1 1 0 1 0 6 Port Wakefield Seagrass meadow 3 3 3 2 3 3 2 19 Port Wakefield Tidal creek 0 3 1 2 0 1 0 7 Port Wakefield Tidal flat 2 3 1 2 2 2 3 15 Port Wakefield Unvegetated soft bottom 2 2 1 2 2 1 2 12 59

Pipeline to the Sea: Feasibility Study - Phase 1
118
Appendix C Risk Assessment for Marine Species

Pipeline to the Sea: Feasibility Study – Phase 1
119
Outlet Species
Risk Risk Score Scouring of the seabed
Hydrocarbon spills
turbidity plumes
Scouring and loss of habitat Pollutants Species Biounit
Crossings Australian salmon 1 2 1 1 1 6 Crossings baitworm 3 3 1 3 2 12 Crossings blacklip abalone 2 3 1 2 2 10 Crossings Goolwa cockle 3 3 1 3 2 12 Crossings greenlip abalone, 2 3 1 2 2 10 Crossings gummy shark 1 2 1 1 1 6 Crossings gummy shark 1 2 1 1 1 6 Crossings King George whiting 1 2 1 2 1 7 Crossings leatherjacket 1 2 1 2 1 7 Crossings Maori octopus 2 2 1 2 1 8 Crossings mulloway 1 2 1 1 1 6 Crossings purple sea urchin 2 3 1 2 2 10 Crossings sand crab 2 3 1 2 2 10 Crossings school shark 1 2 1 1 1 6 Crossings school whiting 1 2 1 2 2 8 Crossings sea sweep 1 2 1 1 1 6 Crossings sea sweep 1 2 1 1 1 6 Crossings silver drummer 1 2 1 1 1 6 Crossings snapper 1 2 1 1 1 6 Crossings snook 1 2 1 1 1 6 Crossings southern rock lobster 2 3 1 2 2 10 Crossings tommy ruff 1 2 1 1 1 6 Crossings trevally 1 2 1 1 1 6 Crossings whaler shark 1 2 1 1 1 6 Crossings wrasse 1 2 1 1 1 6 Crossings yelloweye mullet 1 2 1 1 1 6 194

Pipeline to the Sea: Feasibility Study – Phase 1
120
Outlet Species
Risk Risk Score Scouring of the seabed
Hydrocarbon spills
turbidity plumes
Scouring and loss of habitat Pollutants Species Biounit
McGrath Flat Australian salmon 1 2 1 1 1 6 McGrath Flat baitworm 3 3 1 3 2 12 McGrath Flat Goolwa cockle 3 3 1 3 2 12 McGrath Flat gummy shark 1 2 1 1 1 6 McGrath Flat gummy shark 1 2 1 1 1 6 McGrath Flat mulloway 1 2 1 1 1 6 McGrath Flat sand crab 2 3 1 2 2 10 McGrath Flat school shark 1 2 1 1 1 6 McGrath Flat school whiting 1 2 1 2 2 8 McGrath Flat snapper 1 2 1 1 1 6 McGrath Flat tommy ruff 1 2 1 1 1 6 McGrath Flat whaler shark 1 2 1 1 1 6 McGrath Flat yelloweye mullet 1 2 1 1 1 6 96

Pipeline to the Sea: Feasibility Study – Phase 1
121
Outlet Species
Risk Risk Score Scouring of the seabed
Hydrocarbon spills
turbidity plumes
Scouring and loss of habitat Pollutants Species Biounit
Middleton Australian salmon 1 2 1 1 1 6 Middleton baitworm 3 3 1 3 2 12 Middleton flathead 2 3 1 2 2 10 Middleton flounder 2 3 1 2 2 10 Middleton giant cuttlefish 1 3 2 2 2 10 Middleton Goolwa cockle 3 3 1 3 2 12
Middleton greenlip & blacklip abalone 2 3 1 2 2 10
Middleton gummy shark 1 2 1 1 1 6 Middleton King George whiting 1 2 1 2 1 7 Middleton leatherjacket 1 2 1 2 1 7 Middleton Maori octopus 2 2 1 2 1 8 Middleton mulloway 1 2 1 1 1 6 Middleton purple sea urchin 2 3 1 2 2 10 Middleton sand crab 2 3 1 2 2 10 Middleton school shark 1 2 1 1 1 6 Middleton school whiting 1 2 1 2 2 8 Middleton sea sweep 1 2 1 1 1 6 Middleton silver drummer 1 2 1 1 1 6 Middleton snapper 1 2 1 1 1 6 Middleton snook 1 2 1 1 1 6 Middleton southern calamari 1 2 1 2 2 8 Middleton southern rock lobster 2 3 1 2 2 10 Middleton southern sea garfish 1 2 1 1 1 6 Middleton tommy ruff 1 2 1 1 1 6 Middleton trevally 1 2 1 1 1 6 Middleton western blue groper 1 2 1 1 1 6 Middleton whaler shark 1 2 1 1 1 6 Middleton wrasse 1 2 1 1 1 6 Middleton yelloweye mullet 1 2 1 1 1 6 222

Pipeline to the Sea: Feasibility Study – Phase 1
122
Outlet Species
Risk Risk Score Scouring of the seabed
Hydrocarbon spills
turbidity plumes
Scouring and loss of habitat Pollutants Species Biounit
Port Gawler Australian salmon 1 2 1 1 1 6 Port Gawler baitworm 3 3 1 3 2 12 Port Gawler black bream 1 2 1 1 1 6 Port Gawler blue swimmer crab 2 3 1 2 2 10 Port Gawler flathead 2 3 1 2 2 10 Port Gawler flounder 2 3 1 2 2 10 Port Gawler King George whiting 1 2 1 2 1 7 Port Gawler king/queen scallop 2 3 1 2 2 10 Port Gawler leatherjacket 1 2 1 2 1 7 Port Gawler mud cockle 3 3 1 3 2 12 Port Gawler mulloway 1 2 1 1 1 6 Port Gawler razorfish 3 3 2 3 2 13 Port Gawler red mullet 1 2 1 1 1 6 Port Gawler school whiting 1 2 1 2 2 8 Port Gawler snapper 1 2 1 1 1 6 Port Gawler snook 1 2 1 1 1 6 Port Gawler southern calamari 1 2 1 2 2 8 Port Gawler southern sea garfish 1 2 1 1 1 6 Port Gawler tommy ruff 1 2 1 1 1 6 Port Gawler trevally 1 2 1 1 1 6 Port Gawler western king prawn 2 3 1 3 2 11 Port Gawler whaler shark 1 2 1 1 1 6 Port Gawler yelloweye mullet 1 2 1 1 1 6 Port Gawler yellowfin whiting 1 2 1 2 2 8 192
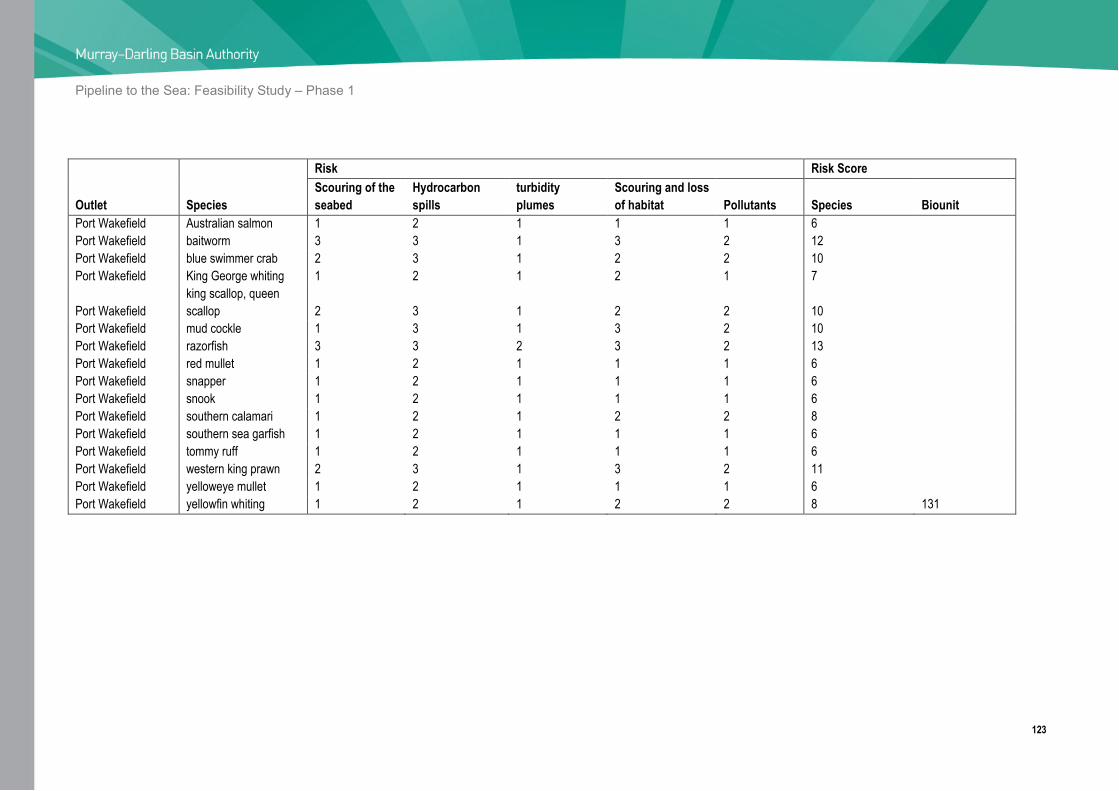
Pipeline to the Sea: Feasibility Study – Phase 1
123
Outlet Species
Risk Risk Score Scouring of the seabed
Hydrocarbon spills
turbidity plumes
Scouring and loss of habitat Pollutants Species Biounit
Port Wakefield Australian salmon 1 2 1 1 1 6 Port Wakefield baitworm 3 3 1 3 2 12 Port Wakefield blue swimmer crab 2 3 1 2 2 10 Port Wakefield King George whiting 1 2 1 2 1 7
Port Wakefield king scallop, queen scallop 2 3 1 2 2 10
Port Wakefield mud cockle 1 3 1 3 2 10 Port Wakefield razorfish 3 3 2 3 2 13 Port Wakefield red mullet 1 2 1 1 1 6 Port Wakefield snapper 1 2 1 1 1 6 Port Wakefield snook 1 2 1 1 1 6 Port Wakefield southern calamari 1 2 1 2 2 8 Port Wakefield southern sea garfish 1 2 1 1 1 6 Port Wakefield tommy ruff 1 2 1 1 1 6 Port Wakefield western king prawn 2 3 1 3 2 11 Port Wakefield yelloweye mullet 1 2 1 1 1 6 Port Wakefield yellowfin whiting 1 2 1 2 2 8 131

Pipeline to the Sea: Feasibility Study - Phase 1
Appendix D Pipeline System Schematics

'7
2-)')
id89
2080
31 p
dfM
achi
ne b
y B
road
gun
Sof
twar
e -
a g
reat
PD
F w
riter
! -
a gr
eat P
DF
cre
ator
! - h
ttp://
ww
w.p
dfm
achi
ne.c
om h
ttp://
ww
w.b
road
gun.
com

'7
2-)')
id89
1790
62 p
dfM
achi
ne b
y B
road
gun
Sof
twar
e -
a g
reat
PD
F w
riter
! -
a gr
eat P
DF
cre
ator
! - h
ttp://
ww
w.p
dfm
achi
ne.c
om h
ttp://
ww
w.b
road
gun.
com

'7
2-)')
id89
1027
65 p
dfM
achi
ne b
y B
road
gun
Sof
twar
e -
a g
reat
PD
F w
riter
! -
a gr
eat P
DF
cre
ator
! - h
ttp://
ww
w.p
dfm
achi
ne.c
om h
ttp://
ww
w.b
road
gun.
com

'7
2-)')
id89
0285
93 p
dfM
achi
ne b
y B
road
gun
Sof
twar
e -
a g
reat
PD
F w
riter
! -
a gr
eat P
DF
cre
ator
! - h
ttp://
ww
w.p
dfm
achi
ne.c
om h
ttp://
ww
w.b
road
gun.
com