Embed Size (px)
Citation preview
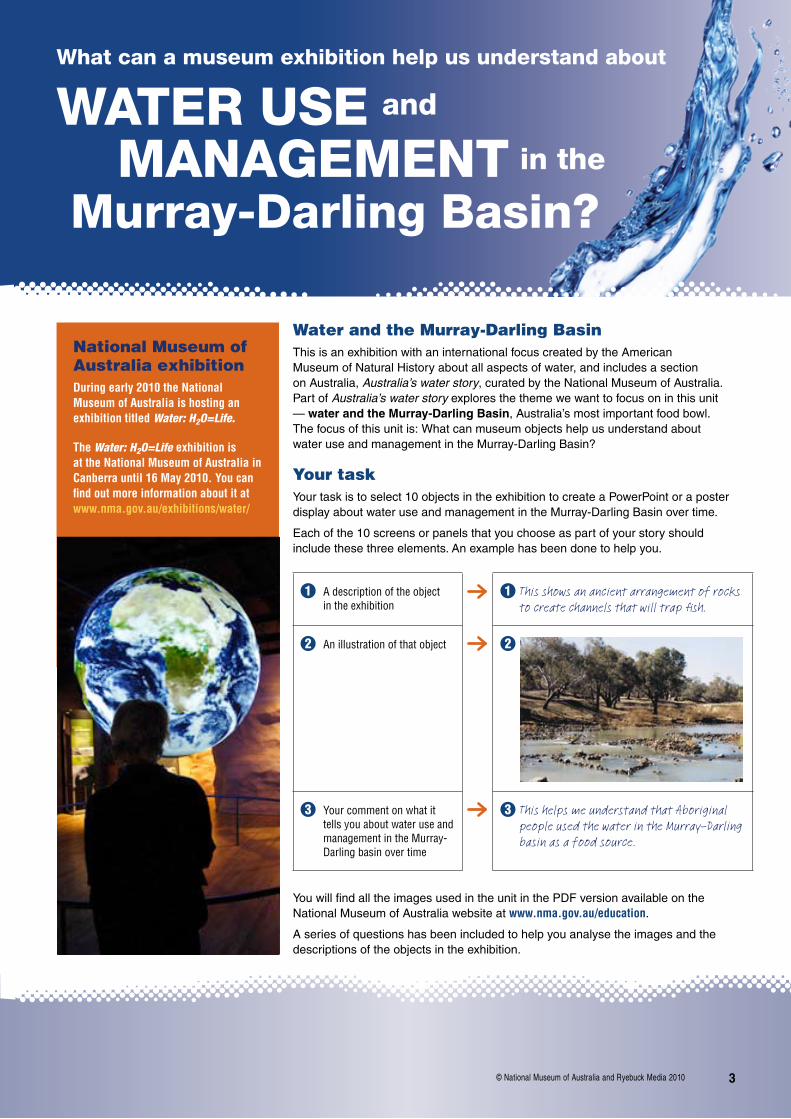
Articles: Water and the Murray-Darling BasinThis is an exhibition with an international focus created by the American Museum of Natural History about all aspects of water, and includes a section on Australia, Australia’s water story, curated by the National Museum of Australia. Part of Australia’s water story explores the theme we want to focus on in this unit — water and the Murray-Darling Basin, Australia’s most important food bowl. The focus of this unit is: What can museum objects help us understand about water use and management in the Murray-Darling Basin?
Your taskYour task is to select 10 objects in the exhibition to create a PowerPoint or a poster display about water use and management in the Murray-Darling Basin over time.
Each of the 10 screens or panels that you choose as part of your story should include these three elements. An example has been done to help you.
1 A description of the object in the exhibition
1 This shows an ancient arrangement of rocks to create channels that will trap fish.
2 An illustration of that object 2
3 Your comment on what it tells you about water use and management in the Murray-Darling basin over time
3 This helps me understand that Aboriginal people used the water in the Murray-Darling basin as a food source.
You will find all the images used in the unit in the PDF version available on the National Museum of Australia website at www.nma.gov.au/education.
A series of questions has been included to help you analyse the images and the descriptions of the objects in the exhibition.
What can a museum exhibition help us understand about
National Museum of Australia exhibitionDuring early 2010 the National Museum of Australia is hosting an exhibition titled Water: H2O=Life.
The Water: H2O=Life exhibition is at the National Museum of Australia in Canberra until 16 May 2010. You can find out more information about it at www.nma.gov.au/exhibitions/water/
3© National Museum of Australia and Ryebuck Media 2010
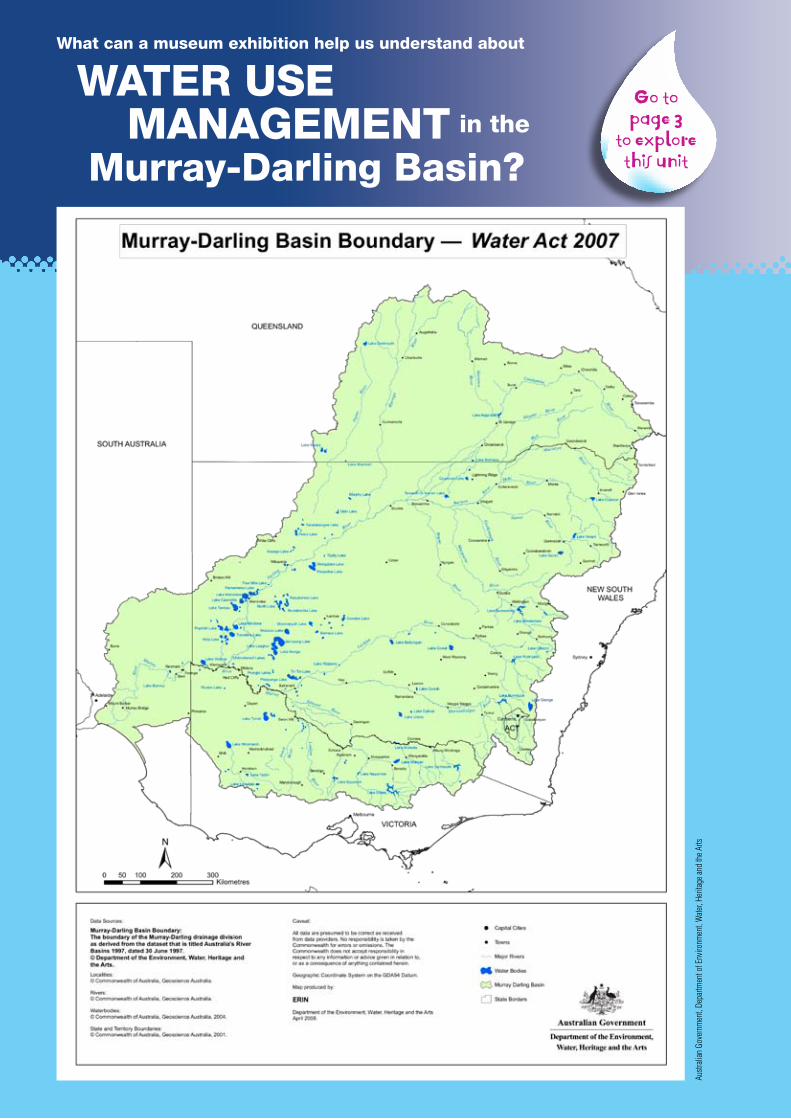
What and where is the Murray-Darling Basin?
A An overviewThe Murray–Darling Basin is the catchment for the Murray and Darling rivers and their many tributaries. It extends from north of Roma in Queensland to Goolwa in South Australia. It is located within four states and the Australian Capital Territory. It covers three quarters of New South Wales, two-thirds of Victoria, 15 per cent of Queensland, 8 per cent of South Australia and the entire Australian Capital Territory.
The Murray-Darling is Australia’s longest river system, and is one of the longest river systems in the world. In total the MDB includes 23 river valleys, covering over one million square kilometres, or 14 per cent of Australia. The Basin also contains important groundwater systems. It includes a great range of climatic conditions and natural environments, including cool and humid rainforests (in parts of Queensland and the Great Dividing Range), temperate Mallee country (in parts of Victoria and South Australia), inland sub-tropical areas (in Queensland), and hot, dry semi-arid and arid lands (in western New South Wales).
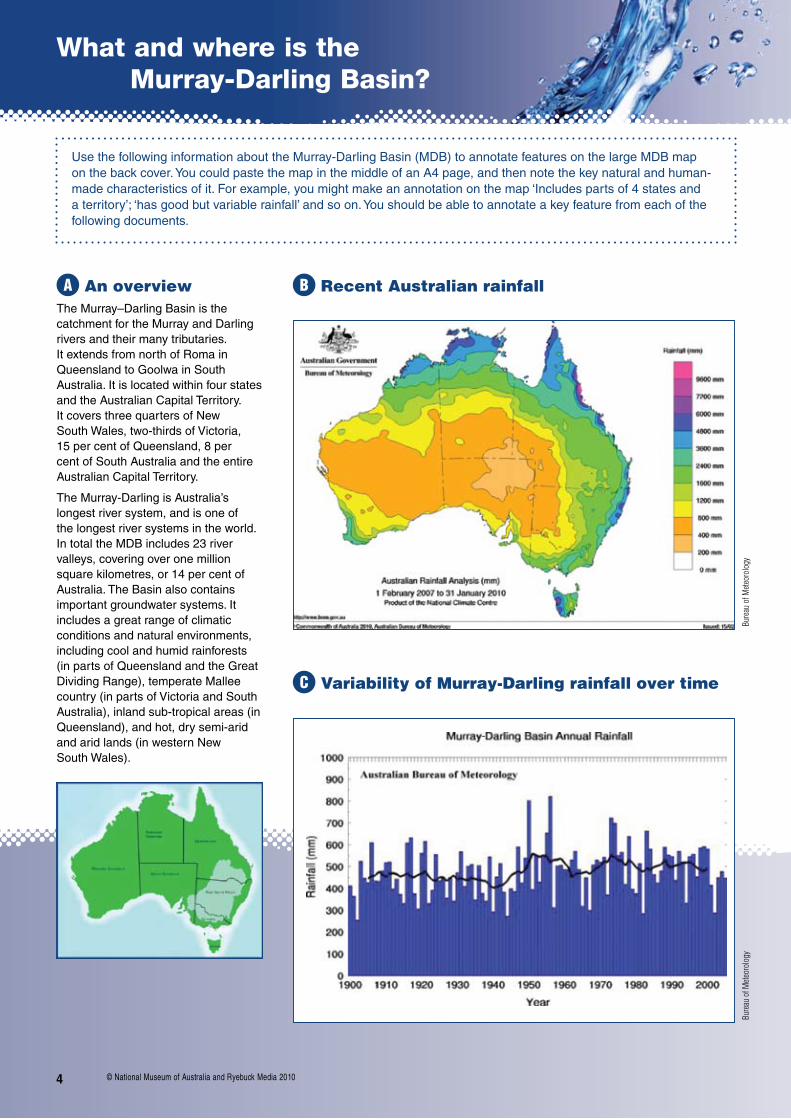
B Recent Australian rainfall
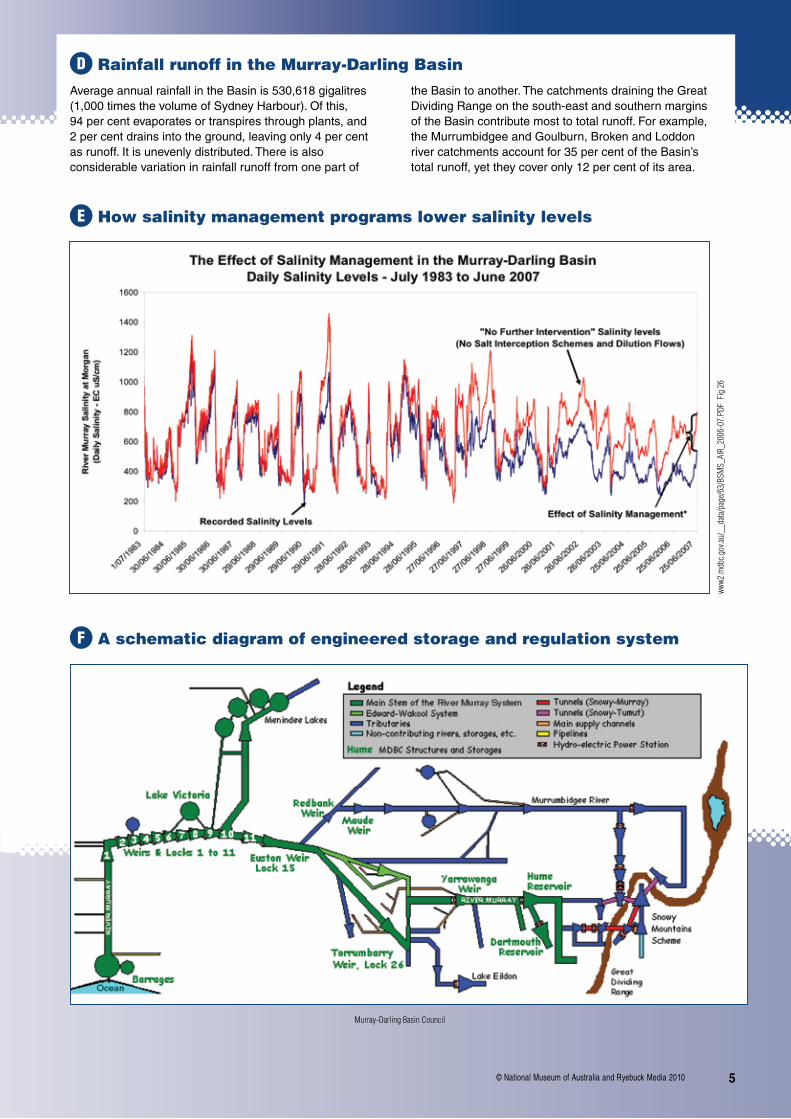
C Variability of Murray-Darling rainfall over time
Bur
eau
of M
eteor
olog
y
Bur
eau
of M
eteor
olog
y
Use the following information about the Murray-Darling Basin (MDB) to annotate features on the large MDB map on the back cover. You could paste the map in the middle of an A4 page, and then note the key natural and human-made characteristics of it. For example, you might make an annotation on the map ‘Includes parts of 4 states and a territory’; ‘has good but variable rainfall’ and so on. You should be able to annotate a key feature from each of the following documents.
-
4 © National Museum of Australia and Ryebuck Media 2010
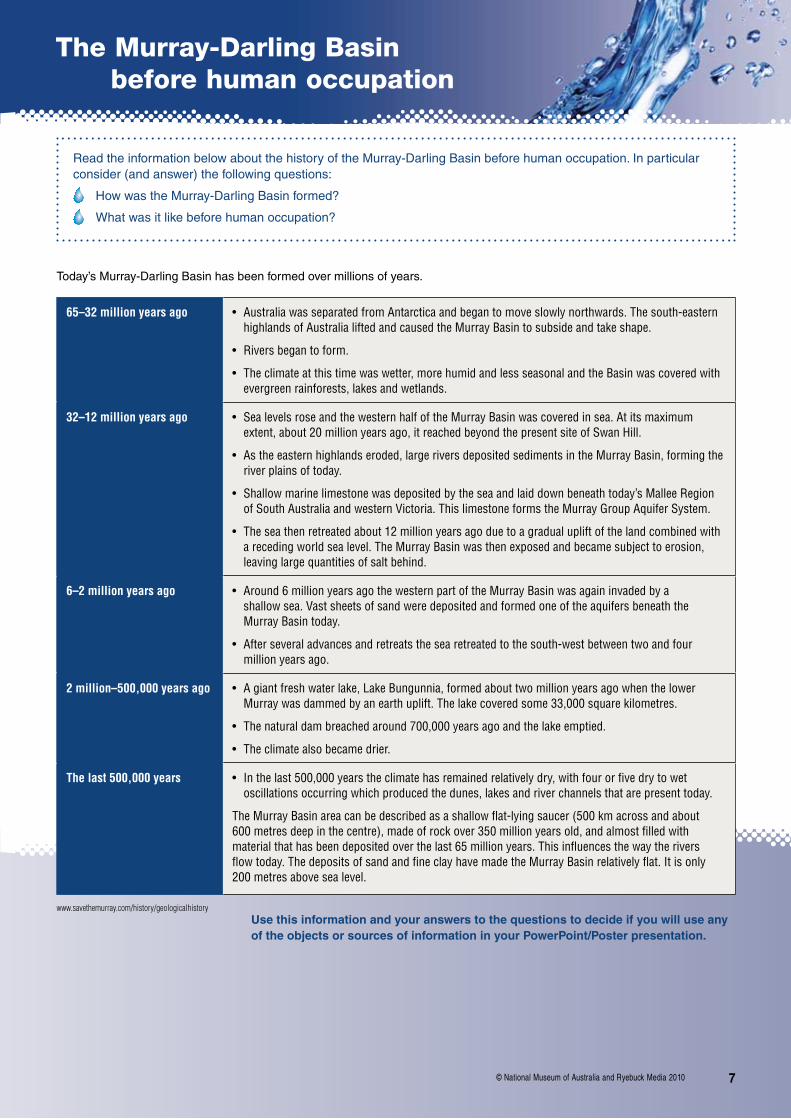
F A schematic diagram of engineered storage and regulation system
www2
.mdb
c.gov
.au/_
_data
/pag
e/63
/BSM
S_AI
R_20
06-0
7.PD
F F
ig 2
6
Murray-Darling Basin Council
D Rainfall runoff in the Murray-Darling BasinAverage annual rainfall in the Basin is 530,618 gigalitres (1,000 times the volume of Sydney Harbour). Of this, 94 per cent evaporates or transpires through plants, and 2 per cent drains into the ground, leaving only 4 per cent as runoff. It is unevenly distributed. There is also considerable variation in rainfall runoff from one part of
the Basin to another. The catchments draining the Great Dividing Range on the south-east and southern margins of the Basin contribute most to total runoff. For example, the Murrumbidgee and Goulburn, Broken and Loddon river catchments account for 35 per cent of the Basin’s total runoff, yet they cover only 12 per cent of its area.
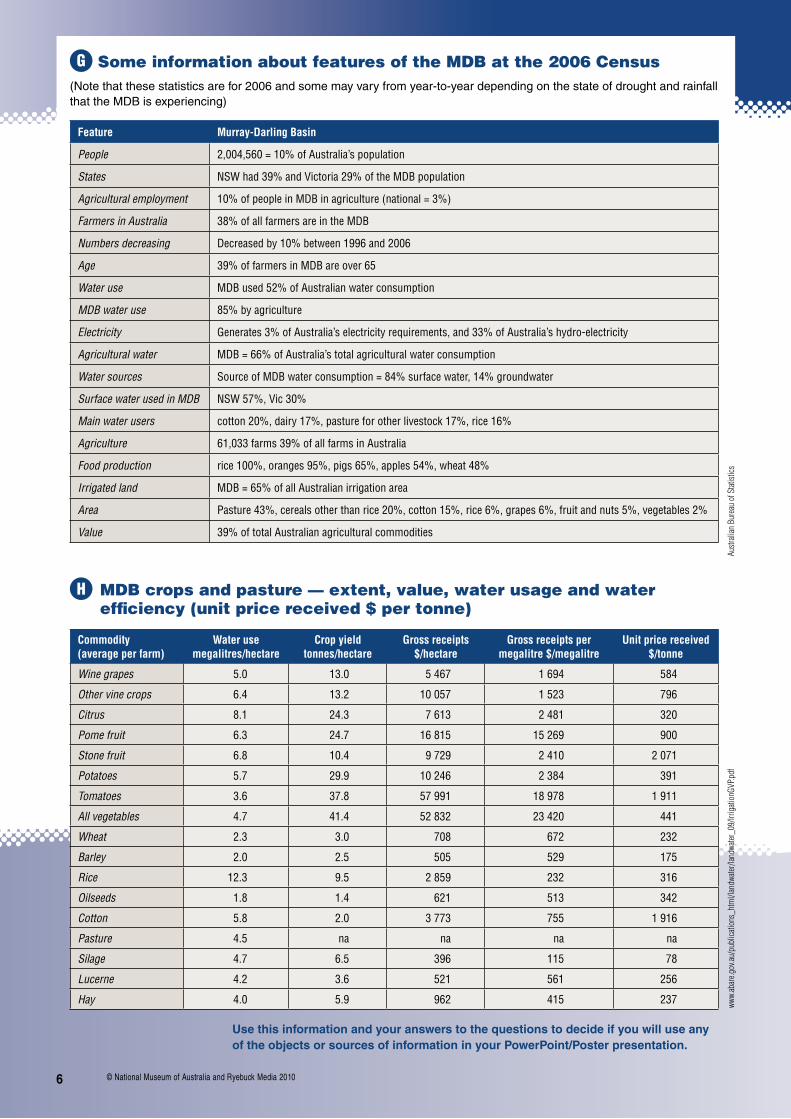
E How salinity management programs lower salinity levels
5© National Museum of Australia and Ryebuck Media 2010
G Some information about features of the MDB at the 2006 Census (Note that these statistics are for 2006 and some may vary from year-to-year depending on the state of drought and rainfall that the MDB is experiencing)
Feature Murray-Darling Basin
People 2,004,560 = 10% of Australia’s population
States NSW had 39% and Victoria 29% of the MDB population
Agricultural employment 10% of people in MDB in agriculture (national = 3%)
Farmers in Australia 38% of all farmers are in the MDB
Numbers decreasing Decreased by 10% between 1996 and 2006
Age 39% of farmers in MDB are over 65
Water use MDB used 52% of Australian water consumption
MDB water use 85% by agriculture
Electricity Generates 3% of Australia’s electricity requirements, and 33% of Australia’s hydro-electricity
Agricultural water MDB = 66% of Australia’s total agricultural water consumption
Water sources Source of MDB water consumption = 84% surface water, 14% groundwater
Surface water used in MDB NSW 57%, Vic 30%
Main water users cotton 20%, dairy 17%, pasture for other livestock 17%, rice 16%
Agriculture 61,033 farms 39% of all farms in Australia
Food production rice 100%, oranges 95%, pigs 65%, apples 54%, wheat 48%
Irrigated land MDB = 65% of all Australian irrigation area
Area Pasture 43%, cereals other than rice 20%, cotton 15%, rice 6%, grapes 6%, fruit and nuts 5%, vegetables 2%
Value 39% of total Australian agricultural commodities
H MDB crops and pasture — extent, value, water usage and water efficiency (unit price received $ per tonne)
Commodity (average per farm)
Water use megalitres/hectare
Crop yield tonnes/hectare
Gross receipts $/hectare
Gross receipts per megalitre $/megalitre
Unit price received $/tonne
Wine grapes 5.0 13.0 5 467 1 694 584
Other vine crops 6.4 13.2 10 057 1 523 796
Citrus 8.1 24.3 7 613 2 481 320
Pome fruit 6.3 24.7 16 815 15 269 900
Stone fruit 6.8 10.4 9 729 2 410 2 071
Potatoes 5.7 29.9 10 246 2 384 391
Tomatoes 3.6 37.8 57 991 18 978 1 911
All vegetables 4.7 41.4 52 832 23 420 441
Wheat 2.3 3.0 708 672 232
Barley 2.0 2.5 505 529 175
Rice 12.3 9.5 2 859 232 316
Oilseeds 1.8 1.4 621 513 342
Cotton 5.8 2.0 3 773 755 1 916
Pasture 4.5 na na na na
Silage 4.7 6.5 396 115 78
Lucerne 4.2 3.6 521 561 256
Hay 4.0 5.9 962 415 237
Austr
alian
Bur
eau
of S
tatist
icsww
w.ab
are.g
ov.au
/pub
licati
ons_
htm
l/lan
dwate
r/lan
dwate
r_09
/Irrig
ation
GVP.p
df
Use this information and your answers to the questions to decide if you will use any of the objects or sources of information in your PowerPoint/Poster presentation.
6 © National Museum of Australia and Ryebuck Media 2010
Today’s Murray-Darling Basin has been formed over millions of years.
65–32 million years ago • AustraliawasseparatedfromAntarcticaandbegantomoveslowlynorthwards.Thesouth-easternhighlands of Australia lifted and caused the Murray Basin to subside and take shape.
• Riversbegantoform.
• Theclimateatthistimewaswetter,morehumidandlessseasonalandtheBasinwascoveredwithevergreen rainforests, lakes and wetlands.
32–12 million years ago • SealevelsroseandthewesternhalfoftheMurrayBasinwascoveredinsea.Atitsmaximumextent, about 20 million years ago, it reached beyond the present site of Swan Hill.
• Astheeasternhighlandseroded,largeriversdepositedsedimentsintheMurrayBasin,formingtheriver plains of today.
• Shallowmarinelimestonewasdepositedbytheseaandlaiddownbeneathtoday’sMalleeRegionofSouthAustraliaandwesternVictoria.ThislimestoneformstheMurrayGroupAquiferSystem.
• Theseathenretreatedabout12millionyearsagoduetoagradualupliftofthelandcombinedwitharecedingworldsealevel.TheMurrayBasinwasthenexposedandbecamesubjecttoerosion,leaving large quantities of salt behind.
6–2 million years ago • Around6millionyearsagothewesternpartoftheMurrayBasinwasagaininvadedbya shallow sea. Vast sheets of sand were deposited and formed one of the aquifers beneath the Murray Basin today.
• Afterseveraladvancesandretreatsthesearetreatedtothesouth-westbetweentwoandfourmillion years ago.
2 million–500,000 years ago • Agiantfreshwaterlake,LakeBungunnia,formedabouttwomillionyearsagowhenthelowerMurraywasdammedbyanearthuplift.Thelakecoveredsome33,000squarekilometres.
• Thenaturaldambreachedaround700,000yearsagoandthelakeemptied.
• Theclimatealsobecamedrier.
The last 500,000 years • Inthelast500,000yearstheclimatehasremainedrelativelydry,withfourorfivedrytowetoscillations occurring which produced the dunes, lakes and river channels that are present today.
TheMurrayBasinareacanbedescribedasashallowflat-lyingsaucer(500kmacrossandabout600metresdeepinthecentre),madeofrockover350millionyearsold,andalmostfilledwithmaterialthathasbeendepositedoverthelast65millionyears.Thisinfluencesthewaytherivers flowtoday.ThedepositsofsandandfineclayhavemadetheMurrayBasinrelativelyflat.Itisonly200 metres above sea level.
www.savethemurray.com/history/geologicalhistory
The Murray-Darling Basin before human occupation
Read the information below about the history of the Murray-Darling Basin before human occupation. In particular consider (and answer) the following questions:
How was the Murray-Darling Basin formed?
What was it like before human occupation?
Use this information and your answers to the questions to decide if you will use any of the objects or sources of information in your PowerPoint/Poster presentation.
7© National Museum of Australia and Ryebuck Media 2010
The first Australians and the Murray-Darling Basin before European settlement
The first humans to occupy the Murray-Darling Basin region were Aboriginal people. This section explores their use and impact on the region. Try to answer the following questions as you read the information below. Some of the information is from the exhibition (text in boxes) and some is additional information (not in boxes).
How did Aboriginal people use the Murray-Darling environment and resources prior to European settlement?
Did they change the environment?
What attitudes and values did they have towards it?
What aspects of their lives did it affect?
Archaeological and oral history studies reveal that Aboriginal camps were overwhelmingly situated near rivers and other waterbodies.Consequently,thereisconsiderableIndigenousheritagefoundaroundwaterways.Thatheritageisnotjustintangibleformslikehearths,toolsandshellmiddens.Itexistsalso in Aboriginal names for these places – in this instance, the MurrumbidgeeRiver,NSW.
RiverswereofmajorimportancetoAboriginalpeople.Riversoffered water and food and were interwoven with spiritual life and belief. Canoes were fashioned from bark, and spears, fishinglinesandnetsmadefromothermaterials.‘Canoetrees’,showing scars from where bark was removed, are found today.
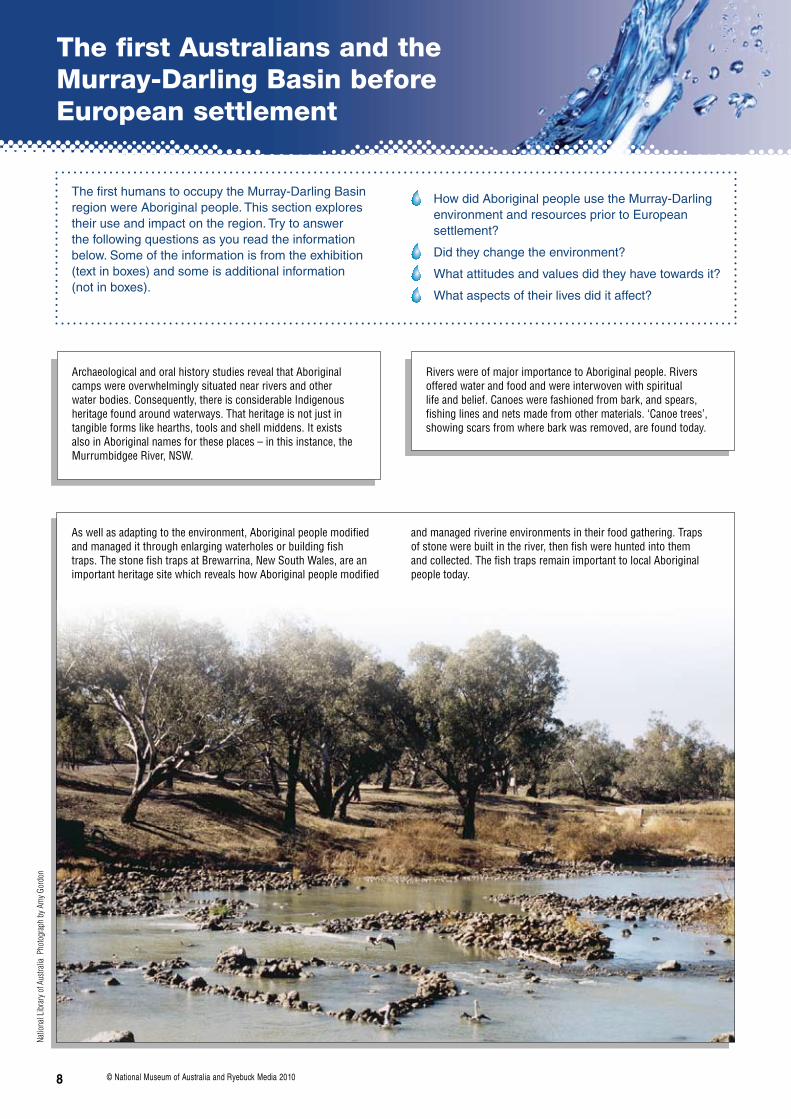
Aswellasadaptingtotheenvironment,Aboriginalpeoplemodifiedandmanageditthroughenlargingwaterholesorbuildingfishtraps.ThestonefishtrapsatBrewarrina,NewSouthWales,areanimportantheritagesitewhichrevealshowAboriginalpeoplemodified
andmanagedriverineenvironmentsintheirfoodgathering.Trapsofstonewerebuiltintheriver,thenfishwerehuntedintothemandcollected.ThefishtrapsremainimportanttolocalAboriginalpeople today.
Natio
nal L
ibra
ry o
f Aus
tralia
Pho
togr
aph
by A
my G
ordo
n
8 © National Museum of Australia and Ryebuck Media 2010
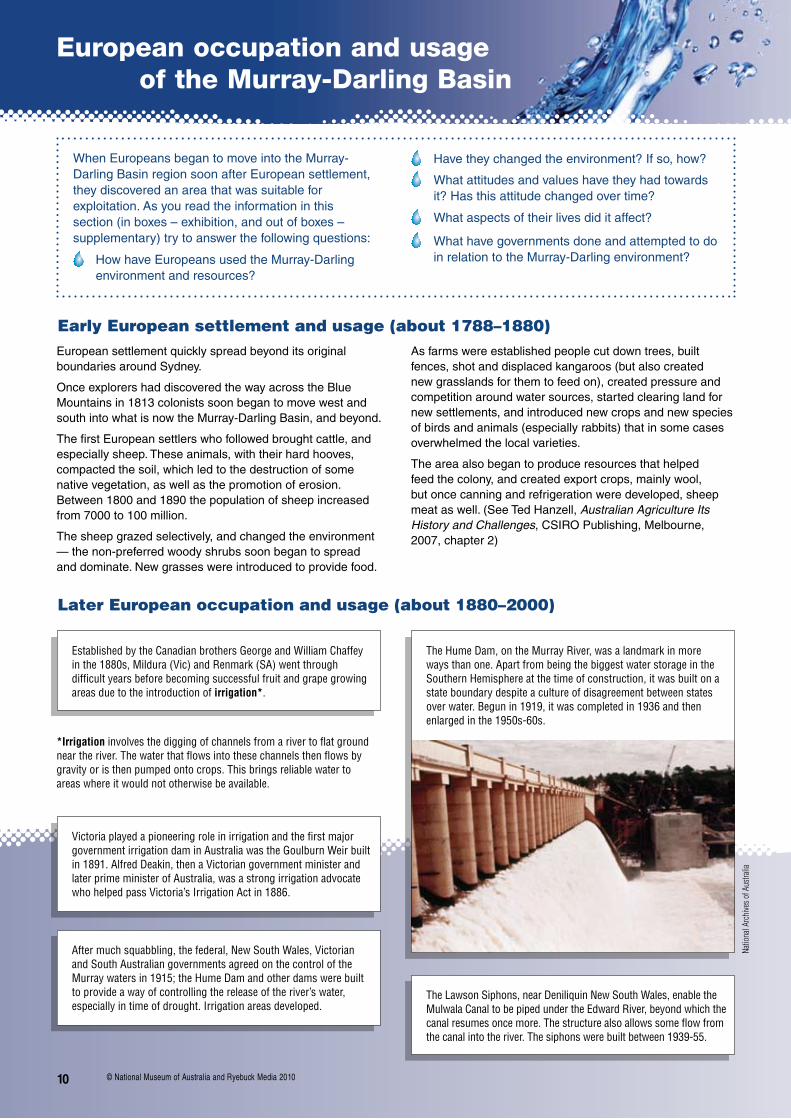
Aboriginalpeoplegroundthefineedgesontheirstoneaxesatplaces close to their riverside camps and where a supply of water helpedtolubricatetheprocess.Theresultinggroovesinthebedrock remain today as evidence of yet another use of water by thefirstAustralians.ThisgrindingsiteisatastreamnearCataractDam, New South Wales.
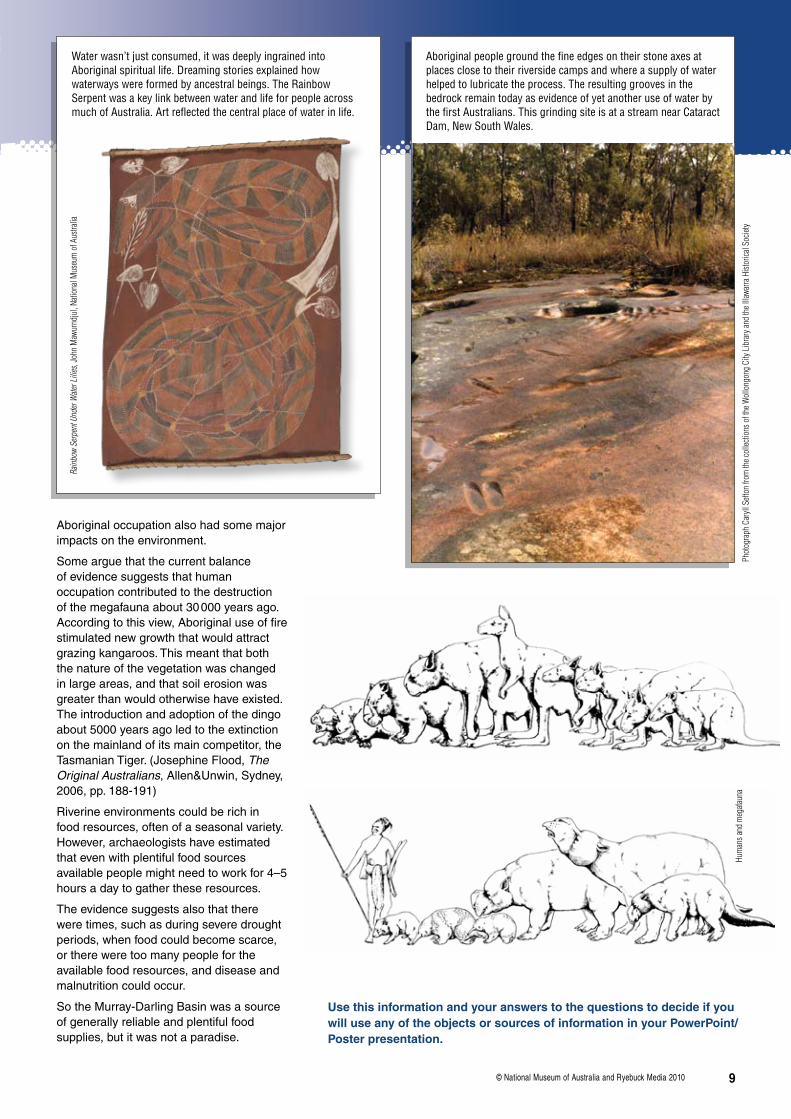
Water wasn’t just consumed, it was deeply ingrained into Aboriginal spiritual life. Dreaming stories explained how waterwayswereformedbyancestralbeings.TheRainbowSerpent was a key link between water and life for people across muchofAustralia.Artreflectedthecentralplaceofwaterinlife.
Phot
ogra
ph C
aryll
Seft
on fr
om th
e col
lectio
ns o
f the
Wol
long
ong
City
Libr
ary a
nd th
e Illa
warra
Hist
orica
l Soc
iety
Use this information and your answers to the questions to decide if you will use any of the objects or sources of information in your PowerPoint/Poster presentation.
Aboriginal occupation also had some major impacts on the environment.
Some argue that the current balance of evidence suggests that human occupation contributed to the destruction of the megafauna about 30 000 years ago. According to this view, Aboriginal use of fire stimulated new growth that would attract grazing kangaroos. This meant that both the nature of the vegetation was changed in large areas, and that soil erosion was greater than would otherwise have existed. The introduction and adoption of the dingo about 5000 years ago led to the extinction on the mainland of its main competitor, the Tasmanian Tiger. (Josephine Flood, The Original Australians, Allen&Unwin, Sydney, 2006, pp. 188-191)
Riverine environments could be rich in food resources, often of a seasonal variety. However, archaeologists have estimated that even with plentiful food sources available people might need to work for 4–5 hours a day to gather these resources.
The evidence suggests also that there were times, such as during severe drought periods, when food could become scarce, or there were too many people for the available food resources, and disease and malnutrition could occur.
So the Murray-Darling Basin was a source of generally reliable and plentiful food supplies, but it was not a paradise.
Hum
ans a
nd m
egafa
una
Rain
bow
Serp
ent U
nder
Wate
r Lili
es, J
ohn
Maw
urnd
jul,
Natio
nal M
useu
m o
f Aus
tralia
9© National Museum of Australia and Ryebuck Media 2010
European occupation and usage of the Murray-Darling Basin
Early European settlement and usage (about 1788–1880)
Later European occupation and usage (about 1880–2000)
When Europeans began to move into the Murray-Darling Basin region soon after European settlement, they discovered an area that was suitable for exploitation. As you read the information in this section (in boxes – exhibition, and out of boxes – supplementary) try to answer the following questions:
How have Europeans used the Murray-Darling environment and resources?
Have they changed the environment? If so, how?
What attitudes and values have they had towards it? Has this attitude changed over time?
What aspects of their lives did it affect?
What have governments done and attempted to do in relation to the Murray-Darling environment?
European settlement quickly spread beyond its original boundaries around Sydney.
Once explorers had discovered the way across the Blue Mountains in 1813 colonists soon began to move west and south into what is now the Murray-Darling Basin, and beyond.
The first European settlers who followed brought cattle, and especially sheep. These animals, with their hard hooves, compacted the soil, which led to the destruction of some native vegetation, as well as the promotion of erosion. Between 1800 and 1890 the population of sheep increased from 7000 to 100 million.
The sheep grazed selectively, and changed the environment — the non-preferred woody shrubs soon began to spread and dominate. New grasses were introduced to provide food.
As farms were established people cut down trees, built fences, shot and displaced kangaroos (but also created new grasslands for them to feed on), created pressure and competition around water sources, started clearing land for new settlements, and introduced new crops and new species of birds and animals (especially rabbits) that in some cases overwhelmed the local varieties.
The area also began to produce resources that helped feed the colony, and created export crops, mainly wool, but once canning and refrigeration were developed, sheep meat as well. (See Ted Hanzell, Australian Agriculture Its History and Challenges, CSIRO Publishing, Melbourne, 2007, chapter 2)
Established by the Canadian brothers George and William Chaffey inthe1880s,Mildura(Vic)andRenmark(SA)wentthroughdifficultyearsbeforebecomingsuccessfulfruitandgrapegrowingareas due to the introduction of irrigation*.
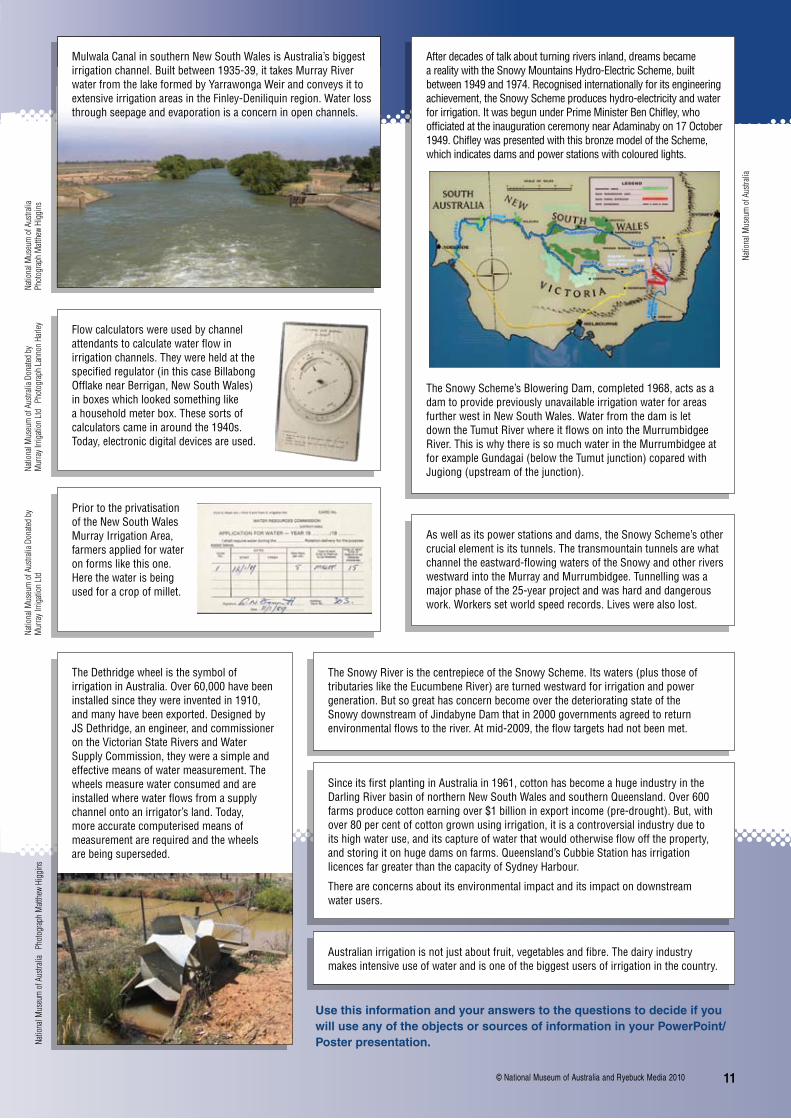
TheHumeDam,ontheMurrayRiver,wasalandmarkinmoreways than one. Apart from being the biggest water storage in the Southern Hemisphere at the time of construction, it was built on a state boundary despite a culture of disagreement between states over water. Begun in 1919, it was completed in 1936 and then enlarged in the 1950s-60s.
*Irrigationinvolvesthediggingofchannelsfromarivertoflatgroundneartheriver.Thewaterthatflowsintothesechannelsthenflowsbygravityoristhenpumpedontocrops.Thisbringsreliablewatertoareas where it would not otherwise be available.
Victoriaplayedapioneeringroleinirrigationandthefirstmajorgovernment irrigation dam in Australia was the Goulburn Weir built in 1891. Alfred Deakin, then a Victorian government minister and later prime minister of Australia, was a strong irrigation advocate whohelpedpassVictoria’sIrrigationActin1886.
After much squabbling, the federal, New South Wales, Victorian and South Australian governments agreed on the control of the Murray waters in 1915; the Hume Dam and other dams were built to provide a way of controlling the release of the river’s water, especiallyintimeofdrought.Irrigationareasdeveloped.
TheLawsonSiphons,nearDeniliquinNewSouthWales,enabletheMulwalaCanaltobepipedundertheEdwardRiver,beyondwhichthecanalresumesoncemore.Thestructurealsoallowssomeflowfromthecanalintotheriver.Thesiphonswerebuiltbetween1939-55.
Natio
nal A
rchi
ves o
f Aus
tralia
10 © National Museum of Australia and Ryebuck Media 2010
After decades of talk about turning rivers inland, dreams became a reality with the Snowy Mountains Hydro-Electric Scheme, built between1949and1974.Recognisedinternationallyforitsengineeringachievement, the Snowy Scheme produces hydro-electricity and water forirrigation.ItwasbegununderPrimeMinisterBenChifley,whoofficiatedattheinaugurationceremonynearAdaminabyon17October1949.ChifleywaspresentedwiththisbronzemodeloftheScheme,which indicates dams and power stations with coloured lights.
As well as its power stations and dams, the Snowy Scheme’s other crucialelementisitstunnels.Thetransmountaintunnelsarewhatchanneltheeastward-flowingwatersoftheSnowyandotherriverswestwardintotheMurrayandMurrumbidgee.Tunnellingwasamajor phase of the 25-year project and was hard and dangerous work.Workerssetworldspeedrecords.Liveswerealsolost.
TheSnowyRiveristhecentrepieceoftheSnowyScheme.Itswaters(plusthoseoftributariesliketheEucumbeneRiver)areturnedwestwardforirrigationandpowergeneration. But so great has concern become over the deteriorating state of the Snowy downstream of Jindabyne Dam that in 2000 governments agreed to return environmentalflowstotheriver.Atmid-2009,theflowtargetshadnotbeenmet.
SinceitsfirstplantinginAustraliain1961,cottonhasbecomeahugeindustryintheDarlingRiverbasinofnorthernNewSouthWalesandsouthernQueensland.Over600farms produce cotton earning over $1 billion in export income (pre-drought). But, with over 80 per cent of cotton grown using irrigation, it is a controversial industry due to itshighwateruse,anditscaptureofwaterthatwouldotherwiseflowofftheproperty,andstoringitonhugedamsonfarms.Queensland’sCubbieStationhasirrigationlicences far greater than the capacity of Sydney Harbour.
Thereareconcernsaboutitsenvironmentalimpactanditsimpactondownstreamwater users.
TheSnowyScheme’sBloweringDam,completed1968,actsasadam to provide previously unavailable irrigation water for areas further west in New South Wales. Water from the dam is let downtheTumutRiverwhereitflowsonintotheMurrumbidgeeRiver.ThisiswhythereissomuchwaterintheMurrumbidgeeatforexampleGundagai(belowtheTumutjunction)coparedwithJugiong (upstream of the junction).
Flow calculators were used by channel attendantstocalculatewaterflowinirrigationchannels.Theywereheldatthespecifiedregulator(inthiscaseBillabongOfflakenearBerrigan,NewSouthWales)in boxes which looked something like ahouseholdmeterbox.Thesesortsofcalculators came in around the 1940s. Today,electronicdigitaldevicesareused.
Prior to the privatisation of the New South Wales MurrayIrrigationArea,farmers applied for water on forms like this one. Here the water is being used for a crop of millet.
TheDethridgewheelisthesymbolofirrigationinAustralia.Over60,000havebeeninstalled since they were invented in 1910, and many have been exported. Designed by JS Dethridge, an engineer, and commissioner ontheVictorianStateRiversandWaterSupply Commission, they were a simple and effectivemeansofwatermeasurement.Thewheels measure water consumed and are installedwherewaterflowsfromasupplychannelontoanirrigator’sland.Today,more accurate computerised means of measurement are required and the wheels are being superseded.
Natio
nal M
useu
m o
f Aus
tralia
Ph
otog
raph
Matt
hew
Higg
ins
Natio
nal M
useu
m o
f Aus
tralia
Natio
nal M
useu
m o
f Aus
tralia
Ph
otog
raph
Matt
hew
Higg
ins
Natio
nal M
useu
m o
f Aus
tralia
Don
ated
by
Mur
ray I
rriga
tion
Ltd
Pho
togr
aph
Lann
on H
arley
Natio
nal M
useu
m o
f Aus
tralia
Don
ated
by
Mur
ray I
rriga
tion
Ltd
Australianirrigationisnotjustaboutfruit,vegetablesandfibre.Thedairyindustrymakes intensive use of water and is one of the biggest users of irrigation in the country.
Use this information and your answers to the questions to decide if you will use any of the objects or sources of information in your PowerPoint/Poster presentation.
Mulwala Canal in southern New South Wales is Australia’s biggest irrigationchannel.Builtbetween1935-39,ittakesMurrayRiverwater from the lake formed by Yarrawonga Weir and conveys it to extensive irrigation areas in the Finley-Deniliquin region. Water loss through seepage and evaporation is a concern in open channels.
11© National Museum of Australia and Ryebuck Media 2010
Today’s occupation and usage of the Murray-Darling Basin
At the time of Federation in 1901 the various colonies could not agree on how to regulate the main rivers that flowed through several colonies. After much haggling they agreed on a system of sharing the water.
In the last 100 years, life in the Murray–Darling Basin has been transformed by the construction of major water storages on the rivers. The total volume of publicly managed water storage capacity in the Basin is just under 35,000 gigalitres. Of that, the Murray–Darling Basin Authority — with major storages at the Dartmouth Dam, Hume Dam, Lake Victoria, Torrumbarry Weir, the Menindee Lakes and other river regulatory structures — is responsible for about a third.
Solving competing interests and issues in the Murray-Darling Basin region is one of Australia’s most pressing challenges today. In this section try to answer the following questions as you interrogate both exhibition (in boxes) and supplementary (out of boxes) information.
What are the main benefits that the Murray-Darling Basin has for all Australians?
What problems are there with it?
What solutions are available?
What will its place be in the future?
Is it able to be used sustainably?
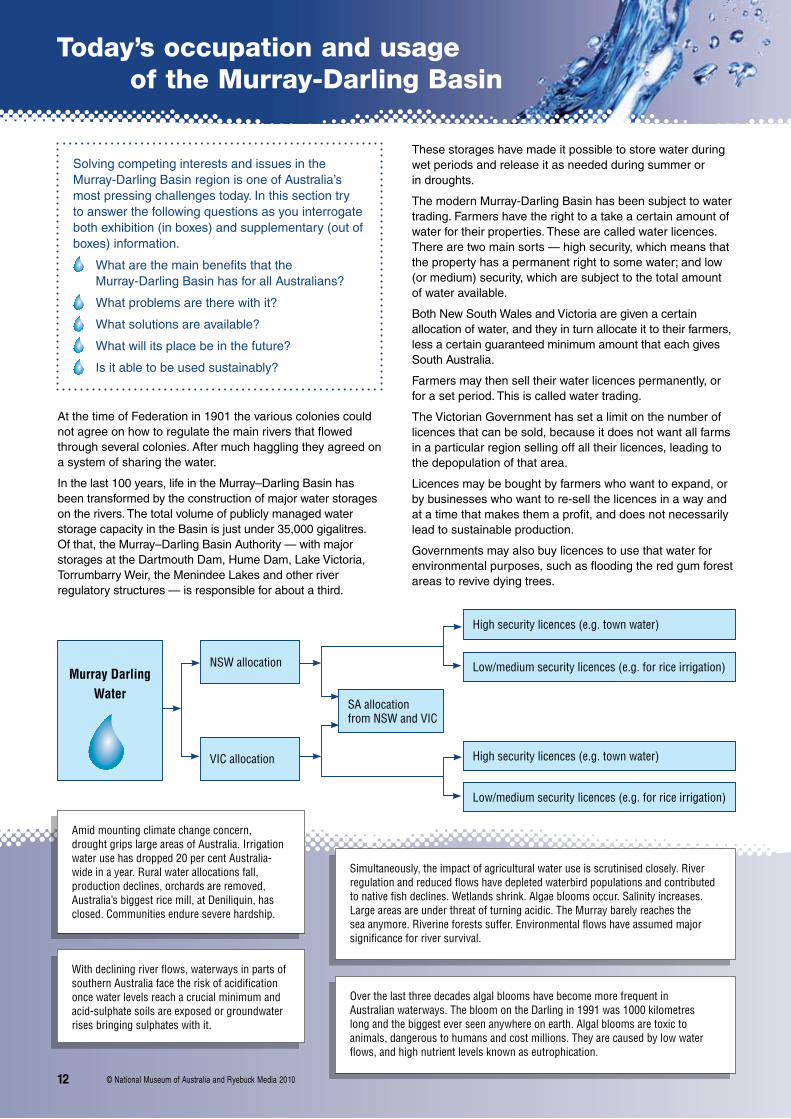
Murray DarlingWater
NSW allocation
VICallocation
SA allocation fromNSWandVIC
High security licences (e.g. town water)
High security licences (e.g. town water)
Low/mediumsecuritylicences(e.g.forriceirrigation)
Low/mediumsecuritylicences(e.g.forriceirrigation)
These storages have made it possible to store water during wet periods and release it as needed during summer or in droughts.
The modern Murray-Darling Basin has been subject to water trading. Farmers have the right to a take a certain amount of water for their properties. These are called water licences. There are two main sorts — high security, which means that the property has a permanent right to some water; and low (or medium) security, which are subject to the total amount of water available.
Both New South Wales and Victoria are given a certain allocation of water, and they in turn allocate it to their farmers, less a certain guaranteed minimum amount that each gives South Australia.
Farmers may then sell their water licences permanently, or for a set period. This is called water trading.
The Victorian Government has set a limit on the number of licences that can be sold, because it does not want all farms in a particular region selling off all their licences, leading to the depopulation of that area.
Licences may be bought by farmers who want to expand, or by businesses who want to re-sell the licences in a way and at a time that makes them a profit, and does not necessarily lead to sustainable production.
Governments may also buy licences to use that water for environmental purposes, such as flooding the red gum forest areas to revive dying trees.
Amid mounting climate change concern, droughtgripslargeareasofAustralia.Irrigationwater use has dropped 20 per cent Australia-wideinayear.Ruralwaterallocationsfall,production declines, orchards are removed, Australia’s biggest rice mill, at Deniliquin, has closed. Communities endure severe hardship.
Simultaneously,theimpactofagriculturalwateruseisscrutinisedclosely.Riverregulationandreducedflowshavedepletedwaterbirdpopulationsandcontributedtonativefishdeclines.Wetlandsshrink.Algaebloomsoccur.Salinityincreases.Largeareasareunderthreatofturningacidic.TheMurraybarelyreachestheseaanymore.Riverineforestssuffer.Environmentalflowshaveassumedmajorsignificanceforriversurvival.
OverthelastthreedecadesalgalbloomshavebecomemorefrequentinAustralianwaterways.ThebloomontheDarlingin1991was1000kilometreslong and the biggest ever seen anywhere on earth. Algal blooms are toxic to animals,dangeroustohumansandcostmillions.Theyarecausedbylowwaterflows,andhighnutrientlevelsknownaseutrophication.
Withdecliningriverflows,waterwaysinpartsofsouthernAustraliafacetheriskofacidificationonce water levels reach a crucial minimum and acid-sulphate soils are exposed or groundwater rises bringing sulphates with it.
12 © National Museum of Australia and Ryebuck Media 2010
Use this information and your answers to the questions to decide if you will use any of the objects or sources of information in your PowerPoint/Poster presentation.
Since their illegal introduction in the 1960s, carp have colonised waterwaysthroughoutAustralia.Insomelakesandstreamstheycomprise90percentofthefishbiomass.Theirpresencehasmadeitthatmuchharderfornativefish,fortheymuddythewater,worsenalgalblooms,destroyzooplanktonandreducefood and space. Various controls are being investigated.
Drought and over-extraction of water for agriculture have had asignificanteffectonwetlands.TheMacquarieMarshesinNewSouthWaleshavehalvedinsizeduetoreducedflowandillegal water abstraction. Waterbird populations have declined accordingly.TheMacquarieRiver’ssalinitylevelisexpectedtorise over threefold by 2100.
TheMurrayCodisAustralia’sbiggestinlandfish,growingtoover100kgs.Formerlywidespread,itisnowthreatened.Likeothernativefish,ithassufferedfromoverfishing,habitatdegradationandtheimpactofriverregulation.NativefishintheMurrayDarlingBasinarenow1percentoftheirpre-Europeannumbers.Regulationbydamsandweirshasremovedthefloodswhichtriggeredspawning,changedseasonalhighflowsfromwinter-springtosummer-autumn,madewatercolder,deprivedfishoffoodandnurseryareasinfloodplains,andcreatedbarrierstomigration.
Hopeforthefutureofnativefishliesinimprovingriverhealth,returningenvironmentalflows,buildingfishwaysupweirs,returningpreviouslyremoved snags as cover for fish,researchintofishbiology,and captive breeding. At the New South Wales government’s Narrandera Fisheries Centre, keyresearchintonativefishbiology enables more effective management, and breeding for re-stocking of impoundments assists a number of species.
RiverredgumisabeautifulAustraliantreefoundformuchoftheMurray’slength.Themostfamousandworld’slargeststandistheBarmah-MillewaForest.ButRiverredgumisatrisk.Wherewaterlevelshaverisenduetodamsandweirs,permanentlyinundatedtreeshavedrowned.Ontheotherhand,asriverregulationhasreducedthefloodsthatpreviouslyrejuvenatedtheforests,manygumsaredying.Logging,cattle-grazingandpublicaccessare other issues which add to the red gum controversy.
Riversaremorethanjustresources.Theyareplacesofbeautyandbiological diversity.
Salinity costs Australian agriculture millions and degradeslandandwaterways.Ithastwomaincauses:clearing of deep-rooted native vegetation allowing water tables to rise, and over-irrigation, both bringing salty water to the surface.
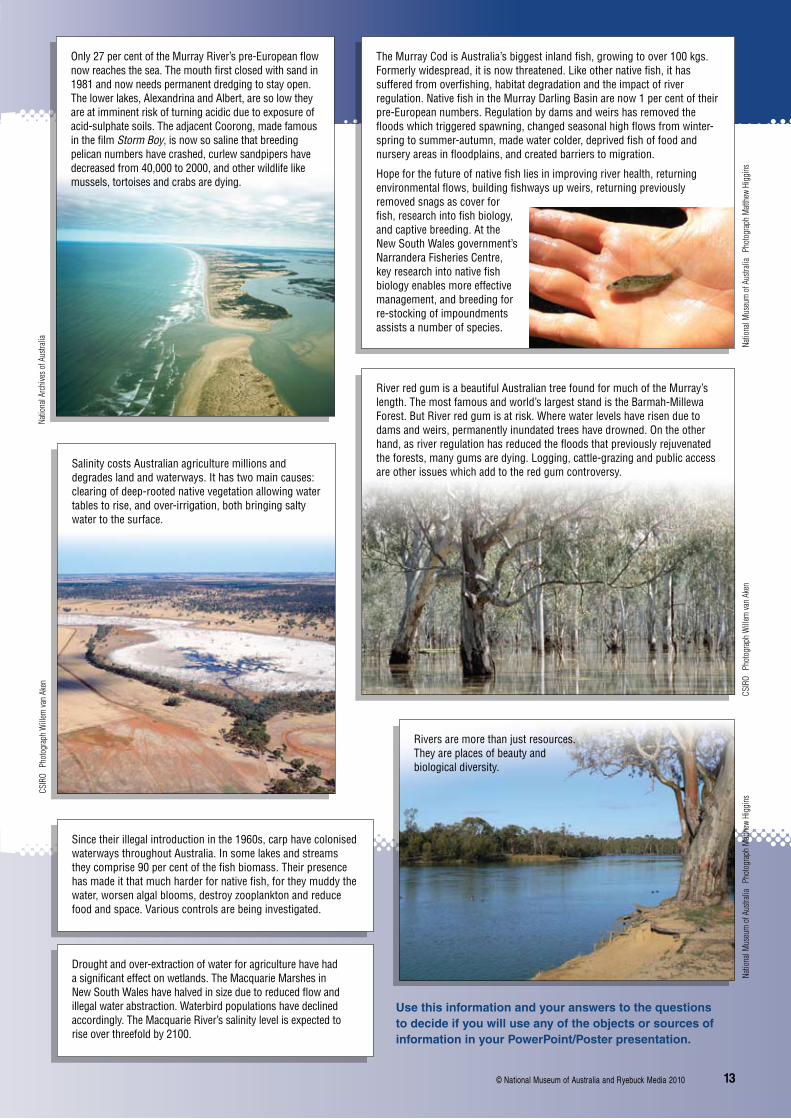
Only27percentoftheMurrayRiver’spre-Europeanflownowreachesthesea.Themouthfirstclosedwithsandin1981 and now needs permanent dredging to stay open. Thelowerlakes,AlexandrinaandAlbert,aresolowtheyare at imminent risk of turning acidic due to exposure of acid-sulphatesoils.TheadjacentCoorong,madefamousinthefilmStorm Boy, is now so saline that breeding pelican numbers have crashed, curlew sandpipers have decreased from 40,000 to 2000, and other wildlife like mussels, tortoises and crabs are dying.
Natio
nal A
rchi
ves o
f Aus
tralia Natio
nal M
useu
m o
f Aus
tralia
Ph
otog
raph
Matt
hew
Higg
ins
Natio
nal M
useu
m o
f Aus
tralia
Ph
otog
raph
Matt
hew
Higg
insCS
IRO
Pho
togr
aph
Will
em va
n Ak
en
CSIR
O P
hoto
grap
h W
illem
van
Aken
13© National Museum of Australia and Ryebuck Media 2010
Reflecting on some water questions
Today the regular supply of water is pre-occupying Australians in both urban and rural communities on an unprecedented scale. The true value of water in a dry and variable continent is finally being realised. Is it soon enough? What might the future be for people, agriculture and nature in the Murray-Darling Basin if present trends continue?
Here are some questions for you to consider in the light of what you have now learned about water and the Murray-Darling Basin. You might like to include these in a survey of members of your own family or some of your friends.
Creating your digital reportYou are now ready to tackle the last task, to prepare your digital report on what museum objects help us understand about water and the Murray-Darling Basin.
You may use the nine images on the first page of this unit, including the captions you created, or you may use more or less. The key thing is to create informative and interesting captions to go with the Museum images, and to organise them so that they present the story of water and the Murray-Darling Basin, and your opinions on it.
You may choose to use some other images (such as maps, or photographs you may have of the area, or other images from this unit of work) as part of your report, but the bulk of the report should use the museum objects from Australia’s water story in the Water: H2O=Life exhibition of the National Museum of Australia.
How long will you shower for tomorrow? Does it matter?
Do you have water-saving devices at home, like a dual-flush toilet, low-flow shower rose, or rainwater tank? If not, will you have them installed?
Do you abide by your local water restrictions?
Should food and all relevant consumer goods carry ‘water efficiency’ labelling reflecting water used in their production?
Urban water is still cheap — in 2007 between 90 cents and $1.50 per 1000 litres, depending on where you are in Australia. Should it be more expensive?
Irrigation water was $0.13 for 1000 litres as an average in early 2009. Should irrigation water be more expensive?
If irrigation water becomes more expensive, food will be more expensive. Are you prepared to pay more for food?
Does it matter if we import more food?
Should agriculture move to the better-watered north of Australia?
If agriculture has to continue cutting back on water use, what happens to those made unemployed?
Much agricultural water goes into export industries. Should Australia’s water be exported via these products?
Would you drink recycled water?
Are desalination or recycling plants the way to go in the future?
Would water issues cause you to change your vote at local, state/territory or federal elections?
Is climate change an issue that might influence the way you are likely to vote in elections?
At current rates of water usage by Australians, how long do you think our natural environment will survive?
Australians live in the driest inhabited continent but are one of the highest per capita users of water in the world. Is this sustainable?
If you do not live in the Murray-Darling Basin does it matter to you what happens there?
More informationMurray-Darling Basin Authority www.mdba.gov.au/
Department of the Environment, Water, Heritage and the Arts www.environment.gov.au/water/
Discover Murray www.murrayriver.com.au/education/
New Perspectives VCE Geography 1–4 Textbook and New Perspectives VCE Geography 1–4 Supplement, Geography Teachers’ Association of Victoria www.gtav.asn.au
The Water Challenge — Investigating water sustainability through innovation multi-media resource, Ryebuck Media www.ryebuck.com.au
The choices we make now as a society determine the sort of [Murray-Darling] Basin we will have in the future.Professor Peter Cullen (1943-2008)
14 © National Museum of Australia and Ryebuck Media 2010
Austr
alian
Gov
ernm
ent,
Depa
rtmen
t of E
nviro
nmen
t, W
ater,
Herit
age a
nd th
e Arts
Go to page 3
to explore this unit