Embed Size (px)
Citation preview

MURDOCH RESEARCH REPOSITORY
This is the author’s final version of the work, as accepted for publication following peer review but without the publisher’s layout or pagination.
The definitive version is available at http://dx.doi.org/10.1016/j.talanta.2009.11.049
May, P.M., Rowland, D., Königsberger, E. and Hefter, G. (2010) JESS, a Joint Expert Speciation System - IV: A large database of aqueous solution physicochemical properties with an automatic
means of achieving thermodynamic consistency. Talanta, 81 (1-2). pp. 142-148.
http://researchrepository.murdoch.edu.au/1579/
Copyright: © 2009 Elsevier B.V.
It is posted here for your personal use. No further distribution is permitted.

Accepted Manuscript
Title: Jess, a joint expert speciation system - iv†A largedatabase of aqueous solution physicochemical properties withan automatic means of achieving thermodynamic consistency
Authors: Peter M. May, Darren Rowland, Erich Konigsberger,Glenn Hefter
PII: S0039-9140(09)00898-4DOI: doi:10.1016/j.talanta.2009.11.049Reference: TAL 10937
To appear in: Talanta
Received date: 25-9-2009Revised date: 19-11-2009Accepted date: 20-11-2009
Please cite this article as: P.M. May, D. Rowland, E. Konigsberger, G. Hefter, Jess, ajoint expert speciation system - iv†A large database of aqueous solution physicochemicalproperties with an automatic means of achieving thermodynamic consistency, Talanta(2008), doi:10.1016/j.talanta.2009.11.049
This is a PDF file of an unedited manuscript that has been accepted for publication.As a service to our customers we are providing this early version of the manuscript.The manuscript will undergo copyediting, typesetting, and review of the resulting proofbefore it is published in its final form. Please note that during the production processerrors may be discovered which could affect the content, and all legal disclaimers thatapply to the journal pertain.

Page 1 of 20
Accep
ted
Man
uscr
ipt
Submitted to Talanta 1
2
3
JESS, A JOINT EXPERT SPECIATION SYSTEM - IV† 4
A LARGE DATABASE OF AQUEOUS SOLUTION PHYSICOCHEMICAL 5
PROPERTIES WITH AN AUTOMATIC MEANS OF ACHIEVING 6
THERMODYNAMIC CONSISTENCY 7
8
9
10
Peter M. May*, Darren Rowland, Erich Königsberger and Glenn Hefter 11
School of Chemical and Mathematical Sciences, Murdoch University, 12
Murdoch WA 6150, Australia 13 14 15 16 † Part III is reference [1]. 17 * Corresponding author. Tel: +61 8 9360 2203, Fax: +61 8 9360 6452. 18 E-mail address: [email protected] 19 20 21 22 Abstract 23 24 The JESS software package, which is a widely used tool for modelling chemical 25 speciation in complex aqueous environments, has been extended to allow 26 comprehensive predictions of physicochemical properties for strong electrolytes in 27 aqueous solution. Another large database, this time of physicochemical property 28 data, has been added to the JESS suite, along with the computational methods 29 which automatically turn these diverse literature data into a thermodynamically 30 consistent calculation for water activities, densities, heat capacities, etc. Given the 31 recent emphasis on the role of water activity in predicting electrolyte mixing 32 behaviour, we expect that this capability will lead to major changes in the way aquatic 33 chemistry is modelled in future. 34
35
36
37
Keywords: aquatic chemistry, chemical species, physicochemical properties, water 38 activity, heat capacities, densities 39
40
*Revised Manuscript

Page 2 of 20
Accep
ted
Man
uscr
ipt
2
Introduction 41 42 In the context of aqueous solutions, the term 'chemical speciation' means 43 characterisation of the identity and abundance of every physicochemically-distinct 44 entity present at the molecular level. Calculations of chemical speciation are 45 therefore important both to validate analytical probes and to represent the results of 46 analytical measurements. 47 48 It has recently become clear to us that such chemical speciation calculations, 49 especially those dealing with concentrated electrolyte solutions, must utilise the 50 thermodynamic water activities of the solutions more than has been the case hitherto 51 [2]. This and the following paper [3] describe two developments which now permit the 52 water activities, and other thermodynamic properties, to be calculated for a wide 53 array of electrolytes and their mixtures over broad ranges of concentration, 54 temperature and pressure. 55 56 In the final stages of characterising thermodynamic systems, great effort must always 57 be put into a coherent representation which describes and predicts the physical and 58 chemical properties of interest. Ideally, a single algebraic summary (i.e. a 59 mathematical model) is needed to embody all the relevant experimental information 60 and any necessary selections and critical assessments of the data. Mathematically 61 speaking, this means carefully weighting the reported experimental results, 62 establishing a particular basis set, elaborating the corresponding functions and 63 properly determining the numerical values of every associated parameter. 64 65 However, production of a large-scale, thermodynamically-consistent framework of 66 property parameters requires substantial resources. Thus, this work is traditionally 67 undertaken by dedicated experts, often collaborating in teams, to produce 68 comprehensive and authoritative tabulations. In this way, reliable reference data are 69 published by organisations such as the U.S. National Bureau of Standards / National 70 Institute of Standards and Technology [http://srdata.nist.gov/solubility/], the OECD 71 Nuclear Energy Agency [4-6] and IUPAC (through some of its major collective 72 projects [7-10]). The results of such labour-intensive reviews often underpin 73 impressive secondary sources [11]. 74 75 Unsurprisingly, such major thermodynamic projects are seriously limited by the 76 resources they require. This problem is exacerbated because the outcome tends to 77 build up progressively from a foundation which fixes the results of each successive 78 layer of work and which, once in place, cannot usually be adjusted without starting 79 again. The enormity of the general challenge is well illustrated by the prodigious 80 efforts of Krumgalz and co-workers just to characterize the volumetric behaviour of 81 single-solute aqueous electrolyte solutions [12,13]. As a further specific example, 82 consider what happens to published thermodynamic datasets with constants for 83 aqueous solutions having a standard state based on infinite dilution when, say, the 84 properties of water are re-evaluated, changing the Debye-Hückel constant as a 85 function of temperature. In other words, in developing thermodynamically-consistent 86 descriptions of chemical systems, good additional experimental measurements 87 arriving after the event cannot easily be incorporated. This can even render the entire 88 preceding effort obsolete if the experimental ranges of conditions are significantly 89 extended or if the measurement differences are sufficiently large. Other issues are 90

Page 3 of 20
Accep
ted
Man
uscr
ipt
3
that it is difficult to correct any errors made early on in the evaluation process and 91 that with increasing complexity, all these problems escalate, making characterisation 92 of multicomponent systems especially troublesome. 93 94 For these reasons, achieving thermodynamic consistency by automatic means is a 95 growing imperative. However, this is much easier said than done - the task requires a 96 myriad of decisions, judgements, and comparisons as well as numerical finessing, 97 scientific knowledge, chemical insight and technical skill [14]. Thus, for the 98 foreseeable future, it seems likely that considerable human expertise will still be 99 needed (see 'Concluding Remarks'). 100 101 Grappling with this challenge, nevertheless, has driven the development of our JESS 102 (for Joint Expert Speciation System) software package [15]. JESS is a widely-used 103 tool for modelling chemical speciation in complex aqueous environments 104 [http://jess.murdoch.edu.au], with the largest integrated database of thermodynamic 105 parameters for chemical reactions [16] and an expert system capability for 106 automatically achieving thermodynamic consistency [14]. A philosophy has been 107 evolved and implemented based on the desire to model chemical speciation in 108 aqueous solutions generally and comprehensively. This is necessary to deal with 109 large multicomponent systems such as occur with blood plasma [17], seawater [18] 110 and hydrometallurgical liquors [19, 20]. A key principle is to assemble as much of the 111 relevant information as possible into substantial databases, including expertly-112 assessed scores and other criteria for decision making, and thereafter to perform 113 automatically all the operations leading to a thermodynamically-consistent model. 114 This allows new data to be added, errors to be corrected and judgements to be 115 changed without much ado. 116 117
The developments described in this paper concern the comprehensive prediction of 118 physicochemical properties for strong electrolytes in aqueous solution. Measured 119 data, as much and as varied as possible, together with the harmonising power of 120 thermodynamics, are used to achieve the objective. Our approach is again founded 121 on a large and growing database - this time of physicochemical property data - along 122 with the computational methods that automatically turn diverse literature sources into 123 a thermodynamically-consistent calculation for water activities, densities, heat 124 capacities, etc. Given recent emphasis on the role of water activity in predicting 125 electrolyte mixing behaviour [2], we expect that having water activities available for 126 as many electrolyte solutions over as wide a range of conditions as possible, will lead 127 to major improvements in the way aquatic chemistry is modelled in future. 128 129 130 131 The Physicochemical Property Database 132 133 The JESS physicochemical property database (FIZ) stores quantities for measured 134 thermodynamic properties of bulk aqueous solutions under well-defined conditions of 135 composition, temperature and pressure. Most of the data concern simple electrolytes, 136 but non-electrolyte solutes such as dissolved gases and other neutral molecules are 137 also accepted. All recorded values are associated with so-called 'merit weights' 138 between 0 and 9 to reflect their assessed reliability. 139 140

Page 4 of 20
Accep
ted
Man
uscr
ipt
4
At present, the database contains values for over two dozen physicochemical 141 properties (Table 1). 142 143 The current symbols for electrolytes are given in Table 2. 144 145 Activity coefficients, osmotic coefficients, densities / molar volumes, apparent molar 146 relative enthalpies and solubilities are the most common of these properties. 147 Although there is a long way still to go, currently more than 175,000 property values 148 have been recorded, with the data spanning about 120 electrolytes. In line with the 149 JESS approach developed for reaction data [14,16], values from both primary and 150 secondary sources are included. (This strategy aims to make JESS models robust 151 and relatively more stable in response to adjustments of the data; all data are treated 152 simply as 'information content' of assessable worth, thus being capable of 153 contributing to knowledge of how each system behaves but allowing evolutionary 154 change to occur when necessary.) Rejected data are likewise also included in the 155 FIZ database but are assigned zero weight so that they have no effect on any 156 subsequent processing. (This minimises the waste of effort associated with bad data 157 which, when not recorded in databases of this kind, are prone to be repeatedly re-158 discovered, re-assessed and re-rejected.) 159 160 The system design allows for many more physicochemical properties than are 161 currently recognised, each having up to 1 million values for any given solute and 162 property (with NaCl expected to comprise the largest data sets). There can be up to 163 45 recognisable cations, 45 recognisable anions and 35 recognisable non-electrolyte 164 substances. There is a current design upper limit of 10,000,000 values per 165 physicochemical property. 166
167
168
169
Table 1: FIZ-recognised physicochemical propertiesa 170
171
Property Name Default
Unit
Other Units
Mean Activity Coefficient unitless
Trace Activity Coefficient unitless
Single Ion Activity Coefficient unitless
Mean Activity Coefficient Ratiob
unitless
Water Activity unitless
Boiling Point Elevationc
C K
Boiling Point C K
Apparent molar compressibility /GPa
Apparent Molar Heat Capacity, Cp
J/(K.mol) cal/(K.mol)
Volumetric Heat Capacity Quotientd
J/(K.cm3)e
Specific Heat Capacity
J/(K.g) J/(K.kg); cal. equivs.
Specific Heat
Apparent Molar Heat Capacity, Cv
J/(K.mol) cal/(K.mol)
Compressibility /GPa /Mbar
Absolute Density kg/m3 g/cm
3
Relative Density Difference kg/m3 g/cm
3

Page 5 of 20
Accep
ted
Man
uscr
ipt
5
Relative Density Quotient unitless
Specific Gravity
Apparent molar expansivity /kK
Expansivity /kK
Freezing Point Depressionc
C K
Freezing Point C K
Molar Excess Gibbs Energy kJ/mol kcal/mol; J/mol; cal/mol
Apparent Molar Relative Enthalpyf
kJ/mol kcal/mol; J/mol; cal/mol
Apparent Molar Enthalpy of Dilutiong
kJ/mol kcal/mol; J/mol; cal/mol
Integral Molar Enthalpy of Dilutionh
kJ/mol kcal/mol; J/mol; cal/mol
Apparent Molar Enthalpy of Mixing kJ/mol kcal/mol; J/mol; cal/mol
Apparent Molar Enthalpy of Solutiong
kJ/mol kcal/mol; J/mol; cal/mol
Molar Excess Enthalpy kJ/mol kcal/mol; J/mol; cal/mol
Isopiestic H2SO4 Concentration m
Isopiestic CaCl2 Concentration m
Isopiestic KCl Concentration m
Isopiestic NaCl Concentration m
Osmotic Coefficient unitless
Osmotic Pressure Pa MPa; KPa; torr; atm; bar
Partial Molar Solvent Heat Capacity J/(K.mol) cal/(K.mol)
Partial Molar Solute Heat Capacity J/(K.mol) cal/(K.mol)
Harned Cell Potential Differencei
V mV
Concentration Cell Potential Differencej
V mV
pe unitless
pH unitless
Partial Molar Solute Enthalpy kJ/mol kcal/mol; J/mol; cal/mol
Partial Molar Solvent Enthalpy kJ/mol kcal/mol; J/mol; cal/mol
Partial Molar Solute Entropy J/(K.mol) cal/(K.mol)
Partial Molar Solvent Entropy J/(K.mol) cal/(K.mol)
Partial Molar Solute Volume cm3/mol m
3/mol
Partial Molar Solvent Volume cm3/mol m3/mol
Solubility / Saturation Limitk
m M; g/L; %w/w; %w/v
Molar Excess Entropy J/(K.mol) cal/(K.mol)
Specific Volume cm3/g m
3/kg
Apparent Molar Volume
cm3/mol m
3/mol
Vapour Pressure Pa MPa; kPa; torr; atm; bar
Molar Excess Volume cm3/mol m
3/mol
172
a The FIZ interface distinguishes between three different kinds of physicochemical property. 173
There are (a) properties of the bulk solution such as the absolute density and the heat 174 capacity, (b) properties defined in terms of the solvent as the implicit component in question 175 such as the water activity and the osmotic coefficient and (c) properties defined in terms of a 176 solute in solution such as activity coefficients and solubilities. 177 b (P,T,c) / (1 atm., 25 C, c) 178
c as a difference w.r.t. to H2O 179
d as measured, for example, by flow calorimeters 180
e quotient is, of course, unitless but this gives the scale 181
f Apparent Molar Relative Enthalpy at given P,T (HA) = L = HP,T - H
0P,T is the preferred 182
property (rather than the Molar Enthalpy of the Solution, H, and the Molar Enthalpy of the 183 Solution at Infinite Dilution, H
0, themselves); L should only be computed using H and H
0 184
values from the same source to maintain internal consistency and limit error propagation 185 associated with the taking of differences between two similar values. L
= 0 at infinite dilution 186
for all temperatures, by definition. 187

Page 6 of 20
Accep
ted
Man
uscr
ipt
6
g initial and final solution concentrations given for single electrolyte solutions diluted with 188
water 189 h HID = H (mfinal) – H (minitial) [21] 190
i For the cell without LJP: Pt, H2(g, P bar) | HX(m1), MY(m2) | AgCl, Ag 191 j For the conc. gradient cell with transference: ref. electr. | MX(m1) | MX(m2) | ref. electr. 192 k Refers to saturated solutions of the subject component or of a recognised solid phase
193 194 195
196
Table 2: FIZ-recognised ionic components 197
198
Cation Anion
Aluminium(III), Al3+
Acetate
Ammonium, NH4+
Aluminate, Al(OH)4–
Barium(II), Ba2+
Arsenate, AsO43–
Beryllium(II), Be2+
Arsenite, AsO33–
Cadmium(II), Cd2+
Borate, B(OH)4–
Calcium(II), Ca2+
Bromate, BrO3–
Cerium(III), Ce3+
Bromide, Br–
Cesium, Cs+
Butyrate, Butanoate
Chromium(II), Cr2+
Carbonate, CO32–
Chromium(III), Cr3+
Chlorate, ClO3–
Cobalt(II), Co2+
Chloride, Cl–
Cobalt(III), Co3+
Chromate, CrO42–
Copper(II), Cu2+
Cyanide, CN–
Europium, Eu3+
Dichromate, Cr2O72–
Gadolinium, Gd3+
Dihydrogenphosphate, H2PO4–
Hydrogen ion, H+
Ferricyanide, Fe(III)(CN)63–
Iron(II), Fe2+
Ferrocyanide, Fe(II)(CN)64–
Iron(III), Fe3+
Fluoride, F–
Lanthanum(III), La3+
Formate
Lead(II), Pb2+
Hydrogencarbonate, HCO3–
Lithium, Li+
Hydrogenmalonate
Magnesium(II), Mg2+
Hydrogensuccinate
Manganese(II), Mn2+
Hydrogensulfate, HSO4–
Mercury(II), Hg2+
Hydroxide, OH–
Neodymium, Nd3+
8-Hydroxyquinolate, Oxinate
Nickel(II), Ni2+
Iodate, IO3–
Potassium, K+
Iodide, I–
Praseodymium(III), Pr3+
Malonate
Rubidium, Rb+
Molybdate, MoO42–
Samarium, Sm3+
Monohydrogenphosphate, HPO42–
Scandium(III), Sc3+
Nitrate, NO3–
Silver(I), Ag+ Nitrite, NO2
–
Sodium, Na+
Oxalate
Strontium(II), Sr2+
Perchlorate, ClO4–
Tetra-n-butylammonium, Bu4N+
Permanganate, MnO4–
Tetraethylammonium, Et4N+
Phosphate, PO43–
Tetramethylammonium, Me4N+
Phthalate
Tetra-n-propylammonium, Pr4N+
Propionate, Propanoate
Thallium(I), Tl+ Pyrophosphate, P2O7
4–
Uranyl, UO22+
Silicate, SiH2O42-

Page 7 of 20
Accep
ted
Man
uscr
ipt
7
Yttrium(III), Y+ Succinate
Zinc(II), Zn2+
Sulfate, SO42–
Thiocyanate, SCN–
Thiosulfate, S2O32–
Triflate, CF3SO3–
199 200 201 The FIZ database is constructed in two phases: (a) the assembly and input of 202 critically-assessed literature data for the various properties into computer sequential 203 files formatted for readability and (b) the conversion of these data into computer 204 direct access files for rapid retrieval, display and processing. A systematic layout for 205 the data in sequential files has been designed to deal with binary (one solute in 206 water) and ternary (two solutes in water) solutions. Much routine analytical expertise 207 has also had to be encoded, particularly regarding the interconversion of 208 measurement units and thermodynamic quantities. This is critical to process data 209 which are deliberately stored (and displayed) in a way that matches the literature 210 source as closely as possible rather than in the converted, unified form ultimately 211 needed for mathematical regression. 212 213 Various subtle problems must be overcome at this early FIZ stage. For example, 214 there is a need for recursion when, say, a function for solution density is in the 215 process of being determined but the data have been measured in concentration units 216 which must be converted using the solution density itself. Similarly, the water 217 activities of certain electrolytes used for reference purposes in isopiestic studies, 218 need to be available to process many isopiestic data. It suffices to say that with the 219 power of computers now available, almost all such issues have been, or can 220 progressively be, resolved. 221 222 223 224 The Specific Interaction Parameter Database 225 226 The JESS specific interaction parameter database (SIP) is a generalised facility for 227 storing the coefficients of, and evaluating, specific-interaction functions such as are 228 used in the Bronsted-Scatchard-Guggenheim specific interaction theory (SIT) [22,23] 229 and Pitzer [23,24] models for electrolyte solution thermodynamics. These coefficients 230 can be taken directly from the literature with few limitations or they can be evaluated 231 from the FIZ data as described below. 232 233 The significance of the SIP database is that it provides a convenient mechanism for 234 managing the large number of Pitzer and SIT parameters necessary to describe the 235 many electrolyte solution properties that have been experimentally characterised. It is 236 critical to keep track of the parameter sets determined by optimization and to be able 237 to locate and apply them efficiently when needed for property calculations. 238 239 To this end, the SIP database associates each set of parameters with a label for the 240 so-called 'equation variant', i.e. a name given to indicate the source of the parameter 241 set. 242

Page 8 of 20
Accep
ted
Man
uscr
ipt
8
243 244 245 Development of the JESS optimiser for physicochemical data 246 247 JESS optimisation of the physicochemical data for binary electrolyte solutions 248 characterises physicochemical properties using the Pitzer formalism. The Pitzer 249 equations are general, effective and widely used for describing thermodynamic data, 250 especially in highly concentrated solutions [23]. A particular advantage of the Pitzer 251 equations, over the Hückel equations [25-27] for example, is that the former are 252 parametrically linear, and hence are suited to standard numerical procedures for 253 solving linear least-squares problems. 254 255 Every optimisation begins with the extraction from the FIZ database of a data set that 256 matches specified property and condition limits. To find the Pitzer parameter values, 257 the equations are then cast in a form suitable for Singular Value Decomposition 258 (SVD) [28]. SVD allows best-fitting parameters to be found even when the fitting 259 matrix is ill-conditioned, which can be a significant issue with Pitzer equations [29]. 260 Particular care must be taken not to overfit any data set since this leads to a 261 decrease in predictive power. 262 263 The selection of functions allowed by the optimiser has been limited as a guide to 264 achieving general, reproducible and consistent results. The following set of functions 265 has been chosen as adequately representative of models in the literature [30,31] 266 which have analytic derivatives. The form of the general expansion for the excess 267 Gibbs energy, activity coefficient or osmotic coefficient is given by 268 269
270
where is one of the Pitzer parameters , , or , and are the optimised 271
coefficients, with each parameter then expanded as a function of temperature and 272 pressure. and are the reference pressure and temperature respectively. TU and 273 TL are temperatures close to the upper and lower critical values for water. From this 274 form, the parameter expansions are readily manipulated to obtain equations for 275 volumetric and thermometric properties. Up to 95 fitting parameters are thus 276 available for SVD optimisation. Recommended selections of parameter sets, which 277 depend on the range of conditions spanned by the data, are generated automatically 278 but can be overridden by user-specified parameter sets if so desired. 279 280 The properties that have so far been included in the optimisation process are activity 281 and osmotic coefficients, relative apparent molar enthalpy, apparent molar heat 282 capacity and apparent molar volume. As discussed in reference [24], these 283 properties are the most directly applicable for identifying the Pitzer parameters and 284
Page 9 of 20
Accep
ted
Man
uscr
ipt
9
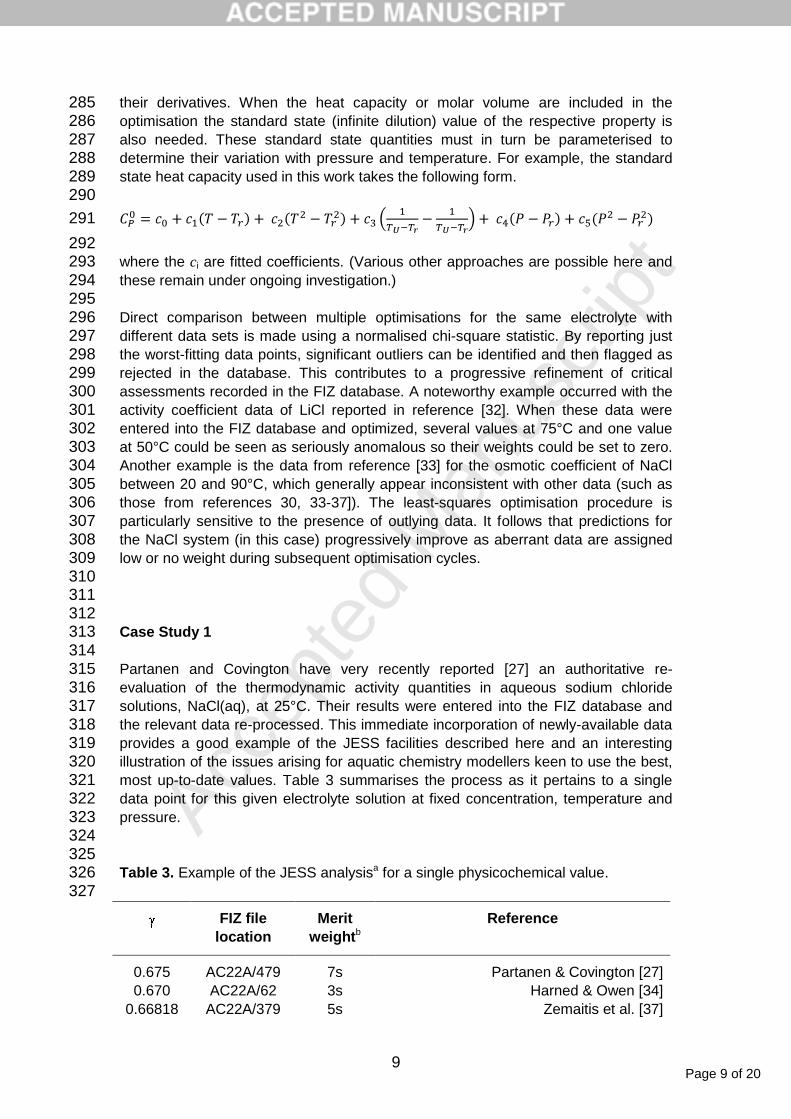
their derivatives. When the heat capacity or molar volume are included in the 285 optimisation the standard state (infinite dilution) value of the respective property is 286 also needed. These standard state quantities must in turn be parameterised to 287 determine their variation with pressure and temperature. For example, the standard 288 state heat capacity used in this work takes the following form. 289 290
291
292 where the ci are fitted coefficients. (Various other approaches are possible here and 293 these remain under ongoing investigation.) 294 295 Direct comparison between multiple optimisations for the same electrolyte with 296 different data sets is made using a normalised chi-square statistic. By reporting just 297 the worst-fitting data points, significant outliers can be identified and then flagged as 298 rejected in the database. This contributes to a progressive refinement of critical 299 assessments recorded in the FIZ database. A noteworthy example occurred with the 300 activity coefficient data of LiCl reported in reference [32]. When these data were 301 entered into the FIZ database and optimized, several values at 75°C and one value 302 at 50°C could be seen as seriously anomalous so their weights could be set to zero. 303 Another example is the data from reference [33] for the osmotic coefficient of NaCl 304 between 20 and 90°C, which generally appear inconsistent with other data (such as 305 those from references 30, 33-37]). The least-squares optimisation procedure is 306 particularly sensitive to the presence of outlying data. It follows that predictions for 307 the NaCl system (in this case) progressively improve as aberrant data are assigned 308 low or no weight during subsequent optimisation cycles. 309 310 311 312 Case Study 1 313 314 Partanen and Covington have very recently reported [27] an authoritative re-315 evaluation of the thermodynamic activity quantities in aqueous sodium chloride 316 solutions, NaCl(aq), at 25°C. Their results were entered into the FIZ database and 317 the relevant data re-processed. This immediate incorporation of newly-available data 318 provides a good example of the JESS facilities described here and an interesting 319 illustration of the issues arising for aquatic chemistry modellers keen to use the best, 320 most up-to-date values. Table 3 summarises the process as it pertains to a single 321 data point for this given electrolyte solution at fixed concentration, temperature and 322 pressure. 323 324 325 Table 3. Example of the JESS analysisa for a single physicochemical value. 326 327
FIZ file
location
Merit
weightb
Reference
0.675 AC22A/479 7s Partanen & Covington [27]
0.670 AC22A/62 3s Harned & Owen [34]
0.66818 AC22A/379 5s Zemaitis et al. [37]

Page 10 of 20
Accep
ted
Man
uscr
ipt
10
0.668 AC22A/137 3s Robinson & Stokes [35]
0.669 AC22B/17 6s Pitzer et al. [30]
0.67079 AC22C/94 7s Archer [38]
0.668 AC22A/207 5s Hamer & Wu [39]
328 a FIZ data shown are for NaCl(aq) solution (2.0000 m, 25°C, 1 bar). For optimization, a total of 329
480 activity and osmotic coefficients were obtained from the FIZ database (0.001-6.144 m, 330 25°C, 1 bar). The Pitzer equation coefficients determined with the Bradley-Pitzer formula for 331 the Debye-Hückel parameter [40] were
0 = 0.07833,
1 = 0.2683 and C = 0.0008629, 332
yielding an activity coefficient = 0.6713. The worst-fitting point in the optimization occurred at 333 1.4 m with = 0.662 from the extended Hückel equation of [27] compared to the value 334 calculated from the JESS-fitted Pitzer equation, this being = 0.6576. 335 b Merit weights indicate both a score between 0 and 9 for assessed reliability (see text) and 336
either ‘p’ or ‘s’ for primary or secondary data respectively. 337 338 Given that NaCl(aq) under ambient conditions is surely characterised 339 thermodynamically best of all electrolyte solutions, the differences evident in the third 340 significant figure, whilst small, cannot be regarded as negligible. However, it seems 341 to us that the precise value which might be critically selected out of this range of 342 results, all from highly reputable sources, would be a matter of opinion more than of 343 good judgement. This opinion depends in part on the view one takes about the 344 respective advantages of the Hückel and the Pitzer equations. Whichever of these 345 equations is preferred, however, we are comfortable with today's JESS-determined 346
outcome of = 0.6713. Should future measurements support the higher value just 347 proposed by Partanen and Covington, the merit weights of the earlier data sets will 348 be progressively reduced and hence the JESS-determined value will gradually 349 increase; alternatively, if not, the JESS process will have avoided an excursion over 350 time, away from and then back towards the cluster of older values. 351 352 Similar issues arise when the electrolyte data sets are not as well characterised as 353 NaCl(aq) so that the consequences of changes over time become harder to 354 understand. For instance, some significant differences occur even with the activity 355 coefficients of KCl(aq) at 25°C and 1 bar for which there are excellent primary data. 356 The discrepancy is most notable at 1.8 m where Partanen & Covington [27] 357
recommend = 0.584 compared with Hamer & Wu [39] who give = 0.576. 358 359 The magnitude of such problems is typically greater still with electrolytes other than 360 NaCl(aq) and KCl(aq). This is important since there is then the potential to alter 361 thermodynamic modelling outcomes, often substantially. 362 363 364 365 Case Study 2 366 367 The JESS optimiser for physicochemical data was used to generate a model from 368 702 thermodynamic data points for aqueous solutions of potassium chloride, KCl(aq), 369 in the range 0-100 °C, 0-6.56 m and 1 bar. The optimised data included activity and 370 osmotic coefficients, apparent relative molar enthalpies and apparent molar heat 371 capacities. Figure 1 shows the deviations of osmotic coefficients obtained from the 372 automatically produced model. The available data and the fit achieved by the Pitzer 373

Page 11 of 20
Accep
ted
Man
uscr
ipt
11
functions are very satisfactory in this case. Most of the osmotic coefficient data are 374 reproduced to within ±0.002, with only a few outliers outside ±0.004. Figure 2 shows 375 the deviations achieved for the heat capacity data. As would be expected from the 376 experimental uncertainty, the largest deviations occur with data approaching infinite 377 dilution but the remainder are mostly within ±7 J/(K.mol). 378 379 . 380 381 382 383 The noticeable disagreement between measured values at low concentration and the 384 Pitzer model in this case study is symptomatic of the difficulty in representing the 385 extreme temperature dependence of the infinite dilution standard state. Accurately 386 modelling the apparent molar heat capacity at infinite dilution, in particular, has been 387 discussed by Archer [38, 41] who has used a finite reference molality, a sensible 388 feature which we have yet to implement. 389 390 391 392 Case Study 3 393 394 Figure 3 shows the deviations of experimental data from the physicochemical 395 optimiser model for aqueous calcium chloride, CaCl2(aq). The range of data 396 extracted from the database was chosen as 25-100 °C, 0-6 m and 1 bar, yielding a 397 total of 523 osmotic and activity coefficient points. The osmotic coefficient data are 398 seen to cycle about the Pitzer model at all temperatures. 399 400 401 402 403 404 These large cyclic systematic deviations have been observed previously: in their 405 study of this system, Rard and Clegg [57] improved the agreement with the 406 experimental results at 25°C by modelling the CaCl+ species present in solution 407 along with calcium and chloride ions. The coupling of thermodynamic models for 408 strong electrolyte solutions with those which exhibit significant chemical speciation as 409 represented in the JESS speciation database will be the subject of our future 410 investigation and development. 411 412 413 414 Concluding Remarks 415 416 The aim of this work is to represent the targeted physicochemical properties in a 417 thermodynamically-consistent way as accurately as possible from the information 418 currently available in the literature. Whilst the automatic process outlined here 419 approaches this problem in much the same way as happens when (human) experts 420 review, assemble and assess primary experimental measurements to develop the 421 highest quality reference data, the two processes have different objectives and 422 should not be confused. Our automated process strives to achieve a thermodynamic 423
Figures 1 and 2 near here
Figure 3 near here

Page 12 of 20
Accep
ted
Man
uscr
ipt
12
simulation capability which can be used with confidence over a given range of 424 conditions to obtain a fair representation of chemical system behaviour as it has so 425 far been described. In addition to the primary data, JESS thus depends heavily on 426 critical compilations by the relevant experts. JESS cannot perform their job and it 427 does not try to do so. 428 429 The software described in this paper has a different role. Its mission, in addition to 430 recording and using the best available reference data, is to facilitate the making of 431 general, rapidly-developed, easy-to-use, up-to-date and reliable models for aqueous 432 chemical systems. This means: 433 434
accommodating the inter-dependence of many 'primary' experimental 435 results as published, which is pervasive but difficult to untangle; 436
dampening the chaotic variations which occur when one widely-used, 437 critically-determined thermodynamic parameter set is superseded by 438 another; and 439
enabling modellers quickly to inspect the relevant data in the literature 440 whenever this is needed to judge the robustness of their results, including 441 most crucially rapid comparisons with the latest available corresponding 442 reference values. 443
444 445 Our experience makes clear one thing above all - even the most authoritative 446 reference data set is ephemeral [58]. It is wrong to think that modellers only need 447 today's best evaluation of any given thermodynamic system. This is not only 448 because critical reviews can never be perfect but also because they are always fixed 449 in time and they are always limited in their scope. Aside from instrument calibration 450 purposes, which is a very specialised use, thermodynamic models generally have a 451 wide reach, which raises issues of coping with enormous amounts of diverse data, of 452 consistency between chemical system parameters over time and of extrapolations 453 beyond the range of measured conditions (especially extrapolations into 454 multicomponent space). It is to address these issues that thermodynamically 455 consistent models are constructed automatically by JESS programs. 456 457 The JESS suite of databases and executable programs and databases is made 458 available for academic (non-commercial) purposes at nominal cost. See 459 http:\\jess.murdoch.edu.au for details. 460 461 462 463 References 464 465 [1] P.M. May, K. Murray, JESS, A Joint Expert Speciation System - III. Surrogate 466 Functions. Talanta, 40 (1993) 819. 467 468 [2] P.M. May, Improved Thermodynamic Calculations for Concentrated Mixed 469 Electrolyte Systems Including Ion Pairing (or the Absence of It). Marine Chem., 99 470 (2006) 62. 471 472

Page 13 of 20
Accep
ted
Man
uscr
ipt
13
[3] D. Rowland, P.M. May, JESS, A Joint Expert Speciation System - V. 473 Approaching Thermodynamic Property Prediction for Multicomponent Concentrated 474 Aqueous Electrolyte Systems. Talanta, 80 (2009) xxxx (following paper). 475 476 [4] A. Olin, B. Nolang, L.-O. Ohman, E.G. Osadchii, E. Rosen, OECD Chemical 477 Thermodynamics Series, Volume 7, Chemical Thermodynamics of Selenium, 2005. 478 479 [5] P.L. Brown, E. Curti, B. Grambow, C. Ekberg, OECD Chemical 480 Thermodynamics Series, Volume 8, Chemical Thermodynamics of Zirconium, 481 Elsevier Science, 2005. 482 483 [6] W. Hummel, G. Anderegg, I. Puigdomenech, L. Rao, O. Tochiyama, OECD 484 Chemical Thermodynamics Series, Volume 9, Chemical Thermodynamics of 485 Compounds and Complexes of U, Np, Pu, Am, Tc, Se, Ni and Zr with Selected 486 Organic Ligands, Elsevier Science, 2005. 487 488 [7] R. Portanova, L.H.J. Lajunen, M. Tolazzi, J. Piispanen, Stability Constants for 489 alpha-Hydroxycarboxylic Acid Complexes with Protons and Metal Ions and the 490 Accompanying Enthalpy Changes - Part II: Aliphatic 2-Hydroxycarboxylic Acids. Pure 491 Appl. Chem., 75 (2003) 495. 492 493 [8] G. Anderegg, F. Arnaud-Neu, R. Delgado, J. Felcman, K. Popov, Critical 494 Evaluation of Stability Constants of Metal Complexes of Complexones for Biomedical 495 and Environmental Applications. Pure Appl. Chem., 77 (2005) 1445. 496 497 [9] K.J. Powell, P.L. Brown, R.H. Byrne, T. Gajda, G. Hefter, S. Sjoberg, H. 498 Wanner, Chemical Speciation of Environmentally Significant Heavy metals with 499 Inorganic Ligands. Part 1: The Hg2+-Cl–, OH–, CO3
2–, SO42–, and PO4
3– Aqueous 500 Systems. Pure Appl. Chem., 77 (2005) 739. 501 502 [10] K.J. Powell, P.L. Brown, R.H. Byrne, T. Gajda, G. Hefter, S. Sjoberg, H. 503 Wanner, Chemical Speciation of Environmentally Significant Metals with Inorganic 504 Ligands. Part 2. The Cu2+-OH–, Cl–, CO3
2–, SO42–, and PO4
3– Systems. Pure Appl. 505 Chem., 79 (2007) 895. 506 507 [11] I. Barin, G. Platzki, Thermochemical Data of Pure Substances, 3rd Edn., 508 Weinheim, Germany, 1995. 509 510 [12] B.S. Krumgalz, R. Pogorelsky, K.S. Pitzer, Volumetric Properties of Single 511 Aqueous Electrolytes from Zero to Saturation Concentration at 298.15 K 512 Represented by Pitzer's Ion-Interaction Equations. J. Phys. Chem. Ref. Data, 25 513 (1996) 663. 514 515 [13] B.S. Krumgalz, R. Pogorelsky, A. Sokolov, K.S. Pitzer, Volumetric Ion 516 Interaction Parameters for Single-Solute Aqueous Electrolyte Solutions at Various 517 Temperatures. J. Phys. Chem. Ref. Data, 29 (2000) 1123. 518 519 [14] P.M. May, K. Murray, Database of Chemical Reactions Designed to Achieve 520 Thermodynamic Consistency Automatically. J. Chem. Eng. Data, 46 (2001) 1035. 521 522 [15] P.M. May, K. Murray, JESS, A Joint Expert Speciation System - I. Raison 523 d'Etre. Talanta, 38 (1991) 1409. 524 525 [16] P.M. May, K. Murray, JESS, A Joint Expert Speciation System - II. The 526 Thermodynamic Database. Talanta, 38 (1991) 1419. 527
Page 14 of 20
Accep
ted
Man
uscr
ipt
14
528 [17] P.M. May, P.W. Linder, D.R. Williams, Computer Simulation of Metal-ion 529 Equilibria in Biofluids: Models for the Low-Molecular-Weight Complex Distribution of 530 Calcium(II), Magnesium(II), Manganese(II), Iron(III), Copper(II), Zinc(II), and Lead(II) 531 Ions in Human Blood Plasma. J. Chem. Soc., Dalton Trans., (1977) 588. 532 533 [18] A. Gianguzza, D. Milea, F.J. Millero, S. Sammartano, Hydrolysis and 534 Chemical Speciation of Dioxouranium(VI) Ion in Aqueous Media Simulating the Major 535 Ion Composition of Seawater. Marine Chem., 85 (2004) 103. 536 537 [19] E. Königsberger, G. Eriksson, P.M. May, G. Hefter, Comprehensive Model of 538 Synthetic Bayer Liquors. Part 1. Overview. Ind. Eng. Chem. Res., 44 (2005) 5805. 539 540 [20] E. Königsberger, P.M. May, B. Harris, Properties of Electrolyte Solutions 541 Relevant to High Concentration Chloride Leaching. I. Mixed Aqueous Solutions of 542 Hydrochloric Acid and Magnesium Chloride, Hydrometallurgy. 90 (2008) 177. 543 544 [21] J.-L. Fortier, P.-A. Leduc, J.E. Desnoyers, Thermodynamic Properties of 545 Alkali Halides. II. Enthalpies of Dilution and Heat Capacities in Water at 25°C. J. 546 Solution Chem., 3 (1974) 323. 547 548 [22] G. Biedermann, J. Bruno, D. Ferri, I. Grenthe, F. Salvatore, K. Spahiu, 549 Modelling of the Migration of Lanthanides and Actinides in Groundwater; the Medium 550 Dependence of Equilibrium Constants. Mater. Res. Soc. Symp. Proc., 11 (1982) 791. 551 552 [23] I. Grenthe, A.V. Plyasunov, K. Spahiu, Estimation of Medium Effects on 553 Thermodynamic Data, in I. Grenthe and I. Puigdomenech (Eds.), Modelling in 554 Aquatic Chemistry, Nuclear Energy Agency, OECD, Paris, France, 1997, pp. 325-555 426. 556 557 [24] K.S. Pitzer, Ion Interaction Approach: Theory and Data Correlation, in K.S. 558 Pitzer (Ed.), Activity Coefficients in Electrolyte Solutions, 2nd. Edn., CRC Press, 559 Boca Raton, Florida, USA, 1991, pp. 75-153. 560 561 [25] J.I. Partanen, A.K. Covington, Re-evaluation of the Activity Coefficients of 562 Aqueous Hydrochloric Acid Solutions up to a Molality of 2.0 using Two-parameter 563 Hueckel and Pitzer Equations. Part 1. Results at 25°C. J. Solution Chem., 31 (2002) 564 187. 565 566 [26] J.I. Partanen, A.K. Covington, Re-evaluation of the First and Second 567 Stoichiometric Dissociation Constants of Phthalic Acid at Temperatures from (0 to 568 60) °C in Aqueous Phthalate Buffer Solutions with or without Potassium Chloride. I. 569 Estimation of the Parameters for the Huckel Model Activity Coefficient Equations for 570 Calculation of the Second Dissociation Constant. J. Chem. Eng. Data, 51 (2006) 777. 571 572 [27] J.I. Partanen, A.K. Covington, Re-evaluation of the Thermodynamic Activity 573 Quantities in Aqueous Sodium and Potassium Chloride Solutions at 25°C. J. Chem. 574 Eng. Data, 54 (2009) 208. 575 576 [28] W.H. Press, S.A. Teukolsky, W.T. Vetterling, B.P. Flannery, Numerical 577 Recipes in FORTRAN, The Art of Scientific Computing, 2nd Edn., Cambridge Univ. 578 Press, Cambridge, U.K., 1992. 579 580

Page 15 of 20
Accep
ted
Man
uscr
ipt
15
[29] S.L. Marshall, P.M. May, G.T. Hefter, Least-Squares Analysis of Osmotic 581 Coefficient Data at 25°C According to Pitzer's Equation. 1. 1:1 Electrolytes. J. Chem. 582 Eng. Data, 40 (1995) 1041. 583 584 [30] K.S. Pitzer, J.C. Peiper, R.H. Busey, Thermodynamic Properties of Aqueous 585 Sodium Chloride Solutions. J. Phys. Chem. Ref. Data, 13 (1984) 1. 586 587 [31] E. Königsberger, Prediction of Electrolyte Solubilities from Minimal 588 Thermodynamic Information. Monatsh. Chem., 132 (2001) 1363. 589 590 [32] H.F. Gibbard Jr., G. Scatchard, Liquid-Vapor Equilibrium of Aqueous Lithium 591 Chloride, from 25 to 100°C and from 1.0 to 18.5 molal and Related Properties. J. 592 Chem. Eng. Data, 18 (1973) 293. 593 594 [33] N. Hubert, Y. Gabes, J.-B. Bourdet, L. Schuffenecker, Vapor Pressure 595 Measurements with a Nonisothermal Static Method between 293.15 and 363.15 K for 596 Electrolyte Solutions. Application to the H2O + NaCl System. J. Chem. Eng. Data, 40 597 (1995) 891. 598 599 [34] H.S. Harned, B.B. Owen, The Physical Chemistry of Electrolytic Solutions, 600 3rd Edn., American Chemical Society Monograph Series No: 137, Reinhold 601 Publishing Corp., N.Y., 1958. 602 603 [35] R.A. Robinson, R.H. Stokes, Electrolyte Solutions, 2nd Edn. Revised, 604 Butterworth and Co., London, 1970. 605 606 [36] F.J. Millero, Effects of Pressure and Temperature on Activity Coefficients, 607 Activity Coefficients in Electrolyte Solutions, Vol. II, 1979, pp. 63-151. 608 609 [37] J.F. Zemaitis Jr., D.M. Clark, M. Rafal, N.C. Scrivner, Handbook of Aqueous 610 Electrolyte Thermodynamics, Theory and Application, Am. Inst. Chem. Eng., New 611 York, U.S.A., 1986. 612 613 [38] D.G. Archer, Thermodynamic Properties of the NaCl + H2O System. II. 614 Thermodynamic Properties of NaCl(aq), NaCl.2H2O(cr), and Phase Equilibria. J. 615 Phys. Chem. Ref. Data, 21 (1992) 793. 616 617 [39] W.J. Hamer, Y.C. Wu, Osmotic Coefficients and Mean Ionic Activity 618 Coefficients of Univalent Electrolytes in Water at 25°C. J. Phys. Chem. Ref. Data, 1 619 (1972) 1047. 620 621 [40] D.J. Bradley, K.S. Pitzer, Thermodynamics of Electrolytes. 12. Dielectric 622 Properties of Water and Debye-Huckel Parameters to 350°C and 1 kbar. J. Phys. 623 Chem., 83 (1979) 1599. 624 625 [41] D.G. Archer, Thermodynamic Properties of the KCl + H2O System. J. Phys. 626 Chem. Ref. Data, 28 (1999) 1. 627 628 [42] J.I. Partanen, Recalculation of Activity and Osmotic Coefficients of Hydrohalic 629 Acids and Some Alkali Metal Halides in Dilute Aqueous Solutions at 298.15 K. Acta 630 Chem. Scand., 45 (1991) 993. 631 632 [43] T.M. Davis, L.M. Duckett, J.F. Owen, C.S. Patterson, R. Saleeby, Osmotic 633 Coefficients of Aqueous LiCl and KCl from Their Isopiestic Ratios to NaCl at 45°C. J. 634 Chem. Eng. Data, 30 (1985) 432. 635

Page 16 of 20
Accep
ted
Man
uscr
ipt
16
636 [44] J.T. Moore, W.T. Humphries, C.S. Patterson, Isopiestic Studies of Some 637 Aqueous Electrolyte Solutions at 80°C. J. Chem. Eng. Data, 17 (1972) 180. 638 639 [45] W.T. Humphries, C.F. Kohrt, C.S. Patterson, Osmotic Properties of Some 640 Aqueous Electrolytes at 60°C. J. Chem. Eng. Data, 13 (1968) 327. 641 642 [46] K.L. Hellams, C.S. Patterson, B.H. Prentice III, M.J. Taylor, Osmotic 643 Properties of Some Aqueous Solutions at 45°C. J. Chem. Eng. Data, 10 (1965) 323. 644 645 [47] J.E. Tanner, F.W. Lamb, Specific Heats of Aqueous Solutions of NaCl, NaBr, 646 KCl: Comparisons with Related Thermal Properties. J. Solution Chem., 7 (1978) 303. 647 648 [48] R.T. Pabalan, K.S. Pitzer, Apparent Molar Heat Capacity and Other 649 Thermodynamic Properties of Aqueous KCl Solutions to High Temperatures and 650 Pressures. J. Chem. Eng. Data, 33 (1988) 354. 651 652 [49] H. Ruterjans, F. Schreiner, U. Sage, Th. Ackermann, Apparent Molar Heat 653 Capacities of Aqueous Solutions of Alkali Halides and Alkylammonium Salts. J. Phys. 654 Chem., 73 (1969) 986. 655 656 [50] V.B. Parker, Thermal Properties of Aqueous Uni-univalent Electrolytes, U.S. 657 Department of Commerce, National Bureau of Standards Rep. NSRDS-NBS-2, 1965. 658 659 [51] L.M. Duckett, J.M. Hollifield, C.S. Patterson, Osmotic Coefficients of Aqueous 660 Calcium Chloride Solutions from 3 to 12 m at 50°C. J. Chem. Eng. Data, 31 (1986) 661 213. 662 663 [52] T.M. Davis, L.M. Duckett, C.E. Garvey, J.M. Hollifield, C.S. Patterson, 664 Osmotic Coefficients of Aqueous LiCl and CaCl2 from Their Isopiestic Ratios to NaCl 665 at 50°C. J. Chem. Eng. Data, 31 (1986) 54. 666 667 [53] J.A. Rard, F.H. Spedding, Isopiestic Determination of the Osmotic 668 Coefficients of Aqueous CaCl2 Solutions at 25°C. J. Chem. Eng. Data, 22 (1977) 56. 669 670 [54] J.A. Rard, A. Habenschuss, F.H. Spedding, A Review of the Osmotic 671 Coefficients of Aqueous CaCl2 at 25°C. J. Chem. Eng. Data, 22 (1977) 180. 672 673 [55] B.R. Staples, R.L. Nuttall, The Activity and Osmotic Coefficients of Aqueous 674 Calcium Chloride at 298.15 K. J. Phys. Chem. Ref. Data, 6 (1977) 385. 675 676 [56] M.S. Gruszkiewicz, J.M. Simonson, Vapor Pressures and Isopiestic Molalities 677 of Concentrated CaCl2(aq), CaBr2(aq), and NaCl(aq) to T = 523 K. J. Chem. 678 Thermodyn., 37 (2005) 906. 679 680 [57] J.A. Rard, S.L. Clegg, Critical Evaluation of the Thermodynamic Properties of 681 Aqueous Calcium Chloride. 1. Osmotic and Activity Coefficients of 0 - 10.77 mol.kg-1 682 Aqueous Calcium Chloride Solutions at 298.15 K and Correlation with Extended 683 Pitzer Ion-Interaction Models. J. Chem. Eng. Data, 42 (1997) 819. 684 685 [58] J.J. Manya, M.J. Antal Jr., Review of the Apparent Molar Heat Capacities of 686 NaCl(aq), HCl(aq), and NaOH(aq) and Their Representation Using the Pitzer Model 687 at Temperatures from (298.15 to 493.15) K. J. Chem. Eng. Data, 54 (2009) 2158. 688

Page 17 of 20
Accep
ted
Man
uscr
ipt
-0.008
-0.006
-0.004
-0.002
0
0.002
0.004
0.006
0.008
0.0 2.0 4.0 6.0
Dif
fere
nc
e in
Os
mo
tic
Co
eff
icie
nt
Concentration (mol/kg)
[39]
[41]
[35]
[42]
[43]
[44]
[45]
[46]
[27]
Figure(s)

Page 18 of 20
Accep
ted
Man
uscr
ipt
-40
-35
-30
-25
-20
-15
-10
-5
0
5
10
15
0.0 2.0 4.0 6.0
Dif
fere
nc
e in
Ap
pa
ren
t M
ola
r H
ea
t C
ap
ac
ity J
/(K
.mo
l)
Concentration (mol/kg)
[41]
[47]
[48]
[21]
[49]
[50]
Figure(s)

Page 19 of 20
Accep
ted
Man
uscr
ipt
-0.08
-0.06
-0.04
-0.02
0
0.02
0.04
0.06
0.0 2.0 4.0 6.0
Dif
fere
nc
e in
Os
mo
tic
Co
eff
icie
nt
Concentration (mol/kg)
[51]
[35]
[52]
[53]
[54]
[55]
[56]
Figure(s)

Page 20 of 20
Accep
ted
Man
uscr
ipt
Figure 1: KCl(aq) deviations of osmotic coefficient data from the Pitzer model
Figure 2: KCl(aq) deviations of apparent molar heat capacity data from the Pitzer model.
Figure 3: CaCl2(aq) deviations of osmotic coefficient data from the Pitzer model.
Figure(s)