Embed Size (px)
Citation preview
Municipal waste management in Spain
Prepared by Alexandra Maria Almasi and Leonidas Milios
ETC/SCP
February 2013
EEA project manager Almut Reichel
Author affiliation
Alexandra Maria Almasi and Leonidas Milios, Copenhagen Resource Institute,
http://www.cri.dk/
Context
The Topic Centre has prepared this working paper for the European Environment Agency
(EEA) under its 2012 work programme as a contribution to the EEA's work on waste
implementation.
Disclaimer
This ETC/SCP working paper has been subjected to European Environment Agency (EEA)
member country review. Please note that the contents of the working paper do not necessarily
reflect the views of the EEA.
3
Contents
Highlights .................................................................................................................. 4
1 Introduction ...................................................................................................... 5
1.1 Objective ................................................................................................. 5
2 Spain’s MSW management performance ....................................................... 5
2.1 MSW Indicators ....................................................................................... 6
2.1.1 The recycling of MSW from 2001 to 2010 ............................................... 6
2.1.2 The yearly increase rate of recycling of MSW ......................................... 7
2.1.3 Landfilling of biodegradable municipal waste .......................................... 8
2.1.4 Regional differences of MSW recycling from 2001 to 2010 ..................... 9
2.1.5 The relation between landfill tax level and recycling level of MSW ......... 9
2.1.6 Environmental benefits of better MSW management .............................. 9
2.2 Uncertainties in the reporting ................................................................ 10
2.3 Important initiatives taken to improve MSW management .................... 12
2.4 Future possible trends ........................................................................... 13
References .............................................................................................................. 14
4
Highlights
Spain still maintains very high rates of landfilling, surpassing 50% of MSW generated in 2010.
Nevertheless, Spain has been successful in meeting the targets set by EU Landfill Directive of
BMW diversion from landfills in 2006 and 2009;
Recycling has improved the last 10 years showing an increase of more that 10% from 21% in
2001, to 33% in 2010. Despite this progress, an extraordinary effort is still required if Spain is to
meet the 50% target of the Waste Framework Directive by 2020;
The first and second National Municipal Solid Waste Management Plans (for the periods 2000-
2006 and 2008-2015 respectively) have been instrumental in the development of MSW recycling
by introducing several initiatives, from separate collection of recyclables to upgrading recycling
facilities, and many more;
The Landfill tax which was adopted by the most highly populated regions of Spain contributed to
the diversion of MSW from landfills and the valorisation of material resources through recycling.
5
1 Introduction
1.1 Objective
Based on historical MSW data for Spain and EU targets linked to MSW, the analysis undertaken
includes:
The historical performance on MSW management based on a set of indicators;
Uncertainties that might explain differences between the countries’ performance which are more
linked to differences of what the reporting includes than differences in management performance;
Relation of the indicators to the most important initiatives taken to improve MSW management in
the country; and
Assessment the future possible trends and achieving of the future EU targets on MSW by 2020.
2 Spain’s MSW management performance
The first Spanish Waste Law was passed in 1985, forcing municipalities to approach the problem of
waste and to take measures for protecting the environment. The 1997 Packaging Law (11/1997) and
the 1998 second Waste Law (10/1998) aimed at establishing the responsibility and obligations of
each party involved in the waste management process (this being absent from the one enacted in
1985). Furthermore, selective collection of materials was enforced at local levels, and national
recovery and overall recycling objectives were set (Barlaz et al, 2002; Justice and Environment,
2011).
The Municipal Solid Waste Plan, covering the period 2000-2006 and supported by the second Waste
Law, introduced specific targets and discussed the distribution of funds for infrastructure development
and the launch of information/awareness campaigns. Although not a law, the terms of the plan have
been legally binding since the 1998 law stated that the autonomous regions must comply with the plan
in whatever form it is elaborated (Barlaz et al., 2002).
In December 2008, the Ministers’ Council of Spain approved the Integrated National Waste Plan for
the period 2008-2015 (Justice and Environment, 2011). The plan provides a comprehensive analysis
of the waste management situation, and in comparison with the previous plan, incorporates several
other waste streams (EEA, 2010) and is based on regional waste plans for all seventeen autonomous
regions. The plan includes many qualitative and quantitative targets to be achieved by 2012 for the
different waste management options as well as targets applying specifically to regions (Spain, 2012).
In July 2011 the new law (22/2011) on waste and contaminated soils came into force, transposing the
Waste Framework Directive (2008/98/EC) into Spanish legislation and adopting all related targets and
objectives (Ministry of Agriculture, Food and Environment, 2012).
Waste legislation in Spain is administered by the relevant authorities at different administrative levels.
At the national level, the Ministry of Agriculture, Food and Environment is responsible for the
national plans and attends to the authorization and inspection of waste shipments to/from third
countries (outside EU). At the regional level, the autonomous regions are responsible for issuing
strategic waste management plans for each specific region. They also attend to the authorization,
inspection and sanction of waste management activities and the shipment of waste to/from EU
countries. Finally, at the local level, the municipal authorities are responsible for the management of
the urban waste (domestic, industry and commerce, offices and services), including separate
collection and transportation of MSW (CIRIEC, 2010).
6
2.1 MSW Indicators
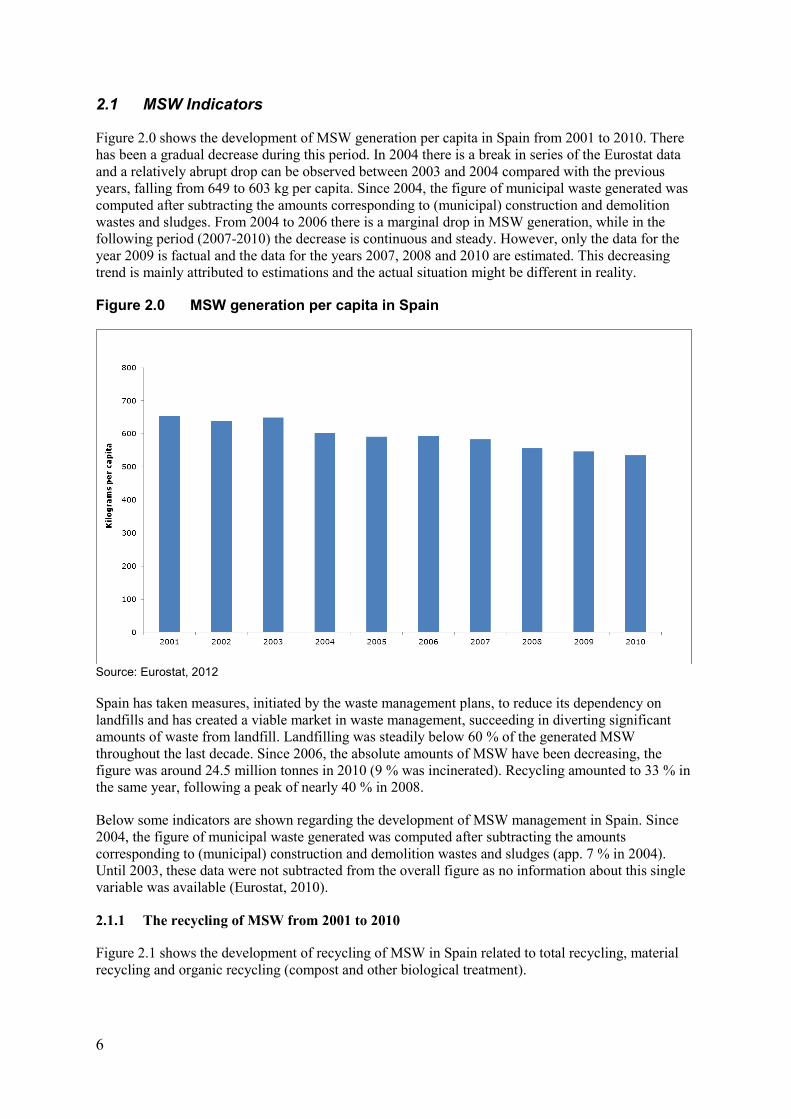
Figure 2.0 shows the development of MSW generation per capita in Spain from 2001 to 2010. There
has been a gradual decrease during this period. In 2004 there is a break in series of the Eurostat data
and a relatively abrupt drop can be observed between 2003 and 2004 compared with the previous
years, falling from 649 to 603 kg per capita. Since 2004, the figure of municipal waste generated was
computed after subtracting the amounts corresponding to (municipal) construction and demolition
wastes and sludges. From 2004 to 2006 there is a marginal drop in MSW generation, while in the
following period (2007-2010) the decrease is continuous and steady. However, only the data for the
year 2009 is factual and the data for the years 2007, 2008 and 2010 are estimated. This decreasing
trend is mainly attributed to estimations and the actual situation might be different in reality.
Figure 2.0 MSW generation per capita in Spain
Source: Eurostat, 2012
Spain has taken measures, initiated by the waste management plans, to reduce its dependency on
landfills and has created a viable market in waste management, succeeding in diverting significant
amounts of waste from landfill. Landfilling was steadily below 60 % of the generated MSW
throughout the last decade. Since 2006, the absolute amounts of MSW have been decreasing, the
figure was around 24.5 million tonnes in 2010 (9 % was incinerated). Recycling amounted to 33 % in
the same year, following a peak of nearly 40 % in 2008.
Below some indicators are shown regarding the development of MSW management in Spain. Since
2004, the figure of municipal waste generated was computed after subtracting the amounts
corresponding to (municipal) construction and demolition wastes and sludges (app. 7 % in 2004).
Until 2003, these data were not subtracted from the overall figure as no information about this single
variable was available (Eurostat, 2010).
2.1.1 The recycling of MSW from 2001 to 2010
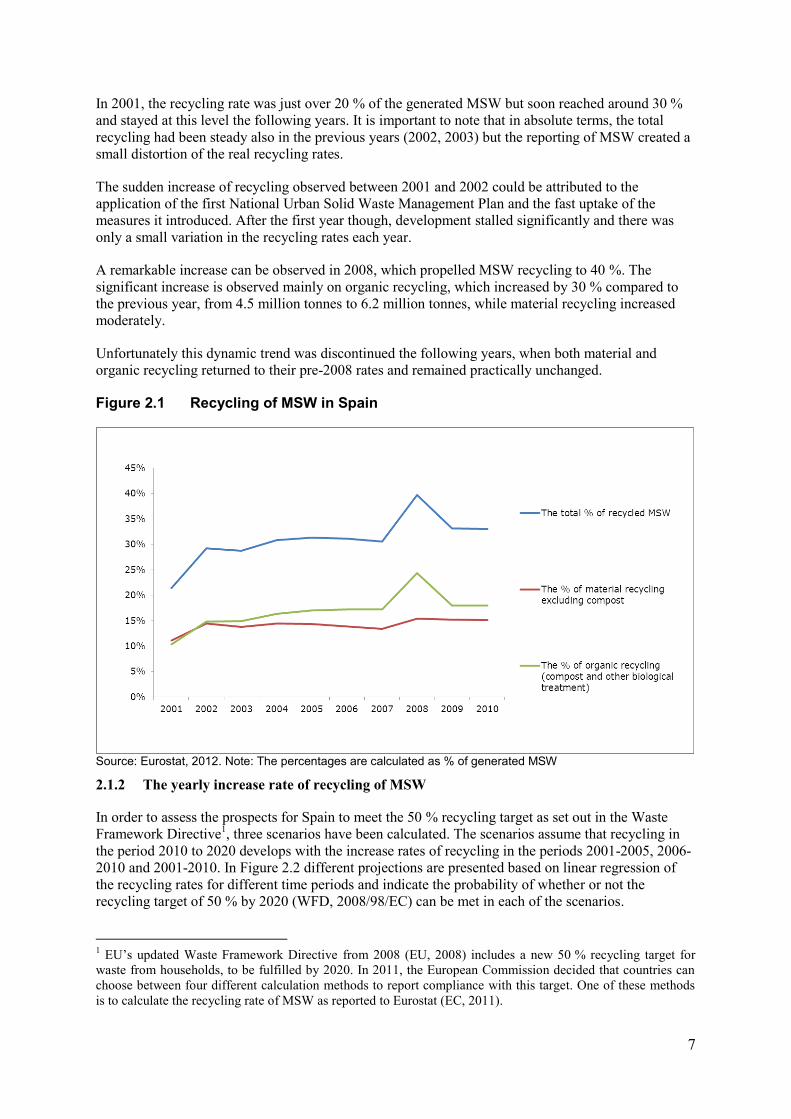
Figure 2.1 shows the development of recycling of MSW in Spain related to total recycling, material
recycling and organic recycling (compost and other biological treatment).
7
In 2001, the recycling rate was just over 20 % of the generated MSW but soon reached around 30 %
and stayed at this level the following years. It is important to note that in absolute terms, the total
recycling had been steady also in the previous years (2002, 2003) but the reporting of MSW created a
small distortion of the real recycling rates.
The sudden increase of recycling observed between 2001 and 2002 could be attributed to the
application of the first National Urban Solid Waste Management Plan and the fast uptake of the
measures it introduced. After the first year though, development stalled significantly and there was
only a small variation in the recycling rates each year.
A remarkable increase can be observed in 2008, which propelled MSW recycling to 40 %. The
significant increase is observed mainly on organic recycling, which increased by 30 % compared to
the previous year, from 4.5 million tonnes to 6.2 million tonnes, while material recycling increased
moderately.
Unfortunately this dynamic trend was discontinued the following years, when both material and
organic recycling returned to their pre-2008 rates and remained practically unchanged.
Figure 2.1 Recycling of MSW in Spain
Source: Eurostat, 2012. Note: The percentages are calculated as % of generated MSW
2.1.2 The yearly increase rate of recycling of MSW
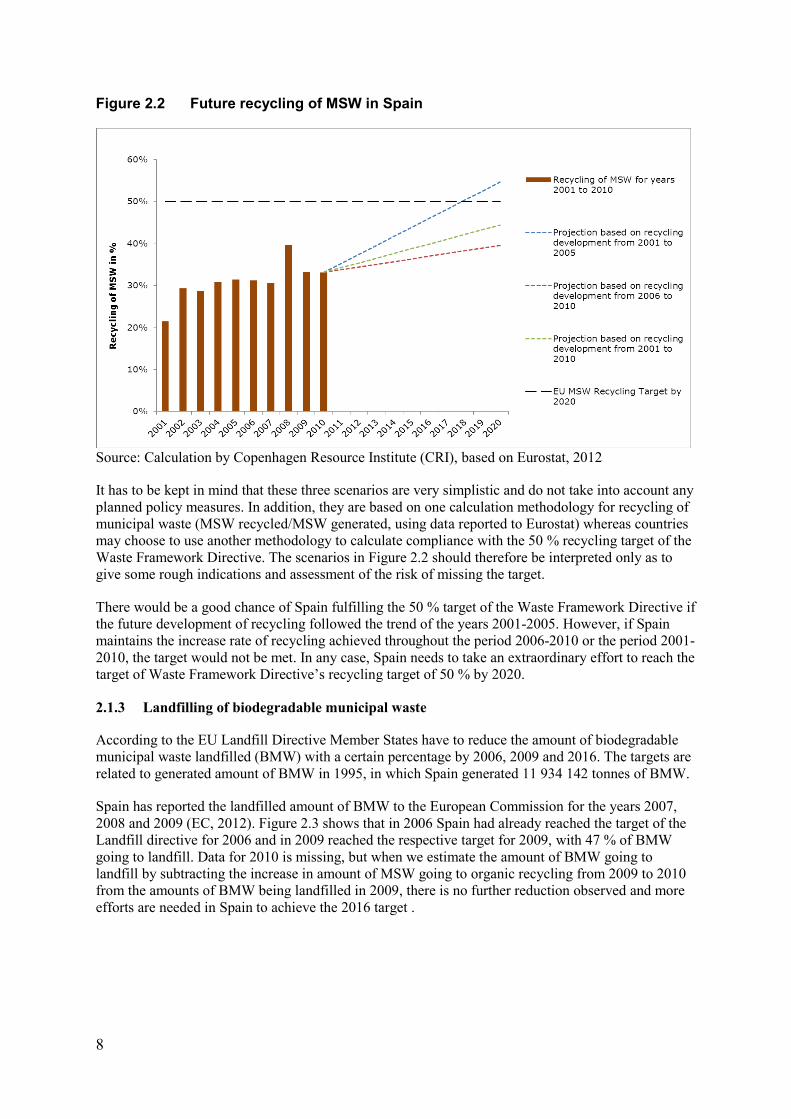
In order to assess the prospects for Spain to meet the 50 % recycling target as set out in the Waste
Framework Directive1, three scenarios have been calculated. The scenarios assume that recycling in
the period 2010 to 2020 develops with the increase rates of recycling in the periods 2001-2005, 2006-
2010 and 2001-2010. In Figure 2.2 different projections are presented based on linear regression of
the recycling rates for different time periods and indicate the probability of whether or not the
recycling target of 50 % by 2020 (WFD, 2008/98/EC) can be met in each of the scenarios.
1 EU’s updated Waste Framework Directive from 2008 (EU, 2008) includes a new 50 % recycling target for
waste from households, to be fulfilled by 2020. In 2011, the European Commission decided that countries can
choose between four different calculation methods to report compliance with this target. One of these methods
is to calculate the recycling rate of MSW as reported to Eurostat (EC, 2011).
8
Figure 2.2 Future recycling of MSW in Spain
Source: Calculation by Copenhagen Resource Institute (CRI), based on Eurostat, 2012
It has to be kept in mind that these three scenarios are very simplistic and do not take into account any
planned policy measures. In addition, they are based on one calculation methodology for recycling of
municipal waste (MSW recycled/MSW generated, using data reported to Eurostat) whereas countries
may choose to use another methodology to calculate compliance with the 50 % recycling target of the
Waste Framework Directive. The scenarios in Figure 2.2 should therefore be interpreted only as to
give some rough indications and assessment of the risk of missing the target.
There would be a good chance of Spain fulfilling the 50 % target of the Waste Framework Directive if
the future development of recycling followed the trend of the years 2001-2005. However, if Spain
maintains the increase rate of recycling achieved throughout the period 2006-2010 or the period 2001-
2010, the target would not be met. In any case, Spain needs to take an extraordinary effort to reach the
target of Waste Framework Directive’s recycling target of 50 % by 2020.
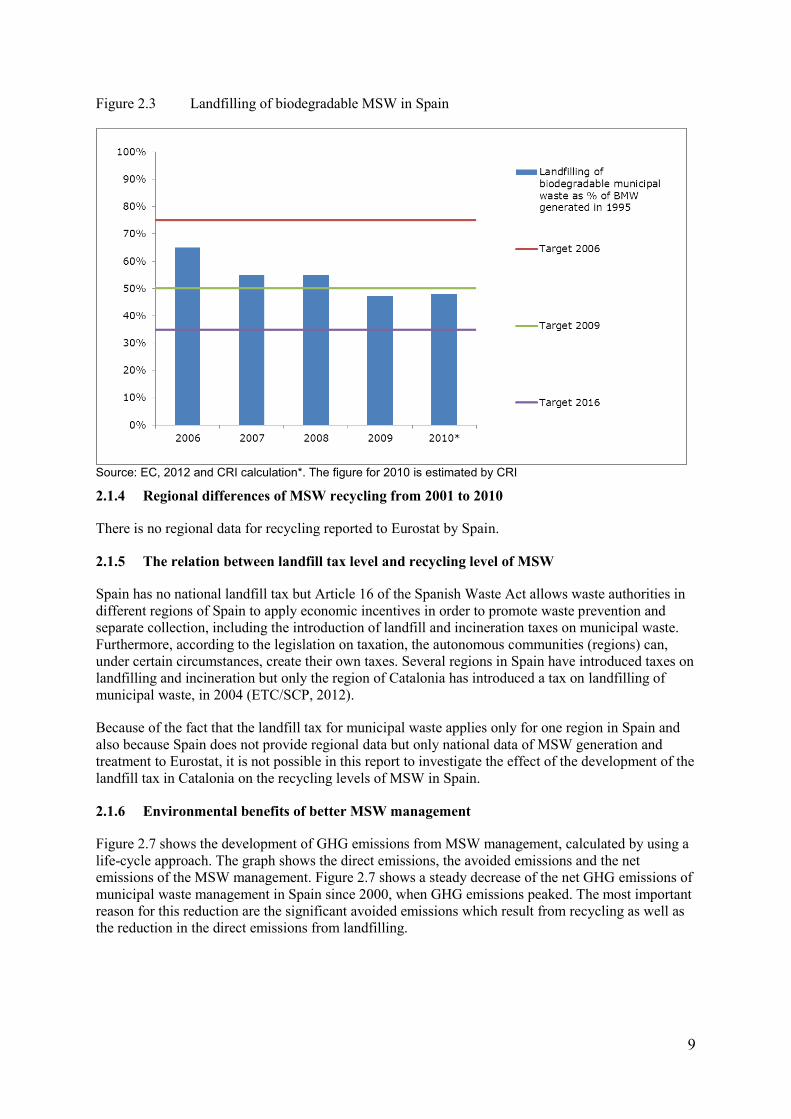
2.1.3 Landfilling of biodegradable municipal waste
According to the EU Landfill Directive Member States have to reduce the amount of biodegradable
municipal waste landfilled (BMW) with a certain percentage by 2006, 2009 and 2016. The targets are
related to generated amount of BMW in 1995, in which Spain generated 11 934 142 tonnes of BMW.
Spain has reported the landfilled amount of BMW to the European Commission for the years 2007,
2008 and 2009 (EC, 2012). Figure 2.3 shows that in 2006 Spain had already reached the target of the
Landfill directive for 2006 and in 2009 reached the respective target for 2009, with 47 % of BMW
going to landfill. Data for 2010 is missing, but when we estimate the amount of BMW going to
landfill by subtracting the increase in amount of MSW going to organic recycling from 2009 to 2010
from the amounts of BMW being landfilled in 2009, there is no further reduction observed and more
efforts are needed in Spain to achieve the 2016 target .
9
Figure 2.3 Landfilling of biodegradable MSW in Spain
Source: EC, 2012 and CRI calculation*. The figure for 2010 is estimated by CRI
2.1.4 Regional differences of MSW recycling from 2001 to 2010
There is no regional data for recycling reported to Eurostat by Spain.
2.1.5 The relation between landfill tax level and recycling level of MSW
Spain has no national landfill tax but Article 16 of the Spanish Waste Act allows waste authorities in
different regions of Spain to apply economic incentives in order to promote waste prevention and
separate collection, including the introduction of landfill and incineration taxes on municipal waste.
Furthermore, according to the legislation on taxation, the autonomous communities (regions) can,
under certain circumstances, create their own taxes. Several regions in Spain have introduced taxes on
landfilling and incineration but only the region of Catalonia has introduced a tax on landfilling of
municipal waste, in 2004 (ETC/SCP, 2012).
Because of the fact that the landfill tax for municipal waste applies only for one region in Spain and
also because Spain does not provide regional data but only national data of MSW generation and
treatment to Eurostat, it is not possible in this report to investigate the effect of the development of the
landfill tax in Catalonia on the recycling levels of MSW in Spain.
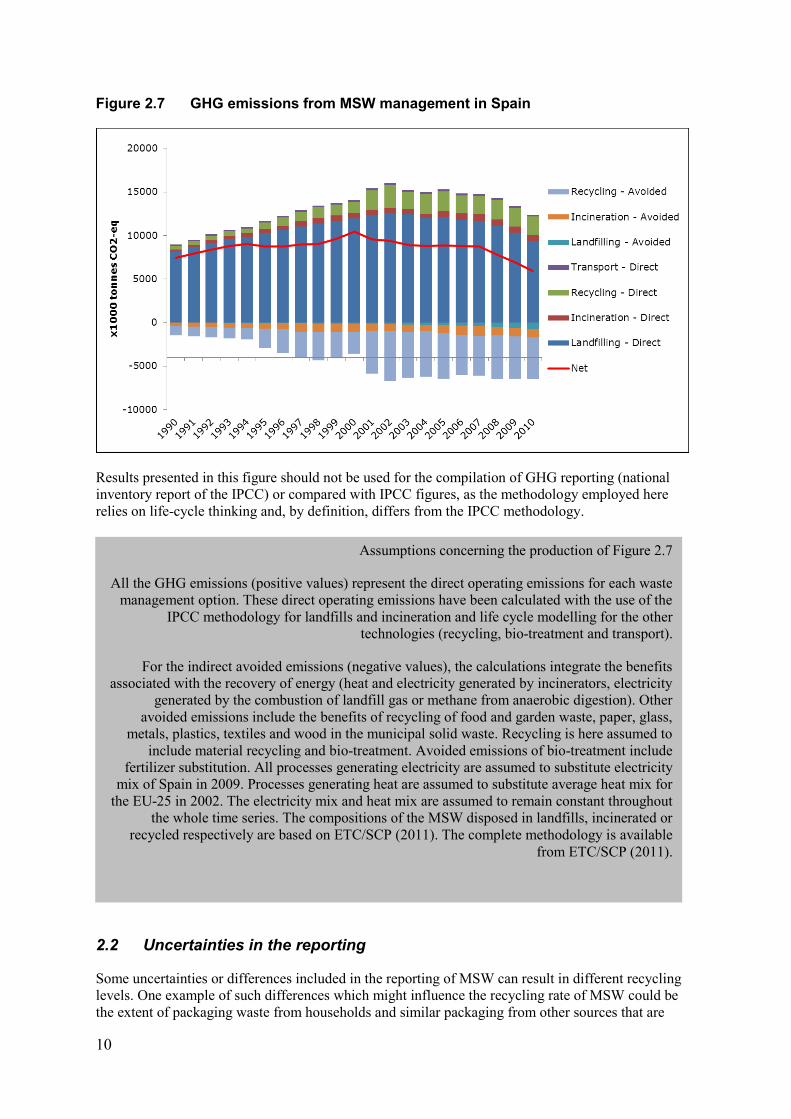
2.1.6 Environmental benefits of better MSW management
Figure 2.7 shows the development of GHG emissions from MSW management, calculated by using a
life-cycle approach. The graph shows the direct emissions, the avoided emissions and the net
emissions of the MSW management. Figure 2.7 shows a steady decrease of the net GHG emissions of
municipal waste management in Spain since 2000, when GHG emissions peaked. The most important
reason for this reduction are the significant avoided emissions which result from recycling as well as
the reduction in the direct emissions from landfilling.
10
Figure 2.7 GHG emissions from MSW management in Spain
Results presented in this figure should not be used for the compilation of GHG reporting (national
inventory report of the IPCC) or compared with IPCC figures, as the methodology employed here
relies on life-cycle thinking and, by definition, differs from the IPCC methodology.
2.2 Uncertainties in the reporting
Some uncertainties or differences included in the reporting of MSW can result in different recycling
levels. One example of such differences which might influence the recycling rate of MSW could be
the extent of packaging waste from households and similar packaging from other sources that are
Assumptions concerning the production of Figure 2.7
All the GHG emissions (positive values) represent the direct operating emissions for each waste
management option. These direct operating emissions have been calculated with the use of the
IPCC methodology for landfills and incineration and life cycle modelling for the other
technologies (recycling, bio-treatment and transport).
For the indirect avoided emissions (negative values), the calculations integrate the benefits
associated with the recovery of energy (heat and electricity generated by incinerators, electricity
generated by the combustion of landfill gas or methane from anaerobic digestion). Other
avoided emissions include the benefits of recycling of food and garden waste, paper, glass,
metals, plastics, textiles and wood in the municipal solid waste. Recycling is here assumed to
include material recycling and bio-treatment. Avoided emissions of bio-treatment include
fertilizer substitution. All processes generating electricity are assumed to substitute electricity
mix of Spain in 2009. Processes generating heat are assumed to substitute average heat mix for
the EU-25 in 2002. The electricity mix and heat mix are assumed to remain constant throughout
the whole time series. The compositions of the MSW disposed in landfills, incinerated or
recycled respectively are based on ETC/SCP (2011). The complete methodology is available
from ETC/SCP (2011).
11
included in the reported recycling of MSW. Most Member States have producer responsibility
schemes on packaging waste. Private operators of such schemes do not always report on the sources
of the packaging waste, and the packaging waste is therefore not always regarded or reported to
Eurostat as MSW.
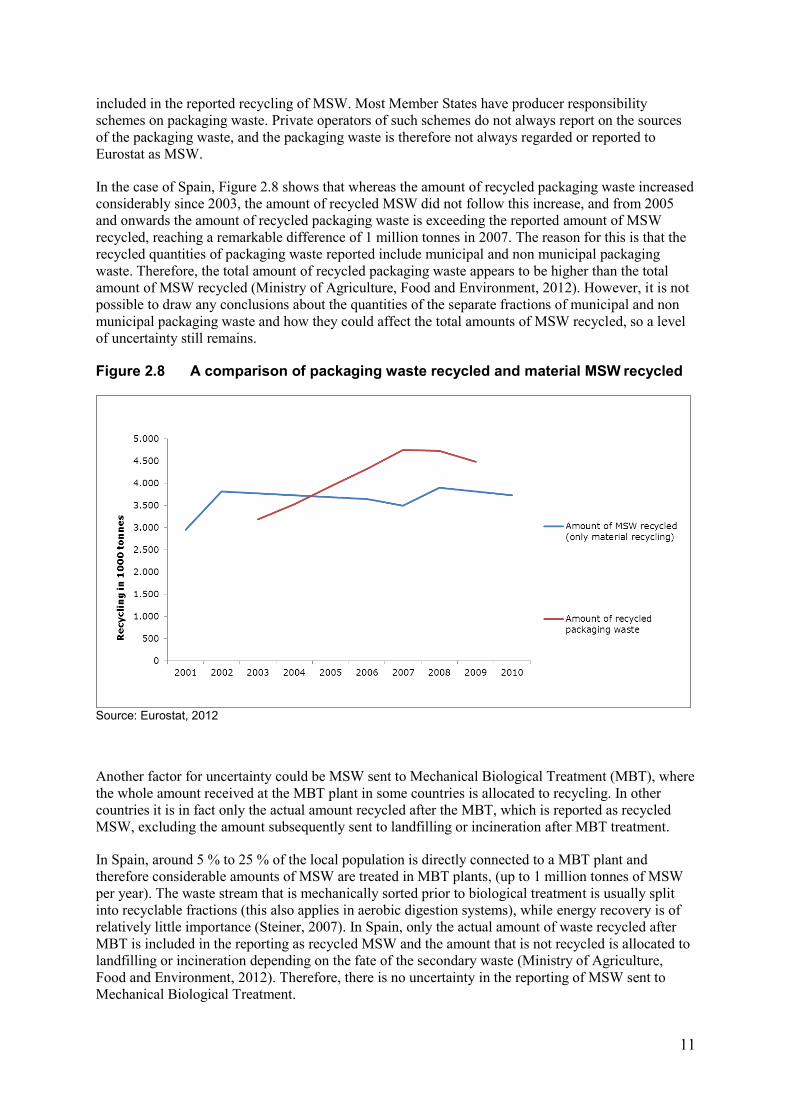
In the case of Spain, Figure 2.8 shows that whereas the amount of recycled packaging waste increased
considerably since 2003, the amount of recycled MSW did not follow this increase, and from 2005
and onwards the amount of recycled packaging waste is exceeding the reported amount of MSW
recycled, reaching a remarkable difference of 1 million tonnes in 2007. The reason for this is that the
recycled quantities of packaging waste reported include municipal and non municipal packaging
waste. Therefore, the total amount of recycled packaging waste appears to be higher than the total
amount of MSW recycled (Ministry of Agriculture, Food and Environment, 2012). However, it is not
possible to draw any conclusions about the quantities of the separate fractions of municipal and non
municipal packaging waste and how they could affect the total amounts of MSW recycled, so a level
of uncertainty still remains.
Figure 2.8 A comparison of packaging waste recycled and material MSW recycled
Source: Eurostat, 2012
Another factor for uncertainty could be MSW sent to Mechanical Biological Treatment (MBT), where
the whole amount received at the MBT plant in some countries is allocated to recycling. In other
countries it is in fact only the actual amount recycled after the MBT, which is reported as recycled
MSW, excluding the amount subsequently sent to landfilling or incineration after MBT treatment.
In Spain, around 5 % to 25 % of the local population is directly connected to a MBT plant and
therefore considerable amounts of MSW are treated in MBT plants, (up to 1 million tonnes of MSW
per year). The waste stream that is mechanically sorted prior to biological treatment is usually split
into recyclable fractions (this also applies in aerobic digestion systems), while energy recovery is of
relatively little importance (Steiner, 2007). In Spain, only the actual amount of waste recycled after
MBT is included in the reporting as recycled MSW and the amount that is not recycled is allocated to
landfilling or incineration depending on the fate of the secondary waste (Ministry of Agriculture,
Food and Environment, 2012). Therefore, there is no uncertainty in the reporting of MSW sent to
Mechanical Biological Treatment.
12
2.3 Important initiatives taken to improve MSW management
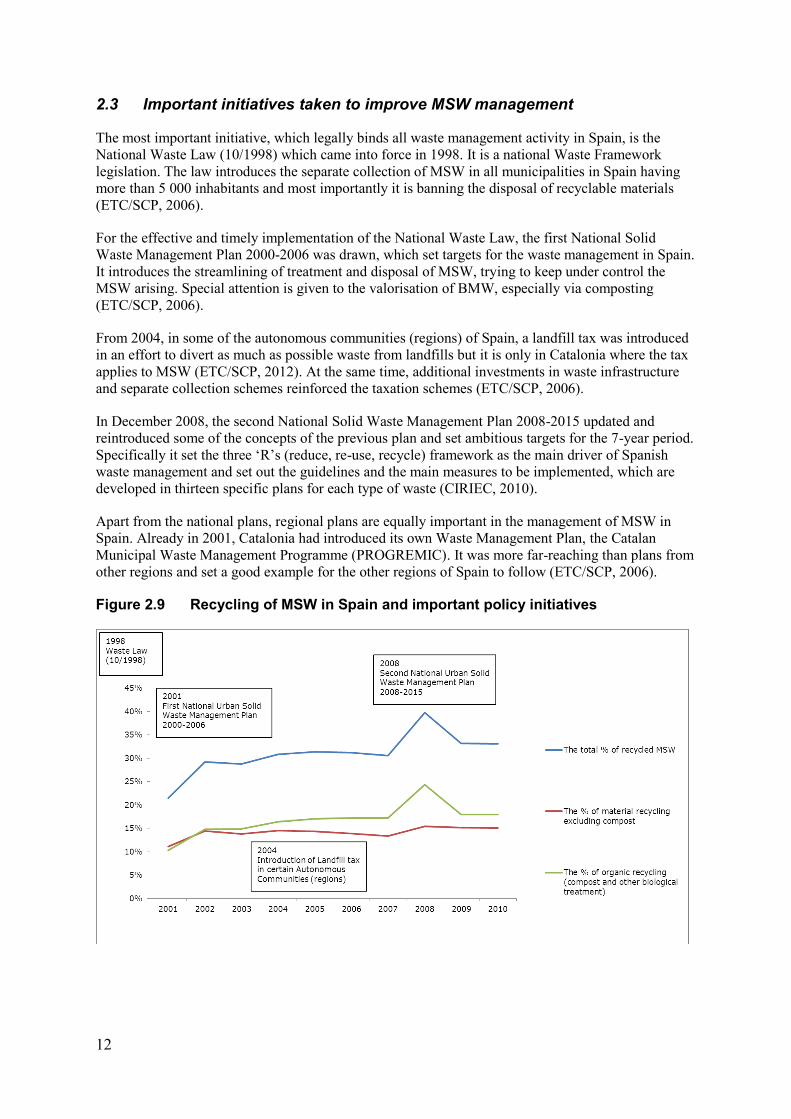
The most important initiative, which legally binds all waste management activity in Spain, is the
National Waste Law (10/1998) which came into force in 1998. It is a national Waste Framework
legislation. The law introduces the separate collection of MSW in all municipalities in Spain having
more than 5 000 inhabitants and most importantly it is banning the disposal of recyclable materials
(ETC/SCP, 2006).
For the effective and timely implementation of the National Waste Law, the first National Solid
Waste Management Plan 2000-2006 was drawn, which set targets for the waste management in Spain.
It introduces the streamlining of treatment and disposal of MSW, trying to keep under control the
MSW arising. Special attention is given to the valorisation of BMW, especially via composting
(ETC/SCP, 2006).
From 2004, in some of the autonomous communities (regions) of Spain, a landfill tax was introduced
in an effort to divert as much as possible waste from landfills but it is only in Catalonia where the tax
applies to MSW (ETC/SCP, 2012). At the same time, additional investments in waste infrastructure
and separate collection schemes reinforced the taxation schemes (ETC/SCP, 2006).
In December 2008, the second National Solid Waste Management Plan 2008-2015 updated and
reintroduced some of the concepts of the previous plan and set ambitious targets for the 7-year period.
Specifically it set the three ‘R’s (reduce, re-use, recycle) framework as the main driver of Spanish
waste management and set out the guidelines and the main measures to be implemented, which are
developed in thirteen specific plans for each type of waste (CIRIEC, 2010).
Apart from the national plans, regional plans are equally important in the management of MSW in
Spain. Already in 2001, Catalonia had introduced its own Waste Management Plan, the Catalan
Municipal Waste Management Programme (PROGREMIC). It was more far-reaching than plans from
other regions and set a good example for the other regions of Spain to follow (ETC/SCP, 2006).
Figure 2.9 Recycling of MSW in Spain and important policy initiatives
13
2.4 Future possible trends
Figure 2.2 shows that Spain would be able to fulfil the target of 50 % recycling of MSW by 2020 if
the annual increase rate would follow the development pattern of the period 2001-2005. To achieve
this rate will take an extraordinary effort.
Whatever the case, Spanish recycling efforts will require a minimum increase of 1.7 percentage points
per year between 2010 and 2020 in order to reach the 50 % target by 2020. This can only be achieved
by the systematic and concentrated effort of all stakeholders involved in urban waste management in
national, regional and local level.
According to the EEA’s State of the Environment and Outlook 2010 country assessment for Spain
(EEA, 2010), waste generation in Spain in 2020 is likely to be linked to economic circumstances.
Nevertheless, the preventive measures implemented under the 2008-2015 National Integrated Waste
Plan (PNIR), approved in December 2008, are expected to notably reduce waste generation, increase
recycling rates, and lower landfill. Waste generation has already shown a tendency towards reduction
since 2007 and is expected to continue as the economic crisis remains.
Further measures are needed in order to enhance recycling. Some of the measures set out in the PNIR
have already been implemented, and others will be put into practice during the remainder of its term.
These are expected to decrease the impact on the natural environment significantly in coming years
(EEA, 2010).
14
References
Barlaz M., Loughlin D., Williams J., 2002, ‘Strengthening Markets for Recyclables, A Worldwide
Perspective: Spain.’ Department of Civil Engineering, North Carolina State University
http://people.engr.ncsu.edu/barlaz/pdfdoc/spain.pdf
CIRIEC, 2010, ‘Working paper No. 2010/03: The Spanish Waste Sector: Waste Collection, Transport
and Treatment’ http://www.ciriec.ulg.ac.be/fr/telechargements/WORKING_PAPERS/WP10-03.pdf
EC, 2011: Commission Decision of 18 November 2011 establishing rules and calculation methods for
verifying compliance with the targets set in Article 11(2) of Directive 2008/98/EC of the European
Parliament and the Council
EC, 2012: Member States’ reporting to the Commission according to Council Directive 1999/31 of 26
April 1999Landfill Directive and Commission Decision 2000/738/EC concerning a questionnaire for
Member States reports on the implementation of Directive 1999/31/EC on the landfill of waste. E-
mail from the Commission to the EEA on 16 February, 2012.
ETC/SCP, 2006, ‘Country Fact Sheets on waste policies’
http://scp.eionet.europa.eu/facts/factsheets_waste/2006_edition/Spain
ETC/SCP (2011). Bakas, I., Sieck, M., Hermann, T., Andersen, F. M., Larsen, H. and Reichel, A.
Projections of Municipal Waste Management and Greenhouse Gases. ETC/SCP working paper
4/2011. Copenhagen, Denmark, 89 pp.
ETC/SCP, 2012: Christian Fischer, Mathias Lehner and David Lindsay McKinnon ‘Overview of the
use of landfill taxes in Europe’. ETC/SCP Working paper 1, 2012.
http://scp.eionet.europa.eu/publications/WP2012_1
European Environment Agency, 2010, ‘The European environment – state and outlook 2010 –
Country assessments: Spain’ http://www.eea.europa.eu/soer/countries/es/soertopic_view?topic=waste
Eurostat, 2012: ‘Waste database municipal waste‘
http://epp.eurostat.ec.europa.eu/portal/page/portal/waste/data/database
Accessed May 2012
Eurostat metadata, 2010, ‘Waste database municipal waste’
http://epp.eurostat.ec.europa.eu/cache/ITY_SDDS/Annexes/env_wasmun_esms_an1.pd
Justice and Environment, 2011, ‘Waste Management Planning: Spain. Legal Analysis’
http://www.justiceandenvironment.org/_files/file/2011%20waste%20plan%20ES.pdf
15
Ministry of Agriculture, Food and Environment, 2012, ‘Information received during the Eionet
consultation of the paper. E-mail of 31st October 2012 from Carmen Tapia Carrasco, Ministry of
Agriculture, Food and Environment’
Spain, 2012, ‘Plans and Programs’, Ministry of Agriculture, Food and Environment (in Spanish)
http://www.magrama.gob.es/es/calidad-y-evaluacion-ambiental/temas/prevencion-y-gestion-
residuos/normativa-y-planificacion/planes-y-programas/
Spain, 2012, ‘State Regulations’, Ministry of Agriculture, Food and Environment (in Spanish)
http://www.magrama.gob.es/es/calidad-y-evaluacion-ambiental/temas/prevencion-y-gestion-
residuos/normativa-y-planificacion/normativa-estatal/buscador.aspx?cat3=2
Steiner M., 2007, ‘MBT in Europe – There’s life in the old dog yet’, Waste management world
http://www.waste-management-world.com/index/display/article-display/304397/articles/waste-
management-world/volume-8/issue-4/features/mbt-in-europe.html


![Municipal Solid Waste Update - Global Methane Initiative...1 Municipal Solid Waste Update [JAPAN] [Kunihiko SHIMADA] GMI Municipal Solid Waste Subcommittee Meeting Vancouver, Canada,](https://img.pdfslide.us/doc/110x75/5e4de36d50ecd14cd3180f83/municipal-solid-waste-update-global-methane-initiative-1-municipal-solid-waste.jpg)